physical activity and wellness at mount allison
TRANSCRIPT
Physical Activity and Wellness at Mount Allison
University: 2010 – 2011
Matthew Kesthely (0146252)
April 21, 2011
Survey Research Methods: Economics 4951
Dr. Carla VanBeselaere
2
Table of Contents
Introduction …………………………………………………………………………… 3
Demographic Information ……………………………………………………………. 3
Health and Wellness Goals …………………………………………………………… 5
Active Living …………………………………………………………………………... 6
Services ………………………………………………………………………………… 8
Dietary Habits …………………………………………………………………………. 9
Sleep Cycles ……………………………………………………………………………. 9
Stimulant Consumption ……………………………………………………………… 11
Tobacco Consumption ………………………………………………………………... 12
Alcohol Consumption ……………………………………………………………….... 12
Conclusion …………………………………………………………………………….. 13
Additional Comments ……………………………………………………………….... 14
References …………………………………………………………………………….. 16
Exhibits ………………………………………………………………………………... 17
3
Introduction
Mount Allison is a university that prides itself on academics, athletics, and having a
diversified community. Founded in 1839 by Charles Frederick Allison, Mount Allison has a rich
history but has always kept an eye squarely on the future (Mount Allison University, 2011). The
university offers five different undergraduate programs, including: Bachelor of Arts, Bachelor of
Science, Bachelor of Fine Arts, Bachelor of Commerce, and Bachelor of Music. As well, they
offer some post-graduate programs, focusing in the sciences. In order to help improve the
fitness and wellness services of the university, students were asked to complete a survey
that was designed to find out more about activities that they participated in and how they
found out about the different services that were offered. As well, information was collected
on dietary habits, sleep cycles, alcohol consumption, stimulant consumption, and finally,
tobacco consumption. By taking an in‐depth look at what students believe to be important,
the Mount Allison University Fitness and Wellness Centers can adapt their services to
better help and allow students to achieve their goals.
Demographic Information
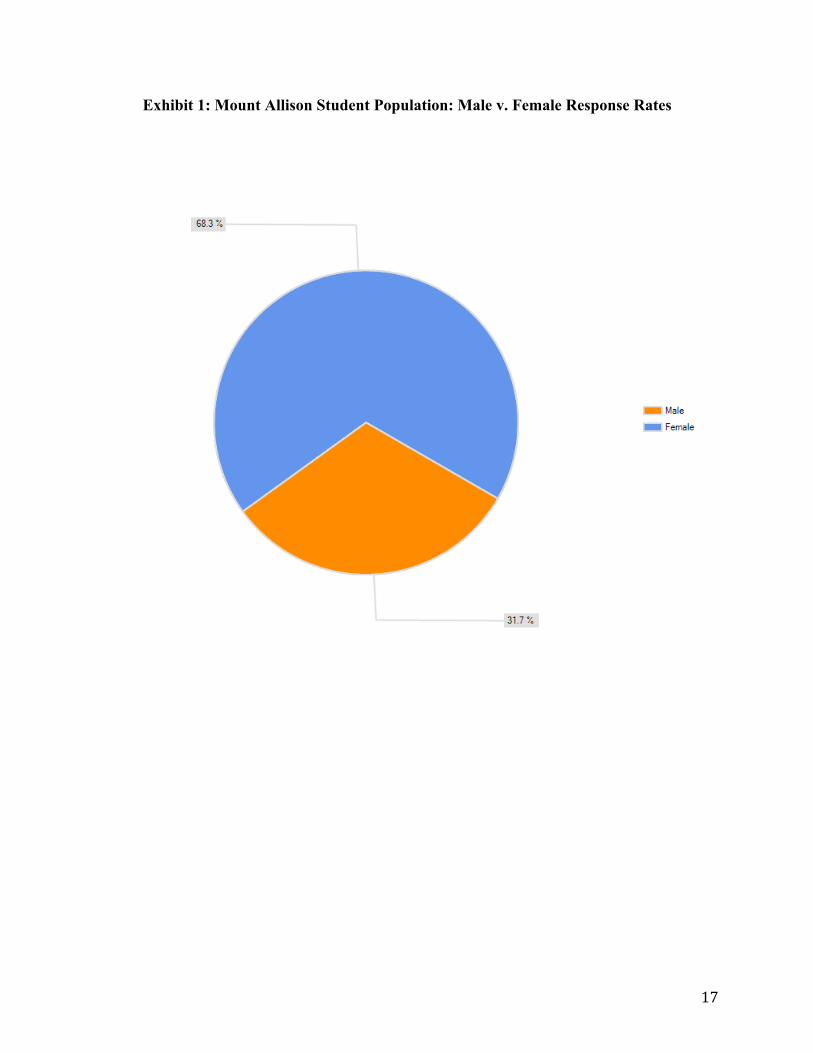
As of May 2011, the Mount Allison University student population was made up of 950
male and 1457 female students; 39 percent and 61 percent respectively. After the survey was
completed, the response rates by those who fell into the male/female category were analyzed to
see if there was a correlation between whether the number that answered was the same as the
percentage of male/female students at Mount Allison. When looking at Exhibit 1, you are able to
see that the response percents for male and female were 31.7 percent and 68.3 percent,
respectively. From this data one can see that there is, at most, an 8 percent differential between
4
the actual population at Mount Allison and those who responded to the survey.
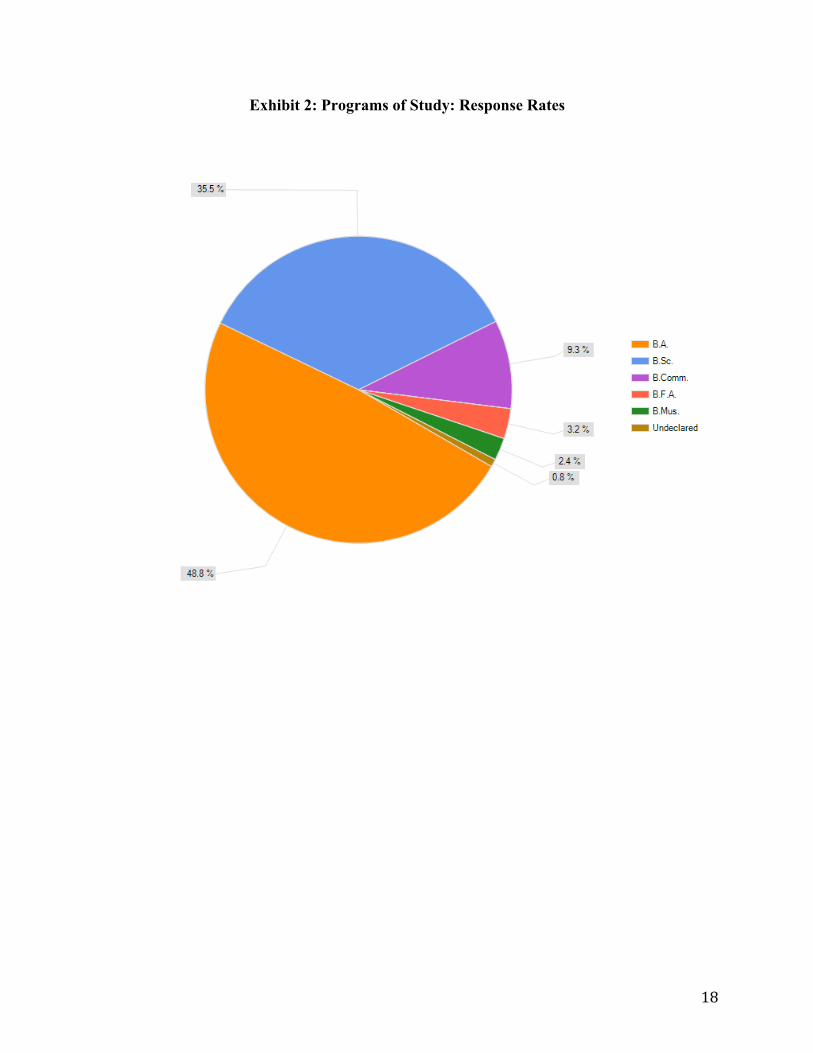
Along with the male/female response rates, the survey was also designed to measure the
program of study each individual respondent was registered for. The response rates for this can
be seen in Exhibit 2. One can see that the largest group of respondents were registered in the
Bachelor of Arts programs; 48.8 percent. Thirty-five and a half percent of the respondents fell
into the Bachelor of Science program. After these two programs, the percentage of respondents
decreased significantly. The survey saw 9.3 percent of its respondents in the Bachelor of
Commerce program, 3.2 percent of its respondents in the Bachelor of Fine Arts program, 2.4
percent of its respondents registered in the Bachelor of Music program, and 0.8 percent of its
respondents undecided as to which program they were going to enter. As well, there were three
individuals who were registered in the Masters of Science program and one individual who was
registered in the Aviation program. Comparing the data retrieved from the survey to that, which
was provided by Mount Allison University, on the program areas and the number of students
enrolled in each program, one can see that there are extremely similar results.
Mount Allison University provided data on the total number of students in their given
year of study; i.e. first, second, etc. During the 2011 winter semester, 32 percent of students were
in first year, 28 percent were in second year, 21 percent were in third year, and finally, 17
percent were in fourth year. With this data it was expected that there would be less responses
from those in fourth year of study. This hypothesis was true as only 16.6 percent of students
indicated that they were in their fourth year of study. Exhibit 3 indicates that there were more
second year students who responded to the survey than any other year.
The survey was also designed to ask respondents whether they lived in residence or if
they lived off-campus. The results of the survey showed that 47.8 percent of respondents lived in
5
residence and that 52.2 percent of respondents lived off-campus. With this data, it should be
noted that making students aware of new programs and services offered by the athletics
department should be done in a manner that focuses slightly more on areas where off-campus
students spend most of their time, i.e. the student center and academic buildings. One of the
survey questions asked respondents to give voice to how they find out about services offered by
the athletic department. Many respondents made mention to the fact that they usually hear about
the services through word of mouth. As well, many students said that they looked at the Mount
Allison website in order to find out more about what was being offered. Other ways in which
people said they became informed was through posters and emails and there were some students
who said that they knew very little about what was offered.
Students were asked what would be the most effective way of communicating new
programs and services offered by the athletics department. Using textual analysis methods,
students believe that the most beneficial way of informing them of the programs and services
offered by the athletics department would be through posters put up on campus and in the fitness
center and gym, through emails, and by having notifications placed on the Mount Allison
website.
Health and Wellness Goals
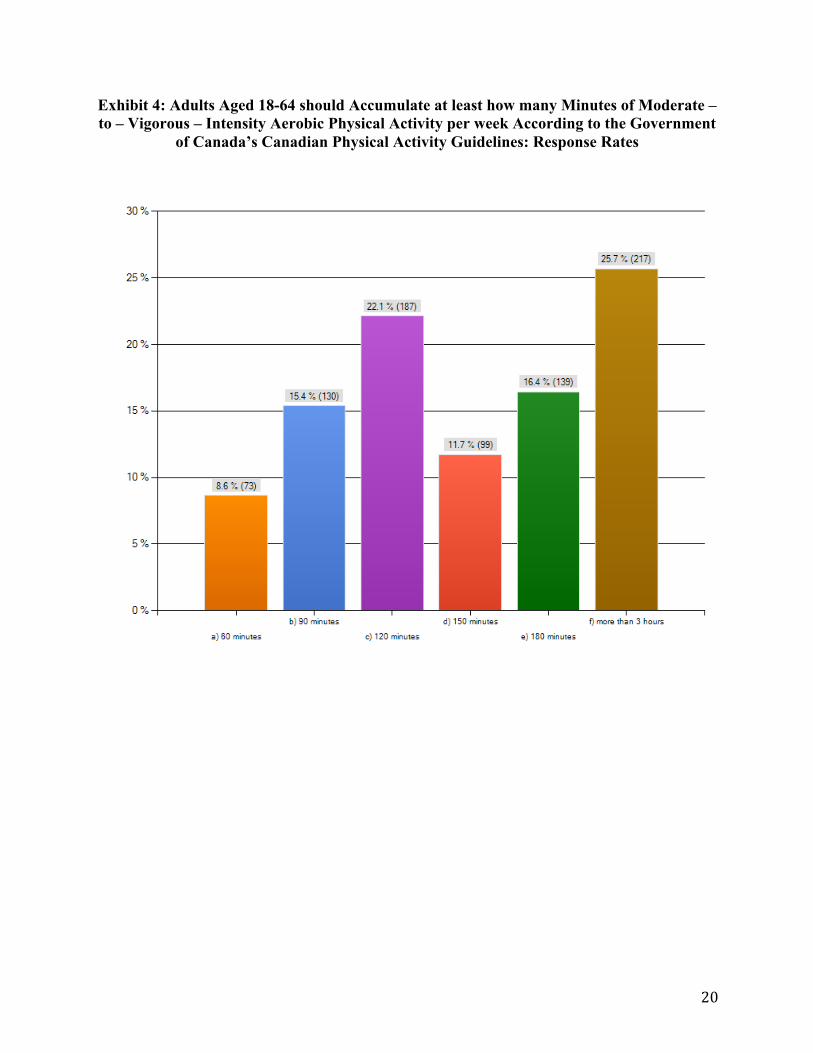
In order to see how informed students were on the Government of Canada’s Canadian
Physical Activity Guidelines, one of the survey questions asked respondents how many minutes
of moderate – to – vigorous – intensity aerobic physical activity one should participate in per
week. As you can see in Exhibit 4, only 11.7 percent of respondents were correct in answering
this question. The largest percentage of respondents, 25.7 percent, felt that the answer was more
6
than three hours of exercise per week, which could suggest that they believe that exercise is an
important aspect of one’s daily life.
Continuing through the survey, respondents were asked if they had any health and
wellness goals. Approximately 79 percent of respondents said that, yes, they do have health and
wellness goals. The next question asked respondents how Mount Allison could help them
achieve these goals. Responses varied from offering different programs such as kickboxing,
having personal trainers that show students how to use each piece of machinery and were
available as trainers, and by increasing the hours of operation for the swimming pool, the fitness
center and the gym. The main issue that was brought up when asking respondents about ways in
which Mount Allison could help them achieve their goals was the fact that students in residence
believe that healthier options should be available at the dining hall, at Gracie’s, and in the
vending machines. Many of the food choices at the dining hall are deep fried and therefore not
very healthy. Healthy food alternatives must be available for those who have goals for a healthy
lifestyle and therefore further develop their bodies.
Active Living
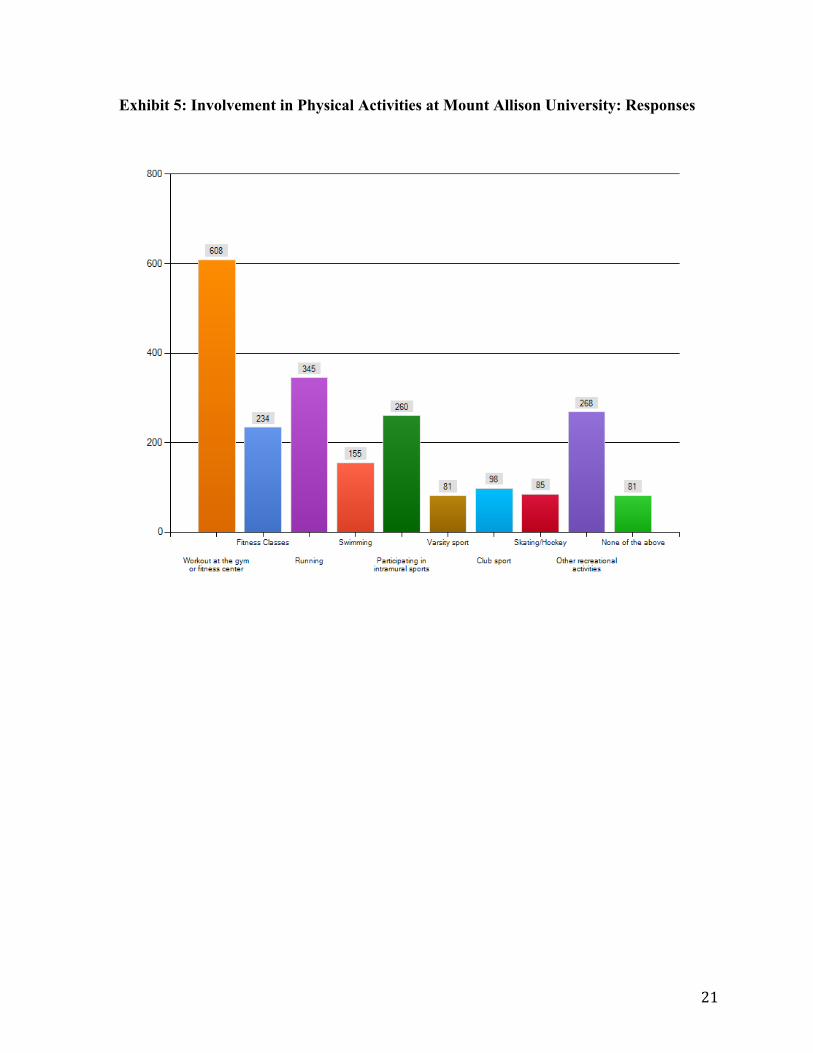
Students at Mount A. were asked how they would describe their level of physical fitness.
The majority of individuals, 83 percent, said that they had a moderate to high level of physical
fitness. Along with describing one’s perceived level of physical fitness, individuals were asked
about which types of activities they took part in at Mount Allison. As you can see when looking
at Exhibit 5, 608 of those who responded to this question said that they worked out at the gym or
fitness center. Running, playing intramural sports, and participating in other recreational
activities were also very prominent as ways in which people were physically active. It is
7
interesting to note that varsity sports was the category with the lowest number of respondents.
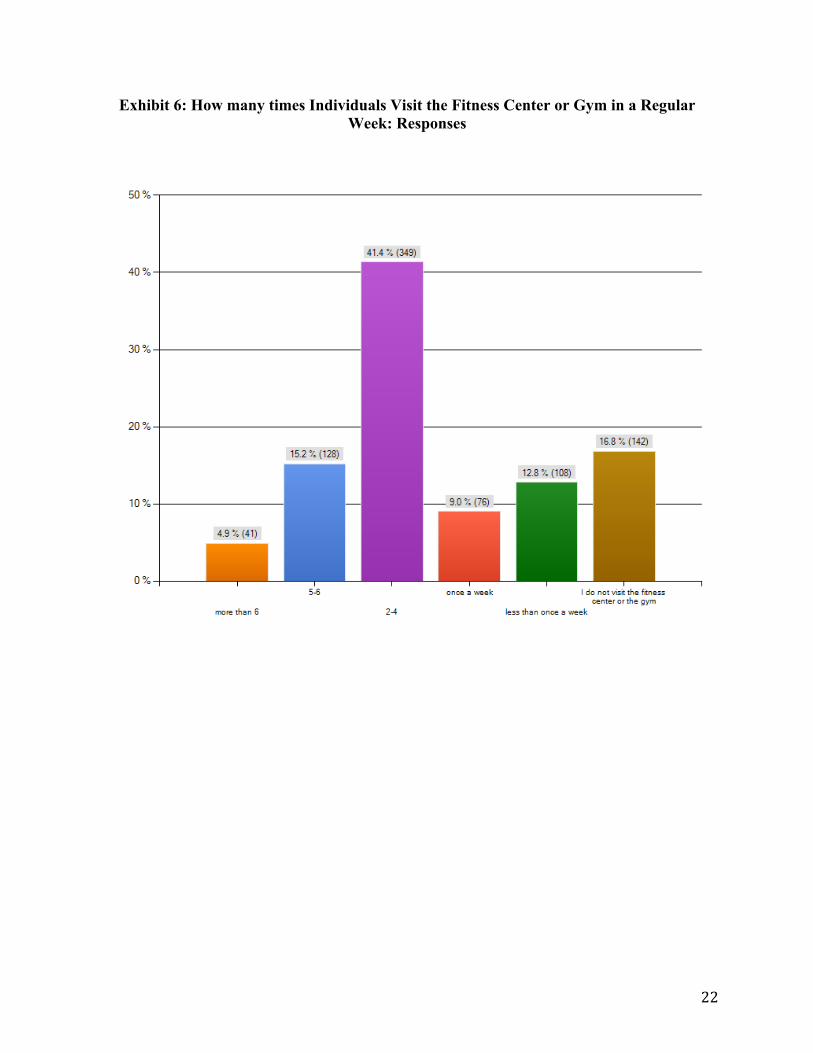
In order to find out about the usage of the university’s fitness center and gym, the survey
asked students how many times they visited in a regular week. Approximately 41 percent of
respondents indicated that they went between two and four times and 15.2 percent indicated that
they worked out between five and six times per week. Exhibit 6 shows all the responses that
students gave as to how many times they went to the fitness center or gym in a regular week.
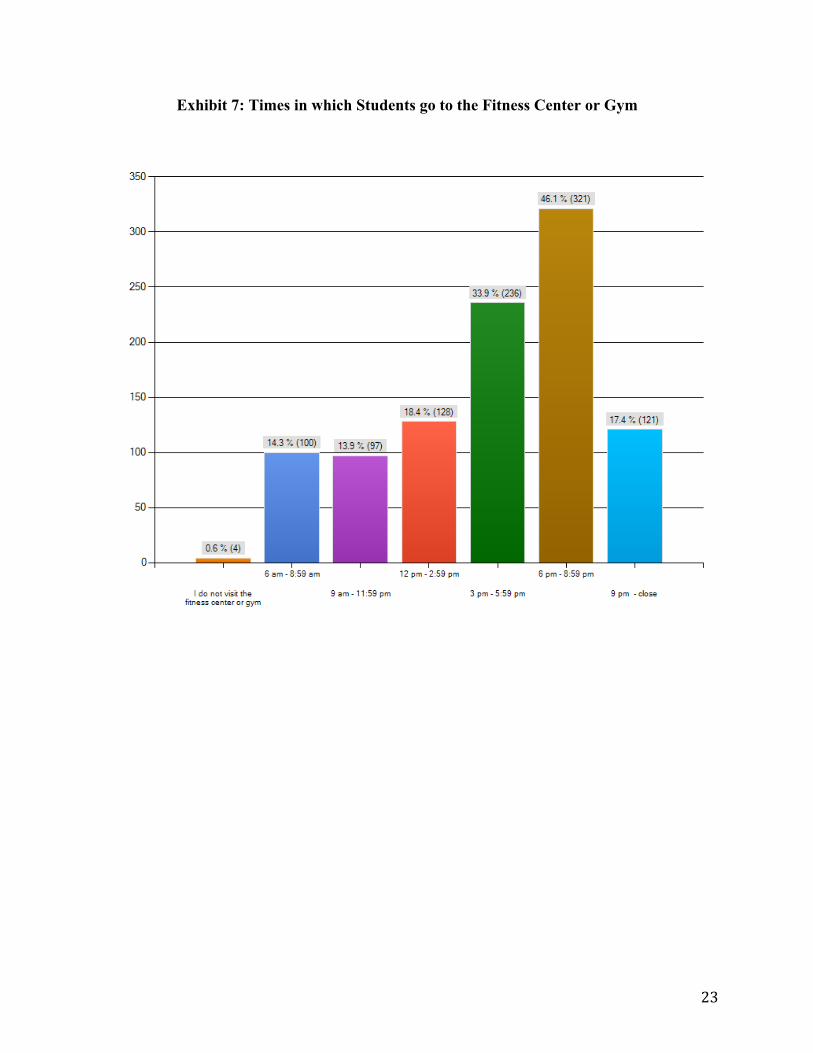
Looking at times at which people go to the gym shows a relatively normal distribution
between the hours of 6 am and 3 pm. After 3 pm there is a spike in the number of people who go
the gym and this spike continues until 9 pm. After 9 pm there is a decrease in the number of
people who go to the gym. This data is particularly useful for organizing times when dance
classes and other services can be offered at the gym as there is almost a guarantee that students
will have time to attend. Exhibit 7 shows the number of students who responded and the times at
which they go to the fitness center or gym. To see whether it would be more convenient to have
the fitness center and gym open later, students were asked if they would be more inclined to go if
it was open later. Approximately 75 percent of respondents said that they would not be more
inclined to go to the fitness center if it was open later. Of the 25 percent who said that they
would be more inclined, the times they specified ranged from midnight to actually having the
facilities open 24 hours a day. As well, some respondents made mention to the fact that the gym
closed earlier on weekends and that it would be more convenient if it was open later. Looking at
extending the hours of operation for the fitness center until 2 am, when the student center closes,
could be beneficial to students at Mount Allison.
In order to possibly better adapt the facilities and services offered at the fitness center and
gym, students who indicated that they did not go to the fitness center or gym were also asked if
8
there was a specific reason as to why the did not go. Many students noted that they did not have
enough time or that because they lived off campus the walk to campus was what they believed to
be enough exercise. Other responses varied from having a lack of motivation to being
uncomfortable with others watching to being more inclined to participate in outdoor and sport-
based activities.
Services
Mount Allison offers a variety of fitness services from Zumba classes to a specialized “fit
camp” which is designed to provide structured fitness activities and a community partnership
where all those involved are looking to benefit from seeing each other succeed. Students were
asked about whether they knew about the different fitness services offered at Mount A. Eighty-
five percent of students said that they were aware, however, there were 15 percent of students
who said that they were unaware. Promoting the benefits of these services could help students
obtain a healthier lifestyle. Of the 85 percent of those who said they knew about the services
provided, they were then asked what types of activities they participated in at the fitness center
or gym. A majority of respondents indicated that they attended the Zumba class, the High Low
class, and had designed their own workout routine for weight training. Other respondents said
that they attended one of the many dance classes put on by Dance Society or by Varsity Dance.
The university swimming pool was closed for renovations during first semester and for
part of second semester. Students were asked if they had ever used the swimming pool and it
should be noted that only 41.5 percent of respondents said that they had used the facility. With
less than 50 percent of respondents saying that they have used the swimming pool, promoting
the benefits of swimming could be a potential way to increase participation in recreational
activities at Mount Allison University.
9
Dietary Habits
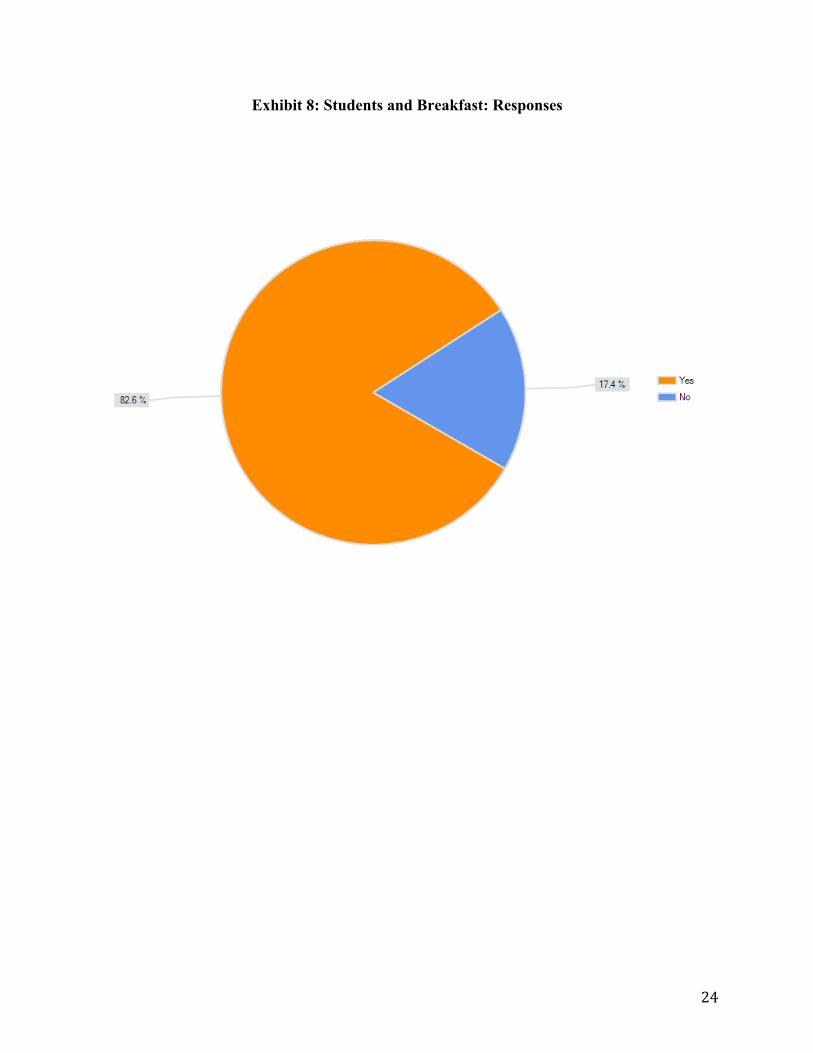
Studies have shown that those who eat breakfast do better in school, as one is able to stay
focused on what is being taught in class. As well, people who eat breakfast are more likely to
maintain a healthy weight, as they are less likely to snack during the day (Region of Peel, 2011).
Students were asked about their dietary habits and whether they ate breakfast. As you can see in
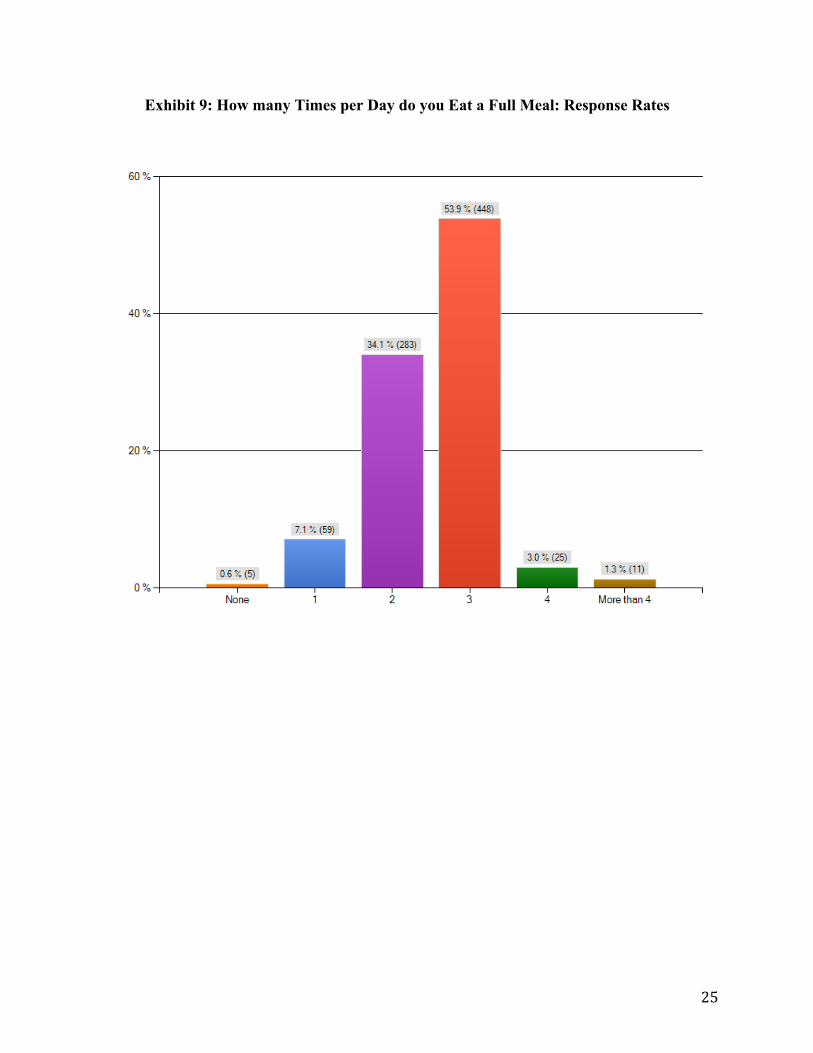
Exhibit 8, 82.6 percent of respondents said they ate breakfast. As well, the survey attempted to
successfully measure the number of times per day individuals ate a full meal. As you can see
from Exhibit 9, 88 percent of respondents said that they ate a full meal two - three times per day.
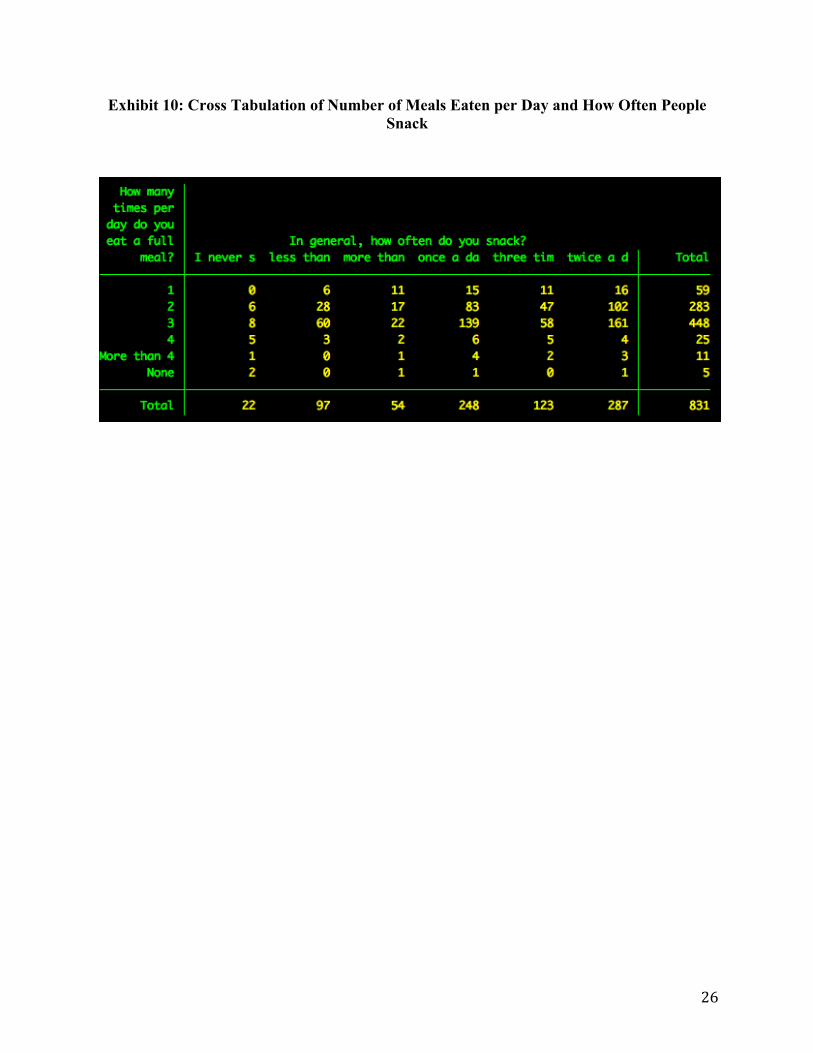
The survey also asked how often each individual snacked. This data was cross-tabulated with
how many meals each person ate daily. As you can see from Exhibit 10, those who said they ate
3 meals per day did the greatest amount of “snacking” and those who ate two meals per day did
the second greatest amount of “snacking.” The majority of those who eat three meals per day
also “snack” between one and two times per day. In order to gain a better understanding of what
people ate when they “snacked”, we asked each respondent what their preferred choice of food
was when they snacked. Many of those who answered this question said that they liked to
“snack” on fruit, vegetables, chips, nuts, popcorn, chocolate, granola bars, and peanut butter.
There were also quite a few respondents who answered the question by saying that they would
snack on whatever they could find.
Sleep Cycles
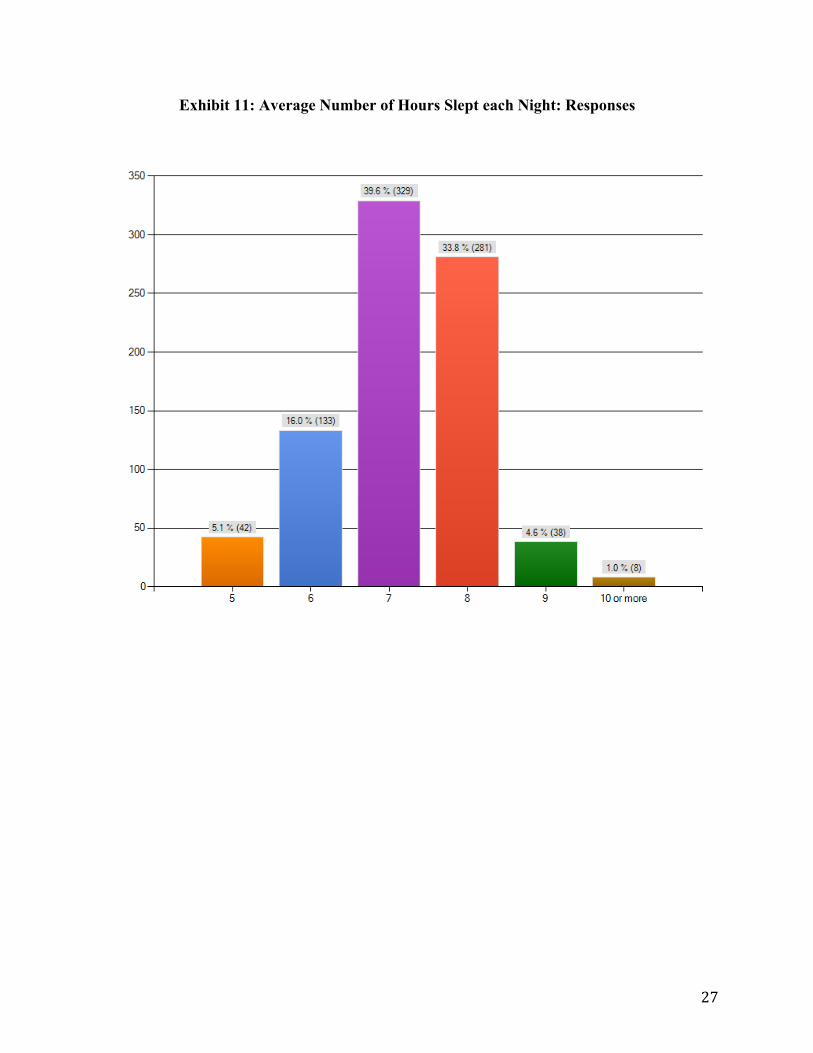
With exercise one also needs to sleep. According to the National Sleep Foundation, adults
need, on average, between seven to nine hours of sleep per night (National Sleep Foundation,
2011). This is an average number and most experts say that there is no “magic number” but
10
rather sleep needs are individual (National Sleep Foundation, 2011). From the responses received
by those who completed the survey, it can be noted that the majority of individuals get between
seven and eight hours of sleep per night. The results obtained can be seen in Exhibit 11. Another
question asked within the survey was whether or not individuals took naps and if so, how long
one slept during their nap. As you can see from Exhibit 12, the majority of respondents, 46.3
percent, said that they did not take naps. As well, 41.8 percent of respondents indicated that their
naps lasted between less than an hour and one hour. Finally, 11.9 percent of respondents
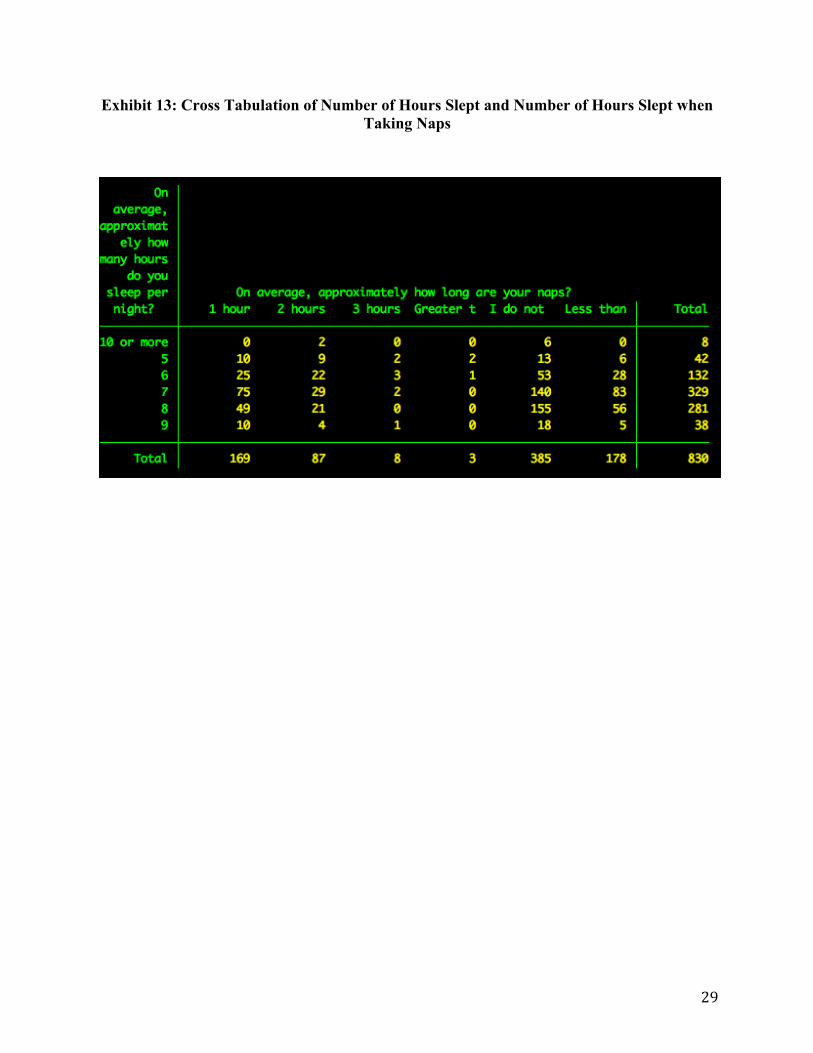
answered saying that they slept for 2 hours or more when taking a nap. Cross tabulating the
responses of time spent sleeping and taking naps indicated that the majority of individuals, 295,
who get between seven and eight hours of sleep per night do not take naps and that 263
individuals would nap an hour or less. This data can be found in Exhibit 13.
Listening to music or being exposed to low frequency noise during sleep has been shown
to affect the cortisol hormone present in one’s body. A study was done with the Department of
Environmental Medicine and the Department of Psychology at The University of Westminster
that dealt with the effects of nighttime low frequency noise on the cortisol response to awakening
and subjective sleep quality. The study showed that night time exposure to low frequency noise
(lfn) may affect the cortisol response when one is woken up and that the lower cortisol levels
after being woken up were associated with subjective reports of lower sleep quality and mood
(Waye et al., 2003). The amount of cortisol hormone present in the blood is highest in the early
morning and has been shown to increase between fifty and one-hundred and sixty percent with in
thirty minutes of waking allowing for one to gain the burst of energy needed in order for the
mind to process information. Cortisol levels should decline as the day progresses and have been
shown to reach their lowest point in the evening, allowing us to relax, rest, and sleep (Växa,
11
2010). With low frequency noise, one’s body is not able to completely block out sensory
messages coming from the outside world and therefore the complete sleep process is not able to
take place. Although our survey did not ask individuals whether or not they listened to music
while they slept, knowing that low frequency noises during sleep can affect the complete sleep
process can help the wellness center promote the fact that noise does affect one’s mind while
sleeping. The wellness center could also use this information in order to promote, to students, the
benefits of obtaining a good night sleep.
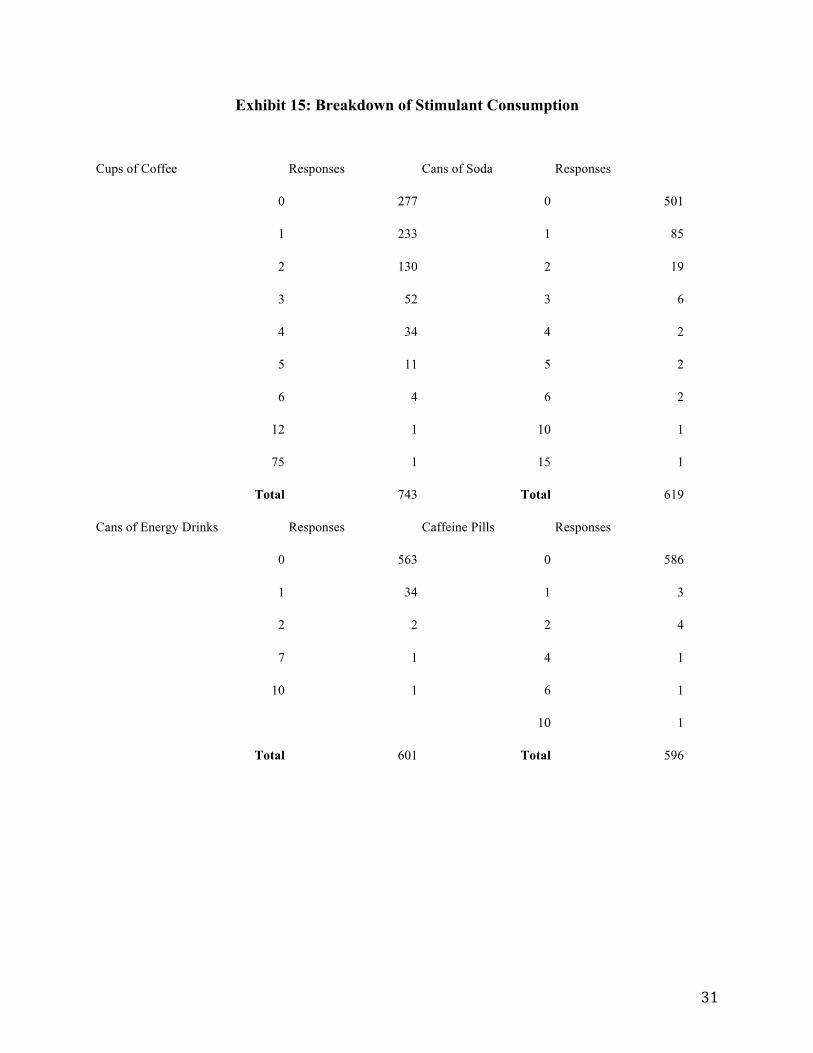
Stimulant Consumption
In order to compensate for a lack of sleep, respondents were asked whether or not they
consumed stimulants such as: coffee, tea, soda, caffeine pills, energy drinks, and herbal
stimulants in order to stay active or motivated to do work. Fifty-three and a third percent of
respondents said that they did not take any sort of stimulant to stay active or motivated to do
work and 46.7 percent said that they did need to take some sort of stimulant in order to stay
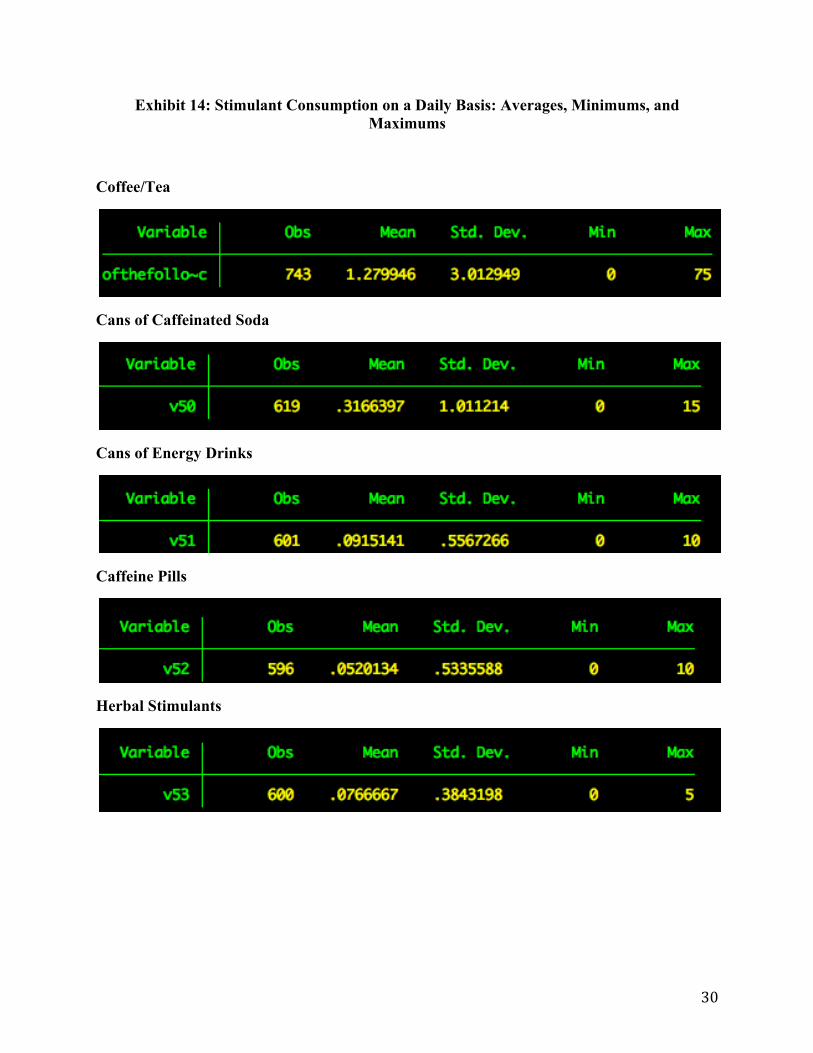
active or motivated. Respondents were also asked about the number of times they drank coffee,
tea, caffeinated soda, and energy drinks on any given day. As well, respondents were also asked
how many times per day they took caffeine pills or herbal stimulants. When looking at Exhibit
14, one can see the averages, as well as the minimum and maximum amounts of each type of
stimulant that was asked about and taken by respondents. It should be noted that under the
question that asked about one’s regular consumption of coffee/tea, the response of 75 should be
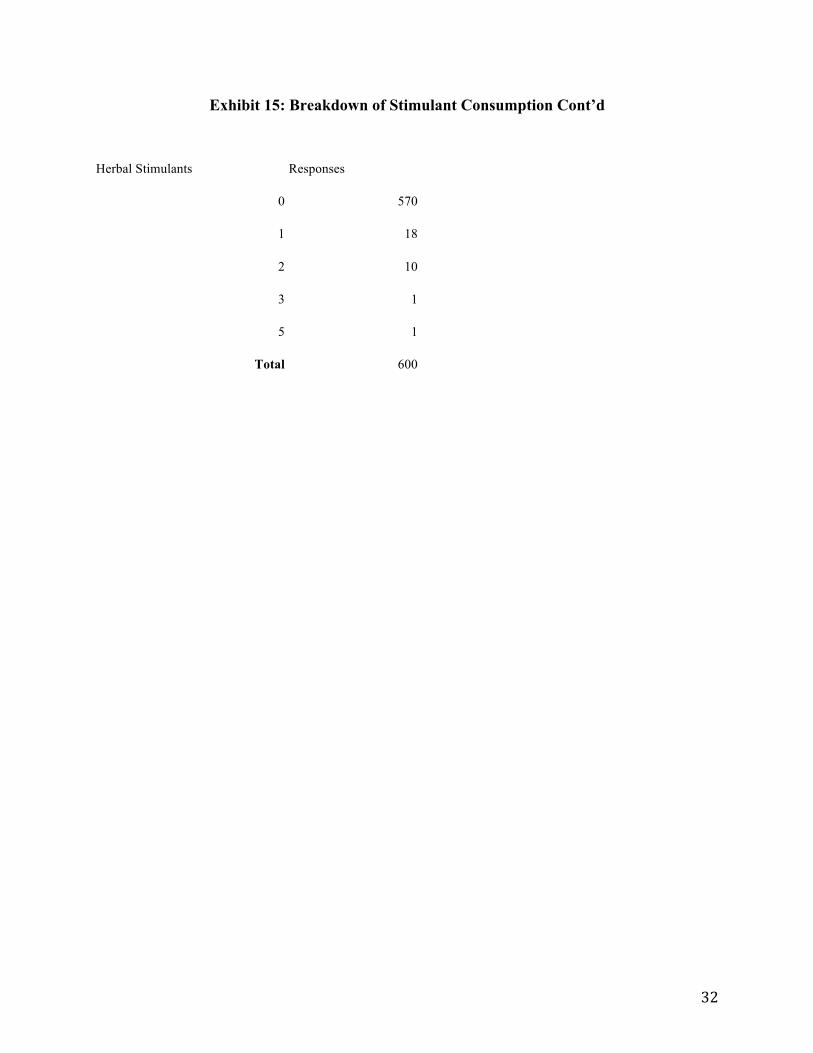
disregarded, as it is an outlier. Exhibit 15 gives a breakdown of the type of stimulant and the
number of times each respondent said they consumed a given type. As one can see, the majority
of respondents drank coffee/tea over any other type of stimulant and caffeine pills and herbal
12
stimulants were the least taken stimulant of the five that were asked about.
Tobacco Consumption
Respondents were asked about whether or not they used tobacco products and if they did
what types were consumed. Approximately 94 percent of respondents indicated that they did not
use tobacco products. Of the 6 percent of respondents that said they did consume tobacco
products, 84 percent of these gave voice to smoking cigarettes. Other responses varied from
cigars, chewing tobacco, sheesha, snuff (nasal tobacco), hookah-tobacco soaked in molasses, to
marijuana. Information on people’s smoking habits and whether or not they smoke can be
particularly useful for the wellness center as they can better adapt their services for those who
fall into the smoking category.
Alcohol Consumption
Consuming alcoholic beverages right after a workout or even that night reduces the proper
healing of muscle tissue. This was posed as a question and respondents were asked whether or
not they knew that this was the case. Of the 829 people who answered this question, 66.1 percent
said that they were unaware of the effects alcohol had on muscles after working out. Results can
be seen in Exhibit 16. The survey also set out to measure the number of times individuals
consumed alcohol in a given week. As you can see from Exhibit 17, the majority of respondents,
36.0 percent, said that they consume alcoholic beverages less than once a week and 25.1 percent
said that they consume alcoholic beverages once a week. It is interesting to note that there were
no respondents who said that they consumed alcoholic beverages six times per week but there
were five respondents who indicated that they consumed alcohol on a daily basis. Respondents
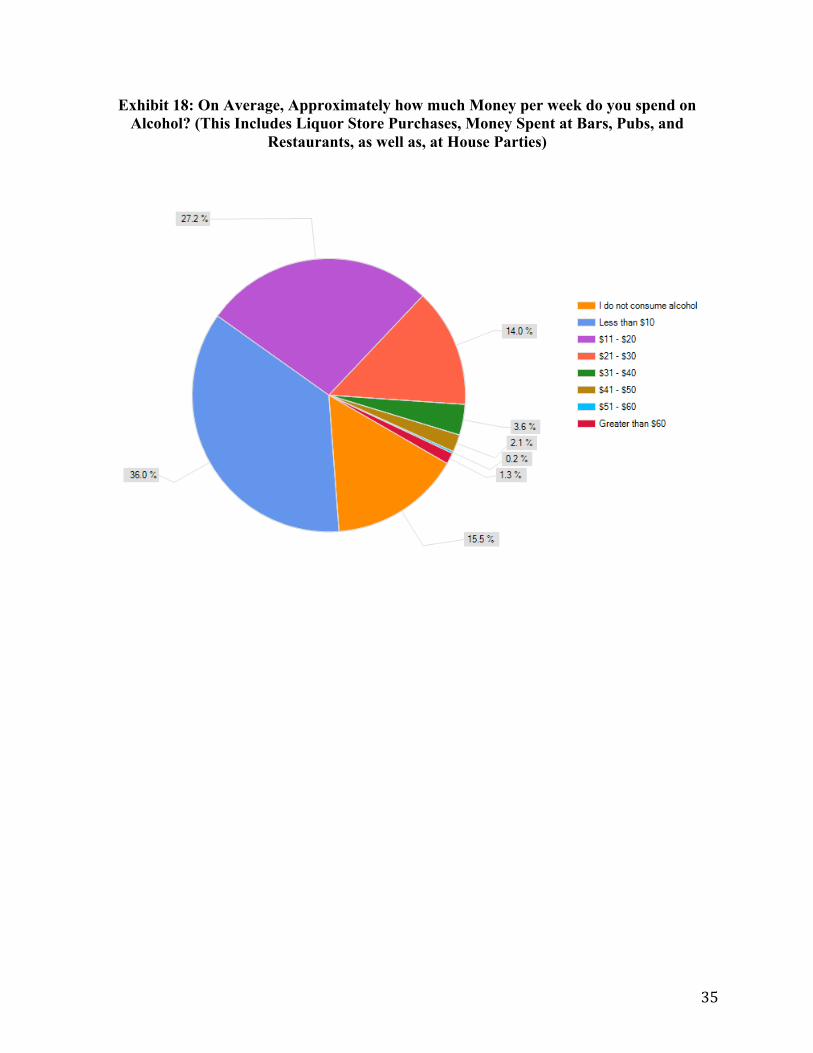
13
were also asked how much they spent, on average, on alcohol each week. This figure included
liquor store purchases, money spent at bars, pubs, and restaurants, as well as, at house events.
Thirty-six percent of individuals indicated that they spent less than $10 and 27.2 percent
responded by saying that they spent between $11 and $20 each week. Exhibit 18 gives a more
detailed look at the breakdown of dollars spent on alcohol by respondents in a given week.
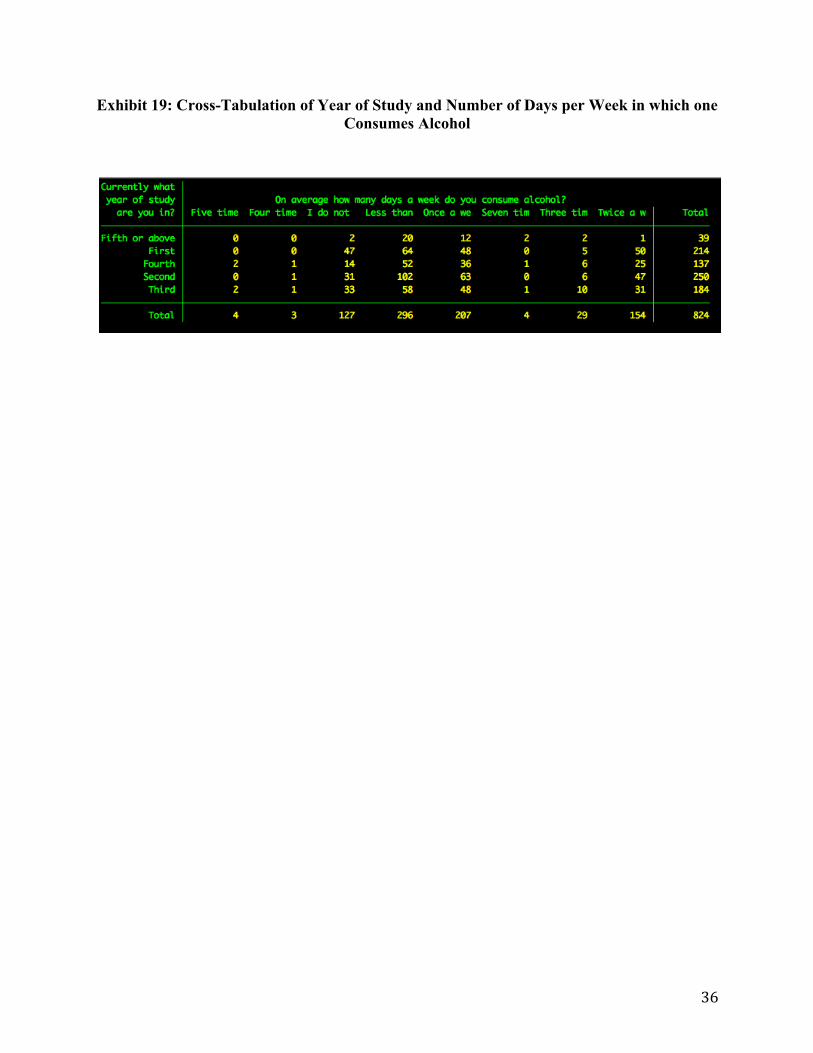
Cross-tabulating one’s year of study and the average amount of days where one consumes
alcohol shows that more second year students consume alcohol when compared to first, third,
fourth, and fifth year students. The results of this cross-tabulation can be found in Exhibit 19.
The results found in Exhibit 18 are what one would most likely expect to see. As one gets further
along in university, the workload is much greater and in order to achieve a high GPA it is
necessary to spend quite a lot of time preparing for classes and working on projects and
proposals, and therefore one spends less time consuming alcoholic beverages.
Conclusion
By taking an in-depth look at what student believe to be important in helping them achieve
a healthy and active lifestyle, Mount Allison University will be able to better adapt the services
they offer. With the information provided, Mount Allison can look at making the fitness center,
gym, and pool open later, look at providing more healthy options at the dining hall, and promote
the importance of obtaining a good night’s sleep. As well, the fitness center might be better able
to educate students on the unhealthy affects that smoking and alcohol play on physical fitness.
14
Additional Comments
Students were encouraged to leave additional comments or questions after they had
completed the survey. Below you will find some of these comments and questions.
- I have wanted to use the facilities more, especially the pool, but with it being closed for repairs for 5 months it did not give me that chance. I hope I will have that opportunity next September. - I think it would help if the gym had a punching bag and also a speed bag. - I really love the fitness center. My favorite thing about it is that it is open so early! I just wish the weekend hours were better. (8 am – 8 pm) - I am not on the swimming team, but I love swimming. I was wondering if a normal student could use the swimming pool? - I don’t really like how the fitness center is automatically included in our school fee. Since I didn’t have a chance to use it this year I would like the choice to pay for it. - It would be great if the pool and gym were open at later hours or if the pool had additional “member swim” times. 8-9 pm on weeknights is a poor time being right in the middle of prime work time. - 24/7 gym hours would be difficult due to safety issues, but commercial gyms find a way to do it; typically by logging entries – either entry via student ID number (punch code) or a card reader to unlock the door to the facility. Also enables theft-prevention since if things go missing you have a list of suspects. - I find, here at Mount Allison especially, you have those really into their fitness and well-being, and those who are completely unconcerned – much of the two extremes. This is something I would like to help change. - I would benefit from an email concerning what is going on in the wellness/fitness center. - There are times in the day when the fitness center is in use or full because of certain activities especially during the evening hours, so there are not many places we can stretch using mats after workout. - The lack of fitness funding is the most significant detractor from the Mount Allison experience. - Aside from just general health, a major area of concern with MTA’s wellness center is its lacking medical services. It’s understandable that there is not enough demand for a doctor to be in full-time, but there should be a doctor in more often, with time to see students who are ill. No
15
one wants to go to Sackville Memorial for an ear infection, but an appointment at the wellness center for 2 weeks later is no help. Additionally, students scheduling appointments for tests or consultations should not have to wait weeks to see a doctor. - Less focus on machines – they are not good for a proper workout. More free weights and benches (and SPACE) in the fitness center so you don’t have to go to the man gym to use free weights (lets be honest – it smells). Should be able to have the environment of the new fitness center with proper equipment. - The hours on weekends of both the fitness center and the weight room should be the same as weekday hours. - As an athlete, the services for varsity athletes here at MTA are terrible. I understand this study is primarily focused on the general student population but I thought I would voice my concerns. There is minimal scholarship money offered to prospective athletes and little academic support is offered to retain struggling student athletes. I have heard numerous people complain and poke fun at the caliber of varsity athletes here at Mount Allison. It all starts with financial sponsorships and this school will never maximize its true potential in athletics if we cannot recruit or retain top quality athletes. There is a ton of potential at this school and great community support but no one wants to support teams who have consistent losing records year after year. I feel little is being done by our athletics department to find corporate sponsors. Strong athletic teams are catalysts for breading contagious school spirit. They can boost morale and develop a sense of pride and belonging. This town has outstanding potential but hasn’t had a winner in a long time; it’s time we gave them one. - Intramural program is awesome, more or less satisfied with MTA athletic and fitness services.
16
References
Mount Allison University. (2011). About. Retrieved April 15, 2011 from http://www.mta.ca/about.html National Sleep Foundation. (2011). How Much Sleep Do We Really Need. Retrieved April 17, 2011 from http://www.sleepfoundation.org/article/how-sleep-works/how-much-sleep-do- we-really-need Region of Peel. (2011). Choosing Healthy Foods: The Importance of Breakfast. Retrieved April 17, 2011 from http://www.peelregion.ca/health/workplace/employees/eating/busy- breakfast.htm
Växa. “Cortisol - The Anti-Sleep Hormone.” Retrieved April 17, 2011 from http://www.vaxa.com/sleep- cortisol.cfm. Waye, Kerstin P., Angela Clow, Sue Edwards, Frank Hucklebridge, and Ragnar Rylander. “Effects of Nighttime Low Frequency Noise on the Cortisol Response to Wakening and Subjective Sleep Quality” Life Sciences 2003: 863-875.
17
Exhibit 1: Mount Allison Student Population: Male v. Female Response Rates
18
Exhibit 2: Programs of Study: Response Rates

19
Exhibit 3: Response Rates and Year of Study
20
Exhibit 4: Adults Aged 18-64 should Accumulate at least how many Minutes of Moderate – to – Vigorous – Intensity Aerobic Physical Activity per week According to the Government
of Canada’s Canadian Physical Activity Guidelines: Response Rates
21
Exhibit 5: Involvement in Physical Activities at Mount Allison University: Responses
22
Exhibit 6: How many times Individuals Visit the Fitness Center or Gym in a Regular Week: Responses
23
Exhibit 7: Times in which Students go to the Fitness Center or Gym
24
Exhibit 8: Students and Breakfast: Responses
25
Exhibit 9: How many Times per Day do you Eat a Full Meal: Response Rates
26
Exhibit 10: Cross Tabulation of Number of Meals Eaten per Day and How Often People Snack
27
Exhibit 11: Average Number of Hours Slept each Night: Responses

28
Exhibit 12: Average Number of Hours Slept during Naps: Responses
29
Exhibit 13: Cross Tabulation of Number of Hours Slept and Number of Hours Slept when Taking Naps
30
Exhibit 14: Stimulant Consumption on a Daily Basis: Averages, Minimums, and Maximums
Coffee/Tea
Cans of Caffeinated Soda
Cans of Energy Drinks
Caffeine Pills
Herbal Stimulants
31
Exhibit 15: Breakdown of Stimulant Consumption
Cups of Coffee Responses Cans of Soda Responses
0 277 0 501
1 233 1 85
2 130 2 19
3 52 3 6
4 34 4 2
5 11 5 2
6 4 6 2
12 1 10 1
75 1 15 1
Total 743 Total 619
Cans of Energy Drinks Responses Caffeine Pills Responses
0 563 0 586
1 34 1 3
2 2 2 4
7 1 4 1
10 1 6 1
10 1
Total 601 Total 596
32
Exhibit 15: Breakdown of Stimulant Consumption Cont’d
Herbal Stimulants Responses
0 570
1 18
2 10
3 1
5 1
Total 600
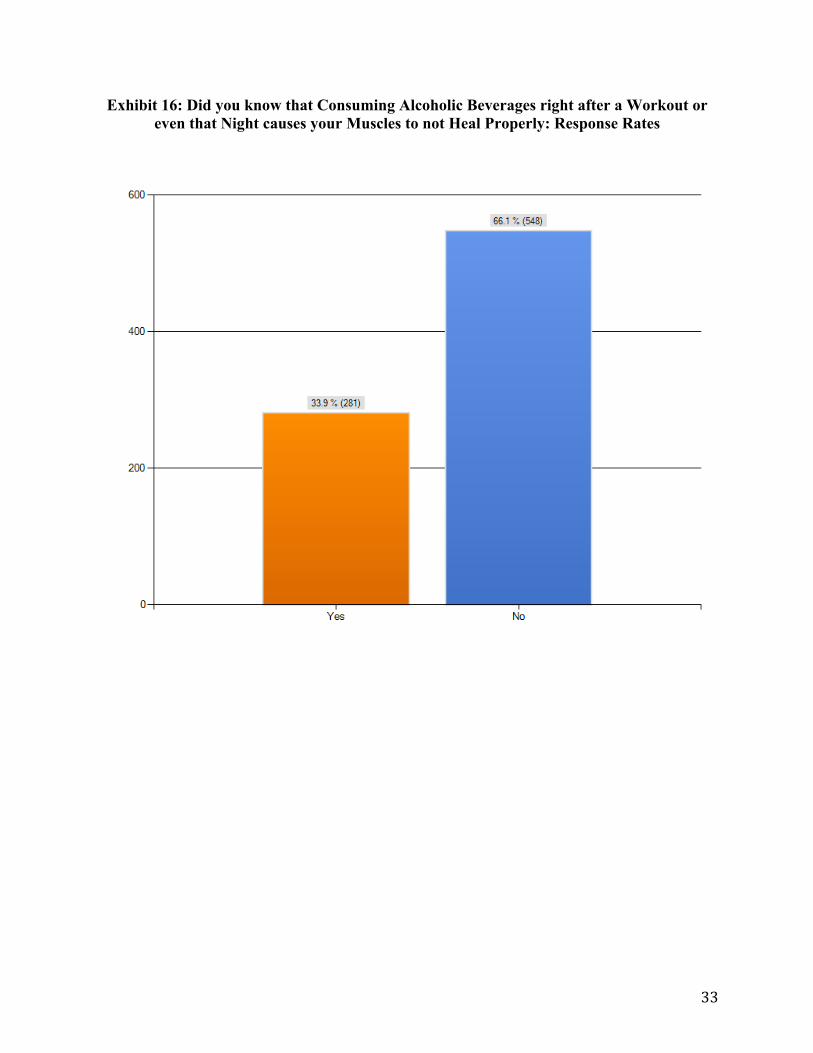
33
Exhibit 16: Did you know that Consuming Alcoholic Beverages right after a Workout or even that Night causes your Muscles to not Heal Properly: Response Rates
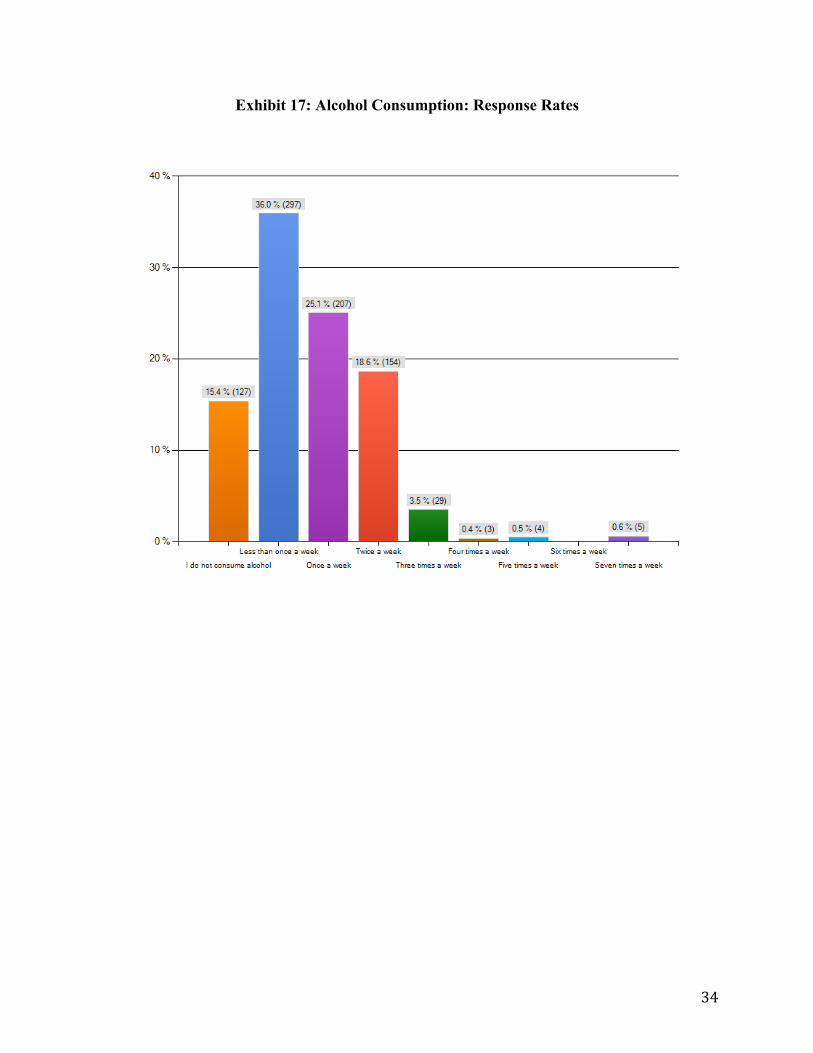
34
Exhibit 17: Alcohol Consumption: Response Rates
35
Exhibit 18: On Average, Approximately how much Money per week do you spend on Alcohol? (This Includes Liquor Store Purchases, Money Spent at Bars, Pubs, and
Restaurants, as well as, at House Parties)
36
Exhibit 19: Cross-Tabulation of Year of Study and Number of Days per Week in which one Consumes Alcohol