physical and functional properties of chromatography media
TRANSCRIPT

X 12 003
Examensarbete 30 hp Januari 2013
Physical and functional properties of chromatography media – a down-scale study
Emma Hansson


Molecular Biotechnology Programme Uppsala University School of Engineering
UPTEC X 12 003 Date of issue 2013-01 Author
Emma Hansson Title (English)
Physical and functional properties of chromatography media
– a down-scale study
Title (Swedish)
Abstract During down scale of column chromatography a phenomenon called wall effect appears. This supports the gel bed and gives it better flow properties. Using three different media in five different sized columns this effect was investigated regarding the physical and functional properties of the media. The conclusion of this study is that the effect appears in columns below 26 mm in diameter and that the impact of the wall effect is larger the more rigid the used media is.
Keywords Chromatography, down scale, wall effect, ion exchange, chromatography media
Supervisors Rodolfo Kurt-Fuentes & Fredrik Kullbo
GE Healthcare
Scientific reviewer Gunnar Johansson
Uppsala University
Project name
Sponsors
Language English
Security
ISSN 1401-2138
Classification
Supplementary bibliographical information Pages 40
Biology Education Centre Biomedical Center Husargatan 3 Uppsala Box 592 S-75124 Uppsala Tel +46 (0)18 4710000 Fax +46 (0)18 471 4687


Physical and functional properties of chromatography media
– a down-scale study
Emma Hansson
Populärvetenskaplig sammanfattning Proteiner är en vanlig beståndsdel i många läkemedel. För att kunna använda ett protein i ett läkemedel eller i livsmedel är det av stor vikt att proteinet är totalt isolerat från andra proteiner och substanser i sin omgivning. Ett vanligt steg i processen mot ett rent protein är kromatografi. Med hjälp av kromatografi kan proteiner renas fram med avseende på deras olika egenskaper så som storlek eller laddning. På läkemedelsföretag sker reningarna i stora kolonner, det vill säga stora tubliknande behållare med kromatografimedia, här kallat bioprocessmedia, som är materialet som används för separation av protein. På GE Healthcare tillverkas bland annat utrustning för proteinrening. Den här rapporten fokuserar på är hur karaktäriseringen, det vill säga egenskaperna, för mediat fastställs i produktionen. För bioprocessmedia karaktäriseras egenskaperna i stor skala av flera liter media. Detta innebär att åtgången av lösningar och provvolymer är stor och därmed begränsas karaktäriseringen. Genom att studera hur fysikaliska och funktionella egenskaper förhåller sig under en nedskalning är hoppet att i framtiden kunna utföra karaktäriseringen av media på små kolonner. Under studien har särskild tyngd lagts vid tryck och flödesegenskaper för mediat i olika skalor av kolonner, men även kapacitet och funktion har fastställts.
Examensarbete, 30 hp Civilingenjörsprogrammet Molekylär bioteknik
Uppsala Universitet januari 2013


Table of contents 1. Introduction ......................................................................................... 9
1.1 Base matrices ....................................................................................... 9 1.2 Ion exchange chromatography ............................................................. 9 1.3 Purpose and goal ................................................................................ 10 1.4 Disposition of the study ....................................................................... 11 1.5 Background; chemical/technical ......................................................... 12 1.5.1 Collapse point determination ......................................................... 12 1.5.2 Packing .......................................................................................... 12 1.5.3 Efficiency test ................................................................................ 13 1.5.4 Function for ion exchanger ............................................................ 13 1.5.5 Breakthrough capacity – ion exchanger ........................................ 14 1.5.6 Cleaning in place (CIP) ................................................................. 14 1.5.7 Stability .......................................................................................... 15
2. Experimental ..................................................................................... 162.1 Materials / Investigated units .............................................................. 16 2.1.1 Media ............................................................................................. 16 2.1.2 Columns ........................................................................................ 16 2.1.3 Equipment ..................................................................................... 16 2.1.4 Chemicals ...................................................................................... 16 2.1.5 Proteins ......................................................................................... 16 2.2 Methods .............................................................................................. 17 2.2.1 Solutions ........................................................................................ 17 2.2.2 Sample Solutions........................................................................... 17 2.2.3 Slurry Preparation.......................................................................... 17 2.2.4 Pressure/Flow ................................................................................ 18 2.2.5 Step flow ........................................................................................ 18 2.2.6 Packing .......................................................................................... 19 2.2.7 Efficiency ....................................................................................... 19 2.2.8 Function ......................................................................................... 20 2.2.9 Breakthrough capacity ................................................................... 20 2.2.10 Stability .......................................................................................... 21 2.3 Criteria for acceptance ........................................................................ 21
3. Results ............................................................................................... 213.1 Pressure/Flow ..................................................................................... 21 3.2 Flow step............................................................................................. 21 3.3 Packing ............................................................................................... 23 3.4 Efficiency............................................................................................. 24 3.5 Function .............................................................................................. 26 3.6 Breakthrough capacity ........................................................................ 28 3.7 CIP ...................................................................................................... 29
4. Discussion / comments .................................................................... 294.1 Flow properties ................................................................................... 29 4.1.1 Collapse Point ............................................................................... 29 4.1.2 Application flow .............................................................................. 30 4.2 Other comments ................................................................................. 31
5. Conclusions ...................................................................................... 31
6. Proposed action plan ....................................................................... 32
7. A special thanks to… ....................................................................... 32
8. References......................................................................................... 33
9. Attachments ...................................................................................... 349.1 Efficiency............................................................................................. 34 9.2 Function .............................................................................................. 35 9.3 Breakthrough capacity ........................................................................ 38 9.4 CIP ...................................................................................................... 40 9.5 Physical stability ................................................................................. 40


1. IntroductionToday physical characterization of bioprocess media are often made in large bioprocess columns with volumes of several litres. This results in high expense regarding time, amount of buffer, sample and it may cause quality problems if tests must be omitted due to cost limitations. When small columns are used function, capacity and stability can be controlled to a higher extent. If the characterization can be performed using small-scale columns, there is much to gain.
The largest difference in functionality between small lab scale columns and the bioprocess columns is the impact of the wall effect. The wall effect is a support to the media given by the walls, resulting in better flow properties in smaller columns. This effect decreases with an increasing diameter of the column. Another known feature of the wall effect in small columns is the distribution of the sample, which tends to flow near the column wall when the wall effect is large.
In this study three media, Q Sepharose FF, MabSelect and Capto Q, were evaluated regarding their physical and functional properties in a scale down study.Investigations were made in five different sizes of columns from 5-50 mm in diameter. Because of limited budget only the flow properties were investigated for MabSelect.
1.1 Base matrices This study includes two types of base matrices, High Flow (HF) and Fast Flow (FF), where HF includes Capto Q and MabSelect and FF includes Q Sepharose FF. All these matrices are based on agarose. When comparing the different media, Capto Q is more rigid because of higher levels of crosslinking.1,2 Because of the higher rigidity, the physical stability of Capto Q is very high compared to Q Sepharose FF which is the most soft media used. This high level of crosslinking makes it possible for larger pores and therefore the binding capacity is larger and a higher flow velocity can be applied.1 The average size of the beads are different for the different media which can be seen in table 1 below where Capto Q is the smallest one and Q Sepharose the largest.
Table 1: Characteristics of the three different media used in this study.
Media Material Average Size Level of crosslinking
Content of agarose
Q Sepharose FF Agarose 6 FF 90 µm Low 6% MabSelect High Flow Agarose HF 35 85 µm Medium 3.5% Capto Q High Flow Agarose HF 70 75 µm High 7%
1.2 Ion exchange chromatography Ion exchange chromatography separates the sample based on net surface charge. This charge depends on the amino acid composition of the protein.3 An anion exchanger is a positively charged chromatography medium which requires an equilibration buffer with low ionic strength to give the media the right properties to interact with the negatively charged molecules. When the sample is loaded the molecules that do not interact with the anionic exchanger will pass through the column while the ones that interact will stay bound. Bound proteins can be eluted
9

with an increasing ionic strength, meaning an elution buffer with a heighten salt concentration. The more negative the net charge of the protein, the higher the ionic strength needs to be used for elution. 3
In this study the anionic exchangers Q Sepharose FF and Capto Q were used. The Q stands for Quarternary ammonium, which is the functional group, shown in figure 1. Further information about the media is shown in table 1 above. The difference between the functional group of these media is that on Q Sepharose FF the ligands are attached directly to the surface of the matrix and on Capto Q the ligands are attached to extenders which in their turn are attached to the matrix.1
Figure 1: The functional group Q of the strong anionic exchangers Q Sepharose FF and Capto Q.
1.3 Purpose and goal The aim with this study was to investigate which effect scaling down of chromatography columns has on the physical and functional properties of the media. The goal was to investigate if the behaviour of bioprocess media in large scale columns can be predicted using small columns.
Therefore, I have investigated the effect on physical and functional properties during a scale down study. The bioprocess media used in the study are mostly anion exchangers.
10

Q Sepharose FF
Capto Q
MabSelect
Collapse point determination
- Flow/Pressure - Flow Step
Efficiency
Function
Capacity
CIP
Stability
Efficiency
Function
Packing
Figure 2: The three media used starting with Q Sepharose FF.
1.4 Disposition of the study
The study was performed according to figure 3. The three media being used during this study was Q Sepharose FF, MabSelect and Capto Q, figure 2. This study includes columns with an inner diameter from 5 mm to 50 mm, all with a bed height of approximately 10 cm.
1. The study started with characterization of the flow properties for the different setups of media and columns. This was done using the open bed methods flow/pressure and flow step (blue box).
2. Q Sepharose FF and Capto Q were packed into the columns and the media wereevaluated regarding their functionality and stability. (green boxes)
Figure 3: Timeline for the different methods used during this study.
Phy
sica
l pro
perti
es
Func
tiona
l pro
perti
es
Phy
sica
l prp
oper
ties
11
1.5 Background; chemical/technical
1.5.1 Collapse point determination The collapse point was evaluated in two different methods, described below.
1.5.1.1 Pressure/Flow The pressure/flow method is performed to determine the relation between the pressure and the flow velocity for a specific column and media set up.4 This is made in an open bed, which means that the adaptor is not adjusted to contact with the surface of the gel. The method can be done by pumping liquid through the column using water in a linear ascending flow rate until the media collapses and the collapse point is reached. The interval that includes the collapse point can be determined as the place from which the linearity of the pressure ends until the place where the pressure increases unlimited. Using this method the collapse point will be estimated but to be more exact a further experiment can be applied where the interval around the collapse point is investigated with a step flow method. 4
1.5.1.2 Step Flow With the step flow method the interval around the collapse point is further investigated by increasing flow velocity in small steps over the column in the given interval. Before the collapse point the pressure will be stabilized after each rise of the flow, but when the collapse point occurs the pressure will keep increasing even when the flow is unchanged. This collapse point will be used as a basis for determination of packing parameters and maximum flow.4
1.5.2 Packing There are in particular three techniques for packing a column, mechanical compression, pressure and flow packing, the latter of which is the technique used in this study.4 A well packed bed is characterized by a homogenous spread of particles within the media. It is important that the media is compressed enough to prevent modifications in the homogenous packed bed when using the columns at high flow rates. On the other hand, if the bed is compressed too much it might lead to development of channels through the bed or in the worst cases the bed can collapse.4
When packing a column the large particles in the media will settle by them self with the help of gravity, this is a unwanted effect that can be prevented by using a low flow of liquid thorough the column during the beginning of packing. Otherwise the distribution in particle size will be inhomogeneous over the column with the largest particles in the bottom and the smallest at the top. Thus, the settle flow velocity has to be higher for larger and more rigid media than for small ones.6 The packing will be finalized using a high flow velocity in order to compress the media and create a stabile bed.
Long and narrow columns need a higher radial flow velocity compared with broader ones, this is because of the so called wall effect. If the same linear flow is used for packing narrow column as for wide ones the narrow columns tend to be loosely packed which in long term use might lead to bad reproducibility. To investigate how well packed the beds are the packing can be evaluated with an efficiency test.7
12

1.5.3 Efficiency test Efficiency test is a qualification method for evaluation of the packed columns.7 Some of the parameters that have an impact on the test are for example:
• Particle size and distribution of themedia
• Homogeneity of the bed• Flow rate for the test• Sample and sample volume• Elution buffer
For best result it is important to keep the external volume as small as possible. The external volume corresponds to the volume from the injection valve to the column and from the column to the point of detection. The sample should be 1-2% of the column volume and can be acetone in water or high salt in low salt. It is important that the column is equilibrated with the elution buffer before the sample injection. There are ready methods in the UNICORN software to use for evaluation of the efficiency but theoretical plates per meter, N/m, and asymmetry can be calculated as:
𝑇ℎ𝑒𝑜𝑟𝑒𝑡𝑖𝑐𝑎𝑙 𝑝𝑙𝑎𝑡𝑒 𝑛𝑢𝑚𝑏𝑒𝑟 =𝑁𝑚
Where m is the length of the bed in meters and N is the number of plates in the bed, which can be calculated as:
𝑁 = 5.54 �𝑉𝑅𝑊ℎ
�2
VR is the retention volume, which is the volume from the injection of the sample to the column to the elution. Wh is the width at half the height of the elution peak. The asymmetry is calculated as
𝐴𝑠 =𝑏𝑎
Where a is the width of the first half of the peak at 10% at the peak height and b the width at the second half, how to use these formulas can be seen in figure 4.7
1.5.4 Function for ion exchanger The function method evaluates how well the column separates a mix of different proteins according to their net charge.3 The elution will be accomplished by an increasing salt gradient. The resolution, Rs, is calculated as the difference between the maximum of two peaks divided with the average base width for the two closest peaks. Rs is a measurement of how well the two peaks are separated. The following equation is used to calculate the resolution and how to use it is shown in figure 5 .
N/m from an elution profile using the equations given in the text .The best result is given from a high narrow peak with good asymmetry.
13
Figure 4: How to evaluate asymmetry and

𝑅𝑠 =2(𝑉𝑅2 − 𝑉𝑅1)𝑤𝑏1 + 𝑤𝑏2
For the peaks to be base line separated a Rs value above 1.5 is needed.3
1.5.5 Breakthrough capacity – ion exchanger When evaluating the capacity of the column, meaning how much the nedia can bind of a specific protein, a large sample injection is made to determine Qb,10% and Qb,85%which is the dynamic binding capacity.
4 What is investigated is not the total capacity of the gel but the breakthrough capacity meaning how much protein that is bound to the column when 10% and 85% of the injected sample flows through. It is of higher value to investigate the flow through capacity than the total capacity because when using the column in its full capacity large amounts of sample will get lost as flow through.4
Qb,x can be calculated as
𝑄𝐵,𝑋% =𝐶0(𝑉𝑋% − 𝑉𝐷) − 𝐶0
𝐴100% ∫𝐴(𝑉)𝑑𝑉𝑉𝑋%
𝑉0
𝑉𝐶Where X in this case is 10% or 85%. 𝑄𝐵,𝑋% Dynamic binding capacity at X% of maximum. Absorbance C0 Concentration of the injected BSA [mg/ml] VX% Volume of protein solution [ml] when X% of absorbance is detected VD Death volume of the system A100% Maximum absorbance at the system for the BSA solution A(V) The absorbance curve given of the method VC Volume of the gel bed
1.5.6 Cleaning in place (CIP) The development of an accurate CIP (Cleaning in place) protocol is of great value for an efficient downstream process.9 For example if the column has been used it is good to CIP the column before a capacity test will be performed for a more accurate result.
Most agarose based media can for example be CIPed using 1M Sodium hydroxide for 1 hour contact time or 20% ethanol for 2 hour contact time. The benefits of using
Figure 5: How to calculate the resolution between two peaks.
14

Sodium hydroxide are that it is easy to remove and detect according to the conductivity level. The functional benefits with using sodium hydroxide are that it also is effective in inactivation of viruses, bacteria and yeast and it removes DNA and proteins from the media easily.10 Sometimes DNAse is needed to remove DNA which can be captured in the bed during use.11 Through continuous CIPs the lifetime of the media can be increased by preventing a gradual build-up of contaminants.12 Large amounts of different microorganisms can change the characteristics of the media if it releases harmful substances such as endotoxins or proteases or if the concentration gets too high as it will clog the column totally. 10 After a CIP it is important to equilibrate the column to get rid of all the NaOH before further use.
1.5.7 Stability A physical stability test simulates a number of purification cycles that are run over the column and the result after these cycles is compared with the result from before the test was accomplished.4 The test can be performed with protein sample or with glycerol in water that gives a higher viscosity that simulates a sample. The goal with the stability test is that the physical and functional properties should be the same before and after this test. This comparison can be made on efficiency test for physical properties and function test for functionally properties.4
15

2. Experimental
2.1 Materials / Investigated units
2.1.1 Media Media Lot number Article number Q Sepharose FF 294725 & 288053 (mixed) 17-0510-04 MabSelect 10011269 17-5199-03 Capto Q 10009361 17-5316-04
2.1.2 Columns Column Dimension Maximum pressure Article number
[mm] [MPa] Tricorn 5/100 10 28-4064-10 Tricorn 10/100 5 28-4064-15 HiScale 16/200 2 28-9644-41 HiScale 26/200 2 28-9645-14 HiScale 50/200 2 28-9644-45 All Columns used was delivered by GE healthcare.
2.1.3 Equipment Chromatographic systems (GE Healthcare) System Max flow Max pressure Article number
[ml/min] [MPa] ÄKTA explorer 10 10 25 18-1300-00 ÄKTA explorer 100 100 10 18-1112-41 ÄKTA PILOT 1 800 (400/pump) 2 18-1164-95
Other equipment Equipment Name Supplier ID number pH meter SevenEasy METTLER TOLEDO 5757 Scale PG503-S METTLER TOLEDO LMA85 Spectrophotometer Spectra max plus Molecular Devices LMA110 Centrifuge Avanti J-20 XP Beckman Coulter 5568
2.1.4 Chemicals Chemical Supplier Lot number Article number Ethanol 99.5% Kemetyl - 10014482 Sodium Cloride Merck K42278904 123 1.00317.1000 Sodium Hydroxide Merck B0586969 133 1.06469.1000 TRIS-HCl Merck TD9349919 045 1.08219.1000
2.1.5 Proteins Protein (Source) Supplier Lot number Article number
α-Lactalbumin (Bovine milk) Sigma L5385 110M7003V BSA (Bovine serum) Sigma A7906 120M1916V Conalbumin (Chicken egg) Sigma C0755 107K7022 Trypsin inhibitor (Soy bean) Sigma T9003 031M7315V
16

2.2 Methods
2.2.1 Solutions
Efficiency test: 0.2M NaCl in distilled H2O.
Function test: Buffer A: 20mM TRIS pH 7.0. Buffer B: Same as Buffer A but with an addition of 0.25M NaCl.
Capacity test: Buffer A: 50mM TRIS pH 8.0. Buffer B: Same as Buffer A but with an addition of 0.5M NaCl.
CIP: 1.0M NaOH in distilled H2O.
Stability test: 20% Glycerol in distilled H2O.
2.2.2 Sample Solutions
Efficiency test sample: 0.8M NaCl in distilled H2O.
Function test samples: 3.75 mg/ml Conalbumin 2.5mg/ml α-Lactalbumin 3.75 mg/ml Trypsin inhibitor Dissolved in Function test buffer A. All three were mixed from stocks containing 10 mg/ml each.
Capacity test sample: Ca. 4 mg/ml BSA dissolved in Capacity test buffer A.
2.2.3 Slurry Preparation The most important thing about the slurry preparation in this study was to keep the same concentration of the slurry during pressure/flow measurements, flow step measurements and packing. The concentration was decided by centrifugation.
1. Make the slurry homogenous by shaking it.2. Take two samples with the same volume of the gel and put it in 50 ml falcon
tubes.3. Spin the slurry for 3000rpm (1570 *G) for 5 minutes.4. Evaluate the slurry concentration by comparing the volume in the tubes, then
add or remove the liquid for an accurate concentration.
17
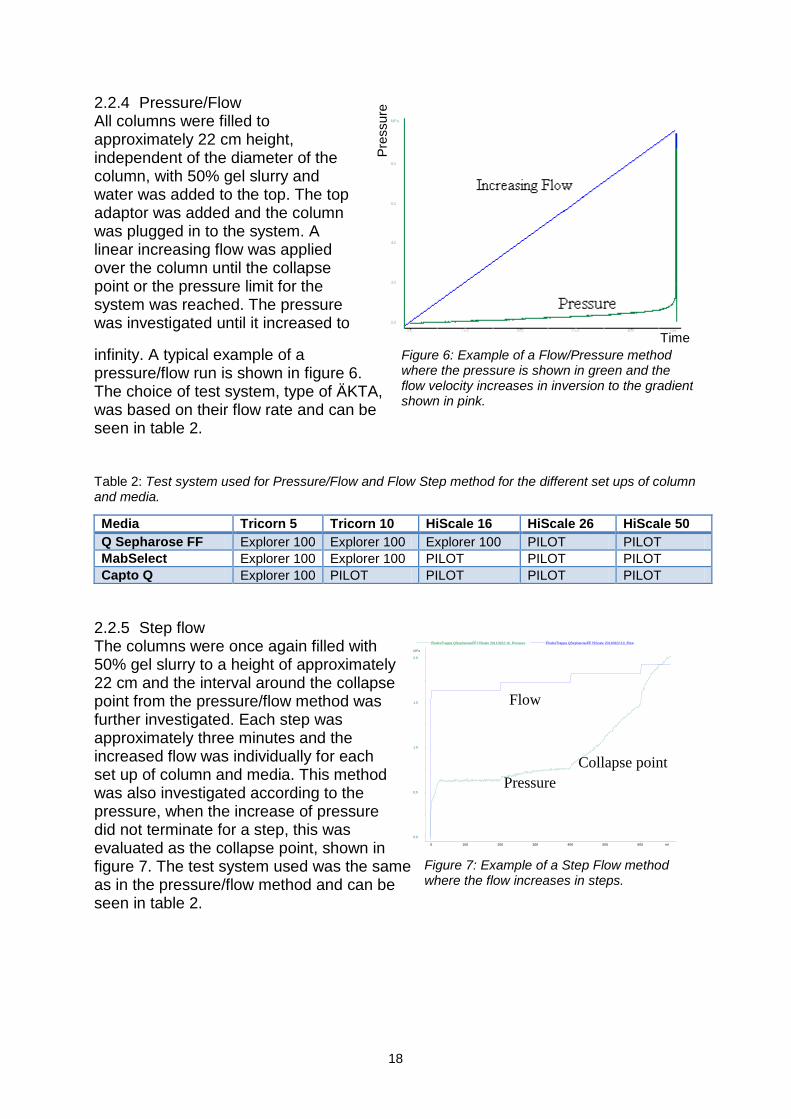
2.2.4 Pressure/Flow All columns were filled to approximately 22 cm height, independent of the diameter of the column, with 50% gel slurry and water was added to the top. The top adaptor was added and the column was plugged in to the system. A linear increasing flow was applied over the column until the collapse point or the pressure limit for the system was reached. The pressure was investigated until it increased to
infinity. A typical example of a pressure/flow run is shown in figure 6. The choice of test system, type of ÄKTA, was based on their flow rate and can be seen in table 2.
Table 2: Test system used for Pressure/Flow and Flow Step method for the different set ups of column and media.
2.2.5 Step flow The columns were once again filled with 50% gel slurry to a height of approximately 22 cm and the interval around the collapse point from the pressure/flow method was further investigated. Each step was approximately three minutes and the increased flow was individually for each set up of column and media. This method was also investigated according to the pressure, when the increase of pressure did not terminate for a step, this was evaluated as the collapse point, shown in figure 7. The test system used was the same as in the pressure/flow method and can be seen in table 2.
Media Tricorn 5 Tricorn 10 HiScale 16 HiScale 26 HiScale 50 Q Sepharose FF Explorer 100 Explorer 100 Explorer 100 PILOT PILOT MabSelect Explorer 100 Explorer 100 PILOT PILOT PILOT Capto Q Explorer 100 PILOT PILOT PILOT PILOT
Figure 6: Example of a Flow/Pressure method where the pressure is shown in green and the flow velocity increases in inversion to the gradient shown in pink.
Figure 7: Example of a Step Flow method where the flow increases in steps.
18
FlodesTrappa QSepharoseFF HiScale 20110922:10_Pressure FlodesTrappa QSepharoseFF HiScale 20110922:10_Flow
0.0
0.5
1.0
1.5
2.0
MPa
0 100 200 300 400 500 600 ml
Collapse pointPressure
Flow
Time
Pres
sure

2.2.6 Packing The columns were packed in a two-step method beginning with a low settle flow during which the media will be settled homogenously. Afterwards the bed was packed using a packing flow, which responds to a higher velocity of the liqiud, these flow rates and the time are shown for the different set ups in table 3. During the packing flow a mark was made on the column at the top of the gel bed. When the bed was packed the adaptor was turned down to the surface of the gel which now was loosened at the top, therefore an additional flow was added at the packing flow rate. Once again the gel bed was dense packed and the adaptor was now adjusted until the mark on the column.
Eluent: distilled water. Settle flow: 35% of maximum flow for Tricorn, 40% for HiScale Packing flow: 80% of maximum flow for Tricorn, 100% for HiScale
The maximum flow responds to 80% of the collapse point received from the flow step methods. Because of the high rigidity of Capto Q the collapse point was set to the flow at the maximum pressure for the hardware. The difference in packing flow between Tricorn and HiScale was to assure that the same linear flow can be used for all columns during function and capacity test without risk of collapse of the bed.
Table 3: Settle flow and packing flow for all different set ups of columns and media. The packing flow for Capto Q in HiScale 50 was set after the highest flow the system (ÄKTA PILOT) can create.
Q S
epha
rose
FF
Column Tricorn 5 Tricorn 10 HiScale 16 HiScale 26 HiScale 50
Settle flow [cm/h] 1497 856 885 610 560
time [min] 2 3 3 3 4 Packing flow [cm/h] 2995 1706 1766 1130 1166
time [min] 2 2 2 2 2
Cap
to Q
Settle flow [cm/h] 8931 4342 3437 3390 1222 time [min] 2 3 3 3 4
Packing flow [cm/h] 17825 7639 6764 5085 2445 time [min] 2 2 2 2 2
2.2.7 Efficiency The efficiency test was performed using 0.8M NaCl as sample and 0.2M NaCl as eluent. From this test the asymmetry, N/m and back pressure was evaluated. One determination was done for each column.
Flow rate: 150 cm/h. Sample volume: 1 % of column volume Equilibration: 5 CV eluent. Elution: 2 CV eluent.
19

2.2.8 Function The function method was performed for analysing the separation of a protein mix existing of three different proteins. The proteins were injected using a loop or for the bigger columns (≤26 mm) a super loop. The volume of the proteins for the different size of column is shown in table 3 below. The separation was evaluated as the resolution between the three peaks and at what conductivity they were eluted. One determination was done for each column.
Flow rate: 150 cm/h. Sample volume: shown in table 4. Equilibration: 4 CV function buffer A. Elution: 20 CV linear gradient of function buffer B.
Table 4: Sample volume for each different size of columns during function the method, the sample volume is the same for Q Sepharose FF and Capto Q, the bed volume of the columns are calculated on a bed height of 10.0 cm.
Column Bed Volume [ml]
Sample Volume [ml]
Tricorn 5 1.96 0.24 Tricorn 10 7.85 0.94 HiScale 16 20.0 2.41 HiScale 26 53.0 6.37 HiScale 50 196 23.55
2.2.9 Breakthrough capacity The capacity of the anionic media in the different columns was evaluated with Bovine Serum Albumin, BSA. The concentration of the BSA was analysed in quadruplicate by absorbance measurement at 280 nm in a spectrophotometer. The mean value from this was used to calculate the concentration of BSA which was done using lambert-Beers law, as shown below. 100% of the maximal UV was measured on the system as flow through. Prior to the analysis the column was CIPed, one determination was done for each column.
𝑐 = 𝐴𝜉∗𝑙
Lambert-Beers law: Where c is the concentration in mg/ml, A the absorbance, 𝜉 the extinction coefficient for the protein and l the length of the cuvette.
Flow rate: ~150 cm/h. CIP: 1 CV 1M NaOH in the beginning and in the end of the method. Equilibration: 5 CV capacity buffer A. Sample: BSA 4 (± 10%) mg/ml in capacity buffer A. Elution: 2 CV capacity buffer B.
After the run Qb,10% and Qb,85% was determined according to an internal test method.
20

2.2.10 Stability The stability test was performed using 20 % glycerol in a constant flow for 120 cv. The aim with the glycerol was to create a higher viscosity simulating a sample for a long term use. Analysis was made by comparing efficiency test run 1 and run 2, which means the efficiency test directly after the packing and the efficiency test after the column being used.
Flow rate: 20% of maximum. flow rate. Sample: 20% Glycerol. Duration: 120 CV.
2.3 Criteria for acceptance This is a comparative study. Therefore the standard acceptance of the different tests is not used.
3. Results
3.1 Pressure/Flow The pressure/flow experiment resulted in an interval to investigate in the followed flow step method. Because of limitations in flow rate for the ÄKTA system, the interval for MabSelect in HiScale 50 and for Capto Q in all HiScale columns could not be determined. As expected the linear flow rate decreases with the increasing diameter of the column, table 5. The result show that the flow properties are best for Capto Q and that Q Sepharose has the lowest limit for flow velocity.
Table 5: The interval for further investigations during step flow for all different set ups determined with pressure/flow method. Interval for flow rate in cm/h.
Flow [cm/h] Tricon 5 Tricorn 10 HiScale 16 HiScale 26 HiScale 50 Q Sepharose FF 2445-4890 1530-2900 2210-2565 1470-1810 1130-1530 MabSelect 6110-12200 3975-6110 3880-4625 3390-3955 N.D. Capto Q 18640-25055 7640-13750 N.D. N.D. N.D.
3.2 Flow step For all set ups of column and media the collapse point from the Flow step method corresponded to a point within the given interval from the Pressure/Flow experiment. The points that could not be found with the Pressure/Flow method were not found with this method either because of limitations of flow and pressure resistance for the system and columns. Table 6 presents the collapse points for the different set ups.
21

Table 6: The flow rate for the collapse point for the different combinations of media and column given in cm/h. When the > sign is used the collapse point was not reached because of limitations in the set up.
Break point [cm/h] Tricorn 5 Tricorn 10 HiScale 16 HiScale 26 HiScale 50 Q Sepharose FF 4278 2445 2208 1526 1406 MabSelect 9167 4584 4178 3503 > 2445 Capto Q 22307 10848 >8654 >6781 >2445
Figure 8 presents a plot of the results given in table 6 where the non-coloured dots respond to limitations in the method arrangement and not a collapse of the media. There is a large difference between the results in the 5 mm columns compared to the others, especially between the 26 mm and 50 mm column where the difference seems to disappear according to the Q Sepharose FF result. The same is indicated for MabSelect but because of no results for the 50 mm column this cannot be established. For Capto Q only the two smallest columns gave a result but from this we can see the same large difference between the 5 mm and the 10 mm column. For the non-coloured points we can see that the media did not collapse during these flow velocities therefore we can assume that the curve flattens out even for Capto Q. One can also see that the difference between the collapse point between the 5 mm and 10 mm column is larger the more rigid media being used.
For each media the pressure at the same linear flow rate was evaluated, figure 9-11, the flow rate used was 50% and 80% of the maximal flow or maximal determined flow which responds to flow used in applications for the media. Figure 9 shows how the pressure levels out quite fast for the increasing column diameter. When studying the same thing for Capto Q and MabSelect the linear flow at 80% is much higher comparing to Q Sepharose FF. At this flow a trend where the pressure for the Tricorn 10 mm is higher than for HiScale 16 can be seen, the reason of this might be because of different filters in the Tricorn and HiScale columns. The pressure differences between 10 mm 16 mm are larger the higher the flow is which strengthen the theory about how the column properties influence the pressure and should be considered when choosing column. The differences in pressure at application flow are the same for 26 mm columns and 50 mm columns, indicating that the wall effects decrease below a column diameter of 26 mm.
Figure 8: Graphic diagram of the collapse points, the uncoloured dots does not respond to actual collapse points, due to limitations in instrumental set-up.
22

3.3 Packing The columns were packed to get a bed height at approximately 10 cm, the actual height of every column is given in table 7. Two columns were packed for each combination of column and media for duplication. Note that only Q Sepharose FF and Capto Q were packed.
Table 7: Bed heights in centimeters for the different media and columns.
Media Q Sepharose FF Capto Q Number 1 2 1 2 Tricorn 5 10.6 10.8 10.2 10.9 Tricorn 10 10.5 10.6 9.9 10.8 HiScale 16 8.9 9.2 10.2 10.0 HiScale 26 11.3 10.0 10.0 9.9 HiScale 50 8.9 9.3 10.0 10.1
Figure 11: Pressure at approximately 50% and 80% of linear maximum flow of the 50 mm column for Capto Q.
Figure 10: Pressure at approximately 50% and 80% of linear maximum flow of the 50 mm column for MabSelect.
Figure 9: Pressure at approximately 50% and 80% of linear maximum flow of the 50 mm column for Q Sepharose FF.
23
0
0,1
0,2
0,3
0 50 100
Pres
sure
[Mpa
]
Column diameter [mm]
Pressure - MabSelect
1250 cm/h
800 cm/h

3.4 Efficiency According to the asymmetry the first round of the efficiency test showed that the two smallest columns, 5 mm and 10 mm in diameter tend to be denser packed because of the lower asymmetry number. One can also see, according to table 8, that the N/m as well as the back pressure increases with the increasing column diameter. Because of the flow properties the back pressure is lower for Capto Q when the same flow is used. Because of issues with the pressure for Capto Q column 50.1 this result might be unreliable.
Table 8: Asymmetry, N/m and back pressure for the first efficiency test for all the columns.
Q S
epha
rose
FF
Tricorn 5 Tricorn 10 HiScale 16 HiScale 26 HiScale 50
1 2 1 2 1 2 1 2 1 2 Asymmetry 0.66 1.13 0.68 0.89 0.91 1.12 0.91 0.98 1.09 1.00 N/m 1407 1341 2416 2117 1851 2275 3294 3392 3459 3229 Back pressure [MPa]
0.25 N.D. 0.37 0.36 0.53 0.39 1.13 1.08 0.97 1.01
Cap
to Q
Asymmetry 0.81 0.88 0.60 0.84 1.08 0.84 0.94 0.90 0.96 1.02 N/m 1069 1095 1673 1933 1808 2027 2900 2831 2449 2760 Back pressure [MPa]
0.27 0.26 0.36 0.36 0.51 0.51 0.58 0.65 N.D. 0.71
A second efficiency test was run after the stability test to investigate the stability of the columns, the result is shown in table 9. To evaluate the stability it has to be compared with the first round of the Efficiency test, which is done for the back pressure in figure 12 for Q Sepharose FF and figure 13 for Capto Q. The figures shows that the back pressure has decreased for Capto Q, this effect seems to be gone for the 50 mm column. Regarding the N/m there are no differences between the first and the second run, figure 14, but the spread is larger for the 50 mm column comparing to the others. One can also see that the difference between the 26 mm and the 50 mm column is very small comparing to the other columns. This test could not be performed on the Capto Q HiScale 16 columns because of elution problems during the breakthrough capacity method.
24
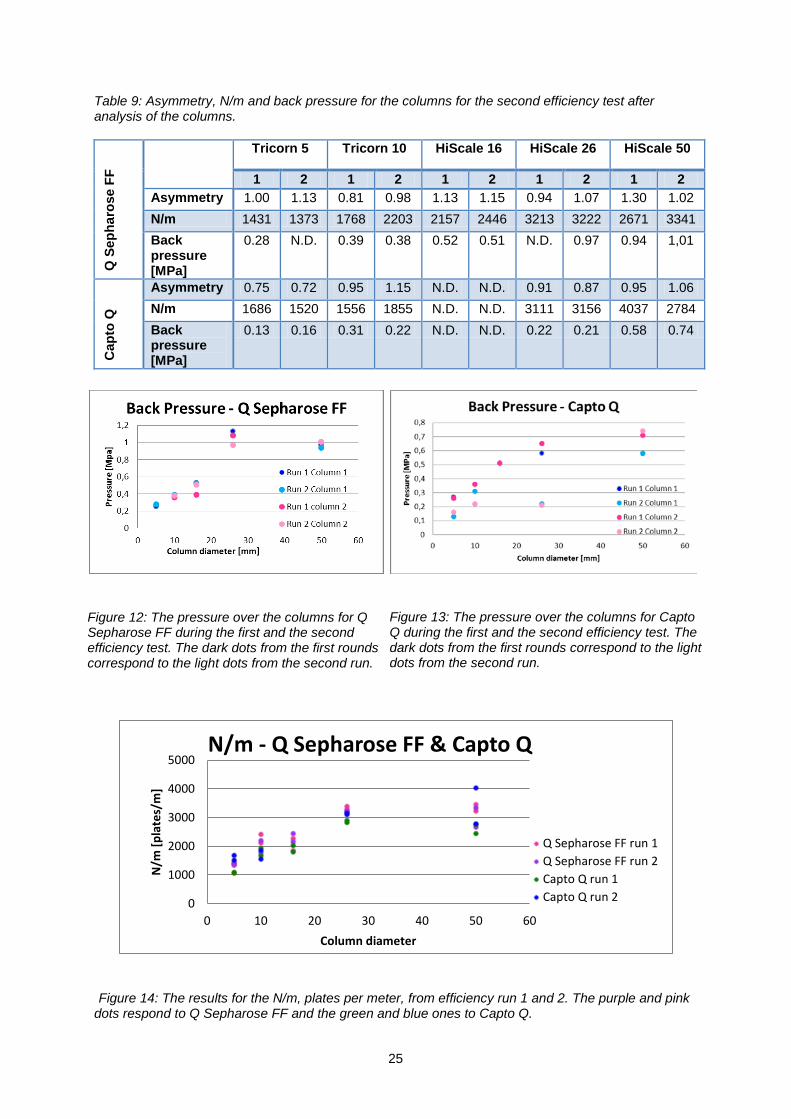
Table 9: Asymmetry, N/m and back pressure for the columns for the second efficiency test after analysis of the columns.
Q S
epha
rose
FF
Tricorn 5 Tricorn 10 HiScale 16 HiScale 26 HiScale 50
1 2 1 2 1 2 1 2 1 2 Asymmetry 1.00 1.13 0.81 0.98 1.13 1.15 0.94 1.07 1.30 1.02 N/m 1431 1373 1768 2203 2157 2446 3213 3222 2671 3341 Back pressure [MPa]
0.28 N.D. 0.39 0.38 0.52 0.51 N.D. 0.97 0.94 1,01
Cap
to Q
Asymmetry 0.75 0.72 0.95 1.15 N.D. N.D. 0.91 0.87 0.95 1.06 N/m 1686 1520 1556 1855 N.D. N.D. 3111 3156 4037 2784 Back pressure [MPa]
0.13 0.16 0.31 0.22 N.D. N.D. 0.22 0.21 0.58 0.74
Figure 14: The results for the N/m, plates per meter, from efficiency run 1 and 2. The purple and pink dots respond to Q Sepharose FF and the green and blue ones to Capto Q.
Figure 13: The pressure over the columns for Capto Q during the first and the second efficiency test. The dark dots from the first rounds correspond to the light dots from the second run.
Figure 12: The pressure over the columns for Q Sepharose FF during the first and the second efficiency test. The dark dots from the first rounds correspond to the light dots from the second run.
25
0
1000
2000
3000
4000
5000
0 10 20 30 40 50 60
N/m
[pla
tes/
m]
Column diameter
N/m - Q Sepharose FF & Capto Q
Q Sepharose FF run 1Q Sepharose FF run 2Capto Q run 1Capto Q run 2

3.5 Function The function test of the columns shows that all the proteins were well separated on all the columns for the first round, table 10. There is a slight difference between the smaller and the larger columns where the larger ones, 26 mm and 50 mm in diameter separate the proteins a bit better. This trend is best shown for Q Sepharose FF as can be seen in figure 15. Capto Q, figure 16, has a lower resolution between peak 1 and 2 comparing to Q Sepharose FF which separates the three peaks more even.
Even the second run of the function method is a validation of the stability of the columns, in table 11 the result from this method is shown. When comparing at what conductivity the peaks was eluted there is no difference for any size of column for both Q Sepharose FF, figure 17, and Capto Q, figure 18. This test could not be performed on the Capto Q HiScale 16 columns because of elution problems during the breakthrough capacity method.
Table 10 Resolution and conductivity for the three peaks from the first function test.
Tricorn 5 Tricorn 10 HiScale 16 HiScale 26 HiScale 50 1 2 1 2 1 2 1 2 1 2
Q S
epha
rose
FF
Conductivity peak 1
10.11 10.09 10.02 9.98 9.75 9.63 9.18 9.16 9.49 9.54
Conductivity peak 2
17.21 17.14 17.38 17.21 16.98 16.91 16.14 16.58 16.77 16.94
Conductivity peak 3
24.33 24.25 24.44 24.27 23.95 23.99 23.39 23.34 23.76 23.82
Resolution peak 1-2
1.67 1.76 1.96 1.99 2.24 2.26 2.94 2.26 2.42 2.39
Resolution peak 2-3
2.03 2.19 2.31 2.38 2.38 2.39 2.80 2.66 2.47 2.67
Cap
to Q
Conductivity peak 1
9.20 9.94 11.98 9.97 9.46 9.12 9.27 9.25 9.19 9.19
Conductivity peak 2
18.93 19.31 22.58 20.74 19.36 19.01 18.86 18.82 18.69 18.61
Conductivity peak 3
26.98 26.60 25.28 25.63 27.40 26.98 26.59 26.62 26.43 23.37
Resolution peak 1-2
1.52 1.69 1.17 1.50 1.65 1.67 1.78 2.36 1.73 1.90
Resolution peak 2-3
1.90 1.98 2.03 2.58 2.43 2.51 2.60 2.58 2.68 2.66
26

Table 11: Resolution and conductivity for the second function test.
Figure 15: The resolution between peak 1-2 and 2-3 for Q Sepharose FF during the first round of efficiency test.
Figure 16: The resolution between peak 1-2 and 2-3 for Capto Q during the first round of efficiency test.
Tricorn 5 Tricorn 10 HiScale 16 HiScale 26 HiScale 50 1 2 1 2 1 2 1 2 1 2
Q S
epha
rose
FF
Conductivity peak 1
9.68 9.80 10.86 9.68 10.17 9.92 9.01 9.01 7.76 8.71
Conductivity peak 2
16.75 17.23 16.43 17.03 19.37 17.50 17.39 16.57 16.44 16.89
Conductivity peak 3
24.10 24.27 22.26 24.21 22.85 23.55 24.33 23.78 23.36 23.77
Resolution peak 1-2
1.80 2.10 1.28 2.27 1.36 2.35 1.67 2.60 2.39 1.81
Resolution peak 2-3
2.02 2.11 1.45 2.24 2.20 2.18 2.19 2.43 2.57 2.50
Cap
to Q
Conductivity peak 1
20.14 19.92 18.09 19.68 N.D. N.D. 9.48 9.54 8.47 10.76
Conductivity peak 2
35.63 40.06 36.92 37.79 N.D. N.D. 19.23 19.23 18.51 19.34
Conductivity peak 3
56.28 56.81 53.33 54.63 N.D. N.D. 26.84 26.83 26.71 25.96
Resolution peak 1-2
1.35 1.81 2.14 1.98 N.D. N.D 2.31 2.93 4.62 2.02
Resolution peak 2-3
1.79 2.18 2.36 2.49 N.D. N.D. 2.64 2.62 2.51 3.42
27

3.6 Breakthrough capacity The breakthrough capacity, which was evaluated with BSA is shown in table 12, Qb,85% refer to how much protein in mg/ml gel that is bound to the column when 85% of the maximum mAU signal is reached, the same is equivalent for Qb,10%. One of the HiScale 16 columns with Capto Q was clogged during the capacity test leading to no result from here and further on, even the HiScale 16.2 had problems with the elution of the protein and could not be used further on. Comparing figure 19 and 20 it can be seen, as expected, that the dynamic binding capacity is much higher for Capto Q than for Q Sepharose FF. Figure 19 shows that the difference between Qb,10% and Qb,85% is larger for the two smallest columns than for the other ones when using Q Sepharose FF. For Q Sepharose FF there is no obvious difference in Qb,85% for small and large columns but for Capto Q a slight difference can be seen between the Tricorn columns and the HiScale columns.
Table 12: Breakthrough capacity for Q Sepharose FF and Capto Q.
Figure 17: The conductivity at the highest point of the three peaks during function test for the first and the second run, Q Sepharose FF.
Figure 18: The conductivity at the highest point of the three peaks during function test for the first and the second run, Capto Q.
Q S
epha
rose
FF
Column Qb,10% [mg/ml gel]
Qb,85%
[mg/ml gel] Tricorn 5 57.13 74.25
Tricorn 10 60.11 78.54 HiScale 16 65.41 72.94 HiScale 26 70.86 77.67 HiScale 50 66.20 75.35
Cap
to Q
Tricorn 5 131.67 154.63 Tricorn 10 129.91 145.75
HiScale 16 157.68 183.46 HiScale 26 165.15 187.82 HiScale 50 159.71 166.95
28

Figure 19: Breakthrough capacity for Q Sepharose FF, Qb,10% and Qb,85% evaluated in mg/ml gel.
Figure 20: Breakthrough capacity for Capto Q, Qb,10% and Qb,85% evaluated in mg/ml gel.
3.7 CIP For the Q Sepharose FF packed column yellow lines from the breakthrough capacity test could be seen even after the CIP. These lines might exist of Bilirubin which is a by-product often seen from albumin. This indicates that the gel was not cleaned and the aim with the CIP was not reached. The CIP method could not be applied on the columns packed with Capto Q because of the clogged build up from the breakthrough capacity test.
4. Discussion / comments
4.1 Flow properties The flow properties reveal that the wall effect gets smaller with an increasing diameter of the column, which could be seen as lower collapse points for larger columns. This effect seems to be disappearing at the 26 mm column which has similar flow properties as the 50 mm column, this seems to be true for all media. The rigidity of the media also contributes to differences because of the wall effect. For example Capto Q shows a larger difference between the 5 mm and 10 mm column than Q Sepharose FF. The result of this study regarding physical properties indicates that characterization of media can be done in a 26 mm column, without any large difference to a larger column regarding the flow properties.
4.1.1 Collapse Point When comparing the collapse point for Q Sepharose FF in Tricorn 5, Tricorn 10, HiScale 16 and HiScale 26 to the HiScale 50 column the factors shown in table 13 appear. This factor seems to head towards 1 when the column diameter increases. Because no collapse point was determined for the HiScale 50 mm column for MabSelect or Capto Q the same factor cannot be calculated.
29

Table 13: Comparison factor when the collapse point for Q Sepharose FF in the smaller columns was compared to the collapse point of the HiScale 50 mm column.
Column diameter [mm]
factor
5 3.04
10 1.74
16 1.57
26 1.08
4.1.2 Application flow When comparing the pressure for the different columns at the same linear flow comparing to the collapse point for the 50 mm HiScale column during pressure/flow method, as in figure 9-11, a higher pressure at the 10 mm column comparing to the 16 mm column indicates that it is not only the gel bed that counts but also the construction of the columns. Because of different flow properties of the media different flow rates are used for the different media. The HiScale columns are equipped with other filters, which are designed for higher flow velocities. This indicates that not only the inner diameter of the column should be considered when choosing column but also the construction of the column. When comparing the relative pressure at these velocities large varieties can be seen, table 14.
Table 14: Comparison of the pressure with the HiScale 50 mm column at given flow velocities, data shown in figure 9-11.
Media
Flow
Q Sepharose FF MabSelect Capto Q
1125 cm/h
700 cm/h
1250 cm/h
800 cm/h 1300 cm/h
1000 cm/h
Tricorn 5 0.70 1.00 0.50 0.75 0.33 0.38
Tricorn 10 0.80 1.33 0.86 1.25 0.56 0.54
HiScale 16 0.95 1.33 N.D. 0.63 0.56 0.62
HiScale 26 1.00 1.11 1.00 1.13 1.06 1.00
When comparing the difference it is shown that the uncertainty between the columns decreases when the column diameter increases. The pressure deviates with ~30% for the Tricorn 10 and HiScale 26 columns but only with ~10% for the HiScale 26 column, compared with the HiScale 26 columns under the same conditions, table 14.
The support of the wall effect seems to have a larger impact on the columns up to 16 mm where a larger back pressure can be seen. The difference in back pressure between the 26 and 50 mm column is not as big as between the smaller ones. The same is true for both Q Sepharose FF and Capto Q, in general the back pressure is lower for Capto Q which can be explained by the higher rigidity of Capto Q. Regarding Capto Q the pressure decreases for the columns below 50 mm in diameter which is shown in figure 12 and 13 when comparing back pressure during efficiency test before and after analysis of the column.
30

When comparing the back pressure for the first and the second efficiency test it is shown that the larger columns are more stable in pressure in long term use for Capto Q, table 14. The difference between before and after evaluation for Q Sepharose FF is within a border of normal deviation between different experiments.
Table 15: Comparison of back pressure against the HiScale 50 mm column during efficiency test before and after evaluation of the columns. No result achieved for Capto Q HiScale 16 for the second efficiency test.
Q Sepharose FF Capto Q
Before After Before After
Tricorn 5 0.22 0.25 0.36 0.21
Tricorn 10 0.32 0.34 0.50 0.39
HiScale 16 0.55 0.53 0.72 N.D.
HiScale 26 0.96 0.91 0.88 0.33
4.2 Other comments Because of a low asymmetry number during the first efficiency test the Tricorn columns seem to be more densely packed comparing to the HiScale columns. During use the asymmetry number increases for these columns indicating that a more homogenous bed has been developed. The N/m increases after analysis for these columns which strengthen the hypothesis that the bed is better packed after use. The N/m follows the same trend as the flow properties, where the N/m increases linear up to 26 mm where the curve flattens out. The function test shows that the proteins are eluted at the same conductivity for the different columns, as expected, but the tests also show that the resolution is higher for the 26 mm and 50 mm column comparing to the smaller ones.
The capacity seems to be independent of the diameter of the column, however the difference between Qb,10% and Qb,85% is bigger for the smaller columns for Q Sepharose FF.
5. Conclusions
The conclusion is that the wall effect declines at a column diameter below 26 mm. Meaning that for columns with a diameter of 26 mm or larger the characterization of media should give comparable result. If the given condition is a flow velocity low enough for the pressure not to increase because of the column construction.
If performing characterization of Q Sepharose FF in Tricorn 10 or HiScale 16 columns the collapse point will differ with a factor 1.75 ± 10% for Tricorn 10 and 1.60 ± 10% for HiScale 16. For flow velocities accommodated for applications the pressure will differ with decrease with up to 30% compared to the same method preformed in a HiScale 50 column for Q Sepharose FF. When comparing the pressure for Capto Q a 50% lower pressure can be seen when using Tricorn 10 or HiScale 16 instead of HiScale 50. The pressure after long term use will be much
31

lower for all columns below 50 mm in diameter packed with Capto Q. It is of importance to remember that the wall effect has a higher impact on more rigid media.
Another thing to consider before performing test using Tricorn columns at high flow velocities is the extra pressure given by the filter of the column.
6. Proposed action plan
For further investigations the same study can be performed in larger columns, perhaps starting with a diameter of 26 mm and increase the diameter from there. Hopefully the results would be that there are no differences regarding flow properties, back pressure and function of the media between the different scales at that level. To be able to determine these properties the hardware set up must be created for high pressures. It would also be interesting to evaluate these tests on media based on the same base matrice but with different ligands to see if the ligands of the media have any impact on the flow properties.
To enhance the results for this study the same study can be done but with a complementary test of breakthrough capacity after the stability test. This would better show the behavior of the whole bed instead of only a fraction which is shown with the function method. But for this to be tested the CIP protocol has to be optimized for all set ups for an accurate result.
7. A special thanks to…First of all I would like to thank my fantastic supervisors Rodolfo Kurt-Fuentes and Fredrik Kullbo at GE Healthcare for having me and always supporting me during these months. I would also thank Therese Graner for the corrector reading and cheering up at the lab. To all other co-workers at GE Healthcare who have helped me and made my exam work a great time for me, THANKS!
From the school I would like to thank Gunnar Johansson and Lars Göran Josefsson for the help and for being at my presentation at GE Healthcare which meant a lot for me.
At last, thanks to my opponents Emma Ekström and Nils Wallmenius for the help and support.
32

8. References
1. Comparative study of strong anion exchangers: Structure-relatedchromatographic performances, Pezzini, Cabanne and Santarelli, Journal ofChromatography B, page 2443-2450, nr 877, 2009
2. Ion Exchange Chromatography Priciples and Methods, Amersham PharmaciaBiotech AB, Edition AB, IBSN 91 970490-3-4, 1999
3. Capto Q Capto ViralQ Capto S, data File 11-0025-76 AD, Ion exchangechromatography, GE Healthcare
4. Personal communication, Rodolfo Kurt-Fuentes, GE Healthcare, Autumn2012
5. Instruction video for packing of HiScale columns, GE Healthcare, 2010http://www.gelifesciences.com/aptrix/upp01077.nsf/content/protein_purification~empty_columns~hiscale#
6. Column efficiency testing, Application Note 28-9372-07 AA, Chromatographycolumns, GE Healthcare
7. The value of efficient cleaning, page 7-9, Downstream 28, Pharmacia BiotechAB, 1998
8. Use of sodium hydroxide for cleaning and santizing chromatography mediaand systems, Application Note 18-1124-57 AF, Process chromatography, GEHealthcare
9. NaOH unchallenged for cleaning and sanitizing, page 17, Downstream 25,Pharmacia Biotech AB, 1997
10. High-throughput process development for design of cleaning-in-placeprotocols, Application note 28-9845-64 AA, Process chromatography, GE Healthcare
33

9. AttachmentsUNICORN methods These are the codes created for the methods used in the study. The codes are used to navigate the ÄKTA systems. For each method the same code was used for the three different systems. All methods will be shown for the largest column, HiScale 50, with a gel bed at approximately 196 ml, with a linear scale down for the other columns.
9.1 Efficiency Method: v:\UNICORN\Local\Fil\Sommarjobb 2011\Method\Efficiency.m01
Main method: ¤ (Main) 0.00 Base CV (196)#Column {ml} Any ¤ 0.00 Block Flow_Rate (Flow_Rate) 0.00 Base SameAsMain 0.00 Flow (52.5)#Flow_Rate {ml/min} 0.00 End_block ¤ 0.00 Block Column_Pressure_Limit (Column_Pressure_Limit) 0.00 Base SameAsMain 0.00 Alarm_Pressure Enabled (2.00)#Column_PressureLimit {MPa} 0.00 {MPa} 0.00 End_Block ¤ 0.00 Block Start_Instructions (Start_Instructions) 0.00 Base SameAsMain 0.00 Wavelength (280)#Wavelength_1 {nm} (OFF)#Wavelength_2 {nm} (OFF)#Wavelength_3 {nm} 0.00 AveragingTimeUV (2.56)#Averaging_Time_UV {sec} 0.00 End_block ¤ 0.00 Block BufferValve_A1_Inlet (BufferValve_A1_Inlet) 0.00 Base SameAsMain 0.00 BufferValveA1 (A11)#BufferValve_A1_Inlet 0.00 End_Block ¤ 0.00 Block Eluent_A_Inlet (Eluent_A_Inlet) 0.00 Base SameAsMain 0.00 PumpAInlet (A1)#Pump_A_Inlet 0.00 End_block ¤ 0.00 Block Column_Valve (Column_Valve) 0.00 Base SameAsMain 0.00 ColumnPosition (Position2)#Column_Position 0.00 End_Block ¤ 0.00 Block Column_Equilibration (Column_Equilibration)
34
0.00 Base SameAsMain (5)#Equilibrate_with End_Block (cv) ¤ 0.00 Block AutoZero_UV (AutoZero_UV) 0.00 Base SameAsMain 0.00 Watch_Off UV1 0.00 AutoZeroUV 0.00 End_Block ¤ 0.00 Block Aut_PressureFlow_Regulation (Aut_PressureFlow_Regulation) 0.00 Base Time 0.00 SystemPumpControlMode (Normal)#System_Pump (0)#System_PressLevel {MPa} (0)#System_MinFlow {ml/min} 0.00 End_Block ¤ 0.00 Block Sample_Injection_ (Sample_Injection_) 0.00 Base SameAsMain 0.00 InjectionValve Inject ¤ 0.00 Block Sample_Injection (Sample_Injection) 0.00 Base Volume (1.96)#Empty_loop_with End_Block (ml) 0.00 InjectionValve Load 0.00 End_block ¤ 0.00 Block Aut_PressureFlow_Reset (Aut_PressureFlow_Reset) 0.00 Base Time 0.00 SystemPumpControlMode Normal 0.00 {MPa} 0.10 {ml/min} 0.00 End_Block ¤ 0.00 Block Flow_Rate (Flow_Rate) 0.00 Base SameAsMain 0.00 Flow (52.5)#Flow_Rate {ml/min} 0.00 End_block ¤ 0.00 Block Isocratic_Elution (Isocratic_Elution) 0.00 Base SameAsMain ¤ 0.00 Block Length_of_Elution (Length_of_Elution) 0.00 Base SameAsMain (2)#Length_of_Elution End_Block (cv) 0.00 End_Block
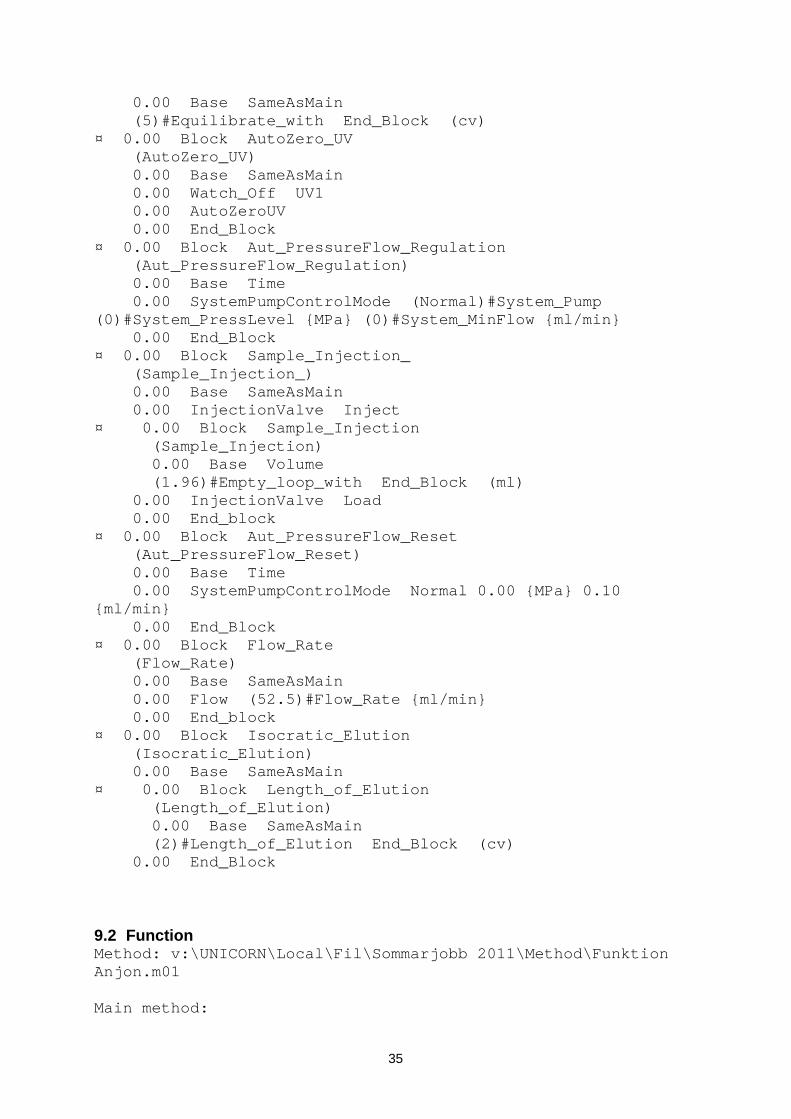
9.2 Function Method: v:\UNICORN\Local\Fil\Sommarjobb 2011\Method\Funktion Anjon.m01
Main method:
35

¤ (Main) 0.00 Base CV (196)#Column {ml} Any ¤ 0.00 Block Flow_Rate (Flow_Rate) 0.00 Base SameAsMain 0.00 Flow (50)#Flow_Rate {ml/min} 0.00 End_block ¤ 0.00 Block Column_Pressure_Limit (Column_Pressure_Limit) 0.00 Base SameAsMain 0.00 Alarm_Pressure Enabled (2)#Column_PressureLimit {MPa} 0.00 {MPa} 0.00 End_Block ¤ 0.00 Block Start_Instructions (Start_Instructions) 0.00 Base SameAsMain 0.00 Wavelength (280)#Wavelength_1 {nm} (254)#Wavelength_2 {nm} (OFF)#Wavelength_3 {nm} 0.00 AveragingTimeUV (2.56)#Averaging_Time_UV {sec} 0.00 End_block ¤ 0.00 Block BufferValve_A1_Inlet (BufferValve_A1_Inlet) 0.00 Base SameAsMain 0.00 BufferValveA1 (A11)#BufferValve_A1_Inlet 0.00 End_Block ¤ 0.00 Block Eluent_A_Inlet (Eluent_A_Inlet) 0.00 Base SameAsMain 0.00 PumpAInlet (A1)#Pump_A_Inlet 0.00 End_block ¤ 0.00 Block Eluent_B_Inlet (Eluent_B_Inlet) 0.00 Base SameAsMain 0.00 PumpBInlet (B1)#Pump_B_Inlet 0.00 End_block ¤ 0.00 Block Start_Conc_B (Start_Conc_B) 0.00 Base SameAsMain 0.00 Gradient (0)#Start_ConcB {%B} 0.00 {base} 0.00 End_block ¤ 0.00 Block Column_Valve (Column_Valve) 0.00 Base SameAsMain 0.00 ColumnPosition (Position2)#Column_Position 0.00 End_Block ¤ 0.00 Block System_Volume_Compensation (System_Volume_Compensation) 0.00 Base Volume (8)#Compensation_Volume End_Block (ml) ¤ 0.00 Block Column_Equilibration (Column_Equilibration)
36

0.00 Base SameAsMain (5)#Equilibrate_with End_Block (cv) ¤ 0.00 Block AutoZero_UV (AutoZero_UV) 0.00 Base SameAsMain 0.00 Watch_Off UV1 0.00 AutoZeroUV 0.00 End_Block ¤ 0.00 Block Aut_PressureFlow_Regulation (Aut_PressureFlow_Regulation) 0.00 Base Time 0.00 SystemPumpControlMode (Normal)#System_Pump (0)#System_PressLevel {MPa} (0)#System_MinFlow {ml/min} 0.00 End_Block ¤ 0.00 Block Sample_Injection_ (Sample_Injection_) 0.00 Base SameAsMain 0.00 InjectionValve Inject ¤ 0.00 Block Sample_Injection (Sample_Injection) 0.00 Base Volume (23.55)#Empty_loop_with End_Block (ml) 0.00 InjectionValve Load 0.00 End_block ¤ 0.00 Block Aut_PressureFlow_Reset (Aut_PressureFlow_Reset) 0.00 Base Time 0.00 SystemPumpControlMode Normal 0.00 {MPa} 0.10 {ml/min} ¤ 0.00 Block Delay0p02min (Delay0p02min) 0.00 Base Time 0.02 End_Block 0.00 End_Block ¤ 0.00 Block Flow_Rate (Flow_Rate) 0.00 Base SameAsMain 0.00 Flow (50)#Flow_Rate {ml/min} 0.00 End_block ¤ 0.00 Block Linear_Gradient (Linear_Gradient) 0.00 Base SameAsMain 0.00 Gradient (100)#Target_ConcB {%B} (20.00)#Length_of_Gradient {base} 20.00 End_Block (cv) ¤ 0.00 Block Gradient_Delay (Gradient_Delay) 0.00 Base Volume (8)#Gradient_Delay End_Block (ml) ¤ 0.00 Block Clean_after_Elution
(Clean_after_Elution)
37

0.00 Base SameAsMain 0.00 Gradient 100 {%B} 0.00 {base} (2)#Clean_with End_Block (cv) ¤ 0.00 Block BufferValve_A1_Inlet (BufferValve_A1_Inlet) 0.00 Base SameAsMain 0.00 BufferValveA1 (A11)#BufferValve_A1_Inlet 0.00 End_Block ¤ 0.00 Block Eluent_A_Inlet (Eluent_A_Inlet) 0.00 Base SameAsMain 0.00 PumpAInlet (A1)#Pump_A_Inlet 0.00 End_block ¤ 0.00 Block Eluent_B_Inlet (Eluent_B_Inlet) 0.00 Base SameAsMain 0.00 PumpBInlet (B1)#Pump_B_Inlet 0.00 End_block ¤ 0.00 Block Start_Conc_B (Start_Conc_B) 0.00 Base SameAsMain 0.00 Gradient (0)#Start_ConcB {%B} 0.00 {base} 0.00 End_block ¤ 0.00 Block Length_of_Reequilibration (Length_of_Reequilibration) 0.00 Base SameAsMain ¤ 0.00 Block System_Volume_Compensation (System_Volume_Compensation) 0.00 Base Volume (8)#Compensation_Volume End_Block (ml) (2)#Reequilibrate_with End_Block (cv)
9.3 Breakthrough capacity Method: v:\UNICORN\Local\Fil\Sommarjobb 2011\Method\Kapacitet anjon.m01
Main method: ¤ (Main) 0.00 Base CV (196)#CV {ml} Any 0.00 BufferValveA1 A11 0.00 ColumnPosition (Position2)#ColumnPosition 0.00 Alarm_Pressure Enabled 2 {MPa} 0.00 {MPa} 0.00 Wavelength 280 {nm} 295 {nm} 310 {nm} 0.00 OutletValve WasteF1 0.00 Flow (50)#Flow {ml/min} ¤ 0.00 Block CIP (CIP) 0.00 Base SameAsMain 0.00 Gradient 100 {%B} 0.00 {base} 0.00 PumpBInlet B2
38

0.00 Flow 10 {ml/min} 1.00 End_Block (cv) ¤ 0.00 Block Equilibration (Equilibration) 0.00 Base SameAsMain 0.00 Gradient 0.0 {%B} 0.00 {base} 0.00 BufferValveA1 A11 0.00 Flow 50 {ml/min} 5.00 AutoZeroUV (cv) 5.00 End_Block (cv) ¤ 0.00 Block Loading (Loading) 0.00 Base SameAsMain 0.00 InjectionMark 0.00 PumpWashExplorer (A13)#injectionInlet OFF OFF OFF 0.00 PumpAInlet A1 0.00 BufferValveA1 A13 0.00 Gradient 0.0 {%B} 0.00 {base} 0.00 Watch_UV1 Greater_Than (850)#85procent {mAU} END_BLOCK 65 End_Block (cv) ¤ 0.00 Block wash (wash) 0.00 Base SameAsMain 0.00 Watch_Off UV1 0.00 PumpWashExplorer A11 OFF OFF OFF 4 End_Block (cv) ¤ 0.00 Block Elution (Elution) 0.00 Base SameAsMain 0.00 PumpWashExplorer OFF OFF ON OFF 0.00 Gradient 100 {%B} 0.00 {base} 0.00 PumpBInlet B1 4 End_Block (cv) ¤ 0.00 Block CIP (CIP) 0.00 Base SameAsMain 0.00 Gradient 100 {%B} 0.00 {base} 0.00 PumpBInlet B2 0.00 Flow 10 {ml/min} 1.00 End_Block (cv) ¤ 0.00 Block ReEquilibration (ReEquilibration) 0.00 Base SameAsMain 0.00 Gradient 0.0 {%B} 0.00 {base} 0.00 PumpAInlet A1 3 End_Block (cv) 0.00 End_Method
39

9.4 CIP Method: v:\UNICORN\Local\Fil\Sommarjobb 2011\Method\CIP50HiScale.m01 Main method: ¤ (Main) 0.00 Base CV 196 {ml} Any 0.00 ColumnPosition (Position2)#pos 0.00 OutletValve WasteF1 0.00 Alarm_Pressure Enabled 2 {MPa} 0.00 {MPa} ¤ 0.00 Block CIP (CIP) 0.00 Base SameAsMain 0.00 Flow 10 {ml/min} 0.00 Gradient 100 {%B} 0.00 {base} 0.00 PumpBInlet B2 4.00 End_Block (cv) ¤ 0.00 Block Equlibrering (Equlibrering) 0.00 Base SameAsMain 0.00 Gradient 0.0 {%B} 0.00 {base} 0.00 BufferValveA1 A11 0.00 Flow 10 {ml/min} 5.00 End_Block (cv)
9.5 Physical stability Method: v:\UNICORN\Local\Fil\Sommarjobb 2011\Method\Stabilitet Anjon.m01 Main method: ¤ (Main) 0.00 Base CV 196 {ml} Any 0.00 Flow 160 {ml/min} 0.00 ColumnPosition Position2 0.00 OutletValve WasteF1 0.00 BufferValveA1 A11 0.00 Alarm_Pressure Enabled 2 {MPa} 0.00 {MPa} ¤ 0.00 Block Glycerol (Glycerol) 0.00 Base SameAsMain 120 End_Block (cv) ¤ 0.00 Block Equilibration (Equilibration) 0.00 Base SameAsMain 0.00 PumpBInlet B1 0.00 Gradient 100 {%B} 0.00 {base} 5 End_Block (cv)
40