physical and functional properties of whole milk powders ...380520/uq380520_oa.pdf · pii:...
TRANSCRIPT
Accepted Manuscript
Physical and functional properties of whole milk powders prepared from concentratepartially acidified with CO2 at two temperatures
Leni Kosasih, Bhesh Bhandari, Sangeeta Prakash, Nidhi Bhansal, Claire Gaiani
PII: S0958-6946(15)00231-9
DOI: 10.1016/j.idairyj.2015.12.009
Reference: INDA 3914
To appear in: International Dairy Journal
Received Date: 4 October 2015
Revised Date: 19 December 2015
Accepted Date: 19 December 2015
Please cite this article as: Kosasih, L., Bhandari, B., Prakash, S., Bhansal, N., Gaiani, C., Physical andfunctional properties of whole milk powders prepared from concentrate partially acidified with CO2 at twotemperatures, International Dairy Journal (2016), doi: 10.1016/j.idairyj.2015.12.009.
This is a PDF file of an unedited manuscript that has been accepted for publication. As a service toour customers we are providing this early version of the manuscript. The manuscript will undergocopyediting, typesetting, and review of the resulting proof before it is published in its final form. Pleasenote that during the production process errors may be discovered which could affect the content, and alllegal disclaimers that apply to the journal pertain.
MANUSCRIP
T
ACCEPTED
ACCEPTED MANUSCRIPT
Physical and functional properties of whole milk powders prepared from concentrate 1
partially acidified with CO2 at two temperatures 2
3
4
5
6
7
Leni Kosasiha, Bhesh Bhandaria, Sangeeta Prakasha, Nidhi Bhansala & Claire Gaiania,b* 8
9
10
11
12
13
a University of Queensland, School of Agricultural and Food Science, St. Lucia, Queensland 4072, 14
Australia 15
b Université de Lorraine, LIBio, 2 avenue de la Forêt de Haye, TSA 40602, 54518 Vandoeuvre-lès-Nancy, 16
France 17
18
19
20
21
* Corresponding author. Tel.: +33(0)3 83 59 60 73 22
E-mail address: [email protected] (C. Gaiani) 23
24
25

MANUSCRIP
T
ACCEPTED
ACCEPTED MANUSCRIPT
__________________________________________________________________________________________________________________26
ABSTRACT 27
28
Effects of carbonation of whole milk concentrate on spray dried powder properties were 29
investigated. Concentrate acidification by CO2 addition (2000 ppm) was found to strongly modify 30
the functional properties (solubility, dispersibility) and structural/physical properties (porosity, 31
free fat) of the resulting powders. For concentrates treated at low temperature (where the majority 32
of emulsified fat is in a solid state at 4 °C), colloidal calcium phosphate (CCP) release, casein 33
dissociation and fat coalescence were observed. For warm CO2 treated concentrates (30 °C) only 34
CCP release was observed. The best functional properties (higher solubility and dispersibility) were 35
found for powders produced from the warm treated concentrates, which were possibly due to the 36
high porosity and better fat globule preservation. 37
___________________________________________________________________________________________________________________ 38
39

MANUSCRIP
T
ACCEPTED
ACCEPTED MANUSCRIPT
1. Introduction 40
41
In the last decade, CO2 application in milk has been extensively studied mainly to improve 42
the shelf-life, quality and yield of diverse dairy products, such as raw and pasteurised milk, cheeses, 43
yogurt, and fermented dairy beverages (Hotchkiss, Werner, & Lee, 2006). For example, CO2 injection 44
in milk before rennet coagulation can be used to reduce the pH of milk and solubilise micellar 45
calcium phosphate, which resulted in cheese containing a different mineral profile (Nelson, Lynch, & 46
Barbano, 2004). 47
Recently, the use of CO2 on protein concentrates to improve the functional properties of milk 48
protein concentrate (MPC) powders was studied (Marella, Salunke, Biswas, Kommineni, & Metzger, 49
2015). It was reported that modification in concentrate mineral environment (Marella et al., 2015) 50
or micelle structure (Law & Leaver, 1998) by adding CO2 may improve the rehydration properties of 51
MPC powders. The improved solubility was attributed to the decrease in micellar interaction and 52
increase in non-micellar casein release caused by partial acidification (Schokker et al., 2011). The 53
addition of glucono-delta-lactone to partially acidify milk concentrates may also reduce the amount 54
of protein–protein interactions during drying, which contribute to the loss of solubility of high-55
protein MPC powders (Eshpari, Tong, & Corredig, 2014). Nevertheless, the use of CO2 as a 56
replacement for glucono-delta-lactone, which acts as a milk acidulant (through the reaction product 57
gluconic acid) has gained interest because CO2 can be totally and easily removed by heating or 58
applying vacuum. 59
The current literature regarding the effect of CO2 in milk has been mainly focused on skim 60
milk and the resulting powders (Lee, 2014). Meanwhile, its effect on whole milk concentrates has 61
never been studied and the effect of CO2 on fat has been poorly reported. It is generally accepted 62
that CO2 has higher solubility in nonpolar solvents, such as lipids, than in polar solvents, such as 63
water, because the molecular structure of CO2 is apolar and it has a dipole moment of zero (Chaix, 64

MANUSCRIP
T
ACCEPTED
ACCEPTED MANUSCRIPT
Guillaume, & Guillard, 2014; Hotchkiss et al., 2006). Therefore, the overall objective of this research 65
was to carbonate whole milk concentrates to alter the partition of CO2 in milk components, and 66
analyse the effect of CO2 on the resulting powders, focusing on functional, physical and structural 67
properties. It was expected that solubilisation of colloidal calcium phosphate (CCP) due to CO2 68
acidification would affect the structural organisation of casein micelles and consequently alter the 69
rehydration and functional properties of the resulting whole milk powder (WMP). 70
71
2. Material and methods 72
73
2.1. Material 74
75
Whole milk (standard, not lecithinated) and skim milk (medium heat) powders for 76
preparing the concentrates were purchased in 25 kg bags from Total Foodtec Pty Ltd. (Brisbane, 77
Australia). The powders were a maximum of 1 month old for the experiments. Carbonation was 78
accomplished by the addition of known amount of solid CO2, also known as dry ice. 79
Phosphate buffered saline (×1) was prepared at a final pH of 7.4 with the following 80
composition: 1.42 g L-1 sodium phosphate, 8.0 g L-1 sodium chloride, 0.2 g L-1 potassium chloride 81
0.24 g L-1 potassium phosphate. 82
83
2.2. Concentrate, carbonation and powder preparation 84
85
Whole milk concentrates (WMC) were prepared by dissolving 25 g of the powder in 100 g of 86
Milli-Q (deionised) water at 25 °C with constant stirring at a high speed with an overhead stirrer for 87
1 h. For each experiment, 3 L of concentrates was prepared. Optical microscopy on the rehydrated 88

MANUSCRIP
T
ACCEPTED
ACCEPTED MANUSCRIPT
sample was done to check the complete rehydration of the powder. Finally, WMC was poured in the 89
kegs for carbonation. 90
Carbonation of the concentrate was done with frozen CO2 (dry ice). The 3 L concentrate was 91
poured into an eleven litre stainless steel keg equipped with manometer. An adequate amount of 92
dry ice was added in the keg allowing a theoretical CO2 content of 2000 ppm in the concentrate (Lee, 93
2014). The kegs were then left for 4 h at 4 or 30 °C respectively. After overnight storage, the 94
samples were spray-dried; a control samples without CO2 addition was stored overnight at 4 °C 95
prior to spray-drying. A single-stage Anhydro Lab S1 spray dryer (Copenhagen, Denmark) dried the 96
carbonated concentrates (without a decarbonation step). The spray dryer fitted with a pneumatic 97
nozzle, supplied compressed air (6.34 bar), and operated at 170 °C and 85 °C inlet and outlet air 98
temperatures, respectively. The spray dried samples were collected in zipped aluminium bags and 99
analysed soon after (all analysis were done in less than 3 days). 100
101
2.3. Chemical analysis 102
103
The CO2 content in the concentrate was determined using a Mettler Toledo CO2 Transmitter 104
5100e Electrochemical probe (InPro 5000 CO2 Sensor, Mettler-Toledo AG, Process Analytics, 105
Urdorf, Switzerland). The electrochemical probe was found to be the most accurate and easiest way 106
to measure CO2 among other tested methods (i.e., infra-red head space analyser, manometric assay) 107
(Chaix et al., 2014; Lee, 2014). The probe was inserted directly into the liquid and final reading was 108
taken when it reached equilibrium. Depending on the CO2 level in the test sample, the final reading 109
reached to equilibrium in 3–8 min. 110
An ionic calcium probe (LAQUAtwin, compact Ca2+ meter, B751, Horiba Scientific) directly 111
measured the calcium ion concentration in 0.3 mL carbonated concentrates. The probe was capable 112
of measuring ionic calcium concentration in the range 1–100 mM. A 0.25 mM resolution was possible 113

MANUSCRIP
T
ACCEPTED
ACCEPTED MANUSCRIPT
in the approximate range of calcium found in milk (range 2.5 to 25 mM). The instrument was 114
calibrated daily with 2.5 mM standards. 115
116
2.4. Structural properties 117
118
2.4.1. Scanning electron microscope 119
A field emission scanning electron microscope (SEM) type JEOL JSM-7100F with a hot 120
(Schottky) electron gun (JEOL Ltd., Tokyo, Japan) and a resolution around 1 nm at 30 kV was used 121
for magnifications higher than 10,000. For lower magnifications, a JEOL JSM-6460LA (JEOL Ltd.) 122
with a tungsten filament electron gun was preferred. Both instrumental analyses were conducted at 123
5 kV to obtain images. 124
Sample preparation was done following the reported method of Mimouni, Deeth, Whittaker, 125
Gidley, and Bhandari, 2010) with some modifications. A drop of milk concentrate was deposited 126
onto a silicon chip wafer (ProSciTech, Kirwan, Australia) coated with poly-L-lysine (Sigma Aldrich, 127
Castle Hill, Australia) which created electrostatic bonding between micelles and the substrate. A few 128
drops of poly-L-lysine solution (1 mg mL-1 in phosphate-buffered saline ×1, pH 7.4) were deposited 129
on the silicon wafer and allowed to air-dry overnight at room temperature in a dust-free 130
environment. One drop of concentrate was then deposited and left for 30 min before rinsing with 131
phosphate buffer (pH 7). A solution of 2.5 % glutaraldehyde in phosphate buffer was then applied 132
for 30 min to achieve chemical fixation of the protein material. After fixation, the samples were 133
washed in phosphate buffer and dehydrated using a graded ethanol series: 50%, 60%, 70%, 80%, 134
90% (1 time), and 100% (3 times). The elapsed time per solution was 2 min. Finally, samples were 135
dried using CO2 in a Supercritical Autosamdri-815B critical point dryer (Tousimis, Rockville, MD, 136
USA). 137

MANUSCRIP
T
ACCEPTED
ACCEPTED MANUSCRIPT
Both silicon wafers and powders were subsequently mounted onto SEM stubs by placing or 138
sputtering them on a carbon double-sided adhesive tape. Coating was done with platinum (Q150T 139
Turbo-Pumped Sputter Coater, ProSciTech) for 2 min (~ 10 nm thick). 140
141
2.4.2. confocal laser scanning microscopy 142
Milk concentrate and powders were analysed by confocal laser scanning microscopy (CLSM) 143
using a Zeiss LSM 700 confocal microscope (Carl Ziess Ltd., North Ryde, New South Wales, 144
Australia). Nile red and rhodamin B (Sigma Aldrich) both at a concentration of 0.1 g L-1 in PEG 200 145
were used to label fat and proteins, respectively. A ratio of 1/100 (dye/concentrate or powder) was 146
used and left for 20 min before imaging. Observations were done with a 63× immersion oil 147
objective. An argon laser operating at excitation wavelengths of 488 nm was used. Each micrograph 148
is a representation of at least 10 images of each sample. 149
150
2.5. Particle density measurements 151
152
True density of powder is defined (GEA Niro, 2006a) as the mass of particles per unit 153
volume . A Quantachrome Multipycnometer (Quantachrome Instruments, Boynton Beach, FL, USA) 154
was used to determine the true density of milk powders. The pycnometer was operated using 155
nitrogen gas at 1.2 kPa. 156
Occluded and interstitial air are defined as the difference between the volume of particles at 157
a given mass and the volume of the same mass of air-free solids and of powders tapped 100 times, 158
respectively (GEA Niro, 2006b). The occluded and interstitial air contents of milk powder were 159
calculated using the formulas described by GEA Niro (2006b). 160
161
2.6. Size analysis 162

MANUSCRIP
T
ACCEPTED
ACCEPTED MANUSCRIPT
163
Average size distribution of casein micelles in the concentrates was measured at 25 °C using 164
a 3000 HSA Malvern Zetasizer (Nano series, Malvern Instruments, Malvern, UK). Before 165
measurement, the samples were filtered (0.45 μm; Millipore) to avoid fat interactions. The 166
concentrates were finally diluted 200 times with Milli-Q deionised water. 167
168
2.7. Functional properties of the powder 169
170
The solubility (ISO, 2005), dispersibility (ISO, 2014) and wettability (ISO, 2014) of the 171
powders was determined per the International Organisation for Standardisation standards with 172
slight modifications due to the limited quantity of powder: the same ratio between water and 173
powder was kept, but the quantity of powder used was reduced to be able to make all repetitions. 174
175
2.8. Milk fat analysis 176
177
2.8.1. Free fat extraction 178
Free fat extraction from milk powder was done following the procedures described 179
elsewhere (Kim, Chen, & Pearce, 2002; Murriera Pazos, Gaiani, Galet, & Scher, 2012; Vignolles, 180
Jeantet, Lopez, & Schuck, 2007) with some modifications. Milk powder (2 g) was weighed and mixed 181
with 50 mL petroleum spirit for 5 min. The solvent was separated by filtration into a round-bottom 182
flask. The powders on the filtrate paper were dried and kept for encapsulated fat analysis. The 183
solvent in the flask was totally evaporated. Then, the solvent-free flask was dried in the oven. The 184
free fat percentage is the ratio between the weight of extracted fat and the weight of powder. 185
186
2.8.2. Encapsulated fat extraction 187

MANUSCRIP
T
ACCEPTED
ACCEPTED MANUSCRIPT
Milk powder recovered from free fat extraction was weighed and warm water (4 mL at 50–188
55 °C) was added. The mixture was vortexed for 2 min to dissolve the powder and release the 189
encapsulated fat. A solvent mixture made of n-hexane and 2-propanol in 3:1 ratio (v/v) was added 190
and vortexed for 15 min to extract the fat. The solution was then centrifuged at 1000 × g for 15 min 191
and the organic phase was filtered into a dry and clean round-bottom flask. The aqueous phase was 192
re-extracted with the solvent mixture and the collected organic phase was totally evaporated. Then, 193
the solvent-free flask was dried in the oven. The encapsulated fat percentage is the ratio between 194
the weight of extracted fat and the weight of initial powder. 195
196
2.8.3. Total fat extraction 197
Total fat was extracted from 2 g of milk powder following the same procedure used for the 198
extraction of encapsulated fat described in sections 2.7.2. 199
200
2.9. Statistical analysis 201
202
All measurements presented in this paper were performed on three independent samples 203
(except that the functional properties were done on two analysis). The KyPlot software version 204
2.0 was used and a parametric multiple comparisons test (Tukey test) was performed. The 205
significance level was: ***P < 0.001, **P < 0.01, *P < 0.05 and NSP > 0.05 (not significant). 206
207
3. Results and discussion 208
209
3.1. Effect of CO2 and temperature on whole milk concentrate properties 210
211
3.1.1. pH and ionic calcium evolution in the concentrates as a function of CO2 concentration 212

MANUSCRIP
T
ACCEPTED
ACCEPTED MANUSCRIPT
Whole milk concentrate consists of an aqueous (skim portion) and a lipid (milk fat) phase. 213
During carbonation, the pH evolution was measured at two temperatures, 4 °C and 30 °C, to acquire 214
milk fat under different states, mainly solid and liquid states, respectively. As shown in Fig. 1A, 215
different pH profiles between skim and whole milk concentrates were obtained during carbonation 216
at 4 °C. Lower pH values were attained for whole milk concentrate in comparison with skim milk 217
concentrate, both containing the same solid content. Similar profiles were obtained after 218
mathematical correction of Fig. 1A as a function of the estimated CO2 content in the skim portion 219
(Fig. 1B). As mentioned previously, CO2 is more soluble in lipid than in water (Hotchkiss et al., 220
2006). Thus, it can be assumed that when fat is in a solid state (i.e., 4 °C), very little CO2 dissolves in 221
the fat portion and most is dissolved in the skim portion. At 4 °C, some fat fractions remain liquid 222
(Buchheim, 1970). However, it may be contained in within spherical fat globules that are covered by 223
a layer of solid fat on the surface (Buchheim, 1970) that could act as a barrier to prevent CO2 224
migration into the fat globules. This hypothesis was confirmed by Fig. 1C, highlighting the 225
importance of the presence of fat fraction and the temperature of carbonation. Therefore, it can now 226
be concluded that, during carbonation at 30 °C, CO2 dissolves both in skim and in the fat fraction, 227
whereas at 4 °C, CO2 dissolves only in the skim fraction. Similar results were also obtained by others 228
(Ma & Barbano, 2003) while studying the effect of temperature during carbonation in cream. 229
Ionic calcium strongly correlates to the pH decrease during carbonation (Table 1). As the pH 230
reduces by CO2, CCP gradually solubilises in the concentrates. The concentrates without CO2 231
treatment presents a classical ionic calcium content around 2.75 mM. Milk at a normal pH presents 232
only around 10% of the total calcium (30 mM) in a ionic form; corresponding to 3 mM (Lewis, 2011). 233
Nevertheless considerable variations were observed by these authors, with the ionic calcium level 234
varying from 1–5 mM Ca2+ depending on processing, storage, temperature, breed, etc. This value 235
increased significantly (P < 0.001) to 6.75 and 6.25 mM for concentrates carbonated at 4 and 30 °C, 236
respectively. Acidification of milk (with CO2) was previously found to increase the ionic calcium by 237

MANUSCRIP
T
ACCEPTED
ACCEPTED MANUSCRIPT
180% (Klandar, Chevalier-Lucia, & Lagaude, 2009) at pH 5.95 and 5 °C. No significant differences 238
were observed between the two carbonated concentrates (P > 0.05). Nevertheless, slight differences 239
in ionic calcium content are possibly due to a reduction in CCP solubility with increasing 240
temperature (Lewis, 2011). 241
Another explanation may be that CO2 in warm concentrate is dissolved in both skim and fat 242
portions. This means that there is slightly less CO2 dissolved in the skim portion for warm 243
concentrate in comparison with cold concentrate. Since majority of casein micelles and CCP are 244
present in the skim portion. Thus, there is less effect of CO2 acidification and less CCP release from 245
casein micelle in warm concentrate than cold concentrate. The concentrate without treatment 246
presents a pH around 6.8 whereas the cold and warm concentrates treated at cold and warm 247
conditions with CO2 have a pH of 5.9 and 6.0, respectively. Again, no significant differences were 248
observed between the two carbonated concentrates (P > 0.05). The tendency of a higher pH value of 249
the warm concentrate can be explained by the slightly lower CO2 level (Table 1), although the 250
difference was not significant. 251
252
3.1.2. Micelle size and shape evolution with carbonation 253
Micelle size in milk concentrates was analysed by dynamic light scattering (DLS). The results 254
described in Table 1 showed that micelle size in the cold treated concentrate was significantly 255
reduced from 180 nm to approximately 150 nm (P < 0.01). Meanwhile, no significant differences 256
were observed between the concentrate without treatment and the warm treated concentrate, in 257
which both have micelle sizes around 180 nm. 258
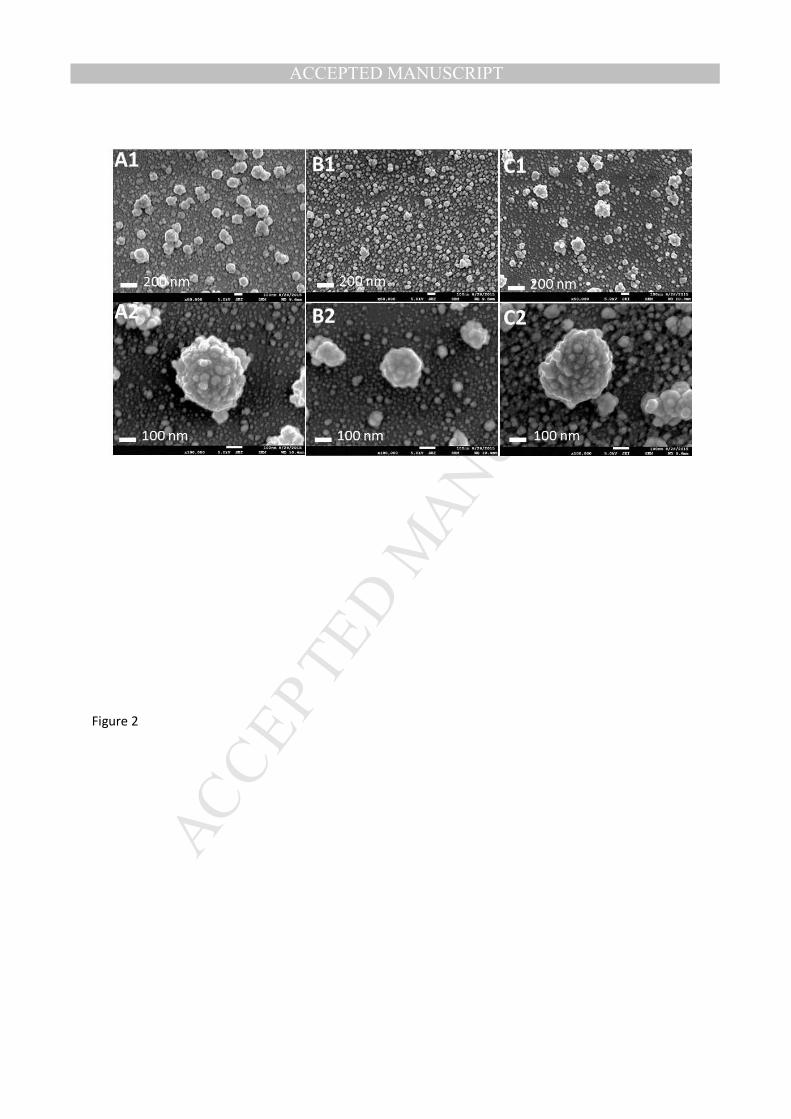
Micelles were also observed at two magnifications (50,000 and 100,000) by SEM high field 259
after fixation and dehydration. At low magnification, uniformly dispersed micelles were seen in all 260
concentrates. In the untreated concentrate (Fig. 2A1), micelles with a size around 200 nm were 261
found uniformly distributed with the presence of small micelles or dissociated micelles in the 262
MANUSCRIP
T
ACCEPTED
ACCEPTED MANUSCRIPT
background. When the concentrate was acidified with CO2 at 4 °C (Fig. 2B1), micelles were visibly 263
smaller in size and greater amount of dissociated micelles were present in the background. 264
Meanwhile, no apparent differences were seen between the standard and high temperature-265
acidified concentrate (Fig. 2C1). The surface of micelles in milk concentrates was also visualised in 266
depth at higher magnification (Figs. 2A2,B2,C2). Our study confirmed earlier research (Dalgleish, 267
2011) that suggests casein micelle are far from regular and are not perfectly spherical. Caseins 268
appear to be organised as an entangled network of protein chains that protrude at the surface 269
(mainly the κ-casein). In addition, microscopy observations and DLS measurements are in 270
agreement as micelles in the cold treated concentrate appeared significantly smaller than in the 271
standard concentrate. 272
It was already demonstrated that the solubilisation of CCP is quick and pH dependent, 273
whereas the dissociation of caseins from micelles varies with pH and temperature (Law & Leaver, 274
1998). A combination of low temperature and low pH was reported to cause the dissociation of CCP 275
and casein monomers from micelles when cold milk pH decreased from pH 6.7 to 5.2 (Law & Leaver, 276
1998; Post, Arnold, Weiss, & Hinrichs, 2012). Meanwhile, no difference in micelle size was observed 277
between the warm treated concentrate and the untreated milk (Table 1, Fig. 2A,C). This could be 278
due to the solitary dissociation of CCP and lack of casein dissociation from micelles in the warm 279
treated concentrate, which showed that CO2 does not influence micelle size in milk concentrates at 280
high temperatures. 281
282
3.1.3. Fat evolution with carbonation 283
CLSM images (at ambient temperature) was conducted after fat labelling of milk 284
concentrates stored at 4 °C (Fig. 3A1,A2) and 30 °C (Fig. 3B1,B2). For each temperature, images 285
were obtained for both CO2 treated (Fig. 3A2,B2) and untreated concentrates (Fig. 3A1,B1). Small 286
and regularly distributed fat globules were observed in concentrates without CO2 treatment, 287

MANUSCRIP
T
ACCEPTED
ACCEPTED MANUSCRIPT
regardless of the temperature. Meanwhile, fat globule coalescence was noticed for concentrates 288
carbonated at 4 °C (Fig. 3A2). The concentrate treated at 30 °C (Fig. 3B2) was also observed to have 289
larger fat globules than the control. However, fat globules as big as at 4 °C were never observed at 290
30 °C. These results are in agreement with the static light scattering analysis (data not shown). 291
Therefore, it is envisaged that formation and breaking of CO2 bubbles during the carbonation 292
process induced coalescence mainly by a surface-mediated mechanism. This mechanism involved 293
the absorption of CO2 at the fat globule membrane interface and subsequently causing coalescence 294
of fat globules, with concomitant release of liquid oil onto the interfaces (Fuller, Considine, Golding, 295
Matia-Merino, & MacGibbon, 2015). This phenomenon may be more pronounced at 4 °C where milk 296
fat is mainly in a solid state (El-Loly, 2011). The combination of fat globule membrane protrusion by 297
crystalline solid fat and CO2 interaction with the membrane might have contributed to the 298
coalescence of fat. It is already known that air accelerates the process of fat coalescence, for instance 299
during the manufacture of ice cream (El-Loly, 2011). However, similar results during carbonation 300
were never reported as carbonation on whole milk concentrate was sparsely studied. Therefore, the 301
effect of CO2 on fat coalescence will need further investigation. 302
303
3.2. Effect of CO2 on spray dried powder properties 304
305
3.2.1. Particle size, shape and density 306
The microstructures of the powders are presented in Fig. 4. At low magnifications (Fig. 307
4A1,B1,C1), similar features were observed among the standard and treated powders, with small 308
particles agglomerated into bigger structures of around 50–100 µm. At intermediate magnifications 309
(Fig. 4A2,B2,C2), again similar round particles were observed. Finally, at high magnifications where 310
the powder surfaces were clearly visualised, no significant modifications were observed in relation 311
to CO2 and/or temperature treatments (Fig. 4A3,B3,C3). 312

MANUSCRIP
T
ACCEPTED
ACCEPTED MANUSCRIPT
Even if the particle size, shape and surface of the powders seemed similar by CLSM and SEM 313
imaging, the physical properties of the powders were different. As presented in Table 2, the 314
occluded gas/air contents of powders produced from concentrates treated with CO2 was 10 times 315
higher than the powders from untreated concentrates. Meanwhile, no significant differences were 316
noted between powders from concentrates carbonated at 4 and 30 °C (P > 0.05). Moreover, the true 317
density and interstitial air content were not significantly lower for CO2 treated powders even if a 318
tendency to lower values was observed. The presence of CO2 in milk concentrates is responsible for 319
the achievement of internal porosity in the resulting powders (Lee, 2014). Therefore, these results 320
were expected as the concentrates were not degassed prior to spray drying. Additionally, as shown 321
in Fig. 5A1,B1,C1, porous structures were seen in CO2 treated powders, whereas standard powders 322
presented some pores, but less important. The cut particles imaged by SEM also showed a lack of 323
vacuoles in the untreated powders (Fig. 5A2), whereas huge vacuoles were present in the treated 324
powders (Fig. 5B2,C2). At higher magnification (Fig. 5A3,B3,C3), small internal pores were visible in 325
the standard powders and the envelope thickness of the other two powders was found to be around 326
2–3 µm, which supported the CLSM results. These microscopy observations supported the occluded 327
air measurements described in Table 2. 328
The CLSM images also showed fat globules (in green) and proteins (in red) distribution in 329
each powder particle (Fig. 4A1,B1,C1). However, no real differences were noticed among the 330
powders, because all particles presented heterogeneous fat globules with a protein layer at the 331
surface. Many authors have reported that greater than 95% of WMP surface was covered with fat, 332
mostly free fat, followed by layers of protein, lactose and fat globules protected by proteins (Fyfe, 333
Kravchuk, Nguyen, Deeth, & Bhandari, 2011; Kim et al., 2002; Kim, Chen, & Pearce, 2009). However, 334
these surface fat layer, generated due to fat globules breakage, cannot be visualised by CLSM due to 335
its low resolution (Vignolles et al., 2007). 336
337

MANUSCRIP
T
ACCEPTED
ACCEPTED MANUSCRIPT
3.2.2. Particle functional properties 338
The analyses of powder functional properties are presented in Table 1. It was found that all 339
powders did not wet within 5 min. This result was expected as WMP particles in this work were not 340
agglomerated and/or lecithinated according to the manufacture of commercial powders. Our results 341
are also different from other researchers on skim milk powder, where CO2 was found to improve 342
wettability (Lee, 2014). However, comparisons are impossible due to the different natures of skim 343
and whole milk powders. Nonetheless, the powders produced from concentrates carbonated at 30 344
°C showed significant improvements in dispersibility (P < 0.01) and solubility (P < 0.001), while the 345
reconstitution properties of powders produced from concentrates treated with CO2 at 4 °C were 346
decreased (for solubility). The dispersibility of standard and powders treated at 4 and 30 °C were 347
54, 46 and 65%, respectively. A similar trend was observed for the solubility of these powders, with 348
values of 97, 94 and 99%, respectively. These differences cannot be attributed to modifications of 349
particle shape or surface morphology because all powder particles have similar structures as 350
observed in Fig. 4A,B,C. In addition, particles size for the three powders were also similar with a d50 351
around 15 µm (data not shown). Meanwhile, improved functional properties have been attributed 352
to powders containing high levels of non-micellar casein in high protein content powders (Schokker 353
et al., 2011). Several factors such as calcium chelators, reduced pH, high pressure, and ionic strength 354
have been found responsible for the structural integrity of casein micelles (Law & Leaver, 1998; 355
Marchin, Putaux, Pignon, & Léonil, 2007). In this study, both CO2 acidification and temperature were 356
found to play a role in the non-micellar casein content. As shown in Fig. 2, the amount of non-357
micellar casein in the concentrates was strongly increased by the action of CO2 acidification in 358
combination with low temperature. However, in this research, the protective effect of non-micellar 359
caseins (serum caseins) observed in high protein content powders (Buldo, 2012) was not confirmed 360
as the resulting powders did not provide better reconstitutability. It is evident that fat caused some 361
modifications in concentrates stored at 4 °C due to coalescence. As a result, fat emulsions in the 362

MANUSCRIP
T
ACCEPTED
ACCEPTED MANUSCRIPT
concentrate were larger and non-homogenous (Fig. 3). Meanwhile, larger fat globules are known to 363
produce free fat on the surface of powder particles (Table 2), which rendered the surface 364
hydrophobic, therefore reducing solubility in water (Bhandari, 2013; Kim et al., 2009). On the other 365
hand, the concentrates carbonated at high temperature did not show fat coalescence, thus the 366
resulting powders have less amount of free fat (Table 2) and consequently better reconstitution 367
properties (Table 1). Additionally, the elevated porosity of powders produced from concentrates 368
treated at 30 °C may contribute to the enhanced functional properties, as similarly reported for 369
skim milk powders (Lee, 2014). Moreover, WMP with poor reconstitution properties were reported 370
to contain more aggregated particles that consisted of mixtures of fat globules and proteins (Singh & 371
Ye, 2010). Therefore, fat destabilisation may mask the positive effect of elevated levels of non-372
micellar caseins in milk concentrates carbonated at low temperatures. 373
374
4. Conclusion 375
376
The effect of CO2 acidification of whole milk concentrate on WMP properties has not been 377
reported in the literature. Results show that CO2 acidification of whole milk concentrates at various 378
temperatures allow the production of powders with totally different properties due to the alteration 379
of physical states of fat. By acting on both micelles and milk fat, new generation of powders with 380
targeted functional properties may be produced. In the future, it may be interesting to find CO2 381
addition and processes conditions that lead to the increase of non-micellar casein levels (as in 2000 382
ppm, 4 °C powders) without the modifications of fat emulsion (as in 2000 ppm, 30 °C powders) to 383
greatly improve the reconstitutability of these powders. 384
385
Acknowledgements 386
387

MANUSCRIP
T
ACCEPTED
ACCEPTED MANUSCRIPT
Author Claire Gaiani would like to thank Europe for their financial support towards this project 388
(Milk PEPPER, N°621727, International Outgoing Fellowship grant). The authors acknowledge the 389
facilities, and the scientific and technical assistance provided by the School of Agriculture and Food 390
Sciences (SAFS) at The University of Queensland and the Australian Microscopy & Microanalysis 391
Research Facility at the Centre for Microscopy and Microanalysis (CMM, The University of 392
Queensland). 393
394
References 395
396
Bhandari, B. (2013). Introduction to food powders. In B. Bhandari, N. Bansal, M. Zhang & P. Schuck 397
(Eds.), Handbook of food powders processes and properties (pp. 1-25). Cambridge, UK: 398
Woodhead Publishing. 399
Buchheim, W. (1970). The process of fat crystallization in the fat globules of milk: Electron 400
microscope studies by the freeze-etching method. Milchwissenschaft, 25, 65-70. 401
Buldo, P. (2012). Crystallization of fat in and outside milk fat globules - Effect of processing and 402
storage conditions. Aarhus University, Denmark: Faculty of Science and Technology. 403
Chaix, E., Guillaume, C., & Guillard, V. (2014). Oxygen and carbon dioxide solubility and diffusivity in 404
solid food matrices: A review of past and current knowledge. Comprehensive Reviews in Food 405
Science and Food Safety, 13, 261-286. 406
Dalgleish, D. G. (2011). On the structural models of bovine casein micelles - review and possible 407
improvements. Soft Matter, 7, 2265–2272. 408
El-Loly, M. M. (2011). Composition, properties and nutritional aspects of milk fat globule membrane 409
- a review. Poland Journal of Food Nutrition and Science, 61, 7-32. 410

MANUSCRIP
T
ACCEPTED
ACCEPTED MANUSCRIPT
Eshpari, H., Tong, P. S., & Corredig, M. (2014). Changes in the physical properties, solubility, and heat 411
stability of milk protein concentrates prepared from partially acidified milk. Journal of Dairy 412
Science, 97, 7394-7401. 413
Fuller, G. T., Considine, T., Golding, M., Matia-Merino, L., & MacGibbon, A. (2015). Aggregation 414
behavior of partially crystalline oil-in-water emulsions: Part II - Effect of solid fat content 415
and interfacial film composition on quiescent and shear stability. Food Hydrocolloids, 51, 23-416
32. 417
Fyfe, K., Kravchuk, O., Nguyen, A. V., Deeth, H., & Bhandari, B. (2011). Influence of dryer type on 418
surface characteristics of milk powders. Drying Technology, 29, 758-769. 419
GEA Niro. (2006a). A-2a Powder bulk density. In GEA Niro analytical methods. Soeborg, Denmark: 420
GEA Niro. 421
GEA Niro. (2006b). A-11a Particle density occluded air and interstitial air (air pycnometer method). 422
In GEA Niro analytical methods. Soeborg, Denmark: GEA Niro. 423
Hotchkiss, J. H., Werner, B. G., & Lee, E. Y. C. (2006). Addition of carbon dioxide to dairy products to 424
improve quality: A comprehensive review. Comprehensive Reviews in Food Science and Food 425
Safety, 5, 158-168. 426
ISO. (2005). Dried milk and dried milk products. In Determination of insolubility index (Vol. ISO 427
8156:2005). Geneva, Switzerland: International Standardisation Organisation. 428
ISO. (2014). Dried milk and dried milk products. In Determination of the dispersibility and 429
wettability (Vol. ISO/TS 17792:2006). Geneva, Switzerland: International Standardisation 430
Organisation. 431
Kim, E. H. J., Chen, X. D., & Pearce, D. (2002). Surface characterization of four industrial spray-dried 432
dairy powders in relation to chemical composition, structure and wetting property. Colloids 433
and Surfaces B: Biointerfaces, 26, 197-212. 434

MANUSCRIP
T
ACCEPTED
ACCEPTED MANUSCRIPT
Kim, E. H. J., Chen, X. D., & Pearce, D. (2009). Surface composition of industrial spray-dried milk 435
powders. 1. Development of surface composition during manufacture. Journal of Food 436
Engineering, 94, 163-168. 437
Klandar, A. H., Chevalier-Lucia, D., & Lagaude, A. (2009). Effects of reverse CO2 acidification cycles, 438
calcium supplementation, pH adjustment and chilled storage on physico-chemical and 439
rennet coagulation properties of reconstituted low- and medium-heat skim milk powders. 440
Food Hydrocolloids, 23, 806–815. 441
Law, A. J. R., & Leaver, J. (1998). Effects of acidification and storage of milk on dissociation of bovine 442
casein micelles. Journal of Agricultural and Food Chemistry, 46, 5008-5016. 443
Lee, E. Y. C. (2014). The effects of carbon dioxide on the physico-chemical and microbiological 444
properties of skim milk and whey protein concentrates. Brisbane, Australia: The University of 445
Queensland. 446
Lewis, M. J. (2011). The measurement and significance of ionic calcium in milk – A review. 447
International Journal of Dairy Technology, 64, 1-13. 448
Ma, Y., & Barbano, D. M. (2003). Effect of temperature of CO2 injection on the pH and freezing point 449
of milks and creams. Journal of Dairy Science, 86, 1578-1589. 450
Marchin, S., Putaux, J.-L., Pignon, F., & Léonil, J. (2007). Effects of the environmental factors on the 451
casein micelle structure studied by cryo transmission electron microscopy and small-angle 452
x-ray scattering/ultrasmall-angle xray scattering. Journal of Chemical Physics, 126, 125-138. 453
Marella, C., Salunke, P., Biswas, A. C., Kommineni, A., & Metzger, L. E. (2015). Manufacture of 454
modified milk protein concentrate utilizing injection of carbon dioxide. Journal of Dairy 455
Science, 98, 3577-3589. 456
Mimouni, A., Deeth, H. C., Whittaker, A. K., Gidley, M. J., & Bhandari, B. R. (2010). Investigation of the 457
microstructure of milk protein concentrate powders during rehydration: Alterations during 458
storage. Journal of Dairy Science, 93, 463-472. 459
MANUSCRIP
T
ACCEPTED
ACCEPTED MANUSCRIPT
Murriera Pazos, I., Gaiani, C., Galet, L., & Scher, J. (2012). Composition gradient from surface to core 460
in dairy powders: Agglomeration effect. Food Hydrocolloids, 26, 149-158. 461
Nelson, B. K., Lynch, J. M., & Barbano, D. M. (2004). Impact of milk preacidification with CO2 on 462
Cheddar cheese composition and yield. Journal of Dairy Science, 87, 3581-3589. 463
Post, A. E., Arnold, B., Weiss, J., & Hinrichs, J. (2012). Effect of temperature and pH on the solubility 464
of caseins: Environmental influences on the dissociation of α- and β-casein. Journal of Dairy 465
Science, 95, 1603-1616. 466
Schokker, E. P., Church, J. S., Mata, J. P., Gilbert, E. P., Puvanenthiran, A., & Udabage, P. (2011). 467
Reconstitution properties of micellar casein powder: Effects of composition and storage. 468
International Dairy Journal, 21, 877-886. 469
Singh, H., & Ye, A. (2010). Controlling milk protein interactions to enhance the reconstitution 470
properties of whole milk powders - A minireview. Lait, 90. 471
Vignolles, M.-L., Jeantet, R., Lopez, C., & Schuck, P. (2007). Free fat, surface fat and dairy powders: 472
interactions between process and product. A review. Lait, 87, 187-236. 473
474

MANUSCRIP
T
ACCEPTED
ACCEPTED MANUSCRIPT
Figure legends
Fig. 1. pH evolution with CO2 concentration for whole milk (�) and skim milk (�)
concentrates with CO2 injected at 4 °C (A), after mathematical correction as a function of the
estimated CO2 in the skim portion at 4 °C (B) and with CO2 injected at 30 °C (C).
Fig. 2. Micelles observed by field emission scanning electron microscopy magnifications
50,000× (1) and 100,000× (2): A, concentrate with no CO2; B, concentrate stored at 4 °C
with CO2; C, concentrate stored at 30 °C with CO2.
Fig. 3. Confocal laser scanning microscopy on whole milk concentrates, fat is labelled with
Nile red and appears in green. Concentrates were stored at (A) 4 °C without (A1) and with
CO2 (A2) or at (B) 30 °C without (B1) and with CO2 (B2).
Fig. 4. Scanning electron microscopy images of the resulting powders at magnifications
1000× (1), 3000× (2) and 10,000× (3): A, powders from concentrate with no CO2; B,
powders from concentrate stored at 4 °C with CO2; C, powders from concentrate stored at
30 °C with CO2.
Fig. 5. Confocal laser scanning microscopy with dual labelling of fat (green) and proteins
(red) of the particles (1) and scanning electron microscopy of cut particles at
magnifications 10,000× (2) and 20,000× (3): A, powders from concentrate with no CO2; B,

MANUSCRIP
T
ACCEPTED
ACCEPTED MANUSCRIPT
powders from concentrate stored at 4 °C with CO2; C, powders from concentrate stored at
30 °C with CO2.

MANUSCRIP
T
ACCEPTED
ACCEPTED MANUSCRIPT
Table 1
Physico-chemical properties of the concentrates and functional properties of the resulting powders. a
a Powders are identified by theoretical CO2 concentration (none and 2000 ppm) and CO2 treatment temperature (none, 4 °C and 30°C).
Values are means of 3 analyses on 3 independent spray drying trials: significance from sample 0 ppm indicated by superscript lowercase
letters, significance from sample 2000 ppm indicated by superscript uppercase letters: ns,NS, not significant, P > 0.05; a,A P < 0.05; b,B P <
0.01; c,C P < 0.001).
Powder
Concentrate properties Powder functional properties
CO2 content
(actual; ppm)
Ionic Ca2+
(mM)
pH Micelle size
- Z average
(nm)
Wettability
(min)
Dispersibility
(%)
Solubility (%)
0 ppm 17±9 2.75±0.25 6.8±0.0 179.3±5.8 > 5 53.8±1.8 97.5±0.3
2000 ppm, 4 °C 1902±67c 6.75±0.25c 5.9±0.1c 147.0±1.5b > 5 45.6±2.5ns 94.0±0.6b
2000 ppm, 30 °C 1781±44c,NS 6.25±0.50c,NS 6.0±0.2c,NS 182.0±3.2ns,B > 5 64.6±2.5a,B 99.0±0.5ns,C

MANUSCRIP
T
ACCEPTED
ACCEPTED MANUSCRIPT
Table 2
Physical and chemical properties of the powders. a
a Powders are identified by theoretical CO2 concentration (none and 2000 ppm) and CO2 treatment temperature (none, 4 °C and 30°C).
Values are means of 3 analyses on 3 independent spray drying trials: significance from sample 0 ppm indicated by superscript lowercase
letters, significance from sample 2000 ppm indicated by superscript uppercase letters: ns,NS, not significant, P > 0.05; a,A P < 0.05; b,B P <
0.01; c,C P < 0.001).
Powder Solvent extraction Physical properties
Free fat
(g L-1)
Total fat
(g L-1)
Encapsulated fat
(g L-1)
True density
(g mL-1)
Occluded air content
(mL 100g-1)
Interstitial air content
(mL 100g-1)
0 ppm 2.45±0.78 30.43±3.51 28.92±0.45 1.14±0.04 1.41±0.02 127.35±0.63
2000 ppm, 4 °C 3.89±0.49b 30.38±4.25ns 26.65±2.02ns 1.00±0.08ns 12.99±0.09c 110.81±0.91ns
2000 ppm, 30°C 2.73±0.37nsA 30.29±0.18ns,NS 29.78±0.61ns,NS 1.10±0.03nsNS 11.81±0.21cNS
103.33±0.29nsNS

MANUSCRIP
T
ACCEPTED
ACCEPTED MANUSCRIPT
Figure 1
MANUSCRIP
T
ACCEPTED
ACCEPTED MANUSCRIPT
Figure 2

MANUSCRIP
T
ACCEPTED
ACCEPTED MANUSCRIPT
Figure 3

MANUSCRIP
T
ACCEPTED
ACCEPTED MANUSCRIPT
Figure 4

MANUSCRIP
T
ACCEPTED
ACCEPTED MANUSCRIPT
Figure 5