physical load, psychosocial and individual factors in ... · physical load, psychosocial and...
TRANSCRIPT

arbete och hälsa | vetenskaplig skriftserie
isbn 91-7045-686-0 issn 0346-7821
nr 2003:10
Physical load, psychosocial and individualfactors in visual display unit work
Jens Wahlström1
National Institute for Working Life
The Sahlgrenska Academy at Göteborg University,Department of Occupational Medicine
1. Occupational Medicine, St Sigfridsgatan 85, SE-412 66 Göteborg, SwedenE-mail: [email protected]

ARBETE OCH HÄLSAEditor-in-chief: Staffan MarklundCo-editors: Marita Christmansson, Birgitta Meding,Bo Melin and Ewa Wigaeus Tornqvist
© National Institut for Working Life & authors 2003
National Institute for Working LifeS-113 91 StockholmSweden
ISBN 91–7045–686–0ISSN 0346–7821http://www.arbetslivsinstitutet.se/Printed at Elanders Gotab, Stockholm
Arbete och Hälsa
Arbete och Hälsa (Work and Health) is ascientific report series published by theNational Institute for Working Life. Theseries presents research by the Institute’sown researchers as well as by others, bothwithin and outside of Sweden. The seriespublishes scientific original works, disser-tations, criteria documents and literaturesurveys.
Arbete och Hälsa has a broad target-group and welcomes articles in differentareas. The language is most often English,but also Swedish manuscripts arewelcome.
Summaries in Swedish and English as wellas the complete original text are availableat www.arbetslivsinstitutet.se/ as from1997.

List of papers
This thesis is based on the following five publications, which will be referred to in the text by their Roman numerals. I Wahlström J, Svensson J, Hagberg M & Johnson PW (2000) Differences
between work methods and gender in computer mouse use. Scand J Work Environ Health, 26(5), 390-7.
II Lindegård A, Wahlström J, Hagberg M, Hansson G-Å, Jonsson P & Wigaeus Tornqvist E (2003) The impact of working technique on physical loads - an exposure profile among newspaper editors. Ergonomics, 46(6), 598-615.
III Wahlström J, Hagberg M, Johnson PW, Rempel D & Svensson J (2002) Influence of time pressure and verbal provocation on physiological and psychological reactions during work with a computer mouse. Eur J Appl Physiol, 87, 257-63.
IV Wahlström J, Lindegård A, Ahlborg G Jr, Ekman A & Hagberg M (2003) Perceived muscular tension, emotional stress, psychological demands and physical load during VDU work. Int Arch Occup Environ Health, DOI: 10.1007/s00420-003-0454-5.
V Wahlström J, Hagberg M, Toomingas A & Wigaeus Tornqvist E Perceived muscular tension, job strain, physical exposure and associations with neck pain among VDU users. A prospective cohort study. Occup Environ Med. Accepted for publication.

List of abbreviations
BMI Body mass index
CI Confidence interval
DBP Diastolic blood pressure
ECU Extensor carpi ulnaris
ED Extensor digitorum
EMG Electromyography
FDI First dorsal interosseus
IRR Incidence rate ratio
MPF Mean power frequency
MVC Maximal voluntary contraction
MVE Maximal voluntary electrical activity
n Number of subjects
RPE Rating of perceived exertion
RVE Reference voluntary electrical activity
SBP Systolic blood pressure
SD Standard deviation
SEM Standard error of the mean
VDU Visual display unit

Contents
Introduction 1 Visual display unit work 1 Musculoskeletal symptoms and visual display unit work 1 Model of musculoskeletal disorders and visual display unit work 2 Physical factors 3 Psychosocial factors 6 Individual factors 7 Perceived muscular tension 8
Aim 9
Subjects 10 Study I 10 Study II 10 Study III 10 Study IV 10 Study V 11 Ethical considerations 11
Methods 12 Study designs and procedures 12 Physical factors 15 Psychosocial factors 20 Individual factors 21 Perceived muscular tension 22 Statistics 23
Results 25 Working technique 25 Sex 28 Time pressure and verbal provocation 29 Perceived muscular tension 31
Discussion 35 Evaluation of the model and implications 35 Muscle activity 37 Wrist postures and movements 39 Forces applied to the computer mouse 41 Ratings of perceived exertion and comfort 42 Perceived muscular tension 42 Methodological considerations and study designs 43
Conclusions 46 General conclusion 46 Specific conclusions 46
Future research 47

Summary 48
Sammanfattning (Summary in Swedish) 49
Acknowledgements 50
References 51

1
Introduction
Visual display unit work
At the traditional office desk the average employee used to perform a great variety of tasks, such as using the telephone, taking notes, looking for documents, filing correspondence, reading a text. This variety of work tasks implied a variety of physical and mental demands during the course of a working day. Since computers have become increasingly common in the office environment since the 1980s, the physical and mental demands on the employees in the office have changed. Working with visual display units (VDUs) is often characterized by hours of work without interruption, thus tying the employee to the machine system. Visual display unit work is characterized by work in constrained postures, repetitive hand and finger movements when operating the keyboard and input device, high visual demands and also, mental demands, for example when new technology or software is introduced.
During the last two decades the number of workers with VDUs has increased dramatically. In 2001 approximately 65% of the Swedish work force used a VDU in their occupation, compared to 30% in 1989 (125). The proportion of employees who spend at least 50% of their working time working with VDUs has increased from about 10% in 1989 to 35% in 2001 (125). Since the late 1980s the use of non-keyboard input devices has increased rapidly and today the market is filled with a large number of different non-keyboard input devices, although the most widely used is still the computer mouse (125).
Musculoskeletal symptoms and visual display unit work
Musculoskeletal symptoms among VDU users are common. In Sweden the reported cases of musculoskeletal illness in which work using computers was given as the reason for the morbidity increased by more than 100% from 1996 to 2002 (124). There are only a few published papers that report the incidence of musculoskeletal symptoms among VDU users. A Finnish study (84) reported the annual incidence of neck pain among VDU users to be 34%. A prospective cohort study from the USA reported the annual incidence of neck/shoulder musculo-skeletal symptoms to be 58 cases/100 person years (35). Cross-sectional studies of VDU users have reported a prevalence of 10-62% of musculoskeletal symptoms in the neck/shoulder region among VDU users (12; 13; 58; 73).
Musculoskeletal symptoms of VDU users are believed to have a multi-factorial aetiology. Non-neutral wrist, arm and neck postures, the work station design and the duration of computer work as well as psychological and social factors, such as time pressure and high perceived work load, are believed to interact in the development of these symptoms (17; 27; 110; 117; 130). Several studies have

2
suggested that an increased prevalence of upper extremity musculoskeletal symptoms may be associated with increased computer mouse use (31; 56; 73).
Model of musculoskeletal disorders and visual display unit work
Sauter & Swanson (119) have proposed an ecological model of musculoskeletal disorders and VDU work (Figure 1). The model does not only cover the more traditional pathways from physical ergonomic factors and biomechanical mechanisms to musculoskeletal disorders, but it also includes psychosocial and cognitive aspects. An introduction to the major concepts of the model is provided in the next paragraph.
Figure 1. An ecological model of musculoskeletal disorders in VDU work, from Sauter & Swanson (119). See the text for a more detailed explanation of the model. Faint arrows denotes moderating effects.
Work technology (“VDT/Office technology”) has a direct path to physical demands, as defined by the physical coupling between the worker and the tool (i.e. workstation ergonomics). There is also a direct path from work technology to work organization. The path from work organization to physical demands suggests that the physical demands from work can be influenced by work organization; for example, increased time pressure leads to an increased number of keystrokes. The model also shows a path from work organization to psychological strain, which in turn influences musculoskeletal outcomes in two ways. Psychological strain is hypothesized to produce muscle tension, which compounds biomechanical strain induced by physical demands. Psychological
VDT/Office Technology
Individual Factors
Work Organization
Physical Demands
Biomechanical Strain
Psychological Strain
Detect Sensation
Labelling/ Attribution
Musculoskeleta11 Outcomes
1 symptom reporting/complaints health care utilization disability performance problems
? Tissue
Damage

3
strain has also been hypothesized to moderate the relationship between biomechanical strain and musculoskeletal outcomes. The model also suggests that the relationship between biomechanical strain and musculoskeletal outcomes is mediated by a complex of cognitive processes, denoted by the shaded area. The cognitive processes involves the detection and labelling/attribution of symptoms. Finally, it is hypothesized that the experience of musculoskeletal disorders feeds back to influence psychological strain at work and the work organization.
Physical factors
Physical load is here defined as factors relating to biomechanical forces generated in the body. In the literature this has also been defined as “mechanical exposure”, to indicate that the full working environment (i.e. lighting, noise, the thermal environment, work organization, psychosocial factors, etc.) is not considered (144).
There are in general four different ways of assessing the physical exposure: (1) job title, (2) subjective judgements, (3) systematic observations and (4) direct measurements. These four methods are generally in order of increasing precision (93; 135; 140). When quantifying physical exposure factors three main dimen-sions should be considered: level (amplitude), repetition (frequency) and duration (40; 150). “Level” of exposure refers to the magnitude or intensity of the physical load, while “repetition” refers to the time variation or frequency of shifts between physical load levels, and “duration”, to the time extension of the physical load.
Three different methods of direct measurements have been used to characterize the physical load in this thesis, electromyography (EMG) to measure muscle activity, recordings of wrist postures and movements with electrogoniometers and recordings of the forces applied to the sides and button of the computer mouse.
Muscle activity When a skeletal muscle contracts an electrical signal is generated. This signal can be recorded and is referred to as electromyography (EMG). Electromyography has been used for many years to assess muscle activity. Already in the early 1950s Lundervold (100) used EMG to investigate muscle activity in patients with so-called “occupation myalgia”. “Occupation myalgia” was defined as pain in muscles overstrained as a result of unvaried work (i.e. static work). Most of the patients studied had typewriting as one of their main job tasks (100). Electro-myography can be recorded either with surface electrodes attached to the skin over the muscle or by needles inserted into the muscle, intra-muscular EMG. In this thesis, surface EMG has been used to assess muscle activity.
To quantify EMG in relation to risk, load limits have been proposed. These limits have been based on the 10th, 50th and 90th percentiles of the amplitude distribution of the muscle activity (66). However, VDU work is characterized by low levels of muscle activity, especially in the trapezius muscles, and no safe lower limit of muscle activity may exist (144). Two other EMG measures that have been used are gap frequency (i.e. number of periods with muscle activity

4
below a predefined threshold level per time unit) (Figure 2) and muscular rest (i.e. the total time with muscle activity below the predefined threshold level relative to the total duration of the recording time) (44; 139). It has been suggested that a low rate of EMG gaps is a predictor of musculoskeletal symptoms in the neck/shoulder region (139). Yet another way to describe muscle activity is to perform exposure variance analysis (EVA). This method was proposed by Mathiassen & Winkel (107) to better quantify the variation in muscle activity or other exposure variables.
EMG-gaps
Mus
cle
activ
ity (%
RV
E)
Time (seconds)10 30 40 0 0
2.5%
Figure 2. Schematic graph of EMG gaps. Muscle activity as percentage of a reference voluntary electrical activity (% RVE; y-axis) and time in seconds (x-axis).
Several hypotheses have been proposed for the pathogenesis of work-related musculoskeletal symptoms and pain (40; 52; 60; 82; 122). One hypothesis suggests that low static contraction during work may result in a recruiting pattern or motor programme, in which only type I muscle fibres are used, and that this may lead to selective motor unit fatigue and damage (38; 39). A similar hypo-thesis known as the “Cinderella hypothesis” has been proposed by Hägg (52). In line with these hypotheses is the overload of type I muscle fibres during pro-longed static contractions. The theory about an overload of type I muscle fibres has been supported in morphological studies in which ragged-red fibres (injured type I muscle fibres) were observed to be associated with occupational static loads (86; 87). These hypotheses are further supported by the findings of Henneman et al. in the mid-1960s (47). This group of researchers carried out their experiments on muscles from the cat. Their findings suggest that low threshold motor units, mainly type I muscle fibres, are recruited and de-recruited in a size-

5
ordered manner, with the small motor units recruited first and de-recruited last (Figure 3).
Figure 3. Schematic diagram of the ordered recruitment of low threshold type I muscle fibres, according to Henneman et al (47).
Recent results from experimental studies using intra-muscular EMG support the hypothesis of a recruiting pattern with type I muscle fibres which are continuously active during static as well as dynamic arm movements, VDU work and mental stress (32; 33; 69; 98; 129). Observations of motor unit substitution have been reported, that is, when one motor unit is de-recruited and another motor unit with a higher threshold is recruited (129; 142). Inter-individual differences in motor unit activity patterns have been observed, with some but not all subjects showing continuously active motor units (129; 152). Mathiassen & Aminoff (105) observed inter-individual differences in the motor response of the trapezius muscle when subjects performed isometric (static) shoulder contractions. They suggested that the different motor responses may explain why individuals with the same exposure do not contract the same type of symptoms, or why some individuals remain healthy.
Wrist positions and movements Electrogoniometry has been used in both experimental and field studies to characterize the postures and movements of the wrist during work (37; 54; 104; 113). Extreme positions of the wrist have been considered to be a risk factor for musculoskeletal symptoms of the hand and wrist (14; 102; 149). Repetitive work
Time
Type I musclefibres
Force
Type II musclefibres
Type II musclefibres
Recruitment of motor unit number
Time
Type I musclefibres

6
has been associated with an increased risk of musculoskeletal symptoms of the wrist and forearm (14; 89; 101; 113; 121). With exposure to both extreme postures and repetitive tasks it has been suggested that the risk increases, compared with exposure to only one risk factor (14).
Highly repetitive jobs have been defined as jobs ”with a cycle time of less than 30 seconds or the same fundamental work cycle performed during more than 50% of the total cycle time” (121). However, several other definitions of repetitive jobs have been used in the literature (77). It has been suggested that the mean power frequency (MPF), which can be assessed by electrogoniometers, could be used as a measure of repetitiveness (43; 68; 151).
Forces applied to the computer mouse A force-sensing computer mouse has been used in this work to record the forces VDU users apply to the sides and button of the computer mouse. It has been suggested that the forces applied to the computer mouse may be a risk factor for musculoskeletal symptoms and it has been observed that 3-4 hours of computer mouse work could lead to fatigue in the muscles of the forearm (63).
Subjective ratings Ratings of perceived exertion (RPE) and comfort have been used to assess subjective perceptions of physical load and work place design in studies of VDU users (71; 74; 75). It has been suggested that ratings of comfort and perceived exertion could be used as screening tools by occupational health practitioners to identify high-exposure groups with regard to poor work place layout and poor working postures among VDU users (94).
Psychosocial factors
Since the early 1990 the role of work organization and psychosocial factors within the work environment has gained more focus in the study of work-related musculoskeletal disorders. The work organization or work system has been suggested to comprise five important components: organizational structure, people or personnel sub-system, technology or technological sub-system, work tasks, and the relevant external environment (40). The different elements in the work system are thought to affect psychosocial factors, for example job demands, decision latitude and social support from managers and colleagues.
A wide range of different instruments have been used to assess psychosocial factors in the work environment, one of the most widely used being the demand-control model developed by Karasek & Theorell (70). The most common way of assessing psychosocial factors has been through use of questionnaires (i.e. self-judgements). A number of different psychosocial factors have been proposed as risk factors for musculoskeletal symptoms in the neck/shoulder region, for example: high job demands, low decision latitude, time pressure, mental stress, job dissatisfaction, high work load and lack of social support from colleagues and superiors (5; 7; 8; 17; 18; 22; 27; 61; 62; 95-97; 117; 123; 130; 148). Several

7
theoretical models of how psychosocial factors are associated with musculo-skeletal symptoms and disorders have been proposed (17; 22; 82; 109; 119; 120; 122; 141); for an overview, see Huang et al. (51). Several of the models suggest that adverse psychosocial factors cause mental stress, which is hypothesized to increase the risk of musculoskeletal symptoms.
The terminology regarding the word “stress” has not always been used consistently by the different research traditions within the field of ergonomics (i.e. psychology and biomechanics). In this thesis a “stressor” is a factor or condition causing a physiological or psychological response. The definition of “stress” is therefore that it is a non-specific response to a stressor, physical or psychological/ mental, consisting of several physiological and/or psychological reactions. Psychophysiological measurements, such as measurements of blood pressure, heart rate, cathecholamines and salivary cortisol, have also been used as effect measures of mental stress due to adverse psychosocial factors.
Experimental studies have observed that mental stress can induce muscle activity (25; 88; 99; 132-134). Some of these experimental studies (25; 88; 99) have used the Stroop Colour Word Test as a stressor and the outcome has primarily been muscle activity in the trapezius muscles and physiological measurements of mental stress (i.e. heart rate and blood pressure). Other studies have used a complex two-choice reaction-time task (132-134) and focused on the muscle activity in the trapezius muscle. However, they also measured muscle activity in other body regions. The Color Word Test and the two-choice reaction-time task require minimal physical activity during performance and are therefore not easily transferred to real work situations using a VDU or a computer mouse.
Individual factors
Sex In almost all scientific studies of work-related musculoskeletal disorders women are found to be at higher risk than men, regardless of the kind of work or occupation involved. The same difference exists between women and men regarding VDU users (26; 58; 73; 74; 84; 117; 130). In the study by Ekman et al. (26), in which the aim was to investigate possible differences between women and men in the reporting of musculoskeletal symptoms among VDU users in the Swedish workforce, the estimated odds ratio for sex (women/men) was 11.9 (95% confidence interval [95% CI] 2.9-50.0). Two explanations for this increased risk for women discussed by the authors were that sex could be a confounder of non work-related factors and that there could be a difference in the occupational exposure among men and women (26). In a review of epidemiological findings on VDU work and musculoskeletal symptoms, Punnett & Bergqvist (117) stated that women appear to consistently report more neck and upper extremity symptoms than men. No definite explanations were found in the reviewed studies, but differences in household work and childcare, work situation differences and constitutional differences were mentioned as possibilities. In a more recent review, Tittiranonda and colleagues (130) suggested that differences in

8
anthropometrics may cause women to work in more extreme postures or using higher relative muscle forces than men. In a cross-sectional study of Swedish VDU users women reported more symptoms in all body regions than men and were more often exposed to physical and psychosocial conditions that have been considered harmful (74).
Working technique Differences in working technique when performing VDU work have not been well documented. However, inter-individual differences in working technique have been observed within other occupations (41; 126). There are two basic elements that characterize working technique: the method or systems of methods used to carry out a work task and the individual motor performance of the work task (81). In this thesis “method” is defined as a way of operating the computer mouse or the keyboard, and the “individual performance” is defined as individual differences in the performance (i.e. lifting of the shoulders, sitting in a tense position). Previous studies have observed that differences in computer mouse location and work with or without forearm support affect the physical load in terms of muscle activity (2; 75).
A concept somewhat similar to working technique is workstyle, which has been conceptualized as a multi-dimensional (i.e. behavioural, cognitive and physiological) stress response to work (29). Wrist postures, finger movements, speed/jerkiness of movements, and force applied while keying are examples of variables included in this construct. Previous research on workstyle has indicated that various dimensions of the construct are associated with pain, symptom severity and functional limitations (30; 46).
Perceived muscular tension
Theorell et al. (127) observed that perceived muscular tension was associated with symptoms from the back, neck and shoulders in their cross-sectional study. The study participants represented a broad range of occupations, including air traffic controllers, symphony musicians, and physicians. In cross-sectional studies of customer service workers, associations between perceived general tension and musculoskeletal symptoms in the neck/shoulder region have been observed (49; 136). In a study by Holte et al. (48), the term “perceived general tension” was explored by means of qualitative interviews. Descriptions considered to represent an activation of the musculoskeletal system (e.g. elevated shoulders, inability to relax, etc.) were given by 52 (81%) of the subjects, but autonomic activation responses were also described. Subjects indicated that both their work environment and personal factors contributed to their perception of tension. Whether perceived muscular tension is a risk factor or an intermediate in the development of musculoskeletal symptoms is unknown, although Holte and colleagues (48) suggested perceived general tension to be an intermediate response to organizational and psychosocial factors.

9
Aim
The overall aim of this thesis was to explore associations between physical load, psychosocial and individual factors in VDU work. Furthermore, the aim was to investigate whether perceived muscular tension is a predictor of neck pain among VDU operators. Specific research questions were: Do different computer mouse operating methods or sex affect the physical load
and perceptions of exertion and comfort while operating the computer mouse? (Study I)
Do different working techniques or sex affect the physical load and perceptions of exertion and comfort when working with a VDU in a field setting? (Study II)
Do time pressure and verbal provocation (i.e. stress situation) affect the physical load when operating the computer mouse? (Study III)
Are perceived muscular tension, psychological demands and/or mental stress associated with physical load or working technique during VDU work? (Study IV)
Are perceived muscular tension, job strain, physical exposure or individual factors, or a combination of these factors, associated with an increased risk of developing neck pain among VDU users? (Study V)

10
Subjects
Study I
Thirty subjects, 15 men and 15 women, volunteered to participate in the study. Subjects from various occupations were recruited from Sahlgrenska University Hospital, Göteborg, Sweden; others were former fellow students of two of the authors (J.S. and J.W.). The subjects employed at the Sahlgrenska University Hospital participated in the experimental session during paid work time. The mean age was 34 (range 18-52) years for the men and 39 (range 22-60) years for the women. The subjects were all experienced computer mouse users with a mean experience of 51 (range 6-144) months of mouse use at work or at home, and all used their right hand to operate the computer mouse. Before the study, subjects were given written and verbal information explaining the experimental procedures. All subjects were free from neck and upper extremity musculoskeletal disorders, according to an interview.
Study II
The study group consisted of all personnel in a newspaper editorial department who, according to their supervisor, had editing tasks as their main job task. Altogether 36 employees performed editorial work as their main job task. Two men and two women were excluded because of long-term sick leave or temporary work at another newspaper. The mean age was 44 (range 26-57) years for the men (n = 14), and 42 (range 28-55) years for the women (n = 18).
Study III
Fifteen subjects, eight men and seven women, volunteered to participate in this study. Subjects from various occupations were recruited from the Sahlgrenska University Hospital, Göteborg; and a few former fellow-students of two of the authors (J.S. and J.W.). The subjects’ mean age was 30 (range 18-48) years and the mean BMI was 23.5 (range 20-28). The subjects were all experienced computer mouse users and all used their right hand to operate the computer mouse. Prior to the study, subjects were given written and verbal information explaining the experimental procedures. None of the subjects used medication for hypertension or any other cardiovascular disease and all were free from upper extremity musculoskeletal disorders, according to an interview.
Study IV
The study group included 57 subjects (28 women and 29 men) recruited from two different organizations. Organization 1, was an editorial department at a daily

11
newspaper (n = 32). Subjects from organization 2, worked as engineers in a large telecommunications company (n = 25). The mean age was 39 (range 26-57) years and the median duration of daily VDU use was between 60% and 83% of the total work time. There were 25 subjects (44%) who reported pain in the neck or upper extremities on the day of the measurement. In both organizations the main procedures and aims of the project were presented at information meetings, whereafter subjects volunteered to participate in the study.
Study V
In this study, the study base consisted of 1 529 computer users, 634 men and 895 women. The baseline questionnaire was answered by 498 men (79%) and 785 women (88%). Since this study focused on predictors for neck pain, only subjects who were healthy at baseline were included. Out of the 1 283 subjects who answered the baseline questionnaire, 671 (52%) were free from neck pain at baseline, with quite an even distribution of men (51%) and women (49%) (Figure 4). The mean age for the men was 43 (range 20-65) years; for the women it was 45 (range 22-65) years. The men had a slightly higher BMI (24.8) than the women (23.4). The women reported the amount of VDU work in relation to their total work time to be 47.6% compared with 41.8% for the men.
Figure 4. Flow chart of participant eligibility for analyses of incident neck pain (Study V).
Ethical considerations
All the studies in this work were approved by the Ethical Committee at Göteborg University. The fifth study (V) was also approved by the Ethical Committee at the Karolinska Institute, Stockholm.
Neck pain 458 women, 154 men
Study base 895 women, 634 men
Baseline questionnaire 785 women, 498 men
Neck pain 103 women, 76 men
Symptom-free 224 women, 268 men
Study population327 women, 344 men
Follow-up period (md: 10.9, range0-17 months)
12
Methods
Study designs and procedures
Studies I & III The first and the third study (Studies I and III) were experimental studies conducted in the laboratory. An adjustable VDU work station was set up and the subjects adjusted the table and chair to fit their needs. Typically, subjects adjusted the chair so their legs were well supported with their feet resting flat on the floor; the table was adjusted so that the mouse and keyboard were approximately at elbow level and the monitor was at a fixed height above the work surface. A Macintosh computer with a 13-inch colour display and 101-key keyboard was used.
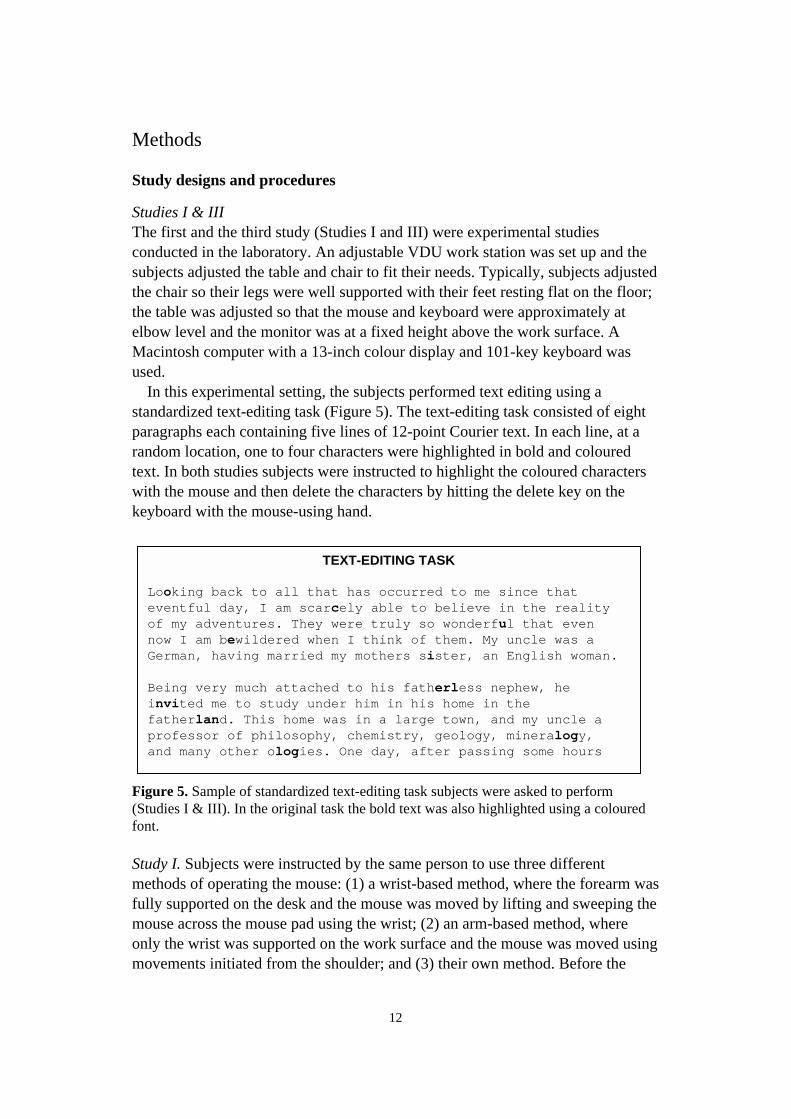
In this experimental setting, the subjects performed text editing using a standardized text-editing task (Figure 5). The text-editing task consisted of eight paragraphs each containing five lines of 12-point Courier text. In each line, at a random location, one to four characters were highlighted in bold and coloured text. In both studies subjects were instructed to highlight the coloured characters with the mouse and then delete the characters by hitting the delete key on the keyboard with the mouse-using hand.
Figure 5. Sample of standardized text-editing task subjects were asked to perform (Studies I & III). In the original task the bold text was also highlighted using a coloured font.
Study I. Subjects were instructed by the same person to use three different methods of operating the mouse: (1) a wrist-based method, where the forearm was fully supported on the desk and the mouse was moved by lifting and sweeping the mouse across the mouse pad using the wrist; (2) an arm-based method, where only the wrist was supported on the work surface and the mouse was moved using movements initiated from the shoulder; and (3) their own method. Before the
TEXT-EDITING TASK Looking back to all that has occurred to me since that eventful day, I am scarcely able to believe in the reality of my adventures. They were truly so wonderful that even now I am bewildered when I think of them. My uncle was a German, having married my mothers sister, an English woman. Being very much attached to his fatherless nephew, he invited me to study under him in his home in the fatherland. This home was in a large town, and my uncle a professor of philosophy, chemistry, geology, mineralogy, and many other ologies. One day, after passing some hours

13
study, in their own office, subjects were instructed on how to perform the different methods and asked to practise and familiarize themselves with each method. On the day of the measurement, subjects practised at the experimental work site to familiarize themselves with the equipment and ensure that they performed the different computer mouse operating methods correctly. All subjects used their own method first, after which the one group of 15 subjects used first the arm-based method followed by the wrist-based method while the other group of 15 subjects used the wrist-based method first followed by the arm-based method (Figure 6).
Figure 6. The design and way of balancing subjects to the different conditions in Study I.
Study III. This experiment consisted of subjects working without and with time pressure and verbal provocation. The subjects participated in a control situation (Control 1), a stress situation (Stress) and a second control situation (Control 2) at the end of the experiment (Figure 7). In the control situations, subjects edited eight, five-line paragraphs of text (2 pages) with no time constraints imposed. In the stress situation, subjects were asked to perform the same task but do twice the amount of work (edit 4 pages).Subjects were asked to work “as fast as possible” and a time constraint of 40 seconds was imposed to complete each page of text editing. If the subjects could not complete the page of text, they were verbally prompted to use the “Page Down” key on the keyboard and continue with the text-editing task on the next page. Subjects were also verbally provoked every 15 seconds (e.g. “hurry up”, “come on, you can do it faster”). The verbal provocation was given by the same test leader throughout the experiment.
Figure 7. The design of the third study (Study III).
Study II and IV First the subjects answered a questionnaire about personal characteristics (age, sex, height, weight etc.), VDU exposure (amount of work with the VDU, key-board, input device, etc.) and perceived muscular tension and psychological demands. In organization 1, the questionnaire data were collected in connection
Time
Own method
Arm-based method
Wrist-based method
Own method
Wrist-based method
Arm-based method
30 s
ubje
cts
15 subj.
15 subj.
~ 5 min ~ 20 min
Time
Control condition 1
Stress condition
Control condition 2

14
with the measurement, which was performed at the beginning of a work shift (either morning or evening). In organization 2, the questionnaire data were collected either on the day before or in connection with the measurements, which were performed either in the morning or after lunch.
The equipment used to measure muscle activity and wrist movements was attached to the subjects and calibrated in an adjacent room. After the calibration procedures the subjects went to their ordinary work place and performed a few minutes of VDU work to familiarize themselves with the task. When necessary, minor adjustments of the measurement equipment were made before the measurements were started. Subjects then performed their usual work task for approximately 15 minutes.
In the analysis the first and last minute of data were excluded, resulting in 13 minutes of data from each subject in both organizations.
Study V The fifth study was part of a prospective cohort study aiming at identifying risk and preventive factors for musculoskeletal disorders and impaired performance during work with a computer mouse and other input devices. Together with the employers and the occupational health care centres of 46 different work sites, work groups or departments were invited to participate in the study. The work sites differed in size, the smallest including only seven persons and the largest, 260. None of the work sites that were invited refused to participate. A list of employees at the work site was established, so that employees on short-term leave were also included. The questionnaire was distributed to all employees at the different work sites by ergonomists at the occupational health care centers. The ergonomists were also responsible for checking the questionnaires to be filled in, and for collecting them.
At baseline the occurrence of musculoskeletal symptoms and occupational exposures during the preceding month as well as individual factors were assessed by means of a printed questionnaire. The collected information included working hours, work content (variation of work tasks, hours/week of computer work, work with a non-keyboard input device and data/text entry), physical exposures (amount of precision work and repetitive work) and psychosocial exposures (job demands and decision latitude). Individual factors such as civil status, age, educational level and lifestyle factors were also included. Neck pain at baseline was defined as reported pain or aches in the neck and/or shoulder area (Figure 8) for 3 days or more during the preceding month and information about neck pain was collected at baseline and in the follow-up questionnaires. Incidence data were assessed with ten follow-up questionnaires regarding pain in the neck/shoulder region. The questions referred to the time period since the preceding questionnaire. The time period usually covered approximately 1 month but for some respondents this time period could be longer as a result of vacations, business trips or other reasons for absence. If a follow-up questionnaire was not answered before the next one appeared, the preceding questionnaire was omitted

15
and that follow-up occasion considered missing. However, the time frame considered for reporting pain covered the period since the last questionnaire was answered.
Figure 8. Definition of the different body regions in the symptom recording questionnaires (female and male version). “Neck pain” was defined as pain or aches in the neck and/or shoulders (shaded area) reported for 3 days or more during the preceding month.
Physical factors
To assess the physical load direct measurements (Studies I-IV), observations (Studies I, II and IV) and ratings (Studies I-V) were used. Electromyography was used to assess muscle activity, an instrumented mouse to measure forces applied to the sides and button of the computer mouse, electrogoniometers to assess wrist postures and movements, and observational checklists to assess working methods and working technique (Figure 9). Ratings of perceived exertion and comfort were also assessed in Studies I-IV.
Figure 9. The position of the EMG electrodes (left), the electrogoniometer and the force-sensing mouse (right) in Studies I and III.

16
Muscle activity Studies I and III. Muscle activity from four separate muscles was recorded at 1 kHz using a commercial EMG system (ME 3000P, Mega Electronics Ltd, Kuopio, Finland). The muscles examined were the right first interosseus (FDI), the right extensor digitorum (ED) and the pars descendent of the right and left trapezius muscles. The electrodes for the FDI and ED were placed as recommended by Perotto et al. (116), and for the trapezius as recommended by Mathiassen et al. (108) (Figure 9). Self-adhesive surface electrodes (M-00-S; Medicotest AS, Ølstykke, Denmark) were placed in pairs with a 35 mm inter-electrode distance. For the FDI muscle, the electrodes were modified (cut), resulting in an inter-electrode distance of 25 mm. Before attaching the electrodes, the skin was dry-shaved and cleaned with alcohol. At the beginning of the recordings the subjects performed standardized maximal voluntary contractions (MVCs) to obtain the maximal voluntary electrical activity (MVE) of the FDI and ED muscles. The MVE in the FDI and the ED was set with maximum static contraction against manual resistance for a minimum of 3 seconds. The reference voluntary electrical activity (RVE) in the right and left trapezius muscles was set with the shoulders flexed 90°, thumbs up and a 1 kg dumbbell held in each hand for a minimum of 3 seconds. A 3-second sampling window was used to calculate the average electrical activity during the MVC and reference contractions. The raw data were recorded on-line using a laptop computer and monitored in real time for quality control. Full-wave rectifying and filtering of the EMG signal derived the muscular activity, using a time constant of 100 ms. Data were analysed using the ME 3000P software version 1.5 (Mega Electronics Ltd, Kuopio, Finland). The 50th percentile of the amplitude distribution was calculated for each subject and used to describe muscle activity.
Studies II and IV. The equipment, electrode placement and procedures for preparing the skin were the same as described above for Studies I and III. The muscles examined were the ED, extensor carpi ulnaris (ECU), the upper trapezius muscle on the side operating the computer mouse and the upper trapezius muscle on the side not operating the mouse. Self-adhesive surface electrodes (N-00-S, Medicotest A/S, Ølstykke, Denmark) were placed with a 20 mm inter-electrode distance. Each subject performed standardized MVCs against manual resistance for 5 seconds to obtain the MVE of the ECU and the ED muscles. For the trapezius muscles, a reference voluntary contraction was performed with a 1 kg dumbbell in each hand with the hands pronated and shoulders abducted 90° in the horizontal line for 15 seconds to obtain the RVE.
Data were analysed using the Megawin software version 1.21 (Mega Electronics Ltd, Kuopio, Finland). Full-wave rectifying and filtering of the EMG signal derived the muscular activity, using a time constant of 125 ms. Maximal voluntary electrical activity for ED was calculated using a 1-second moving average and the 1-second window with the highest average EMG activity was used as the reference value. The RVE for the trapezius muscles was calculated

17
using a 10-second moving average, the 10-second window with the highest average EMG activity was chosen and thereafter the mean value of the three reference contractions was used as the reference value. The 50th percentile of the amplitude distribution was calculated for each subject and used to describe the muscle activity for the 13 minutes of work. For analysing gap frequency and muscular rest of the trapezius muscles, a threshold of 2.5% RVE was chosen. The RVE corresponds roughly to a load of 15-20% MVC (44). The rest definition 2.5% RVE therefore corresponds to 0.4-0.5% MVC. Muscular rest was defined as the summed duration of the gaps relative to the total duration of the recording. The gap duration time was set to 125ms.
Forces applied to the computer mouse. To measure the forces applied to the sides and button, a force-sensing Apple ADBII mouse was used. The force-sensing mouse was fully operational and similar in weight, feel and appearance to an ordinary Apple ADBII mouse. The design and measurement accuracy of the force-sensing mouse has been validated, described, and discussed in detail elsewhere (63). A portable PC instrumented with a data acquisition card was used to collect and store the force data. The force signals from the mouse were sampled at 60 Hz and analysed using a program written in Labview 4.0. The program identified each time the mouse was used (i.e. each so called “grip episode”), and kept track of idle periods, defined as any period the mouse was not used for 1 second or longer. For each grip episode, the program calculated the mean force, peak force and grip duration.
The maximum force the subjects could apply to the sides and button of the mouse was measured after the experiment. The subjects were asked to apply MVC to the sides and button of an Apple ADBII mouse instrumented with load cells (Pinchmeter, Greenleaf Medical, Palo Alto, CA, USA). The subjects were instructed to grip the mouse during the MVC in the same way that they gripped the mouse during the experiment. The MVC applied to the sides and button of the mouse was measured separately and the data were analysed using a program written in Labview 4.0. Using a 1-second moving average, the program identified the 1-second window with the highest average force and used this value as the MVC. The subjects applied three MVCs to the sides and button of the mouse and the highest MVC applied to each location was chosen as the subject’s MVC. If the difference between the highest and second highest MVC was greater than 10%, additional MVCs were collected to verify the maximum.
Wrist postures and movements Studies I and III. A two-axis electrogoniometer (Model XM65, Penny & Giles Biometrics, Blackwood, Wales, UK) and a data logger (Model DL 1001, Penny & Giles Biometrics, Blackwood, Wales, UK) were used for recording flexion/extension and radial/ulnar deviation position and movements in the right wrist. The sampling frequency was 20 Hz. The reference (zero) position of the goniometer system was recorded when the subjects sat at the workstation with their arm fully pronated, resting in front of them with their hand pressed flat on

18
the work surface, and in a neutral radial/ulnar position (36). The wrist position and movement data were calculated using an interactive data analysis program (Goniometer Analysis System, version 1.0; Ergonomic and Research Consulting, Inc.; Seattle, WA, USA). The program calculated the mean position, mean velocity, MPF of the power spectrum and the range of motion for both flexion/extension and radial/ulnar deviation. “Mean power frequency” was defined as the centre of gravity for the power spectrum , and the “range of motion” was defined as the difference between the 95th and the 5th percentile of the wrist angles (43).
Studies II and IV. A glove instrumented with two electrogoniometers, and a data logger (Greenleaf Medical, Palo Alto, CA, USA) were used to record wrist positions and movements in the mouse-operating wrist with a sampling rate of 20 Hz. Calibration was done in four different wrist positions: 45° extension, 45° flexion, 25° ulnar deviation and 15° radial deviation using a calibration fixture (Greenleaf Medical, Palo Alto, CA, USA). The reference position (zero position) was recorded with the hand fully pronated and with the palm of the hand lying flat, in neutral radial/ulnar and flexion/extension positions, in the calibration fixture.
The data were transferred to the hard disc of a computer for subsequent analysis and then treated as described above for Studies I and III.
Blood pressure In Study III systolic and diastolic blood pressure (SBP, DBP) was registered with an ambulatory blood pressure monitor, CardioTens (Medikolt International AB, Skärholmen, Sweden). This equipment has been tested for validity and reliability (11), and the algorithm used in the apparatus followed the recommendations from the Association for the Advancement of Medical Instrumentation. Systolic blood pressure and DBP were registered once during the control situation mid-way through the task. During the stress situation SBP and DBP were measured approximately 1 minute after the start of the text-editing task.
Heart rate and heart rate variability Heart rate variability and heart rate were measured with the Polar Vantage NV™ (Polar Electro Oy, Kempele, Finland) heart rate monitor in Study III. Data were analysed using the Precision Performance software version 2.0 (Polar Electro Oy, Kempele, Finland). Heart rate was registered “beat by beat” and thereafter the data were filtered using an automatic procedure contained in the Polar software system. The low frequency domain (0.04-0.15 Hz) and the high frequency domain (0.15-0.40 Hz) of the power spectrum were calculated using the Polar software system. The low frequency to high frequency ratio (LF/HF ratio) was calculated, together with the mean heart rate. The high frequency component of the power spectrum reflects parasympathetic activity and the low frequency component reflects sympathetic activity with vagal modulation and mental stress has been

19
observed to lower the heart rate variability and give an increase in the LF/HF ratio (85).
Perceived exertion and comfort Studies I and III. The subjects rated perceived exertion before the experiment, after the use of each working method and after the stress situation using a Borg scale (19) ranging from 6 to 20, which was modified to range from 0 to 14 (146). Subjects rated perceived exertion in five different body locations: neck/shoulder (scapular), right shoulder (upper arm), right forearm, right wrist and right hand/fingers. The different locations were summed and then divided into two categories, “proximal” (neck/shoulder and shoulder) and “distal” (forearm, wrist and hand/fingers). After each experimental setting subjects rated their overall comfort on a scale graded from – 4 (poor comfort) to + 4 (excellent comfort) (75).
Study II. The subjects rated their perceived exertion before and directly after the measurement. They rated perceived exertion in 11 different body locations: neck, shoulders, upper arms, forearms, wrists, and hands/fingers on both the mouse-operating side and the non-mouse-operating side using the Borg CR-10 scale (19). After the measurement subjects rated their overall comfort on a scale graded from – 4 (poor comfort) to + 4 (excellent comfort) (75).
Physical exposure Study V. Physical exposure was assessed at baseline with two questions: (1) “During the last month, have you carried out precision work (e.g. work with precision tools, computer mouse or the like) for altogether more than ½ hour per day?” (2) “During the last month, have you carried out work tasks where the same hand or finger movements were repeated several times a minute (e.g. typing, keyboard work, sorting paper) for altogether more than ½ hour per day)?” The response scales comprised four categories:” never or almost never”, “a few days per month”, “a few days per week” and “daily or almost daily”. Subjects who reported precision and repetitive work “daily or almost daily” also reported the average time of exposure per day in per cent of the total work time. The median daily exposure was used as the cut-off point for low/high exposure. Hence, subjects with an average time of daily exposure greater than the median value were classified as exposed and the others as unexposed to the two factors, respectively. Respondents were then classified into three groups of physical exposure: “high physical exposure” (high exposure to both precision and repetitive work), “medium physical exposure” (high exposure to precision or repetitive work), and “low physical exposure” (low exposure to both precision and repetitive work).

20
Psychosocial factors
Job demands and decision latitude Study IV. To assess the psychosocial exposure, central components from the model suggested by Karasek & Theorell were used (70). The model is based on three variables: psychological demands (five items), decision latitude (six items) and social support (six items). In this study psychological demands were assessed using a Swedish short version of the Job Content Questionnaire (128). Five questions (organization 2) and four questions (organization 1) regarding psychological demands during the previous month were asked. The response scale comprised four categories for each question: “often”, “sometimes”, “rarely” and “never”. For each subject a median response (“often”, “sometimes”, “rarely” or “never”) was calculated. The group was then dichotomized and subjects with a median response of “often” or “sometimes” were classified as having high psychological demands and subjects with a median response of “rarely” or “never” as having low psychological demands.
Study V. To assess the psychosocial exposure, central components from the model proposed by Karasek & Theorell were used (70). Job demands and decision latitude were assessed using a Swedish short version of the Job Content Questionnaire (128). Responses were given on a four-point scale ranging from “yes, often” to “no, never”. The median value of the demand and decision latitude scores, respectively, was used as a cut-off point for low/high exposure. Respondents were then classified into three groups of job strain: high job strain (high demands and low decision latitude), medium strain (high demands and high decision latitude or low demands and low decision latitude), and low strain (low demands and high decision latitude).
Mental stress To assess mental stress we used a Swedish mood adjective checklist (78-80). The checklist measures two factors, stress and energy, each comprising six items. Three adjectives within each factor are positively loaded and three are negatively loaded. The checklist uses six categories (0-5) for each adjective: “very much”, “much”, “fairly”, “somewhat”, “hardly” or “not at all”. High values indicate high stress and energy levels, respectively. A high stress level is characterized by high activity and negative values (tensed, stressed, pressured) and low stress levels are characterized by low activity and positive values (rested, relaxed, calm).
In Study III a sum of scores was calculated for each dimension and then the mean values were used to characterize each subject’s stress and energy level. The ratings were done immediately after each condition.
In Study IV a median response for the stress dimension was calculated for each subject. Subjects with a median response of “fairly” to “very much” were classified as having high mental stress and subjects with a median response of “somewhat” to “not at all”, as having low mental stress.

21
Individual factors
Working technique Study I. To characterize subjects’ own working methods with the computer mouse, three items from an ergonomic checklist (1; 45) were used: (1) how the forearm and/or wrist was supported (near the elbow at the proximal part of the forearm or distally at the wrist or hand); (2) whether the computer mouse was lifted from the surface; and (3) the type of arm movements (whole arm or wrist and/or fingers). To characterize each subject’s own method, video recordings were made simultaneously from two different angles. Two of the researchers independently classified subjects, when using their own method, into one of three different groups (arm-based, wrist-based or a hybrid method). If the results of these two persons differed, which occurred in six out of 30 times, a third researcher analysed the video recordings and made a final classification. Subjects who did not support their forearm on the work surface and used their whole arm to move the computer mouse were categorized as “arm-based” users. To be categorized as “wrist-based” users, subjects had to support their forearm on the work-surface and used wrist movements to repeatedly lift and move the computer mouse.
Study II. The working technique used during ordinary VDU work was observed and classified according to an observation protocol (1; 45). The subjects’ individual working technique was evaluated by an experienced ergonomist according to nine items (Table 1). The ergonomist was blinded to the subjects’ symptoms and measurement results. The items from the checklist were selected by an expert panel consisting of five experienced practitioners and researchers in ergonomics. The same panel also developed the score range for each item. An overall working technique score (range 1-25) was calculated as the sum of scores for the separate items. The score given to each item corresponds to the judged magnitude of the potential risk. A maximum total score of 25 could be obtained. Subjects with a total score of >15 were classified as having a good working technique (five men and six women), while subjects with a score of 14-15 were classified as having an intermediate working technique (three men and seven women). Subjects with a total score of <14 were classified as having a poor working technique (6 men and 5 women). In the analysis of the potential differences between good and poor working technique, the intermediate group were excluded.
Study IV. Two items were used to serve as a proxy for working technique, namely whether the shoulders were lifted during keyboard and whether they were lifted during computer mouse work (Table 1). The study group was dichotomized into a poor working technique group (subjects who worked with lifted shoulders during keyboard or computer mouse work) and a good working technique group (subjects who worked without lifting their shoulders during both keyboard and computer mouse work).

22
Table 1. Items used for classification of working technique, giving the score range for each item. The overall score ranged from 1 to 25.
Item Categories Score
Support of the arms during keyboard work (score 0-5).
No support at all Proximal part of the hand Wrist Distal part of the forearm Proximal part of the forearm Elbow
0 1 1 1 1 1
Support of the mouse-operating arm during input device work (score 0-5).
No support at all Proximal part of the hand Wrist Distal part of the forearm Proximal part of the forearm Elbow
0 1 1 1 1 1
Lifting of the computer mouse (score 0-3).
None Hardly ever Now and then Frequently
3 2 1 0
Range of movements during input device work (score 1-3).
Small Medium Large
3 2 1
Velocity of movements during input device work (score 0-1).
Normal Fast and/or jerky
1 0
Type of working method during input device work (score 0-2).
Whole arm Forearm Wrist/Fingers
0 1 2
Sitting in a tense position (score 0-2).
No Yes
2 0
Lifting the shoulders during keyboard work (score 0-2).
Not at all Yes, sometimes Yes, most of the time
2 1 0
Lifting the shoulders during input device work (score 0-2).
Not at all Yes, sometimes Yes, most of the time
2 1 0
Perceived muscular tension
Information about perceived muscular tension was collected from a questionnaire. The question regarding muscular tension was worded, “Have you, during the past month, experienced muscle tension (for example: wrinkled your forehead, ground your teeth, raised your shoulders)?” The response scale comprised four categories: “never”, “a few times”, “a few times per week”, or “one or several times per day”.
In Study IV the subjects were classified into a high tension group (“a few times per week” or “one or several times per day”) and a low tension group (“never” or “a few times”).

23
In Study V respondents were classified into three groups, the high tension (“a few times per week” or “one or several times per day”), medium tension (“a few times”) and low tension (“never”) groups.
Statistics
Descriptive data are presented as means with the standard error of the mean (SEM), unless otherwise specified. In the first three studies (Studies I-III), all statistical analyses were performed using the statistical software JMP (SAS Institute Inc., Cary, NC, USA). In the last two studies all statistical analyses were performed using the SAS statistical software (SAS Institute Inc., Cary, NC, USA). Where applicable, statistical significance has been assumed for p≤0.05.
Study I Data were analysed using repeated measures analysis of variance methods. Post-hoc comparisons between work methods were performed using Tukey adjusted t-tests (paired observations) and adjusted 95% CIs of the differences between means were calculated. Sex comparisons were made using t-tests (two independent groups) and were only performed on the data where subjects used their own work method. Owing to technical problems, the results from one male subject were excluded in the analysis of wrist postures and the results of another male subject were excluded in the analysis of muscle activity.
Study II Comparisons between good and poor working technique and between men and women were performed using Wilcoxon’s rank sum test. Because of technical problems one female subject was excluded from the analysis of muscle activity and one male subject from the analysis of wrist positions and movements.
Study III A repeated measures analysis of variance were performed to test the null hypothesis that condition did not have any effect on the different variables assessed. The results are presented with the corresponding p-value. Due to technical problems, the results of two male subjects were excluded from heart rate analysis, one female subject was excluded from the analysis of blood pressure and one male subject was excluded from the analysis of wrist movements.
Study IV A multivariate linear regression model was used to analyse how perceived muscular tension (low tension = 0, high tension = 1), mental stress (low stress = 0, high stress = 1), psychological demands (low demands = 0, high demands =1), organization (organization 1 = 0 and organization 2 = 1) and sex (woman = 0, and man = 1) influenced the physical load (i.e. muscle activity, wrist movements). The explanatory variables to be included in the model were decided a priori. The binary dependent variable working technique was analysed with a logistic

24
regression model with the same explanatory variables as described for the multi-variate linear regression models. Age (continuous ) and present musculoskeletal pain (no pain = 0, pain = 1) were controlled for in both the linear and logistic regression models.
Owing to technical problems one woman and one man were excluded from the analysis of muscle activity and the result of one woman was excluded in the analysis of wrist movements. Data were also missing from one woman in the ratings of mental stress.
Study V All statistical analyses were performed separately for men and women or stratified by sex. Incidence rate ratios (IRRs; hazard ratios) with 95% CI were computed using Cox’s proportional hazard model (proc phreg, SAS version 8.2 ). Kaplan-Meier survival curves were obtained by means of the statistical software JMP version 4.0.4. The potential excess risk attributable to interaction was assessed between the exposures “perceived muscular tension” and “job strain”, “perceived muscular tension” and “physical exposure” , “job strain” and “physical exposure” by measuring departure from additivity of effect with the method proposed by Rothman & Greenland (118).
According to this method, for a potential interaction to exist (R11-R01)-(R10-R00) must be greater than zero. R11 represents the measure of risk (IRR in this case) from high exposure to both sets of factors, for example high physical exposure and high job strain. R10 represents the risk from exposure to only the first set of exposure, for example high physical exposure; R01 represents the risk from exposure to only the second set of exposure, for example high psychosocial exposure; and R00 represents the risk from exposure to low exposure from both sets of factors, for example low physical exposure and low job strain. The proportion of excess risk due to interaction was calculated from the results of the Cox proportional hazard analyses (R11-R01- R10+1)/R11. A value greater than zero indicate a potential interaction effect.

25
Results
Working technique
Study I When using the wrist-based method, subjects applied higher mean and peak forces (%MVC) to the sides of the mouse than with the other methods (Table 2). Differences between working methods were found in all goniometric variables but the most pronounced differences were the greater extension of the wrist and the lower MPF in flexion/extension movements when using the arm-based method (Table 2). Muscle activity in the right and left trapezius muscles was dependent on working method (Table 2). The highest muscle activity in the trapezius muscles was found when the subjects worked with the arm-based method and the lowest when working with the wrist-based method.
Table 2. Mean differences and the 95% confidence intervals (95% CI) of the differences in physical load between mouse operating methods. Positive values for wrist postures denote extension and ulnar deviation. (% MVC = percentage of maximal voluntary contraction; p 0.50 = 50th percentile of the amplitude probability distribution function; % RVE = percentage of reference voluntary electrical activity).
Physical load Comparison Difference n Mean 95% CI Forces applied to mouse 30 Side mean force (% MVC) Own – wrist-based -0.39 -0.57; -0.22 Own – arm-based 0.08 -0.09; 0.25 Wrist-based – arm-based 0.48 0.31; 0.65 Button mean force (% MVC) Own – wrist-based 0.23 0.11; 0.35 Own – arm-based 0.06 -0.06; 0.19 Wrist-based – arm-based -0.17 -0.29; -0.04 Wrist flexion/extension 29 Mean position (°) Own – wrist-based -0.9 -3.2; 1.4 Own – arm-based -6.8 -9.1; -4.5 Wrist-based – arm-based -5.9 -8.2; -3.6 Mean power frequency (Hz) Own – wrist-based 0.00 -0.10; 0.11 Own – arm-based 0.12 0.01; 0.22 Wrist-based – arm-based 0.11 0.01; 0.22 Wrist radial/ulnar deviation 29 Mean position (°) Own – wrist-based 0.4 -1.1; 1.9 Own – arm-based 0.1 -1.3; 1.6 Wrist-based – arm-based -0.3 -1.7; 1.2 Mean power frequency (Hz) Own – wrist-based -0.02 -0.09; 0.05 Own – arm-based -0.01 -0.08; 0.06 Wrist-based – arm-based 0.01 -0.06; 0.08 Muscle activity (p 0.50) 29 Right trapezius (% RVE) Own – wrist-based 7.2 -2.4; 16.7 Own – arm-based -23.8 -33.3; -14.2 Wrist-based – arm-based -30.9 -40.5; -21.4 Left trapezius (% RVE) Own – wrist-based 5.5 -1.2; 12.2 Own – arm-based -7.3 -14.0; -0.6 Wrist-based – arm-based -12.8 -19.5;-6.1

26
Subjects rated their proximal perceived exertion higher after they had used the arm-based method compared with their own method (mean difference = 4.9; 95% CI 3.1; 6.7) and with the wrist-based method (mean difference = 4.0; 95% CI 2.2; 5.7). Distal perceived exertion was rated highest after working with the wrist-based method compared with their own (mean difference = 4.9; 95% CI 2.4; 7.4) and with the arm-based method (mean difference = 2.0; 95% CI -0.6; 4.5). Subjects rated their own method as most comfortable and the arm-based method as the least comfortable. When using the wrist-based method, the duration to complete the task was longer compared with the subject’s own method (mean difference = 37 seconds; 95% CI 15; 58) and with the arm-based method (mean difference = 26 seconds; 95% CI 5; 48).
Based on the video observations used to characterize each subject’s own method, nine subjects used an arm-based method, seven used a wrist-based method, and 14 used a hybrid method (primarily a wrist-based method where the mouse was not lifted off the mouse pad). When grouping the subjects according to their own method, the muscle activity in the right and left trapezius muscles showed the same pattern as for the arm-based and wrist-based methods (Figure 10).
Figure 10. Box-plot of muscle activity (% RVE) in the right trapezius muscle, grouped by the subjects’ own working method. (p 0.50 = 50th percentile of the amplitude probability distribution function, % RVE = percentage of reference voluntary electrical activity).
Study II In general, subjects classified as having a good working technique tended to have less muscle activity in all measured muscles than did the subjects classified as
Rig
ht tr
apez
ius
p0.5
0 (%
RV
E)
0
10
20
30
40
50
60
70
Arm-based Hybrid Wrist-based
Own method
36
25
6

27
having a poor working technique (Figure 11). In the analysis of EMG gaps and muscular rest the same trend was observed (i.e. subjects with a good working technique had more EMG gaps and muscular rest), though the results were not statistically significant. Subjects with a poor working technique tended to work with their wrist more extended (27±2.3° vs. 20±2.2°; p = 0.08) and ulnar deviated (16±2.7° vs. 10±2.6°; p = 0.13) than subjects with a good working technique. In the other goniometric variables the differences were less pronounced.
Only small differences were observed in RPE and ratings of comfort between subjects with a good and subjects with a poor working technique.
Figure 11. Muscle activity in the extensor digitorum (ED), extensor carpi ulnaris (ECU), trapezius on the side operating the computer mouse (Trapezius Mouse side) and trapezius on the side not operating the computer mouse (Trapezius Non-mouse side) for subjects with good and poor working technique, respectively, presented as medians and the 25th and 75th percentiles and corresponding p-values (Wilcoxon’s rank sum test). (p 0.50 = 50th percentile of the amplitude probability distribution function; % MVE = percentage of maximal voluntary electrical activity, % RVE = percentage of reference voluntary electrical activity).
Study IV There was a higher proportion of subjects reporting high psychological demands and high mental stress who more often worked with lifted shoulders (poor working technique) than of subjects with low demands and low mental stress. The association between psychological demands and working technique was less clear in the multivariate logistic model, but subjects who reported high levels of mental stress more often worked with lifted shoulders (odds ratio = 6.0; 95% CI 1.2; 28.9). However, when present musculoskeletal pain was controlled for in the multivariate model the odds ratio for high mental stress decreased to 4.5 (95% CI 0.9; 23.2).
0
5
10
15
20
25
ED (%MVE) ECU (%MVE) Trapezius Mouseside (%RVE)
Trapezius Non-mouse side
(%RVE)
Mus
cle
activ
ity (p
0.50
)
Good (n=11)
Poor (n=10)
p=0.34p=0.03
p=0.20
p=0.24

28
Sex
Study I The women applied almost twice the force to the button of the mouse, when expressed as % MVC, that the men applied (mean difference = 1.7; 95% CI 0.6; 2.8). No differences between the men and the women were observed when the force was expressed in Newtons. When operating the mouse, the women tended to work with greater extension and greater ulnar deviation in the wrist compared with the men (Figure 12). The women worked with higher muscle activity (% MVE) in the ED than the men (mean difference = 3.7; 95% CI 0.9; 6.5). The differences between the sexes in the left and right trapezius muscles (% RVE) were smaller and no general trends could be observed.
The women performed the task slightly faster (mean difference = 11 seconds; 95 % CI -8; 31) and also produced slightly more errors (mean difference = 0.3; 95 % CI -0.2; 0.8). The mean (and standard deviation [SD]) maximum force the men applied to the button and sides, respectively, of the mouse was 60.4 N (14.9) and 98.6 N (22.2). The mean (SD) maximum force the women applied to the button and sides of the mouse was 41.4 N (6.7) and 64.4 N (9.8), respectively.
Study II The women worked with higher relative muscle activity in the ED muscle compared with the men (6.2±1.6 vs. 5.0±2.4; p = 0.04). No differences between the men and the women were observed in the levels of muscle activity or in EMG gaps or muscular rest for the trapezius muscles or the ECU.
The men tended to work with greater ulnar deviation than women did (Figure 12), but in the other wrist positions and movement variables the differences were small. No differences were observed between the men and the women in RPE or ratings of comfort.
Figure 12. Wrist positions from the laboratory (Study I) and field study (Study II) grouped by sex. Presented as mean position (degrees) and standard error of the mean with corresponding p-values (t-test, two independent groups).
0
5
10
15
20
25
30
35
Lab (study I) Field (study II) Lab (study I) Field (study II)
Extension Ulnar deviation
Posi
tion
(deg
rees
)
MenWomen
p=0.64
p=0.05
p=0.12
p=0.05

29
Time pressure and verbal provocation
Study III The analysis showed significant effects of condition on heart rate, SBP and DBP, but not on the LF/HF ratio (Table 3).
The only force parameter that was affected by condition was the button peak forces (% MVC) applied to the computer mouse (Table 3 and Figure 13). In the other force parameters there was no significant effect of condition, though the force tended to be higher in the stress situation than in the two control situations (Table 3). Muscle activity in the FDI, the ED and the right trapezius muscle were all affected by condition (Table 3). Condition also had a significant effect on MPF and mean velocity of the wrist, both in flexion/extension and in radial/ulnar deviation (Table 3 and Figure 14). The measures of productivity (grip episode duration and speed) were also affected by condition (Table 3 and Figure 15).
Table 3. Means and standard error of the mean (SEM) of the different parameters assessed in the three conditions, giving p-values corresponding to a repeated measure analysis of variance. (% MVC = percentage of maximal voluntary contraction; % MVE = percentage of maximal voluntary electrical activity; % RVE = percentage of reference voluntary electrical activity).
Registration Variable
Control 1 Stress Control 2 p-value Blood pressure (n = 14) Systolic (mmHg) 130 (2.9) 136 (3.5) 128 (2.6) 0.001 Diastolic (mmHg) 82 (1.3) 86 (1.6) 80 (1.3) 0.002 Heart rate parameters (n = 13) Heart rate (beats/minute) 77 (2.6) 82 (2.7) 77 (2.4) 0.04 LF/HF Ratio 1.9 (0.40) 3.0 (0.88) 2.5 (0.57) 0.45 Mood ratings (n = 15) Stress (scale step) 1.7 (0.18) 3.0 (0.25) 1.6 (0.13) <0.0001 Energy (scale step) 3.1 (0.18) 3.4 (0.17) 3.1 (0.20) 0.08 Force applied to computer mouse (n = 15) Side mean force (% MVC) 0.8 (0.08) 0.9 (0.11) 0.7 (0.08) 0.11 Side Peak force (% MVC) 1.3 (0.14) 1.5 (0.19) 1.2 (0.11) 0.12 Button mean force (% MVC) 1.4 (0.14) 1.5 (0.15) 1.4 (0.13) 0.10 Button peak force (% MVC) 3.5 (0.38) 4.2 (0.46) 3.5 (0.33) 0.005 Wrist flexion/extension (n = 14) Mean power frequency (Hz) 0.72 (0.05) 0.96 (0.07) 0.74 (0.04) 0.001 Mean velocity (degrees/second) 16.5 (1.4) 21.9 (1.9) 18.3 (1.8) 0.0002 Wrist radial/ulnar deviation (n = 14) Mean power frequency (Hz) 0.44 (0.03) 0.58 (0.03) 0.41 (0.03) 0.0002 Mean Velocity (degrees/second) 9.9 (0.9) 11.8 (1.1) 11.3 (1.5) 0.0002 Muscle activity (n = 15) First dorsal interosseus (% MVE) 8.7 (2.1) 11.7 (2.8) 10.3 (3.2) 0.0005 Extensor digitorum (% MVE) 7.8 (0.6) 9.7 (0.8) 7.9 (0.6) 0.0002 Right trapezius (% RVE) 28.3 (5.9) 45.1 (10.1) 31.8 (5.6) 0.02 Left trapezius (% RVE) 10.9 (2.8) 20.4 (5.7) 12.9 (2.8) 0.20 Productivity (n = 15) Speed 0.22 (0.01) 0.32 (0.01) 0.26 (0.01) <0.0001 Grip duration (seconds) 3.1 (0.11) 2.2 (0.09) 2.6 (0.08) <0.0001

30
2.5
3
3.5
4
4.5
5
Control 1 Control 2 Stress
Condition
Butto
n pe
ak fo
rce
(% M
VC)
p-value = 0.005
Figure 13. Means ± standard error of the mean of the button peak force (% maximal voluntary contraction) applied to the computer mouse in the different conditions, presented with the p-value corresponding to the repeated measure analysis of variance.
0.2
0.3
0.4
0.5
0.6
0.7
Control 1 Control 2 Stress
Condition
MPF
(Hz)
p-value = 0.0002
Figure 14. Means ± standard error of the mean of the mean power frequency of the wrist in radial/ulnar deviation in the different conditions, presented with the p-value corresponding to the repeated measure analysis of variance.
0.15
0.2
0.25
0.3
0.35
0.4
Control 1 Control 2 Stress
Condition
Spee
d
p-value <0.0001
Figure 15. Means ± standard error of the mean of the speed (ratio between the number of editings and the duration of the task) in the different conditions, presented with the p-value corresponding to the repeated measure analysis of variance.

31
Perceived muscular tension
Study IV Subjects who had perceived muscular tension at least a few times per week the month before the measurement worked with higher muscle activity and less muscular rest in the trapezius muscles compared with subjects who had not perceived muscular tension (Table 4). The same patterns of muscle activity and muscular rest were observed for the subjects who perceived high mental stress during the measurements and subjects who rated high psychological demands during the month preceding the measurement (Table 4).
In the multivariate model with muscle activity in the trapezius muscle on the side operating the computer mouse as the dependent variable, subjects who perceived muscular tension at least a few times per week worked with higher muscle activity (5% RVE; p = 0.05), when controlling for the other explanatory variables in the model. The explained variance (r2) of the model was 0.13.
Table 4. Mean (standard error of the mean) of muscle activity and muscular rest in the trapezius muscles grouped by perceived muscular tension, mental stress and psychological demands. (% RVE = percentage of reference voluntary electrical activity).
Response Explanatory variables Muscular tension Mental stress Psychological demands
No (n = 26)
Yes (n = 31)
Low (n = 45)
High (n = 11)
Low (n = 23)
High (n = 34)
Muscle activity (%RVE), trapezius mouse-side
6.8 (1.6) 12.1 (1.4) 9.2 (1.2) 12.2 (3.1) 8.9 (1.7) 10.3 (1.4)
Muscular rest (% time), trapezius, mouse-side
20.6 (3.4) 13.6 (3.0) 16.3 (2.5) 18.1 (6.0) 17.0 (3.7) 16.7 (2.9)
Muscle activity (%RVE), trapezius, non-mouse side
5.2 (1.0) 11.3 (1.9) 6.6 (0.9) 16.3 (4.3) 6.1 (1.3) 10.2 (1.8)
Muscular rest (% time), trapezius, non-mouse side
22.1 (3.4) 13.6 (2.7) 19.4 (2.5) 9.3 (3.8) 21.8 (3.9) 14.4 (2.4)
Subjects who perceived high mental stress and muscular tension at least a few
times per week worked with higher muscle activity in the trapezius muscle on the side not operating the computer mouse when controlling for the other explanatory variables in the multivariate model (Table 5). Including age or present musculo-skeletal pain in these models did not change the results.
The relative duration of muscular rest in the trapezius muscles was less for subjects who perceived muscular tension at least a few times per week (Table 4). However, in the multivariate models the associations between perceived muscular tension and muscle activity on the mouse operating side and on the non-mouse operating side were not statistically significant (% time –9.0; p = 0.10; r2 = 0.06

32
and % time –7.0; p = 0.16; r2 = 0.14, respectively). No statistically significant (p>0.05) associations were found in any of the other outcome variables (i.e. muscle activity in the forearm or wrist movements). Including age or present musculoskeletal pain in these models did not change the results.
Table 5. Multivariate linear regression model with muscle activity (EMG) in the trapezius muscle on the side not operating the computer mouse as the dependent variable, giving r2 for the full model and the estimates, std error and the p-value for each explanatory variable in the model. (% RVE = percentage of reference voluntary electrical activity). Response Explanatory variable Estimate Std error p-value Muscle activity (% RVE), trapezius, non-mouse side
Muscular tension 5.1 2.5 0.05
(r2 = 0.29) Mental stress
8.0 2.8 0.006
Psychological demands
2.8 2.3 0.2
Organization
0.4 2.4 0.9
Sex
1.5 2.3 0.5
Study V The median follow-up time was 10.9 (range 0-17.5) months and 179 subjects, 103 women and 76 men, developed neck pain during follow-up (Table 6).
Table 6. Number of male and female computer users who developed/did not develop neck pain during follow-up, grouped by the different risk factors. Risk factor Neck pain during follow-up Men (n = 344) Women (n = 327) No (n = 268) Yes (n = 76) No (n = 224) Yes (n = 103) Muscular tension Low 95 20 61 16 Medium 117 29 106 54 High 51 23 55 32 Job strain Low 100 20 44 15 Medium 122 42 117 54 High 39 12 53 32 Physical exposure Low 169 45 103 35 Medium 65 20 63 40 High 28 11 43 22 Age Young (18-34 yrs) 75 23 49 14 Middle (35-44 yrs) 66 26 49 24 Old (45--yrs) 127 27 126 65
Both in men and in women who perceived muscular tension at least a few times
per week compared with men and women who had not perceived muscular tension the preceding month the IRR for developing neck pain was 1.9 (95% CI 1.05; 3.5), in the unadjusted analyses (Table 7). Female respondents with high job

33
strain had an IRR of 1.7 (95% CI 0.95; 3.2) and male respondents with high job strain had an IRR of 1.5 (95% CI 0.74; 3.1) for developing neck pain compared with respondents with low job strain (unadjusted, Table 7).
High perceived muscular tension was associated with an increased risk (IRR 1.6, 95% CI 1.02 ; 2.5), even when controlling for job strain, physical exposure and age in the model stratified by sex (Table 7).
Table 7. Unadjusted and adjusted incidence rate ratios (IRR) for neck pain among male and female computer users, with corresponding 95% confidence intervals (95% CI). Risk factor Men Women Totala, adjusted
IRR (95% CI) IRR (95% CI) IRR (95% CI) Muscular tension Low 1 1 1 Medium 1.2 (0.66; 2.08) 1.7 (0.95; 2.91) 1.3 (0.85; 1.91)b High 1.9 (1.05; 3.48) 1.9 (1.05; 3.49) 1.6 (1.02; 2.48)b Job strain Low 1 1 1 Medium 1.6 (0.93; 2.69) 1.4 (0.77; 2.40) 1.5 (1.02; 2.32)c High 1.5 (0.74; 3.09) 1.7 (0.95; 3.24) 1.5 (0.95; 2.52)c Physical exposure Low 1 1 1 Medium 1.2 (0.73; 2.12) 1.6 (0.99; 2.45) 1.4 (0.99; 2.01)d High 1.5 (0.79; 2.96) 1.4 (0.83; 2.42) 1.3 (0.85; 2.03)d Age Young (18-34 yrs) 1 1 1 Middle (35-44 yrs) 1.3 (0.74; 2.28) 1.6 (0.80; 3.03) 1.4 (0.90; 2.21)e Old (45- yrs) 0.8 (0.45; 1.36) 1.5 (0.85; 2.71) 1.2 (0.79; 1.81)e a Stratified for sex. b Adjusted for physical exposure, job strain and age. c Adjusted for perceived muscular tension, physical exposure and age. d Adjusted for muscular tension, job strain and age. e Adjusted for muscular tension, job strain and physical exposure.
When combining different risk factors, an IRR of 4.0 (95% CI 1.6; 10.0) was
observed for respondents with high perceived muscular tension and high job strain compared to respondents with low perceived muscular tension and low job strain (Table 8, Figure 16). Combining high job strain and high physical exposure resulted in an IRR of 2.7 (95% CI 1.2; 5.9). There were no clear indications of excess risks due to interactions between high perceived muscular tension and high job strain or between high perceived muscular tension and high physical exposure (Table 8). However, for the combination of high job strain and high physical exposure, an excess risk due to interaction of 0.75 was indicated (Table 8).

34
Table 8. Combination of different risk factors for neck pain among male and female computer users, stratified for sex and adjusted for age. Presented as the incidence rate ratio (IRR) with corresponding 95% confidence intervals (95% CI), as well as number of events and censorings. Note that only respondents with low and/or high exposure to the risk factors are included, combinations with medium exposure are excluded. Exposure combination Men and women IRR (95% CI) Events / Censored Excess risk due to
interaction Perceived muscular tension & job strain a
Low tension, low strain 1 7 / 56 High tension, low strain 3.3 (1.1 ; 9.5) 8 / 18 Low tension, high strain 2.5 (0.90 ; 6.8) 9 / 23 High tension, high strain 4.0 (1.6 ; 10.0) 19 / 28 - 0.19 Perceived muscular tension & physical exposure b
Low tension, low physical 1 20 / 90 High tension, low physical 1.7 (0.92 ; 3.3) 23 / 52 Low tension, high physical 0.83 (0.27 ; 2.6) 4 / 17 High tension, high physical 1.9 (0.86 ; 4.2) 12 / 18 0.17 Job strain & physical exposure c Low strain, low physical 1 17 / 89 High strain, low physical 1.1 (0.51 ; 2.5) 14 / 49 Low strain, high physical 0.54 (0.12 ; 2.4) 2 / 15 High strain, high physical 2.7 (1.2 ; 5.9) 15 / 17 0.75 a Adjusted for physical exposure and age. b Adjusted for job strain and age. c Adjusted for perceived muscular tension and age.
Figure 16. Kaplan-Meier survival curve (unadjusted and unstratified) for men and women with high perceived muscular tension and high job strain compared with men and women with low perceived muscular tension and low job strain.

35
Discussion
Evaluation of the model and implications
Based on the results of this work and other recent published studies, a modified model for VDU work and musculoskeletal disorders is proposed (Figure 17).
Figure 17. A model of musculoskeletal disorders and VDU work, modified from Sauter & Swanson (Figure 1) (119). Broken lines denotes modifying effects.
In the first two studies (Studies I and II), it was observed that individual factors such as working methods and working technique affected the physical load in terms of muscle activity, wrist postures and forces applied to the computer mouse. The third study (Study III), support that psychosocial factors, i.e. time pressure and verbal provocation, affect perceptions of mental stress. Mental stress was hypothesized to increase the physical load in terms of muscle activity. In Study III we observed that the physical load increased as a result of mental stress and increased productivity. Besides an increase in muscle activity; increases in the forces applied to the computer mouse and increased repetitiveness of wrist move-ments were also observed. The results of the third study (Study III) also support the path from psychosocial factors to physical load through increased physical demands. The fourth study (Study IV) support an association between perceived muscular tension and physical load. Perceived muscular tension is hypothesized to be an early sign of musculoskeletal symptoms (cf. “detect sensation” in the original model by Sauter & Swanson; Figure 1). It is further hypothesized that perceived muscular tension arises as a result of psychosocial factors, physical load and mental stress, as well as of individual factors, as indicated by the broken
VDU/Office Technology
Individual factors
Psychosocial factors
Physical demands
Physical load
Mental stress
Perceived muscular tension
Musculoskeletal outcomes1
1 symptom reporting/complaints health care utilization disability performance problems
Labelling/ attribution

36
lines in Figure 17. However, observations from prospective studies are necessary to make inferences about the factors causing perceived muscular tension. Another difference between the present model and the original model proposed by Sauter & Swanson (119) is the direct path from mental stress to perceived muscular tension. This association is supported by recent research that has observed mental stress and psychosocial factors to be independent risk factors for neck pain (7; 148). The reason for having a direct path from mental stress to musculoskeletal outcomes, not mediated through physical load, is that the mechanisms behind unspecific musculoskeletal symptoms are not well known. As in the original model by Sauter & Swanson (119), it is hypothesized that when an individual perceives symptoms the reactions (“labelling/attribution”) depend on psycho-logical factors (psychosocial factors, mental stress and individual factors) and these factors determine at least to some extent whether he or she will seek medical advice, be off work, etc. The results from the fifth study (Study V) support an association between perceived muscular tension and neck pain (i.e. musculoskeletal symptoms).
Neither the model proposed here nor the original model by Sauter & Swanson is complete. None of the models takes environmental factors outside of work into account, for example home life factors that could modify perceptions of mental stress. Productivity is an important outcome that is not accounted for in the model and it is not certain that the factors associated with musculoskeletal symptoms are the same as those associated with decreased productivity. Further research is needed to establish which factors cause perceived muscular tension and other possible sensations, such as perceptions of exertion and comfort. The aetiology behind unspecific musculoskeletal symptoms in the neck/shoulder and forearm region is unknown and there is a need for more knowledge regarding the specific mechanisms causing pain in these regions. The indication of an excess risk due to the interaction between physical and psychosocial exposure is another interesting issue for future research, which could modify the proposed model.
Intervention studies may be designed to lower the perceived muscular tension and as a result lower the incidence of neck pain. There may be a need for more interventions at the workplace, which are more specifically addressed to the individual than to the workplace, since the perception of muscular tension prob-ably arises from both workplace factors and individual factors. This issue has been addressed by Holte et al. (48) and Holte & Westgaard (48; 50), who pointed out that there may be a need to assess factors that focus more on the individual translation of the exposure into an individual response than on the more traditional risk factors such as job strain and physical exposure. New intervention strategies focusing on the individual may be an alternative approach in occupations characterized by intense VDU work, which would entail low force requirements but high physical exposure with regard to precision and repetitive demands. Another factor to consider in intervention strategies is working technique in combination with information about the importance of workstation lay-out and psychosocial risk factors. Ketola et al. (76) investigated the effect of

37
an intensive ergonomics approach and education on workstation changes and musculoskeletal disorders among VDU users. Their study was a randomized controlled trial and the subjects were allocated within three different groups, an intensive ergonomics, an ergonomic education and a reference group. After 2 months of follow-up less discomfort was reported by the intensive ergonomics and the ergonomic education groups than by the reference group. The authors concluded that cooperative planning in which both employees and practitioners are actively involved (i.e. participatory ergonomics) will achieve the best results when attempts are made to improve physical ergonomics of VDU workstations. Other intervention studies, though not as well designed as the study by Ketola and colleagues (76), have reported similar results for ergonomic improvements (3; 20; 111). It has also been suggested that office ergonomics programmes may be effective in reducing worker compensation costs and injury rates due to musculoskeletal disorders (92).
Interventions conducted by the occupational health services could also focus on more than one factor in the proposed model. For example, an intervention could comprise optimization of the workplace lay-out (modifying the physical demands) in combination with a feed-back survey of the psychosocial work environment (modifying the psychosocial factors) and individual training focusing on working technique (modifying the individual factors). Following the suggestions by Ketola et al. (76) this should be carried out in co-operation between workers and the occupational health care personnel to achieve the best results. Management support and involvement have also been pointed out as important factors to adress when designing interventions (145). This approach would not add any scientific knowledge, other than knowledge about whether the intervention could decrease musculoskeletal symptoms or perceived muscular tension (or whatever the outcome), but would be a way for the occupational health service to design effective interventions based upon the existing scientific knowledge.
Muscle activity
The general levels of muscle activity, both in the laboratory studies (Studies I and III) and in the field studies (Studies II and IV), were low compared with results from other occupational groups with repetitive work tasks (44), but fairly consistent with results from other studies on computer mouse users both in laboratory and in field settings (2; 4; 15; 28; 56; 71; 75; 91). The frequency of EMG gaps and the relative duration of muscular rest in the trapezius muscles were also fairly consistent with other studies regarding VDU work (16; 57; 112).
In the first laboratory study (Study I) it was observed that different computer mouse operating methods affected the physical load and ratings of perceived exertion and comfort. The arm-based method was distinguished from the other two methods, as subjects worked with higher muscle activity in the right trapezius muscle. The other muscles showed only small differences between methods, at least when looking at group mean levels of muscle activity. Previous studies have also observed that operating the computer mouse without support of the forearm

38
results in increased trapezius muscle activity (2; 75). In Study II, a field study, subjects with a good working technique had less muscle activity in the extensor carpi ulnaris muscle than subjects with a poor working technique. The muscle activity in the extensor digitorum and the trapezius muscles showed similar results, although these results were not statistically significant (p>0.05).
Women worked with higher relative muscle activity in the extensor digitorum muscle, both in the laboratory study (Study I) and in the field study (Study II). This difference was probably due to strength differences between men and women. Therefore, as a result of fixed forces required by the device or by the fixed device geometry, women have to use a greater proportion of their total capacity. Similar results have been reported by Karlqvist et al. (71; 75). In the other muscles examined, the differences between men and women were smaller and no consistent trends were observed.
When working under time pressure and verbal provocation (stress conditions; Study III) the muscle activity increased in the first dorsal interosseus muscle, extensor digitorum muscle and right trapezius muscle, which is in line with previous research (25; 88; 90; 99; 132-134). Several theoretical models have been proposed, including those by Sauter & Swanson (119) and Bongers et al. (17), which are in line with the observed increase in muscle activity due to mental stress.
Subjects who had perceived muscular tension at least a few times per week the month before the measurement worked with higher muscle activity in the left and right trapezius muscles (Study IV). Westgaard and colleagues have used a similar question in their studies and observed associations between perceived general tension and musculoskeletal symptoms in the neck/shoulder region (49; 136). They also observed associations between muscle activity in the trapezius muscle and hourly tension in intra-subject comparisons of low- and high-tension periods over the day (48). However, some of their previous studies failed to find an association between perceived general tension and muscle activity in standardized laboratory settings (9; 10). The opposite finding was reported by Nordander et al. (112). They observed a higher time fraction of muscular rest among office workers with high muscular tension than among office workers without such a tendency. One explanation for the differences between the results in the above studies may be the difference in the assessment of muscular tension. In this work a single-item question was used, while Nordander et al. (112) assessed perceived muscular tension as the number of series of habits experienced (“Do you frequently – hold your breath?; contract your stomach muscles?; raise your shoulders?; sit on the edge of the chair?”, etc) and Westgaard et al. used a visual analogue scale. Another explanation for the differences between the results in the above studies may be the specific task from which the data were collected. Nordander and colleagues (112) used EMG data from desk work which was defined as ”different kinds of office work performed at the desk, not using a computer”, whereas we only used data from computer work (i.e. keyboard and computer mouse tasks).

39
Some studies have observed that muscular rest and EMG gaps (short periods of muscle rest) are associated with a higher risk of musculoskeletal symptoms in the neck/shoulder region (53; 57; 138) but other studies have failed to show this association (59; 137; 143). It has also been discussed if the low levels of muscle activity recorded during light manual and/or VDU work are associated with increased risk of musculoskeletal symptoms, since the levels probably are hard to differentiate from levels during inactive living (143). A recent proposed hypo-thesis is the blood vessel-nociceptor interaction hypothesis by Knardahl (82). The hypothesis pertains to work situations with cognitive tasks and low-level muscle contractions and suggests that blood vessel-nociceptor interactions are of central importance in generating pain. Knardahl’s hypothesis raises the need to rethink the methods and concepts used for studies of myalgia and musculoskeletal symptoms and pain associated with VDU use.
Wrist postures and movements
In the present study operating the computer mouse using different methods, or being classified as having a good or a poor working technique, affected the subjects’ wrist position. In Study I subjects extended their wrist more when using the arm-based method, and in Study II subjects with a poor working technique tended to work with the wrist more extended and ulnar deviated. The difference in wrist posture was probably due to the fact that subjects with a poor working technique supported their forearm to a lesser degree than did subjects with a good working technique. The same appeared to apply to subjects using the arm-based method (no forearm support allowed), which resulted in a more extended wrist.
The mean values of extension differed between the laboratory study (Study I) and the field study (Study II), with the mean positions being ~28° and ~20°, respectively. This difference may be due to the fact that in Study I the keyboard and computer mouse were in fixed positions on the work table and subjects were not allowed to change this setting. In Study II the keyboard and mouse were positioned by the subjects and the researchers did not change anything in the workplace design or settings before the measurements. Another possible explanation is that two different devices were used to assess wrist positions, and previous studies have reported differences in measurement accuracy between the two systems (65; 67).
Electrogoniometers have been shown to be subject to position measurement errors (21; 43; 67). These errors often occur due to crosstalk, which could be described as a phenomenon where movement in one wrist plane (i.e. flexion/ extension) causes a false signal in the other wrist plane (i.e. radial/ulnar deviation). Crosstalk could also be induced by forearm pronation/supination movements, but the results presented here would have been less affected since the subjects did not change their pronation/supination angle when operating the keyboard or the computer mouse. Johnson and co-workers (65) showed that the difference between the device used in the laboratory studies (Studies I and III) and in the field studies (Studies II and IV) could be up to 5º for the wrist postures

40
under observation. An additional possible explanation is that the different calibration procedures of the goniometer systems accounted for the differences in results. In the laboratory study (Study I) the hand was held flat (pressed) in a neutral radial/ulnar position on the work surface, while in the field study (Study II) the calibration was done in a more anatomically neutral posture using the calibration fixture, with the back of the hand aligned with the dorsum of the fore-arm. This small difference has been reported to give differences of up to 7° (67).
Only small differences were found in MPF between different working methods and techniques in the laboratory and field studies (Studies I and II). However, there was a large discrepancy between the mean values, in flexion/extension movements between the laboratory study (0.68 Hz) and the field study (0.29 Hz). The difference in radial/ulnar deviation was less (0.43 Hz and 0.24 Hz, respectively). In a previous study of computer mouse users, the MPF ranged from 0.23 Hz to 0.28 Hz in flexion/extension and from 0.21 Hz to 0.24 Hz in radial/ ulnar deviation (72). The large difference between our laboratory study (Study I), our field study (Study II) and the Karlqvist et al.’s study (72) was probably due to the repetitive nature of the text-editing task. During the text-editing tasks subjects alternated between using the mouse and using the keyboard and the regular periodicity of movements most likely biased the MPF to higher values when compared with less periodic work. Another explanation may be that the difference in MPF values was due to equipment differences between the above-mentioned studies. However, this is most unlikely since the software used to analyse the data in Studies I and II was the same; also, a comparison of our software and the analysis software used in Karlqvist et al.’s study (72), did not show any differences (Jonsson et al., unpublished results).
In our laboratory study (Study I) the women worked with greater wrist extension and greater ulnar deviation than the men. The smaller stature of women and the fixed size of the devices used may explain part of this difference. The fixed size of the keyboard may have caused more outward rotation of the shoulder and ulnar deviation of the wrist and the fixed height of the mouse may have lead to greater wrist extension among the women than among the men. In addition, the position of the keyboard and mouse was fixed on the desk. If the subjects had been allowed to change the position of the keyboard and mouse, the differences may have been smaller. This was indicated in the field study (Study II), where the subjects placed the keyboard and mouse where they found it most appropriate. In that study the general tendency was that men tended to work with their wrist more extended and ulnar deviate more than the women.
The MPF and velocities from the mouse-operating wrist increased in the stress situation compared with the control situations (Study III). This result could be expected since subjects worked faster, though this may have some practical implications since MPF has been associated with higher prevalence of musculo-skeletal disorders in female industrial workers (42). The mean MPF values during the control situations in our study were high compared with those in other studies of VDU work (72). The higher values of MPF, both in flexion/extension and in

41
radial/ulnar deviation, in this study were probably due to the repetitive nature of the text-editing task. However, there was an increase in MPF of about 0.2 Hz in flexion/extension and of about 0.15 Hz in radial/ulnar deviation. In a study of industrial workers with repetitive tasks, in which an exposure-response relation was observed between wrist movements (MPF) and musculoskeletal wrist/hand disorders, the difference in MPF between the high and low exposure groups was about 0.25 Hz (42). This may imply that VDU users working under stressful conditions, for example time pressure, may have an increased risk of developing wrist/hand disorders. However, in our second field study (Study IV) no associations between wrist movements (MPF) and mental stress or psychological demands were observed.
Forces applied to the computer mouse
The forces applied to the sides of the mouse were the most sensitive force variables for detecting differences between working methods. In a study by Johnson et al. (64), the forces applied to the sides of the mouse when performing a similar text-editing task to ours was found to have a high correlation with regular work (r = 0.89).
In our study, women applied higher forces to the computer mouse when expressed as % MVC. Similar results have been reported by Johnson et al. (64). This may relate both to the lower muscle strength among women and to anthropometrical differences which influence biomechanical loads. A fixed button actuation force in combination with strength differences is one probable explanation why women apply more relative force (% MVC) than men. Another reason could be that women have smaller hands, which results in higher relative exertion levels in gripping the mouse.
The peak forces applied to the button of the computer mouse increased by 0.7% MVC during the stress situation compared with the control situations. Despite the difference in speed/productivity, since there was only a small difference in applied force between the two control situations the increase in applied force observed in the stress situation was most likely an effect of mental stress. Whether the increase in applied force (0.7% MVC) during the stress situation has any clinical relevance is uncertain. The increase in applied force to the computer mouse may also explain some of the increase in muscle activity in the hand and forearm (i.e. the FDI and ED muscles) and possibly also some of the increased muscle activity in the trapezius muscle.
Whether the forces applied to the sides and button of the computer mouse is associated with increased risk for developing musculoskeletal symptoms is not known. A previous study has shown that prolonged computer mouse work could lead to fatigue of the forearm muscles (63). It has also been observed that subjects with more severe musculoskeletal symptoms apply higher force while key-boarding (30). Blangsted et al. (16) studied VDU users in a department at a municipal administration and reported the mean hourly number of mouse clicks to be 230 and the mean hourly number of keystrokes to 1 960. In a sub-group of the
42
NUDATA-cohort the keying speed in the 75 percentile was measured to be from 8 000 to 22 000 keystrokes/hour (6). This indicates a large between-subject variability in keying speed and number of keystrokes performed. It is also reasonable to believe that the number of mouse clicks varies to a large extent, depending on occupation, work task and the software used to carry out the work task. The combination of high repetitiveness in the fingers and wrist, the static loading imposed on the thumb to grip the mouse, the prolonged extension and ulnar deviation of the wrist and the long duration may all be contributing to the development of musculoskeletal symptoms in the forearm and hand/wrist. Several studies have also found an increased risk for hand/wrist symptoms among individuals with long daily duration of VDU and computer mouse use (55; 58; 103; 117).
Ratings of perceived exertion and comfort
In our first laboratory study (Study I), there were differences in RPE between the working methods. By contrast, in the field study (Study II) only minor differences were observed between subjects with a good and subjects with a poor working technique. In the experimental setting (Study I) subjects performed movements (working methods) that they were not used to, which may be one explanation for the differences in RPE between the working methods. In Study II the subjects used their normal working technique and possibly the data collection time was too short or the groups too small to distinguish between the two groups. It should also be noted that two different methods of assessing perceived exertion were used, the Borg 0-14 scale and the Borg CR-10 scale. However, rather than the different rating scales, it is the factors given above that are likely to have caused the discrepancy between the studies. A recent paper observed good agreement between ratings of comfort and perceived exertion on the one hand and observations of workplace lay-out and working postures on the other hand (94). The authors suggested that ratings of comfort and perceived exertion could be used as screening tools by occupational health practitioners to identify high-exposure groups concerning poor workplace lay-out and poor working postures among VDU users.
Perceived muscular tension
An IRR of 1.6 was observed for respondents with high perceived muscular tension when controlling for other factors. If the work environment is characterized by high job strain and the risk of developing neck pain is greater among individuals who react with muscular tension than among those who do not, perceived muscular tension would be considered an intermediate or early sign of neck pain.
The combination of high perceived muscular tension and high job strain resulted in a higher risk estimate than the combination of perceived muscular tension and physical exposure (IRR 4.0 and 1.9, respectively). This may suggest

43
that the psychosocial exposure is more important than the physical exposure when work is characterized by low force requirements, as has also been suggested by others (50; 115). In the present study physical exposure was not an independent risk factor for development of neck pain. The items used for describing the physical exposure were amount of precision and repetitive work. The way the different questions were asked and the construction of the variable physical exposure suggest that it could be associated with hours/day of VDU work. A post hoc analysis of the association between hours/day of VDU work and physical exposure also showed a positive correlation (Spearman’s rank correlation coefficient 0.49; p<0.0001). In another prospective study of VDU users the same lack of association between musculoskeletal symptoms in the neck and daily hours of VDU work was observed (103). However, there are dimensions of the physical working environment other than the hours/day of VDU work that are considered to be risk factors for neck pain, such as absence of arm support, height of the keyboard in relation to elbow height, the height of the monitor, and lighting conditions (3; 103).
A possible interaction was found for co-exposure between high job strain and high physical exposure, indicated by an excess risk attributable to interaction of 0.75. There are few studies that have investigated possible interaction effects between physical and psychosocial exposure and increased risk for musculo-skeletal symptoms. However, Devereux and co-workers (24) observed a potential interaction between high psychosocial and high physical exposure in a cross-sectional study of both blue-collar and white-collar workers, which further increased the risk of musculoskeletal symptoms in the upper extremities. Wigaeus Tornqvist et al. (147) reported an indication of an excess risk due to the inter-action between job strain and VDU work for seeking care because of neck or shoulder disorders.
Methodological considerations and study designs
The first four studies (Studies I-IV) were all cross-sectional, thus making causal inferences about the different associations impossible. In Study V causal inferences were possible because of the study’s prospective design.
One major consideration with the two laboratory studies (Studies I and III) and the two field studies (Studies II and IV) is the relatively short duration of data collection. In the two laboratory studies this was not that great a concern, since the studies were explorative. In the two field studies the data collection time was 15 minutes, with 13 minutes used in the data analysis (the first and last minute were excluded). In general the subjects performed their ordinary work at their ordinary workstations. The way individuals operate their keyboard and input device during the course of a working day is not believed to vary to a great extent. Still, it could be questioned how well these measures mirror the mean daily exposure, since the variation over the day is unknown. A recently published paper compared the efficiency of different exposure assessment strategies regarding trapezius muscle activity and found the common strategy of consecutive sampling

44
for short periods within tasks to be inefficient (106). The authors have presented a decision algorithm for determining appropriate sampling strategies in different types of jobs.
It has been observed that the postures of VDU operators is quite stable over time and that between-subject variability in this regard is larger than within-subject variability (114). The force subjects apply to the computer mouse does not vary between hours or between days, indicating that the force a VDU user applies to the mouse can be characterized in 1 day during any hour of the day (64). Furthermore, the force applied during a similar text-editing task as we used in our laboratory studies (Studies I and III) correlated moderately to strongly with the forces applied during regular work (64).
In our first field study (Study II), a sum of scores was calculated from the different items included in the instrument used to assess working technique. This was because of the design of the study, whose aim was to compare an overall assessment of working technique with direct measurements of the physical load. A disadvantage of this method is that the impact of each item was not evaluated so that two identical scores could have had different profiles. In the second field study (Study IV) two items were used as a proxy for working technique. The rationale behind this was to use a simple approach and also, the fact that the item “work with lifted shoulders” was believed to possibly be associated with the independent variables perceived muscular tension, psychological demands and mental stress.
Two different ways of treating the rating of psychological demands were used in Studies IV and V. In Study IV the data were treated as ordinal data, and the median response was used as a cut-off for low/high exposure. In the prospective study (Study V) a sum of the scores was calculated and then the group median was used as a cut-off for low/high exposure. In previous studies using the same type of questions and instruments researchers have treated the data either as ordinal data (5; 23; 24) or used the method of calculating a sum of scores (7; 74). One disadvantage with the method of calculating a sum of scores and use the group median, or percentiles as cut-off points is that it is hard to compare results between studies since these cut-off points varies between studies.
In Study III the order of the two different situations was not randomized. The increases in physiological and psychological reactions and physical load during the stress situation could have been an effect of subjects working faster or an effect of time or learning. Based on decreases in grip episode duration and increases in speed/productivity, part of the increases in the physiological parameters could be attributed to the fact that subjects worked faster in the stress situation than in the control situations. The productivity increase was approximately the same between the three registrations, with the greatest productivity in the stress situation. However, the magnitude of the differences in physiological parameters between the first and second control situation was much less than that observed between control and stress situations. Therefore, this indicates that some of the increase in the physiological parameters was stress-

45
related. Heart rate and systolic blood pressure were probably affected only by stress while the other physiological measures (EMG, forces and wrist movements) were probably affected by both stress and speed/productivity. Kohlisch & Schaefer (83) concluded that the impact of motor activity on cardiac parameters (heart rate and blood pressure) may be neglected during common computer tasks (i.e. keystrokes at intervals of 300 ms or longer).
The response rate in the baseline questionnaire was 84% in Study V and must be considered fairly good. However, 31% of the men and 58% of the women who answered the baseline questionnaire reported neck pain, and were not included in the present study. This could have biased the results towards an under-estimation of the incidence rates (i.e. healthy worker effect) since the participants in the study could have been less prone to develop neck pain than those who had neck pain at baseline. In addition to this, individuals who were already on long-term sick leave at baseline were not included in the study. Women had almost a twofold prevalence of neck pain compared with men at baseline and this could lead to an underestimation of incidence rates among the women compared with the men, as well as an underestimation of the risk estimates among the women. It is therefore important to distinguish between the sexes in future studies. Another limitation of the study was the inclusion of individuals with prior experience of VDU work. However, it will be difficult to solve this problem since exposure to VDU use starts in childhood. In a cohort of young information technology users, the mean age at starting to use VDUs was 12 years (unpublished data).
Possible confounding factors not controlled for in the multivariate analyses could be previous history of neck pain (34; 35) and duration of computer work (117), which in previous studies have been observed to be risk factors. If per-ceived muscular tension is more common among individuals with a previous history of neck pain the observed risk estimates for perceived muscular tension may be overestimated. The results in the present study are based on both self-reported exposures at baseline and self-reported symptoms during follow-up, which could have led to either underestimation or overestimation of the risk estimates. However, in a paper from Toomingas and colleagues (131) it is concluded that there is no support for the idea of a bias to the relative risk estimates when subjects rate both the exposure and the outcome. The different exposure variables were assessed at baseline and there may have been a risk that some of the exposure variables as well as perceived muscular tension changed during the follow-up period.

46
Conclusions
General conclusion
The physical load during VDU work is affected by psychosocial and individual factors as well as physical demands. VDU users who perceives muscular tension at least a few times per week appear to have an increased risk of developing neck pain.
Specific conclusions
In the present study: - Different computer mouse operating methods affected the physical load;
use of forearm support during computer mouse use decreased the physical load.
- It was indicated that subjects classified as having a good working technique work with less physical load than do subjects with a poor working technique.
- Women worked with higher muscle activity in the extensor digitorum muscle and applied higher force to the computer mouse, relative to their maximal capacity, during computer mouse work.
- Work under time pressure and verbal provocation (stress conditions) resulted in a higher overall physical load and increased physiological and psychological reactions compared with control conditions.
- Perceived muscular tension and mental stress were associated with physical load during VDU work.
- Perceived muscular tension was associated with an increased risk of developing neck pain among VDU users. An excess risk due to interaction between high physical exposure and high job strain was indicated .The results also suggest that the combination of high job strain and high perceived muscular tension was associated with higher risk of developing neck pain than was the combination of high physical exposure and high perceived muscular tension.

47
Future research
With the proposed model as a framework, future research activities should aim to determine factors that cause perceived muscular tension and other factors, such as comfort and perceived exertion, which potentially could be early signs of musculoskeletal symptoms. There is also a need to explore and validate the question we have used to assess perceived muscular tension. Future research should also aim at determining whether working technique predicts musculo-skeletal symptoms among VDU users.
The possible interaction effect from physical and psychosocial exposure should be taken into consideration when designing prospective studies so that proper analyses can be performed with enough statistical power.

48
Summary
Physical load, psychosocial and individual factors in visual display unit work. Arbete och Hälsa 2003:10
The overall aim of this thesis was to explore associations between physical load, psychosocial and individual factors in visual display unit (VDU) work. Furthermore, the aim was to investigate whether perceived muscular tension is a predictor of neck pain among VDU operators. The thesis is based upon five separate studies, two laboratory studies, two field studies and one prospective cohort study.
Several different methods were used to assess the physical load. Electromyo-graphy (EMG) was used to record muscle activity. Wrist postures and movements were assessed by means of electrogoniometers. An instrumented computer mouse was used to measure the forces applied to the computer mouse. Working technique was assessed with an observation protocol. Perceived exertion, comfort, mental stress and perceived muscular tension were assessed with questionnaires.
The results of this work are discussed in relation to a proposed model for VDU work and musculoskeletal symptoms. The first two studies (Studies I and II) support an association between individual factors (working technique and sex) and the physical load. In Study III we observed that the physical load increased as a result of mental stress and increased productivity. Besides an increase in muscle activity; increases in the forces applied to the computer mouse and increased repetitiveness of wrist movements were also observed. The results from the third study also support an association between psychosocial factors and physical load through increased physical demands. The fourth study (Study IV) supports an association between perceived muscular tension and physical load and perceived muscular tension is hypothesized to be an early sign of musculoskeletal symptoms. In Study V an increased risk of developing neck pain was observed among subjects who perceived high muscular tension, even when controlling for job strain, physical exposure and age.
It is concluded that the physical load during VDU work is affected by psychosocial and individual factors as well as physical demands. VDU users who perceives muscular tension at least a few times per week appear to have an increased risk of developing neck pain.
Key words: computer work, musculoskeletal symptoms, working technique, psychosocial factors, physical load, muscular tension, mental stress

49
Sammanfattning (Summary in Swedish)
Physical load, psychosocial and individual factors in visual display unit work. Arbete och Hälsa 2003:10
Det övergripande syftet med denna avhandling var att undersöka eventuella samband mellan fysisk belastning, psykosociala och individuella faktorer vid datorarbete. Vidare var målsättningen att undersöka om upplevd muskelspänning föregår smärta i nack- skulderregionen. Avhandlingen baseras på fem separata studier, två experimentiella studier, två fältstudier och en prospektiv kohortstudie.
Den fysiska belastningen registrerades med flera olika metoder. Elektromyo-grafi (EMG) användes för att mäta muskelaktivitet. Handledsställningar och handledsrörelser registrerades med elektrogoniometrar. En instrumenterad dator-mus användes för att mäta hur hårt deltagarna tryckte på datormusen. Arbetsteknik observerades med hjälp av observationsprotokoll. Studiedeltagarna skattade sina upplevelser av muskelspänning, ansträngning, komfort och mental stress.
Resultaten från avhandlingen diskuteras i relation till en föreslagen modell för datorarbete och muskuloskeletala symtom. Resultaten från de två första studierna visade att individuella faktorer, i det här fallet arbetsteknik och kön, påverkade den fysiska belastningen. I den tredje studien observerades att mental stress och ökad produktivitet ledde till ökad fysisk belastning. Det innebar inte bara en ökning av muskelaktivitet utan även en ökning av kraften som applicerades på datormusen och repitiviteten i handledsrörelserna. Resultaten från den tredje studien stöder ett samband mellan psykosociala faktorer och fysisk belastning. I den fjärde studien observerades samband mellan fysisk belastning och upplevd muskelspänning. I det sista delarbetet visade resultaten på en ökad risk för muskuloskeletala symtom i nack- skulderregionen hos personer som upplevt muskelspänning minst några gånger i veckan den senaste månaden.
Sammanfattningsvis visar avhandlingen att den fysiska belastningen vid datorarbete påverkas av både psykosociala och individuella faktorer såväl som av fysiska krav. Personer med datorarbete som upplever muskelspänning minst ett par gånger i veckan verkar löpa ökad risk att utveckla muskuloskeletala symtom i nacke-skuldra.
Nyckelord: datorarbete, muskuloskeletala symtom, arbetsteknik, psykosociala faktorer, fysisk belastning, muskelspänning, mental stress

50
Acknowledgements
I would like to thank everyone who has contributed to the work presented here and especially:
Mats Hagberg, my main supervisor and head of the department of Occupational Medicine. Excellent coaching!
Roland Kadefors, my assistant supervisor. For your valuable advice and friendly support.
Pete Johnson, my co-author and friend. For the many fruitful discussions and your encouragement through the years.
Agneta Lindegård, co-author, co-worker and friend. These years would not have been the same without you.
Per Jonsson, co-author, co-worker and friend. For all the stimulating discussions in the Ergofyslab and also the more philosophical ones in your back yard.
Joakim Svensson, co-author and friend. For all the fun we have had.
Christina Ahlstrand, Lotta Dellve, Mats Eklöf, Ewa Gustafsson, Catarina Karlberg, Ann-Sofie Liljenskog Hill, Linda Nordling Nilsson, Katrin Skagert, Sara Thomée, Ulrika Wedberg, Gunilla Öberg and all my other colleagues and friends at Occupational and Environmental Medicine, Göteborg.
My co-authors: Gunnar Ahlborg, Anna Ekman, Gert-Åke Hansson, David Rempel, Allan Toomingas and Ewa Wigaeus Tornqvist.
The Swedish Council for Working Life and Social Research for financial support.
My parents, Rune and Yvonne, for all your support through the years.
Dan and Lii, my brother and sister; for being there whenever needed.
Vickan, Jonathan and Albin, my family – you are the best!

51
References
1. (1997). Checklist for observations and measurements of working conditions at computer work stations. National Institute for Working Life, Stockholm. Available: http://www.arbetslivsinstitutet.se/datorarbete/hjalpmedel_en.asp [2003, 30/9].
2. Aarås A, Fostervold KI, Ro O, Thoresen M & Larsen S (1997) Postural load during VDU work: a comparison between various work postures. Ergonomics, 40(11), 1255-68.
3. Aarås A, Horgen G, Bjørset HH, Ro O & Walsøe H (2001) Musculoskeletal, visual and psychosocial stress in VDU operators before and after multidisciplinary ergonomic interventions. A 6 years prospective study--Part II. Appl Ergon, 32(6), 559-71.
4. Aarås A & Ro O (1997) Workload when using a mouse as a input device. Int J Hum Comput Interaction, 9(2), 105-18.
5. Andersen JH, Kaergaard A, Frost P, Thomsen JF, Bonde JP, Fallentin N, Borg V & Mikkelsen S (2002) Physical, psychosocial, and individual risk factors for neck/shoulder pain with pressure tenderness in the muscles among workers performing monotonous, repetitive work. Spine, 27(6), 660-7.
6. Andersen JH, Thomsen JF, Overgaard E, Lassen CF, Brandt LPA, Vilstrup I, Kryger AI & Mikkelsen S (2003) Computer Use and Carpal Tunnel Syndrome: A 1-Year Follow-up Study. JAMA, 289(22), 2963-2969.
7. Ariens GA, Bongers PM, Hoogendoorn WE, Houtman IL, van der Wal G & van Mechelen W (2001) High quantitative job demands and low coworker support as risk factors for neck pain: results of a prospective cohort study. Spine, 26(17), 1896-901.
8. Ariens GA, van Mechelen W, Bongers PM, Bouter LM & van der Wal G (2001) Psychosocial risk factors for neck pain: a systematic review. Am J Ind Med, 39(2), 180-93.
9. Bansevicius D, Westgaard RH & Jensen C (1997) Mental stress of long duration: EMG activity, perceived tension, fatigue, and pain development in pain-free subjects. Headache, 37(8), 499-510.
10. Bansevicius D, Westgaard RH & Sjaastad OM (1999) Tension-type headache: pain, fatigue, tension, and EMG responses to mental activation. Headache, 39(6), 417-25.
11. Barna I, Keszei A & Dunai A (1998) Evaluation of Meditech ABPM-04 ambulatory blood pressure measuring device according to the British Hypertension Society protocol. Blood Press Monit, 3(6), 363-68.
12. Bergqvist U, Wolgast E, Nilsson B & Voss M (1995) Musculoskeletal disorders among visual display terminal workers: individual, ergonomic, and work organizational factors. Ergonomics, 38(4), 763-76.
13. Bernard B, Sauter S, Fine L, Petersen M & Hales T (1994) Job task and psychosocial risk factors for work-related musculoskeletal disorders among newspaper employees. Scand J Work Environ Health, 20(6), 417-26.
14. Bernard BP ed. (1997) Musculoskeletal Disorders and Workplace Factors: a critical review of epidemiological evidence for work-related musculoskeletal disorders of the neck, uper extremity, and low back. 2nd ed. Cincinnati: National Institute for Occupational Safety and Health (NIOSH).
15. Birch L, Juul-Kristensen B, Jensen C, Finsen L & Christensen H (2000) Acute response to precision, time pressure and mental demand during simulated computer work. Scand J Work Environ Health, 26(4), 299-305.
16. Blangsted AK, Hansen K & Jensen C (2003) Muscle activity during computer-based office work in relation to self-reported job demands and gender. Eur J Appl Physiol, 89(3-4), 352-8.

52
17. Bongers PM, de Winter CR, Kompier MA & Hildebrandt VH (1993) Psychosocial factors at work and musculoskeletal disease. Scand J Work Environ Health, 19(5), 297-312.
18. Bongers PM, Kremer AM & ter Laak J (2002) Are psychosocial factors, risk factors for symptoms and signs of the shoulder, elbow, or hand/wrist?: A review of the epidemiological literature. Am J Ind Med, 41(5), 315-42.
19. Borg G (1990) Psychophysical scaling with applications in physical work and the perception of exertion. Scand J Work Environ Health, 16(Suppl 1), 55-8.
20. Brisson C, Montreuil S & Punnett L (1999) Effects of an ergonomic training program on workers with video display units. Scand J Work Environ Health, 25(3), 255-63.
21. Buchholz B & Wellman H (1997) Practical operation of a biaxial goniometer at the wrist joint. Hum Factors, 39, 119-29.
22. Carayon P, Smith MJ & Haims MC (1999) Work organization, job stress, and work-related musculoskeletal disorders. Hum Factors, 41(4), 644-63.
23. Devereux JJ, Buckle PW & Vlachonikolis IG (1999) Interactions between physical and psychosocial risk factors at work increase the risk of back disorders: an epidemiological approach. Occup Environ Med, 56(5), 343-53.
24. Devereux JJ, Vlachonikolis IG & Buckle PW (2002) Epidemiological study to investigate potential interaction between physical and psychosocial factors at work that may increase the risk of symptoms of musculoskeletal disorder of the neck and upper limb. Occup Environ Med, 59(4), 269-77.
25. Ekberg K, Eklund J, Tuvesson M-A, Örtengren R & Ericson M (1995) Psychological stress and muscle activity during data entry at visual display units. Work & Stress, 9(4), 475-90.
26. Ekman A, Andersson A, Hagberg M & Wigaeus Hjelm E (2000) Gender differences in musculoskeletal health of computer and mouse users in the Swedish workforce. Occup Med (Lond), 50(8), 608-13.
27. Faucett J & Rempel D (1994) VDT-related musculoskeletal symptoms: interactions between work posture and psychosocial work factors. Am J Ind Med, 26(5), 597-612.
28. Fernström E & Ericson MO (1997) Computer mouse or Trackpoint--effects on muscular load and operator experience. Appl Ergon, 28(5-6), 347-54.
29. Feuerstein M (1996) Workstyle: definition, empirical support, and implications for prevention, evaluation, and rehabilitation of occupational upper-extremity disorders. In: Moon SD & Sauter SL eds. Beyond biomechanics: psychosocial aspects of musculoskeletal disorders in office work. Pp 177-206, London: Taylor & Francis.
30. Feuerstein M, Armstrong T, Hickey P & Lincoln A (1997) Computer keyboard force and upper extremity symptoms. J Occup Environ Med, 39(12), 1144-53.
31. Fogleman M & Brogmus G (1995) Computer mouse use and cumulative trauma disorders of the upper extremities. Ergonomics, 38(12), 2465-75.
32. Forsman M, Birch L, Zhang Q & Kadefors R (2001) Motor unit recruitment in the trapezius muscle with special reference to coarse arm movements. J Electromyogr Kinesiol, 11(3), 207-16.
33. Forsman M, Kadefors R, Zhang Q, Birch L & Palmerud G (1999) Motor-unit recruitment in the trapezius muscle during arm movements and in VDU precision work. Int J Ind Ergonomics, 24, 619-30.
34. Fredriksson K, Alfredsson L, Köster M, Bildt Thorbjörnsson C, Toomingas A, Torgén M & Kilbom Å (1999) Risk factors for neck and upper limb disorders: results from 24 years of follow up. Occup Environ Med, 56(1), 59-66.
35. Gerr F, Marcus M, Ensor C, Kleinbaum D, Cohen S, Edwards A, Gentry E, Ortiz DJ & Monteilh C (2002) A prospective study of computer users: I. Study design and incidence of musculoskeletal symptoms and disorders. Am J Ind Med, 41(4), 221-35.
36. Greene WB & Heckman JD eds. (1994) The clinical measurement of joint motion. 1st ed. Rosemont: American Academy of Orthopaedic Surgeons.

53
37. Gustafsson E & Hagberg M (2003) Computer mouse use in two different hand positions: exposure, comfort, exertion and productivity. Appl Ergon, 34(2), 107-13.
38. Hagberg M (1981) On evaluation of local muscular load and fatigue by electromyography. Doctoral thesis, Arbete och Hälsa 1981:24. Solna: National Board of Occupational Safety and Health.
39. Hagberg M (1984) Occupational musculoskeletal stress and disorders of the neck and shoulder: a review of possible pathophysiology. Int Arch Occup Environ Health, 53(3), 269-78.
40. Hagberg M, Silverstein B, Wells R, Smith MJ, Hendrick HW, Carayon P & Pérusse M (1995) Work related musculoskeletal disorders (WMSDs): a reference book for prevention. London: Taylor & Francis.
41. Hagner IM & Hagberg M (1989) Evaluation of two floor-mopping work methods by measurement of load. Ergonomics, 32(4), 401-8.
42. Hansson G-Å, Balogh I, Ohlsson K, Pålsson B, Rylander L & Skerfving S (2000) Impact of physical exposure on neck and upper limb disorders in female workers. Appl Ergon, 31(3), 301-10.
43. Hansson G-Å, Balogh I, Ohlsson K, Rylander L & Skerfving S (1996) Goniometer measurement and computer analysis of wrist angles and movements applied to occupational repetitive work. J Electromyogr Kinesiol, 6(1), 23-35.
44. Hansson G-Å, Nordander C, Asterland P, Ohlsson K, Strömberg U, Skerfving S & Rempel D (2000) Sensitivity of trapezius electromyography to differences between work tasks - influence of gap definition and normalisation methods. J Electromyogr Kinesiol, 10(2), 103-15.
45. Hansson Risberg E, Wigaeus Tornqvist E, Hagberg M, Hagman M, Isaksson A, Karlqvist L & Toomingas A (2001) Bedömning av arbetsförhållanden vid datorarbete med hjälp av en ergonomisk checklista [In Swedish]. Arbetslivsrapport 2001:13, Stockholm: National Institute for Working Life.
46. Haufler AJ, Feuerstein M & Huang GD (2000) Job stress, upper extremity pain and functional limitations in symptomatic computer users. Am J Ind Med, 38(5), 507-15.
47. Henneman E, Somjen G & Carpenter DO (1965) Excitability and inhibitability of motoneurons of different sizes. J Neurophysiol, 28(3), 599-620.
48. Holte KA, Vasseljen O & Westgaard RH (2003) Exploring perceived tension as a response to psychosocial work stress. Scand J Work Environ Health, 29(2), 124-33.
49. Holte KA & Westgaard RH (2002) Daytime trapezius muscle activity and shoulder-neck pain of service workers with work stress and low biomechanical exposure. Am J Ind Med, 41, 393-405.
50. Holte KA & Westgaard RH (2002) Further studies of shoulder and neck pain and exposures in customer service work with low biomechanical demands. Ergonomics, 45(13), 887-909.
51. Huang GD, Feuerstein M & Sauter SL (2002) Occupational stress and work-related upper extremity disorders: concepts and models. Am J Ind Med, 41, 298-314.
52. Hägg GM (1991) Static work load and occupational myalgia: a new explanation model. In: Andersen PA, Hobart DJ & Danoff JV eds. Electromyographical Kinesiology. Pp 141-4, Amsterdam: Elsevier.
53. Hägg GM & Åström A (1997) Load pattern and pressure pain threshold in the upper trapezius muscle and psychosocial factors in medical secretaries with and without shoulder/neck disorders. Int Arch Occup Environ Health, 69(6), 423-32.
54. Hägg GM, Öster J & Byström S (1997) Forearm muscular load and wrist angle among automobile assembly line workers in relation to symptoms. Appl Ergon, 28(1), 41-7.
55. Jensen C (2003) Development of neck and hand-wrist symptoms in relation to duration of computer use at work. Scand J Work Environ Health, 29(3), 197-205.

54
56. Jensen C, Borg V, Finsen L, Hansen K, Juul-Kristensen B & Christensen H (1998) Job demands, muscle activity and musculoskeletal symptoms in relation to work with the computer mouse. Scand J Work Environ Health, 24(5), 418-24.
57. Jensen C, Finsen L, Hansen K & Christensen H (1999) Upper trapezius muscle activity patterns during repetitive manual material handling and work with with a computer mouse. J Electromyogr Kinesiol, 9(5), 317-25.
58. Jensen C, Finsen L, Søgaard K & Christensen H (2002) Musculoskeletal symptoms and duration of computer and mouse use. Int J Ind Ergonomics, 30, 265-75.
59. Jensen C, Nilsen K, Hansen K & Westgaard RH (1993) Trapezius muscle load as a risk indicator for occupational shoulder- neck complaints. Int Arch Occup Environ Health, 64(6), 415-23.
60. Johansson H & Sojka P (1991) Pathophysiological mechanisms involved in genesis and spread of muscular tension in occupational muscle pain and in chronic musculoskeletal pain syndromes: a hypothesis. Med Hypotheses, 35(3), 196-203.
61. Johansson JA (1995) Psychosocial work factors, physical work load and associated musculoskeletal symptoms among home care workers. Scand J Psychol, 36(2), 113-29.
62. Johansson JA & Rubenowitz S (1994) Risk indicators in the psychosocial and physical work environment for work-related neck, shoulder and low back symptoms: a study among blue- and white-collar workers in eight companies. Scand J Rehabil Med, 26(3), 131-42.
63. Johnson PW (1998) The development, characterization and implementation of a technique to measure muscle fatigue during computer use. Doctoral thesis, University of California, Berkeley.
64. Johnson PW, Hagberg M, Hjelm EW & Rempel D (2000) Measuring and characterizing force exposures during computer mouse use. Scand J Work Environ Health, 26(5), 398-405.
65. Johnson PW, Jonsson P & Hagberg M (2002) Comparison of measurement accuracy between two wrist goniometer systems during pronation and supination. J Electromyogr Kinesiol, 12(5), 413-20.
66. Jonsson B (1982) Measurement and evaluation of local muscular strain in the shoulder during constrained work. J Hum Ergol, 11, 73-88.
67. Jonsson P & Johnson PW (2001) Comparison of measurement accuracy between two types of wrist goniometer systems. Appl Ergon, 32(6), 599-607.
68. Juul-Kristensen B, Hansson G-Å, Fallentin N, Andersen JH & Ekdahl C (2001) Assessment of work postures and movements using a video-based observation method and direct technical measurements. Appl Ergon, 32(5), 517-24.
69. Kadefors R, Forsman M, Zoega B & Herberts P (1999) Recruitment of low threshold motor-units in the trapezius muscle in different static arm positions. Ergonomics, 42(2), 359-75.
70. Karasek R & Theorell T (1990) Healthy work. New York: Basic Books.
71. Karlqvist L, Bernmark E, Ekenvall L, Hagberg M, Isaksson A & Rostö T (1999) Computer mouse and track-ball operation: Similarities and differences in posture, muscular load and perceived exertion. Int J Ind Ergonomics, 23, 157-69.
72. Karlqvist L, Hagberg M, Hansson G-Å, Huldt Mattson G, Neelakantan G, Skantze C, Tegelius B & Waldenström M (1995) Good working environments for graphics industry VDU operators using a computer mouse. [In Swedish]. Arbete och Hälsa 1995:17, Solna: National Institute for Working Life.
73. Karlqvist L, Hagberg M, Köster M, Wenemark M & Ånell R (1996) Musculoskeletal Symptoms among Computer-assisted Design (CAD) Operators and Evaluation of a Self-assessment Questionnaire. Int J Occup Environ Health, 2(3), 185-94.
74. Karlqvist L, Wigaeus Tornqvist E, Hagberg M, Hagman M & Toomingas A (2002) Self-reported working conditions of VDU operators and associations with musculoskeletal symptoms: a cross-sectional study focussing on gender differences. Int J Ind Ergonomics, 30, 277-94.

55
75. Karlqvist LK, Bernmark E, Ekenvall L, Hagberg M, Isaksson A & Rostö T (1998) Computer mouse position as a determinant of posture, muscular load and perceived exertion. Scand J Work Environ Health, 24(1), 62-73.
76. Ketola R, Toivonen R, Häkkänen M, Luukkonen R, Takala EP & Viikari-Juntura E (2002) Effects of ergonomic intervention in work with video display units. Scand J Work Environ Health, 28(1), 18-24.
77. Kilbom Å (1994) Repetetive work of the upper extremity: Part II - The scientific basis (knowledge base) for the guide. Int J Ind Ergonomics, 14, 59-86.
78. Kjellberg A, Andersson P, Sköldström B & Lindberg L (1996) Fatigue effects of noise on aeroplane mechanics. Work & Stress, 10, 62-71.
79. Kjellberg A & Iwanowski S (1989) Stress/energi-formuläret: utveckling av en metod för skattning av sinnesstämning i arbetet. [In Swedish]. Undersökningsrapport 1989:26, Stockholm: Arbetsmiljöinstitutet.
80. Kjellberg A & Wadman C (2002) Subjective stress and its relation to psychosocial
work conditions and health complaints. [In Swedish]. Arbete och Hälsa, 2002:12. Stockholm: National Institute for Working Life.
81. Kjellberg K, Lindbeck L & Hagberg M (1998) Method and performance: two elements of work technique. Ergonomics, 41(6), 798-816.
82. Knardahl S (2002) Psychophysiological mechanisms of pain in computer work: the blood vessel-nociceptor interaction hypotheses. Work & Stress, 16(2), 179-189.
83. Kohlisch O & Schaefer F (1996) Physiological changes during computer tasks: responses to mental load or to motor demands? Ergonomics, 39(2), 213-24.
84. Korhonen T, Ketola R, Toivonen R, Luukkonen R, Hakkanen M & Viikari-Juntura E (2003) Work related and individual predictors for incident neck pain among office employees working with video display units. Occup Environ Med, 60(7), 475-82.
85. Kristal-Boneh E, Raifel M, Froom P & Ribak J (1995) Heart rate variability in health and disease. Scand J Work Environ Health, 21, 85-95.
86. Larsson B, Björk J, Henriksson KG, Gerdle B & Lindman R (2000) The prevalences of cytochrome c oxidase negative and superpositive fibres and ragged-red fibres in the trapezius muscle of female cleaners with and without myalgia and of female healthy controls. Pain, 84(2-3), 379-87.
87. Larsson SE, Bengtsson A, Bodegård L, Henriksson KG & Larsson J (1988) Muscle changes in work-related chronic myalgia. Acta Orthop Scand, 59(5), 552-56.
88. Larsson SE, Larsson R, Zhang Q, Cai H & Öberg PA (1995) Effects of psychophysiological stress on trapezius muscles blood flow and electromyography during static load. Eur J Appl Physiol, 71(6), 493-8.
89. Latko WA, Armstrong TJ, Franzblau A, Ulin SS, Werner RA & Albers JW (1999) Cross-sectional study of the relationship between repetitive work and the prevalence of upper limb musculoskeletal disorders. Am J Ind Med, 36(2), 248-59.
90. Laursen B, Jensen BR, Garde AH & Jørgensen AH (2002) Effect of mental and physical demands on muscular activity during the use of a computer mouse and a keyboard. Scand J Work Environ Health, 28(4), 215-21.
91. Laursen B, Jensen BR & Ratkevicius A (2001) Performance and muscle activity during computer mouse tasks in young and elderly adults. Eur J Appl Physiol, 84(4), 329-36.
92. Lewis RJ, Krawiec M, Confer E, Agopsowicz D & Crandall E (2002) Musculoskeletal disorder compensation costs and injuries before and after an office ergonomics program. Int J Ind Ergonomics, 29(2), 95-99.
93. Li G & Buckle P (1999) Current techniques for assessing physical exposure to work-related musculoskeletal risks, with emphasis on posture-based methods. Ergonomics, 42(5), 674-95.

56
94. Lindegård A, Karlberg C, Wigaeus Tornqvist E, Hagberg M & Toomingas A Concordance between ratings of comfort and perceived exertion, and observations of workplace layout, and working postures among VDU-users. Manuscript.
95. Linton SJ (2000) A review of psychological risk factors in back and neck pain. Spine, 25(9), 1148-56.
96. Linton SJ & Kamwendo K (1989) Risk factors in the psychosocial work environment for neck and shoulder pain in secretaries. J Occup Med, 31(7), 609-13.
97. Lundberg U (2002) Psychophysiology of work: stress, gender, endocrine response, and work-related upper extremity disorders. Am J Ind Med, 41(5), 383-92.
98. Lundberg U, Forsman M, Zachau G, Eklöf M, Palmerud G, Melin B & Kadefors R (2002) Effects of experimentally induced mental and physical stress on motor unit recruitment in the trapezius muscle. Work & Stress, 16(2), 166-78.
99. Lundberg U, Kadefors R, Melin B, Palmerud G, Hassmén P, Engström M & Elfsberg Dohns I (1994) Psychophysiological stress and EMG activity of the trapezius muscle. Int J Behav Med, 1(4), 354-70.
100. Lundervold A (1951) Occuaption myalgia. Electromyographic investigations. Acta Psychiatr Neurol Scand, 26, 359-69.
101. Malchaire J, Cock N & Vergracht S (2001) Review of the factors associated with musculoskeletal problems in epidemiological studies. Int Arch Occup Environ Health, 74(2), 79-90.
102. Malchaire JB, Cock NA & Robert AR (1996) Prevalence of musculoskeletal disorders at the wrist as a function of angles, forces, repetitiveness and movement velocities. Scand J Work Environ Health, 22(3), 176-81.
103. Marcus M, Gerr F, Monteilh C, Ortiz DJ, Gentry E, Cohen S, Edwards A, Ensor C & Kleinbaum D (2002) A prospective study of computer users: II. Postural risk factors for musculoskeletal symptoms and disorders. Am J Ind Med, 41(4), 236-49.
104. Marras WS & Schoenmarklin RW (1993) Wrist motions in industry. Ergonomics, 36(4), 341-51.
105. Mathiassen SE & Aminoff T (1997) Motor control and cardiovascular responses during isoelectric contractions of the upper trapezius muscle: evidence for individual adaptation strategies. Eur J Appl Physiol Occup Physiol, 76(5), 434-44.
106. Mathiassen SE, Burdorf A, van der Beek AJ & Hansson G-Å (2003) Efficient one-day sampling of mechanical job exposure data--a study based on upper trapezius activity in cleaners and office workers. AIHA J (Fairfax, Va), 64(2), 196-211.
107. Mathiassen SE & Winkel J (1991) Quantifying variation in physical load using exposure-vs-time data. Ergonomics, 34(12), 1455-68.
108. Mathiassen SE, Winkel J & Hägg G (1995) Normalization of surface EMG amplitude from the upper trapezius muscle in ergonomic studies - a review. J Electromyogr Kinesiol, 5(4), 197-226.
109. Melin B & Lundberg U (1997) A biopsychosocial approach to work-stress and musculoskeletal disorders. J Psychophysiol, 11(3), 238-47.
110. Nakazawa T, Okubo Y, Suwazono Y, Kobayashi E, Komine S, Kato N & Nogawa K (2002) Association between duration of daily VDT use and subjective symptoms. Am J Ind Med, 42(5), 421-6.
111. Nevala-Puranen N, Pakarinen K & Louhevaara V (2003) Ergonomic intervention on neck, shoulder and arm symptoms of newspaper employees in work with visual display units. Int J Ind Ergonomics, 31, 1-10.
112. Nordander C, Hansson G-Å, Rylander L, Asterland P, Unge Byström J, Ohlsson K, Balogh I & Skerfving S (2000) Muscular rest and gap frequency as EMG measures of physical exposure: the impact of work tasks and individual related factors. Ergonomics, 43(11), 1904-19.

57
113. Ohlsson K, Hansson G-Å, Balogh I, Strömberg U, Pålsson B, Nordander C, Rylander L & Skerfving S (1994) Disorders of the neck and upper limbs in women in the fish processing industry. Occup Environ Med, 51(12), 826-32.
114. Ortiz DJ, Marcus M, Gerr F, Jones W & Cohen S (1997) Measurement variability in upper extremity posture among VDT users. Appl Ergon, 28(2), 139-43.
115. Palmer KT, Walker-Bone K, Griffin MJ, Syddall H, Pannett B, Coggon D & Cooper C (2001) Prevalence and occupational associations of neck pain in the British population. Scand J Work Environ Health, 27(1), 49-56.
116. Perotto A (1994) Anatomical guide for the electromyographer: the limbs and trunk. (3rd ed.). Springfield: Charles C. Thomas.
117. Punnett L & Bergqvist U (1997) Visual display unit work and upper extremity musculoskeletal disorders. Arbete och Hälsa, 1997:16. Stockholm: National Institute for Working Life.
118. Rothman KJ & Greenland S (1998) Modern epidemiology. (2nd ed.). Philadelphia: Lippincott-Raven.
119. Sauter SL & Swanson NG (1996) An ecological model of musculoskeletal disorders in office work. In: Moon SD & Sauter SL eds. Beyond biomechanics: Psychosocial aspects of musculoskeletal disorders in office work. Pp 3-21, London: Taylor & Francis.
120. Schleifer LM, Ley R & Spalding TW (2002) A hyperventilation theory of job stress and musculoskeletal disorders. Am J Ind Med, 41(5), 420-32.
121. Silverstein BA, Fine LJ & Armstrong TJ (1987) Occupational factors and carpal tunnel syndrome. Am J Ind Med, 11(3), 343-58.
122. Sjøgaard G, Lundberg U & Kadefors R (2000) The role of muscle activity and mental load in the development of pain and degenerative processes at the muscle cell level during computer work. Eur J Appl Physiol, 83(2-3), 99-105.
123. Smith MJ & Carayon P (1996) Work organization, stress, and cumulative trauma disorders. In: Moon SD & Sauter SL eds. Beyond biomechanics: psychosocial aspects of musculoskeletal disorders in office work. Pp 23-42, London: Taylor & Francis.
124. Statistics Sweden (2002) Work related health problems 2002. AM43SM0201: Statistics Sweden.
125. Statistics Sweden (2002) The working environment 2001. AM68SM0201: Statistics Sweden.
126. Søgaard K, Fallentin N & Nielsen J (1996) Work load during floor cleaning. The effect of cleaning methods and work technique. Eur J Appl Physiol Occup Physiol, 73(1-2), 73-81.
127. Theorell T, Harms-Ringdahl K, Ahlberg-Hulten G & Westin B (1991) Psychosocial job factors and symptoms from the locomotor system--a multicausal analysis. Scand J Rehabil Med, 23(3), 165-73.
128. Theorell T, Michélsen H & Nordemar R (1991) Tre arbetsmiljöindex som använts i Stockholmsundersökningen. [In Swedish]. In: Hagberg M & Hogstedt C eds. Stockholmsundersökningen 1. Pp 150-54, Stockholm: MUSIC Books.
129. Thorn S, Forsman M, Zhang Q & Taoda K (2002) Low-threshold motor unit activity during a 1-h static contraction in the trapezius muscle. Int J Ind Ergonomics, 30(4-5), 225-36.
130. Tittiranonda P, Burastero S & Rempel D (1999) Risk factors for musculoskeletal disorders among computer users. Occup Med, 14(1), 17-38, iii.
131. Toomingas A, Alfredsson L & Kilbom Å (1997) Possible bias from rating behavior when subjects rate both exposure and outcome. Scand J Work Environ Health, 23(5), 370-7.
132. Wærsted M, Bjørklund RA & Westgaard RH (1991) Shoulder muscle tension induced by two VDU-based tasks of different complexity. Ergonomics, 34(2), 137-50.
133. Wærsted M, Bjørklund RA & Westgaard RH (1994) The effect of motivation on shoulder-muscle tension in attention- demanding tasks. Ergonomics, 37(2), 363-76.

58
134. Wærsted M & Westgaard RH (1996) Attention-related muscle activity in different body regions during VDU work with minimal physical activity. Ergonomics, 39(4), 661-76.
135. van der Beek AJ & Frings-Dresen MH (1998) Assessment of mechanical exposure in ergonomic epidemiology. Occup Environ Med, 55(5), 291-9.
136. Vasseljen O, Holte KA & Westgaard RH (2001) Shoulder and neck complaints in customer relations: individual risk factors and perceived exposures at work. Ergonomics, 44(4), 355-72.
137. Vasseljen O & Westgaard RH (1995) A case-control study of trapezius muscle activity in office and manual workers with shoulder and neck pain and symptom-free controls. Int Arch Occup Environ Health, 67(1), 11-18.
138. Veiersted KB & Westgaard RH (1993) Development of trapezius myalgia among female workers performing light manual work. Scand J Work Environ Health, 19(4), 277-83.
139. Veiersted KB, Westgaard RH & Andersen P (1993) Electromyographic evaluation of muscular work pattern as a predictor of trapezius myalgia. Scand J Work Environ Health, 19(4), 284-90.
140. Wells R, Norman R, Neumann P, Andrews D, Frank J, Shannon H & Kerr M (1997) Assessment of physical work load in epidemiologic studies: common measurement metrics for exposure assessment. Ergonomics, 40(1), 51-61.
141. Westgaard RH (1999) Effects of physical and mental stressors on muscle pain. Scand J Work Environ Health, 25(Suppl 4), 19-24.
142. Westgaard RH & de Luca CJ (1999) Motor unit substitution in long-duration contractions of the human trapezius muscle. J Neurophysiol, 82(1), 501-4.
143. Westgaard RH, Vasseljen O & Holte KA (2001) Trapezius muscle activity as a risk indicator for shoulder and neck pain in female service workers with low biomechanical exposure. Ergonomics, 44(3), 339-53.
144. Westgaard RH & Winkel J (1996) Guidelines for occupational musculoskeletal load as a basis for intervention: a critical review. Appl Ergon, 27(2), 79-88.
145. Westgaard RH & Winkel J (1997) Ergonomic intervention research for improved musculoskeletal health: a critical review. Int J Ind Ergonomics, 20(6), 463-500.
146. Wigaeus Hjelm E, Winkel J, Nygård CH, Wiktorin C & Karlqvist L (1995) Can cardiovascular load in ergonomic epidemiology be estimated by self- report? Stockholm MUSIC 1 Study Group. J Occup Environ Med, 37(10), 1210-17.
147. Wigaeus Tornqvist E, Kilbom Å, Vingård E, Alfredsson L, Hagberg M, Theorell T, Waldenström M, Wiktorin C, Hogstedt C & Group M-NS (2001) The influence on seeking care because of neck and shoulder disorders from work-related exposures. Epidemiology, 12(5), 537-45.
148. Viikari-Juntura E, Martikainen R, Luukkonen R, Mutanen P, Takala E-P & Riihimäki H (2001) Longitudinal study on work related and individual risk factors affecting radiating neck pain. Occup Environ Med, 58(5), 345-52.
149. Viikari-Juntura E & Silverstein B (1999) Role of physical load factors in carpal tunnel syndrome. Scand J Work Environ Health, 25(3), 163-85.
150. Winkel J & Mathiassen SE (1994) Assessment of physical work load in epidemiologic studies: concepts, issues and operational considerations. Ergonomics, 37(6), 979-88.
151. Yen TY & Radwin RG (2000) Comparison between using spectral analysis of electrogoniometer data and observational analysis to quantify repetitive motion and ergonomic changes in cyclical industrial work. Ergonomics, 43(1), 106-32.
152. Zennaro D, Laubli T, Krebs D, Klipstein A & Krueger H (2003) Continuous, intermitted and sporadic motor unit activity in the trapezius muscle during prolonged computer work. J Electromyogr Kinesiol, 13(2), 113-24.