physical modeling and numerical analysis of … modeling and numerical analysis of tsunami...
TRANSCRIPT
B14
Physical Modeling and Numerical Analysis of Tsunami Inundation in a City Scale
〇Adi PRASETYO, Takuya MIYASHITA, Tomohiro YASUDA, Nobuhito MORI, and Hajime MASE
Introduction
Knowledge of the hydrodynamic information of
tsunami inundation such as spatial distribution of
tsunami wave propagation, arrival time, tsunami
height and acting forces is very important to establish
the soft and hard countermeasure tsunami protection.
Therefore, understanding of local tsunami behavior
and hydrodynamics processes when a tsunami impacts
urban infrastructures in a coastal city is needed. Since
the mega tsunami events are very rare occurrences,
physical modeling is very useful provide the dynamic
information similar to real conditions.
In this study, the physical model to investigate
inundation processes in a complex coastal city model
was conducted using the HyTOFU (Hybrid Tsunami
Open Flume in Ujigawa open laboratory). The goal of
study are: (a). to investigate local tsunami behavior,
tsunami inundation and other hydrodynamics
processes on complex land structures in coastal areas
and (b). to verify numerical model of 2D-Nonlinear
Shallow Water Equation (2D-NSWE) and the
Quasi-3D Euler Equation – Regional Ocean Modeling
System (Q3D-ROMS) using data set of a physical
modeling results based on 2011 Tohoku Earthquake
tsunami event.
Experimental setup
The physical model was constructed at 1:250 scale
as an idealization of the coastal town of Onagawa. The
physical model represented the bathymetry condition
of the Onagawa shore with a 13.7 m long flat sea floor
section from the wave generator, followed by a 1:10
planar slope section and ending with a beach section
where the Onagawa town physical model was fixed.
The sea floor section was constructed from concrete
and plastered by smooth cement mortar while the
slope section was made of coated iron plate. The
constant water depth was set at 0.84 m. The Onagawa
town profile was downscaled and constructed with
detailed accuracy, consisting of real topography and
urban coastal infrastructures (e.g., buildings, houses,
and streets, as well as hills and mountains) as
macro-roughness elements. Vegetation, debris and
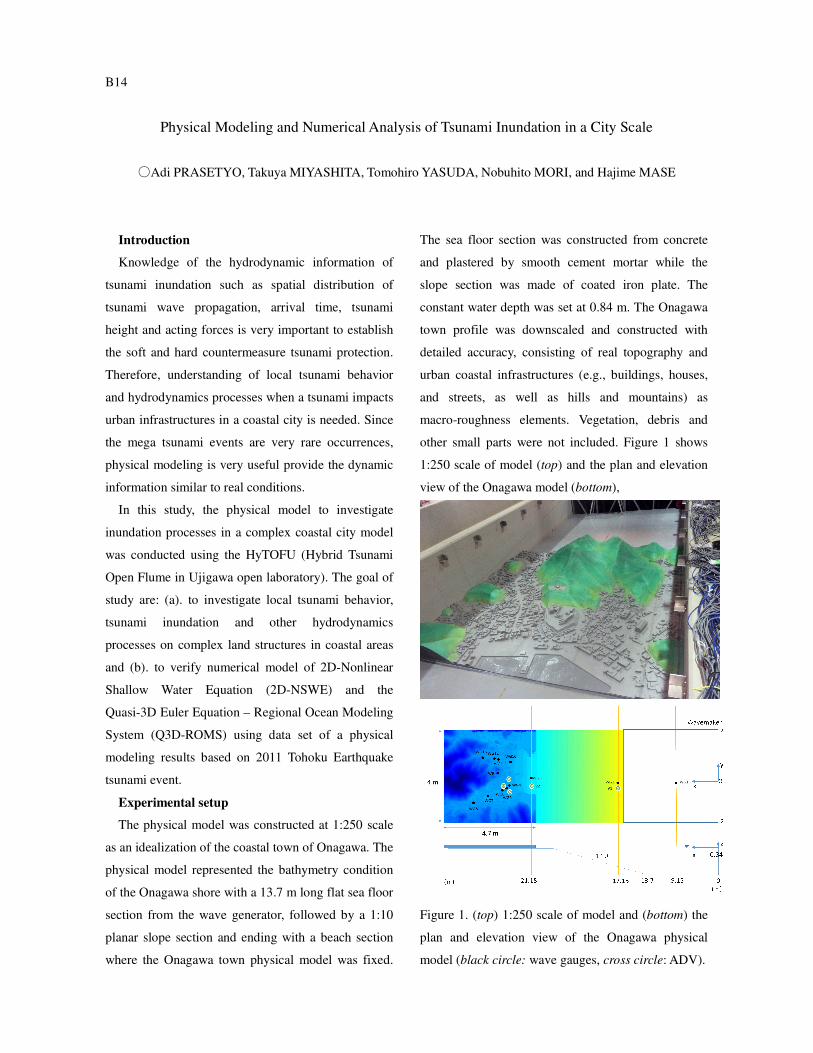
other small parts were not included. Figure 1 shows
1:250 scale of model (top) and the plan and elevation
view of the Onagawa model (bottom),
Figure 1. (top) 1:250 scale of model and (bottom) the
plan and elevation view of the Onagawa physical
model (black circle: wave gauges, cross circle: ADV).

The tsunami waves were generated using single
mechanisms of the HYTOFU. Two tsunami
waveforms were used, solitary wave and long period
continuous flow, produced by the mechanical
piston-type wave generator and the pump-type wave
generator, respectively. To measure the water surface
elevation, water velocities and wave pressure, 13
capacitance-type wave gauges, five ADV, and 19
pressure sensor were installed in the flume.
In this study, a comparison of results of
experimental and numerical model has been examined
using two different tsunami numerical models, a
2D-Nonlinear Shallow Water Equations (2D-NSWE)
model and Quasi-3D Euler Equations with Regional
Ocean Modeling System (Q3D-ROMS).
Results
Figure 2 shows the spatial distribution of tsunami
inundation on the physical model. The flow speed in
the southern region was faster than in the northern
side. Based on the arrival time of the flow edge at
each gauge, the average inundation speed in the
southern and the northern region was calculated to be
about 0.27 m/s and 0.15 m/s, respectively. Existence
of macro-roughness elements (e.g. buildings, houses)
and a steeper topography condition was recognized as
the reason for inundation speed reduction along the
street in the northern region.
Figure 2. Snapshots of tsunami inundation on land
Comparison results of maximum water surface
elevation and arrival time between experimental and
numerical models at all wave gauges (WG2-WG13) is
depicted in Figure 3. In general, the 2D-NSWE model
and Q3D-ROMS model results agree well with
experimental result in terms of maximum tsunami
height, inundation depth and arrival time for the long
period continuous flow case. However, for solitary
wave case the maximum inundation depth of
2D-NSWE model results were underestimated and the
arrival time in the numerical models were slower than
experimental results. These facts evidently show that a
nonlinear shallow water equation model might not be
suitable in representing a tsunami waveform in terms
of wave magnitude and spatial duration due to
nearshore effects and wave diffraction by structures.
Figure 3. Comparison results of maximum water
surface elevation (left) and arrival time (right)
between experimental and numerical models at all
wave gauges (WG2-WG13) for the long period
continuous flow case (red line: experimental results,
black line: Q3D-ROMS model, blue line: 2D-NSWE
model)
Conclusions
Tsunami wave generation similar to the 2011
Tohoku Earthquake Tsunami in Onagawa was
successfully reproduced and the spatial distribution of
tsunami wave propagation and inundation processes
on land was clearly observed.
A comparison of experimental and numerical
models was performed using both 2D-NSWE and
Q3D-ROMS. To validate and verify the numerical
model sensitivity, physical modeling is very useful
provide the dynamic information similar to real
conditions. The experimental data set obtained from
this study are valuable.
Northern Southern