physical property characterization of the waipapa
TRANSCRIPT

Physical Property Characterization of the WaipapaGreywacke: An Important Geothermal ReservoirBasement Rock in New ZealandAurelio Melia ( [email protected] )
University of Liverpool (UK) https://orcid.org/0000-0003-2488-8799Daniel Roy Faulkner
University of Liverpool (UK)David Daniel McNamara
University of Liverpool (UK)
Research
Keywords: Geothermal, Greywacke, Permeability, Fracture, Rock Properties, Basement Rock.
Posted Date: November 17th, 2021
DOI: https://doi.org/10.21203/rs.3.rs-1071508/v1
License: This work is licensed under a Creative Commons Attribution 4.0 International License. Read Full License

1
Physical property characterization of the Waipapa Greywacke: an 1
important geothermal reservoir basement rock in New Zealand 2
3
Melia, Aurelio1, Faulkner, Daniel Roy1, McNamara, David Daniel1. 4
1 Department of Earth, Ocean and Ecological Sciences, University of Liverpool, Liverpool, L69 3GP. 5
Keywords: Geothermal; Greywacke; Permeability; Fracture; Rock Properties; Basement Rock. 6
7
Institutional email addresses: [email protected] ; [email protected] 8
Personal email addresses: [email protected] 9
Corresponding author: Aurelio Melia 10
11
Submission Date: November 12th, 2021. 12
13
14
15
ABSTRACT 16
17
Greywacke basement rocks in New Zealand host conventional geothermal reservoirs and 18
may supply important hotter and deeper geothermal energy resources in the future. This work 19
combines petrological analyses and physical property measurements of Waipapa greywacke, a 20
basement unit hosting New Zealand geothermal reservoirs, in order to understand better how 21
structurally controlled flow networks develop and channel geothermal fluids within it. Results show 22
intact Waipapa greywacke has high tensile and triaxial compressive strengths, and low intrinsic 23
permeability (~10-21 m2). Permeability of intact Waipapa greywacke does not increase significantly 24
during triaxial loading to failure and is accompanied by minimal changes ultrasonic wave velocities. 25
These data taken together suggest that microcrack development during brittle deformation is very 26
limited. Upon failure, the permeability increases by two orders of magnitude and shows similar 27
permeability to tests performed on synthetic, single, mode I fractures in intact Waipapa greywacke. 28
Permeability persists in Waipapa greywacke fractures under confining pressures of at least 150 29

2
MPa. It is concluded that Waipapa greywacke rocks will not allow fluid flow through the matrix of 30
the rock and that substantial geothermal fluid flow will only occur through macrofracture networks. 31
32
33
1 INTRODUCTION 34
35
In New Zealand, both direct use (e.g. heating, bathing, horticulture) and electricity 36
production from geothermal resources is well developed and continues to expand [Carey et al., 37
2015]. Current geothermal development for electricity production in New Zealand utilizes 38
reservoirs at depths up to ~3.5 km, dubbed the conventional resource. Future development of 39
geothermal power in New Zealand aims at expanding the use of basement hosted geothermal 40
resources, including the greywacke basement terranes of the North Island [Mroczek et al., 2016; 41
Brathwaite et al., 2002; Wood et al., 2001], and newer discoveries proposed in the basement schist 42
lithologies of the South Island [Sutherland et al., 2017]. Furthermore, future New Zealand 43
geothermal potential lies in the development of deeper and hotter reservoirs likely hosted within 44
similar basement lithologies [Bignall, 2011; Sheburn et al., 2003]. 45
In basement geothermal reservoirs hosted in greywacke or igneous rocks, fracture and fault 46
networks control fluid flow [Wood et al., 2001; Sutherland et al., 2017; Wallis et al., 2011; Browne, 47
1980]. As such, these resources are susceptible to changeable heat fluxes, dynamic fluid flow 48
regimes, and tectonic stress fields, all of which can exert influence on the physical and mechanical 49
properties of these fractured reservoir host rocks. Information on the physical and mechanical 50
properties of basement rocks in New Zealand is thus crucial to their future development as 51
geothermal resources both at conventional development depths and at novel, deeper depths. 52
Furthermore, such dynamic environments generate fluid-rock interactions, which can alter the 53
mineralogy and texture of reservoir host rocks, in turn modifying the physical properties, which 54

3
govern their mechanical behaviour and subsequent structural network development [Siratovich et 55
al., 2015]. In order to optimize and maintain structurally hosted geothermal resources, studies of 56
their physical properties, their interactions, and their dynamic evolution due to fluid interactions 57
need to be studied to understand the effects they produce in the subsurface reservoir [Gupta and 58
Sukanta, 2006; Di Pippo, 2008; Grant and Bixley, 2011]. 59
To date, few data on the thermo-physical properties of New Zealand greywacke basement 60
rocks exist [Mielke et al., 2016, McNamara et al., 2014; Richards and Read, 2007]. This study aims 61
to enhance the understanding of the physical properties of these important geothermal reservoir 62
rocks by presenting new data on the physical, mechanical, and elastic properties on the Waipapa 63
greywacke terrane. This basement terrane is known to host geothermal reservoirs in the Ngawha 64
Geothermal Field in Northland, and has the potential to host deeper geothermal resources in the 65
Taupo Volcanic Zone (TVZ). Rock texture and microstructure analysis, combined with physical 66
property determination (uniaxial compressive strength (UCS), tensile strength, triaxial compressive 67
strength, static and dynamic elastic properties, porosity, density, seismic wave velocity, and 68
permeability) of Waipapa Terrane greywacke samples presented here provide new information on 69
the physical properties controlling brittle deformation in this lithology, the process necessary for it 70
to act as a geothermal reservoir. Data presented here will contribute towards the improved 71
construction of thermo-hydro-mechanical-chemical models of this basement terrane to assist in de-72
risking of future New Zealand geothermal systems and other similarly hosted geothermal reservoirs 73
globally. 74
75
1.1 Geological Setting 76
The Waipapa Terrane in New Zealand spans a significant portion of the northwest half of 77
New Zealand’s North Island, outcropping from the northwest border of the TVZ, and northwards 78
into Northland (Figure 1). Permian to Jurassic units comprise the terrane in a complex sequence of 79
indurated and metamorphosed volcaniclastic sandstones and siltstones [Adams et al., 2009; 80

4
Beetham and Watters, 1985]. Following Begg & Mazengarb (1996), in New Zealand the greywacke 81
sequences are generally identified as medium to dark grey, coarse to medium grained, lightly 82
metamorphosed sandstones. Grains are poorly sorted and consist of angular quartz and feldspar, and 83
lithic fragments of metamorphic and igneous rocks. The intergranular material consists of clay 84
minerals formed during induration or low-grade metamorphism. Greywacke sandstones may be 85
interbedded with lightly metamorphosed mudstones (argillite), usually layers of clay, silt, or mud, 86
generally dark to black in colour, yet occasionally red when there is a high content of iron bearing 87
minerals. The proportions between mudstone and sandstone are spatially variable within the 88
Waipapa Terrane. Geothermal expression in this unit is well documented at the Ngawha 89
Geothermal Field in Northland, and potentially within the buried basement units underneath the 90
modern (>2 Ma) volcaniclastic deposits of the TVZ. 91
Locally, at the Ngawha Geothermal Field, Waipapa Terrane basement hosting the 92
geothermal resource is composed of grey-green argillites and massive, quartzo-feldspathic 93
greywacke sandstones which have experienced low-grade metamorphism (prehnite-pumpellyite 94
grade [Mayer, 1968]), and are strongly hydrothermally altered and veined with common fault 95
breccia textures [Bayrante and Spörli, 1989; Cox and Browne, 1998; Sheppard, 1986]. Waipapa 96
greywacke basement is not yet drilled within the TVZ, an extensional intra-arc basin formed as a 97
consequence of oblique subduction of the Pacific Plate underneath the North Island of New Zealand 98
[Sheppard, 1986; Wilson et al., 1995]. Torlesse Terrane greywacke basement rock has been 99
penetrated by drilling in the Kawerau, Ngatamariki, Ohaaki, Rotokawa, and Tauhara geothermal 100
fields [Wood et al., 2001; Adams et al., 2009; Cole and Spinks, 2009; Cant et al., 2018; McNamara 101
and Massiot, 2016; McNamara et al., 2016, Bignall et al., 2010], and at Kawerau Geothermal Field 102
hosts geothermal resources. The suture between the Waipapa and Torlesse terranes is thought to 103
occur somewhere within the TVZ underneath the infill units but a precise location and depth is 104
undetermined [Adams et al., 2009; Milicich et al., 2013a]. However, given that seismic evidence 105
points to brittle deformation reaching potential depths of ~6 to 8 km [Bibby et al., 1995], Waipapa 106
5
terrane greywacke holds significant potential as a reservoir for hotter and deeper geothermal 107
resources within the TVZ [Bignall, 2011]. 108
Limited data exist on the thermo-physical properties of the Waipapa terrane greywacke 109
lithologies. A 3.7% porosity measurement, which included a structural component, was measured 110
by McGuiness [McGuinness, 1984]. UCS values of Waipapa terrane greywacke of ~193 MPa are 111
recorded by Richards and Read (2007). McNamara et al. (2014) describe densities of ~2.71 g/cm3, 112
tensile strength ranges of 20-36 MPa, UCS values of 300-310 MPa, static Poisson’s ratio and 113
Young’s moduli of 0.28 and 70 GPa respectively, cohesion values of 51 MPa, a 0.93 coefficient of 114
internal friction (μ), nuclear magnetic resonance porosities of 2%, and P-wave velocities (Vp) ranges 115
of 6 - 6.25 km/s. Mielke et al. (2016) document similar values for the properties noted in 116
McNamara et al. (2014) with the only exceptions being lower Vp values (~5.6 km/s), lower UCS 117
values (123-245 MPa), and lower Young’s Modulus (~20-27 GPa). Porosity values of ~1%, 118
permeability of <1x10-16, thermal conductivity (~2.5 Wm-1K-1) and diffusivity (~1.14-1.24 x 10-6119
m2/s), specific heat capacity of ~0.74-0.87 kg.m2/K.s2, and a shear-wave velocity (VS) of 3 km/s are 120
also recorded. 121
122

6
123
Figure 1: Map of the North Island of New Zealand showing outcropping basement terrane rocks, major structural 124
components of the TVZ, geothermal field locations, and the locations of the quarries used for sampling for this work. 125
Modified from McNamara et al. (2014). 126
127
128
2 METHODS AND MATERIALS 129
2.1 Materials and Sample Preparation 130
Samples of Waipapa greywacke terrane were acquired from quarry outcrops in order to test 131
their physical and mechanical properties. Waipapa samples are sourced from Taotaoroa Quarry 132
(TTGW), which is located between Cambridge and Matamata, ~8 km north of Karapiro Lake. 133
While outcrops where samples are acquired show the Waipapa greywacke to be layered and 134
7
fractured, the samples tested here contain no discernible anisotropy with respect to internal fabrics. 135
All the rock deformation data presented in this work were collected at the Rock Deformation 136
Laboratory at the University of Liverpool, and SEM images were collected using a JEOL JSM 137
7001F FEG-SEM in the SEM Shared Research Facility, Albert Crewe Centre for Electron 138
Microscopy at the University of Liverpool. Twenty-five, 20 mm diameter x 50 mm height 139
specimens were cored and squared from samples of Waipapa greywacke sandstones from Taotaoroa 140
Quarry. Squareness of the cored samples was better than 0.01 mm or less [Paterson and Wong, 141
2015]. A selection of these specimens was used to make ten, 20 mm diameter x 10 mm height disks 142
utilized for tensile strength measurements, and two cores (of the same size) for permeability 143
measurements where a macroscopic mode I fracture was induced in the samples. Three thin sections 144
of Waipapa greywacke from Taotaoroa Quarry were made for petrological observations using an 145
optical microscope. Finally, the sample taken to failure during triaxial testing was impregnated with 146
epoxy resin and cut parallel to the core axis and perpendicular to the shear fracture plane, polished 147
and utilized for imaging of the deformed specimen in an XL30 Philips scanning electron 148
microscope (SEM). 149
150
2.2 Porosity measurements and bulk density 151
Porosity estimates are determined from cores using a helium multipycnometer model (MVP-152
D160-E, Quantachrome Instruments). The porosity was calculated for seventeen samples of 153
Waipapa greywacke. Bulk density was calculated for three Waipapa greywacke cores, using their 154
mass and solid volume. 155
156
2.3 Tensile strength 157
Brazilian tests, conforming to ATSM standards (ATSM D3967-08), were performed on 20 158
mm diameter disks of greywacke basement rock, with a thickness-to-diameter ratio (t/D) between 159
0.2 and 0.75. Tensile strength is calculated with the following equation: 160

8
161 𝜎𝑡 =2PπLD (1) 162
163
where: σt is the splitting tensile strength (MPa), P is the maximum force applied indicated by 164
the machine (N), L is the thickness of the specimen (mm), D is the diameter of the specimen (mm). 165
166
167
168
2.4 Uniaxial compressive strength 169
UCS experiments were carried out on ten samples from Taotaoroa Quarry. Axial and 170
circumferential strain gauges were attached to the samples during testing. Samples were then 171
brought to failure using a uniaxial press. Static Young’s modulus (𝐸) and static Poisson’s ratio (𝜈) 172
are estimated from the gradient of a linear elastic region of the UCS test results (from 40-120 MPa). 173
174
2.5 Triaxial loading test 175
A single triaxial compressive test (σ1 > σ2 = σ3) was carried out on a greywacke core in 176
order to obtain the lithology’s strength under confining pressure conditions of 20 MPa and a pore 177
pressure of 5MPa (𝜎 = 15 MPa) to enhance our understanding of how this lithology undergoes 178
shear fracture at ~1 km depth, and to ensure repeatability of results delivered in McNamara et al. 179
(2014). Furthermore, the evolution of permeability and P and S wave velocity were monitored to 180
establish the development of these properties during loading to failure. We used a triaxial 181
deformation rig able to perform triaxial experiments up to 250 MPa confining pressure (servo 182
controlled), 250 MPa pore pressure (servo controlled), and ~1000 MPa differential stress with a 183
load capacity of 300 kN [Faulkner and Armitage, 2013] (Figure 2). Figure 2 shows the layout of 184
this apparatus, illustrating where the sample is situated within the pressure vessel. It also shows the 185
9
internal force gouge that provided high resolution measurements of the axial force that was applied 186
to the sample via a screw-driven actuator below the vessel illustrated in Figure 2. 187
Vp and Vs, and permeability measurements of the sample are measured axially during this 188
experiment. The position of the piezoelectric crystals (lead-zircon titanate) within the assembly are 189
illustrated in Figure 2. Axial loading proceeded at a displacement rate of 0.1 microns/s and paused 190
at various intervals in order to obtain P- and S- wave velocity and permeability measurements 191
(detailed in Section 2.7). The axial displacement reported is corrected for the elastic distortion of 192
the loading column, which is 180 kN/mm for the apparatus. 193
194
195
2.6 Elastic wave velocities and dynamic elastic moduli 196
Ultrasonic wave velocities (P- and S- wave) were measured along sample axes while loaded 197
to failure in both uniaxial compression and triaxial testing. These tests were carried out in order to 198
understand how the wave velocities develop as microcrack networks develop under increasing 199
stress, providing insight into the change in microcrack density in the samples during deformation 200
(e.g. Schubnel et al., 2003). Values are determined under varying levels of axial stress during UCS 201
testing, and under various levels of axial stress with constant confining pressures during triaxial 202
testing. Physical property characterizations are summarized in Table 2.203
Velocity data were used to calculate a dynamic Young's modulus (𝐸𝑑) and dynamic 204
Poisson's ratio (𝜈𝑑) for these samples, using the below equations and assuming isotropy [Kuttruff, 205
1991]: 206
207
𝐸𝑑 =𝜌𝑉𝑠2(3𝑉𝑝2− 4𝑉𝑠2)𝑉𝑝2−𝑉𝑠2 (2)208
209 𝜈𝑑 =𝑉𝑝2−2𝑉𝑠22(𝑉𝑝2−𝑉𝑠2) (3) 210

10
211
where 𝜌 is the density (g/cm3). The change in the sample's density, calculated from the variation in 212
volumetric change which occurs during uniaxial compression, was accounted for in the analysis. 213
214
215
Figure 2: A schematic illustration of the sample assembly contained within the pressure vessel used for the 216
experiments described. It also highlights the position of the piezoelectric crystals within the assembly that 217
are used for the P and S wave velocity measurements [Faulkner and Armitage, 2013]. 218
219
220
221

11
2.7 Permeability measurements 222
To examine fluid flow properties of the Waipapa Terrane greywacke, permeability tests 223
were carried out on both intact samples and samples containing a synthetic single fracture. 224
Permeability measurements were performed using the pulse-transient method [Brace et al., 1968] 225
with deionised water used as the pore fluid. When the measurement begins, the upstream and 226
downstream reservoir pressures of the sample are equilibrated and equal. A small increase (<1 227
MPa) of the upstream reservoir pressure or a decrease of the downstream reservoir pressure is then 228
imposed to apply a pressure gradient across the sample. The decay characteristics of this pressure 229
pulse, monitored in the upstream or downstream reservoir or both, may then be used to obtain a 230
value for permeability. 231
As previously mentioned, permeability measurements were made during the triaxial 232
compression tests to monitor permeability evolution as intact greywacke approaches failure. 233
Permeability measurements were made for each pressure step (every 20 kN, or 63.91 MPa increase 234
in load). The first permeability measurement was taken at 0 MPa (no load applied), with subsequent 235
measurements made at compressive stresses of 20 (63.91 MPa), 40 (127.81 MPa), 60 (191.72 236
MPa), 80 (255.62 MPa), 90 (287.57 MPa), 95 (303.55 MPa) and finally 100 kN (319.52 MPa) 237
where brittle failure occurred. 238
In order to understand how the permeability of single fracture responds to varying stress 239
conditions, two intact greywacke rock cores (20 mm diameter x 10 mm height) were placed in a 240
Brazilian loading jig, then loaded to failure in order to produce a single fracture plane [Nara et al., 241
2011]. These samples were then carefully placed in a polyurethane jacket and put into a triaxial 242
testing apparatus to hydrostatically load the specimen and measure evolving fracture permeability. 243
For both specimens, permeability was recorded initially at 40 MPa confining pressure, with 244
subsequent measurements taken every 5 MPa up to 110 MPa. After that, permeability 245
measurements were taken at 120, 130 and 150 MPa. The procedure used here follows that of Nara 246
et al. [Nara et al., 2011].247

12
Ta
ble 1
: List o
f sam
ples ex
am
ined
in th
is stud
y an
d th
e exp
erimental tests p
erform
ed o
n each
. TT
GW
= T
aotao
roa
24
8
quarry
gre
yw
acke, S
F =
Sin
gle F
racture ex
perim
ent. N
um
bers in
brack
ets (e.g. (x
3)) in
dicate th
e nu
mb
er of tim
es that
24
9
test was carried
out o
n th
at sa
mp
le. Sam
ple
s TT
GW
_11
_3_H
11
60
and
TT
GW
_1
1_
3_
H1
16
1 are th
in sectio
ns.
25
0
25
1
25
2
25
3
Density
S.F.
XPL
SEM
Permeability
(x18)
(x18)
Porosity
Vp - Vs
Brazilian
(x3)
(x3)
(x2)
Triaxial
Uniaxial
Sample
TTGW_11_3_H1160
TTGW_11_3_H1161
TTGW_11_3_4_triax
TTGW_11_2_1
TTGW_11_2_2
TTGW_11_2_3
TTGW_11_2_4
TTGW_11_3_1
TTGW_11_3_2
TTGW_11_3_3
TTGW_11_3_5
TTGW_11_3_6
TTGW_11_3_7
TTGW_11_3_8
TTGW_11_3_10
TTGW_11_3_11
TTGW_11_3_12
TTGW_11_3_13
TTGW_11_3_14
TTGW_11_3_16
TTGW_11_3_17
TTGW_11_3_18
TTGW_11_3_19
TTGW_11_3_20
TTGW_11_3_21
TTGW_11_3_22
TTGW_11_3_23

13
3 RESULTS 254
3.1 Petrology 255
From examination, Waipapa Terrane samples used in this study are composed of a medium 256
to coarse grained (0.25–1.5 mm), greywacke sandstone consisting of abundant to common, 257
subangular–subrounded, detrital quartz, plagioclase, and abundant lithic fragments (≤5 mm sizes) 258
(Figure 3). Lithic fragments are made of andesitic, basaltic, and rhyolitic lavas with granophyric 259
textures, and siltstone. Some lava lithics show a trachytic texture. The greywacke sandstone is clast 260
supported and matrix poor. Matrix is composed of indurated clay/silt. Chlorite, calcite, quartz, and 261
occasional epidote are found as vein minerals. In general, the Waipapa samples are moderately 262
altered to chlorite, leucoxene and clay with some weak epidote alteration. Plagioclase crystals in 263
places are weakly altered to clays while detrital biotite crystals are relatively fresh. Within the rock 264
andesite lithic fragments show some albitization. The groundmass is altered to chlorite and detrital 265
plagioclase is partially altered to clay. Mineralization within observed microfractures in these 266
samples indicates that these crack networks at one point operated as fluid flow pathways. 267
268

14
269
Figure 3: A) Photograph of thin section of sample TTGW_11_3_17 showing grain size variation and 270
mineralised veinlets (red line), B) Photomicrograph (XP; TTGW_11_3_17) showing typical grain size and texture 271
of Waipapa basement greywacke C) Photomicrograph (XP; TTGW_11_3_17) showing mineralised 272
intragranular fractures in quartz grains, D) Photomicrograph (XP; TTGW_11_3_17) showing mineralised 273
intergranular veinlets in Waipapa greywacke, E) SEM backscatter image (TTGW_11_3_17) showing 274
mineralised intragranular fractures within a quartz grain, F) SEM backscatter image ( TTGW_11_3_17) showing typical 275
grain sizes and textures of Waipapa greywacke basement and the igneous textures noted in lithic grains. Qz = quartz, Pl 276
= plagioclase. 277
278
3.2 Porosity and bulk density 279
Table 2 provides an overview of the mechanical (tensile and unconfined strength), elastic, 280
and physical properties of intact Waipapa greywacke. 281
Property Measured
Range
# of
Tests Mean
Standard
Deviation
Tensile Strength 14.4 - 32.42 10 21.07 8.28

15
(MPa)
UCS (MPa) 205 - 384 10 285.6 60.17
Poisson’s Ratio (u𝑆) 0.19 - 0.36 10 0.316 0.1
Young’s Modulus
(𝐸𝑆) (GPa) 54 - 85 10 72.8 9.04
Poisson’s Ratio (u𝐷) 0.28 - 0.30 3 0.29 0.01
Young’s Modulus
(𝐸𝐷) (GPa) 80 - 84 3 81.7 2.08
Density (ρ) (g/cm3) 2.721 - 2.731 3 2.726 0.0051
Porosity (ɸ) (vol%) 0.841 - 1.304 17 1.035 0.152
282
Table 2: Summary of the measured physical properties of Waipapa greywacke from this study. 283
284
3.3 Tensile strength 285
A standard deviation in tensile strength for the Waipapa greywacke samples indicates some 286
variability (Table 2). Studies about the precision and reproducibility of tensile strength tests have 287
been made by ASTM testing multiple specimens of different rocks (ASTM, D3967 - 08). 288
Variability of tensile strengths measured here is not outside the norm for these types of experiments 289
[Gale and Holder, 2008].290
291
3.4 Uniaxial compressive strength (UCS) and static elastic moduli 292
For all UCS tests (Table 1), stress-strain curves show a slight concave-upwards trend at low 293
loads, followed by a linear region showing no ductile behavior up to failure (Figure 4). No 294
discernible yield point was observed before failure. Static Young’s moduli range between 54 and 85 295
GPa and static Poisson’s ratios range from 0.19 to 0.36 (Table 2). 296
297

16
298
Figure 4: Stress-strain curves obtained from the uniaxial test of the Waipapa greywacke sample 299
TTGW_11_2_2. These results are typical of the UCS tests in general. 300
301
302
3.5 Triaxial compressive strength303
Permeability measurements (Table 1) performed prior to the start of the triaxial test provide 304
an intact rock permeability of 1.65x10⁻²¹ m2. Axial loading proceeded at a displacement rate of 0.1 305
microns/s, and the loading was stopped at regular intervals in order to obtain P and S wave velocity 306
and permeability measurements (Figure 9). The axial displacement reported is corrected for the 307
elastic distortion of the loading column which is 180 kN/mm for the apparatus. 308
The loading curve in Figure 5 shows a typical, initial concave upwards trend, then quasi-309
linear loading, the slope of which provides a static Young’s modulus of ~55 GPa. No yield is 310
observed as failure (314 MPa) is approached, and the sample fails while still under quasi-linear 311
loading. Reloading of the sample after failure occurs along a shallower gradient indicating the 312
fractured sample is more compliant, and a residual strength of ~120 MPa is recorded. 313
314
17
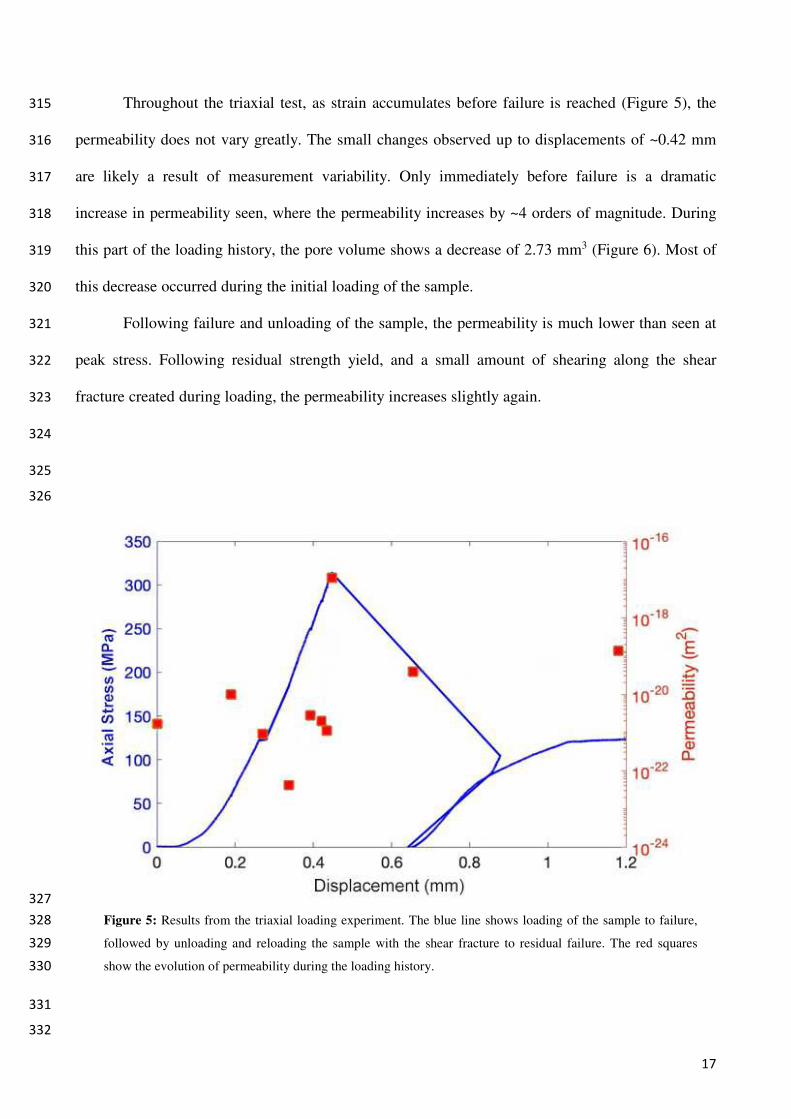
Throughout the triaxial test, as strain accumulates before failure is reached (Figure 5), the 315
permeability does not vary greatly. The small changes observed up to displacements of ~0.42 mm 316
are likely a result of measurement variability. Only immediately before failure is a dramatic 317
increase in permeability seen, where the permeability increases by ~4 orders of magnitude. During 318
this part of the loading history, the pore volume shows a decrease of 2.73 mm3 (Figure 6). Most of 319
this decrease occurred during the initial loading of the sample. 320
Following failure and unloading of the sample, the permeability is much lower than seen at 321
peak stress. Following residual strength yield, and a small amount of shearing along the shear 322
fracture created during loading, the permeability increases slightly again. 323
324
325
326
327
Figure 5: Results from the triaxial loading experiment. The blue line shows loading of the sample to failure, 328
followed by unloading and reloading the sample with the shear fracture to residual failure. The red squares 329
show the evolution of permeability during the loading history.330
331
332

18
333
Figure 6: Pore volume change with increasing differential stress during the triaxial test. 334
335
336
3.6 Scanning electron microscopy observations 337
SEM observations (Table 1) of the shear fracture generated by the failure of the core during 338
the triaxial test reveal it is filled with fragments of greywacke material (Figure 7a). The upper 339
extremity of the fracture, where the sample comes into contact with the loading platen, widens and 340
has a triangular shape, filled with large greywacke fragments (≤ 0.675 mm) set in a finer matrix 341
(≤200 µm sized cement grain). The typical aperture of the fracture is <1 mm. A network of 342
subsidiary fractures develops close to both sides of the main rupture. This subsidiary fracture 343
network is variable and includes both relatively wide fractures and clusters of narrower cracks. The 344
subsidiary fractures have variable morphologies that are broadly parallel and sub-parallel to the 345
main fracture, and parallel to the loading direction. Very few subsidiary brittle deformation features 346
are observed at greater distance from the main rupture in the tested sample. 347
348

19
349
Figure 7: A) SEM image of the greywacke sample TTGW_11_3 brought to failure in triaxial conditions. The deformed 350
sample was mounted in epoxy resin and cut and polished for imaging within the SEM. This image displays the shear 351
fracture and its filling material. A microfracture network is visible to the left side of the primary shear fracture. B) This 352
image is the result of an assembly of images that have been acquired using the SEM. It shows an induced fracture in a 353
greywacke disk (TTGW_11_3_17) using the Brazilian jig. 354
355

20
The synthetically produced fractures from Brazilian loading (Figure 7b) show very little 356
comminution and, in contrast to the shear fracture (Figure 7a), few fragments contained within the 357
fracture. Fracture walls are a mixture of tortuous and straight, and rough and smooth, and the 358
fracture width is consistent (~25 μm). There is no development of a damage zone or subsidiary 359
fractures around the main fracture (Figure 7b). Similar post-failure conditions occurred for 360
TTGW_11_3_5 sample (Figure 10). 361
362
363
3.7 Vp, Vs, and dynamic elastic moduli 364
Vp and Vs values were acquired during both uniaxial and triaxial tests (Table 1). The P-wave 365
and S-wave data were measured along the sample axis. From uniaxial tests, Vp varies from 6,072 to 366
6,410 m/s (Figure 8), and Vs varies from 3,423 to 3,605 m/s. From the triaxial test, peak Vp is 6,334 367
m/s and peak Vs is 3,647 m/s. Dynamic Poisson's ratio was in the range of 0.28 - 0.30 and dynamic 368
Young's modulus was in the range 80 to 84 GPa. 369
Figure 8 shows the trend of Vp and Vs for Waipapa greywacke during uniaxial testing. Data 370
shows an initial rapid increase in Vp and Vs as the differential stress is increased (Figure 8). After 371
that, Vp and Vs assume a sub-horizontal trend and show little changes up to the point of failure. In 372
detail, all the Vp curves show fluctuation with a general increasing trend, while, for the Vs, in the 373
beginning the trend is upward, then it levels out until failure. Data from the triaxial test reveals a 374
similar trend between Vp, Vs, and axial stress (Figure 9). 375
376

21
377
378
Figure 8: Seismic wave velocities (Vp and Vs) measured along the sample axis during uniaxial compressive tests. 379
380
381
382
Figure 9: Seismic wave velocities (Vp and Vs) measured during triaxial compressive test. 383
384
3.8 Single fracture permeability385
As confining pressure increased a monotonic decrease in permeability is observed for the 386
single, Mode I fracture in Waipapa greywacke (Figure 10). In both experiments, a similar trend in 387
permeability response is observed, with permeability measurements (Table 1) between 10-16 m2 and 388
10-17 m2 made at 40 MPa confining pressure, and permeability measurements of ~10-19 m2 made at 389
150 MPa confining pressures. At no point in the experiments did the fracture cease to allow the 390

22
transmission of fluid along it. We saw that even with 150 MPa confining pressure the permeability 391
was still higher than measured for the intact samples (Figure 10). 392
393
Figure 10: Graph of permeability against confining pressure through a single fracture (samples TTGW_11_3_5 (a) and 394
TTGW_11_3_17 (b)). Red dashed line indicates where permeability becomes stable. 395
396
397
4 DISCUSSION 398
The physical properties of a lithology affect its ability to transmit fluid within it. The matrix 399
permeability of a rock is the key factor influencing fluid flow in a rock type, which in turn is 400
strongly influenced by porosity, pore connectivity and, for low porosity lithologies, microfractures. 401
Beyond matrix permeability a lithology’s ability to transmit fluid is dictated by the presence of 402
structures [Evans et al., 2005], and the formation of structural permeability within a lithology is 403
related to the mechanical properties of the rocks that constitute it. We discuss here our findings in 404
the context of how they help understand fluid flow within Waipapa greywacke basement units. 405
406
4.1 The role of microfractures in Waipapa greywacke mechanical strength 407
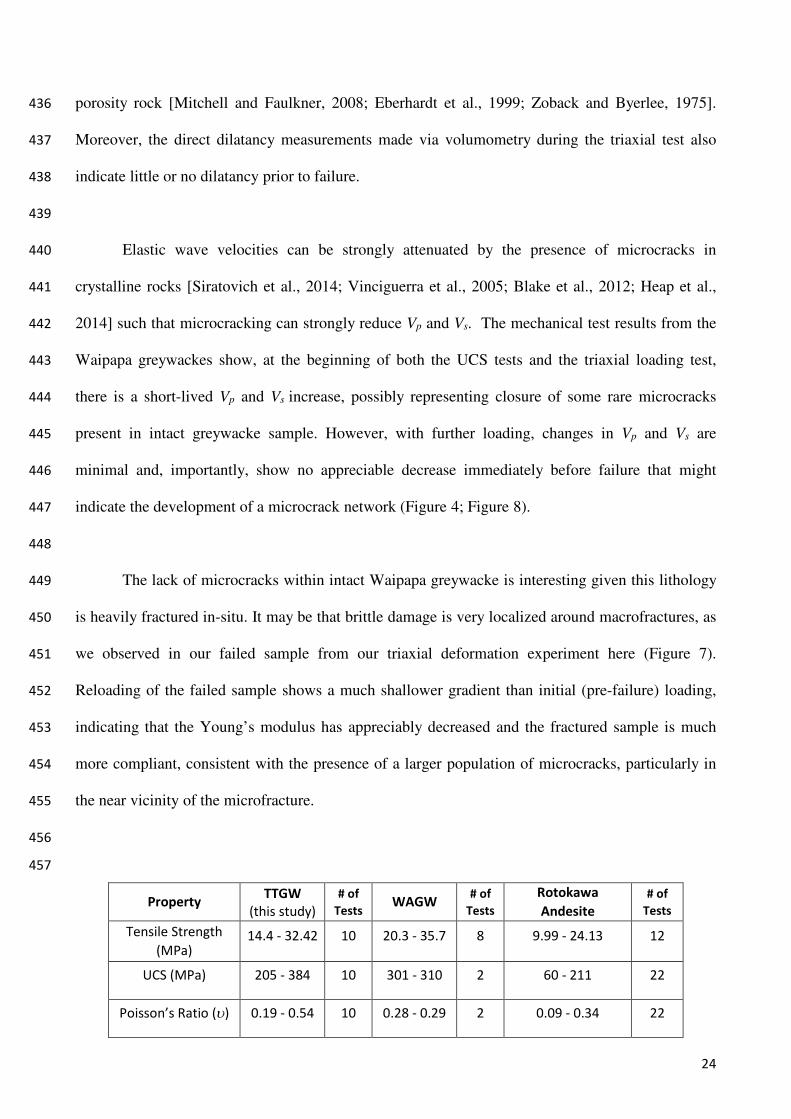
The Waipapa greywacke mechanical strength reported here is high. As a comparison, the 408
mechanical strength of the Waipapa greywackes (Table 3) is higher than that found in other 409
23
lithologies reported as mechanically strong such as Westerly granite (UCS strength ~200 MPa 410
[Mitchell and Faulkner, 2008; Heap and Faulkner, 2008]), or the Rotokawa Andesite, another 411
important geothermal reservoir rock in the TVZ (UCS strength of 60-211 MPa; [Siratovich et al., 412
2012, Siratovich et al., 2014]). Intact sedimentary rock strength is dependent on a variety of factors 413
including the rock’s diagenetic history, composition, maturity level (well-sorted, well-rounded), and 414
the cumulative effect of the various geological processes experienced by them since formation such 415
as metamorphism and deformation. Here we attempt to determine the controls on the strength of 416
Waipapa greywacke. 417
418
In Waipapa greywacke porosity ranges from 0.841 to 1.304 % (Table 3). These 419
measurements of low porosity, coupled with the microstructural observations (Figure 3) illustrate 420
the minimal primary porosity that exists within this lithology. The presence of microcracks in a low 421
porosity lithology often contribute little to the overall porosity but can have an important impact on 422
its mechanical strength, and thus the stresses at which it will experience brittle failure [Siratovich et 423
al., 2014; Eberhardt et al., 1999; Faulkner et al., 2006; Lajtai, 1998]. Previous studies on low 424
porosity crystalline rocks have shown that the presence of microfractures is evident by deviation 425
from linear elastic behaviour at stress levels well below the failure stress, as well as an increase in 426
volumetric strain [Mitchell and Faulkner, 2008; Zoback and Byerlee, 1975]. Both these 427
observations lend support to the interpretation that, as loading progresses, existing microfractures 428
start to propagate, leading to reduced compliance (related to deviation from linear elasticity) and 429
volumetric strain increase. 430
431
There is strong evidence, in addition to the low porosity, that Waipapa greywacke has a low 432
microcrack density. The loading curve (Figure 4) indicates little dilatancy from the volumetric 433
strain curve and there is an appreciable lack of any yield point. This indicates that the formation of 434
any microcrack network prior to failure is very limited, and contrasts with other studies on low 435
24
porosity rock [Mitchell and Faulkner, 2008; Eberhardt et al., 1999; Zoback and Byerlee, 1975]. 436
Moreover, the direct dilatancy measurements made via volumometry during the triaxial test also 437
indicate little or no dilatancy prior to failure. 438
439
Elastic wave velocities can be strongly attenuated by the presence of microcracks in 440
crystalline rocks [Siratovich et al., 2014; Vinciguerra et al., 2005; Blake et al., 2012; Heap et al., 441
2014] such that microcracking can strongly reduce Vp and Vs. The mechanical test results from the 442
Waipapa greywackes show, at the beginning of both the UCS tests and the triaxial loading test, 443
there is a short-lived Vp and Vs increase, possibly representing closure of some rare microcracks 444
present in intact greywacke sample. However, with further loading, changes in Vp and Vs are 445
minimal and, importantly, show no appreciable decrease immediately before failure that might 446
indicate the development of a microcrack network (Figure 4; Figure 8). 447
448
The lack of microcracks within intact Waipapa greywacke is interesting given this lithology 449
is heavily fractured in-situ. It may be that brittle damage is very localized around macrofractures, as 450
we observed in our failed sample from our triaxial deformation experiment here (Figure 7). 451
Reloading of the failed sample shows a much shallower gradient than initial (pre-failure) loading, 452
indicating that the Young’s modulus has appreciably decreased and the fractured sample is much 453
more compliant, consistent with the presence of a larger population of microcracks, particularly in 454
the near vicinity of the microfracture. 455
456
457
Property TTGW
(this study)
# of
Tests WAGW
# of
Tests
Rotokawa
Andesite
# of
Tests
Tensile Strength
(MPa) 14.4 - 32.42 10 20.3 - 35.7 8 9.99 - 24.13 12
UCS (MPa) 205 - 384 10 301 - 310 2 60 - 211 22
Poisson’s Ratio (u) 0.19 - 0.54 10 0.28 - 0.29 2 0.09 - 0.34 22

25
Young’s Modulus
(𝐸) (GPa) 54 - 85 10 65 - 70 2 20 - 44 22
Poisson’s Ratio
(u𝑑) 0.28 - 0.30 3 - - 0.13 - 0.23 22
Young’s Modulus
(𝐸𝑑) (GPa) 80 - 84 3 - - 25 - 46 22
Density (ρ) (g/cm3) 2.727 3 2.71 2 2.49 22
Porosity (ɸ) (vol%) 1.035 17 ~ 2 2 8.44 22
458
Table 3: A comparison of the physical and elastic properties values for Waipapa greywacke samples (TTGW = 459
Taotaorao Quarry; WAGW = Waotu Quarry) measured in this study [this study; McNamara et al., 2014] and Torlesse 460
greywacke [this study (porosity); McNamara et al., 2014, Stewart, 2007], Rototawa andesite [Siratovich et al., 2012, 461
Siratovich et al., 2014]. Mean values are reported for density and porosity. Dynamic properties are identified in this 462
table with the subscript "d" (𝐸𝑑 and 𝜈𝑑). 463
464
4.2 Waipapa greywacke permeability 465
The arguments presented above for the low microfracture density of the Waipapa greywacke 466
have significant implications for the matrix permeability of this rock. The microcrack density does 467
not have a great influence on the porosity, but the permeability is strongly affected by the presence 468
of microcracks [Costa, 2006; Chaki, 2008], though this is strongly dependent on effective stress 469
levels and whether the rock undergoes brittle failure or not [Faulkner and Armitage, 2013; Zoback 470
and Byerlee, 1975]. In this study, Waipapa greywacke displayed no sign of significant dilatancy 471
during deformation experiments (Figs. 4-6), and a lack of decrease in Vp and Vs before failure in 472
both uniaxial and triaxial tests. This is complemented by the absence of enhanced permeability 473
observed during loading to failure in the triaxial deformation experiment (Figure 5). In terms of 474
macrofracture generation within intact Waipapa greywacke, it appears that dilation of axially 475
aligned microcracks and their subsequent coalescence plays a limited role in the brittle deformation 476
and permeability development of this lithology, occurring at stress levels commensurate with those 477
at failure. 478

26
The results given in Table 2 are comparable to previous measurements on porosity of 479
Waipapa greywacke [Mielke et al., 2016], and porosity and permeability measurements made under 480
the same conditions for Torlesse greywacke (~1.6 %, ~4.824x10⁻²² m2; [McNamara et al., 2014]), 481
which also hosts geothermal reservoirs [Milicich et al., 2016]. These greywacke lithologies display 482
the lowest porosity and permeability values measured to date across a range of New Zealand 483
geothermal lithologies. For comparison, Rotokawa andesite has permeability values four to five 484
orders of magnitude greater than the greywacke units (~10-17 m2) [Siratovich et al., 2014], and 485
greater porosity values (Table 3), while lithologies from the Tahorakuri Formation, Matahina 486
ignimbrite, Te Teko Formation, Tahuna Formation, and a range of TVZ andesite, dacite, and 487
rhyolite lavas all have higher average porosity values [Mielke et al., 2016, Wyering et al., 2014]. 488
As discussed, inherent microcrack density, porosity, and permeability are linked such that 489
increased microcrack density, increases porosity, which in turn can increase permeability [Costa, 490
2006; Chaki et al., 2008], though this is strongly dependant on effective stress levels (Figure 5) and 491
whether the rock undergoes brittle failure or not [Zoback and Byerlee, 1975]. The low porosity 492
range reported here for Waipapa greywacke suggests a low density of inherent microstructures in 493
this lithology, and those that are present are minimally connected. This is supported by the low 494
permeability measurements (1.65x10⁻²¹ m2), the low reduction in volume observed under triaxial 495
deformation experiments, and SEM images reported in this study. 496
It has been well demonstrated that faults and fractures in brittle rock are produced by the 497
interaction and fusion of many microcracks [Mitchell and Faulkner, 2008; Lockner et al., 1991; 498
Lockner et al., 1992b; Reches and Lockner, 1994; Healy et al., 2006]. As a result, when differential 499
stress is applied to an intact rock sample, microfracture damage increases as the rock approaches 500
failure, and the resultant increasing dilatancy will have direct impacts on both porosity and 501
permeability. For example, permeability increases in Westerly Granite as it is triaxially deformed 502
are recorded as the granite failure strength is approached due to increasing development of 503
microcracks, which then increases further as stress is relaxed allowing more connectivity between 504

27
variable oriented microcracks in the rock [Mitchell and Faulkner, 2008; Zoback and Byerlee, 1975]. 505
In this study, Waipapa greywacke displayed no sign of significant dilatancy during deformation 506
experiments, both uniaxial and triaxial (Figs. 4-6), similar to results reported in McNamara et al., 507
(2014). This lack of dilatancy is supported by the lack of decrease in Vp and Vs before failure in both 508
uniaxial and triaxial tests, and a lack of increased permeability observed during loading in the 509
triaxial deformation experiment (Figure 5). In terms of macrofracture generation within intact 510
Waipapa greywacke, it appears that dilation of axially aligned microcracks and their subsequent 511
coalescence plays either no role in brittle deformation of this lithology, or that it happens within a 512
fast timeframe not captured by our experimental work here. Concerning contributions pre-failure 513
deformation makes to Waipapa greywacke permeability, we conclude this is likely to be small, 514
though suggest future experiments of this nature be performed at higher resolution along the stress-515
strain path. Our results suggest that Waipapa permeability is dominated by macrostructures, as no 516
permeability is witnessed to be generated by dilatancy effects from deformation in this lithology, 517
agreeing with similar conclusions made elsewhere [McNamara et al., 2014]. 518
Passelègue et al. (2018) demonstrate that permeability anisotropy is caused when the intact 519
rock is loaded to macroscopic failure though the rock being deformed is essentially isotropic, 520
indicating that permeability anisotropy begins to evolve only after a lithology is deformed, and that 521
anisotropy will be aligned with respect to the stress state that generated the fractures. Considering 522
the low permeability of intact Waipapa greywacke, permeability anisotropy is expected to be an 523
important aspect of this lithology as a geothermal reservoir. Experimental data presented here 524
confirms the introduction of permeability anisotropy within Waipapa greywacke. Rapid, large 525
increases in permeability (around four orders of magnitude, from 10-21 m2 to 10-17 m2) at the point of 526
brittle failure are noted from the triaxial compression experiment (Figure 5) and the single fracture 527
permeability tests (Figure 10). Thus, permeability dramatically increases in Waipapa greywacke 528
rocks as a result of brittle deformation, implying an anisotropic permeability will develop, oriented 529
with respect to a given stress field. 530
28
Defining the orientation of such permeable anisotropy in Waipapa greywacke not simple 531
given the complex nature of the tectonics associated with this lithology in geothermal regions 532
[McNamara et al., 2019]. Within the TVZ the Waipapa greywacke is subject to NW-SE directed 533
extension, with local variations [McNamara et al., 2019]. Under contemporary tectonic conditions, 534
fractures generated in Waipapa greywacke will predominantly align to this stress state (striking NE-535
SW, parallel to σ2), thus defining the permeability anisotropy. However, the Waipapa greywacke 536
has undergone deformation prior to TVZ rifting resulting in previous brittle deformation in a range 537
of orientations [Roland and Sibson, 2004]. We suggest that lateral permeability anisotropy in 538
Waipapa greywacke will be aligned to the strike of the TVZ rift (NE-SW), in which both brittle 539
structures formed during rifting, and brittle structures formed pre-rifting, but preferentially aligned 540
for slip in the current stress field, control geothermal fluid flow. Indeed, a dominant NE-SW 541
fracture strike orientation is shown within fluid flow zones in geothermal wells drilled into Torlesse 542
greywacke basement at the Kawerau Geothermal Field [Wallis et al., 2004], establishing these 543
fracture patterns do exist in greywacke basement type lithologies in the TVZ. Implications of our 544
findings for geothermal fluid flow in the Waipapa greywacke reservoir Ngawha Geothermal Field 545
are more difficult to determine due to a lack of direct structural or stress information from this 546
location [Mongillo, 1985]. Reported structures have E-W, and NE-SW strike orientations and are 547
associated with NW-SE directed extension in the region [Bayrante and Spörli, 1989]. Assuming this 548
structure-stress arrangement, we can infer from out experimental results that a macrofracture related 549
permeability anisotropy aligned NE-SW would form in the Waipapa basement of the Ngawha 550
Geothermal Field. 551
In a geothermal reservoir where permeability is controlled by macrostructures, such as those 552
in Waipapa greywacke, the ability for brittle structures to maintain fluid flow is important to the 553
resource longevity and sustainability. This study examined the effect of single macrofracture 554
behavior on the permeability of Waipapa greywacke. Macrofracture closure pressures of 555
synthetically generated fractures in Waipapa greywacke falls between 95 to 112 MPa. At these 556

29
closure pressures, fluid flow across the fracture was observed to continue, developing a stable 557
permeability around 10-19 m2 for confining pressures between 95 and 150 MPa (Figure 10). Thus, 558
even at closure, macrofractures in the Waipapa greywacke provide continued permeability (2 orders 559
of magnitude higher than intact greywacke permeability). Permeability measurements on fractured 560
greywacke under triaxial conditions also support persistent permeability in greywacke fractures post 561
initial failure (Figure 5). Similar large increases in permeability from inducing a single fracture are 562
reported from dense volcanic rocks in geothermal regions [Lamur et al., 2017]. Persistent 563
permeability in Waipapa greywacke fractures under closure pressures may be facilitated by 564
incomplete fracture closure due to the presence of fragments inside the fractures propping it open, 565
asperity generation, permeability via secondary brittle damage generated around the main brittle 566
fracture (Figure 10). Our observations suggest all three possibilities may contribute in some way. A 567
size range of wall rock fragments are observed within the triaxial fracture experiment, some of 568
which are likely more than significant to prop open a newly generated fractures and facilitate 569
ongoing fluid flow within it. The longevity of this propping is uncertain, as over time with ongoing 570
fracture slip, these fragments may be constantly reduced in size and maintain less open space. With 571
enough time and comminution of facture fill material, combined with fluid-rock interaction, gouge 572
may be generated and potentially seal the fracture completely to fluid flow. Asperity generation in 573
fractures tested here will certainly play a role in ongoing fracture permeability after closure 574
pressures are reached, as morphologically different fracture walls are observed in fractures 575
generated in both triaxial and tensile tests. As with grain propping, there is a time limit to the ability 576
for asperity to maintain fluid flow in a fracture as consistent slip will eventually grind these 577
asperities down. The exact contribution secondary brittle damage makes to observed greywacke 578
permeability is unknown, which makes it difficult to address in terms of their contribution to 579
permeability under closure pressures. Given these secondary structures generated under the same 580
experimental conditions as the primary brittle failure it is reasonable to assume they would behave 581
30
similarly to the main fracture, though given their more varied orientation with respect to σ1, and the 582
high level of intersection observed this is questionable and requires further study. 583
584
It should be noted that the results from the measurements on the single fracture are 585
represented in terms of permeability to allow direct comparison with the permeability of the intact 586
rock. Strictly, reporting permeability for fracture flow is not correct, as the calculation assumes that 587
fluid flow occurs over the crossectional area of the specimen, whereas for rocks with a low matrix 588
permeability, fluid will predominantly flow through the fracture. Consequently, the ‘permeability’ 589
becomes scale dependent [Heap and Kennedy, 2016]. This can be illustrated by considering that if 590
the sample diameter were doubled, the flow would also double, as the length of the fracture has 591
increased by a factor of two. However, the crossectional area used in the permeability calculation 592
would quadruple and the permeability would appear to half for the larger specimen. Hydraulic 593
transmissivity, the product of the fracture permeability and its thickness, is a better way to represent 594
the flow properties of fractures. This parameter can be derived from the pulse transient 595
measurements we made using the methodology described by Rutter and Mecklenburgh (2018). 596
In summary, intrinsic microfracture density in Waipapa greywacke is low, and the 597
development, coalescence, and growth of the microfracture network before failure is minimal. 598
Consequently, microfractures do not play a key role in the formation of permeable structures within 599
the Waipapa greywacke lithology. Macrofractures demonstrably increase permeability in Waipapa 600
greywacke, contribute to long-lived permeability post-failure, and the permeability they develop 601
within this lithology is anisotropic, and so permeability vectors in the greywacke units will be 602
related to the local and regional stress conditions. 603
604
605
606
607

31
5 CONCLUSIONS 608
Our experiments indicate a high mechanical strength for intact Waipapa greywacke 609
lithology that is partly due to a low density of inherent microcracks. This lack of microcracks 610
contributes to the low intrinsic porosity and permeability of intact Waipapa greywacke. Our 611
experiments confirm that the Waipapa greywacke lithology will only support fluid flow via the 612
generation of macrostructures. Furthermore, these macrofractures maintain a level of permeability 613
after stress conditions relax (fracture closure). Brittle fractures generated in Waipapa greywacke 614
thus remain important permeable components in this lithology for an undetermined length of time 615
after their formation. Such macrofracture controlled permeability is inherently anisotropic and as 616
such the directionality of fluid transmission in the Waipapa greywacke will be strongly controlled 617
by the arrangement of the local tectonic stress field as this controls orientation of microfracture 618
development. Given that structures impart strong permeability anisotropy to Waipapa basement, 619
any fluid flow modeling of geothermal systems within such geological units should account for this. 620
Further studies on Waipapa greywacke mechanical strength that simulate deeper crustal levels, and 621
flow experiments through single macrostructures under such conditions are required to better 622
quantify the fluid flow properties of this basement lithology needed for accurate modelling. 623
624
625
626
627
628
629
630
631
632
REFERENCES 633

32
634
Adams CJ, Mortimer N, Campbell HJ, Griffin WL. Age and isotropic characterisation of 635
metasedimentary rocks from the Torlesse Supergroup and Waipapa Group in the central 636
North Island, New Zealand. New Zealand Journal of Geology and Geophysics. 637
2009;52:149-170. https://doi.org/10.1080/00288300909509883 638
639
Bayrante LF, Spörli KB. Structural observations in the autochthon and allochthon at Ngawha 640
geothermal field, New Zealand. Geology of Northland: Accretion, allochthon and arcs at the 641
edge of the New Zealand micro-continent. Royal Society of New Zealand Bulletin. 642
1989;26:106-114. 643
644
Beetham RD, Watters WA. Geology of Torlesse and Waipapa terrane basement rocks encountered 645
during the Tongariro power development project, North Island, New Zealand. New Zealand 646
journal of geology and geophysics. 1985;28:575-594. 647
https://doi.org/10.1080/00288306.1985.10422534 648
649
Begg JG, Mazengarb C. Part Q27, scale 1:50,000, Lower Hutt: Institute of Geological & Nuclear 650
Sciences. Institute of Geological & Nuclear Sciences geological map 22. 128 p. + 1 fold. 651
Map. 1996. 652
653
Bibby H, Caldwell T, Davey F, Webb T. Geophysical evidence on the structure of the Taupo 654
Volcanic Zone and its hydrothermal circulation. Journal of Volcanology and Geothermal 655
Research. 1995;68:29-58. https://doi.org/10.1016/0377-0273(95)00007-H 656
657
Bignall G. Taupo Volcanic Zone deep geothermal drilling project. Proceedings Hotter and Deeper 658
Exploration Science Workshop, Taupo, New Zealand. 2011. 659
https://www.geothermal-energy.org/pdf/IGAstandard/NZGW/2011/K2.pdf (2011). 660
Accessed 31 October 2021. 661
662
Bignall G, Rae A, Rosenberg M. Rationale for targeting fault versus formation-hosted permeability 663
in high-temperature geothermal systems of the Taupo Volcanic Zone, New Zealand. 664
Proceedings, World Geothermal Congress, Bali, Indonesia. 2010. 665
https://www.geothermal-energy.org/pdf/IGAstandard/WGC/2010/1148.pdf (2010). 666
Accessed 31 October 2021. 667

33
668
Blake OO, Faulkner DR, Rietbrock A. The effect of varying damage history in crystalline rocks on 669
the P and S wave velocity under hydrostatic confining pressure. Pure Applied Geophysics. 670
2012;170:493-505. https://doi.org/10.1617/s11527-016-0892-7 671
672
Brace WF, Walsh JB, Frangos WT. Permeability of granite under high pressure. Journal of 673
Geophysical Research. 1968;73:2225-2236. https://doi.org/10.1029/JB073i006p02225 674
675
Brathwaite RL, Wood CP, Rosenberg MD, Faure K. Porosity and permeability in the basement 676
rocks at the Kawerau and Ohaaki geothermal fields, New Zealand. IN: Soengkono S, 677
Browne PRL. Proceedings, 24th New Zealand Geothermal Workshop, University of 678
Auckland. 2002;24:49-54. 679
https://www.geothermal-energy.org/pdf/IGAstandard/NZGW/2002/Brathwaite.pdf (2002). 680
Accessed 31 October 2021. 681
682
Browne PRL. Joint channels in reservoir rocks of the Ngawha geothermal field, Northland. 683
Proceeding, 2nd New Zealand Geothermal Workshop, University of Auckland. 1980;81-84. 684
https://www.geothermal-energy.org/pdf/IGAstandard/NZGW/1980/Browne.pdf (1980). 685
Accessed 31 October 2021. 686
687
Cant JL, Siratovich PA, Cole JW, Villeneuve MC, Kennedy BM. Matrix permeability of reservoir 688
rocks, Ngatamariki geothermal field, Taupo Volcanic Zone, New Zealand. Geothermal 689
Energy. 2018;6. http://dx.doi.org/10.26021/8877 690
691
Carey B, Dunstall M, McClintock S, White B, Bignall G, Luketina K, Robson B, Zarrouk S, 692
Seyward A. New Zealand country update. World Geothermal Congress, Melbourne. 2015. 693
694
Chaki S, Takarli M, Agbodjan WP. Influence of thermal damage on physical properties of a granite 695
rock: porosity, permeability and ultrasonic wave evolutions. Construction and Building 696
Materials. 2008;22:1456-1461. https://doi.org/10.1016/j.conbuildmat.2007.04.002 697
698
Cole JW, Spinks KD. Caldera volcanism and rift structure in the Taupo Volcanic Zone, New Zealand. 699
Geological Society, London, Special Publications. 2009;327:9-29. 700
http://dx.doi.org/10.1144/SP327.2 701
702

34
Costa A. Permeability‐porosity relationship: A reexamination of the Kozeny‐Carman equation 703
based on a fractal pore‐space geometry assumption. Geophysical research letters. 2006. 704
https://doi.org/10.1029/2005GL025134 705
706
Cox ME, Browne PRL. Hydrothermal alteration mineralogy as an indicator of hydrology at the 707
Ngawha Geothermal Field, New Zealand. Geothermics. 1998;27:259-270. 708
https://doi.org/10.1016/S0375-6505(97)10015-3 709
710
Di Pippo R. Geothermal power plants: principles, applications, case studies and environmental 711
impact. Elsevier Ltd, 2nd edition, Oxford. 2008. 712
713
Eberhardt E, Stead D, Stimpson B. Quantifying progressive pre-peak brittle fracture damage in rock 714
during uniaxial compression. International Journal of Rock Mechanics and Mining Sciences. 715
1999;36:361-380. https://doi.org/10.1016/S0148-9062(99)00019-4 716
717
Evans KF, Genter A, Sausse J. Permeability creation and damage due to massive fluid injections 718
into granite at 3.5 km at Soultz: 1. Borehole observations. Journal of Geophysical Research 719
e Solid Earth. 2005;110(B4). https://doi.org/10.1029/2004JB003168 720
721
Faulkner DR, Armitage PJ. The effect of tectonic environment on permeability development around 722
faults and in the brittle crust. Earth and Planetary Science Letters. 2013;375:71-77. 723
https://doi.org/10.1016/j.epsl.2013.05.006 724
725
Faulkner DR, Mitchell TM, Healy D, Heap MJ. Slip on "weak" faults by the rotation of regional 726
stress in the fracture damage zone. Nature. 2006;444:922-925. 727
https://doi.org/10.1038/nature05353 728
729
Gale JFW, Holder J. Natural fractures in the Barnett Shale: Constraints on spatial organization and 730
tensile strength with implications for hydraulic fracture treatment in Shale-Gas reservoirs. 731
In: 42nd U.S. Rock Mechanics Symposium & 2nd U.S.-Canada Rock Mechanics 732
Symposium: ARMA. 2008;08-96. 733
734
Grant MA, Bixley PF. Geothermal Reservoir Engineering, 2nd edition, Academic Press, 735
Burlington, USA. 2011. doi:10.1016/C2010-0-64792-4 736

35
737
Gupta H, Sukanta R. An alternative resource for the 21st Century. Geothermal Energy, 1st edition, 738
Elsevier Science. 2006. 739
740
Healy D, Jones RR, Holdsworth RE. Three-dimensional brittle shear fracturing by tensile crack 741
interaction. Nature. 2006;439:64-67. https://doi.org/10.1038/nature04346 742
743
Heap MJ, Faulkner DR. Quantifying the evolution of static elastic properties as crystalline rock 744
approaches failure. International Journal of Rock Mechanics and Mining Sciences. 745
2008;45:564-573. 746
747
Heap MJ, Kennedy B. Exploring the scale-dependent permeability of fractured andesite. Earth and 748
Planetary Science Letters. 2016;447:139-150. https://doi.org/10.1016/j.epsl.2016.05.004 749
750
Heap MJ, Lavallée Y, Petrakova L, Baud P, Reuschlé T, Varley NR, Dingwell DB. Microstructural 751
controls on the physical and mechanical properties of edifice-forming andesites at Volcán de 752
Colima, Mexico. Journal of Geophysical Research, Solid Earth. 2014;119:2925-2963. 753
https://doi.org/10.1002/2013JB010521 754
755
Kuttruff H. Ultrasonics fundamentals and applications. Elsevier, Science & Technology, New York. 756
1991. 757
758
Lajtai EZ. Microscopic fracture processes in a granite. Rock Mechanics and Rock Engineering. 759
1998;31:237-250. https://doi.org/10.1007/s006030050023 760
761
Lamur A, Kendrick JE, Eggertsson GH, Wall RJ, Ashworth JD, Lavallée Y. The permeability of 762
fractured rocks in pressurised volcanic and geothermal systems. Scientific reports. 763
2017;7:61-73. https://doi.org/10.1038/s41598-017-05460-4 764
765
766
Lockner DA, Byerlee JD, Kuksenko V, Ponomarev A, Sidorin A. Quasi-static fault growth and 767
shear fracture energy in granite, Nature. 1991;350:39-42. https://doi.org/10.1038/350039a0 768
769

36
Lockner DA, Byerlee JD, Kuksenko V, Ponomarev A, A, Sidrin. Observations of quasi-static fault 770
growth from acoustic emissions, Fault Mechanics and Transport Properties of Rocks, edited 771
by Evans B, and Wong TF. Academic, San Diego, California. 1992b:3-31. 772
773
Mayer W. Petrology of the Waipapa Group, near Auckland, New Zealand. New Zealand Journal of 774
Geology and Geophysics. 1968;12:412-435. 775
https://doi.org/10.1080/00288306.1969.10420291 776
777
McGuinness MJ. Recent interference tests at Ngawha and Ohaaki. Proceedings, 6th New Zealand 778
Geothermal Workshop. 1984;169-174. 779
https://pangea.stanford.edu/ERE/pdf/IGAstandard/NZGW/1984/McGuinness.pdf (1984). 780
781
McNamara DD, Faulkner DR, McCarney E. Rock Properties of Greywacke Basement Hosting 782
Geothermal Reservoirs, New Zealand, preliminary results. Proceedings, 39th Workshop 783
Geothermal Reservoir Engineering, Stanford University, California. 2014;10-21. 784
doi:10.13140/RG.2.1.1304.2160 785
786
McNamara DD, Massiot C. Geothermal structural geology in New Zealand: Innovative 787
Characterisation and micro-analytical techniques. Proceedings, 38th New Zealand 788
Geothermal Workshop, Auckland, New Zealand. 2016. 789
https://www.geothermal-energy.org/pdf/IGAstandard/NZGW/2016/Keynote_McNamara.pdf 790
(2016). Accessed 31 October 2021. 791
792
McNamara DD, Milicich SD, Massiot C, Villamor P, McLean K, Sépulveda F, Ries WF. Tectonic 793
controls on Taupo Volcanic Zone geothermal expression: Insights from Te Mihi, Wairakei 794
Geothermal Field. Tectonics. 2019. https://doi.org/10.1029/2018TC005296 795
796
McNamara DD, Sewell S, Buscarlet E, Wallis IC. A review of the Rotokawa Geothermal Field, 797
New Zealand. Geothermics. 2016;59:281-293. 798
https://doi.org/10.1016/j.geothermics.2015.07.007 799
800
Mielke P, Weinert S, Bignall G, Sass I. Thermo-physical rock properties of greywacke basement 801
rock and intrusive lavas from the Taupo Volcanic Zone, New Zealand. Journal of 802
Volcanology and Geothermal Research. 2016;324:179-189. 803

37
https://doi.org/10.1016/j.jvolgeores.2016.06.002 804
805
Milicich SD, Clark JP, Wong C, Askari M. A review of the Kawerau geothermal field. New 806
Zealand. Geothermics. 2016;59:252-265. https://doi.org/10.1016/j.jvolgeores.2018.01.012 807
808
Milicich SD, Wilson CJN, Bignall G, Pezaro B, Charlier BLA, Wooden JL, Ireland TR. U–Pb 809
dating of zircon in hydrothermally altered rocks of the Kawerau Geothermal Field, Taupo 810
Volcanic Zone, New Zealand. Journal of Volcanology and Geothermal Research. 811
2013a;253:97-113. https://doi.org/10.1016/j.jvolgeores.2012.12.016 812
813
Mitchell TM, Faulkner DR. Experimental measurements of permeability evolution during triaxial 814
compression of initially intact crystalline rocks and implications for fluid flow in fault 815
zones. Journal of Geophysical Research. 2008;113. https://doi.org/10.1029/2008JB005588 816
817
Mongillo MA. The Ngawha geothermal field: new and updated scientific investigations. 818
Geothermal Coordination Group, Department of Scientific and Industrial Research. 1985. 819
820
Mroczek EK, Milicich SD, Bixley PF, Sepulveda F, Bertrand EA, Soengkono S, Rae AJ. Ohaaki 821
geothermal system: Refinement of a conceptual reservoir model. Geothermics. 2016;59:311-822
324. https://doi.org/10.1016/j.geothermics.2015.09.002 823
824
Nara Y, Meredith PG, Yoneda T, Kaneko K. Influence of macro-fractures and micro-fractures on 825
permeability and elastic wave velocities in basalt at elevated pressure. Tectonophysics. 826
2011;503:52-59. https://doi.org/10.1016/j.tecto.2010.09.027 827
828
Passelègue FX, Pimienta L, Faulkner DR, Schubnel A, Fortin JN, Guéguen Y. Development and 829
recovery of stress-induced elastic anisotropy during cyclic loading experiment on Westerley 830
granite. Geophysical Research Letters. 2018;45:8156-816. 831
https://doi.org/10.1029/2018GL078434 832
833
Paterson M, Wong T. Experimental rock deformation - The brittle field. Springer-Verlag. 2005;12-834
13. 835
836

38
Reches Z, Lockner DA. Nucleation and growth of faults in brittle rocks. Journal of Geophysics 837
Research. 1994;99:159-173. https://doi.org/10.1029/94JB00115 838
839
Richards L, Read S. New Zealand greywacke characteristics and influences on rock mass behavior. 840
Proceedings, 11th Congress of the International Society of Rock Mechanics: the second half 841
century of rock mechanics. 2007;359-364. 842
843
Rowland JV, Sibson RH. Structural controls on hydrothermal flow in a segmented rift system, 844
Taupo Volcanic Zone, New Zealand. Geofluids. 2004;4:259-283. 845
https://doi.org/10.1111/j.1468-8123.2004.00091.x 846
847
Rutter EH, Mecklenburgh J. Influence of normal and shear stress on the hydraulic transmissivity of 848
thin cracks in a tight quartz sandstone, a granite, and a shale. Geophysical Research: Solid 849
Earth. 2018;123. https://doi.org/10.1002/2017JB014858 850
851
Sheppard DS. Fluid chemistry of the Waimangu geothermal system. Geothermics. 1986;15:309-852
328. https://doi.org/10.1016/0375-6505(86)90107-0 853
854
Sherburn S, Bannister SC, Bibby HM. Seismic velocity structure of the central Taupo Volcanic 855
Zone, New Zealand, from local earthquake tomography. Journal of Volcanology and 856
Geothermal Research. 2003;122:69-88. https://doi.org/10.1016/S0377-0273(02)00470-5 857
858
Siratovich PA, Davidson J, Villeneuve M, Graveley D, Kennedy B, Cole J, Wyering L, Price L. 859
Physical and mechanical properties of the Rotokawa Andesite from production wells RK 860
27_L2, RK 28 and RK 30. Proceedings, New Zealand Geothermal Workshop, University of 861
Auckland, New Zealand. 2012. 862
https://www.geothermal-energy.org/pdf/IGAstandard/NZGW/2012/46654final00022.pdf 863
864
Siratovich PA, Heap MJ, Villeneuve MC, Cole JW, Reuschlé T. Physical property relationships of 865
the Rotokawa Andesite, a significant geothermal reservoir rock in the Taupo Volcanic Zone, 866
New Zealand. Geothermal Energy. 2014;2:1-31. 867
https://doi.org/10.1186/s40517-014-0010-4 868
869

39
Siratovich PA, Von Aulock FW, Lavallée Y, Cole JW, Kennedy BM, Villeneuve MC. 870
Thermoelastic properties of the Rotokawa Andesite: A geothermal reservoir constraint. 871
Journal of Volcanology and Geothermal Research. 2015;301:1-13. 872
http://dx.doi.org/10.1016/j.jvolgeores.2015.05.003. 873
874
Stewart S. Rock mass strength and deformability of unweathered closely jointed New Zealand 875
greywacke, PhD Thesis, University of Canterbury, Christchurch, New Zealand. 2007. 876
http://dx.doi.org/10.26021/3499 877
878
Sutherland R, Townend J, Toy V, Zimmer M. Extreme hydrothermal conditions at an active plate-879
bounding fault. Nature. 2017;546:137-140. https://doi.org/10.1038/nature22355 880
881
Vinciguerra S, Trovato C, Meredith PG, Benson PM. Relating seismic velocities, thermal cracking 882
and permeability in Mt. Etna and Iceland basalts. International Journal of Rock Mechanics 883
and Mining Sciences. 2005;42:900-910. https://doi.org/10.1016/j.ijrmms.2005.05.022 884
885
Wallis IC, Bardsley CJ, Powell TS, Rowland JV, O’Brien JM. A structural model for the Rotokawa 886
Geothermal Field, New Zealand. Proceedings, 35th New Zealand Geothermal Workshop, 887
Auckland University, New Zealand. 2013. 888
889
Wallis I, McNamara DD, Rowland J, Massiot C. The nature of fracture permeability in the 890
greywacke basement at Kawerau Geothermal Field, New Zealand. In Proceedings, 37th 891
Workshop on Geothermal Reservoir Engineering. 2012. doi:10.13140/RG.2.1.4875.9284 892
893
Wilson CJN, Houghton BF, McWilliams MO, Lanphere MA, Weaver SD, Briggs RM. Volcanic 894
and structural evolution of Taupo Volcanic Zone, New Zealand, a review. Journal of 895
Volcanology and Geothermal Research. 1995;68:1-28. 896
897
Wood C, Brathwaite RL, Rosenberg MD. Basement structure, lithology and permeability at 898
Kawerau and Ohaaki geothermal fields, New Zealand. Geothermics. 2001;30:461-481. 899
https://doi.org/10.1016/S0375-6505(01)00003-7 900
901

40
Wyering LD, Villeneuve MC, Walli, IC, Siratovich PA, Kennedy BM, Gravley DM, Cant JL. 902
Mechanical and physical properties of hydrothermally altered rocks, Taupo Volcanic Zone, 903
New Zealand. 2014. https://doi.org/10.1016/j.jvolgeores.2014.10.008 904
905
Zoback MD, Byerlee JD. The effect of microcrack dilatancy on the permeability of Westerly 906
granite. Journal of Geophysical Research. 1975;80:752-755. 907
https://doi.org/10.1029/JB080i005p00752 908
909
910
911
912
Declarations 913
914
915
Availability of data and materials 916
917
918
The datasets used and analyzed during the current study are available and have been attached as 919
submitting files. Information and settings about the machines employed in the experiments are 920
available at Rock Deformation Laboratory - Department of Earth, Ocean and Ecological Sciences - 921
University of Liverpool (UK).922
923
924
925
Competing Interests 926
927
928
The authors declare that they have no competing interests regarding the publication of this article. 929
930
931
932
Funding Statement 933
934
This research was supported and funded by the New Zealand Ministry of Business, Innovation and 935
Employment Geothermal Supermodels research programme hosted by GNS Science. 936

41
937
938
Author’s contributions 939
940
AM planned study strategy, made the rock samples for the tests, designed the jig for Brazilian test, 941
performed all scientific experiments and measurements, analyzed and interpreted the experiments’ 942
data, observed thin sections at optical and SEM microscopes, built up graphs for the data 943
interpretations, designed a schematic illustration of the sample assembly, made all the data tables 944
presenting data collections, contributed in writing the manuscript. 945
946
DRF planned study strategy, supervised laboratory operations, analyzed and interpreted the 947
experiments’ data, contributed in writing the manuscript. 948
949
DDM planned study strategy, provided rough rock samples from the field, collected SEM images, 950
analyzed and interpreted the experiments’ data, contributed in writing the manuscript. 951
952
All authors read and approved the final manuscript. 953
954
955
956
Acknowledgements 957
958
We thank Julian Mecklenburgh for discussions of research results. We acknowledge the research 959
staff and technicians of the University of Liverpool’s Rock Deformation Laboratory (Gary 960
Coughlan) and Scanning Electron Microscopy Shared Research Facility (Elliot Wood) for access to, 961
use of, and training on equipment and microscopes. 962
963
964
965
966
967
968

Supplementary Files
This is a list of supplementary �les associated with this preprint. Click to download.
Data.rar