physical review a102, 052820 (2020)
TRANSCRIPT

PHYSICAL REVIEW A 102, 052820 (2020)
Structure of Kα1,2- and Kβ1,3-emission x-ray spectra for Se, Y, and Zr
Y. Ito,1,* T. Tochio,2 M. Yamashita,3 S. Fukushima ,4 A. M. Vlaicu,5 J. P. Marques,6,7 J. M. Sampaio ,8 M. Guerra ,7
J. P. Santos,7 Ł. Syrocki,9 K. Słabkowska,9 E. Weder,9 M. Polasik,9 J. Rzadkiewicz,10 P. Indelicato,11 Y. Ménesguen ,12
M.-Ch. Lépy ,12 and F. Parente 7,13,†
1Laboratory of Atomic and Molecular Physics, ICR, Kyoto University, Gokasho, Uji, Kyoto 611-0011 Japan2Department of Physics, Faculty of Science, Kobe University, 1-1 Rokkodai, Kobe 657-8501, Japan
3HIT, 3-1-12 Yukihira, Suma-ku, Kobe 654-0037, Japan4Kobe Material Testing Laboratory Company, Ltd., 47-13 Nijima, Harima-cho, Kako-gun, Hyogo 675-0155, Japan
5National Institute of Materials Physics, Bucharest-Magurele, Str. Atomistilor 405A, P.O. Box MG-7, 077125 Magurele-IIfov, Romania6BioISI-Biosystems & Integrative Sciences Institute, Faculty of Sciences, University of Lisboa, 1749-016 Lisboa, Portugal
7Departamento de Física, Laboratório de Instrumentação, Engenharia Biomédica e Física da Radiação (LIBPhys-UNL), Faculdade deCiências e Tecnologia da Universidade Nova de Lisboa, Monte da Caparica, 2892-516 Caparica, Portugal
8LIP-Laboratório de Instrumentação e Física Experimental de Partículas, Avenida Professor Gama Pinto 2, 1649-003 Lisboa, Portugal9Faculty of Chemistry, Nicolaus Copernicus University in Torun, Gagarina 7, 87-100 Torun, Poland
10National Centre for Nuclear Research, 05-400 Otwock, Poland11Laboratoire Kastler Brossel, Sorbonne Université, CNRS, ENS-PSL Research University, Collège de France, Case 74; 4,
place Jussieu, F-75005 Paris, France12Université Paris-Saclay, CEA, LIST, Laboratoire National Henri Becquerel (LNE-LNHB), F-91120 Palaiseau, France
13BioISI–Biosystems & Integrative Sciences Institute, Faculdade de Ciências da Universidade de Lisboa, Campo Grande,C8, 1749-016 Lisboa, Portugal
(Received 27 April 2020; revised 15 September 2020; accepted 20 October 2020; published 20 November 2020)
The Kα and Kβ x-ray spectra of Se, Y, and Zr were studied experimentally and theoretically in order to obtaininformation on the Kα1 line asymmetry and the spin doublet in Kβ1,3 diagram lines. Using a high-resolutionantiparallel double-crystal x-ray spectrometer, we obtained the line shapes, that is, asymmetry index and naturallinewidths. We found that the corrected full width at half maximum of the Kα1 and Kα2 lines as a function ofZ is in good agreement with the data in the literature. Furthermore, satellite lines arising from shake-off appearin the low-energy side of the Kα1 and Kα2 lines in Se but, in Y and Zr, it was very difficult to identify thecontribution of the shake process to the overall lines. The Kβ1,3 natural linewidth of these elements was alsocorrected using the appropriate instrumental function for this type of x-ray spectrometer, and the spin doubletenergies were obtained from the peak positions. The corrected full width at half maximum (FWHM) of the Kβ1
x-ray lines increases linearly with Z , but this tendency was found to be, in general, not linear for Kβ3 x-ray lines.This behavior may be due to the existence of satellite lines originated from shake processes. Simulated lineprofiles, obtained using the multiconfiguration Dirac-Fock formalism, accounting for radiative and radiationlesstransitions and shake-off processes, show a very good agreement with the high-resolution experimental spectra.
DOI: 10.1103/PhysRevA.102.052820
I. INTRODUCTION
The Kα and Kβ x-ray emission spectra of the 3d transitionmetals exhibit several peculiar asymmetric line profiles notobserved in other elements [1], whose origin has been un-der investigation and debate [2–6]. Several mechanisms, such
*Present address: Rigaku Corporation, 14-8, Akaoji-cho,Takatsuki-shi, Osaka 569-1146, Japan.
†Corresponding author: [email protected]
Published by the American Physical Society under the terms of theCreative Commons Attribution 4.0 International license. Furtherdistribution of this work must maintain attribution to the author(s)and the published article’s title, journal citation, and DOI.
as shake processes [7], conduction-band collective excitation[8], exchange [9–15], and final-state interactions [16,17] weresuggested to account for this effect. In particular, Deutsch andco-workers [4,5], Hölzer et al. [6], Anagnostopoulos et al.[18], Chantler et al. [19], and Ito et al. [20] suggested thatthe line shapes in Kα1,2 x-ray spectra could be accounted forby the diagram transition and 3s, 3p, and 3d spectator-holetransitions. Ito et al. [20] measured systematically the Kα1,2
spectra in the elements from Ca to Ge using an antiparalleltwo-crystal x-ray spectrometer and elucidated the origin ofthe asymmetry in the Kα1 emission profile, confirming thatthe broadening of the linewidths of Kα2 spectra originatesfrom L2-L3M4,5 Coster-Kronig transitions. Combined ab initioDirac-Fock calculations and high-resolution x-ray emissionmeasurements of Kα1,2 spectra for elements Ca, Ti, and Geshow that the asymmetric line shapes of these emission lines
2469-9926/2020/102(5)/052820(13) 052820-1 Published by the American Physical Society

Y. ITO et al. PHYSICAL REVIEW A 102, 052820 (2020)
TABLE I. Experimental conditions of the measurements usinga two-crystal x-ray spectrometer. The measurements were performedwith a tube voltage of 40 kV and the current of 60 mA under vacuum.The analyzing crystal was Si(220).
Accumulation 2θ stepElement Specimen line time (s/point) (o)
Se Metal Kα1,2 7 0.0005Kβ1,2,3 45 0.001
Y Metal Kα1,2 18 0.0005Kβ1,2,3 120 0.002
Zr Metal Kα1,2 17 0.0005Kβ1,3 120 0.0005
can be fully explained by considering only the diagram andthe 3d spectator transitions [20].
On the other hand, the Kβ1,3 x-ray emission spectrumincludes Kβ ′ and Kβ ′′ satellites on the low- and high-energysides of the Kβ1,3 peak position, respectively, as explained inthe case of copper [4,5]. These satellite lines have also beeninvestigated until now both experimentally and theoretically[1,6,18,21–26] for all 3d transition metals. Shake-off from the3d shell was also shown to account reasonably well for themeasured Kβ1,3 line shape, although a complete quantitative
fitting has not been reported, and possible contributions fromother shells were not investigated [21,24,25]. More recently,Ito et al. [27] measured systematically the Kβ x-ray spec-tra of the elements from Ca to Ge, using a high-resolutionantiparallel double-crystal x-ray spectrometer. They reportedthat each Kβ1,3 natural linewidth has been corrected usingthe instrumental function of this type of x-ray spectrometer,the spin doublet energies have been obtained from the peakposition values in Kβ1,3 x-ray spectra, and the contributionsof satellite lines were considered to be originated from [KM]shake processes.
In order to elucidate the influence of the shake processes onthe spectral profile, we investigated in this paper the contribu-tion of [1s3d] shake-off to the asymmetry of Se, Y, and ZrKα1,2 emission lines, from both experiment and theory, andthe natural width of each line in the Kβ1,3 emission spectraof the same elements to obtain the energy values of the spindoublet in detail, using a high-resolution double-crystal x-rayspectrometer.
II. EXPERIMENTAL METHODOLOGY
In the present paper we used a RIGAKU (3580E) double-crystal x-ray spectrometer. The experimental conditions forthe measurements are given in Table I. Using Bragg reflec-tions with this spectrometer, the true FWHM of the emission
FIG. 1. The observed Kα1,2 spectra in elements Se, Y, and Zr are shown with the Lorentzian functions used in the fitting processes [20,27].These spectra were measured using the antiparallel double-crystal x-ray spectrometer described in the text. For Se, on the left side is shown theresult of a two-asymmetric Lorentzian fitting analysis, and on the right side the result of a four-symmetric Lorentzian fitting analysis, accordingto Ito et al. [20]. In this figure, Kα11 is the Kα1 diagram line, and Kα21 is the Kα2 line, whereas Kα12 and Kα22 are the corresponding satellitelines. The ratio of the Kα12 to Kα11 line intensities is used in Fig. 9. The spectra of Y and Zr were analyzed by a two-symmetric Lorentzianfitting. A single scan of three repeat measurements is shown in each element. Each χ2
r is a value in a single scan measurement. See the text fordetails.
052820-2

STRUCTURE OF Kα1,2- AND Kβ1,3-EMISSION … PHYSICAL REVIEW A 102, 052820 (2020)
FIG. 2. The observed Kβ1,3 spectra in elements Se, Y, and Zr are shown with the fitting Lorentzian functions. These spectra were measuredusing the antiparallel double-crystal x-ray spectrometer described in detail in Ref. [20,27]. Kβ ′′ are satellite lines on the high energy side ofthe Kβ1,3 spectra. A single scan of three repeat measurements is shown for each element together with the value of χ2
r .
line can be determined by a simple subtraction of the con-volution in the crystal dispersion from the FWHM of themeasured emission line [28] (see Refs. [20,27] for details).With a Rh end-window x-ray generator operating at 40 kVand 60 mA, the emitted Kα and Kβ spectra (see Figs. 1and 2) were recorded under a vacuum with a sealed Xe gasproportional counter in the symmetric Si(220) Bragg reflec-tion of the double-crystal spectrometer at an angular stepof 0.0005◦ in 2θ for Kα spectra, 0.001◦ for Se, 0.0025◦for Y, and 0.0005◦ for Zr in 2θ for Kβ spectra. The slitsvertical divergence is 0.573◦ in this spectrometer. Tempera-ture in the x-ray spectrometer chamber is controlled within35.0 ± 0.5 ◦C. Acquisition time was 7–120 s/point (see Ta-ble I). Neither smoothing nor correction were applied to theraw data. Each spectrum was repeated three times. The energyvalues of Bearden [29] were taken as starting points for the di-agram line fitting parameters. We used metal powder (99.9%,Nacalai Tesque) for Se, metal plate (99%, Nilaco Corporation)for Y, and metal foil (99.2%, Nilaco Corporation) for Zr. Thepowder Se was confirmed to be the metallic form using a x-raydiffractometer and the double-crystal x-ray spectrometer.
The instrumental function of the double-crystal spectrom-eter can be very well described from Monte Carlo simulationsas has been shown in Refs. [30–32] and by simply comput-ing the rocking curve of the Si crystals through dynamicaldiffraction theory [33]. From these instrumental functionsone can obtain the natural linewidths as well as some otherbroadening mechanisms. In the present case, given the largenatural widths of the diagram lines of neutral atoms whencompared to the spectrometer instrumental function, we can
use the simple broadening method described by Tochio et al.[28] without increasing the final uncertainty.
III. THEORETICAL CALCULATIONS
The level energies, transition amplitudes, and shake prob-abilities needed to calculate the diagram, and satellite x-rayemission spectra were computed with the relativistic atomicstructure code MCDFGME, developed by Desclaux [34] andIndelicato and Desclaux [35]. This code fully implementsthe multiconfiguration Dirac-Fock (MCDF) method but, inthe present calculations, the electronic correlation was onlyincluded up to the level of the configuration mixing, and notat the level of a multiconfiguration calculation.
A. Basics of the MCDF method
The N-electron atomic system in the MCDF method isdescribed by the Dirac-Coulomb-Breit (DCB) Hamiltonian,
HDCB =N∑
a=1
hDa +
N−1∑a=1
N∑b=a+1
V CBab , (1)
where hDa is the one-electron Dirac Hamiltonian,
hDa = cαa ·pa +c2(βa − 1) + V N
a . (2)
Here αa and βa are the 4 × 4 Dirac matrices and V Na de-
scribes the interaction of one electron with the atomic nucleus.In the length gauge, the two-electron interaction can be writ-
052820-3

Y. ITO et al. PHYSICAL REVIEW A 102, 052820 (2020)
ten as
V CBab = 1
rab− αa · αb
rabcos(ωabrab)
+ (αa · ∇a)(αb · ∇b)cos(ωabrab) − 1
ω2abrab
, (3)
where rab is the interelectrons distance and ωab is the energyof the exchanged photon between the two electrons. The firstterm 1/rab describes the instantaneous Coulomb interactionand the remaining terms are known as the Breit interaction. Inthe limit ωabrab � 1, the Breit interaction becomes
V Bab ≈ −αa · αb
rab− 1
2(αa · ∇a)(αb · ∇b)rab. (4)
The first term in this relation is known as the magnetic (Gaunt)interaction, and the second term is the lowest-order retardationinteraction, which are calculated in the MCDFGME code as partof the self-consistent variational method. The remaining Breitretardation terms in Eq. (3) were also included perturbatively.Furthermore, the code also accounts for radiative corrections,namely, self-energy and vacuum polarization. For details onthe theory QED corrections in atomic systems, we refer thereader to Ref. [36].
The atomic wave functions are calculated in the frameworkof the variational principle using energy eigenfunctions thatare written as linear combinations of configuration state func-tions (CSF). The CSF are expressed as linear combinationsof Slater determinants with the same parity and are eigen-functions of the Hamiltonian, total angular momentum, andprojection of the total angular momentum on the quantizationaxis of the atomic system. All energy levels for one- andtwo-hole configurations were calculated with complete relax-ation, meaning that both the mixing coefficients and the radialorbitals in the CSF were optimized in the variational method.
B. Calculation of the line intensities
Radiative transition amplitudes were calculated betweenlevels of the K-shell one-hole configurations with full re-laxation, that is, initial and final bound-state wave functionswere optimized independently. This so-called optimal levelsscheme does not ensure the orthogonality of the initial- andfinal-state spin orbitals. To deal with the nonorthogonality ofthe wave functions, the code uses the formalism prescribed byLöwdin [37]. Radiationless transition amplitudes were calcu-lated between initial levels of K-shell one-hole configurationsand final levels of bound two-hole configurations and anelectron in the continuum. The initial levels wave functionswere also obtained from the previous energy calculations,but to ensure orthogonality, no orbital relaxation was allowedbetween the initial and the final bound-state wave functions.Nonetheless, the radiationless rates were calculated using themore accurate transition energies obtained in the first step.
From the results of these calculations, we computed alldiagram line intensities from initial levels i to all possible finallevels f where the indices i and f stand for the electronicconfigurations Ci and Cf , the total angular momenta Ji andJf , respectively, and all other quantum numbers required to
completely specify these levels,
Iif = NiEif Bifωi. (5)
Here, Ni is the population of level i, Eif = Ei − E f is thetransition energy, Bif is the x-ray emission branching ratio,
Bif = ARif∑
f ′ ARif ′
= ARif
ARi
, (6)
and ωi is the initial level fluorescence yield,
ωi = ARi
ARi + ANR
i
=∑
f ′ ARif ′∑
f ′ ARif ′ + ∑
f ′′ ANRif ′′
, (7)
where ARif ′ and ANR
if ′′ are the radiative and radiationless transi-tion amplitudes, respectively, between two levels. In Eqs. (6)and (7), f ′ and f ′′ stand for all possible levels that can bereached from level i by radiative and radiationless transitions,respectively. The populations of levels i are taken to be statis-tical, which means that all states of the initial levels of a givenconfiguration have the same probability of being populated
Ni = (2Ji + 1)∑i′ (2Ji
′ + 1), (8)
where the summation runs over all levels belonging to config-uration Ci.
The radiative transition amplitudes in the length gaugecan be written as the Einstein A coefficients for the photonemission,
ARif = 2(J + 1)(2J + 1)
J{[(2J + 1)!!]2}(Eif
hc
)2J+1 |〈 f ||QJ ||i〉|2
2Ji + 1, (9)
where QJ are the many-electron multipole transition oper-ators of rank J as defined in Ref. [38]. All electric andmagnetic multipole transitions with J � 3 were included inthe present calculations. The radiationless transition ampli-tudes were calculated assuming the sudden approximationusing perturbation theory. The calculation was performed inthe frozen-core approximation, including both direct and ex-change terms [39].
Satellite lines correspond to transitions where a second“spectator” hole is present and occur when initial double-holelevels exist. This double ionization may result from shake-off,that is, the ejection of an outer electron due to the suddenchange in nuclear potential when an inner hole is created. Thisprocess was considered by Bloch [40] and used for the firsttime by and Demekhin and Sachenko [41] to calculate for thefirst time shake satellite intensities in the x-ray spectra. Åberg[42] also used the sudden approximation for the calculation ofKα1α2 satellite line intensities in Ne-like ions. Frequently, thenumber of satellite lines is so large that they are seen in thespectra as bands as in the present spectra.
To compute satellite branching ratios, we used radiativetransition amplitudes between levels of two-hole configu-rations, calculated in the same way as for the one-holeconfigurations but limited to J � 1. An exact calculation ofsatellite intensities also requires the calculation of radiation-less transition amplitudes between initial two-hole and finalthree-hole configuration levels to obtain the satellite level flu-orescence yield ωsat
i′ . This, however, would be computationally
052820-4
STRUCTURE OF Kα1,2- AND Kβ1,3-EMISSION … PHYSICAL REVIEW A 102, 052820 (2020)
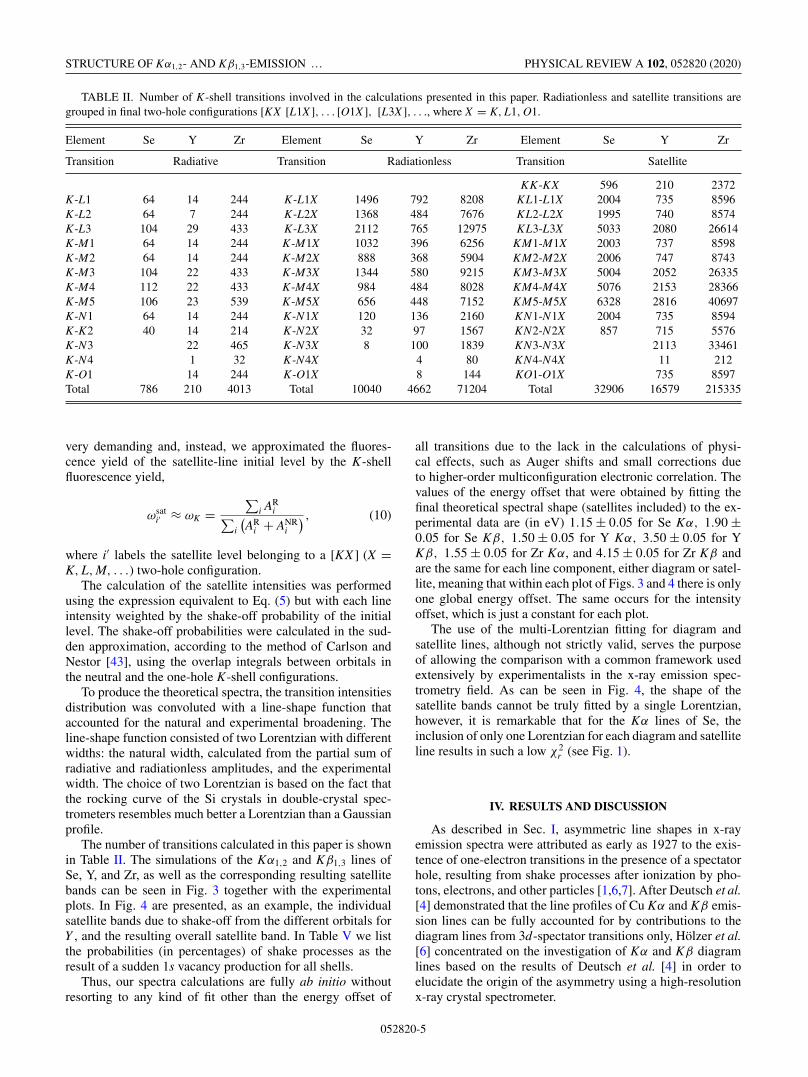
TABLE II. Number of K-shell transitions involved in the calculations presented in this paper. Radiationless and satellite transitions aregrouped in final two-hole configurations [KX [L1X ], . . . [O1X ], [L3X ], . . ., where X = K, L1, O1.
Element Se Y Zr Element Se Y Zr Element Se Y Zr
Transition Radiative Transition Radiationless Transition Satellite
KK-KX 596 210 2372K-L1 64 14 244 K-L1X 1496 792 8208 KL1-L1X 2004 735 8596K-L2 64 7 244 K-L2X 1368 484 7676 KL2-L2X 1995 740 8574K-L3 104 29 433 K-L3X 2112 765 12975 KL3-L3X 5033 2080 26614K-M1 64 14 244 K-M1X 1032 396 6256 KM1-M1X 2003 737 8598K-M2 64 14 244 K-M2X 888 368 5904 KM2-M2X 2006 747 8743K-M3 104 22 433 K-M3X 1344 580 9215 KM3-M3X 5004 2052 26335K-M4 112 22 433 K-M4X 984 484 8028 KM4-M4X 5076 2153 28366K-M5 106 23 539 K-M5X 656 448 7152 KM5-M5X 6328 2816 40697K-N1 64 14 244 K-N1X 120 136 2160 KN1-N1X 2004 735 8594K-K2 40 14 214 K-N2X 32 97 1567 KN2-N2X 857 715 5576K-N3 22 465 K-N3X 8 100 1839 KN3-N3X 2113 33461K-N4 1 32 K-N4X 4 80 KN4-N4X 11 212K-O1 14 244 K-O1X 8 144 KO1-O1X 735 8597Total 786 210 4013 Total 10040 4662 71204 Total 32906 16579 215335
very demanding and, instead, we approximated the fluores-cence yield of the satellite-line initial level by the K-shellfluorescence yield,
ωsati′ ≈ ωK =
∑i AR
i∑i
(AR
i + ANRi
) , (10)
where i′ labels the satellite level belonging to a [KX ] (X =K, L, M, . . .) two-hole configuration.
The calculation of the satellite intensities was performedusing the expression equivalent to Eq. (5) but with each lineintensity weighted by the shake-off probability of the initiallevel. The shake-off probabilities were calculated in the sud-den approximation, according to the method of Carlson andNestor [43], using the overlap integrals between orbitals inthe neutral and the one-hole K-shell configurations.
To produce the theoretical spectra, the transition intensitiesdistribution was convoluted with a line-shape function thataccounted for the natural and experimental broadening. Theline-shape function consisted of two Lorentzian with differentwidths: the natural width, calculated from the partial sum ofradiative and radiationless amplitudes, and the experimentalwidth. The choice of two Lorentzian is based on the fact thatthe rocking curve of the Si crystals in double-crystal spec-trometers resembles much better a Lorentzian than a Gaussianprofile.
The number of transitions calculated in this paper is shownin Table II. The simulations of the Kα1,2 and Kβ1,3 lines ofSe, Y, and Zr, as well as the corresponding resulting satellitebands can be seen in Fig. 3 together with the experimentalplots. In Fig. 4 are presented, as an example, the individualsatellite bands due to shake-off from the different orbitals forY , and the resulting overall satellite band. In Table V we listthe probabilities (in percentages) of shake processes as theresult of a sudden 1s vacancy production for all shells.
Thus, our spectra calculations are fully ab initio withoutresorting to any kind of fit other than the energy offset of
all transitions due to the lack in the calculations of physi-cal effects, such as Auger shifts and small corrections dueto higher-order multiconfiguration electronic correlation. Thevalues of the energy offset that were obtained by fitting thefinal theoretical spectral shape (satellites included) to the ex-perimental data are (in eV) 1.15 ± 0.05 for Se Kα, 1.90 ±0.05 for Se Kβ, 1.50 ± 0.05 for Y Kα, 3.50 ± 0.05 for YKβ, 1.55 ± 0.05 for Zr Kα, and 4.15 ± 0.05 for Zr Kβ andare the same for each line component, either diagram or satel-lite, meaning that within each plot of Figs. 3 and 4 there is onlyone global energy offset. The same occurs for the intensityoffset, which is just a constant for each plot.
The use of the multi-Lorentzian fitting for diagram andsatellite lines, although not strictly valid, serves the purposeof allowing the comparison with a common framework usedextensively by experimentalists in the x-ray emission spec-trometry field. As can be seen in Fig. 4, the shape of thesatellite bands cannot be truly fitted by a single Lorentzian,however, it is remarkable that for the Kα lines of Se, theinclusion of only one Lorentzian for each diagram and satelliteline results in such a low χ2
r (see Fig. 1).
IV. RESULTS AND DISCUSSION
As described in Sec. I, asymmetric line shapes in x-rayemission spectra were attributed as early as 1927 to the exis-tence of one-electron transitions in the presence of a spectatorhole, resulting from shake processes after ionization by pho-tons, electrons, and other particles [1,6,7]. After Deutsch et al.[4] demonstrated that the line profiles of Cu Kα and Kβ emis-sion lines can be fully accounted for by contributions to thediagram lines from 3d-spectator transitions only, Hölzer et al.[6] concentrated on the investigation of Kα and Kβ diagramlines based on the results of Deutsch et al. [4] in order toelucidate the origin of the asymmetry using a high-resolutionx-ray crystal spectrometer.
052820-5

Y. ITO et al. PHYSICAL REVIEW A 102, 052820 (2020)
FIG. 3. Simulation of the Kα1,2 and Kβ1,3 lines of Se, Y, and Zr, together with the experimental data. Both diagram and satellite linesaccount for the final line shape. The curves labeled “Sat.” are the sum of all satellite lines.
According to Hölzer et al. [6], only few of the previousdata were corrected for instrumental broadening, althoughit was realized early that broadening from this origin has asignificant effect [44]. A two-flat-crystal x-ray spectrometer,using a crystal instead of the slit in a single-flat-crystal x-
ray spectrometer, is used for our studies. This spectrometerwas developed by Gohshi et al. [45] with the two crystalslinked. Tochio et al. [28] evaluated the instrumental broad-ening in this type spectrometer. Ito et al. [20] investigatedsystematically the asymmetry index, FWHM, and intensity
052820-6

STRUCTURE OF Kα1,2- AND Kβ1,3-EMISSION … PHYSICAL REVIEW A 102, 052820 (2020)
FIG. 4. Simulation of the Kα1,2 and Kβ1,3 satellite lines of Y. The resulting satellite band is represented, together with the componentsresulting from shake-off from the individual orbitals. In order to better identify the individual satellites, the ordinate is shown in logarithmicscale and only the most intense curves are shown. The small structure on the high-energy side of the Kα1,2 spectrum is due to 2p spectatorholes.
ratio of Kα1,2 diagram lines in 3d transition elements usingthe double-crystal x-ray spectrometer in order to elucidatethe origin of the asymmetry in the line profile. They showedthat the asymmetry index of Kα1 in the elements from Scto Ge is ascribed to the existence of a 3d spectator hole.In which element the asymmetry of Kα lines appears wasdiscussed.
In the present paper, the Kα1,2 and Kβ1,3 spectra of ele-ments Se, Y, and Zr, have been measured three times each,using a high-resolution double-flat-crystal x-ray spectrometer.The values of the obtained averaged line energies and aver-aged relative intensity ratios for each line in each Lorentzianmodel for these elements are shown in Tables III and IV,respectively. The corrected FWHM for the Kα1,2 and Kβ1,3
diagram lines are presented in Tables III and IV, and Figs. 5–8,respectively, together with values reported by other authors[46,47]. The corrected FWHM values were taken from theobserved FWHM through the method of Tochio et al. [28].
A. The observed Kα1,2 emission spectra
The two-asymmetric and the four-symmetric Lorentzianfittings are performed only for Se. The two-symmetricLorentzian fittings are performed also for Y and Zr. This isbecause the contribution of the [1s3d] shake process couldnot be clearly confirmed from the observed spectra throughthe fitting method as seen in Fig. 1. The asymmetry indexis defined as the ratio of the half width at half maximum
TABLE III. The observed Kα1,2 spectra in elements Se, Y, and Zr are shown with the Lorentzian functions used in the fitting processes[4,20]. Kα11 spectra are the Kα1 diagram line, and Kα21 spectra are the Kα2 diagram line. Kα12 and Kα22 satellite lines are due to the shakeprocesses. The corrected FWHM was obtained by the method of Tochio et al. [28]. All energy values are in eV. The values of the instrumentalbroadening are around 0.17, 0.21, and 0.22 eV for Se, Y, and Zr Kα1 photon energy, respectively. The asymmetry index is defined as the ratioof the half width at half maximum on the low- and high-energy sides of each peak, respectively.
Element/lines Energy FWHM Corrected FWHM Ref. [46] Ref. [47] Asymetry index Irel (%)
Se Two-asymmetric LorentzianKα1 11222.383(94) 3.727(15) 1.028(9) 100Kα2 11181.439(96) 3.689(23) 1.028(11) 51.78(20)
Se Four-symmetric LorentzianKα11 11222.380(89) 3.633(20) 3.468(20) 3.3 3.33 100Kα12 11217.573(65) 3.53(80) 1.68(52)Kα21 11181.48(10) 3.579(39) 3.414(39) 3.33 3.46 50.83(64)Kα22 11178.55(41) 3.02(76) 1.80(88)
Y Two-symmetric LorentzianKα1 14958.389(24) 5.464(27) 5.254(27) 4.94 5.02 100Kα2 14883.403(39) 5.393(40) 5.216(40) 5.04 5.18 52.23(23)
Zr Two-symmetric LorentzianKα1 15774.87(31) 5.865(31) 5.645(31) 5.34 5.4 100Kα2 15690.77(30) 5.845(44) 5.625(44) 5.46 5.62 52.53(27)
052820-7

Y. ITO et al. PHYSICAL REVIEW A 102, 052820 (2020)
TABLE IV. The observed Kβ1,3 spectra in elements Se, Y, and Zr are shown with the Lorentzian functions used in the fitting process [27].Kβ ′′ spectra are satellite lines (see Ref. [4,5,27] and references therein). The fitting analyses in Se, Y, and Zr were executed with symmetricLorentzians. The corrected FWHM was obtained by the method of Tochio et al. [28]. All energy values are in eV.
Element/lines Energy FWHM Corrected FWHM Ref. [46] Irel (%)
Se Symmetric LorentzianKβ1 12495.911(26) 4.285(87) 4.085(87) 4.48 100Kβ3 12490.094(44) 5.70(10) 5.50(10) 4.48 63.3(1.1)Kβ ′′ 12503.11(30) 6.25(71) 8.1(1.3)Kβ2 12652.840(77) 4.81(24) 5.24(34)
Y Symmetric LorentzianKβ1 16737.88(29) 5.60(25) 5.38(25) 5.46 100Kβ3 16726.02(28) 5.53(17) 5.31(17) 5.46 52.6(1.8)Kβ ′′ 16746.2(2.9) 17.0(6.1) 1.80(88)Kβ2 17010.57(16) 5.80(25) 1.68(52)
Zr Symmetric LorentzianKβ1 17667.78(30) 6.171(88) 5.791(88) 5.83 100Kβ3 17654.31(23) 5.89(10) 5.51(10) 5.83 50.49(60)Kβ ′′ 15774.87(31) 10.8(1.7) 5.2(1.3)
on the low- and high-energy sides of each peak, respectively,providing a measure of the peak asymmetry [49].
The corrected FWHM of the Kα1(Kα11) and Kα2(Kα21)diagram lines, additionally corrected for the instrumentalbroadening, are presented in Figs. 5 and 6 together with therecommended values based on experimental results of Camp-bell and Papp [46] and the semiempirical values of Krauseand Oliver [47] (when fitting Kα1,2 spectral lines with fourLorentz functions in 3d elements, the ones corresponding tothe two diagram lines, that is, Kα11 and Kα21, are shown).
For Se, the values of the obtained averaged line energies,averaged FWHM, averaged asymmetry indexes, and averaged
FIG. 5. The corrected FWHM of the Kα1 line of elements Se, Y,and Zr are shown, together with the semiempirical values reported byKrause and Oliver [47], and the recommended values, based on ex-perimental results, of Campbell and Papp [46]. The values of Krauseand Oliver are represented by the dotted line and those reported byCampbell and Papp by the dots and dashed line. The data (a) fromIto et al. [20] were used for only Si(220) analyzing crystals in avacuum. The corrected FWHM values for the Kα1 diagram lines inthe elements Se, Y, and Zr were obtained from the observed FWHMthrough the method of Tochio et al. [28]
relative intensity ratios for each line in the asymmetric modelare given in Table III, and averaged line energies, averagedobserved FWHM, averaged corrected FWHM, and averagedrelative intensity ratio in four symmetric Lorentzian modelare also shown in Table III. The instrumental broadeningwas found to be 0.17, 0.21, and 0.22 eV of Kα1 in Se, Y,and Zr, respectively, using the method of Tochio et al. men-tioned above, and the CFWHMs were obtained by subtractionfrom the FWHMs. Moreover, for Y and Zr, the values of theobtained averaged line energies, averaged FWHM, averagedcorrected FWHM, and averaged relative intensity ratio in Kα1
and Kα2 lines, in each symmetric Lorentzian model are shownin Table III as well as the other reported data, that is, Krause
FIG. 6. The corrected FWHM of the Kα2 line of elements Se, Y,and Zr are shown together with the semiempirical values reported byKrause and Oliver [47] marked by dotted line, and the recommendedvalues of Campbell and Papp [46] marked by dotted and dashedline. Solid circles in (b) are the values subtracting the Coster-Kronigbroadening effects reported by Ito et al. [20]. Crosses in (a) are fromthe observed data of Kα2 in Ref. [20]. The corrected FWHM valuesfor the Kα2 diagram line in the elements Se, Y, and Zr were obtainedfrom the observed FWHM through the method of Tochio et al. [28].
052820-8

STRUCTURE OF Kα1,2- AND Kβ1,3-EMISSION … PHYSICAL REVIEW A 102, 052820 (2020)
FIG. 7. The corrected FWHM of the Kβ1 line of elements Se, Y,and Zr together with the recommended values reported by Campbelland Papp [46] marked by dots and dashed curve. The linear functionW is obtained by the least-squares method using Kβ1 linewidths [27].(a) Ito et al. [27]. (b) Hölzer et al. [6]. (c) Anagnostopolos et al. [18].(d) Pham et al. [26].
and Oliver semiempirical natural linewidths [47], and the rec-ommended linewidth values of Campbell and Papp [46].
We checked the Cu Kα1,2 diagram lines as standard linesin order to evaluate the reproducibility in the double-crystalx-ray spectrometer, whereas measuring the Kα1,2 and Kβ1,3
diagram lines for each element [20,50]. The fitting processwith the Lorentzian functions shown in Fig. 1 for Kα1,2 andFig. 2 for Kβ1,3 diagram lines, used the procedure providedin IGOR PRO (HULINKS, Inc.) software application. The val-ues of χ2
r are shown in these figures. In our case, N in χ2r
is the number of the fitted data points. In the fitting pro-cess no constraints have been imposed. Moreover, Figs. 1and 2 show a single scan of three repeat measurements ineach element. The errors quoted in Table III are, thus, only
FIG. 8. The corrected FWHM of the Kβ3 line of elements Se,Y, and Zr is shown together with the recommended values [46].Thelinear function W was obtained by the least-squares method usingKβ1 linewidths in the elements Zn and Ge [27]. (a) Ito et al. [27].(b) Hölzer et al. [6]. (c) Anagnostopoulos et al. [18]. (d) Pham et al.[26].
FIG. 9. Ratio of Kα12 satellite to the Kα11 diagram line inten-sities in Se is shown by a black triangle together with those ofRefs. [20,48] marked by crosses (a). According to Ito et al. [20],this satellite is mainly considered to be a contribution of the [1s3d]shake process to the asymmetry of the Kα1 emission line. Openrhombohedra (b) from Ref. [20] and open triangles from Table Vrepresent the shake probability of [KM], respectively. These valuesare based on the theoretical calculations. See the text in details.
statistical errors resulting from the fitting processes and thelimited reproducibility of the experimental setup. To obtainrealistic uncertainties, the errors originating from the energycalibration have to be considered. Absolute Kα1,2 and Kβ1,3
photon energies for all 3d elements between Cr and Cu can befound in Ref. [6].
In Figs. 5 and 6 we can see that the overall variationbehavior with Z of the Kα11 (or Kα1) and Kα21 (or Kα2)lines is well reproduced by the data reported by Campbelland Papp [46] and Krause and Oliver [47]. We obtained thecorrected FWHM values for both Kα11 (or Kα1) and Kα21
(or Kα2) diagram lines from the observed FWHM throughthe method of Tochio et al. [28]. Ito et al. [20] attributed thedifference in Kα11 and Kα21 diagram lines corrected FWHMvalues observed in 3d elements to the broadening effect of theCoster-Kronig transitions.
In what concerns the asymmetry of the Kα1 diagram line,Ito et al. [20] concluded that it is due to the [1s3d] shakeprocesses as seen in Fig. 9. Through precise experiments andtheoretical considerations, we investigated up to which ele-ments the influence of the [1s3d] shake processes contributesto the Kα1 emission spectrum. In Table V and Fig. 9 (shakeprobability ratio), the [KX ] (X = M, N, O) shake probabili-ties are shown for Se, Y, and Zr. The [1s3d] shake probabilityis relatively large, at least, until element Zr. However, anasymmetric Kα1 profile can be observed for Se, whereas inY and Zr it is very difficult to distinguish the satellite linesfrom the diagram lines. One should consider that the shakeprobabilities of [KN] or [KO] hidden satellites are large inthese elements as seen in Table V. Therefore, it is hard todiscuss the asymmetry in the Kα1 spectra of elements withatomic numbers larger than Y based on both the experimentalresults and the theoretical calculations of the shake processas seen in Figs. 1 and 3 because, according to Ito et al. [20],the asymmetry depends on the [KM] shake probability and
052820-9

Y. ITO et al. PHYSICAL REVIEW A 102, 052820 (2020)
TABLE V. Probabilities (in percentages) of shake processes forvarious shells as the result of a sudden 1s vacancy production.
Se (Z = 34) Y (Z = 39) Zr (Z = 40)
1s 0.0045 0.0034 0.00322s 0.0620 0.0417 0.04032p1/2 0.1080 0.0738 0.06902p3/2 0.2110 0.1408 0.13133s 0.2670 0.1705 0.16233p1/2 0.5060 0.3178 0.29493p3/2 1.1090 0.6188 0.57313d3/2 1.9230 0.8201 0.71823d5/2 2.8700 1.0537 0.89794s 3.1080 1.6582 1.49254p1/2 6.5250 2.1367 1.78264p3/2 8.2610 4.2805 3.55485s 14.6472 12.87224d3/2 7.3547 7.85924d5/2 1.1906
for elements higher than Y, the influence of the shake processdue to [KN] and [KO] becomes larger than the influence of[KM] shake process. It is noteworthy that for these elementsthe observed spectra are almost symmetrical.
From the theoretical calculations and the simulated lineshapes, we conclude that the [1s3d] satellites present them-selves as small peaks aligned with the diagram centroid withshoulders on the low-energy side of the diagram line as ex-pected from Fig. 1. Nevertheless, the [1s3p] satellites alsocontribute to a small asymmetry on the high-energy side ofthe simulated diagram peaks, although these could not beconfirmed experimentally. It may be due to the detection limitof the measurement. This cannot be seen in the Kα spectraof all the measured elements but is more pronounced in Zrand, to some extent, Se. Other than that very subtle effect, theab initio simulated Kα spectra present a very good agreementwith the experimental data (see Fig. 3) both on the overallshape and the intensity ratios.
B. The observed Kβ1,3 emission spectra
The values of the obtained averaged line energies and aver-aged relative intensity ratios for each line of Kβ1,3 or Kβ2
in each Lorentzian model for Se, Y, and Zr, are shown inTable IV. The corrected FWHM for the Kβ1 and Kβ3 diagramlines are presented in Table IV, and Figs. 7 and 8, respectively,together with values reported by other authors [6,18,26,27].The corrected FWHM values were taken from the observedFWHM through the method of Tochio et al. [28]. The Kβ1,3
spin doublet values observed and calculated in this paper arepresented in Table VI and Fig. 10, respectively, together withother observed values [6,18,26,27]. The Lorentzian modelwas used for an analytic representation of Kβ x-ray lines [27],and the results of the fitting analysis are shown in Fig. 2 forSe, Y, and Zr. The errors quoted in Tables IV and VI are,thus, only statistical errors resulting from the fitting processesand the limited reproducibility of the experimental setup. InFig. 7, the linear function W shown by a solid line wasfound by the least-squares method with the corrected FWHM
of Sc Kβ1 as an initial value in order to compare with therecommended FWHM of Campbell and Papp [46]. We cansee that the overall variation behavior with Z of the correctedFWHM of the Kβ1 line may be linearly fitted with the functionW = 0.257 × Z − 4.364 and these values are consistent withthose of Ref. [46] marked in dots and dashed line betweenthe elements Fe and Zr. What happens to the change in thecorrected FWHM, when the Z number is over 40, has towait for future research. Furthermore, when the value of Zis less than 26, the corrected FWHM largely deviates from therecommended value. This value is a little different from thefunction W = 0.300 × Z − 5.445 previously reported [27].This difference is due to the fact that the Kβ1 linewidths [27]data were evaluated by adding the widths of the Se, Y, andZr Kβ1 lines. The obtained W values were corrected usingthe corrected FWHM of Kβ1 lines in the same elements. Weconsider the obtained linear function W to be more reliable.We will discuss this later.
In Fig. 8, the linear function W , represented by a solidline, was obtained using the corrected FWHMs of Zn andGe Kβ3 in order to compare with the data of Campbell andPapp [46] because these elements have comparatively smalleffects of the shake processes [KM] on the diagram lines in3d elements as seen in Fig. 9. The corrected FWHM valuesof the Kβ3 lines between Cu and Zr, with the exception of Se,are consistent with those of the Kβ3 from Ref. [46], althoughthe corrected FWHM values of the Kβ3 lines in 3d elementsare very different from those reported therein. The cause ofthe deviation of the Se Kβ3 line from the linear function Wis unknown. The explanation of the tendency of the correctedFWHM of the Kβ3 line is much more difficult than that inthe Kβ1 line case. It is necessary to collect experimental dataof Kβ3 lines with atomic Z of 40 or more and 20 or less,using this type of x-ray spectrometer in order to elucidate thecomplexity of the tendency of the corrected FWHM in Kβ3 asa function of Z .
The Kβ1,3 spin doublet values observed and calculatedin this paper are presented in Table VI together with otherreported values [29,46,51] and in Fig. 10 together with otherobserved values [6,18,26,27]. From the fitting analysis of theKβ1,3 spectra in these elements, the photon energies of theKβ1,3 and Kβ ′′ or Kβ2 lines are presented in Tables IV andVI together with the other reports [29,51] for comparison.The spin doublet energy dependency on the atomic numberZ is obtained using the data from Ito et al. [27] and thepresent paper, and the logarithmic function is almost thesame as that reported by Ito et al. [27], that is, log10 S =0.065(Z − 24.879) + 0.149. However, the physical meaningof this function is not clarified yet.
Now we considered the validity of the logarithmic functionof the spin doublet (Fig. 10) in what concerns the Kβ1 andKβ3 lines (Figs. 7 and 8). The FWHM by fitting analysis ofthe measured data of Ca Kβ1,3 emission lines was obtained inthe following way: The double-crystal x-ray spectrometer wasused to measure Ca Kβ1,3,5 spectra in a CaCO3 compound,using Si(220) analytical crystals. The primary target was tung-sten, and the tube voltage and tube current were 40 kV and 70mA, respectively. The step angle in 2θ was 0.005◦ and themeasuring time was 500 s/point. Ca Kβ1,3 spectral lines can-not be separated even by a high-resolution measurement. The
052820-10

STRUCTURE OF Kα1,2- AND Kβ1,3-EMISSION … PHYSICAL REVIEW A 102, 052820 (2020)
TABLE VI. Comparison of experimental and theoretical K x-ray line energies for Se, Y, and Zr. All energy values are in eV.
Se (Z = 34) Y (Z = 39) Zr (Z = 40)
Present paper Kα1 11222.383(94) 14958.389(24) 15774.87(31)Experiment Kα2 11181.439(96) 14883.403(39) 15690.77(30)
Kα1-Kα2 40.944(4) 74.985(15) 84.109(44)Kα11 11222.380(89)Kα21 11181.48(10)
Kα11-Kα21 40.905(15)Kβ1 12495.911(26) 16737.89(29) 17667.78(30)Kβ3 12490.094(44) 16726.02(28) 17654.31(23)
Kβ1-Kβ3 5.817(19) 11.860(51) 13.463(66)Kβ2 12652.840(77) 17010.57(16)
Present paper Kα1 11222.4 14958.3 15774.9Theory Kα2 11181.6 14883.1 15690.7
Kα1-Kα2 40.8 75.2 84.2Kβ1 12495.9 16738.5 17667.8Kβ3 12490.1 16726.6 17654.2
Kβ1-Kβ3 5.8 11.9 13.6Kβ2 12653.4 17010.5
Bearden Kα1 11222 14958.8 15775.1Experiment Kα2 11181.6 14882.9 15690.9
Kα1-Kα2 40.4 75.5 84.2Deslattes Kα1 11222.52(12) 14958.54(27) 15774.914(54)Experiment Kα2 11181.53(31) 14882.94(26) 15690.645(50)
Kα1-Kα2 40.99 75.6 84.269Deslattes Kα1 11222.55(48) 14958.14(53) 15774.87(54)Theory Kα2 11181.82(52) 14883.06(58) 15690.61(60)
Kα1-Kα2 40.73 75.14 84.26Bearden Kβ1 12495.9 16737.8 17667.8Experiment Kβ3 12489.6 16725.8 17654
Kβ1-Kβ3 6.3 12 13.8Kβ2 12652.2 17015.4
Deslattes Kβ1 12496.03(67) 16738.08(67) 17666.578(76)Experiment Kβ3 12489.7(10) 16725.9(10) 17652.628(75)
Kβ1-Kβ3 6.33 12.18 13.95Kβ2 12652.29(96) 17015.6(14)
Deslattes Kβ1 12496.5(12) 16738.4(12) 17667.4(12)Theory Kβ3 12490.3(12) 16726.8(13) 17654.1(13)
Kβ1-Kβ3 6.2 11.6 13.3Kβ2 12656.38(73) 17012.08(62)Kβ2 12655.11(33) 17015.30(49)
observed FWHM is 1.63 eV, and, when this value is correctedfor the instrumental function in this x-ray spectrometer [28],it becomes 1.58 eV. In Fig. 10, the spin doublet in Ca Kβ1,3
spectra is about 0.7 eV from the logarithmic function. FromFigs. 7 and 8, the corrected FWHMs of Kβ1 and Kβ3 diagramlines are about 0.8 and 0.7 eV, respectively. Assuming thatthe Kβ1 and the Kβ3 lines are separated by only 0.7 eV, thecombined width becomes 1.5 eV, which matches the observedvalue. Therefore, the linear functions obtained in Figs. 7 and8 are considered to be reliable.
In Table VI our experimental and theoretical results con-cerning Kα1,2, Kβ1,3, and Kβ2 transition energies for Se,Y, and Zr have been compared with the results of other au-thors. Our theoretical predictions presented here have beendetermined in the framework of the MCDF method [52] andaveraging over all the individual transitions within a givenline. In what concerns the accuracy of our MCDF predictions,we estimate that the precision for the calculated values for
the positions of the Kα1, Kα2, Kβ1, Kβ3, and Kβ2 x-raydiagram lines is on the order of 0.2–0.5 eV [52]. This accuracyconfirms the very good agreement between our theoreticaland our experimental results. The photon energies of Kα1,2
and Kβ1,3 emission lines in the present paper are consistentwith those of Bearden [29] and Deslattes et al. [51] and theenergy value of our theoretical Y Kβ2 spectral line, althoughconsistent with our experimental value, disagrees with valuesof those authors [51].
The simulated shapes of the Kβ lines of Se, Y, and Zrare presented in Fig. 3 and as can be seen, the overall agree-ment with the experimental data is very good for Se with aslight overestimation of the energy of the [1s3d] satellite ofaround 4 eV. However, the calculated shake probabilities seemto agree very well for Se. For Zr, the intensity ratio of themultiplet agrees very well with the experimental data, but thecalculated [1s3d] shake probability is probably overestimated,leading to a shoulder on the high-energy side of the Kβ1 peak,
052820-11

Y. ITO et al. PHYSICAL REVIEW A 102, 052820 (2020)
FIG. 10. The spin doublet energies of Kβ1 and Kβ3 lines forelements Se, Y, and Zr. The least-squares fitting was executed usingboth data in the present paper and Ito et al. [27]. (a) Ito et al. [27].(b) Hölzer et al. [6]. (c) Anagnostopolos et al. [18]. (d) Pham et al.[26]. The value of the logarithmic function is well consistent withthat in Ito et al. [27].
not visible in the measured spectrum. Furthermore, such asin Se, the satellite centroid is shifted towards the high-energyside of the x-ray diagram line. Still, the overall agreement ofthe line shape is very good. Regarding Y, the agreement is notas good as for Se and Zr as the Kβ3/Kβ1 ratio is around 10%lower than the experimental one, and for the shake structure,we find a similar behavior as in the Zr spectra with a consistentshake probability and a slight shift of the [1s3d] satellite peaktoward the high-energy side.
V. SUMMARY AND CONCLUSIONS
Se, Y, and Zr Kα1,2 and Kβ1,3 spectra were measuredusing a high-resolution two-crystal x-ray spectrometer. Thevalues of the energies, FWHM, and ratio are compared withthe literature and will contribute to future theoretical researchin this field. The correction values for the FWHM of Kα1
and Kα2 agree well with the recommended full width at halfmaximum values of Campbell and Papp [46].
The values of the spin doublet in the Kβ1,3 of Se, Y, andZr are found to agree with the extrapolation of what has beenreported by Ito et al. [27]. This is very important for the eval-uation of the spin doublet observed by the x-ray spectrometer.
In what concerns the asymmetric index in the elementsunder study in this paper, the contribution of the [1s3d] shakeprocess is observed only for Se. However, on Y and Zr,the effect of the [KN] and [KO] shake processes increases,whereas the effect of [KM] decreases. Therefore, it is difficultto confirm the existence of asymmetry.
The computed spectra in this paper required a huge com-putational effort due to the very large number of radiative andradiationless transitions. This high number of transitions isneeded to calculate all of the parameters for a simulation of themultiplet line shapes in an ab initio way. The simulated spectraare in good agreement with the high-resolution experimentalspectra from the double-crystal spectrometer although, for Y,the simulated line shape of the Kβ1,3 multiplet presents adiscrepancy on the intensity ratio of around 10%. From thetheoretical results, we see that the [1s3p] satellite lines mightalso contribute to the peak asymmetry of these elements,calling for more research on the simulation of other transitionmetals with Z higher than 40.
ACKNOWLEDGMENTS
This research was supported, in part, by Fundaçãopara a Ciência e Tecnologia (Portugal) under ResearchCenter Grants No. UID/FIS/04559/2020 (LIBPhys) andNo. UID/MULTI/04046/2020 (BioISI), and by the ProjectNo. PTDC/FIS-AQM/31969/201, “Ultra-high-accuracy x-ray spectroscopy of transition-metal oxides and rare earths.”Laboratoire Kastler Brossel (LKB) is a Unité Mixte deRecherche de Sorbonne University-UPMC, de ENS-PSLResearch University, du Collège de France et du CNRSNo. 8552’. P.I. is a member of the Allianz Program ofthe Helmholtz Association, contract No. EMMI HA-216“Extremes of Density and Temperature: Cosmic Matter inthe Laboratory.” P.I. acknowledges financing by the Pro-gramme Hubert Curien PESSOA 38028UD and ProgramNo. PAUILF 2017-C08. This work was also supportedby the National Science Centre (Poland) under Grant No.2017/25/B/ST2/00901.
[1] J. Finster, G. Leonhardt, and A. Meisel, J. de Phys. Colloq. 32,C4-218 (1971).
[2] B. Ekstig, E. Kallne, E. Noreland, and R. Manne, J. de Phys.Colloq. 32, C4-214 (1971).
[3] M. Pessa, E.-K. Kortela, A. Suikkanen, and E. Suoninen, Phys.Rev. A 8, 48 (1973).
[4] M. Deutsch, G. Hölzer, J. Härtwig, J. Wolf, M. Fritsch, and E.Forster, Phys. Rev. A 51, 283 (1995).
[5] M. Deutsch, O. Gang, G. Hölzer, J. Härtwig, J. Wolf, M.Fritsch, and E. Forster, Phys. Rev. A 52, 3661 (1995).
[6] G. Hölzer, M. Fritsch, M. Deutsch, J. Härtwig, and E. Forster,Phys. Rev. A 56, 4554 (1997).
[7] M. J. Druyvesteyn, Z. Phys. 43, 707 (1927).[8] D. Doniach and M. Sunjic, J. Phys. C 3, 285 (1970).
[9] K. Tsutsumi, J. Phys. Soc. Jpn. 14, 1696 (1959).[10] A. Meisel and W. Nefedov, Ann. Phys. (Leipzig) 464, 48
(1961).[11] A. Meisel and W. Nefedov, Ann. Phys. (Leipzig) 464, 53
(1961).[12] W. I. Nefedov, Bull. Acad. Sci. USSR, Phys. Ser. 28, 724
(1964).[13] K. Tsutsumi and H. Nakamori, in X-ray Spectra and Electronic
Structure of Matter, edited by A. Faessler and G. Wiech (Foto-druck Frank OHG, Munchen, 1973).
[14] S. I. Salem, G. M. Hochney, and P. L. Lee, Phys. Rev. A 13, 330(1976).
[15] K. Tsutsumi, Y. Iwasaki, O. Aita, K. Ichikawa, and T. Watanabe,J. Phys. Soc. Jpn. 47, 1920 (1979).
052820-12

STRUCTURE OF Kα1,2- AND Kβ1,3-EMISSION … PHYSICAL REVIEW A 102, 052820 (2020)
[16] K. S. Srivastava, R. L. Srivastava, O. K. Harsh, and V. Kumar,Phys. Rev. B 19, 4336 (1979).
[17] K. S. Srivastava, S. Singh, A. K. Srivastava, R. S. Nayal, A.Chaubey, and P. Gupta, Phys. Rev. A 25, 2838 (1982).
[18] D. F. Anagnostopoulos, R. Sharon, D. Gotta, and M. Deutsch,Phys. Rev. A 60, 2018 (1999).
[19] C. T. Chantler, M. N. Kinnane, C.-H. Su, and J. A. Kimpton,Phys. Rev. A 73, 012508 (2006).
[20] Y. Ito, T. Tochio, H. Ohashi, M. Yamashita, S. Fukushima,M. Polasik, K. Słabkowska, Ł. Syrocki, E. Szymanska, J.Rzadkiewicz, P. Indelicato, J. P. Marques, M. C. Martins, J. P.Santos, and F. Parente, Phys. Rev. A 94, 042506 (2016).
[21] T. Ishizuka, T. Tochio, A. M. Vlaicu, D. Osawa, Y. Ito, T.Mukoyama, S. Hayakawa, Y. Gohshi, and T. Shoji, Adv. X-RayChem. Anal., Jpn. 30, 21 (1998).
[22] W. C. Sauder, J. R. Huddle, J. D. Wilson, and R. E. Lavilla,Phys. Lett. A 63, 313 (1977).
[23] R. D. Deslattes, R. E. LaVilla, and A. Henins, Nucl. Instrum.Methods, Phys. Res. 152, 179 (1978).
[24] R. E. LaVilla, Phys. Rev. A 19, 717 (1979).[25] J. Bremer and H. Sorum, Phys. Lett. A 75, 47 (1979).[26] T. L. Pham, T. V. Nguyen, J. A. Lowe, I. P. Grant, and C. T.
Chantler, J. Phys. B: At., Mol. Opt. Phys. 49, 035601 (2016).[27] Y. Ito, T. Tochio, M. Yamashita, S. Fukushima, A. M. Vlaicu,
Ł. Syrocki, K. Słabkowska, E. Weder, M. Polasik, K. Sawicka,P. Indelicato, J. P. Marques, J. M. Sampaio, M. Guerra, J. P.Santos, and F. Parente, Phys. Rev. A 97, 052505 (2018).
[28] T. Tochio, Y. Ito, and K. Omote, Phys. Rev. A 65, 042502(2002).
[29] J. A. Bearden, Rev. Mod. Phys. 39, 78 (1967).[30] M. H. Mendenhall, A. Henins, L. T. Hudson, C. I. Szabo, D.
Windover, and J. P. Cline, J. Phys. B: At., Mol. Opt. Phys. 50,115004 (2017).
[31] J. Machado, C. I. Szabo, J. P. Santos, P. Amaro, M. Guerra, A.Gumberidze, G. Bian, J. M. Isac, and P. Indelicato, Phys. Rev.A 97, 032517 (2018).
[32] J. Machado, G. Bian, N. Paul, M. Trassinelli, P. Amaro, M.Guerra, C. I. Szabo, A. Gumberidze, J. M. Isac, J. P. Santos, J. P.Desclaux, and P. Indelicato, Phys. Rev. A 101, 062505 (2020).
[33] J. Machado, G. Bian, N. Paul, M. Trassinelli, P. Amaro, M.Guerra, C. I. Szabo, A. Gumberidze, J. M. Isac, J. P. Santos,
J. P. Desclaux, and P. Indelicato, J. Phys. B: At., Mol. Opt. Phys.52, 215004 (2019).
[34] J. P. Desclaux, Comput. Phys. Commun. 9, 31 (1975).[35] P. Indelicato and J. P. Desclaux, Phys. Rev. A 42, 5139
(1990).[36] P. J. Mohr, G. Plunien, and G. Soff, Phys. Rep. 293, 227 (1998).[37] P. O. Löwdin, Phys. Rev. 97, 1474 (1955).[38] W. R. Johnson, Atomic Structure Theory (Springer-Verlag,
Berlin/Heidelberg, 2007).[39] E. J. McGuire, in Atomic Inner-Shell Processes, edited by B.
Crasemann (Academic, New York/London, 1975), pp. 293–330.
[40] F. Bloch, Phys. Rev. 48, 187 (1935).[41] V. F. Demekhin and V. P. Sachenko, in Röntgenspektren und
Chemische Bindung, 58 (VEB Repprocolor, Leipzig, 1966).[42] T. Åberg, Phys. Lett. A 26, 515 (1968).[43] T. A. Carlson and C. W. Nestor, Phys. Rev. A 8, 2887 (1973).[44] L. G. Parratt, Phys. Rev. 50, 1 (1936).[45] Y. Gohshi, H. Kamada, K. Kohra, T. Utaka, and T. Arai, Appl.
Spectrosc. 36, 171 (1982)[46] J. L. Campbell and T. Papp, At. Data Nucl. Data Tables 77, 1
(2001).[47] M. O. Krause and J. H. Oliver, J. Phys. Chem. Ref. Data 8, 329
(1979).[48] Y. Ito, T. Tochio, S. Fukushima, A. Taborda, J. M. Sampaio, J. P.
Marques, F. Parente, P. Indelicato, and J. P. Santos, J. Quant.Spectrosc. Radiat. 151, 295 (2015).
[49] A. Shigemi, T. Tochio, T. Ishizuka, N. Shigeoka, K. Ito, A. M.Vlaicu, Y. Ito, T. Mukoyama, and Y. Gohshi, X-Ray Spectrom.28, 478 (1999).
[50] Y. Ménesguen, M.-C. Lépy, Y. Ito, M. Yamashita, S.Fukushima, M. Polasik, K. Słabkowska, Ł. Syrocki, E. Weder,P. Indelicato, J. P. Marques, J. M. Sampaio, M. Guerra, F.Parente, and J. P. Santos, J. Quant. Spectros. Radiat. 236,106585 (2019).
[51] R. D. Deslattes, Ernest G. Kessler, Jr., P. Indelicato, L. deBilly, E. Lindroth, and J. Anton, Rev. Mod. Phys. 75, 35(2003).
[52] M. Polasik, Phys. Rev. A 39, 616 (1989); 39, 5092 (1989);40, 4361 (1989); 41, 3689 (1990); 52, 227 (1995); 58, 1840(1998).
052820-13