physician group practice (pgp) demonstration project-physician group practice (pgp) demonstration...
TRANSCRIPT

Government Programs: Lessons from the CMS
Physician Group Practice (PGP) Demonstration Project-
Emphasis on Heart Failure
33rdrd
National Pay for Performance SummitNational Pay for Performance SummitFebruary 28, 2008February 28, 2008
F. Douglas Carr, MD, MMMMedical Director, Education & System Initiatives
Billings Clinic

Outline•
Intro Billings Clinic
•
PGP mechanics•
Focus on our approach to Heart Failure
•
Performance Year 1 Results•
Observations
•
Questions•
Barriers to Remote Monitoring

What is Billings Clinic?•
Group Practice–
w/ 225 Physicians, 65 midlevels, 29 (~50 sub-) specialties (Allergy to Urology)
–
10 clinic locations–
272 (220) bed tertiary hospital–
Manage/support 7 CAHs –
3000+ Committed Employees–
3rd
largest employer in Montana
•
Integrated Delivery System/ Medical Foundation–
Board of Directors: community-based–
Leadership Council (Internal Board): physician majority + senior
administrators

Service Region Locations
Riverton
Fremont
Casper
Powell
Park
Cody
Hot Springs
Thermopolis
Bighorn
LovellGreybull
WashakieWorland
SheridanSheridan
Johnson
Buffalo
Campbell
GilletteCrook
LincolnFlathead
Sanders
Mineral
Lake
Glacier
Missoula
Ravalli
Beaverhead
GraniteDeer
Lodge
Powell
Toole
Pondera
Teton
Lewis & Clark
Cascade
Jefferson
Silver Bow
Broa
dwat
er
Madison
Gallatin
Park
Sweet Grass
Stillwate
r
MeagherWheatland
Judith Basin
Chouteau
Libe
rty Hill
Blaine
Fergus
Golden Valley
CarbonBig Horn
Yellowstone
Musselshell
Petroleum
Phillips
Valley
Garfield
Rosebud
Treasure
Powder River
Carter
CusterFallon
PrairieWibaux
Dawson
McCone
Richland
Roosevelt
SheridanDaniels
Missoula
Butte
Dillon
Havre
Lewistown
Livingston
Columbus Billings
Red Lodge
Hardin
RoundupForsyth Miles City Baker
Glendive
Sidney
Wolf PointGlasgow
Weston
Natrona
Great Falls
Kalispell
I-15 I-90
I-25
Williams
Williston
Divide
McKenzie
Dickinson
Golden V
alleyB
illings
Dunn
Stark
Slope
BowmanAdams
Hettinger
I-94
HWY 2
Scobey
Big Timber Colstrip
Bozeman
Affiliate Management Services
Columbus -
Stillwater Hospital
Colstrip -
Colstrip Clinic
Forsyth -
Rosebud Healthcare
Lovell -
North Big Horn Hospital
Red Lodge -
Beartooth Hospital
Big Timber -
Pioneer Medical Center
Livingston -
Livingston Healthcare
Scobey -
Daniels Memorial Hospital
Clinic Locations & Number of Providers
Billings Clinic -
Cody (7 MDs, 1 PA)
Bozeman OB/Gyn (6 MDs, 2 NPs, 1 PA)
Billings Clinic -
Forsyth (1 PA)
Billings Clinic-
Main (200 MD, 47 PA)
Billings Clinic -
West (8 MDs, 1 PA)
Billings Clinic -
Miles City (10 MDs, 3 PAs)
Billings Clinic -
Red Lodge (4 MDs)
Billings Clinic -
Columbus (2 MDs, 1 NP)
Billings Clinic -
Heights (4 MDs, 1 PA)
Counties with Affiliate or Branch Clinic
Other Service Area CountiesDecember 2007

Montana: 147,138 square miles and 922,002 people

CMS PGP Objectives
Health Care Education and Research
•
Encourage coordination of Part A & Part B•
Coordinate care for chronically ill and high cost beneficiaries in an efficient manner
•
Decrease the growth in Medicare spending over the next 3 years

Everett, WA –
Everett Clinic
Marshfield, WI –
Marshfield Clinic
Springfield, MO –
St Johns
Danville, PA-Geisinger
Billings, MT-Billings Clinic
St. Louis Park, MN –
Park NicolletWinston-Salem, NC-Novant- Forsyth
Physician Group Practices
Integrated Delivery Systems
Academic & Network Org.Middletown, CT –
Integrated Resources for Middlesex Area (IRMA)
Ann Arbor, MI -
University of Michigan
Bedford, NH-Dartmouth Hitchcock
10 Organizations
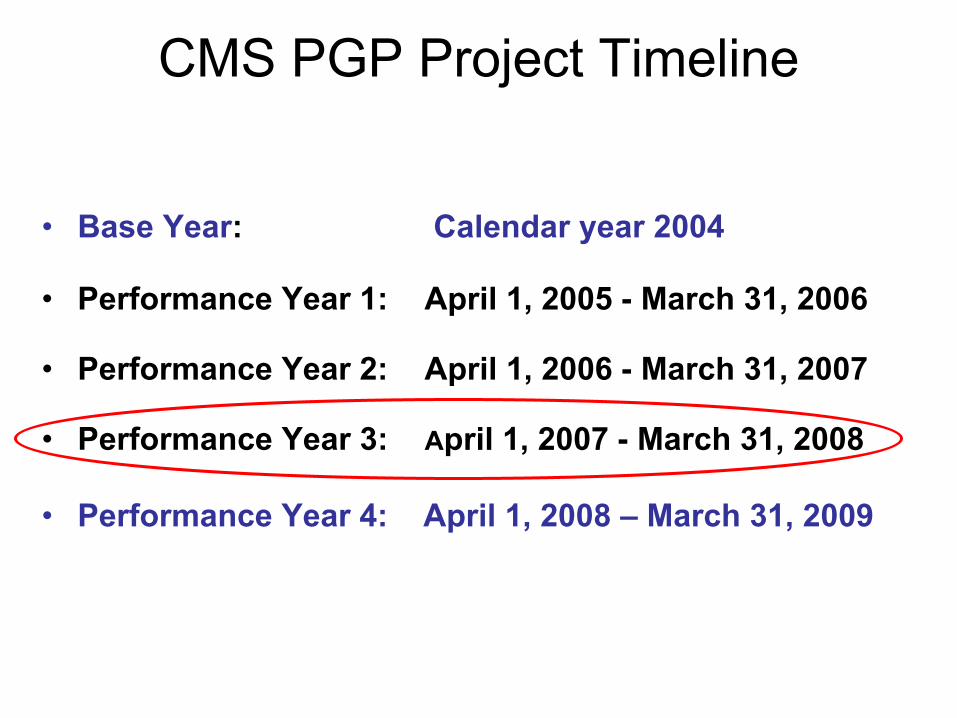
CMS PGP Project Timeline
•
Base Year:
Calendar year 2004
•
Performance Year 1:
April 1, 2005 -
March 31, 2006
•
Performance Year 2:
April 1, 2006 -
March 31, 2007
•
Performance Year 3:
April 1, 2007 -
March 31, 2008
•
Performance Year 4: April 1, 2008 –
March 31, 2009

PGP Demo Concepts
• Medicare Fee For Service continues as before• If PGP is able to reduce the growth of Medicare
spending for the cohort under its care compared to a regional comparison, CMS will share part of its savings with PGP
• Budget neutral project for CMS
• Meeting Financial Target= “Gate”
• Once “Open”, PGP’s portion dependent on meeting Quality Measures

CMS PGP Beneficiary Assignment
• To be assigned to PGP:– PGP must provide to beneficiary
• at least one E&M office or other OP service• plurality of E&M office/OP services provided in the year
• To be assigned to Comparison Group– Beneficiary must have at least one E&M Service– Cannot have had any E&M services at PGP during the
current year or been assigned to the PGP previously.– Must reside in a service area county.– Service area counties must provide 1% of eligible
beneficiaries.

PY-1 Billings Clinic versus Comparison Group Service Area Distribution
Riverton
Fremont
Casper
Park
10 V 12 %
Hot Springs
Thermopolis
Bighorn3 V 4 %
WashakieWorland
Sheridan1 V 16 %
Johnson
Buffalo
Campbell
GilletteCrook
LincolnFlathead
Sanders
Mineral
Lake
Glacier
Missoula
Ravalli
Beaverhead
Granite
Deer Lodge
Powell
Toole
Pondera
Teton
Lewis & Clark Cascade
Jefferson
Silver Bow
Broa
dwat
er
Madison
Gallatin
Park
Sweet Grass
Stillwate
r
MeagherWheatland
Judith Basin
Chouteau
Libe
rty Hill
Blaine
Fergus
Golden Valley
CarbonBig Horn
Yellowstone
Musselshell
Petroleum
Phillips
Valley
Garfield
Rosebud
Treasure
Powder River
Carter
CusterFallon
Prairie Wibaux
Dawson
McCone
Richland
Roosevelt
SheridanDaniels
Missoula
Anaconda
Butte
Dillon
Bozeman
Havre
Lewistown
1 v 7 %4 v 2 %
61v 40 %
5 v 3 %
Hardin
2 v 1 % 2 V 3 %
8 v 4 %Baker
1 v 5 %
Sidney
CulbertsonWolf Point
2 v 3 %
16.4% of Assigned Beneficiaries in PY-1 are outside of the PGP Service area
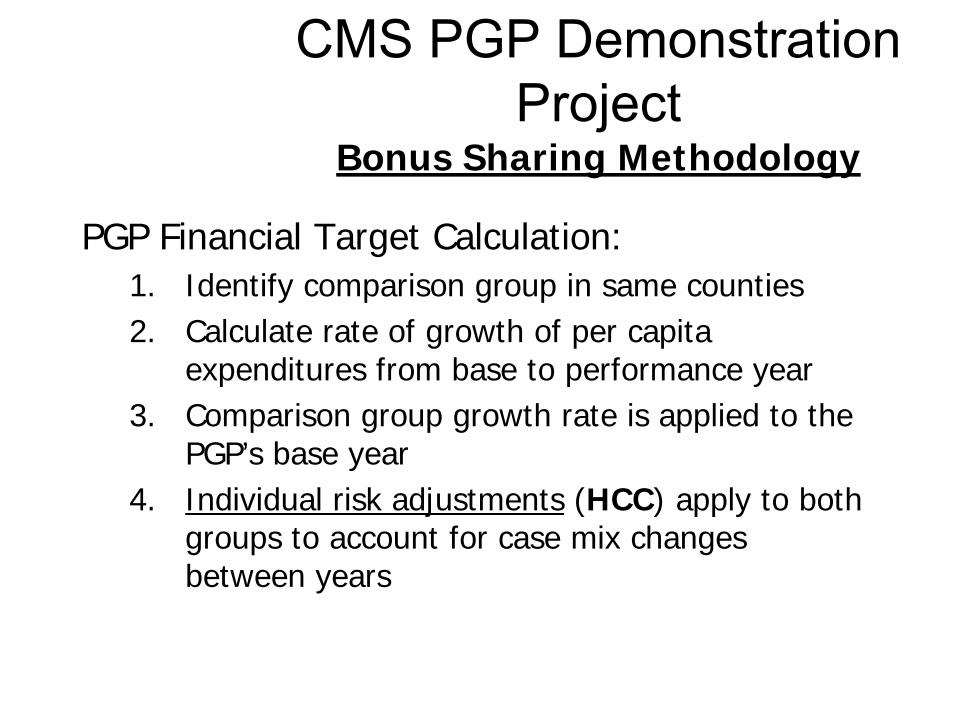
CMS PGP Demonstration Project
Bonus Sharing Methodology
PGP Financial Target Calculation:1. Identify comparison group in same counties2. Calculate rate of growth of per capita
expenditures from base to performance year3. Comparison group growth rate is applied to the
PGP’s base year4. Individual risk adjustments (HCC) apply to both
groups to account for case mix changes between years
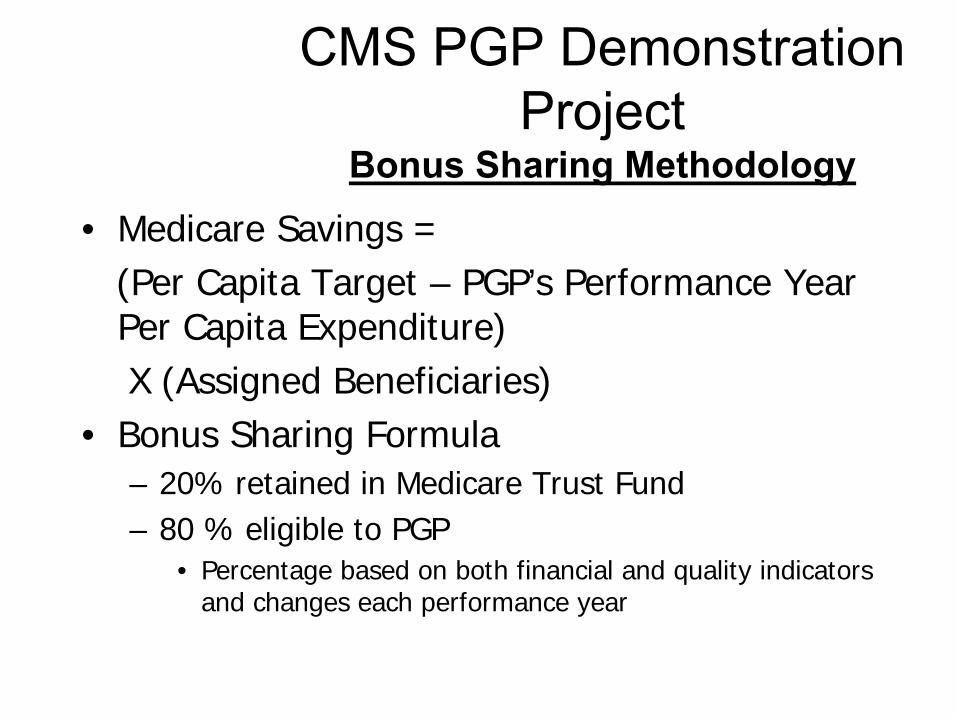
CMS PGP Demonstration Project
Bonus Sharing Methodology• Medicare Savings =
(Per Capita Target – PGP’s Performance Year Per Capita Expenditure) X (Assigned Beneficiaries)
• Bonus Sharing Formula– 20% retained in Medicare Trust Fund– 80 % eligible to PGP
• Percentage based on both financial and quality indicators and changes each performance year

PGP Project Financial Model
SVNGS >2%
20% 20% ⇒⇒ CMSCMS
80% 80% Performance PayPerformance Pay
0.3 Q
0.7 E
0.4 Q
0.6 E
0.5 Q
0.5E
Y1 Y2 Y3 Y4
Q: QualityE: Efficiency
0.5
Q
0.5 E

CMS PGP Quality Measures
•
Year 1:
Diabetes•
Year 2:
Year 1 plus HF
and CAD
•
Year 3:
Year 2 plus Hypertension and colorectal and breast
cancer
screenings
+ flu and pneumonia vaccines
Total 32
OutpatientOutpatient

Quality Measures: Diabetes % of patients in performance year with
Claims Based•
Hgb-A1c tests
•
LDL test•
Microalbumin testing or Dx/Tx for nephropathy
•
Retinal exam by MD/OD:1year/high risk,2 years/low risk
Chart/Hybrid Based•
HgbA1c ≤
9.0%
•
BP< 140/90•
LDL<130
•
Complete foot exam documented
•
Influenza vaccine•
Pneumoccocal vaccine

Quality Measures: HF % of patients in performance year with
Claims Based•
LV-EF in same year if hospitalized for HF
•
Chart/Hybrid Based•
Qualitative/quantitative LVF Assessment
•
Visits Weight documented•
Visits BP documented•
HF Education documented in last 6 months
•
LVSD on ß-blocker•
LVSD on ACEI•
HF/AF on Warfarin•
Influenza vaccine•
Pneumococcal vaccine

Quality Measures: CAD % of patients in performance year with
Claims Based•
Lipid profile
Chart/Hybrid Based•
LDL<130
•
Antiplatelet Rx•
Lipid Rx
•
Hx MI, on ß-blockers•
BP @ last visit
•
DM &/or LVSD on ACEI

Quality Measures: Preventive Care % of patients in performance year with
Claims Based•
♀
50-69 y.o. w/
mammogram in current or prior year
Chart/Hybrid Based•
“Screened”
for colon
Cancer•
BP documented
•
Last BP<140/90 •
If BP is >140/>90 documented plan of care
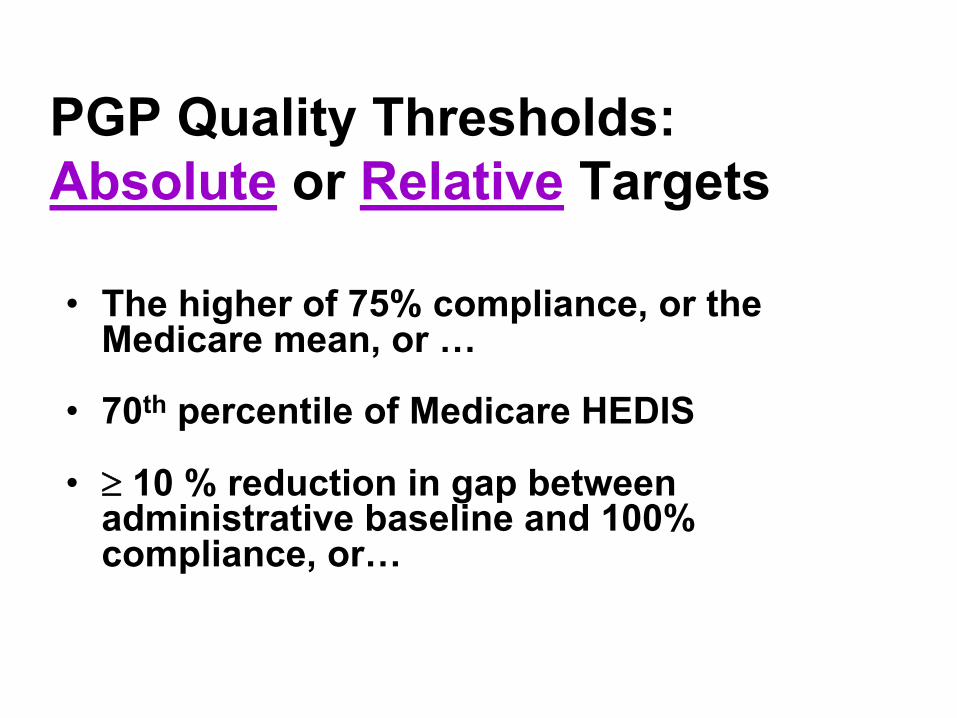
PGP Quality Thresholds: Absolute
or Relative
Targets
•
The higher of 75% compliance, or the Medicare mean, or …
•
70th
percentile of Medicare HEDIS
•
≥
10 % reduction in gap between administrative baseline and 100% compliance, or…

Base Year Data: Where does the $ go?
Components of Medicare Expenditures For Billings Clinic• Inpatient 40%• Hospital OP 24%• Part B 22%• SNF 7%• Home Health 3%• DME 4%

CMS PGP Mantra
•
Quality Measures
are OUTPATIENT driven.
•
Financial Savings
are INPATIENT
driven.

Base Year Data: What Diagnoses?
•
HCC 80: CHF 1,945 discharges•
HCC 92: Heart Arrhythmias 1,898
•
HCC 15-19: Diabetes 1,683 •
HCC 108: COPD 1,887
•
HCC 79: Card-Resp Failure 1,305•
HCC 105: Vascular Disease 969
•
HCC 131: Renal Failure 743

CMS PGP Patient Focus AreasCMS PGP Patient Focus Areas
METABOLIC DISEASE:
DIABETES
HTNCARDIOLOGY:
HF
CAD
Needless Admissions:5 Wishes
Nursing HomePsychiatryMedication
Reconciliation
PREVENTIVE CARE:
Colorectal & Breast Cancer Screening
Immunizations

EMR: Vehicle for Process Improvement
•
Chronic Disease Management–
Disease Registry–
Disease Management Modules (DM, HF, CAD, HTN)–
Clinical Guidelines–
Reports for organization and providers–
Patient information
•
Health Maintenance–
Cancer, Osteoporosis, etc. Screening–
Immunizations•
Patient Safety–
Medication reconciliation during transitions of care
Health Care Education and Research

Heart Failure•
Cost SavingsGoal: Decrease ‘All Cause’
Admissions 10-20% 50%–
Existing HF Clinic: 200 750 patients–
Technology leverage
•
Quality Improvements–
HF Clinic Re-design: Expand RNs, daily IP/OP coverage, Mid-level
–
Adopt new Treatment Guidelines–
HF Management POC Modules in Cerner–
Feedback to providers with patient report cards
–
HF Registry build > 3,000–
Effective Patient Education
Health Care Education and Research
CMS Quality Measures:
□□
Ejection Fraction Test
□□
Blood Pressure Screen
□□
Patient Education
□□
ACE/ARB Therapy
□□
Beta Blocker Therapy
□□
Smoking Status

Heart Failure Disease Module:
Alerts for Providers

E-form for Heart Failure Registry and Tel-
Assurance Program Enrollment

E-form for documenting Smoking Status and Education

E-form for documenting Heart Failure Education

Heart Failure Point-of-Care Summary Screen

1997 –
2005
: HF Program Prior to PGP
•
Outpatient tele-management program (POTs), within cardiac rehab–
HF inpatient pathway provider referral
•
Physician-directed Nurse management–
2.6 FTEs (RNs); M-F 0800-1700
–
150+ patients: discharged at 1 year if stable–
Reduced HF hospitalizations by about 10-20%?
•
PGP/CMS-RTI stats 2004: 1800 HF patients, 1900 admissions
•
How to have a greater impact?

Interactive Telephone System with Web-enabled Data Tracking
•
Developed @ Evanston Northwestern Hospital by Randy Williams, MD in late 1990’s
•
Utilizes daily
monitoring system for patients via Interactive Voice data collection
•
Validated, proven system that manages by exception
•
Allows for 1 RN to follow 2-300 patients•
Has demonstrated reduction of all-cause hospitalization >50% @ some hospitals

Interactive Telephone System with Web-enabled Data Tracking
•
Patients call daily between 4 AM and Noon
•
Data appears immediately on a web server
•
HF “Care Coaches”
(RNs) call outliers
–
Manage per HF protocols (diuretic ∆)
–
Refer to HF Clinic MD/NPP or PCP
•
Goal: coordinate care w/“Tx Physician”

Recorded Questions
1.
Have you noticed more swelling in the last day?
2.
Did you wake up short of breath last night?
3.
Did you sleep in a chair or prop up with pillows more than usual last night?
4.
Have you had any lightheadedness or dizziness in the last day?
5.
Please enter this morning’s weight. Have you felt more sort of breath in the last day?

The Challenges of Patient Adherence
17%Other
19%Failure to Seek Care
16%Inappropriate Rx
Rx Noncompliance24%
Diet Noncompliance24%
Vinson J Am Geriatr Soc 1990;38:1290-5

Disease Severity / Future Financial Risk
# of
At R
isk
Indi
vidu
als
Care MgmtTargets
Existing Approach to Chronic Population Care Management
Top 5-10% of population
Unmet Need and Unmanaged Risk

Pharos Target Population
Disease Severity / Future Financial Risk
# of
At R
isk
Indi
vidu
als
Telephonic Enhanced Adherence Monitoring
The Target Population

Current model of HF Program•
6 RNs providing 7day/week coverage
for IP education/enrollment and OP care management.
•
IP Care:–
Focused on ADHF patients (Case ID: referral, registry, admit Dx,
BNP, etc.)
–
Core Measures documentation assisted by new Cerner Powerforms–
Discharge planning: Euvolemia & Early follow-up visit (5 days)–
Opportunity for enrollment for other patients with HF
•
OP care:–
RN triage and intervention (pre-approved protocols for diuretics/electrolyte management)
–
~500 patients w/ HF use TelAssurance©•
Daily telephone call in, IVR system•
5 questions + weight variances precipitates RN follow-up–
Minimum # (~50) called at least monthly, unable to use TA
•
Midlevel :
Available for post-hospital, emergent, and Rx Titration per physician discretion
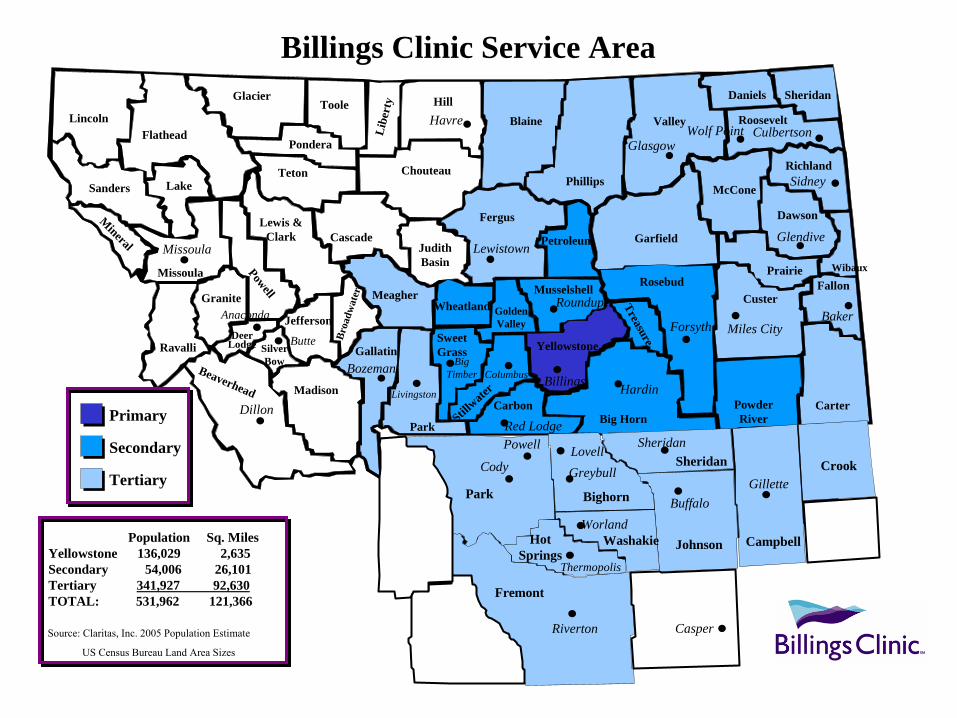
Billings Clinic Service Area
Riverton
Fremont
Casper
Powell
Park
Cody
Hot Springs
Thermopolis
Bighorn
LovellGreybull
WashakieWorland
SheridanSheridan
Johnson
Buffalo
Campbell
GilletteCrook
LincolnFlathead
Sanders
Mineral
Lake
Glacier
Missoula
Ravalli
Beaverhead
Granite
Deer Lodge
Powell
Toole
Pondera
Teton
Lewis & Clark Cascade
Jefferson
Silver Bow
Broa
dwat
er
Madison
Gallatin
Park
Sweet Grass
Stillwate
r
MeagherWheatland
Judith Basin
Chouteau
Libe
rty Hill
Blaine
Fergus
Golden Valley
CarbonBig Horn
Yellowstone
Musselshell
Petroleum
Phillips
Valley
Garfield
Rosebud
Treasure
Powder River
Carter
CusterFallon
Prairie Wibaux
Dawson
McCone
Richland
Roosevelt
SheridanDaniels
Missoula
Anaconda
Butte
Dillon
Bozeman
Havre
Lewistown
Livingston
Big Timber Columbus Billings
Red Lodge
Hardin
Roundup
Forsyth Miles CityBaker
Glendive
Sidney
CulbertsonWolf PointGlasgow
Primary
Secondary
Tertiary
Population Sq. MilesYellowstone 136,029 2,635Secondary 54,006 26,101Tertiary 341,927 92,630TOTAL: 531,962 121,366
Source: Claritas, Inc. 2005 Population Estimate
US Census Bureau Land Area Sizes
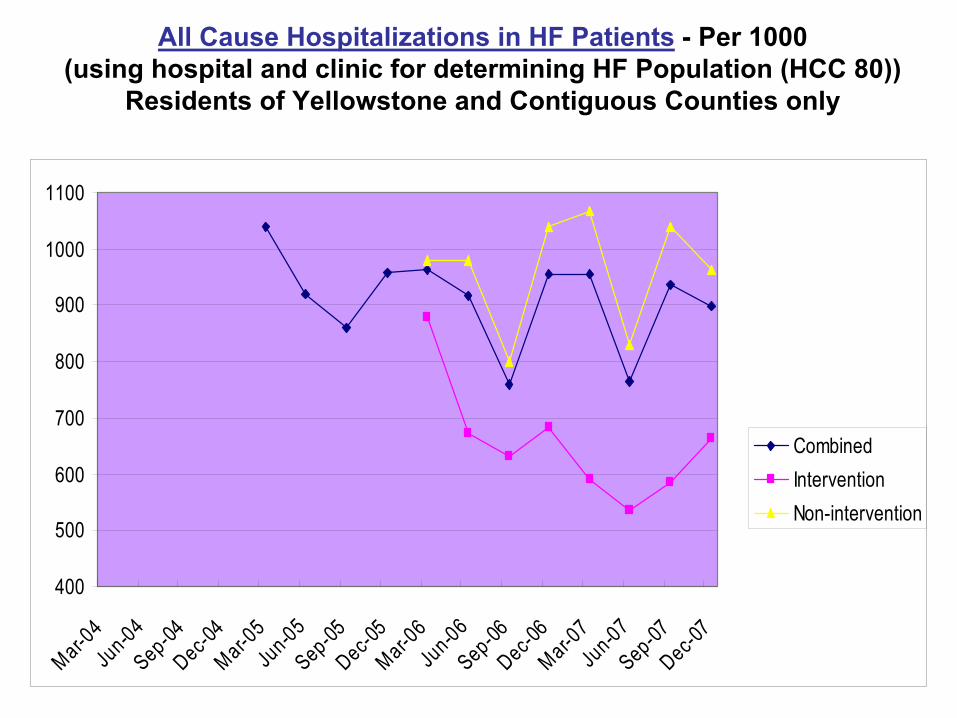
All Cause Hospitalizations in HF Patients
-
Per 1000 (using hospital and clinic for determining HF Population (HCC 80))
Residents of Yellowstone and Contiguous Counties only
400
500
600
700
800
900
1000
1100
Mar-04
Jun-04
Sep-04Dec-0
4Mar-0
5Ju
n-05Sep-05Dec-0
5Mar-0
6Ju
n-06Sep-06Dec-0
6Mar-0
7Ju
n-07Sep-07Dec-0
7
CombinedInterventionNon-intervention

Heart Failure Primary Dx Hospitalizations –
Per 1000 (using hospital and clinic data for determining
HF Population (HCC 80))
-
50.0
100.0
150.0
200.0
250.0
300.0
350.0
400.0
Mar-04
Jun-04Sep-04Dec-0
4Mar-0
5Jun-05Sep-05Dec-0
5Mar-0
6Jun-06Sep-06Dec-0
6Mar-0
7Jun-07Sep-07Dec-0
7
CombinedInterventionNon-intervention

Averted Admissions - All Payers
0.0020.0040.0060.0080.00
100.00
Jan-M
arch 06
April-J
une 06
July-
Sept 0
6Oct-
Dec 06
Jan-M
arch 07
April-J
une 07
July-
Sept 0
7Oct-
Dec 07
Quarters
Ave
rted
Adm
issi
ons
Averted Admissionsvs RTI Rate^̂
Averted Admissionsvs NonInterventionGroup^̂
>50% reduction in hospitalizationsor
~ 6/100/month enrolled in TA
Total: # 516 Medicare: ~80%

Averted Admissions - Medicare Program Savings
$-$100,000.00$200,000.00$300,000.00$400,000.00$500,000.00
Jan-M
arch 06
April-J
une 06
July-
Sept 0
6Oct-
Dec 06
Jan-M
arch 07
April-J
une 07
July-
Sept 0
7Oct-
Dec 07
Quarters
Med
icar
e Pr
ogra
m
Savi
ngs
Estimated programSavings vs RTI Rate
Estimated programSavings vsNonInterventionGroup
Estimated Cost Savings to MedicareUpper Est.: $2,770,000Lower Est.: $1,736,000

PGP PY-1 Results•
Press Release by CMS July 2007 (Q2PY3!)
•
1°
result is improved Diabetes quality measures
across all org, most are > national
benchmarks•
Process Improvements were applied to all
patients/payers; no restriction of services•
Aggregate Savings
to CMS of ~$21M
over ~225,000 beneficiaries•
2/10 orgs (Marshfield Clinic & U Michigan) achieved >2% $7+M in bonus payments

Billings Clinic PY-1 Results•
Achieved 8/10 Diabetes targets, 20/22 total points (91%)
•
Did not exceed the 2% threshold, thus no bonus received in 1st
year
•
Inpatient costs reduced } vs. Comparison•
Outpatient costs higher } “
“
•
(HF and many other programmatic efforts not functional until PY-2)
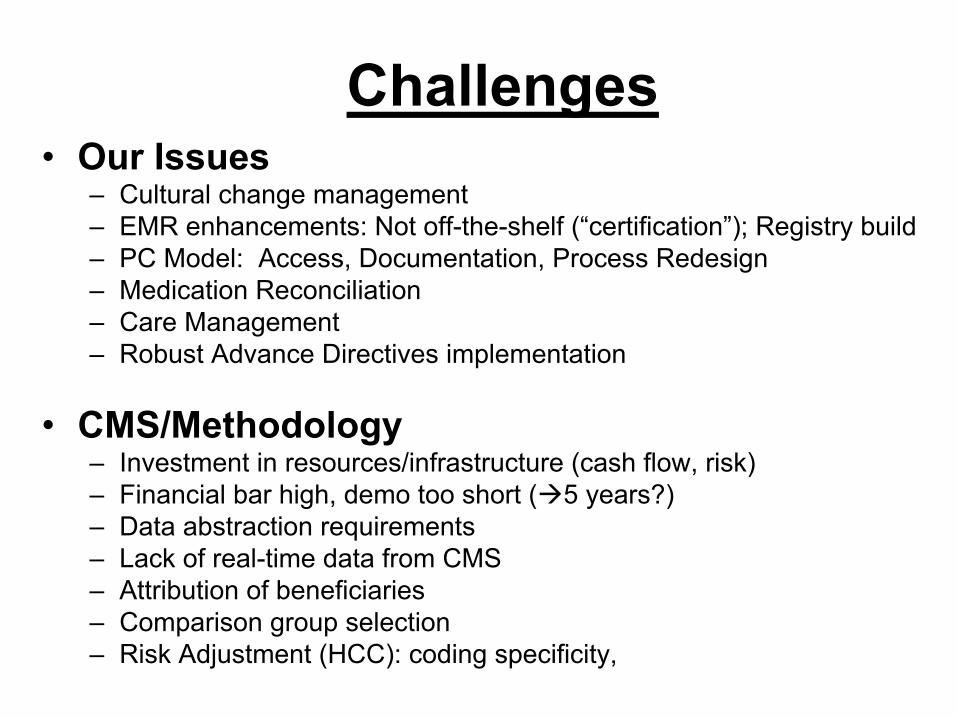
Challenges•
Our Issues–
Cultural change management –
EMR enhancements: Not off-the-shelf (“certification”); Registry build–
PC Model: Access, Documentation, Process Redesign–
Medication Reconciliation –
Care Management –
Robust Advance Directives implementation
•
CMS/Methodology–
Investment in resources/infrastructure (cash flow, risk)–
Financial bar high, demo too short ( 5 years?)–
Data abstraction requirements–
Lack of real-time data from CMS–
Attribution of beneficiaries–
Comparison group selection –
Risk Adjustment (HCC): coding specificity,

Working with CMS

What have we learned from playing with CMS?
•
Delay in receiving data fails to support the improvement process
•
Initial results reflect the delay between process improvements and clinical outcomes.
•
Quality improvement may also not inherently be more efficient, especially in the short-term.
•
Coding specificity will play a significant role in national programs that attempt to track quality with claims data (e.g.. PQRI)

Observations on HCC risk adjustment scores
•
Base Year Variation among the 10 PGP groups: 0.821 to 1.308
•
PY-1 results were significantly influenced by the Δ between attributed and comparison groups
•
HCC scores tend to increase “2%/year in managed care markets”; demo range: 0.5% to 6.5%
•
Future of CMS Value Based Purchasing initiatives (P4P) likely to hinge on greater specificity of charge data–
Future Medical Home management fee likely will be risk adjusted–
MS-DRG and HCC risk drivers are similar: specificity & comprehensive, emphasis on some “usual suspects”

Statistical Challenges for Rural Counties?
•
Risk Adjustments for rural counties, especially with beneficiary numbers <1,000, can be very volatile. (>17%)
•
The net financial effects for Billings Clinic are greatly related to the change in Risk Adjustment. (-3% relative to comp group)

Observations
•
Look more broadly at interventions–
HF as 1°
Dx is 13% of all admissions for HF patients
•
PGP lessons may be hidden in the details–
2/10 achieved financial targets in 1st year
–
Success in individual programs may be lost in the overall analysis
–
After PY1, all groups are more aware that HCC risk adjustment is a CSF
•
Premier analysis of HF is limited to a more narrow hospital/episode of care perspective

Observations
•
DM by providers, not intermediaries, allows for direct intervention and best integration of care and QI into the care delivery system
•
Medical Home: Is the infrastructure sufficient to achieve the outcomes?
•
Not all diseases have same monetary impact or ROI/timeline–
HF vs. Diabetes, COPD, CAD, HTN, Cancer Prevention
•
The “Tyranny of FFS”

…….Any Questions?

Barriers to wide-spread adoption of remote monitoring to chronic care
•
Payment systems–
FFS promotes piece-work, lack of accountability of outcomes
–
No FFS recognition of DM or care coordination activities
•
3rd
Party vs. Provider-based DM
–
Providers can better integrate DM into clinical treatment
–
Coordination of IP/OP –
Greater clinical accountability for the total care of patient
–
EHR interface/ communication with all providers

Barriers to wide-spread adoption of remote monitoring to chronic care
•
Provider integration–
Coordination among specialties
–
Outpatient + Inpatient–
EHR is the vehicle for coordination and guideline use at POC
•
Dissemination of guidelines•
POC alerting/ordering/documentation –
Other infrastructure (human resources) required for DM
–
Registry build and maintenance–
Organizational change management

Barriers to wide-spread adoption of remote monitoring to chronic care
•
Provider Acceptance–
Professional change management (Team Process)
–
Workflow change–
Accountability/feedback (report cards)
•
Patient Acceptance–
Passive “Activated” (Wagner Chronic Care Model)
–
“Selling”
is not skill set in Health Care–
Enrollment is always less than reported
•
3rd
party: 10%•
Provider: 20%•
“Seller”: 30+%

Barriers to wide-spread adoption of remote monitoring to chronic care
•
HIT–
Interface/interoperability
–
Registry build and maintenance–
Current EHR “certification”
doesn’t include supporting
accepted quality measures–
Quality measures are not uniform
–
Reporting capabilities lagging•
Geographic–
Ideal for the model/technology
–
Increases provider interaction complexity