physician services analysis - alberta · 2016-03-01 · 1 physician services analysis the following...
TRANSCRIPT
1
Physician Services Analysis
The following slides were prepared by KPMG on behalf of Alberta Health. All inter-provincial comparisons are based on
data published by the Canadian Institute for Health Information (CIHI).
Analysis related to growth in Alberta’s physician services budget and physician benefit programs is based on AH physician services budget data.
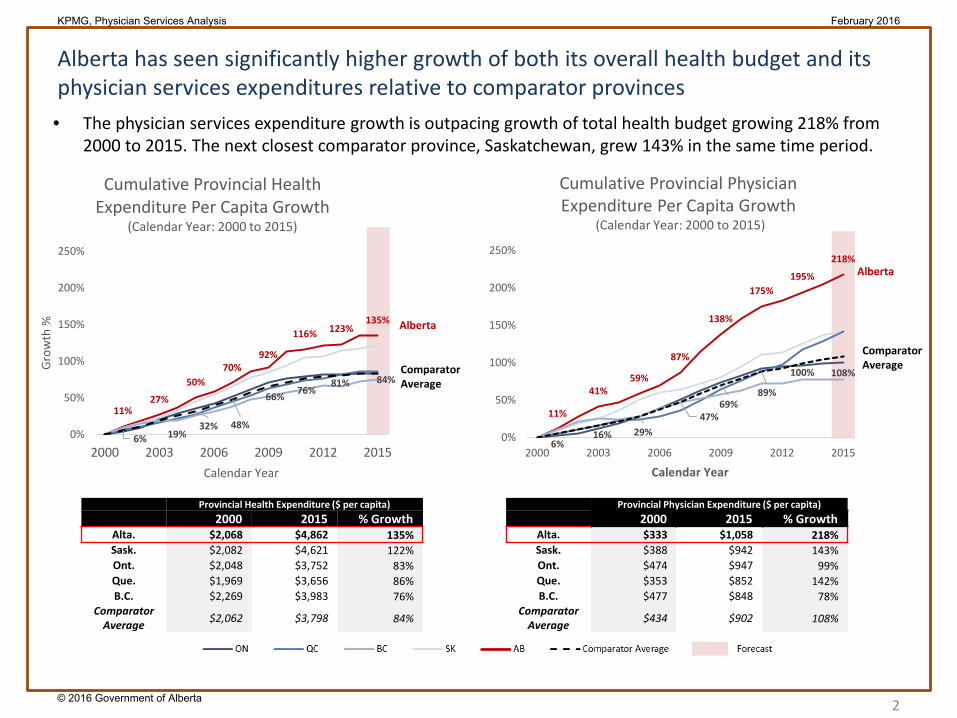
Alberta has seen significantly higher growth of both its overall health budget and its physician services expenditures relative to comparator provinces
2
Provincial Health Expenditure ($ per capita)2000 2015 % Growth
Alta. $2,068 $4,862 135%Sask. $2,082 $4,621 122%Ont. $2,048 $3,752 83%Que. $1,969 $3,656 86%B.C. $2,269 $3,983 76%
Comparator Average $2,062 $3,798 84%
Provincial Physician Expenditure ($ per capita)2000 2015 % Growth
Alta. $333 $1,058 218%Sask. $388 $942 143%Ont. $474 $947 99%Que. $353 $852 142%B.C. $477 $848 78%
Comparator Average $434 $902 108%
• The physician services expenditure growth is outpacing growth of total health budget growing 218% from 2000 to 2015. The next closest comparator province, Saskatchewan, grew 143% in the same time period.
11%27%
50%70%
92%
116% 123%135%
6% 19%32% 48%
66% 76%81% 84%
0%
50%
100%
150%
200%
250%
2000 2003 2006 2009 2012 2015
Grow
th %
Calendar Year
Cumulative Provincial Health Expenditure Per Capita Growth
(Calendar Year: 2000 to 2015)
Alberta
ComparatorAverage
Alberta
ComparatorAverage
11%
41%59%
87%
138%
175%195%
218%
6%16% 29%
47%69%
89%
100% 108%
0%
50%
100%
150%
200%
250%
2000 2003 2006 2009 2012 2015
Calendar Year
Cumulative Provincial Physician Expenditure Per Capita Growth
(Calendar Year: 2000 to 2015)
KPMG, Physician Services Analysis February 2016
© 2016 Government of Alberta

• $4,862 per capita spending on health
• $1,058 per capita spending on physician services
In 2015 Alberta had the highest provincial expenditure on health per capita and physician services per capita among the comparator provinces
3
Calendar Year 2015Source: CIHI National Health Expenditure Database, KPMG Analysis
18% 20%health physicians
5% 11%health physicians
23% 10%health physicians 25% 19%
health physicians
QCSK
ON
AB
Per Capita Provincial Expenditure 2015 BC AB SK ON QC
Health $3,983 $4,862 $4,621 $3,752 $3,656
Physician Services $848 $1,058 $942 $947 $852
Note: the percentages and arrows in the chart represent the difference in health and physician services expenditures relative to Alberta
KPMG, Physician Services Analysis February 2016
© 2016 Government of Alberta
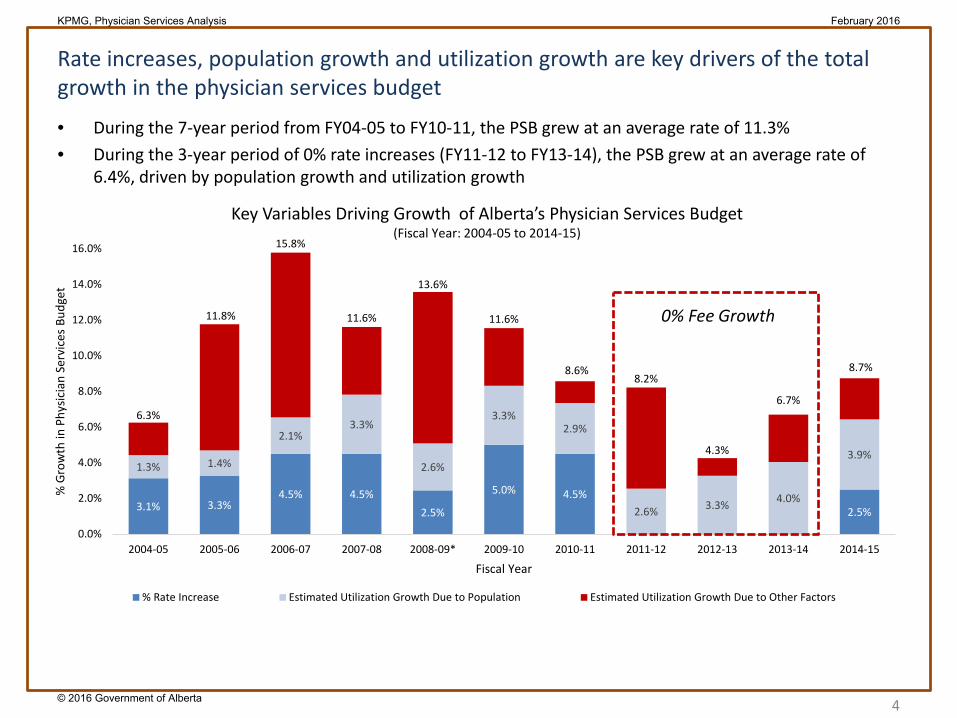
• During the 7-year period from FY04-05 to FY10-11, the PSB grew at an average rate of 11.3%• During the 3-year period of 0% rate increases (FY11-12 to FY13-14), the PSB grew at an average rate of
6.4%, driven by population growth and utilization growth
4
Rate increases, population growth and utilization growth are key drivers of the total growth in the physician services budget
3.1% 3.3%4.5% 4.5%
2.5%
5.0% 4.5%2.5%
1.3% 1.4%
2.1%3.3%
2.6%
3.3%2.9%
2.6% 3.3% 4.0%
3.9%
6.3%
11.8%
15.8%
11.6%
13.6%
11.6%
8.6%8.2%
4.3%
6.7%
8.7%
0.0%
2.0%
4.0%
6.0%
8.0%
10.0%
12.0%
14.0%
16.0%
2004-05 2005-06 2006-07 2007-08 2008-09* 2009-10 2010-11 2011-12 2012-13 2013-14 2014-15
% G
row
th in
Phy
sicia
n Se
rvic
es B
udge
t
Fiscal Year
% Rate Increase Estimated Utilization Growth Due to Population Estimated Utilization Growth Due to Other Factors
Key Variables Driving Growth of Alberta’s Physician Services Budget (Fiscal Year: 2004-05 to 2014-15)
0% Fee Growth
KPMG, Physician Services Analysis February 2016
© 2016 Government of Alberta

In 2013 Alberta has a relatively young population, with the smallest share of individuals over the age of 60 among comparator provinces
5
– 59% in Saskatchewan– 57% in Ontario– 56% in Canada– 55% in British Columbia– 54% in Quebec
– 7.3% in British Columbia– 7.2% in Quebec– 7.1% in Saskatchewan– 6.8% in Ontario – 6.8% in Canada
• In 2013, Alberta had a median age of 36.0 years, lowest in Canada
Source: Statistics Canada CANSIM Table 051-0001: Estimates of Population by Age Group and Sex 2013
0%
10%
20%
30%
40%
50%
60%
70%
80%
90%
100%
% o
f Pop
ulat
ion
in A
ge G
roup
Provincial Demographics (2013)
75 and Over
60 to 74
45 to 59
30 to 44
15 to 29
0 to 14
Age Group
KPMG, Physician Services Analysis February 2016
© 2016 Government of Alberta

Alberta has a relatively healthier population, as measured by prevalence of key chronic illnesses
6
Source: Statistics Canada. Table 105-0502 Health Indicator Profile 2013-14Diabetes: Population aged 12 and over who reported that they have been diagnosed by a health professional as having diabetes. Diabetes includes females 15 and over who reported that they have been diagnosed with gestational diabetes. COPD: Population aged 35 and over who reported being diagnosed by a health professional with chronic bronchitis, emphysema or chronic obstructive pulmonary diseaseHigh Blood Pressure: Population aged 12 and over who reported that they have been diagnosed by a health professional as having high blood pressure.Mood Disorder: Population aged 12 and over who reported that they have been diagnosed by a health professional as having a mood disorder, such as depression, bipolar disorder, mania or dysthymia
SK, 3.2%
AB, 4.1%
ON, 4.3%
BC, 4.4%
QC, 4.4%
COPD
AB, 15.1%
BC, 15.8%
QC, 17.2%
SK, 17.8%
ON, 18.5%
High Blood Pressure
QC, 5.2%
AB, 7.1%
SK, 7.8%
ON, 8.4%
BC, 9.3%
Mood Disorder
AB, 5.3%
BC, 5.5%
SK, 6.7%
ON,6.7%
QC, 7.2%
0%
2%
4%
6%
8%
10%
12%
14%
16%
18%
20%
Prev
alen
ce
Diabetes
Chronic Illness Prevalence (2013-14)
KPMG, Physician Services Analysis February 2016
© 2016 Government of Alberta

Relative to comparator provinces, Alberta ranks last or second to last in access to primary care as measured by 4 key indicators
7
ON, 91% BC,
85% SK,80%
AB,80% QC,
75%
0%
10%
20%
30%
40%
50%
60%
70%
80%
90%
100%
% o
f Res
pond
ents
Have a Regular Doctor
BC,46% SK,
43%ON,42%
QC,40% AB,
36%
Same/Next Day Appointment
BC,44%
ON,42% SK,
37% AB,33%
QC,32%
Ease in Finding After Hours Care
QC,75% BC,
67%ON,65% SK,
62% AB,58%
Same Day Answers to Phone Calls
Access to Primary Care(2013-14)
KPMG, Physician Services Analysis February 2016
© 2016 Government of Alberta

Among the comparator provinces, Alberta was ranked middle of the pack or worse across five of the six care coordination metrics
8
QC, 91% BC,
84%ON, 82%
SK, 81%
AB, 80%
0%
10%
20%
30%
40%
50%
60%
70%
80%
90%
100%
% o
f Res
pond
ents
QC, 49% BC,
44%ON, 33%
AB, 32%
SK, 30%
ON, 68%
AB, 66%
SK, 64%
BC, 63%
QC, 48%
ON, 62%
QC, 61% BC,
57% AB, 54% SK,
51%
BC, 57% ON,
54%AB, 54% QC,
49% SK, 46%
ON, 64%
BC, 63% AB,
60% SK, 55% QC,
50%
Care Coordination Metrics (2013-14)
No Conflicting Information from Different Doctors
Access to Medical Test Results
Doctors Informed about Visits to
Emergency Department
Doctors Seem Knowledgeable about
Medical History
Doctors Spending Enough Time with
Patients
Doctors Sharing in Decision Making
with Patients
KPMG, Physician Services Analysis February 2016
© 2016 Government of Alberta
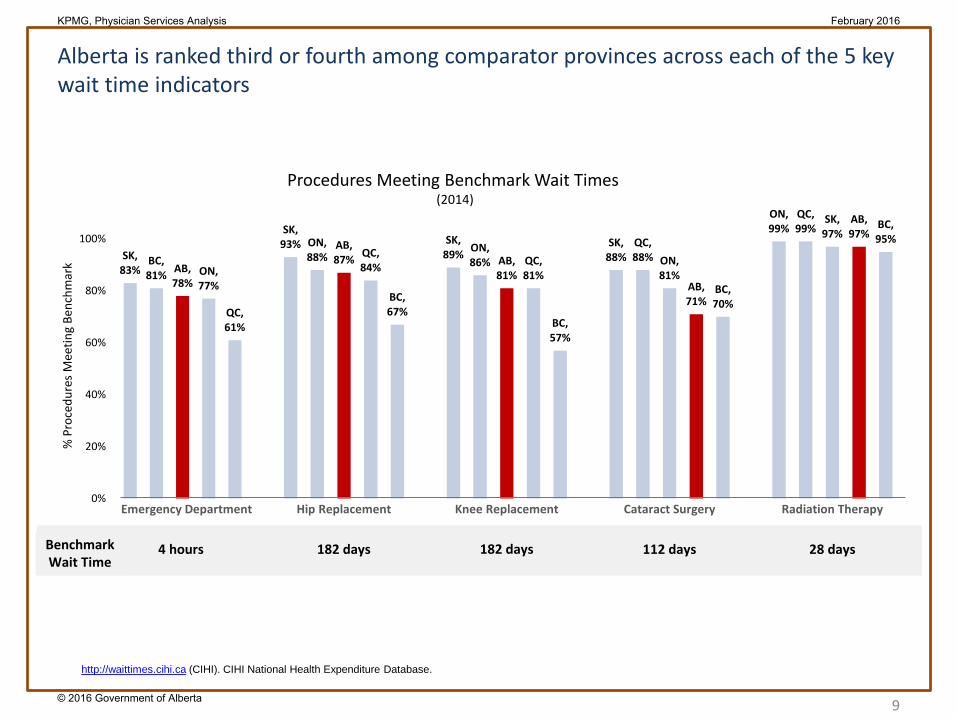
Alberta is ranked third or fourth among comparator provinces across each of the 5 key wait time indicators
9
http://waittimes.cihi.ca (CIHI). CIHI National Health Expenditure Database.
SK, 83%
BC, 81% AB,
78%ON, 77%
QC, 61%
0%
20%
40%
60%
80%
100%
% P
roce
dure
s M
eetin
g Be
nchm
ark
Emergency Department
SK, 93% ON,
88%AB, 87% QC,
84%
BC, 67%
Hip Replacement
SK, 89% ON,
86% AB, 81%
QC, 81%
BC, 57%
Knee Replacement
SK, 88%
QC, 88% ON,
81%AB, 71%
BC, 70%
Cataract Surgery
ON, 99%
QC, 99%
SK, 97%
AB, 97%
BC, 95%
Radiation Therapy
Procedures Meeting Benchmark Wait Times (2014)
BenchmarkWait Time
4 hours 182 days 182 days 112 days 28 days
KPMG, Physician Services Analysis February 2016
© 2016 Government of Alberta
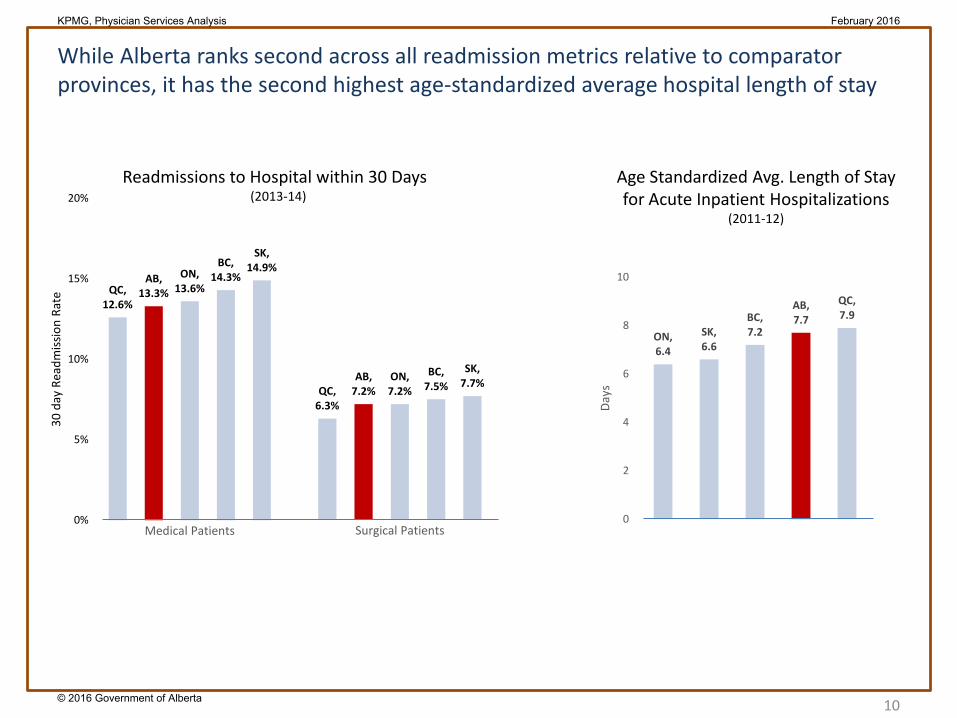
While Alberta ranks second across all readmission metrics relative to comparator provinces, it has the second highest age-standardized average hospital length of stay
10
QC, 12.6%
AB, 13.3%
ON, 13.6%
BC, 14.3%
SK, 14.9%
0%
5%
10%
15%
20%
30 d
ay R
eadm
issio
n Ra
te
Medical Patients
QC, 6.3%
AB, 7.2%
ON, 7.2%
BC, 7.5%
SK, 7.7%
Surgical Patients
Readmissions to Hospital within 30 Days (2013-14)
ON, 6.4
SK, 6.6
BC, 7.2
AB, 7.7
QC, 7.9
0
2
4
6
8
10
Days
Age Standardized Avg. Length of Stay for Acute Inpatient Hospitalizations
(2011-12)
KPMG, Physician Services Analysis February 2016
© 2016 Government of Alberta
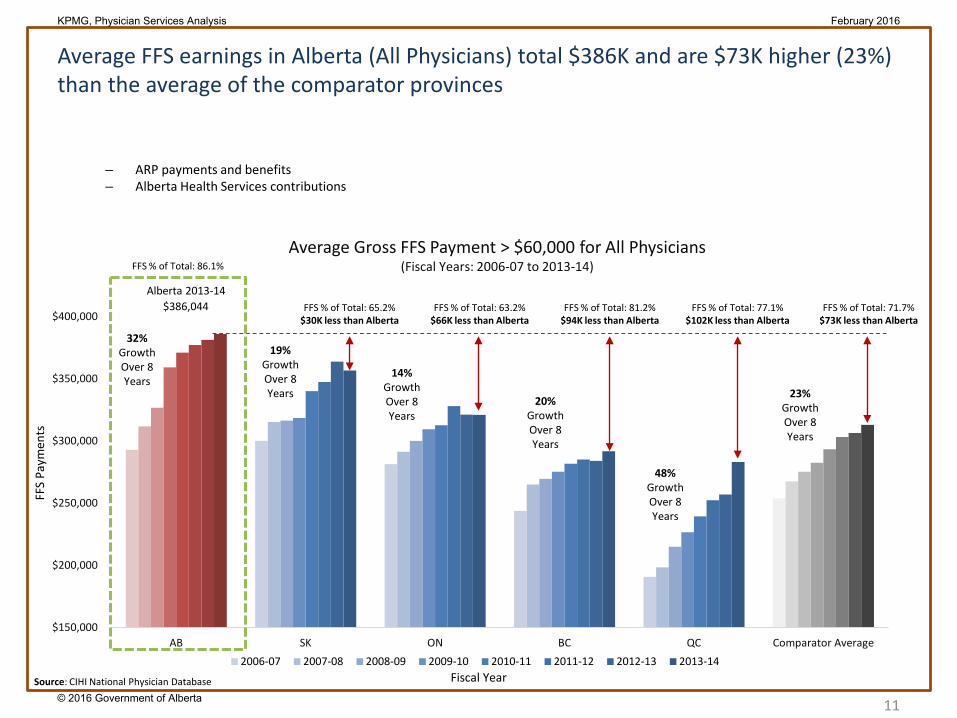
$386,044
$150,000
$200,000
$250,000
$300,000
$350,000
$400,000
AB SK ON BC QC Comparator Average2006-07 2007-08 2008-09 2009-10 2010-11 2011-12 2012-13 2013-14
Average FFS earnings in Alberta (All Physicians) total $386K and are $73K higher (23%) than the average of the comparator provinces
11
– ARP payments and benefits– Alberta Health Services contributions
Alberta 2013-14FFS % of Total: 65.2%
$30K less than AlbertaFFS % of Total: 63.2%
$66K less than AlbertaFFS % of Total: 81.2%
$94K less than AlbertaFFS % of Total: 77.1%
$102K less than AlbertaFFS % of Total: 71.7%
$73K less than Alberta
32% Growth Over 8 Years
19% Growth Over 8 Years
14% Growth Over 8 Years
20% Growth Over 8 Years
48% Growth Over 8 Years
23% Growth Over 8 Years
Source: CIHI National Physician Database
FFS % of Total: 86.1%Average Gross FFS Payment > $60,000 for All Physicians
(Fiscal Years: 2006-07 to 2013-14)
Fiscal Year
FFS
Paym
ents
KPMG, Physician Services Analysis February 2016
© 2016 Government of Alberta
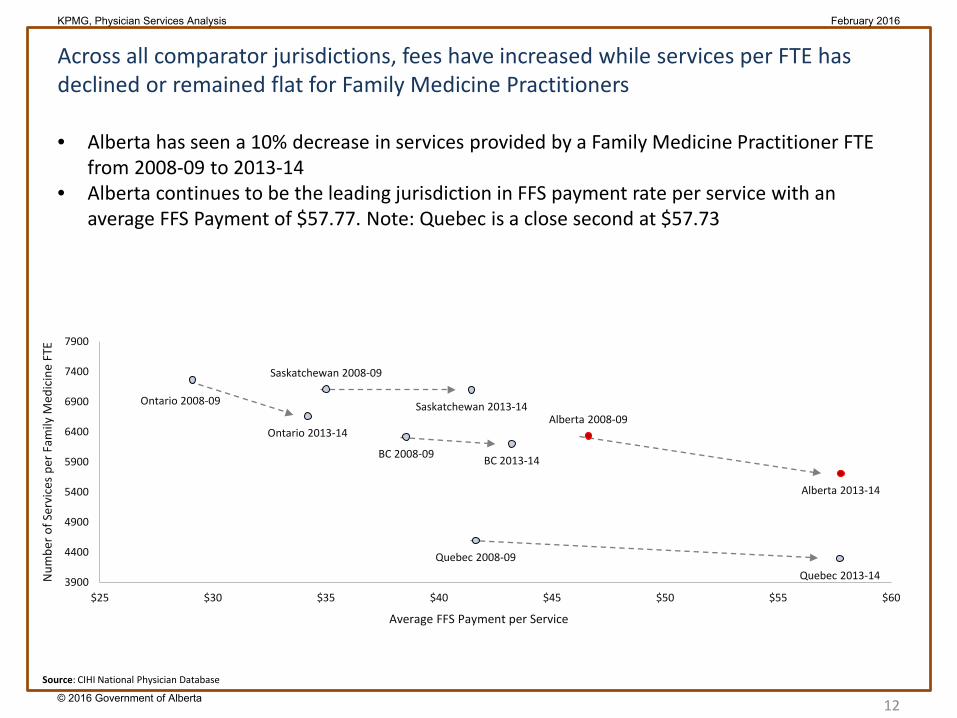
Across all comparator jurisdictions, fees have increased while services per FTE has declined or remained flat for Family Medicine Practitioners
12
Num
ber o
f Ser
vice
s pe
r Fam
ily M
edic
ine
FTE
Average FFS Payment per Service
Quebec 2008-09
Ontario 2008-09
Saskatchewan 2008-09
Alberta 2008-09
BC 2008-09
Quebec 2013-14
Ontario 2013-14
Saskatchewan 2013-14
Alberta 2013-14
BC 2013-14
3900
4400
4900
5400
5900
6400
6900
7400
7900
$25 $30 $35 $40 $45 $50 $55 $60
• Alberta has seen a 10% decrease in services provided by a Family Medicine Practitioner FTE from 2008-09 to 2013-14
• Alberta continues to be the leading jurisdiction in FFS payment rate per service with an average FFS Payment of $57.77. Note: Quebec is a close second at $57.73
Source: CIHI National Physician Database
KPMG, Physician Services Analysis February 2016
© 2016 Government of Alberta
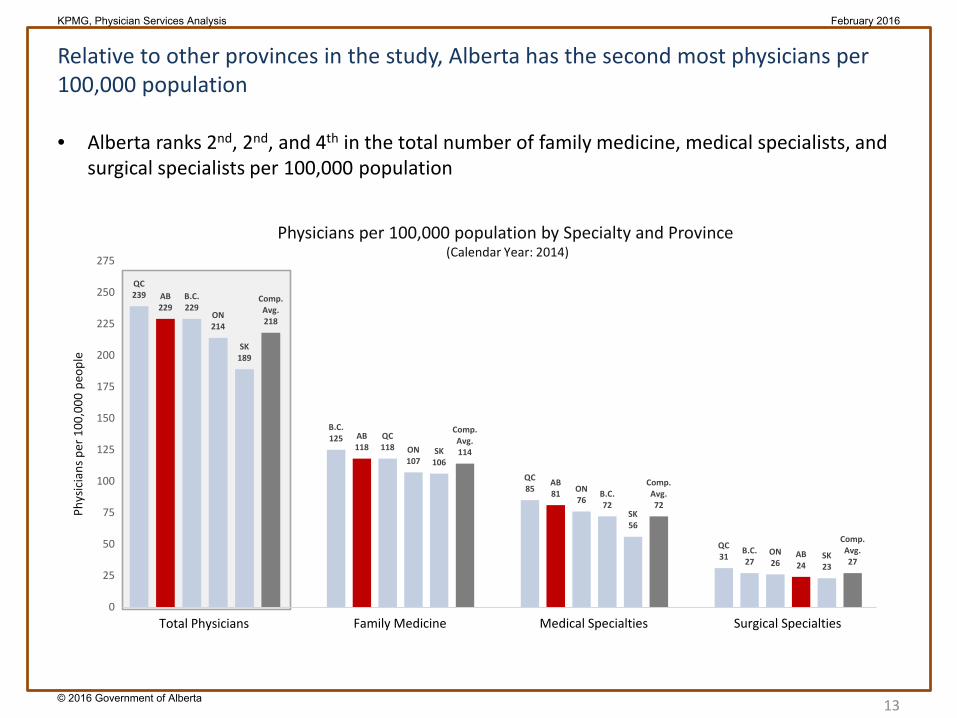
• Alberta ranks 2nd, 2nd, and 4th in the total number of family medicine, medical specialists, and surgical specialists per 100,000 population
Relative to other provinces in the study, Alberta has the second most physicians per 100,000 population
13
QC239 AB
229B.C.229
ON214
SK189
Comp.Avg.218
0
25
50
75
100
125
150
175
200
225
250
275
Phys
icia
ns p
er 1
00,0
00 p
eopl
e
B.C.125 AB
118QC118 ON
107SK
106
Comp.Avg.114
QC85
AB81 ON
76B.C.72
SK56
Comp.Avg.72
QC31
B.C.27
ON26
AB24
SK23
Comp.Avg.27
Physicians per 100,000 population by Specialty and Province (Calendar Year: 2014)
Total Physicians Family Medicine Medical Specialties Surgical Specialties
KPMG, Physician Services Analysis February 2016
© 2016 Government of Alberta
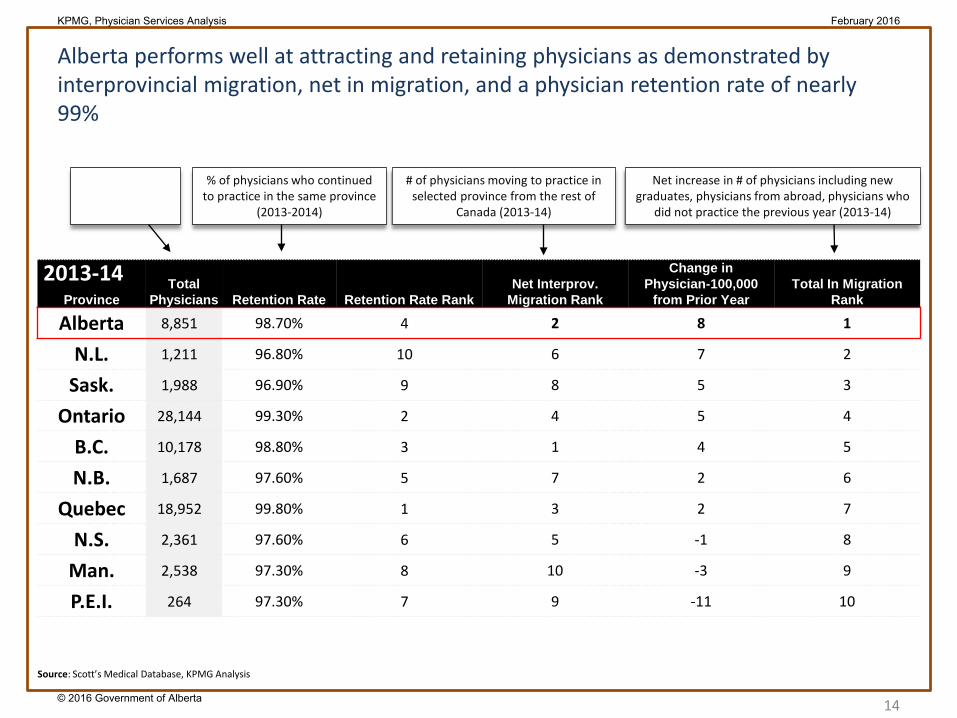
Alberta performs well at attracting and retaining physicians as demonstrated by interprovincial migration, net in migration, and a physician retention rate of nearly 99%
14
ProvinceTotal
Physicians Retention Rate Retention Rate RankNet Interprov.
Migration Rank
Change in Physician-100,000
from Prior YearTotal In Migration
Rank
Alberta 8,851 98.70% 4 2 8 1
N.L. 1,211 96.80% 10 6 7 2
Sask. 1,988 96.90% 9 8 5 3
Ontario 28,144 99.30% 2 4 5 4
B.C. 10,178 98.80% 3 1 4 5
N.B. 1,687 97.60% 5 7 2 6
Quebec 18,952 99.80% 1 3 2 7
N.S. 2,361 97.60% 6 5 -1 8
Man. 2,538 97.30% 8 10 -3 9
P.E.I. 264 97.30% 7 9 -11 10
% of physicians who continued to practice in the same province
(2013-2014)
# of physicians moving to practice in selected province from the rest of
Canada (2013-14)
Net increase in # of physicians including new graduates, physicians from abroad, physicians who
did not practice the previous year (2013-14)
2013-14
Source: Scott’s Medical Database, KPMG Analysis
KPMG, Physician Services Analysis February 2016
© 2016 Government of Alberta
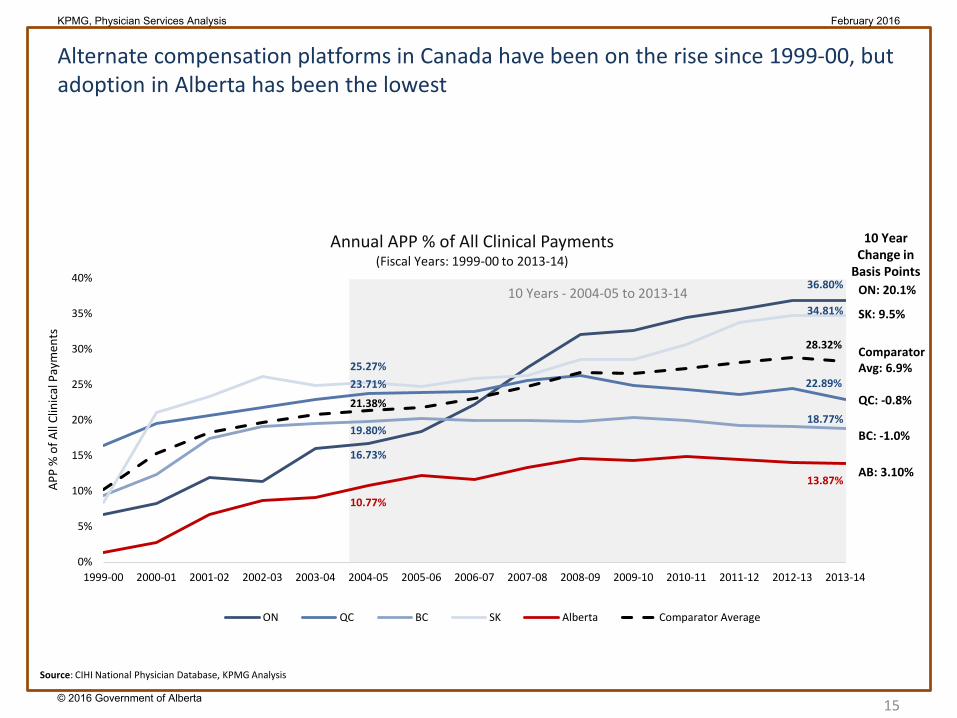
10 Years - 2004-05 to 2013-14
Alternate compensation platforms in Canada have been on the rise since 1999-00, but adoption in Alberta has been the lowest
15
16.73%
36.80%
23.71% 22.89%
19.80%18.77%
25.27%
34.81%
10.77%
13.87%
21.38%
28.32%
0%
5%
10%
15%
20%
25%
30%
35%
40%
1999-00 2000-01 2001-02 2002-03 2003-04 2004-05 2005-06 2006-07 2007-08 2008-09 2009-10 2010-11 2011-12 2012-13 2013-14
Annual APP % of All Clinical Payments(Fiscal Years: 1999-00 to 2013-14)
ON QC BC SK Alberta Comparator Average
10 Year Change in
Basis PointsON: 20.1%
SK: 9.5%
QC: -0.8%
Comparator Avg: 6.9%
BC: -1.0%
AB: 3.10%
APP
% o
f All
Clin
ical
Pay
men
ts
Source: CIHI National Physician Database, KPMG Analysis
KPMG, Physician Services Analysis February 2016
© 2016 Government of Alberta
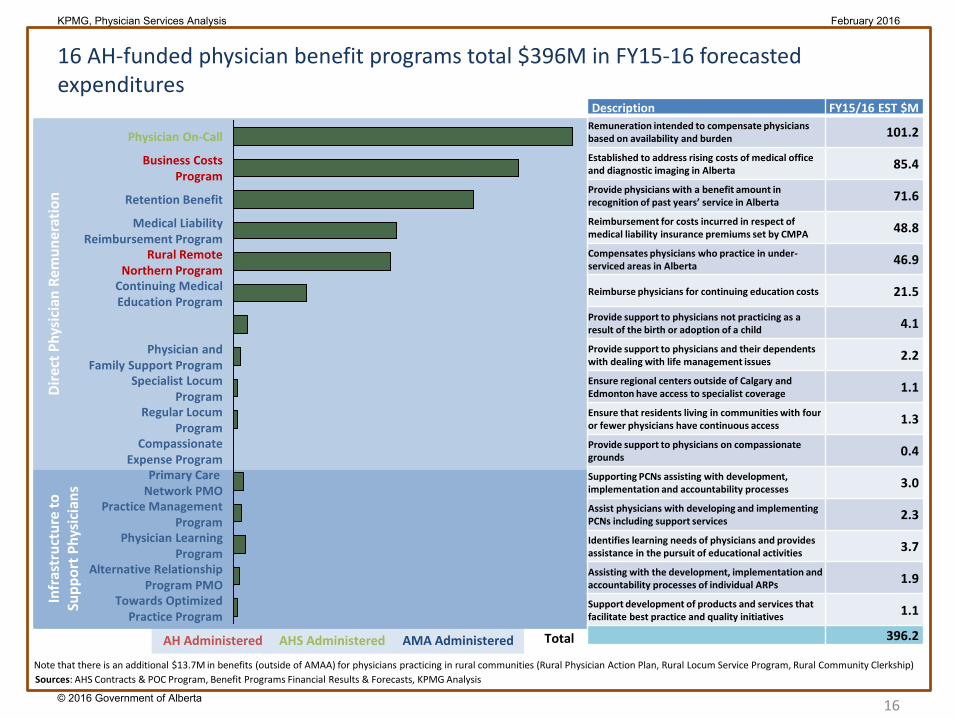
TotalAH Administered AHS Administered AMA Administered
Infr
astr
uctu
re to
Su
ppor
t Phy
sici
ans
Dire
ct P
hysi
cian
Rem
uner
atio
n16 AH-funded physician benefit programs total $396M in FY15-16 forecasted expenditures
16
Description FY15/16 EST $MRemuneration intended to compensate physicians based on availability and burden 101.2
Established to address rising costs of medical office and diagnostic imaging in Alberta 85.4
Provide physicians with a benefit amount in recognition of past years’ service in Alberta 71.6
Reimbursement for costs incurred in respect of medical liability insurance premiums set by CMPA 48.8
Compensates physicians who practice in under-serviced areas in Alberta 46.9
Reimburse physicians for continuing education costs 21.5
Provide support to physicians not practicing as a result of the birth or adoption of a child 4.1
Provide support to physicians and their dependents with dealing with life management issues 2.2
Ensure regional centers outside of Calgary and Edmonton have access to specialist coverage 1.1
Ensure that residents living in communities with four or fewer physicians have continuous access 1.3
Provide support to physicians on compassionate grounds 0.4
Supporting PCNs assisting with development, implementation and accountability processes 3.0
Assist physicians with developing and implementing PCNs including support services 2.3
Identifies learning needs of physicians and provides assistance in the pursuit of educational activities 3.7
Assisting with the development, implementation and accountability processes of individual ARPs 1.9
Support development of products and services that facilitate best practice and quality initiatives 1.1
396.2
Physician andFamily Support Program
Retention Benefit
Medical LiabilityReimbursement Program
Continuing MedicalEducation Program
Rural RemoteNorthern Program
Practice ManagementProgram
Physician LearningProgram
Alternative RelationshipProgram PMO
Towards OptimizedPractice Program
Regular LocumProgram
Specialist LocumProgram
Physician On-Call
Business CostsProgram
Primary Care Network PMO
CompassionateExpense Program
Note that there is an additional $13.7M in benefits (outside of AMAA) for physicians practicing in rural communities (Rural Physician Action Plan, Rural Locum Service Program, Rural Community Clerkship)Sources: AHS Contracts & POC Program, Benefit Programs Financial Results & Forecasts, KPMG Analysis
KPMG, Physician Services Analysis February 2016
© 2016 Government of Alberta