physicians in canada, 2014 chartbook september 2015
TRANSCRIPT

Physicians in Canada, 2014
Chartbook September 2015

2
Our VisionBetter data. Better decisions. Healthier Canadians.
Our MandateTo lead the development and maintenance of comprehensive and integrated health information that enables sound policy and effective health system management that improve health and health care.
Our ValuesRespect, Integrity, Collaboration, Excellence, Innovation
3
Additional resources
The following companion products are available on CIHI’s website:
• Summary report
• Methodological notes
• Data tables
• Public summary
Talk to us
For data-specific information:[email protected]
For media inquiries:[email protected]
www.cihi.ca
The following slides are provided to reuse in your own presentations.
Please cite as follows: Canadian Institute for Health Information. Physicians in Canada, 2014. Ottawa, ON: CIHI; 2015.

4
Physician supply
5
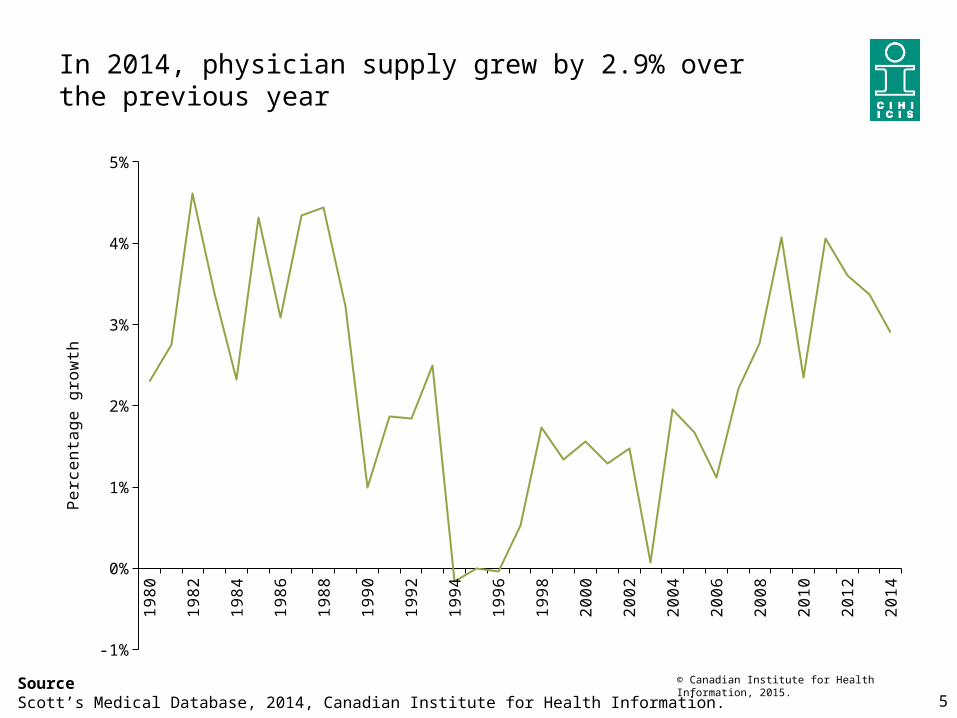
In 2014, physician supply grew by 2.9% over the previous year
19
80
19
81
19
82
19
83
19
84
19
85
19
86
19
87
19
88
19
89
19
90
19
91
19
92
19
93
19
94
19
95
19
96
19
97
19
98
19
99
20
00
20
01
20
02
20
03
20
04
20
05
20
06
20
07
20
08
20
09
20
10
20
11
20
12
20
13
20
14
-1%
0%
1%
2%
3%
4%
5%
Pe
rce
nta
ge
gro
wth
SourceScott’s Medical Database, 2014, Canadian Institute for Health Information.
© Canadian Institute for Health Information, 2015.
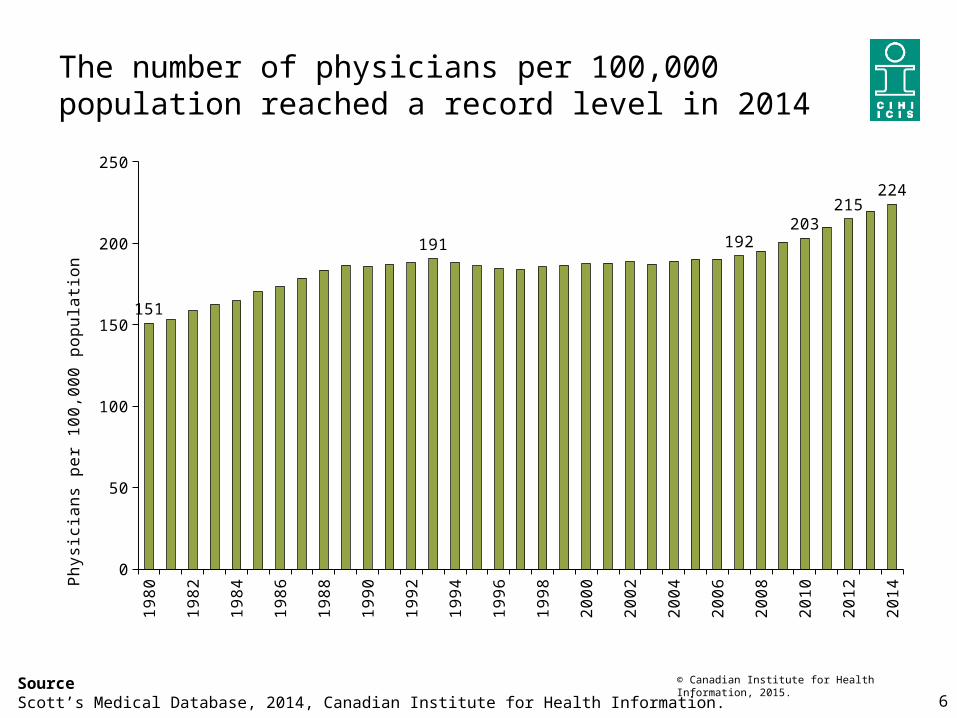
The number of physicians per 100,000 population reached a record level in 2014
6SourceScott’s Medical Database, 2014, Canadian Institute for Health Information.
19
80
19
81
19
82
19
83
19
84
19
85
19
86
19
87
19
88
19
89
19
90
19
91
19
92
19
93
19
94
19
95
19
96
19
97
19
98
19
99
20
00
20
01
20
02
20
03
20
04
20
05
20
06
20
07
20
08
20
09
20
10
20
11
20
12
20
13
20
14
0
50
100
150
200
250
151
191 192203
215224
Ph
ysic
ian
s p
er
10
0,0
00
po
pu
latio
n
© Canadian Institute for Health Information, 2015.

The number of physicians per population has increased in all provinces since 2010
7SourceScott’s Medical Database, 2014, Canadian Institute for Health Information.
© Canadian Institute for Health Information, 2015.
N.L. P.E.I. N.S. N.B. Que. Ont. Man. Sask. Alta. B.C. Canada0
50
100
150
200
250
300
225
163
224
205
224
188 186
169
211 213203
248
179
260
229239
214201
189
229 229 224
2010 2014
Ph
ysic
ian
s p
er
10
0,0
00
po
pu
latio
n
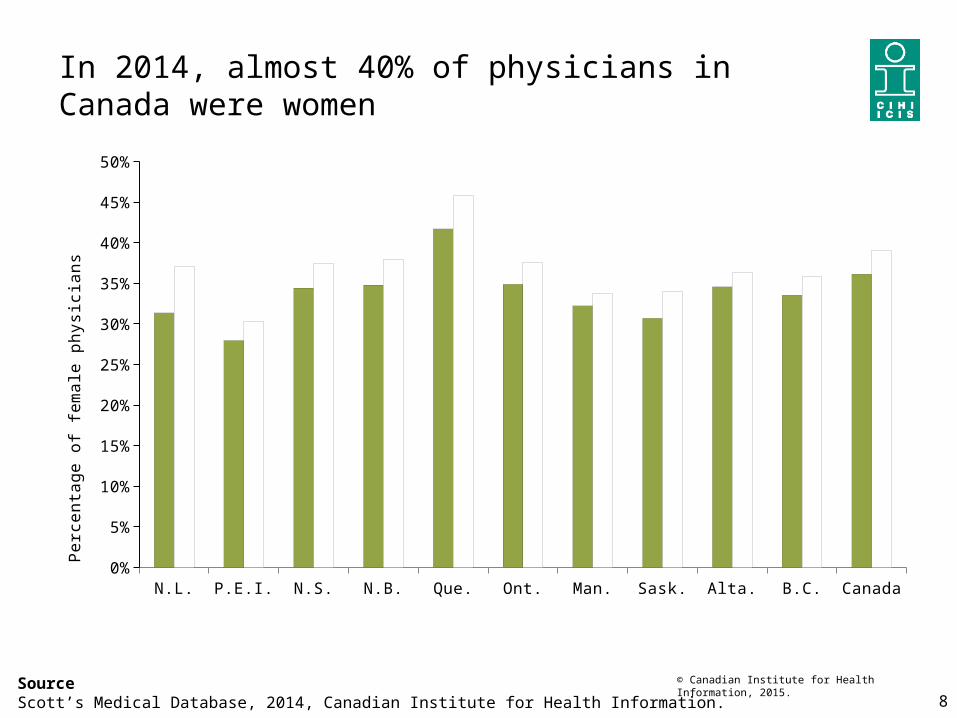
In 2014, almost 40% of physicians in Canada were women
8SourceScott’s Medical Database, 2014, Canadian Institute for Health Information.
© Canadian Institute for Health Information, 2015.
N.L. P.E.I. N.S. N.B. Que. Ont. Man. Sask. Alta. B.C. Canada
2010 0.3136 0.2797 0.3443 0.348 0.4171 0.3489 0.3224 0.3071 0.3457 0.3356 0.36139
2014 0.3709 0.3027 0.3751 0.3789 0.4585 0.3752 0.3381 0.34048 0.3639 0.3579 0.38995
3%
8%
13%
18%
23%
28%
33%
38%
43%
48%
Pe
rce
nta
ge
of f
em
ale
ph
ysic
ian
s
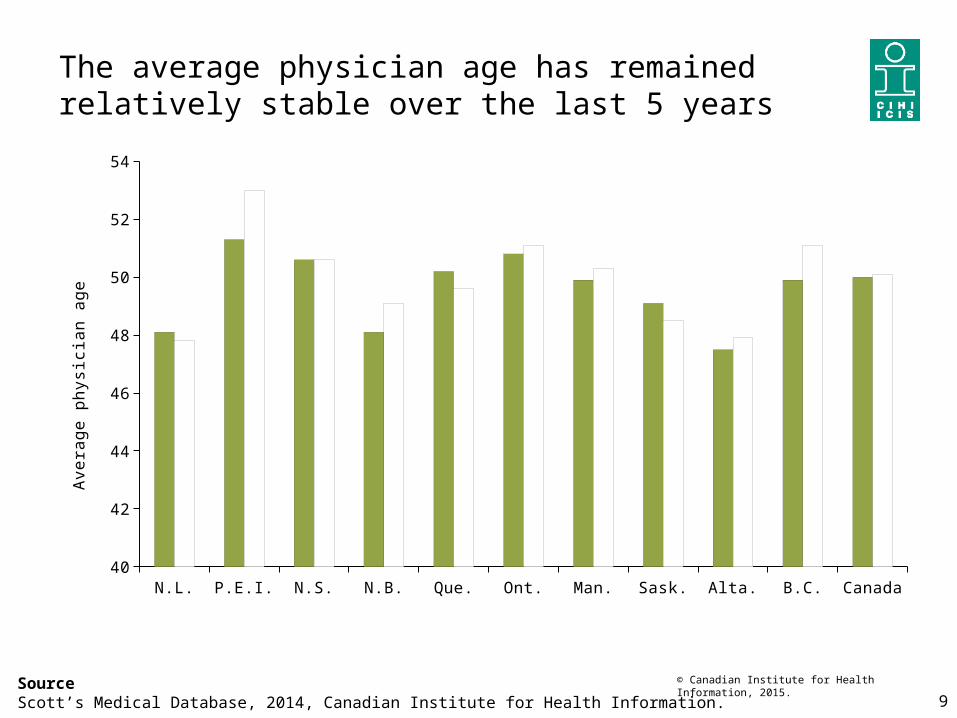
The average physician age has remained relatively stable over the last 5 years
9SourceScott’s Medical Database, 2014, Canadian Institute for Health Information.
© Canadian Institute for Health Information, 2015.
N.L. P.E.I. N.S. N.B. Que. Ont. Man. Sask. Alta. B.C. Canada
2010 48.1 51.3 50.6 48.1 50.2 50.8 49.9 49.1 47.5 49.9 50
2014 47.8 53 50.6 49.1 49.6 51.1 50.3 48.5 47.9 51.1 50.1
41
43
45
47
49
51
53
Ave
rag
e p
hys
icia
n a
ge
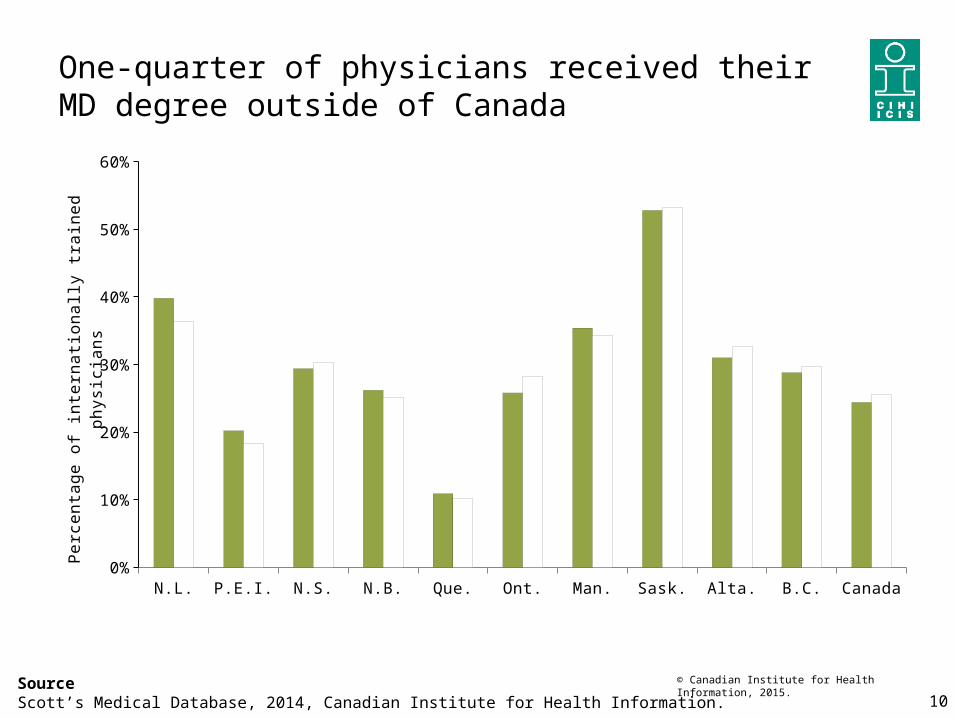
One-quarter of physicians received their MD degree outside of Canada
10SourceScott’s Medical Database, 2014, Canadian Institute for Health Information.
© Canadian Institute for Health Information, 2015.
N.L. P.E.I. N.S. N.B. Que. Ont. Man. Sask. Alta. B.C. Canada
2010 0.398 0.202 0.294 0.262 0.109 0.258 0.354 0.528 0.31 0.288 0.244
2014 0.364 0.183 0.303 0.251 0.102 0.283 0.343 0.532 0.326 0.297 0.255
5%
15%
25%
35%
45%
55%
Pe
rce
nta
ge
of i
nte
rna
tion
ally
tra
ine
d p
hys
icia
ns
11
Physician payments

12
Total gross clinical payments to physicians increased by almost 6% to reach $24.1 billion
SourceNational Physician Database, Canadian Institute for Health Information.
© Canadian Institute for Health Information, 2015.
19
99
–2
00
0
20
00
–2
00
1
20
01
–2
00
2
20
02
–2
00
3
20
03
–2
00
4
20
04
–2
00
5
20
05
–2
00
6
20
06
–2
00
7
20
07
–2
00
8
20
08
–2
00
9
20
09
–2
01
0
20
10
–2
01
1
20
11
–2
01
2
20
12
–2
01
3
20
13
–2
01
4
0
5,000,000
10,000,000
15,000,000
20,000,000
25,000,000
30,000,000
Total payments Fee-for-service
Pa
yme
nts
in th
ou
san
ds
of d
olla
rs
13
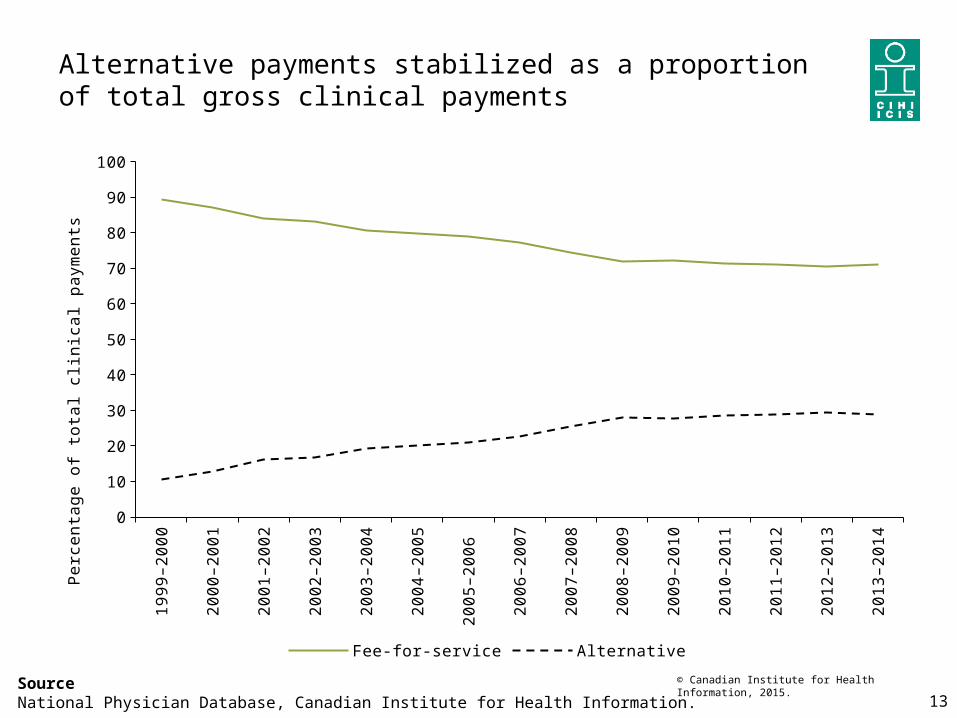
Alternative payments stabilized as a proportion of total gross clinical payments
SourceNational Physician Database, Canadian Institute for Health Information.
© Canadian Institute for Health Information, 2015.
19
99
–2
00
0
20
00
–2
00
1
20
01
–2
00
2
20
02
–2
00
3
20
03
–2
00
4
20
04
–2
00
5
20
05
–2
00
6
20
06
–2
00
7
20
07
–2
00
8
20
08
–2
00
9
20
09
–2
01
0
20
10
–2
01
1
20
11
–2
01
2
20
12
–2
01
3
20
13
–2
01
4
0
10
20
30
40
50
60
70
80
90
100
Fee-for-service Alternative
Pe
rce
nta
ge
of t
ota
l clin
ica
l pa
yme
nts
14
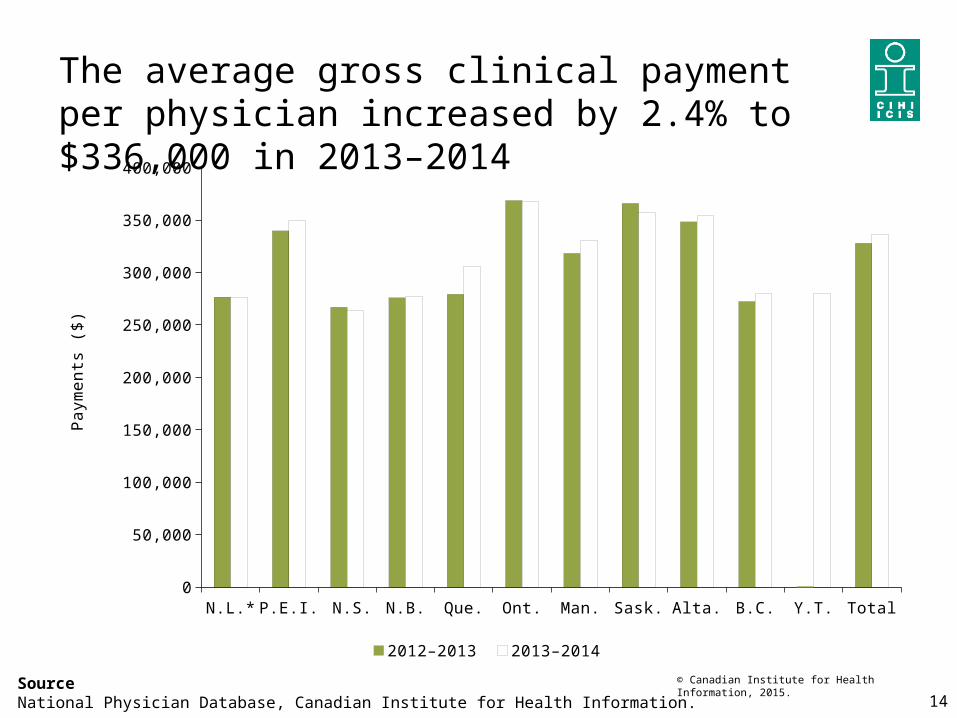
The average gross clinical payment per physician increased by 2.4% to $336,000 in 2013–2014
SourceNational Physician Database, Canadian Institute for Health Information.
© Canadian Institute for Health Information, 2015.
N.L.* P.E.I. N.S. N.B. Que. Ont. Man. Sask. Alta. B.C. Y.T. Total0
50,000
100,000
150,000
200,000
250,000
300,000
350,000
400,000
2012–2013 2013–2014
Pa
yme
nts
($
)
15
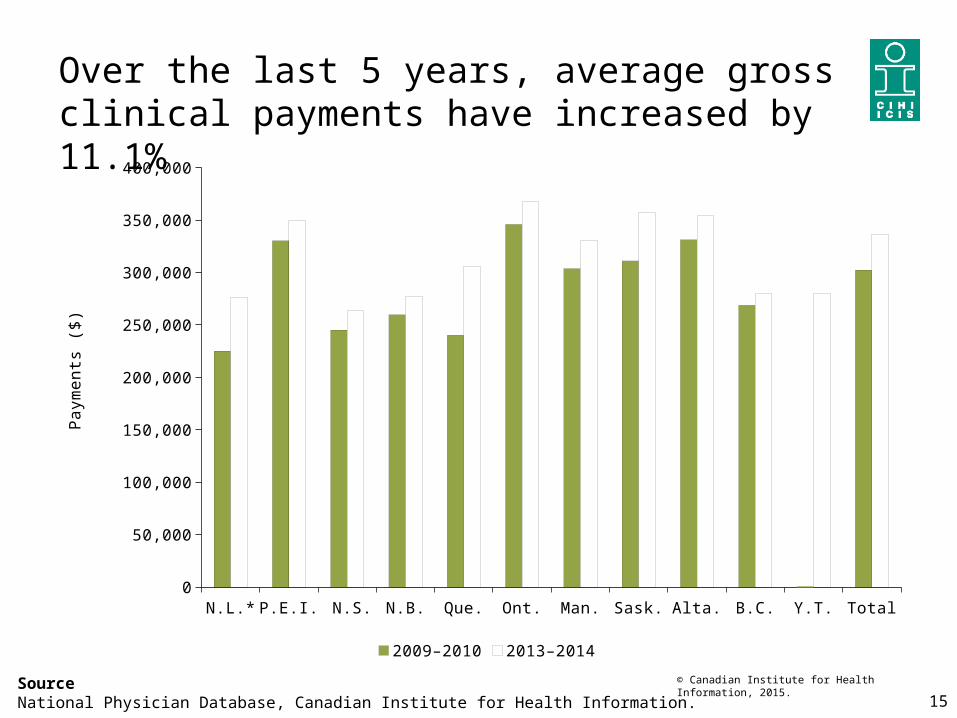
Over the last 5 years, average gross clinical payments have increased by 11.1%
SourceNational Physician Database, Canadian Institute for Health Information.
© Canadian Institute for Health Information, 2015.
N.L.* P.E.I. N.S. N.B. Que. Ont. Man. Sask. Alta. B.C. Y.T. Total0
50,000
100,000
150,000
200,000
250,000
300,000
350,000
400,000
2009–2010 2013–2014
Pa
yme
nts
($
)
16
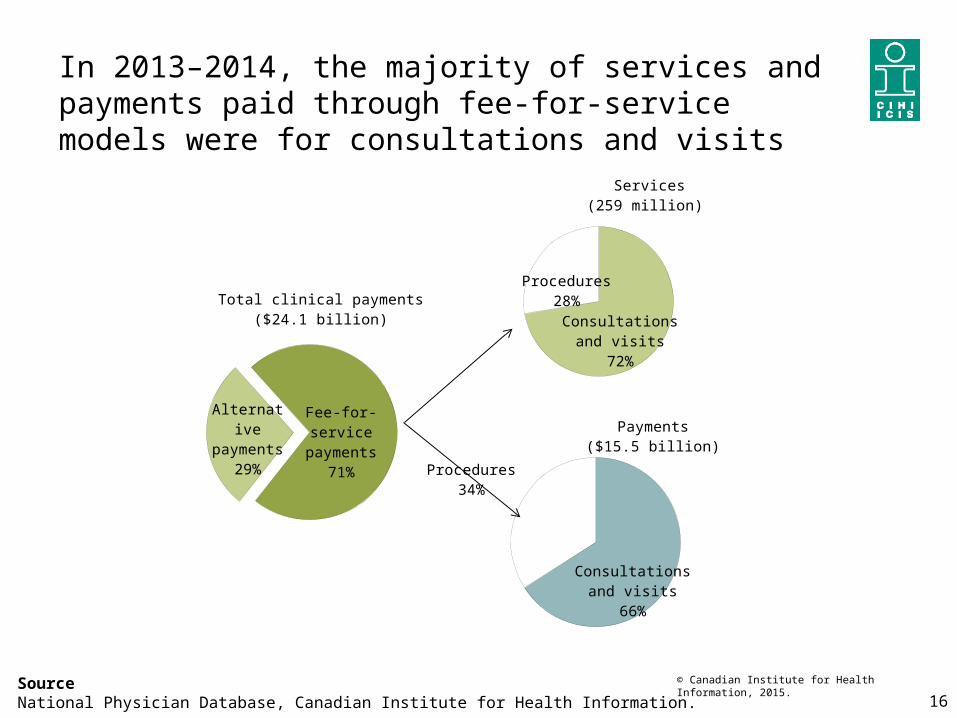
In 2013–2014, the majority of services and payments paid through fee-for-service models were for consultations and visits
SourceNational Physician Database, Canadian Institute for Health Information.
© Canadian Institute for Health Information, 2015.
Consultations and visits72%
Procedures28%
Services(259 million)
Consultations and visits
66%
Procedures34%
Payments($15.5 billion)
Fee-for-service
payments71%
Alternative payments
29%
Total clinical payments($24.1 billion)
17
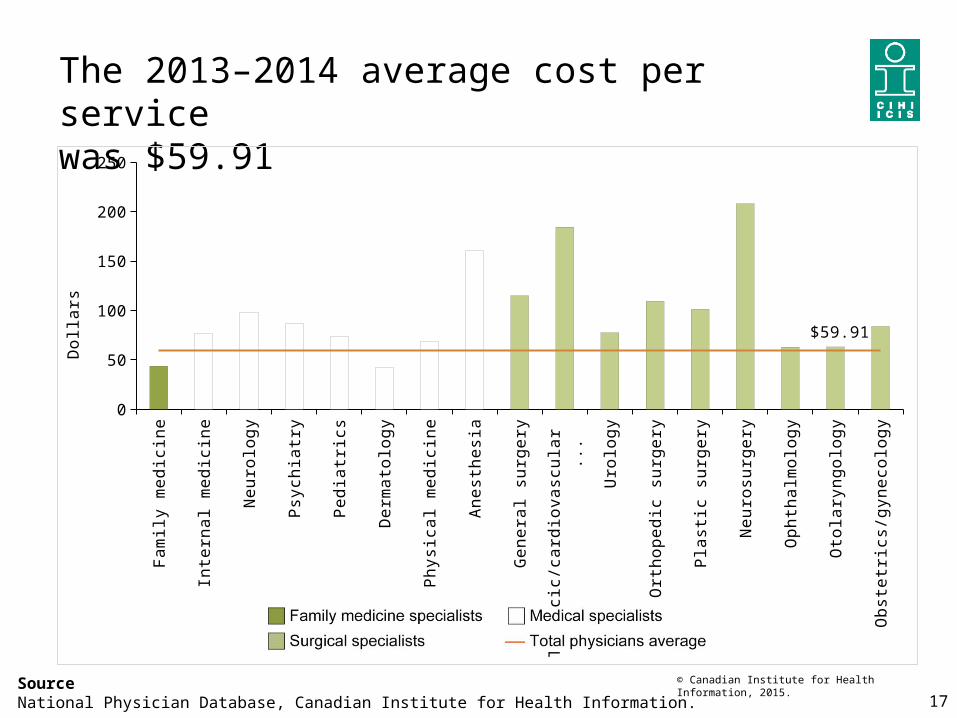
The 2013–2014 average cost per service was $59.91
SourceNational Physician Database, Canadian Institute for Health Information.
© Canadian Institute for Health Information, 2015.
Fa
mily
me
dic
ine
Inte
rna
l me
dic
ine
Ne
uro
log
y
Psy
chia
try
Pe
dia
tric
s
De
rma
tolo
gy
Ph
ysic
al m
ed
icin
e
An
est
he
sia
Ge
ne
ral s
urg
ery
Th
ora
cic/
card
iova
scu
lar
su
rge
ry
Uro
log
y
Ort
ho
pe
dic
su
rge
ry
Pla
stic
su
rge
ry
Ne
uro
surg
ery
Op
hth
alm
olo
gy
Oto
lary
ng
olo
gy
Ob
ste
tric
s/g
yne
colo
gy
0
50
100
150
200
250
$59.91Do
llars