physico- chemical analysis of drinking water district
TRANSCRIPT
International Journal of Engineering Science Invention (IJESI)
ISSN (Online): 2319 – 6734, ISSN (Print): 2319 – 6726
www.ijesi.org ||Volume 7 Issue 2|| February 2018 || PP. 18-27
www.ijesi.org 18 | Page
Physico- Chemical Analysis Of Drinking Water–Anantapur
District, Andhra Pradesh
K.Mahammad Rafi1
Dr.M.Umamahesh2
Dr.T.Ramachar3
1.Research Scholar ,Dept.of Chemistry ,Rayalaseema University,Kurnool,A.P
2.Professor,dept.of Chemistry,RGM College of Engg.&Technology(Autonomous),Nandyal,A.P
3.Associate Professor,dept.of humanities and basic sciences,G.Pullareddy Engineering College
(Autonomous),Kurnool,A.P
Corresponding Author: K.Mahammad Rafi
ABSTRACT: Due to lack of awareness about water pollution and remedies of pollution in human and their
activities now a days in major areas ground and surface water is contaminated, and also it leads to damage
human health by water born diseases like Cholera, Diarrhea, Malaria Typhoid, Filariasis1 Thus the analysis of
water quality parameters in selected area for present research is very important to protect and preserve the
quality and warn to human by creating awareness in them .So that in Anantapur district water was
contaminated due to lack of water sources and more industrial activities .For this we were collected some
water samples in selected areas to analyze the samples of Ground water and surface water for physico –
Chemical characteristics like pH,EC,Turb.,F-,NO3
-,SO4
2-,Temp,Dissolved oxygen, Total suspended solids ,Total
Hardness, Chloride, and Trace metal ions are Cu, Zn, Mn, Fe, Al using the procedures outlined prescribed by
Indian standards. The obtained results are after analysis compared with Indian Standard Drinking water
specification IS: 10500-2012 16
.finally we suggest after this investigation, Analysis and preserve the water
should be carried out as per standards to prevent diseases periodically.
KEYWORDS: Drinking Water, water Quality parameters , Indian Standards ,
I. Introduction Water is the most Important substance in daily life of living organisms .and also shaping the land and
regulating the climate too .Ground water and surface water sources are used for Human activities and also
Industrial activities. but in the last few decades there has been increase the demand of fresh water due to rapid
growth of populisation and industrialization and also climate change .In this context the remain some sources of
water was contaminated by unwanted activities in present research area especially in this area due to presence
of more hill area and lacking rainfall there is a raise of global warming. So that we selected this area to study.
The greater part of the soluble constituents in ground water comes from soluble minerals in soils and
sedimentary rocks. The more common soluble constituents include calcium, sodium, bicarbonate and sulphate
ions. Another common constituent is chloride ion derived from intruded sea water, connate water, and evapo
transpiration concentrating salts, and sewage wastes for example. So here we selected some areas of Anantapur
district to analyze the samples for various parameters as taken in two different ground water sample and surface
water sample in each area and each one two samples. For this study we selected four areas named as
Kadiri,Tadipatri,Guntakal,Nallacheruvu, and total collected 16 samples i.e. 4 samples separated as 2 samples
from ground water sources and 2 samples from surface water sources .samples collected as per Indian standards
sample collecting procedures.
II. Materials and methods : 1.Study Area:
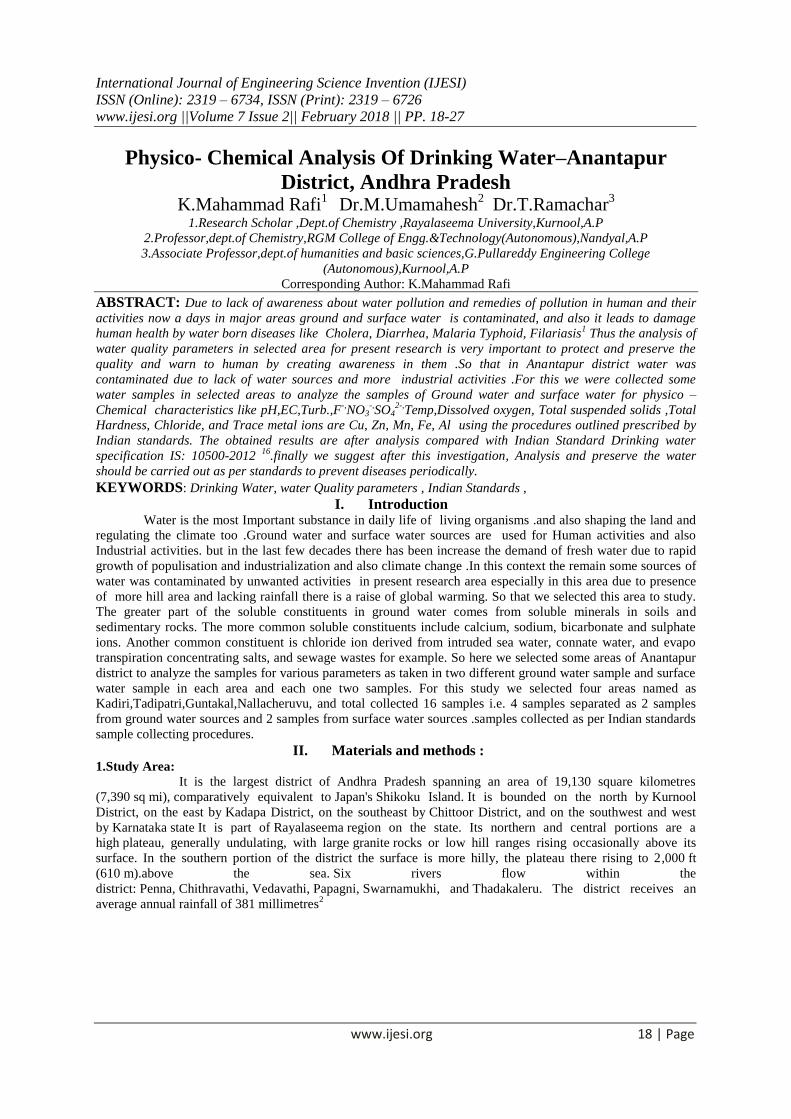
It is the largest district of Andhra Pradesh spanning an area of 19,130 square kilometres
(7,390 sq mi), comparatively equivalent to Japan's Shikoku Island. It is bounded on the north by Kurnool
District, on the east by Kadapa District, on the southeast by Chittoor District, and on the southwest and west
by Karnataka state It is part of Rayalaseema region on the state. Its northern and central portions are a
high plateau, generally undulating, with large granite rocks or low hill ranges rising occasionally above its
surface. In the southern portion of the district the surface is more hilly, the plateau there rising to 2,000 ft
(610 m).above the sea. Six rivers flow within the
district: Penna, Chithravathi, Vedavathi, Papagni, Swarnamukhi, and Thadakaleru. The district receives an
average annual rainfall of 381 millimetres2
PHYSICO- CHEMICAL ANALYSIS OF DRINKING WATER–
www.ijesi.org 19 | Page
Fig.1 : Map of Annatapur district
2.Sampling and analytical methods:
The all samples were collected from specified as above 4 areas as per sampling methods specified in
IS:3025 part 1 in Poly Ethylene bottles and immediatly brought to laboratory to analyze the samples for physico
–Chemical characteristics like pH,EC,Turb.,F-,NO3
-,SO4
2-,Temp,Dissolved oxygen,Total suspended solids ,Total
Hardness, Chloride, and Trace metal ions are Cu, Zn, Mn, Fe, Al as per Al using the procedures outlined
prescribed by Indian standards3. The obtained results are after analysis compared with Indian Standard Drinking
water specification IS: 10500-2012. . such as pH by using pH meter,EC by using Conductivity meter, Turbidity
by nephelometric method, Fluoride will find by Colorimetric SPADNS Method ,Nitrate and sulphate by using
Spectrophotometer ,Total dissolved Solids by TDS meter ,Hardness in water by using EDTA complexometric
Titration method ,Chloride by An argentometric method, finally trace metals are like Copper
,Zinc,Iron,Managnese,Aluminium are by using Atomic absorption Spectrophotometric method16
.
III. Results and discussion: The results of all physico chemical parameters for the water samples collected from each and every
area specified in above are presented clearly in the below tables .
1.Temperature:
Temperature is a Important parameter of water quality to all bio chemical reactions in aquatic
living organisms .If a rise in temperature in water it leads to speeding up of reactions loss in life span of
organisms. The average temperature of the present study ranged from 220c - 29
0c.
Sample
Code
Kadiri tadipatri Guntakal Nallacheruvu
G1 28 27 26 26
G2 27 29 27 26
S1 22 25 25 24
S2 24 24 25 25
Table 1: Temperature of various areas
G1&G2 : ground Water 1&2 S1&S2 : surface water 1&2
Fig.2: Graphical representation of Temperature
0
0.1
0.2
Code G1 G2 S1 S2
tem
pe
ratu
re
Sample code
Temperature
Kadiri
tadipatri
Guntakal
Nallacheruvu
PHYSICO- CHEMICAL ANALYSIS OF DRINKING WATER–
www.ijesi.org 20 | Page
2. pH :
lower pH value of water sample is sore taste and higher value of water it gives a alkaline taste
.Actually the pH standard is 6.5-8.5 .The pH values of the present study ranged from 6.02 – 8.24
Sample
Code
Kadiri tadipatri Guntakal Nallacheruvu
G1 6.78 6.48 6.58 7.11
G2 6.62 6.54 7.23 7.01
S1 6.98 6.81 7.96 6.99
S2 6.02 6.14 8.24 7.26
Table 2: pH of various areas
G1&G2 : ground Water 1&2 S1&S2 : surface water 1&2
Fig.3: Graphical representation of pH
3.Electrical Conductivity:
. Freshwater is usually between 0 and 1,500 uS/cm.If Ec value 0-800 it is Good drinking water for
humans (provided there is no organic pollution and not too much suspended clay material).In th e present study
the values are ranged from 98 - 560 uS/cm.
Sample
Code
Kadiri tadipatri Guntakal Nallacheruvu
G1 168 170 180 211
G2 201 199 159 184
S1 122 130 142 560
S2 185 190 156 98
Table 3: EC of various areas
G1&G2 : ground Water 1&2 S1&S2 : surface water 1&2
Fig.4: Graphical representation of Electrical Conductivity
4.Total Dissolved solids:
TDS level as follows: excellent, less than 300 mg/litre; good, between 300 and600 mg/litre;
fair, between 600 and 900 mg/litre; poor, between 900 and 1200 mg/litre; and unacceptable, greater than 1200
mg/litre in present study TDS values of this parameter is ranged from 239 – 271 mg/l
0
0.1
0.2
Code G1 G2 S1 S2
pH
Sample Code
pH
Kadiri
tadipatri
Guntakal
Nallacheruvu
0
0.05
0.1
0.15
Code G1 G2 S1 S2
EC
Sample Code
Electrical Conductivity
Kadiri
tadipatri
Guntakal
Nallacheruvu
PHYSICO- CHEMICAL ANALYSIS OF DRINKING WATER–
www.ijesi.org 21 | Page
Sample
Code
Kadiri tadipatri Guntakal Nallacheruvu
G1 254 242 258 242
G2 239 259 264 256
S1 257 262 243 271
S2 246 267 249 258
Table 4: TDS of various areas
G1&G2 : ground Water 1&2 S1&S2 : surface water 1&2
Fig.5: Graphical representation of TDS
5.Total hardness:
Hardness of water is a very important to used in domestical and industrial purpose.It may cause
scale deposition and sludge formation in industries .actually as per standards hardness of water is desirable limit
is 300 and permissible limit is 600 mg/l..In present study the hardness of water samples ranged from 196 – 246
mg/l.all are samples below desirable limit as per standards. Sample Code
Kadiri tadipatri Guntakal Nallacheruvu
G1 231 223 196 207
G2 236 246 206 228
S1 214 216 214 234
S2 198 221 213 201
Table 5: Total hardness of various areas
G1&G2 : ground Water 1&2 S1&S2 : surface water 1&2
Fig.6: Graphical representation of Total Hardness
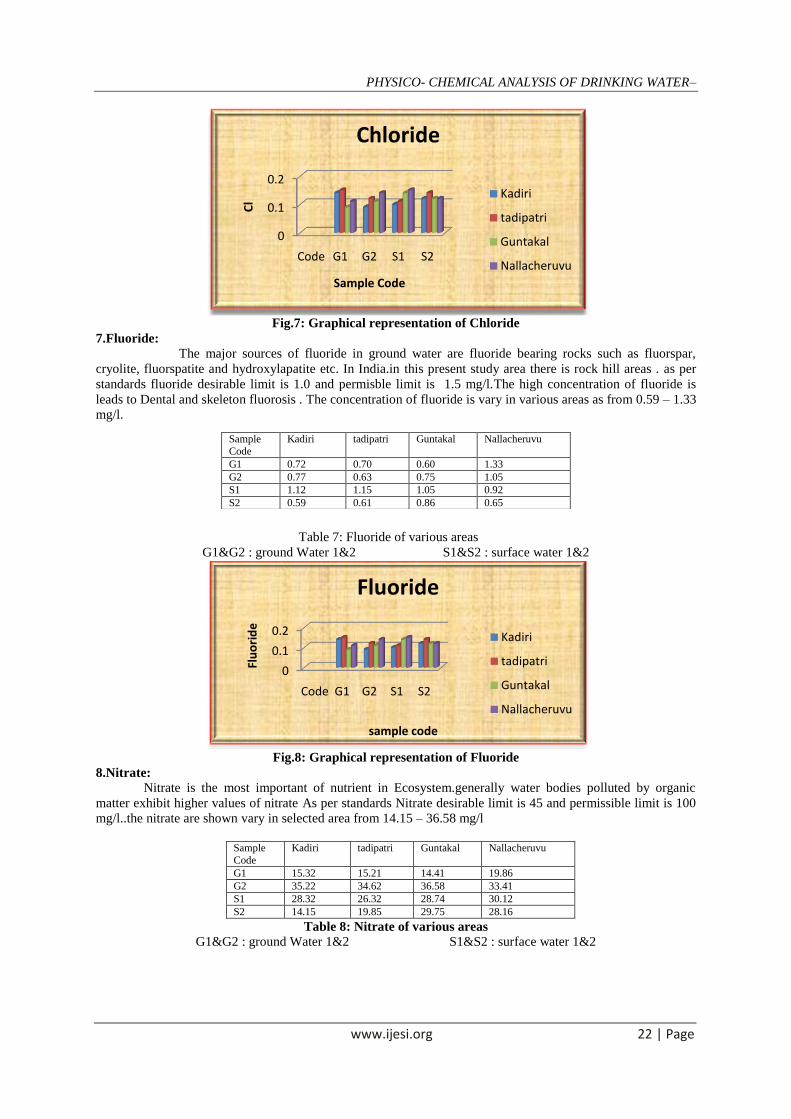
6.Chloride:
Chloride occurs in water samples is leads to sewage pollution as per low and higher values.
Chloride desirable limit is 250 and permissible limit is 1000 mg/l.Chloride values are ranged from. 89.1 – 212.4
mg/l.all are below desirable limit and safe to drinking. Sample
Code
Kadiri tadipatri Guntakal Nallacheruvu
G1 89.1 99.4 212.4 154.3
G2 108.2 128.5 183.4 129.2
S1 210.3 140.7 119.4 211.1
S2 158.3 159.8 126.2 176.3
Table 6: Chloride of various areas
G1&G2 : ground Water 1&2 S1&S2 : surface water 1&2
0
0.1
0.2
Code G1 G2 S1 S2
TDS
Sample code
TDS
Kadiri
tadipatri
Guntakal
Nallacheruvu
0
0.1
0.2
Code G1 G2 S1 S2
Har
dn
ess
sample code
Total Hardness
Kadiri
tadipatri
Guntakal
Nallacheruvu
PHYSICO- CHEMICAL ANALYSIS OF DRINKING WATER–
www.ijesi.org 22 | Page
Fig.7: Graphical representation of Chloride
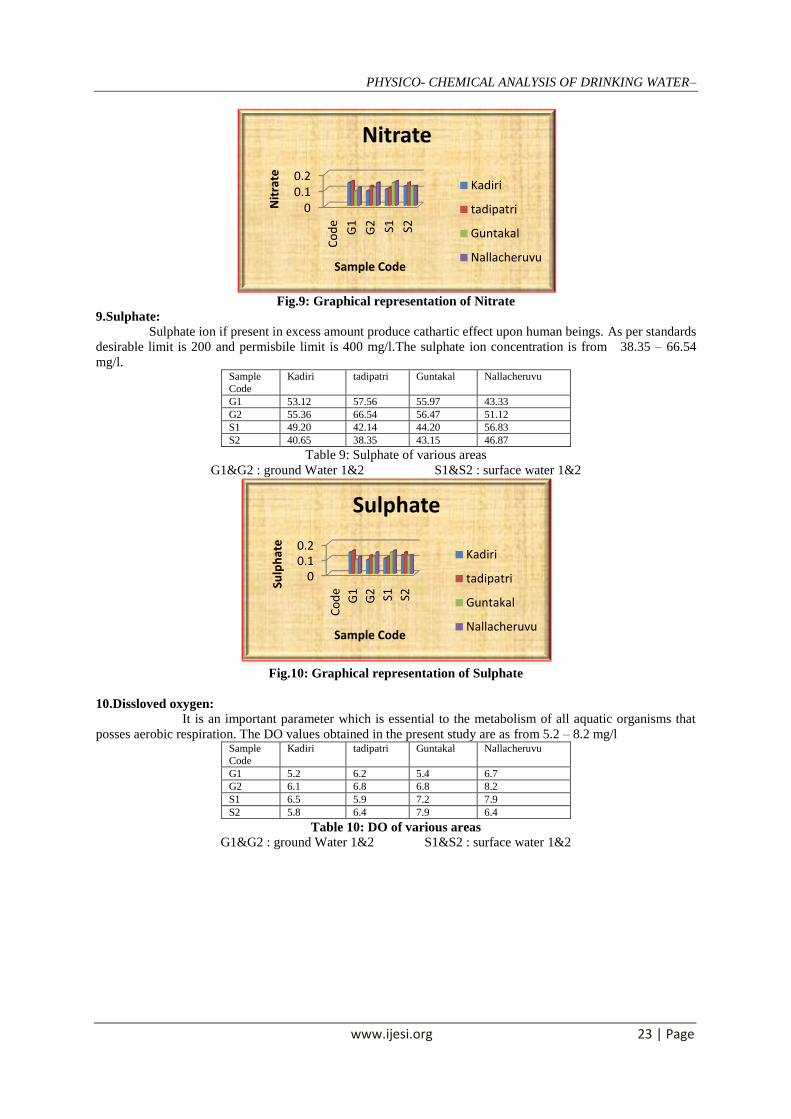
7.Fluoride:
The major sources of fluoride in ground water are fluoride bearing rocks such as fluorspar,
cryolite, fluorspatite and hydroxylapatite etc. In India.in this present study area there is rock hill areas . as per
standards fluoride desirable limit is 1.0 and permisble limit is 1.5 mg/l.The high concentration of fluoride is
leads to Dental and skeleton fluorosis . The concentration of fluoride is vary in various areas as from 0.59 – 1.33
mg/l.
Table 7: Fluoride of various areas
G1&G2 : ground Water 1&2 S1&S2 : surface water 1&2
Fig.8: Graphical representation of Fluoride
8.Nitrate:
Nitrate is the most important of nutrient in Ecosystem.generally water bodies polluted by organic
matter exhibit higher values of nitrate As per standards Nitrate desirable limit is 45 and permissible limit is 100
mg/l..the nitrate are shown vary in selected area from 14.15 – 36.58 mg/l
Sample
Code
Kadiri tadipatri Guntakal Nallacheruvu
G1 15.32 15.21 14.41 19.86
G2 35.22 34.62 36.58 33.41
S1 28.32 26.32 28.74 30.12
S2 14.15 19.85 29.75 28.16
Table 8: Nitrate of various areas
G1&G2 : ground Water 1&2 S1&S2 : surface water 1&2
0
0.1
0.2
Code G1 G2 S1 S2C
l
Sample Code
Chloride
Kadiri
tadipatri
Guntakal
Nallacheruvu
0
0.1
0.2
Code G1 G2 S1 S2
Flu
ori
de
sample code
Fluoride
Kadiri
tadipatri
Guntakal
Nallacheruvu
Sample
Code
Kadiri tadipatri Guntakal Nallacheruvu
G1 0.72 0.70 0.60 1.33
G2 0.77 0.63 0.75 1.05
S1 1.12 1.15 1.05 0.92
S2 0.59 0.61 0.86 0.65
PHYSICO- CHEMICAL ANALYSIS OF DRINKING WATER–
www.ijesi.org 23 | Page
Fig.9: Graphical representation of Nitrate
9.Sulphate: Sulphate ion if present in excess amount produce cathartic effect upon human beings. As per standards
desirable limit is 200 and permisbile limit is 400 mg/l.The sulphate ion concentration is from 38.35 – 66.54
mg/l. Sample
Code
Kadiri tadipatri Guntakal Nallacheruvu
G1 53.12 57.56 55.97 43.33
G2 55.36 66.54 56.47 51.12
S1 49.20 42.14 44.20 56.83
S2 40.65 38.35 43.15 46.87
Table 9: Sulphate of various areas
G1&G2 : ground Water 1&2 S1&S2 : surface water 1&2
Fig.10: Graphical representation of Sulphate
10.Dissloved oxygen:
It is an important parameter which is essential to the metabolism of all aquatic organisms that
posses aerobic respiration. The DO values obtained in the present study are as from 5.2 – 8.2 mg/l Sample
Code
Kadiri tadipatri Guntakal Nallacheruvu
G1 5.2 6.2 5.4 6.7
G2 6.1 6.8 6.8 8.2
S1 6.5 5.9 7.2 7.9
S2 5.8 6.4 7.9 6.4
Table 10: DO of various areas
G1&G2 : ground Water 1&2 S1&S2 : surface water 1&2
00.10.2
Co
de
G1
G2 S1 S2
Nit
rate
Sample Code
Nitrate
Kadiri
tadipatri
Guntakal
Nallacheruvu
00.10.2
Co
de
G1
G2 S1 S2
Sulp
hat
e
Sample Code
Sulphate
Kadiri
tadipatri
Guntakal
Nallacheruvu
PHYSICO- CHEMICAL ANALYSIS OF DRINKING WATER–
www.ijesi.org 24 | Page
Fig.11: Graphical representation of Dissolved oxygen
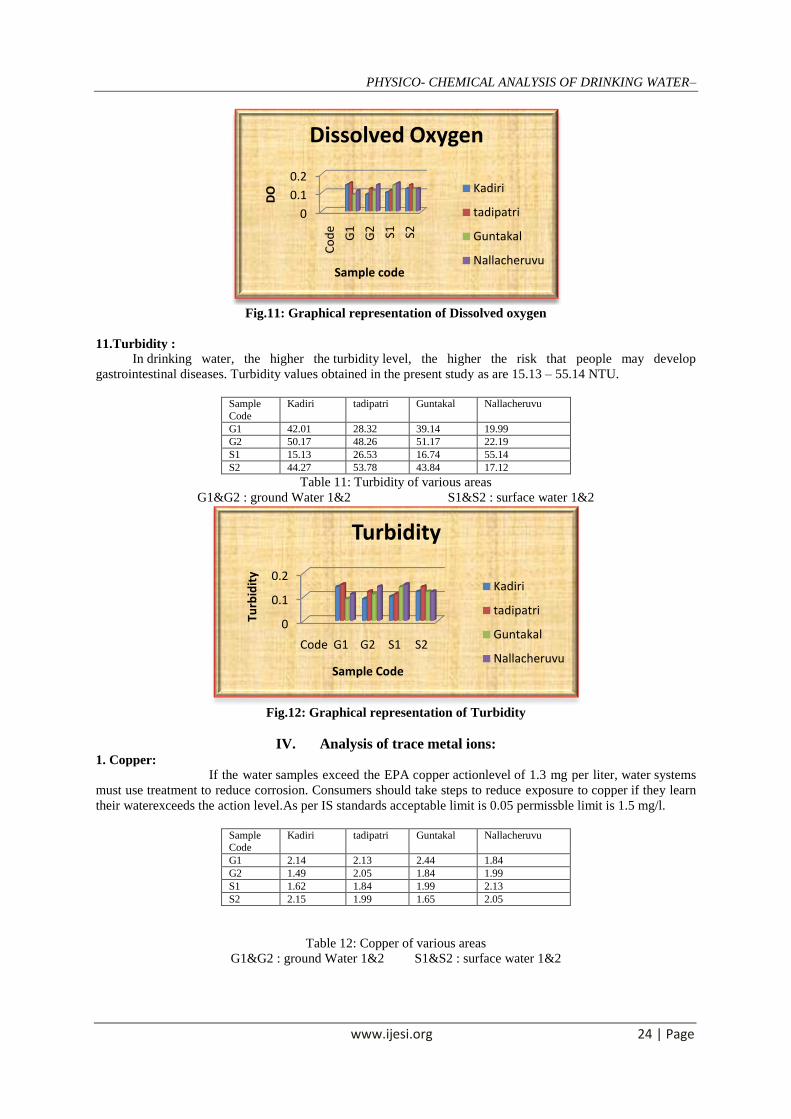
11.Turbidity :
In drinking water, the higher the turbidity level, the higher the risk that people may develop
gastrointestinal diseases. Turbidity values obtained in the present study as are 15.13 – 55.14 NTU.
Sample
Code
Kadiri tadipatri Guntakal Nallacheruvu
G1 42.01 28.32 39.14 19.99
G2 50.17 48.26 51.17 22.19
S1 15.13 26.53 16.74 55.14
S2 44.27 53.78 43.84 17.12
Table 11: Turbidity of various areas
G1&G2 : ground Water 1&2 S1&S2 : surface water 1&2
Fig.12: Graphical representation of Turbidity
IV. Analysis of trace metal ions: 1. Copper:
If the water samples exceed the EPA copper actionlevel of 1.3 mg per liter, water systems
must use treatment to reduce corrosion. Consumers should take steps to reduce exposure to copper if they learn
their waterexceeds the action level.As per IS standards acceptable limit is 0.05 permissble limit is 1.5 mg/l.
Table 12: Copper of various areas
G1&G2 : ground Water 1&2 S1&S2 : surface water 1&2
0
0.1
0.2
Co
de
G1
G2 S1 S2
DO
Sample code
Dissolved Oxygen
Kadiri
tadipatri
Guntakal
Nallacheruvu
0
0.1
0.2
Code G1 G2 S1 S2
Turb
idit
y
Sample Code
Turbidity
Kadiri
tadipatri
Guntakal
Nallacheruvu
Sample Code
Kadiri tadipatri Guntakal Nallacheruvu
G1 2.14 2.13 2.44 1.84
G2 1.49 2.05 1.84 1.99
S1 1.62 1.84 1.99 2.13
S2 2.15 1.99 1.65 2.05
PHYSICO- CHEMICAL ANALYSIS OF DRINKING WATER–
www.ijesi.org 25 | Page
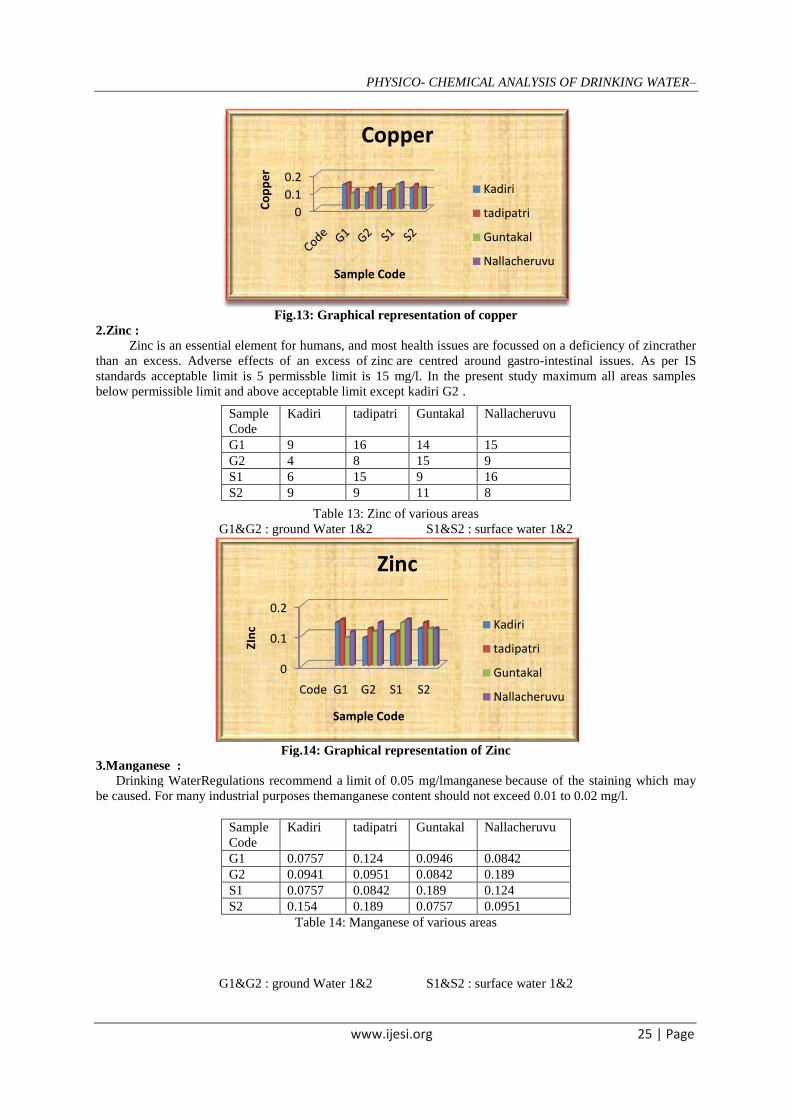
Fig.13: Graphical representation of copper
2.Zinc :
Zinc is an essential element for humans, and most health issues are focussed on a deficiency of zincrather
than an excess. Adverse effects of an excess of zinc are centred around gastro-intestinal issues. As per IS
standards acceptable limit is 5 permissble limit is 15 mg/l. In the present study maximum all areas samples
below permissible limit and above acceptable limit except kadiri G2 .
Table 13: Zinc of various areas
G1&G2 : ground Water 1&2 S1&S2 : surface water 1&2
Fig.14: Graphical representation of Zinc
3.Manganese :
Drinking WaterRegulations recommend a limit of 0.05 mg/lmanganese because of the staining which may
be caused. For many industrial purposes themanganese content should not exceed 0.01 to 0.02 mg/l.
Sample
Code
Kadiri tadipatri Guntakal Nallacheruvu
G1 0.0757 0.124 0.0946 0.0842
G2 0.0941 0.0951 0.0842 0.189
S1 0.0757 0.0842 0.189 0.124
S2 0.154 0.189 0.0757 0.0951
Table 14: Manganese of various areas
G1&G2 : ground Water 1&2 S1&S2 : surface water 1&2
0
0.1
0.2
Co
pp
er
Sample Code
Copper
Kadiri
tadipatri
Guntakal
Nallacheruvu
0
0.1
0.2
Code G1 G2 S1 S2
ZIn
c
Sample Code
Zinc
Kadiri
tadipatri
Guntakal
Nallacheruvu
Sample
Code
Kadiri tadipatri Guntakal Nallacheruvu
G1 9 16 14 15
G2 4 8 15 9
S1 6 15 9 16
S2 9 9 11 8
PHYSICO- CHEMICAL ANALYSIS OF DRINKING WATER–
www.ijesi.org 26 | Page
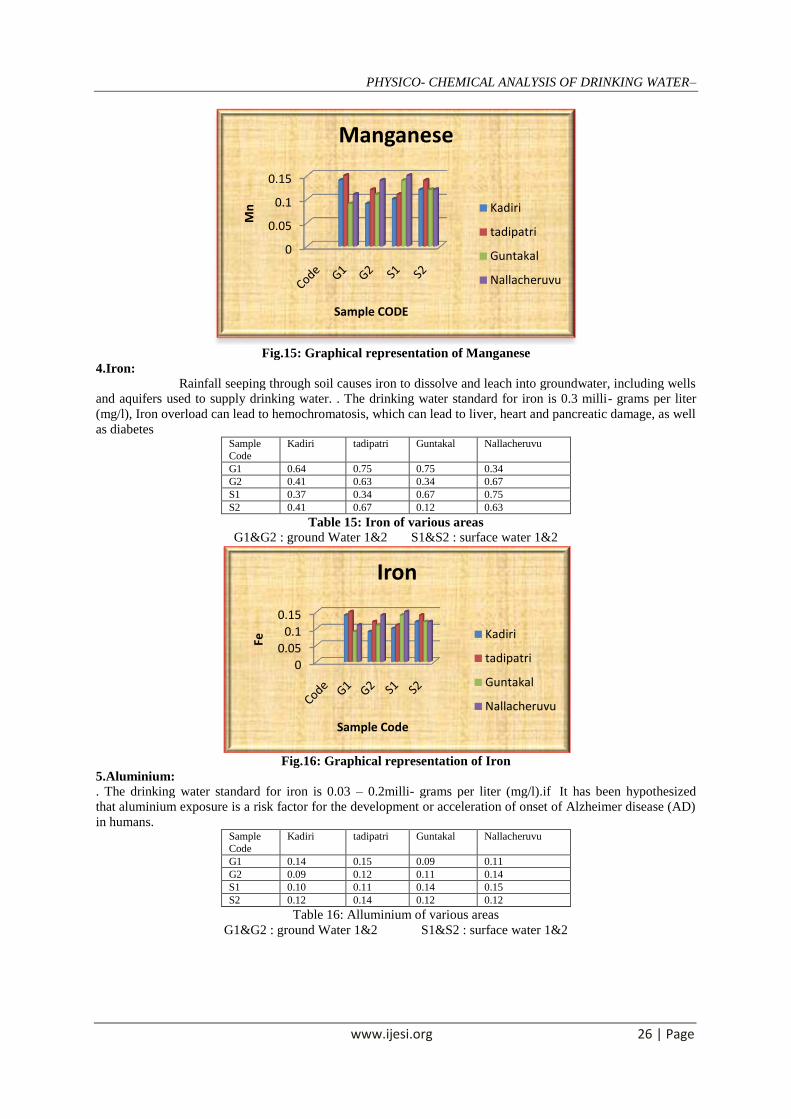
Fig.15: Graphical representation of Manganese
4.Iron: Rainfall seeping through soil causes iron to dissolve and leach into groundwater, including wells
and aquifers used to supply drinking water. . The drinking water standard for iron is 0.3 milli- grams per liter
(mg/l), Iron overload can lead to hemochromatosis, which can lead to liver, heart and pancreatic damage, as well
as diabetes Sample
Code
Kadiri tadipatri Guntakal Nallacheruvu
G1 0.64 0.75 0.75 0.34
G2 0.41 0.63 0.34 0.67
S1 0.37 0.34 0.67 0.75
S2 0.41 0.67 0.12 0.63
Table 15: Iron of various areas
G1&G2 : ground Water 1&2 S1&S2 : surface water 1&2
Fig.16: Graphical representation of Iron
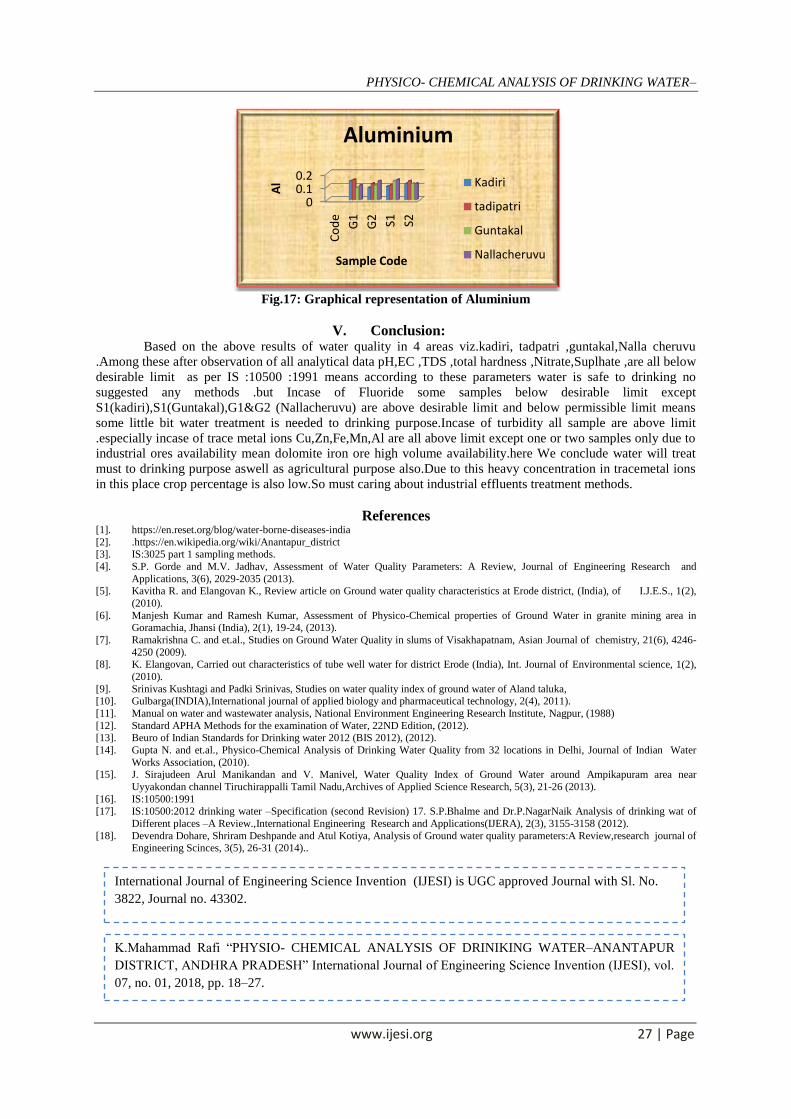
5.Aluminium: . The drinking water standard for iron is 0.03 – 0.2milli- grams per liter (mg/l).if It has been hypothesized
that aluminium exposure is a risk factor for the development or acceleration of onset of Alzheimer disease (AD)
in humans. Sample
Code
Kadiri tadipatri Guntakal Nallacheruvu
G1 0.14 0.15 0.09 0.11
G2 0.09 0.12 0.11 0.14
S1 0.10 0.11 0.14 0.15
S2 0.12 0.14 0.12 0.12
Table 16: Alluminium of various areas
G1&G2 : ground Water 1&2 S1&S2 : surface water 1&2
0
0.05
0.1
0.15
Mn
Sample CODE
Manganese
Kadiri
tadipatri
Guntakal
Nallacheruvu
0
0.05
0.1
0.15
Fe
Sample Code
Iron
Kadiri
tadipatri
Guntakal
Nallacheruvu
PHYSICO- CHEMICAL ANALYSIS OF DRINKING WATER–
www.ijesi.org 27 | Page
Fig.17: Graphical representation of Aluminium
V. Conclusion: Based on the above results of water quality in 4 areas viz.kadiri, tadpatri ,guntakal,Nalla cheruvu
.Among these after observation of all analytical data pH,EC ,TDS ,total hardness ,Nitrate,Suplhate ,are all below
desirable limit as per IS :10500 :1991 means according to these parameters water is safe to drinking no
suggested any methods .but Incase of Fluoride some samples below desirable limit except
S1(kadiri),S1(Guntakal),G1&G2 (Nallacheruvu) are above desirable limit and below permissible limit means
some little bit water treatment is needed to drinking purpose.Incase of turbidity all sample are above limit
.especially incase of trace metal ions Cu,Zn,Fe,Mn,Al are all above limit except one or two samples only due to
industrial ores availability mean dolomite iron ore high volume availability.here We conclude water will treat
must to drinking purpose aswell as agricultural purpose also.Due to this heavy concentration in tracemetal ions
in this place crop percentage is also low.So must caring about industrial effluents treatment methods.
References [1]. https://en.reset.org/blog/water-borne-diseases-india
[2]. .https://en.wikipedia.org/wiki/Anantapur_district [3]. IS:3025 part 1 sampling methods.
[4]. S.P. Gorde and M.V. Jadhav, Assessment of Water Quality Parameters: A Review, Journal of Engineering Research and
Applications, 3(6), 2029-2035 (2013). [5]. Kavitha R. and Elangovan K., Review article on Ground water quality characteristics at Erode district, (India), of I.J.E.S., 1(2),
(2010).
[6]. Manjesh Kumar and Ramesh Kumar, Assessment of Physico-Chemical properties of Ground Water in granite mining area in Goramachia, Jhansi (India), 2(1), 19-24, (2013).
[7]. Ramakrishna C. and et.al., Studies on Ground Water Quality in slums of Visakhapatnam, Asian Journal of chemistry, 21(6), 4246-
4250 (2009). [8]. K. Elangovan, Carried out characteristics of tube well water for district Erode (India), Int. Journal of Environmental science, 1(2),
(2010).
[9]. Srinivas Kushtagi and Padki Srinivas, Studies on water quality index of ground water of Aland taluka, [10]. Gulbarga(INDIA),International journal of applied biology and pharmaceutical technology, 2(4), 2011).
[11]. Manual on water and wastewater analysis, National Environment Engineering Research Institute, Nagpur, (1988)
[12]. Standard APHA Methods for the examination of Water, 22ND Edition, (2012). [13]. Beuro of Indian Standards for Drinking water 2012 (BIS 2012), (2012).
[14]. Gupta N. and et.al., Physico-Chemical Analysis of Drinking Water Quality from 32 locations in Delhi, Journal of Indian Water
Works Association, (2010). [15]. J. Sirajudeen Arul Manikandan and V. Manivel, Water Quality Index of Ground Water around Ampikapuram area near
Uyyakondan channel Tiruchirappalli Tamil Nadu,Archives of Applied Science Research, 5(3), 21-26 (2013).
[16]. IS:10500:1991
[17]. IS:10500:2012 drinking water –Specification (second Revision) 17. S.P.Bhalme and Dr.P.NagarNaik Analysis of drinking wat of
Different places –A Review.,International Engineering Research and Applications(IJERA), 2(3), 3155-3158 (2012).
[18]. Devendra Dohare, Shriram Deshpande and Atul Kotiya, Analysis of Ground water quality parameters:A Review,research journal of Engineering Scinces, 3(5), 26-31 (2014)..
00.10.2
Co
de
G1
G2 S1 S2
Al
Sample Code
Aluminium
Kadiri
tadipatri
Guntakal
Nallacheruvu
International Journal of Engineering Science Invention (IJESI) is UGC approved Journal with Sl. No.
3822, Journal no. 43302.
K.Mahammad Rafi “PHYSIO- CHEMICAL ANALYSIS OF DRINIKING WATER–ANANTAPUR
DISTRICT, ANDHRA PRADESH” International Journal of Engineering Science Invention (IJESI), vol.
07, no. 01, 2018, pp. 18–27.