physicochemical assessment of surface and groundwater resources of greater comilla region of...
TRANSCRIPT
8/7/2019 Physicochemical Assessment of Surface and Groundwater Resources of Greater Comilla Region of Bangladesh
http://slidepdf.com/reader/full/physicochemical-assessment-of-surface-and-groundwater-resources-of-greater 1/8
July 2010, Volume 1, No. 1
International Journal of Chemical and Environmental Engineering
Physicochemical Assessment of Surface andGroundwater Resources of Greater Comilla Region
of Bangladesh
M. J. Ahmed*, M.R. Haque and T. M. A. Haque
Laboratory of Analytical Chemistry, Department of Chemistry, University of Chittagong, Bangladesh,
*corresponding author email: [email protected]
Abstr act
An extensive study was carried out to elucidate the distribution and occurrence of different parameters of water quality of the greater
Comilla region- Comilla, Brahmanbaria and Chandpur districts’, freshwater resources of Bangladesh. To study the different
physicochemical parameters, surface water samples from the Meghna, Gumti, Titas, Hoara and Dakatia Rivers and groundwater
samples from almost every Upazilas were collected and analyzed. Water samples from the freshwater resources were collected from
different points and at different seasons for continuous monitoring during the hydrological years 2008-2009. Collected samples were
analyzed for the following parameters: pH, EC, TDS, TSS, TS, DO, transparency, acidity, dissolved carbon dioxide, total alkalinity,
total hardness, chloride, ammonia-N, sulphate-S, o-phosphate-P, BOD, COD, nitrate-N, nitrite-N, total nitrite and nitrate-N, arsenic,
iron, manganese, copper, nickel, chromium, cadmium, lead, calcium, magnesium, sodium and potassium using the procedure outlined
in the standard methods. Arsenic was analysed for groundwater and Coli form only for surface water samples. Results of water
quality assessment identified the problem areas in respect of arsenic. The results also provided data to understand and quantify the
threat of the impact of climate change on freshwater resources of this region. The results also provided data for water quality of
surface and groundwater resources of Comilla region to match national and international standards for drinking, agricultural,
industrial and livestock requirements.
1. IntroductionEnvironment is the aggregate of conditions affecting
the existence or development of life and nature. The
environmental problems of Bangladesh are becoming
acute because of population explosion, urbanization,
unplanned industrialization and lack of adequate forest
areas. Anthropogenic activities like mining, disposal of
treated and untreated effluents from different industriesand also the indiscriminate use of heavy metal containing
fertilizers and pesticides in agriculture resulted in
deterioration of water quality rendering serious
environmental problems [1]. Pollution by organic matterand nutrients originates from anthropogenic sources,
mainly as municipal wastewater [2]. There are allegations
that untreated wastes are discharged from the factories
into the water bodies (Fig. I). Surface waters in
Bangladesh serve purposes including drinking, bathing,
fishing, irrigation, household and livestock watering.
Water pollution concerns within the rural and municipal
areas are therefore not limited to potable water criteria but
include the effects on general health of humans, livestock,
agriculture and aquatic life.
Greater Comilla region lies in the eastern part of
Bangladesh and consists of three districts- Comilla,Brahmanbaria and Chandpur. This region is almost plain
lowland with some hillock at Lalmai and Mainamati.
Comilla district comprises with an area of 3085.17 sq km
and has fourteen Upazilas. These are Comilla sadar, Sadar
Daskin, Barura, Chandina, Daudkandi, Titas, Laksham,
Brahmanpara, Burichang, Chauddagram, Debidwar,
Homna, Mur
adnagar and Nangalkot. Main rivers of this district
are the Meghna, Gumti and Dakatia. Brahmanbariadistrict comprises with an area of 1927.11 sq km and has
seven Upazilas. These are Banchharampur, Kasba,Nabinagar, Nasirnagar, Brahmanbaria Sadar, Sarail and
Akhaura. Main rivers of this district are the Meghna, Titas
and Haora. Chandpur district comprises with an area of
1704.06 sq km and has seven Upazilas. These are
Chandpur Sadar, Hajiganj, Kachua, Faridganj, Matlab,
Haimchar, and Shahrasti. Main rivers of this district arethe Meghna and Dakatia.
A global water supply and sanitation assessment stated

8/7/2019 Physicochemical Assessment of Surface and Groundwater Resources of Greater Comilla Region of Bangladesh
http://slidepdf.com/reader/full/physicochemical-assessment-of-surface-and-groundwater-resources-of-greater 2/8
Physicochemical Assessment of Surface and Groundwater Resources of Greater Comilla Region of Bangladesh
48
that 75% of the populations of rural areas in Asia do not
have access to improved water [3]. A recent World Bank study also reported that environmental pollution is
responsible for 22% of all death from diseases in
Bangladesh and reducing environmental risks could
increase the national income by 3.5%. Therefore,
physicochemical assessment and monitoring of surface
and groundwater resources of the greater Comilla regionusing simple and rapid methods is of paramount
importance.
The results provided data for water quality of surface
and groundwater resources of this region to match
national and international standards for drinking,
agricultural, industrial and livestock requirements. Theassessment data can be used to help determine the
efficacy of existing water quality policies and to help
analysts determine the need for, and likely consequences
of new policies. The assessment data can be supplied to
the proper Govt. authority for making new national andregional policies and appropriate preventive measures can
be taken prior further deterioration of water quality. Theassessment will increase the awareness of the people of
the risk and affected areas so that they could be ready to
face the disaster due to climate change.
2. Materials and Method
Surface and groundwater samples from different
rivers and Upazilas (smaller administrative unit of
Bangladesh) of Comilla, Brahmanbaria and Chandpur
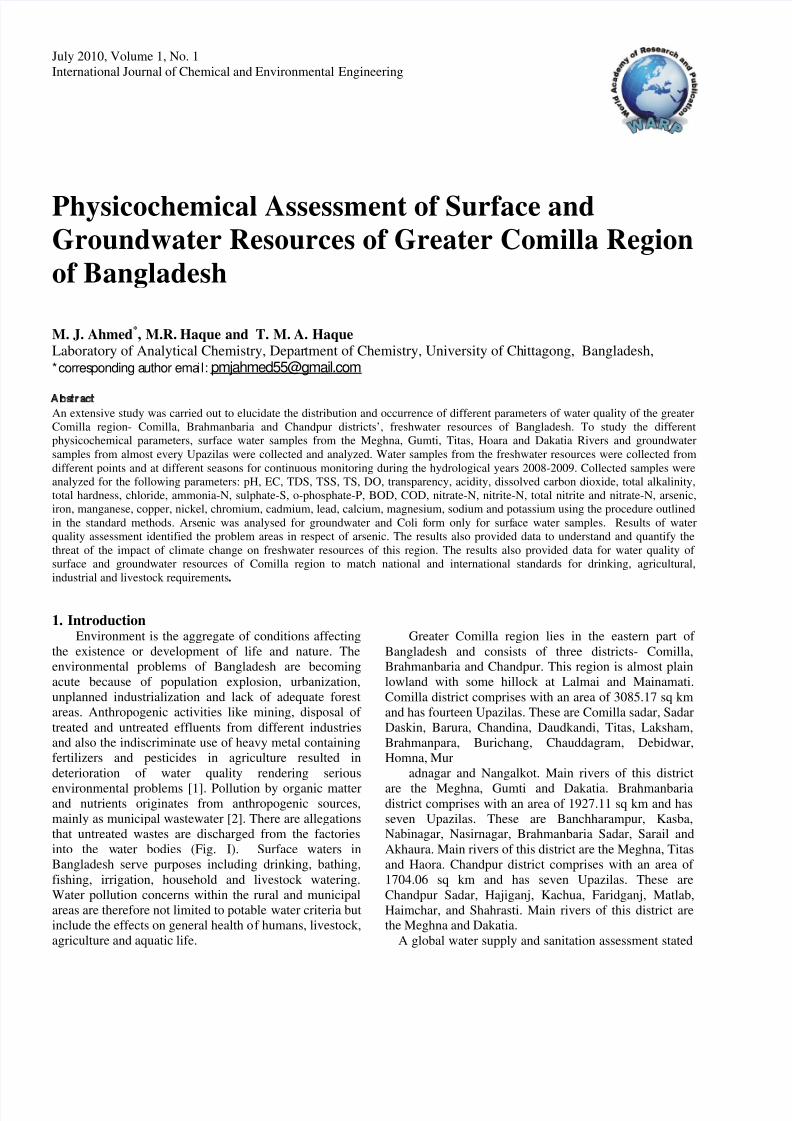
districts were collected for this study. Sample collection
points are shown in figure II. Samples were collected in
amber color polyethylene bottle cleaned by rinsing
thoroughly with 8M HNO3, followed by repeated
washing with distilled
water
Fig. 1 Photo shows dumping of solid wastes into the water body
washing with distilled water. Multiple samples were
collected from the same spot in different seasons to study
the seasonal variation of the results. The surface water
samples were collected in the boat if possible in the
middle of the flow. Two to four sub samples of equal
volume were collected from vertical section. The water
samples were collected within 3-9 inches from the surfaceof the water. Groundwater samples were collected from
tube wells after discarding water for the first 2 minutes.
The samples were mixed well and a sample of 1.0-1.5 L
was transferred for analysis in the laboratory.
Temperature, transparency, pH, Electrical conductivity
(EC), Total dissolved solids (TDS), dissolved oxygen(DO) were measured at the sampling site. Other
parameters were analysed immediately after sample
collection at the laboratory. For the analysis of metals by
UV-Visible spectrophotometry and atomic absorption
spectrophotometry (AAS) samples were digested
according to wet-digestion method [4]. For chemical
analysis, standard preservation techniques and methods of
analysis [5-8] were used. Data were analysed by Excel
2000 software and SPSS 11.5 software was used for
statistical analysis.Different parameters of water quality
were analyzed by the following methods:A glass thermometer was used for the measurement
of temperature. Transparency was measured by Sacchidisc. pH, EC and TDS were measured at the sampling site
by Hanna Combo meter, Model – HI 98129.
Measurement of DO was done by Jenway 970 DO meter
at the sampling site. Biochemical oxygen demand (BOD)was measured from the differences of initial and 5 days
DO by DO meter. Chemical oxygen demand (COD) was
determined by titrimetric method after 2 hours open
reflux. Acidity and dissolved carbon dioxide were
measured by titrimetric method using standard 0.02M
NaOH. Total and phenolphthalein alkalinity were
measured by titrimetric method using methyl orange and
phenolphthalein, respectively as indicators. Hardness was
measured by complexometric titration method. o-phosphate-P was measured by colorimetric
vanadomolybdophosphoric acid method. Sulphate-S was
measured by colorimetric barium chloride turbidimetricmethod. Nitrite-N was determined by colorimetric method
by formation of a reddish purple azo dye produced at pH
2.0-2.5 by coupling diazotized sulfanilamide with
N-(1-naphthyl)-ethylenediamine dihydrochloride.
Chloride was determined by argentometric method in aneutral or slightly alkaline solution using potassium
chromate as indicator by standard silver nitrate as titer.
Iron was determined by colorimetric method using
1,10-phenanthroline as chelating agent. Manganese was
determined by colorimetric per-sulfate oxidation method.In colorimetric methods a Shimadzu, Model-1800 UV-
Vis spectrophotometer was used. Zinc, copper, lead,
cadmium, cobalt, nickel and chromium were determined
by Varian Model-AA240FS fast sequential atomic
absorption spectrophotometer. Coli form was measured
by MPN(Maximum probable number) method [9].
8/7/2019 Physicochemical Assessment of Surface and Groundwater Resources of Greater Comilla Region of Bangladesh
http://slidepdf.com/reader/full/physicochemical-assessment-of-surface-and-groundwater-resources-of-greater 3/8
Physicochemical Assessment of Surface and Groundwater Resources of Greater Comilla Region of Bangladesh
49
Error! Not a valid link.
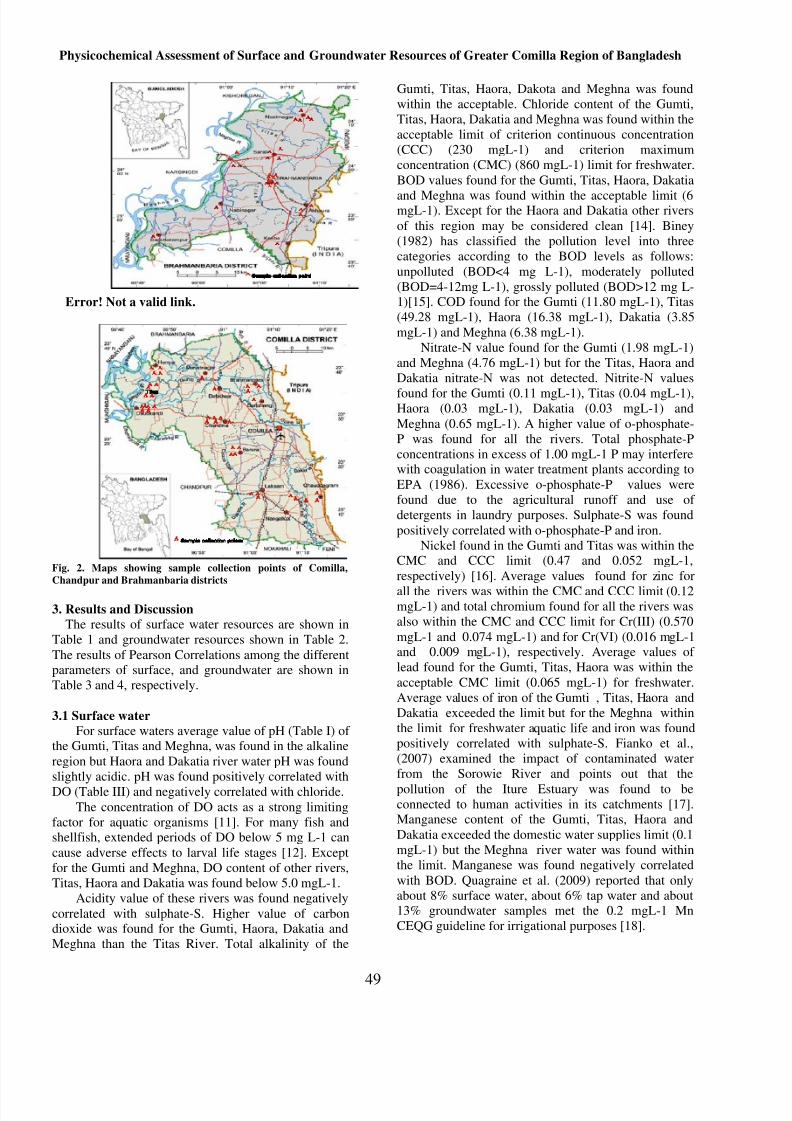
Fig. 2. Maps showing sample collection points of Comilla,
Chandpur and Brahmanbaria districts
3. Results and Discussion
The results of surface water resources are shown in
Table 1 and groundwater resources shown in Table 2.
The results of Pearson Correlations among the differentparameters of surface, and groundwater are shown in
Table 3 and 4, respectively.
3.1 Surface water
For surface waters average value of pH (Table I) of the Gumti, Titas and Meghna, was found in the alkaline
region but Haora and Dakatia river water pH was found
slightly acidic. pH was found positively correlated with
DO (Table III) and negatively correlated with chloride.
The concentration of DO acts as a strong limiting
factor for aquatic organisms [11]. For many fish andshellfish, extended periods of DO below 5 mg L-1 can
cause adverse effects to larval life stages [12]. Except
for the Gumti and Meghna, DO content of other rivers,
Titas, Haora and Dakatia was found below 5.0 mgL-1.
Acidity value of these rivers was found negatively
correlated with sulphate-S. Higher value of carbondioxide was found for the Gumti, Haora, Dakatia and
Meghna than the Titas River. Total alkalinity of the
Gumti, Titas, Haora, Dakota and Meghna was found
within the acceptable. Chloride content of the Gumti,
Titas, Haora, Dakatia and Meghna was found within the
acceptable limit of criterion continuous concentration
(CCC) (230 mgL-1) and criterion maximum
concentration (CMC) (860 mgL-1) limit for freshwater.
BOD values found for the Gumti, Titas, Haora, Dakatia
and Meghna was found within the acceptable limit (6mgL-1). Except for the Haora and Dakatia other rivers
of this region may be considered clean [14]. Biney
(1982) has classified the pollution level into three
categories according to the BOD levels as follows:
unpolluted (BOD<4 mg L-1), moderately polluted
(BOD=4-12mg L-1), grossly polluted (BOD>12 mg L-1)[15]. COD found for the Gumti (11.80 mgL-1), Titas
(49.28 mgL-1), Haora (16.38 mgL-1), Dakatia (3.85
mgL-1) and Meghna (6.38 mgL-1).
Nitrate-N value found for the Gumti (1.98 mgL-1)
and Meghna (4.76 mgL-1) but for the Titas, Haora and
Dakatia nitrate-N was not detected. Nitrite-N values
found for the Gumti (0.11 mgL-1), Titas (0.04 mgL-1),Haora (0.03 mgL-1), Dakatia (0.03 mgL-1) and
Meghna (0.65 mgL-1). A higher value of o-phosphate-
P was found for all the rivers. Total phosphate-P
concentrations in excess of 1.00 mgL-1 P may interferewith coagulation in water treatment plants according to
EPA (1986). Excessive o-phosphate-P values were
found due to the agricultural runoff and use of
detergents in laundry purposes. Sulphate-S was found
positively correlated with o-phosphate-P and iron.
Nickel found in the Gumti and Titas was within theCMC and CCC limit (0.47 and 0.052 mgL-1,
respectively) [16]. Average values found for zinc for
all the rivers was within the CMC and CCC limit (0.12mgL-1) and total chromium found for all the rivers was
also within the CMC and CCC limit for Cr(III) (0.570
mgL-1 and 0.074 mgL-1) and for Cr(VI) (0.016 mgL-1and 0.009 mgL-1), respectively. Average values of
lead found for the Gumti, Titas, Haora was within the
acceptable CMC limit (0.065 mgL-1) for freshwater.
Average values of iron of the Gumti , Titas, Haora and
Dakatia exceeded the limit but for the Meghna within
the limit for freshwater aquatic life and iron was found
positively correlated with sulphate-S. Fianko et al.,
(2007) examined the impact of contaminated water
from the Sorowie River and points out that the
pollution of the Iture Estuary was found to beconnected to human activities in its catchments [17].Manganese content of the Gumti, Titas, Haora and
Dakatia exceeded the domestic water supplies limit (0.1
mgL-1) but the Meghna river water was found within
the limit. Manganese was found negatively correlated
with BOD. Quagraine et al. (2009) reported that only
about 8% surface water, about 6% tap water and about13% groundwater samples met the 0.2 mgL-1 Mn
CEQG guideline for irrigational purposes [18].

8/7/2019 Physicochemical Assessment of Surface and Groundwater Resources of Greater Comilla Region of Bangladesh
http://slidepdf.com/reader/full/physicochemical-assessment-of-surface-and-groundwater-resources-of-greater 4/8
Physicochemical Assessment of Surface and Groundwater Resources of Greater Comilla Region of Bangladesh
50
Table .1 Surface water quality of greater comilla Region
Parameters Gumti Titas Haora Dakatia Meghna
Ambient temp (0C) 35.80 30.97 31.50 33.20 35.00
Water temp (0C) 34.70 30.03 30.75 34.40 31.00pH 7.34 7.11 6.99 6.78 7.04
EC (µScm-1) 92.45 87.80 92.50 179.15 415.95
TDS (mgL-1) 46.15 43.43 46.30 89.85 207.40
TSS (mgL-1) 130.00 240.00 100.00 80.00 70.00
TS(mgL-1) 176.15 277.00 146.30 169.85 277.40
DO(mgL-1) 6.10 4.77 4.80 4.15 6.85
Transparency (cm) 32.50 20.00 16.00 26.00 30.00
Acidity (mgL-1) 11.86 6.36 8.84 9.72 15.47
CO2 (mgL-1) 10.86 3.17 7.78 8.55 13.61
P.alkalinity (mgL-1) BDL BDL BDL BDL BDL
T.alkalinity (mgL-1) 53.28 40.53 136.50 56.02 50.75
T. hardness (mgL-1) 43.00 45.00 72.00 107.00 92.00
Chloride (mgL-1) 37.17 25.84 39.93 65.69 85.31
BOD (mgL-1) 0.13 2.45 3.40 3.05 1.68
COD (mgL-1) 11.80 49.28 16.38 3.85 6.38
NO2—N (mgL-1) 0.11 0.04 0.03 0.03 0.65
NO3- -N (mgL-1) 1.98 BDL BDL BDL 4.76
PO43- -P (mgL-1) 3.59 1.73 4.18 2.52 1.87
SO42- -N (mgL-1) 8.72 9.64 14.27 11.96 7.25
Ni (mgL-1) 0.003 0.003 BDL BDL BDL
Zn (mgL-1) 0.044 0.040 0.045 0.048 0.039Cu (mgL-1) BDL BDL BDL BDL BDL
Co (mgL-1) 0.032 0.033 0.042 0.014 0.024
Cr (mgL-1) 0.012 0.021 0.019 0.014 0.013
Cd (mgL-1) BDL BDL BDL BDL BDL
Pb (mgL-1) 0.018 0.050 0.020 BDL BDL
Fe (mgL-1) 1.49 2.42 1.69 1.02 0.39
Mn (mgL-1) 0.36 0.16 0.32 0.18 0.08
%NaCl 0.50 0.15 0.45 0.55 0.85
Coli form (100mL) ≥ 1600 900 500 500 ≥ 1600
BDL= Below Detection Level, ND= Not Done

8/7/2019 Physicochemical Assessment of Surface and Groundwater Resources of Greater Comilla Region of Bangladesh
http://slidepdf.com/reader/full/physicochemical-assessment-of-surface-and-groundwater-resources-of-greater 5/8
Physicochemical Assessment of Surface and Groundwater Resources of Greater Comilla Region of Bangladesh
51
Table.2 Groundwater quality of the greater Comilla region
Parameters Comilla Chandpur Brahmanbaria BSTI Standard
Ambient Temp.(0C) 28.00-37.00 27.50-36.00 30.00-36.10 --
Water Temp.(0C) 16.00-32.00 22.00-30.00 26.00-32.00 --
pH 5.80-7.58 7.13-7.34 6.62-7.16 6.4-7.4EC (µScm-1) 73.20-1797.00 364.00-704.00 127.40-1688.00 --
TDS (mgL-1) 36.50-749.00 182.00-351.00 63.60-809.00 Max 500
% NaCl 0.10-2.90 0.70-1.40 0.20-3.20 --
DO (mgL-1) 1.25-3.42 1.33-2.54 1.08-3.76 Max 6
Acidity (mgL-1) 3.52-278.46 2.06-10.30 8.84-152.49 --
T. alkalinity (mgL-1) 21.33-1046.69 148.00-277.50 102.96-2832.00 --
T. hardness (mgL-1) 26.00-684.00 124.00-252.00 12.00-524.00 Max 500
Chloride (mgL-1) 10.06-364.48 15.31-59.34 4.78-272.26 Max 600
NO2—N (mgL-1) BDL-0.04 BDL-0.06 BDL-0.02 Nil
NO3—N (mgL-1) BDL - 3.59 BDL- 0.22 BDL - 3.56 Max 10
PO43—P (mgL-1) 0.00-8.91 4.18 - 5.15 0.00-7.08 Max 6
SO42- -S (mgL-1) 0.00 - 59.10 0.15-1.54 0.31-68.52 Max 400
Ni (mgL-1) BDL- 0.001 BDL-0.004 BDL-0.009 --
Zn (mgL-1) BDL-0.018 BDL-0.03 BDL-0.03 Max 5
Cu (mgL-1) BDL-0.010 BDL-0.007 BDL-0.04 Max 1
Co (mgL-1) BDL -0.037 BDL-0.008 BDL-0.04 ---
Cr (mgL-1) BDL -0.008 BDL-0.006 BDL -0.01 Max 0.5
Cd (mgL-1) BDL BDL BDL 0.005
Pb (mgL-1) 0.01-0.08 0.05-0.07 0.04-0.07 Max 0.05
As (mgL-1) 0.01 -0.50 0.1-0.60 BDL - 0.10 Max 0.05
Fe (mgL-1) 0.05-7.83 BDL -8.86 0.10-6.96 0.3-1.0Mn (mgL-1) BDL -3.94 BDL -0.38 BDL -1.63 Max 0.1
BSTI= Bangladesh Standards and Testing Institute

8/7/2019 Physicochemical Assessment of Surface and Groundwater Resources of Greater Comilla Region of Bangladesh
http://slidepdf.com/reader/full/physicochemical-assessment-of-surface-and-groundwater-resources-of-greater 6/8
Physicochemical Assessment of Surface and Groundwater Resources of Greater Comilla Region of Bangladesh
53
Highest number of Coli form,≥1600 was found in
the Gumti and Meghna river water samples but for theTitas, Haora and Dakatia Coli form found for per 100mL
are 900, 500 and 500, respectively.
3.2 Groundwater
Groundwater depletion due to pollution mostly from
anthropogenic sources, which is estimated for about 20%
of global withdrawals, is a serious problem. Besidesreducing availability of good quality of water for
consumption, it poses a risk to associated aquatic and
terrestrial ecosystems [19]. Groundwater recharge to
shallow unconfined aquifers is complex and is dependent
upon the occurrence, intensity, and duration of
precipitation, temperature, humidity, wind velocity, aswell as the character and thickness of soil and rock above
the water table, and the surface topography, vegetation,
and land use [20]. pH of groundwater samples (Table II)
of Comilla and Brahmanbaria districts was found in the
slightly acidic to alkaline range but Chandpurgroundwater has pH in the alkaline range. pH was found
positively correlated (Table IV) with o-phosphate-P only.
Lower values of pH of Comilla district is not within the
acceptable limit set by BSTI (6.4-7.4) for drinking water.
pH of groundwater can be lowered by organic acids from
decaying vegetation, or the dissolution of sulfideminerals. Higher values of TDS of Comilla and
Brahmanbaria exceeded the limit of BSTI standard (Max
600 mgL-1). TDS values indicate the general nature of
water quality and are usually related to conductivity.
Water containing more than 500 mg/L of TDS is not
considered desirable for drinking water supplies, thoughmore highly mineralised water may be used where better
quality water is not available [21]. EC was foundpositively correlated with hardness, chloride, manganese
and sulphate-S.
Acidity was found positively correlated with
hardness and iron and total hardness was found positively
correlated with EC, acidity, chloride and manganese.
Higher values of total hardness of Comilla and
Brahmanbaria exceeded the limit of BSTI standard (Max
500 mgL-1). Higher values of total alkalinity of
groundwater samples of Comilla and Brahmanbariaexceeded the limit of BSTI standard (Max 600 mgL-1).
Chloride content of groundwater of Comilla, Chandpur
and Brahmanbaria was found within the acceptable limit
of BSTI standard (Max 600 mgL-1).Nitrate-N of groundwater samples of Comilla,
Chandpur and Brahmanbaria was within the limit (Max.10 mgL-1 ) of BSTI drinking water standard. Nitrite-N
should not be present in drinking water, but in some
samples of all the districts nitrite-N was found. O-
phosphate-P of all the districts was found positively
correlated with pH and iron. Higher values of Comilla
and Brahmanbaria exceeded the limit of BSTI standard(Max 6 mgL-1). Sulphate-S content of groundwater of all
the districts was within the acceptable limit of BSTI
standard (Max 400 mgL-1). Sulphate-S was found
positively correlated with EC, hardness, alkalinity andiron.
Among the toxic and trace metals nickel, zinc,
copper, cobalt, chromium and cadmium in groundwater
samples of all the three districts were found within the
acceptable limit of BSTI standard. Lead content of
groundwater samples of Comilla, Chandpur andBrahman aria is slightly higher than the permissible limit
for drinking water (Max 0.05 mgL-1). Arsenic is a toxic
element and classified as a human carcinogen [22]. The
total as content in polluted environmental samples (soil,
sediment) is poor indicator of its bioavailability, mobility
or toxicity [23]. About 35% groundwater samples of Comilla, 33 % of Chandpur and 27% of Brahmanbaria
district contained arsenic in concentration ≥ 0.1 mgL -1
and about 20% samples of Comilla and 50% of Chandpur
contained arsenic in concentration≥ 0.5 mgL -1.
Groundwater contamination by arsenic is a big threat to
the lives of thousands of people in Bangladesh [24].
Halim et al. (2008) reported that dissolved arsenic ingroundwater ranged from 0.006 to 0.461 mgL-1, with
69% groundwater samples exceeded the Bangladesh limit
for safe drinking water (0.05 mg L-1) [25]. It is evident
that groundwater of Comilla and Chandpur districts aremore prone to arsenic contamination. Arsenic, which is
naturally present in soil, can be mobilized and
transported, leading to increased concentrations of As in
aquifers, that are sources of drinking water [27]. Natural
processes (atmospheric emission, desorption and
dissolution of naturally occurring arsenic richminerals)/anthropogenic activities (mining/fossil fuel
combustion/metallurgical processes/wood preservative
etc.) are the two principal pathways for arsenic releaseinto the environment [28]. Kouras et al. (2007) reported
that almost 65% of the examined wells exceeded the limit
of 0.010 mg L-1 proposed for water intended for humanconsumption.
Higher value of iron of Comilla and Brahmanbaria is
higher than the permissible limit for drinking water (0.3-
1.0 mgL-1). Higher value of manganese content of all the
three districts exceeded the permissible limit for drinkingwater (Max. 0.1 mgL-1). No correlation was found among
iron, arsenic and manganese.
4. Conclusion
From the present physicochemical study of the waterquality of Comilla region, it can be concluded that surfacewater of this region is slightly acidic to alkaline. Higher
values of EC and TDS found for the Meghna river may be
due to the effluents from the industries of Ashuganj,
Brahmanbaria. From the COD value it can be concluded
that Titas at Brahmanbaria point is the most polluted
among these rivers. This is due to the municipal wastesand effluents discharged into the river. Alkalinity of all
these rivers is mainly for carbonates and bicarbonates.
Higher values of o-phosphate-P may be due to the
8/7/2019 Physicochemical Assessment of Surface and Groundwater Resources of Greater Comilla Region of Bangladesh
http://slidepdf.com/reader/full/physicochemical-assessment-of-surface-and-groundwater-resources-of-greater 7/8
Physicochemical Assessment of Surface and Groundwater Resources of Greater Comilla Region of Bangladesh
54
washing out of fertilizer from agricultural fields and
detergents used in household purposes.In comparison with the Karnafuli River, DO of these
rivers is in better condition. Dakatia and Meghna river
water is moderately hard but the Gumti, Titas and Haora
river water is soft. Among the metals nickel, cobalt, zinc,
cobalt, chromium and lead were found within the
acceptable limit of EPA and higher amount of iron andmanganese content of these rivers may be due to the
pollution from industrial and municipal sources and
geological conditions of soil through which these rivers
are flowing. Higher number of Coli form found in the
river water samples may be for human feces and
municipal wastes.pH of some groundwater samples of Comilla (5.80-
7.58) district was found far below the permissible limit
of BSTI (6.4-7.4) for drinking water. Continuous
consumption of acidic water may cause health hazard.
Higher values of TDS of Comilla (36.50-749.00 mgL-1)and Brahmanbaria (63.60-809.00 mgL-1) exceeded the
limit of BSTI (Max 600 mgL-1). Higher values of totalhardness of Comilla (26.00-684.00 mgL-1) and
Brahmanbaria (12.00-524.00 mgL-1) also exceeded the
limit of BSTI (Max 500 mgL-1). Higher values of total
alkalinity of groundwater of Comilla (21.33-1046.69
mgL-1) and Brahmanbaria (102.96-2832.00 mgL-1)
exceeded the limit of BSTI (Max 600 mgL-1). Higher
values of o-phosphate-P of Comilla (BDL-8.91 mgL-1)
and Brahmanbaria (BDL-7.08 mgL-1) exceeded the limit
of BSTI (Max 6 mgL-1).
Assessment of groundwater enables visualization of
areas of different groundwater chemical status, early
identification of a risk and timely undertaking
interception/reversal actions for restoration of goodgroundwater status. Assessment of groundwater of this
region reveled that groundwater of Chandpur district is
highly contaminated by arsenic. About 85% groundwatersamples of Chandpur contained arsenic in concentration ≥
0.1 mgL-1. Iron content of groundwater of Comilla
(0.05-7.83 mgL-1) and Brahmanbaria (0.10-5.52 mgL-1)
is higher than the permissible limit for drinking water
(0.3-1.0 mgL-1). Higher values of manganese of Comilla
(BDL-3.94 mgL-1), Chandpur (BDL-0.16) and
Brahmanbaria (0.00-1.63 mgL-1) exceeded the
permissible limit for drinking water (Max. 0.1 mgL-1).
Other metals such as-nickel, zinc, copper, cobalt,
cadmium and chromium were found within thepermissible limit of BSTI. The following is concluded
and recommended from the present study
1. From the present study it is found that the Titas
River water becomes polluted from industrial, municipal
and agricultural sources. Industrial and municipal
effluents must be discharged into the river after proper
treatment.2. Department of Environment (DoE) should take a
lead role in organizing an efficient effort with other
government and non government agencies in solving the
problems of the Titas River.
3. Proper law should be passed and implemented, sothat authority can take necessary action against the
industries and bodies responsible for polluting the Rivers.
The community people should be mobilized in such
efforts, because people’s participation is very much
fruitful in improving the environmental situation.
4. Government should take necessary steps to supplyarsenic free and non-acidic safe drinking from deep tube
well.
5. Steps must be taken for using rain water, after
preserving in tanks and ponds in the rainy season, as
alternate source of groundwater.
Acknowledgment
The authors are grateful to the Ministry of Science and
Information & Communication Technology for financial
assistance to complete this project. The authors would
also like to express sincere thanks to the Ministry of
Education and Bangladesh University Grants Commission
for sanctioning deputation and granting scholarship,respectively to one of us (M. Reazul Haque).
References
[1] D. Kar, P. Sur, S. K. Mandal, T. Saha, R. K. Kole, ‘‘Assessmentof heavy metal pollution in surface water’’. International Journal
of Environment Science and Technology, Vol. 5(1), 2008,
pp.119-124.
[2] M. Vega, R. Pardo, E. Barrado, L. Debán, ‘‘Assessment of seasonal
and polluting effects on the quality of river water by exploratory
data analysis’’. Water Research, Vol. 32(12), 1998 pp.3581-3592.
[3] S. Godfrey and M. Smith, ‘‘Improved microbial risk assessment
of groundwater’’, Hydrogeol J, Vol. 13, 2005, pp. 321-324
[4] S. M. Flanagan, D. L. Montgomery, J. D. Ayotte, US. GeologicalSurvey Water-Resources Investigations Report 01-4042, 2001,
p.12.
[5] APHA, Standard Methods for the Examination of Water and
Wastewater. (18th edition), APHA, New York, 1992.
[6] G. N. Chattopadhyay, Chemical analysis of fish pond soil and
water, Daya publishing house, Delhi-110035, 1998, p.68.
[7] N. Manivasakam, Physicochemical examination of water, sewageand industrial effluent, 2nd edn. Pragati Prakashan, 2000, p. 47.
[8] A. K. De, Environmental Chemistry, 4th edn, New AgeInternational Publication, 2000, p.286.
[9] L. S. Clesceri, A. L Greenberg and A. D. Eton (Eds.), Standard
Methods for the Examination of Water and Wastewater (20thedition), APHA, New York, 1998.
[10] M. H. Abdullah, B. Musta, Phreatic Water Quality of the TurtleIsland of West Malaysia: Pulau Selingan and Pulau Bakungan
Kechil. Borneo Science, Vol. 6, 1999, pp.1-9.
[11] A. A. Khan, S. B. Ali, ‘‘Effects of Erosion on Indus River Bio-diversity in Pakistan’’. Pakistan Journal of Biological Sciences,
Vol. 6(12), 2003, pp.1035-1040.
[12] EPA (United States Environmental Protection Agency), ‘‘Qualitycriteria for water 1986’’. Office of Water Regulator and
Standards, Washington, DC 20460, 1986.
[13] S. Suthar, J. Sharma, M. Chabukdhara, A. K. Nema, ‘‘Water
8/7/2019 Physicochemical Assessment of Surface and Groundwater Resources of Greater Comilla Region of Bangladesh
http://slidepdf.com/reader/full/physicochemical-assessment-of-surface-and-groundwater-resources-of-greater 8/8
Physicochemical Assessment of Surface and Groundwater Resources of Greater Comilla Region of Bangladesh
55
quality assessment of river Hindon at Ghaziabad, India: impact of industrial and urban wastewater’’. Environ. Monit. Assess. Vol.
165(1-4), 2009, pp. 103-12.
[14] S. K. Banerji, ‘‘Environmental Chemistry, Prentice-Hall of IndiaPrivate Limited, New Delhi-11001, 1997, p. 90.
[15] C. A. Biney, ‘‘Preliminary survey of the state of pollution of the
coastal environment of Ghana’’. Oceanologica Acta, Vol.4(Supp), 1982, pp. 39-43.
[16] EPA (United States Environmental Protection Agency), ‘‘National
Recommended Water Quality Criteria: 2002’’. Office of Water,Office of Science and Technology, 2002.
[17] J. Fianko, S. Osae, D. Adomako, D. Adotey, Y. Serfor-Armah,
‘‘Assessment of heavy metal pollution of the Iture estuary in thecentral region of Ghana’’. Environmental Monitoring and
Assessment, Vol. 131(1-3), 2007, pp. 467-473.
[18] E. K. Quagraine, C. K. Adokoh, ‘‘Assessment of dry seasonsurface, ground, and treated water quality in the Cape Coast
municipality of Ghana’’. Environ. Monit. Assess. Vol. 160(1-4),
2009, pp. 521-39.
19. E. Kmiecik, J. Szczepańska, I. Twardowską and S. Sebastian,
‘‘Assessing Chemical Status of Shared Groundwater Resources:
A Crucial Political, Regulatory and Management Issue’’.Overexploitation and Contamination of Shared Groundwater
Resources, 2008, p. 325.
[20] J. G. Arnold, R. S. Muttiah, R. Srinivasan, P. M. Allen, ‘‘Regionalestimation of base flow and groundwater recharge in the Upper
Mississippi river basin’’. Journal of Hydrology, Vol. 227(1-4),
2000, pp. 21-40.
[21] C. K. Jain, ‘‘A hydro-chemical study of a mountainous watershed:
the Ganga, India’’. Water Research, Vol. 36(5), 2002, pp. 1262-1274.
[22] WHO, ‘‘Task Group on Environmental Health Criteria for Arsenic:Arsenic. Environmental Health Criteria 18’’. World Health
Organization, Geneva, 1981.
[23] M. B. Arain, T. G. Kazi, J. A. Baig, M. K. Jamali, H. I. Afridi, A.Q. Shah, N. Jalbani, R. A. Sarfraz, ‘‘Determination of arsenic
levels in lake water, sediment, and foodstuff from selected area of
Sindh, Pakistan: Estimation of daily dietary intake’’. Food andChemical Toxicology, Vol. 47, 2009, pp. 242-248.
[24] H. M. Anawar, J. Akai, K. Komaki, H. Terao, T. Yoshioka, T.Ishizuka, S. Safiullah, K. Kato, ‘‘Geochemical occurrence of arsenic in groundwater of Bangladesh: sources and mobilization
processes’’. Journal of Geochemical Exploration, Vol. 77, 2003,
pp. 109-131.
[25] M. A. Halim, R. K. Majumder, S. A. Nessa, K. Oda, Y. Hiroshiro,
B. B. Saha, S. M. Hassain, S. A. Latif, M. A. Islam, K. Jinno,‘‘Groundwater contamination with arsenic in Sherajdikhan,
Bangladesh: geochemical and hydrological implications’’.
Environ Geol. Vol. 58(1), 2008, pp. 73-84.
[27] S. M. F. Ahsan, M. N. Islam, M. J. Uddin, M. T. Uddin, Statisticalmodeling of the groundwater arsenic contamination level in
Bangladesh due to chemical elements’’. Journal of Applied
Quantitative Methods, Vol. 3(3), 2008 pp. 254-263.
[28] R. Bhattacharyya, D. Chatterjee, B. Nath, J. Jana, G. Jacks, M.Vahter, High arsenic groundwater: Mobilization, metabolism and
mitigation – an overview in the Bengal Delta Plain’’, Molecular
and Cellular Biochemistry, Vol. 253, 2003, pp. 347-355.
[29] A. Kouras, I. Katsoyiannis, D. Voutsa, ‘‘Distribution of arsenic in
groundwater in the area of Chalkidiki, Northern Greece’’. Journalof Hazardous Materials, Vol. 147, 2007, pp. 890-899.