physicochemical changes in a model protein bar during storage · 1 of 37 physicochemical changes in...
TRANSCRIPT

1 of 37
Physicochemical Changes in a Model Protein Bar during Storage
SIMON M. LOVEDAY, JASON P. HINDMARSH, LAWRENCE K. CREAMER, AND HARJINDER SINGH*
Riddet Institute, Massey University, Private Bag 11 222, Palmerston North, New Zealand
* Corresponding author
(tel: +64 6 350 4401; fax: +64 6 350 5655; e-mail: [email protected]).

2 of 37
Abstract
High-protein snack bars (protein bars) contain high-quality protein, sugars and other low
molecular weight polyhydroxy compounds (PHCs), high-energy confectionary fats, and a
minimum of water (water activity ≤ 0.65). The consequence of the intimate mixing of these
components in protein bars is that they can react together, creating sensory characteristics that
are unacceptable to consumers.. This study examined the changes occurring in a model protein
bar during storage for 50 days at 20 °C.
Over this time, fracture stress increased from 20.1 ± 1.8 Pa to 201 ± 75 Pa at a rate that
decreased slightly over time. 1H nuclear magnetic resonance (NMR) showed that the molecular
mobility of PHCs decreased dramatically over the first 5 days as the batter set into a solid bar.
Over the first 17 hours after manufacturing, protein particles became more clustered, and soluble
protein appeared to precipitate, as shown by confocal microscopy. Reactive lysine fell 38% in
the first 10 days of storage and was approximately constant thereafter. Sodium dodecyl sulfate
polyacrylamide gel electrophoresis (SDS-PAGE) showed little change in protein molecular
weights. Following the initial ‘setting’ phase of 5-10 days, fracture stress continued to increase
and the molecular mobility of PHCs decreased. Changes in PHC molecular mobility were
consistent with glucose crystallisation. Chemical changes were minimal during this phase, which
suggests that chemical reactions play little part in the hardening of protein bars and that changes
in molecular mobility and changes in microstructure driven by moisture migration may be more
important.
KEYWORDS: High-protein snack bar; milk protein concentrate (MPC); shelf life;
intermediate-moisture foods; Maillard reactions; nuclear magnetic resonance (NMR)

3 of 37
INTRODUCTION
Many processed foods are multicomponent heterogeneous systems that are far from
thermodynamic equilibrium (Mezzenga, 2007). There is often a considerable time lag between
manufacture and consumption, during which a product is transported and stored. During this
storage time, multiple chemical, physical, and biological reactions occur serially and
simultaneously. Some of these reactions lead to the development of desirable attributes, such as
good flavors in aged wines and cheeses, but others create flavors, colors, or textures that impact
negatively on quality, as perceived by consumers. The shelf life can be defined as the length of
time for which a product can be stored before the appearance of the first characteristic that
consumers find unappealing, e.g., texture that is too tough.
Intermediate-moisture foods generally have water activity (aw) in the range 0.9–0.6 (Roos, 2001,
p. 5). This is low enough to inhibit the growth of most micro-organisms, though some organisms
will exhibit limited growth at the upper end of this range (Jay, 1996, p. 45). The factor that limits
shelf life is more often chemical or physical reactions. The most important class of chemical
reactions for intermediate-moisture foods is Maillard reactions (also known as nonenzymatic
browning), in which exposed amino groups on proteins react with reducing sugars. Maillard
reactions occur fastest at aw in the range 0.65–0.75 and at high temperature (Lea & Hannan,
1949). Physical reactions include changes of state, such as melting or crystallisation, and
transitions related to molecular mobility such as the glass transition.
High-protein snack bars (hereafter called ‘protein bars’) are a convenient and nutritious food
format that was originally developed for athletes but is now formulated to appeal to a wide range
of health-conscious consumers. These bars contain 15–35% protein, which consists almost
exclusively of dairy or soy proteins because of their health benefits and cost effectiveness.
Chocolate, sugars, and flavorings create an appealing taste and flavor. Nuts, wafers, nuggets, etc.

4 of 37
may be added for novel texture. Vitamins, minerals, and/or fiber are often added for enhanced
nutritional value.
Products of this type are generally formulated to have aw less than 0.65, and some have aw as low
as 0.3 (Doherty & Ward, 1997). The aw can be depressed by removing water from the
formulation and/or by adding low-molecular-weight solutes. The moisture content of protein
bars is typically 10–15% w/w, and the humectants most commonly used are sorbitol, glucose,
fructose, maltodextrin, glycerol, and high-fructose corn syrup.
The shelf life of protein bars is often limited by the development of a ‘hard’ or ‘tough’ texture
that consumers find unpalatable. The mechanism leading to the hardening of protein bars has not
been conclusively identified, although a number of hypotheses have been proposed. Zhou and
Labuza (2008) suggested that hardening resulted from thiol–disulfide interchange reactions
during storage. This was thought to lead to protein cross-linking, aggregation, and network
formation, which resulted in a hard texture. Others have reported evidence that bar hardening
during storage is favored by more ordered protein secondary structure and lower surface
hydrophobicity of protein particles (Baier et al., 2007). This group cited moisture migration as a
driving force for the hardening of protein bars, but did not specify the source and destination of
migration.
It is also possible that Maillard reactions between reducing sugars and reactive lysine residues
play a part in the hardening of protein bars. Cross-linking of proteins via Maillard reactions
during food processing is widely acknowledged, but the specific reaction pathways are not well-
known because of the multiplicity of possible reactions (Gerrard, 2002). Maillard reactions are
favored by high temperature and alkaline pH (Lea & Hannan, 1949), and when an excess of
reducing sugar is present (van Boekel, 2001). Rich and Foegeding (2000) reported that Maillard
reactions in whey protein isolate gels were associated with strengthening of the gel. However, in
5 of 37
the work of Baier et al. (2007), when browning was inhibited with sulfites, the rate at which
protein bars hardened was unaffected.
Li, Szlachetka, Chen, Lin, & Ruan (2008) suggested that the NMR relaxation behavior of protein
powders as a function of temperature was an indication of their performance in protein bars.
Higher values of T2 were thought to indicate higher susceptibility to physicochemical changes
over time, i.e. protein bar hardening.
In this study, we examined the contributions of various chemical and physical reactions to the
hardening of a model protein bar stored for up to 50 days at 20 °C.
MATERIALS AND METHODS
Chemicals. Disodium tetraborate, tris, and sodium dodecyl sulfate (SDS) were obtained from
BDH Chemical Ltd. (Poole, England) (AnalaR or molecular biology grade). Dithiothreitol
(DTT), glycerol, glycine, and tetramethylethylenediamine (electrophoresis or spectrophotometric
grade) were obtained from Sigma Chemical Co. (St. Louis, MO). Ammonium persulfate and
acrylamide/bis (37.5:1) were obtained from BioRad (Hercules, CA) and were electrophoresis
grade.
Milk protein concentrate (MPC, ALAPRO™ 4850) (typical analysis 81.3% protein, 5.7%
moisture, 3–5% lactose, 1.6% fat) was supplied by Fonterra Co-operative Limited, Auckland,
New Zealand. Cocoa butter (ADM DeZaan pure prime pressed) and glucose were supplied by
Hawkins Watts Ltd, Auckland, New Zealand. The water used to make protein bar material was
supplied from an underground bore. All analyses used water filtered by reverse osmosis.

6 of 37
Product Manufacture. Bar material was made in 1 kg batches according to the formulation
shown in Table 1. The ingredients were mixed with a Kenwood mixer (Kenwood Corporation,
Long Beach, CA) fitted with a flat K-bar type blade.
Water and glucose at room temperature (~20 °C) were mixed and heated in a stainless steel
container to 105 °C, then cocoa butter was added and the container was placed in a water bath at
room temperature. While the sugar–water–cocoa butter syrup was cooling, MPC was weighed
into the mixer bowl, followed by glycerol. The glycerol was mixed into the MPC with a spatula
for approximately 30 s. When the syrup had cooled to 40 °C, at which temperature it was a
slightly viscous liquid, it was added to the MPC and glycerol in the mixer bowl and mixed at 80
rpm.
These ingredients were mixed for 1 min and then rested for 1 min, during which the bowl was
scraped with a spatula to remove powder caked against the surface. After resting for 1 min, the
protein bar material was mixed for another 1 min.
Immediately after the second period of mixing, the viscous protein bar material was poured into
100 mL plastic containers (Lily brand, Huhtamaki NZ Ltd., Auckland New Zealand) or
vertically oriented cylindrical plastic tubes with internal diameter 16 mm and length 80 mm,
sealed at one end with tape. Care was taken not to entrap large air bubbles inside the tubes.
The lids were placed on the 100 mL containers and the tubes were sealed at the other end with
tape. The samples were transferred to an incubator at 20 °C shortly after manufacture. The
plastic tubes were vertically oriented throughout storage. The day following manufacture was
designated ‘day 1’ of the storage trial.
Texture Analysis. A lubricated uniaxial compression test was adapted from methods described
previously (Watkinson et al., 1997; Watkinson et al., 2001; Watkinson & Jackson, 1999). Each
solidified cylindrical core of protein bar material was pushed out of its plastic tube with a
7 of 37
wooden rod, forming a plug approximately 70 mm long. The plug was sliced perpendicular to
the long axis using a lubricated wire, giving three or four 20 mm long cylindrical sections.
Each section was placed upright (cylinder axis vertically oriented) on a smooth Teflon plate
lubricated with mineral oil and then compressed vertically with a parallel lubricated Teflon plate.
The samples were compressed with a TA.HD texture analyzer, equipped with a 500 N load cell
(Stable Micro Systems, Godalming, UK) and driven by Texture Expert Exceed software (version
2.64, Stable Micro Systems), to 80% Cauchy strain at a crosshead speed of 0.83 mm/s. Each of
the three or four cylindrical sections cut from a single sample plug was compressed in the same
way.
Force–distance–time data were analyzed using proprietary software (Masterworks Software,
Tawa, New Zealand) written in a functional programming language called J (version 4.06d,
Jsoftware Inc., Shorewood, MN) (Iverson, 1991). The software algorithm converted the raw data
into stress and Hencky strain according to the method of Watkinson et al. (1997), and the
fracture stress was approximated by the local maximum in stress (Van Vliet, Lucisano, &
Casiraghi, 1991). The modulus of deformability was measured from the maximum slope found at
low strain (Watkinson & Jackson, 1999), and the fracture area was the area under the stress–
strain curve (i.e., work) up to the point of maximum stress (Watkinson et al., 2001).
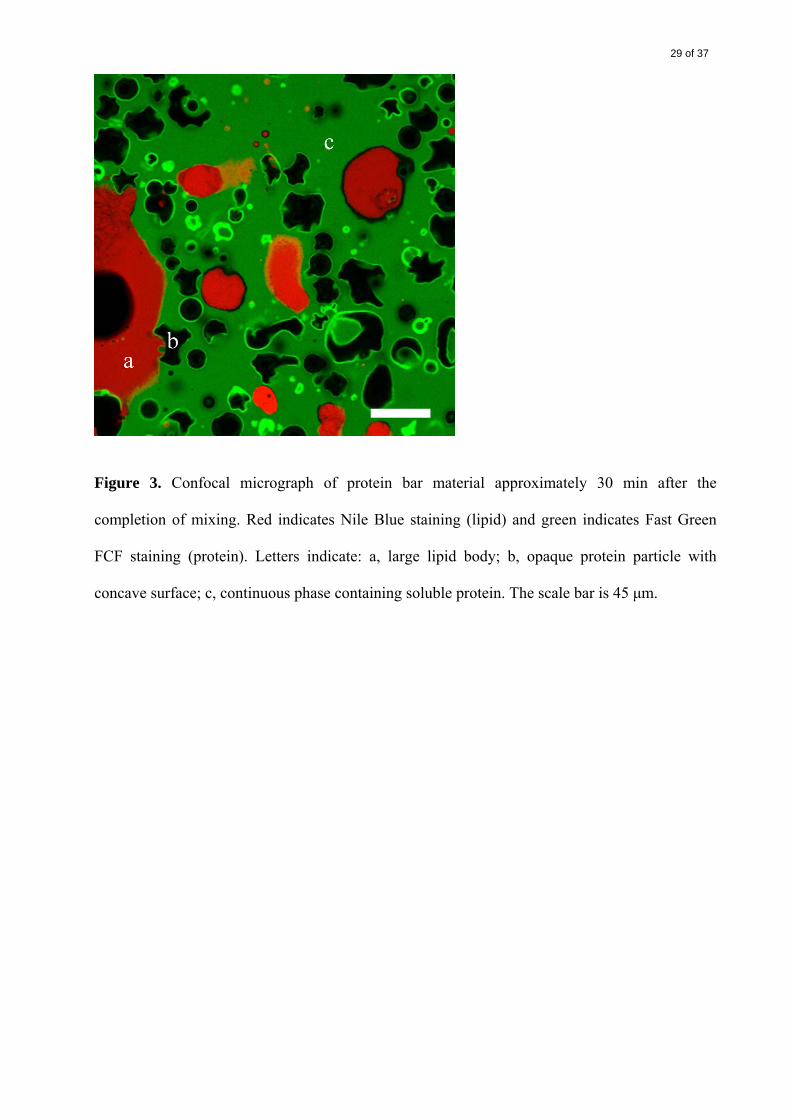
Confocal Laser Scanning Microscopy. During manufacture of the protein bars, a subsample
was withdrawn after the final mixing and a few drops of dye were added. The dye was a mixture
of Nile Blue and Fast Green FCF dissolved at 0.2% w/v in a commercial antifading mountant
medium, Citifluor (Citifluor Ltd, Leicester, UK). The dye was mixed into the protein bar
material with a knife until even coloring was achieved, as judged by eye, and then a drop of the
mixture was placed on a glass cavity slide and a coverslip was applied. The slides were stored at
20 °C.

8 of 37
The slides were examined with a Leica model TCS SP5 DM6000B confocal laser scanning
microscope (Leica Microsystems, Wetzlar, Germany), initially approximately 30 min after the
completion of mixing and then again the next day, approximately 17 h later.
The images were processed with Adobe Photoshop CS version 8.0 (Adobe Systems
Incorporated, San Jose, CA) and ImageJ 1.38x (National Institutes of Health, USA;
http://rsb.info.nih.gov/ij/).
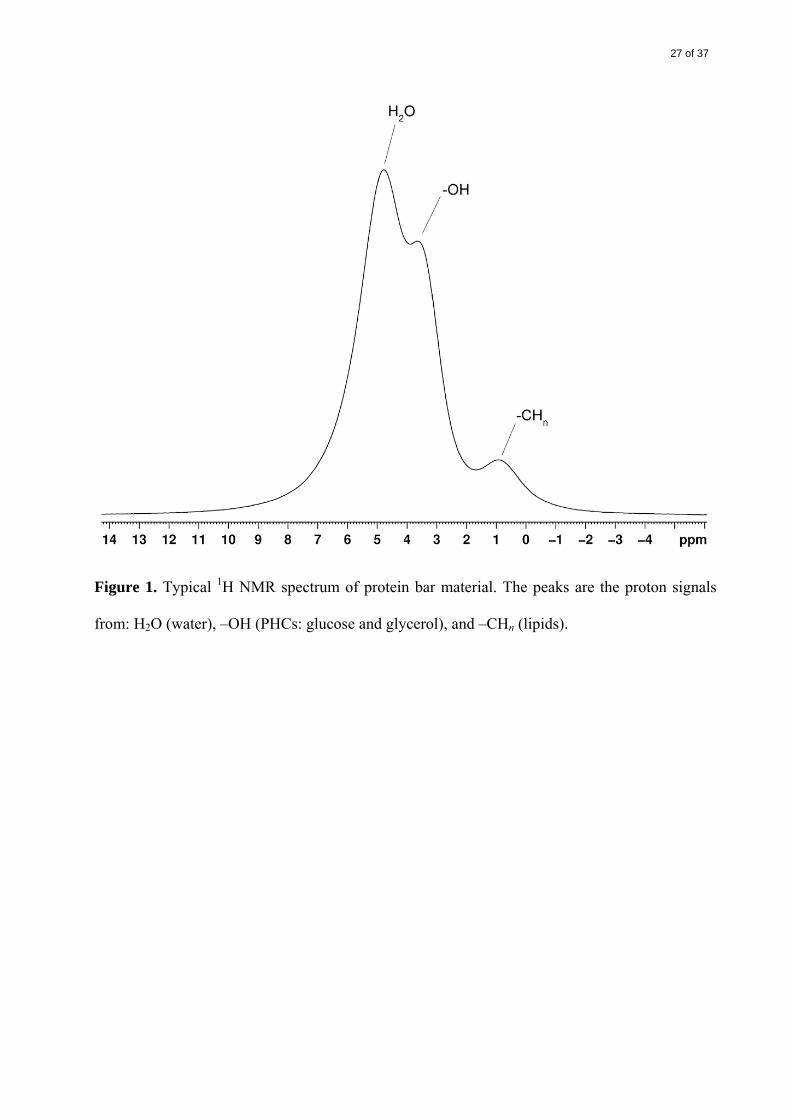
Nuclear Magnetic Resonance (NMR). All NMR experiments were undertaken in a Bruker
(Rheinstetten, Germany) AMX 200 MHz horizontal wide-bore magnet. The proton transverse (or
spin–spin) relaxation was measured using the Carr Purcell Meiboom Gill (CPMG) spin-echo
pulse sequence (Callaghan, 1991). The major components of the bar material – water, lipid, and
polyhydroxy compounds (PHCs) – could be analyzed separately via their representative peaks in
the proton NMR spectrum, as shown in Figure 1. The major PHCs, glucose and glycerol, could
not be separated, as both appear at the –OH position in the proton spectrum.
The transverse relaxation signal (S) versus the CPMG time of each component was well-fitted in
all cases by a bi-exponential model (Schuck et al., 2002):
⎟⎟⎠
⎞⎜⎜⎝
⎛+⎟
⎟⎠
⎞⎜⎜⎝
⎛=
SLOWFAST TtB
TtAS
,2,2
expexp (1)
T2,FAST and T2,SLOW are the transverse relaxation rate constants of fast- and slow-relaxing protons
of each compound, respectively. The values A and B are the proportions of each component. The
T2 of a compound is related to its molecular mobility and molecular interactions (Lin et al.,
2006). As the molecular mobility decreases and/or the level of molecular interactions increases,
T2 will decrease. The presence of two relaxation rates corresponds to two coexisting states of a
compound that differ in molecular mobility and/or levels of interaction. In semisolids, this

9 of 37
usually indicates compounds having both liquid-like amorphous and crystalline or glassy
domains.
The standard Bruker phase-sensitive nuclear Overhauser effect (NOE) pulse sequence
(NOESYPH) was used to acquire a two-dimensional nuclear Overhauser effect spectroscopy (2D
NOESY) data set with a mixing time (τm) of 200 ms. In 2D NOESY, the NOEs appear as cross-
peaks, indicating transfer of spin polarization from one spin population to another (cross-
relaxation). NOEs can occur between adjacent nuclei within a molecule and/or between nuclei in
different molecules. An NOE occurs when two nuclei are close in space (within 5 Å) (Otting &
Liepinsh, 1995). The intensity of the NOE peak is proportional to the distance between the
nuclei, and is inversely proportional to the spin exchange rate.
Protein Extraction and SDS Polyacrylamide Gel Electrophoresis (SDS-PAGE). After
storage for 1–50 days at 20 °C, it was necessary to prevent further chemical reactions so that the
state of the sample was preserved. A procedure described earlier (Loveday & Winger, 2007) was
adapted. A 100 mL plastic container was removed from storage and approximately 30 g of
protein bar material was gradually added to liquid nitrogen in an aluminum dish. The remaining
protein bar material was discarded. When boiling had subsided, the frozen protein bar material
and the remaining liquid nitrogen were transferred to a pre-cooled laboratory Waring blender and
blended at high speed until the sample had been shattered into a fine powder (30 s to 1 min). The
powdered samples were stored in plastic bags at –80 °C until they were lyophilized several days
later. The lyophilized samples were stored in plastic bags at –20 °C.
The protein extraction method was adapted from Poms et al. (2004). The extraction buffer was
50 mM borate at pH 9.0, and 0.1% w/v DTT was added for samples that were extracted for
reduced SDS-PAGE or the reactive lysine assay.
10 of 37
Frozen lyophilized protein bar was added to extraction buffer at room temperature (~20 °C) at a
ratio of 0.4 g of sample to 8 mL of buffer. The slurry was homogenized at high speed for 30 s
(Diax 600, Heidolph, Schwabach, Germany), transferred to a 70 mL polystyrene pot (LabServ,
Biolab, Auckland, New Zealand), and stirred at low speed overnight in a temperature-controlled
room at 4 °C. After overnight stirring, a 5 mL aliquot of slurry was removed with a syringe
(Terumo Corporation, Tokyo, Japan) and passed through a 0.8 μm syringe-driven filter (Minisart
26 mm diameter, Sartorius AG, Goettingen, Germany). The samples were filtered at room
temperature (~20 °C) and the filtrate was stored at –20 °C.
Prior to SDS-PAGE, the filtrates were thawed and mixed with SDS sample buffer (1 volume of
sample to 2 volumes of reducing buffer or 4 volumes of nonreducing buffer), which consisted of
62.5 mM tris-HCl pH 6.8, 10% glycerol, 2% SDS, and 0.01% bromophenol blue. For reduced
SDS-PAGE, 0.1% DTT was included in the sample buffer.
The preparation and running of the SDS-PAGE gels followed the method of Anema and
Klostermeyer (1997), except that the percentage of acrylamide in the gels was increased to 16%.
Destaining and scanning of the gels were carried out as described by Considine et al. (2007).
Reactive Lysine Assay. The procedure used was adapted from Goodno et al. (1981). Each 100
mL of reagent was made up by dissolving 80 mg of orthophthaldialdehyde (OPA) in 2 mL of
ethanol, adding this to 50 mL of 0.1 M borate buffer (pH 9.0), and then adding 10 mL of 10%
w/v SDS solution, 100 mg of DTT, and sufficient water to bring the volume to 100 mL.
The protein bar extracts prepared for SDS-PAGE were also assayed for reactive lysine content.
In a 1.5 mL acrylic cuvette (path length 10 mm), 50 μL of extract was added to 950 μL of
reactive lysine reagent. The cuvette was covered with Parafilm (Alcan, Montreal, Quebec,
Canada) and inverted several times. After incubation at 20 °C for 5 min, the absorbance at 335

11 of 37
nm was measured with a UV/visible spectrophotometer (PU8600, Philips, Amsterdam, The
Netherlands).
The OPA reagent was used as a blank, and its absorbance was set to zero prior to assaying the
protein bar extracts. In some cases, it was necessary to dilute the protein bar extracts with water
before taking 50 μL for the assay so that the absorbances would be within the range that could be
measured accurately. The absorbances were normalized against the average absorbance on day 1
and were expressed as percentages. The OPA assay was carried out three times on each protein
bar extract.
RESULTS AND DISCUSSION
Texture Change. The texture of the protein bars changed substantially during storage; the
fracture stress increased from 20.5 ± 1.8 Pa (n = 4) on day 1 to 201 ± 7.5 Pa (n = 3) on day 50
(Figure 2). Because fracture area and modulus of deformability were strongly and significantly
correlated with fracture stress, only the fracture stress results are shown.
Baier et al. (2007) found a very similar pattern of hardening in protein bars stored at 37 °C and
aw of 0.11 or 0.42 for 28 days. Protein bars stored at aw of 0.80 hardened for approximately 4
days and softened thereafter (Baier et al., 2007).
Microstructure Changes. Confocal micrographs of protein bar material taken approximately 30
min after mixing (Figure 3) showed rounded lipid bodies up to several hundred microns wide
(labeled ‘a’ in Figure 3) and opaque proteinaceous particles 5–60 μm in diameter (‘b’),
surrounded by a continuous phase containing soluble protein (‘c’). Some lipid bodies contained
spherical vacuole-like unstained regions 50–130 μm in diameter (‘d’ in Figure 4) with some
protein at the interface (‘e’). These regions probably contain a mixture of water, glucose, and
glycerol. The protein particles ranged in size from 5 to 60 μm (Figure 5). Some particles had
convoluted concave surfaces, whereas others had smooth spherical surfaces. Other dried dairy

12 of 37
powders show very similar particle morphologies (McKenna, Lloyd, Munro, & Singh, 1999;
Nijdam & Langrish, 2006), so it is likely that the opaque proteinaceous particles were
undissolved powder particles.
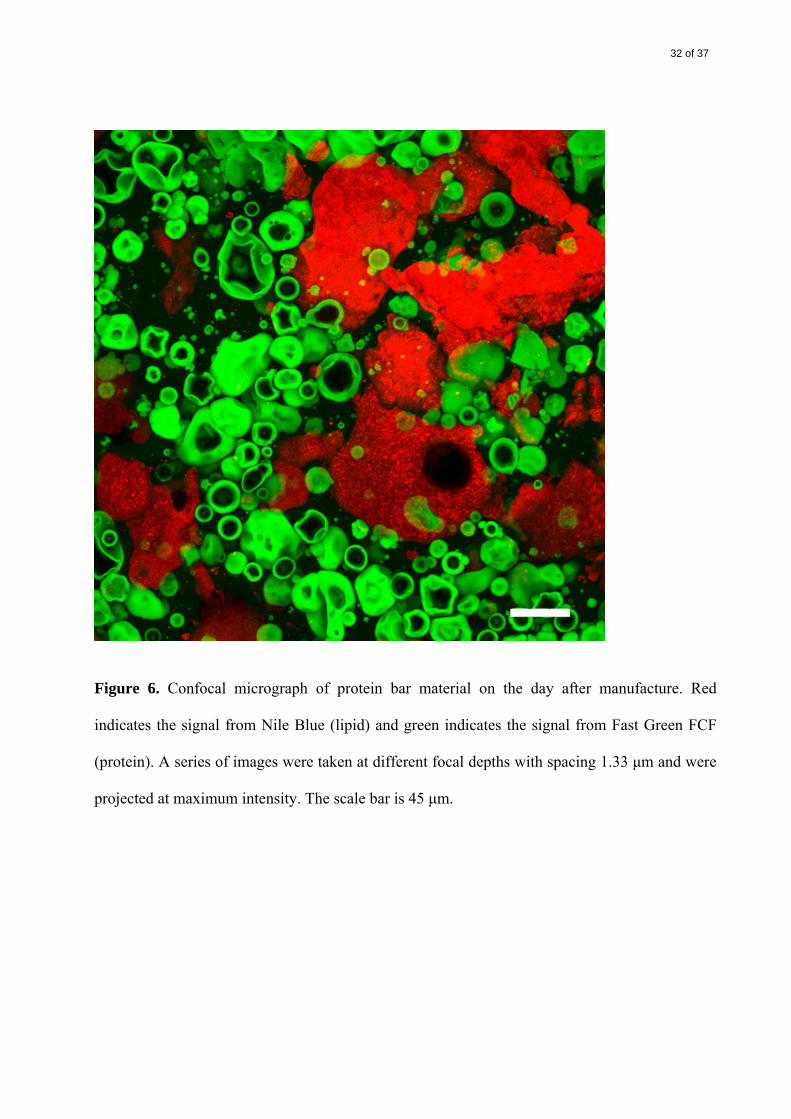
Three segregated phases were evident after approximately 17 h at 20 °C
(
Figure 6). Lipid formed large elongated or bulbous structures with wrinkled surfaces, in some
cases containing spherical unstained ‘vacuoles’. The protein particles were unchanged in size
and appearance, but were arranged in a more compact network-like phase. The continuous
background of Fast Green staining (soluble protein) that was seen immediately after manufacture
was replaced with unstained areas, which probably consisted of water and PHCs.
MPC contains a mixture of whey proteins and casein micelles in a weight ratio of approximately
20:80. It is likely that the dissolved protein seen shortly after manufacture consisted mainly of

13 of 37
whey proteins, which are generally much more soluble than caseins. During the first day after
manufacture, the protein bar material hardened from a batter-like pourable material into a soft
but cohesive solid. Over this time, two changes were observed in confocal micrographs: the
‘clustering’ of protein particles and the disappearance of soluble protein.
The bar mixture contained 15% w/w water, an amount insufficient to fully hydrate glucose (40%
w/w), glycerol (15% w/w) and protein (20% w/w). In earlier work, bars made to the same
formulation had water activity of 0.65. Under such conditions of limited water availability, there
would be a competition between proteins and PHCs for hydration water.
Immediately after manufacture, the majority of the protein would exist as powder particles, but
the surfaces of these particles are likely to be hydrated. During storage, the strong driving force
for water to associate with the hydroxyl groups of low molecular weight PHCs (as they produce
higher osmotic pressures) is likely to cause moisture migration away from particle surfaces,
resulting in further association between the particles or some kind of phase separation. This is
consistent with indications of phase separation observed by Chen, Zhang, and Cao (2005) in
mixtures of soy protein isolate, glycerol and water. Those workers postulated the existence of
glycerol-rich, protein-rich and protein-water microphases (Chen et al., 2005).
Some of the protein appears to dissolve during mixing, then precipitates during the following
hours as it loses the competition for water of hydration, depositing at the surface of undissolved
protein particles. PHCs may not be fully dissolved at first, but after some time they draw water
away from dissolved protein.
Molecular Mobility and Spin Interactions. The NMR results indicate that lipids did not
contribute to the hardening of the protein bars during storage. The NOESY measurements
showed only weak protein–lipid, carbohydrate–lipid, and water–lipid interactions. The relaxation
rate (T2) measurements showed no significant changes in the molecular mobility of the lipids
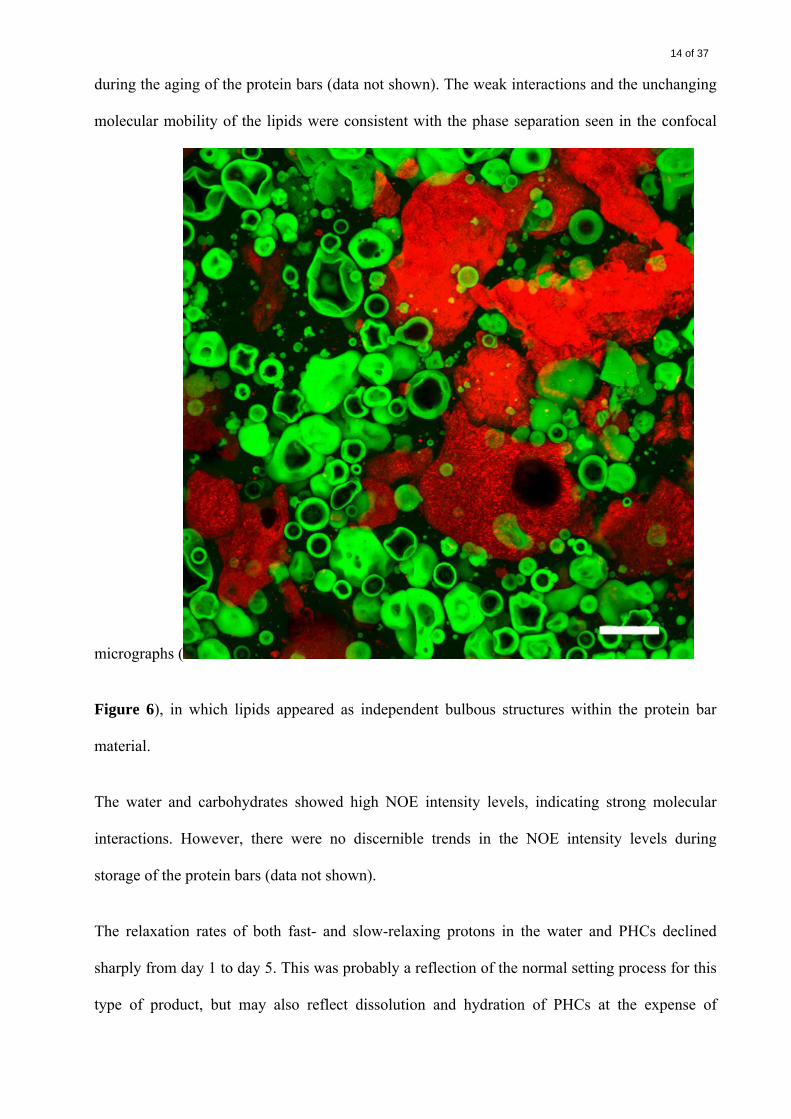
14 of 37
during the aging of the protein bars (data not shown). The weak interactions and the unchanging
molecular mobility of the lipids were consistent with the phase separation seen in the confocal
micrographs (
Figure 6), in which lipids appeared as independent bulbous structures within the protein bar
material.
The water and carbohydrates showed high NOE intensity levels, indicating strong molecular
interactions. However, there were no discernible trends in the NOE intensity levels during
storage of the protein bars (data not shown).
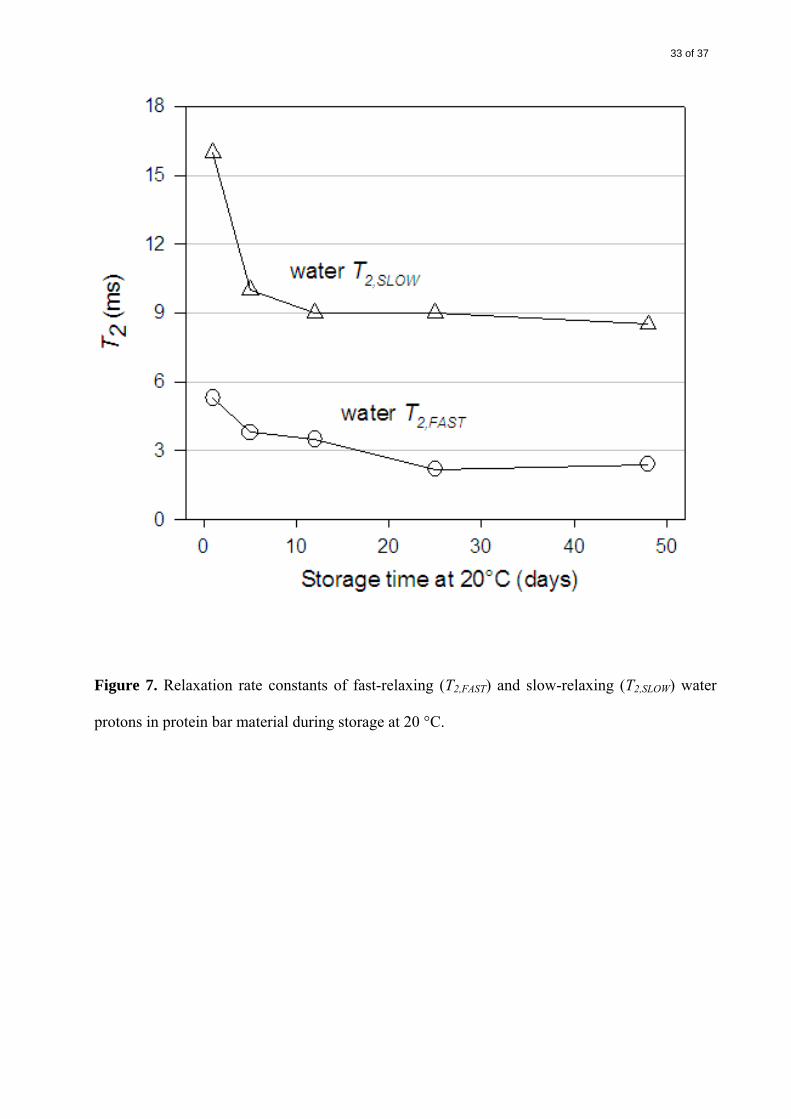
The relaxation rates of both fast- and slow-relaxing protons in the water and PHCs declined
sharply from day 1 to day 5. This was probably a reflection of the normal setting process for this
type of product, but may also reflect dissolution and hydration of PHCs at the expense of

15 of 37
dissolved protein, as noted above. In addition to the change over the first five days, there was a
continued reduction in the mobility from day 5 to day 48 (Figures 7, 8), concomitant with the
large increases in fracture stress (Figure 2). This shows that, after the initial setting, there was
continued change over the longer term.
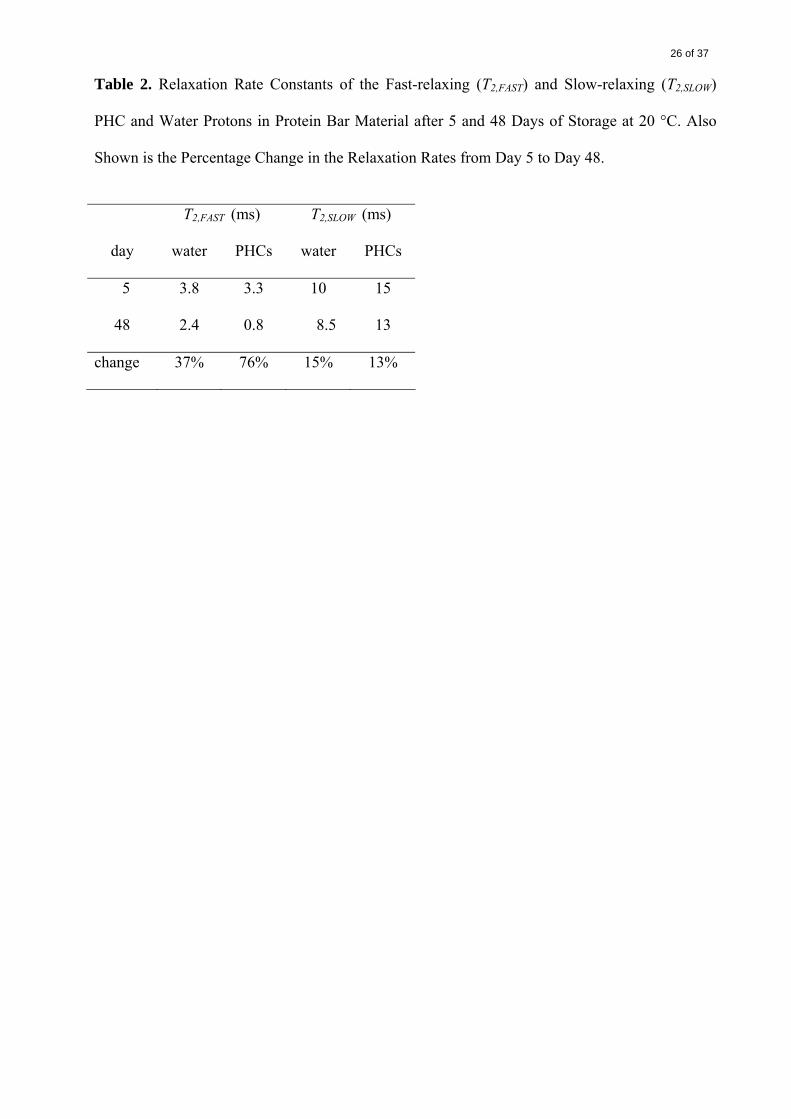
It was noted that, between days 5 and 48, the relaxation rate T2,FAST decreased by the largest
proportion for both water and PHCs (37% and 76%, respectively), whereas the corresponding
decreases in T2,SLOW were small for both water and PHCs (15% and 13%) (Table 2). The
decreases in T2,FAST indicated that PHC and water domains of lower mobility became even less
mobile, i.e., the solid-like regions became more solid-like. A possible cause for this hardening
was a progressive crystallization of glucose in viscous, supersaturated PHC/water domains.
Migration of either water or PHCs between the two fractions of different mobility did not seem
to occur, judging by the unchanging proportions of each (A and B) (data not shown).
Protein Modifications. During the first 12 days of storage at 20 °C, reactive lysine fell 38% and
plateaued thereafter (Figure 9). Confocal micrographs showed large undissolved protein
particles, but proteins at the surface of particles would still be capable of undergoing chemical
reactions with the surrounding medium.
Warmbier et al. (1976b) found a similar pattern of reactive lysine loss in a model intermediate-
moisture food stored at 45 °C. In that study, the loss of reactive lysine was rapid during the first
7 days of storage and then slow or negligible during the subsequent 8 days (Warmbier et al.,
1976b).
The active ingredient in the reactive lysine assay reagent, OPA, will react with both α-amino
groups and ε-amino groups, so part of the assay response is due to N-terminal α-amino groups
(Goodno et al., 1981). The contribution from α-amino groups is not negligible in mixtures of
small peptides or where the lysine content is very low (Goodno et al., 1981), but neither of these

16 of 37
conditions applies to the mixture of milk proteins found in MPC (Farrell Jr. et al., 2004;
Swaisgood, 1996).
It is likely that lysine residues reacted with added glucose or lactose in the MPC during storage,
but this was not confirmed with other methods such as mass spectrometry. MPC contains 4.6%
w/w lactose, (0.92% w/w in bar material), so lactose reactions are relatively minor. Other
protein–protein and protein–sugar reactions were also possible (Gerrard, 2002), and may have
occurred to some extent.
Residual unreacted lysine residues may have been located within the interior of proteins or in
sterically inhibited positions, and were therefore unavailable to react with glucose or lactose
molecules. Such a scenario would be consistent with the findings of Scaloni et al. (2002). In that
work, the lactosylation sites on αs1-casein from heated milks were identified by mass
spectrometric analysis of enzyme-hydrolyzed casein. Lactosylation was site-specific, with
lactosyl-lysine produced at only seven of the 14 lysine residues (Scaloni et al., 2002). Analogous
results were reported for β-casein (Scaloni et al., 2002), α-lactalbumin, and β-lactoglobulin
(Meltretter, Seeber, Humeny, Becker, & Pischetsrieder, 2007).
The samples had not changed color perceptibly after 50 days at 20 °C, in spite of the large
decrease in reactive lysine (Figure 9). Warmbier et al. (1976a) reported an initial induction
period without color formation before a model intermediate-moisture food began to brown. The
duration of the induction period depended on temperature and aw, and very little pigment formed
when the product was stored for 53 days at 25 °C, similar to our findings after 50 days at 20 °C.
Warmbier et al. (1976a) suggested that colorless reaction intermediates accumulated at first, and
that pigment formation began only when the concentration of colorless intermediates was
sufficient. The early stages of Maillard reactions, in which little or no color change is observed,
were termed ‘initial stage’ and ‘intermediate stage’ by Hodge (1953).
17 of 37
Standard SDS-PAGE is a very powerful technique for separating a large number and type of
proteins, primarily by molecular weight. Comparison of the patterns of reduced and nonreduced
proteins can show the effect of reducing disulfide bonds. There is a possibility of Maillard-type
reactions in protein bars, e.g., reactions in which glucose units form bonds with protein amino
groups. However, such reactions will not greatly affect the molecular weight of the proteins
because sugars are much smaller than proteins.
In the nonreduced SDS-PAGE gel (Figure 10), there was some high-molecular-weight material
that either remained near the top of the resolving gel or did not enter the stacking gel at all but
remained in the sample well. These features were absent from the reduced gel (Figure 11),
indicating that they were disulfide-bonded aggregates.
In the control lanes, the κ-casein and β-lactoglobulin bands were darker in the reduced gel
(Figure 11) than in the nonreduced gel (Figure 10), suggesting that these proteins were partially
disulfide-bonded in MPC. In the reduced SDS-PAGE gels, the β-lactoglobulin band appeared to
be slightly less mobile in the protein bar samples than in the control (MPC powder in water). The
control lane was taken from a different gel, and the differences in β-lactoglobulin band position
may have simply reflected slight differences in gel preparation.
Overall, the effect of storage time at 20 °C on protein molecular weights was minor. In the
reduced SDS-PAGE gel (Figure 11), there was a suggestion of increased blurring above the
major casein band with increasing storage time, but no conclusive changes. In the nonreduced
gel (Figure 10), the κ-casein band became fainter with increasing storage time, and the other
casein bands became blurred upwards, especially after 26 and 48 days of storage. The blurring of
the αs- and β-casein bands and the disappearance of the κ-casein band suggest an increase in
molecular weight, which may have been due to the addition of one or more glucose or lactose
molecules to lysine residues. The α-lactalbumin band on the nonreduced gel became

18 of 37
progressively fainter and more diffuse with storage time, and α-lactalbumin may have also
undergone Maillard reactions.
The progressive upward blurring of bands with increasing storage time at 20 °C was similar to
the effect of increasing heating time/temperature on milk proteins heated with reducing sugars
(Ajandouz, Desseaux, Tazi, & Puigserver, 2008; Morris, Sims, Robertson, & Furneaux, 2004).
However, molecular weight changes in the proteins in the protein bars were relatively small.
The model protein bars made in this investigation hardened substantially during storage for 50
days at 20 °C. Hardening occurred more rapidly than in commercial bars, but the model
contained the main components of commercial protein bars in realistic ratios, and similar
physicochemical reactions are likely to have occurred.
Protein bar manufacture can include different mixing methods and a different order of ingredient
addition from that used here. Different rates and times of mixing or adding ingredients in a
different order may affect the spatial distribution and hydration state of proteins and PHCs. If so,
the driving forces for physicochemical reactions would be different. However, information on
the effect of manufacturing variables on the rate of physicochemical reactions in protein bars is
unavailable in the literature, therefore the magnitude of differences cannot be assessed.
The microstructure of the protein bars underwent a phase-separation within the first day,
concomitant with a transformation from a liquid batter to a soft but cohesive solid. The NMR
results showed a strong interaction between water and PHCs, and pointed to ongoing change in
their molecular mobilities throughout 50 days of storage. Particularly notable was the large
decrease in mobility of solid-like domains of water and PHCs, which may indicate that glucose
was crystallizing.
19 of 37
A large proportion of reactive lysine reacted within the first 12 days, but there was little change
in reactive lysine content thereafter. SDS-PAGE showed relatively minor changes in the
molecular weights of proteins over 50 days at 20 °C.
The two-phase nature of the available lysine reactions and the negligible changes to protein
molecular weights in SDS-PAGE were not consistent with the continuous increases in the
fracture stress, fracture area, and modulus of deformability values of the protein bars. It appeared
that the hardening of the protein bars was not associated with chemical modification of the
proteins. However, the physicochemical changes to low-mobility PHC/water domains were
concomitant with hardening, and may have been causally involved in the hardening of the
protein bars.
This study of a model food product showed that several chemical and physical reactions occurred
serially and simultaneously. It exemplified the diversity and complexity of aging reactions in
multicomponent food systems, and illustrated the range of length- and time-scales at which they
occur.
ABBREVIATIONS USED
aw, water activity; 2D NOESY, two-dimensional nuclear Overhauser effect spectroscopy;
CPMG; Carr Purcell Meiboom Gill; DTT, dithiothreitol; MPC, milk protein concentrate; NMR,
nuclear magnetic resonance; NOE, nuclear Overhauser effect; OPA, orthophthaldialdehyde;
PHC, polyhydroxy compound; SDS-PAGE, sodium dodecyl sulfate polyacrylamide gel
electrophoresis.
ACKNOWLEDGMENT
This work was carried out as part of FRST project DRIX0201. The financial support of
Fonterra Co-operative Ltd. and the New Zealand Foundation for Research, Science and

20 of 37
Technology is gratefully acknowledged. The authors thank Philip Watkinson, Sheelagh Hewitt,
and Steve Taylor for helpful discussions and critical comment on the manuscript. We thank
Namrata Taneja for technical assistance with bar preparation, rheology, SDS-PAGE, and the
reactive lysine assay.

21 of 37
LITERATURE CITED
Ajandouz, E. H., Desseaux, V., Tazi, S., & Puigserver, A. (2008). Effects of temperature and pH
on the kinetics of caramelisation, protein cross-linking and Maillard reactions in aqueous model
systems. Food Chemistry, 107(3), 1244-1252.
Anema, S. G., & Klostermeyer, H. (1997). Heat-induced, pH-dependent dissociation of casein
micelles on heating reconstituted skim milk at temperatures below 100°C. Journal of
Agricultural and Food Chemistry, 45(4), 1108-1115.
Baier, S. K., Guthrie, B. D., Elmore, D. L., Smith, S. A., Lendon, C. A., Muroski, A. R., et al.
(2007). Influence of extrusion on protein conformation and shelf-life extension of nutritional
bars. Paper presented at the International Symposium on the Properties of Water X, 2-7
September, Bangkok, Thailand.
Callaghan, P. T. (1991). Principles of Nuclear Magnetic Resonance Microscopy. Oxford, UK:
Clarendon Press.
Chen, P., Zhang, L., & Cao, F. F. (2005). Effects of moisture on glass transition and
microstructure of glycerol-plasticized soy protein. Macromolecular Bioscience, 5(9), 872-880.
Considine, T., Patel, H. A., Singh, H., & Creamer, L. K. (2007). Influence of binding conjugated
linoleic acid and myristic acid on the heat- and high-pressure-induced unfolding and aggregation
of beta-lactoglobulin B. Food Chemistry, 102(4), 1270-1280.
Doherty, C. A., & Ward, P. C. (1997). U.S. Patent No. 5,607,716.
Farrell Jr., H. M., Jimenez-Flores, R., Bleck, G. T., Brown, E. M., Butler, J. E., Creamer, L. K.,
et al. (2004). Nomenclature of the proteins of cows' milk−sixth revision. Journal of Dairy
Science, 87(6), 1641-1674.
Gerrard, J. A. (2002). Protein-protein crosslinking in food: methods, consequences, applications.
Trends in Food Science and Technology, 13(12), 391-399.

22 of 37
Goodno, C. C., Swaisgood, H. E., & Catignani, G. L. (1981). A fluorimetric assay for available
lysine in proteins. Analytical Biochemistry, 115(1), 203-211.
Hodge, J. E. (1953). Dehydrated foods, chemistry of browning reactions in model systems.
Journal of Agricultural and Food Chemistry, 1(15), 928-943.
Iverson, K. E. (1991). The ISI Dictionary of J, Version 3.3. Toronto, Quebec, Canada: Iverson
Software Inc.
Jay, J. M. (1996). Modern Food Microbiology. New York: Chapman & Hall.
Lea, C. H., & Hannan, R. S. (1949). Studies of the reaction between proteins and reducing sugars
in the "dry" state : I. The effect of activity of water, of pH and of temperature on the primary
reaction between casein and glucose. Biochimica et Biophysica Acta, 3, 313-325.
Li, Y., Szlachetka, K., Chen, P., Lin, X., & Ruan, R. (2008). Ingredient Characterization and
Hardening of High-Protein Food Bars: an NMR State Diagram Approach. Cereal Chemistry,
85(6), 780-786.
Lin, X., Ruan, R., Chen, P., Chung, M., Ye, X., Yang, T., et al. (2006). NMR state diagram
concept. Journal of Food Science, 71(9), R136-R145.
Loveday, S. M., & Winger, R. J. (2007). Mathematical model of sugar uptake in fermenting
yeasted dough. Journal of Agricultural and Food Chemistry, 55, 6325-6329.
McKenna, A. B., Lloyd, R. J., Munro, P. A., & Singh, H. (1999). Microstructure of whole milk
powder and of insolubles detected by powder functional testing. Scanning, 21(5), 305-315.
Meltretter, J., Seeber, S., Humeny, A., Becker, C. M., & Pischetsrieder, M. (2007). Site-specific
formation of Maillard, oxidation, and condensation products from whey proteins during reaction
with lactose. Journal of Agricultural and Food Chemistry, 55(15), 6096-6103.
Mezzenga, R. (2007). Equilibrium and non-equilibrium structures in complex food systems.
Food Hydrocolloids, 21(5-6), 674-682.

23 of 37
Morris, G. A., Sims, I. M., Robertson, A. J., & Furneaux, R. H. (2004). Investigation into the
physical and chemical properties of sodium caseinate-maltodextrin glyco-conjugates. Food
Hydrocolloids, 18(6), 1007-1014.
Nijdam, J. J., & Langrish, T. A. G. (2006). The effect of surface composition on the functional
properties of milk powders. Journal of Food Engineering, 77(4), 919-925.
Otting, G., & Liepinsh, E. (1995). Protein hydration viewed by high-resolution NMR
spectroscopy: implications for magnetic resonance image contrast. Accounts of Chemical
Research, 28(4), 171-177.
Poms, R. E., Capelletti, C., & Anklam, E. (2004). Effect of roasting history and buffer
composition on peanut protein extraction efficiency. Molecular Nutrition and Food Research,
48(6), 459-464.
Rich, L. M., & Foegeding, E. A. (2000). Effects of sugars on whey protein isolate gelation.
Journal of Agricultural and Food Chemistry, 48(10), 5046-5052.
Roos, Y. H. (2001). Water activity and plasticization. In N. A. M. Eskin & D. S. Robinson
(Eds.), Food shelf life stability: chemical, biochemical, and microbiological changes (pp. 5).
Boca Raton, FL: CRC Press.
Scaloni, A., Perillo, V., Franco, P., Fedele, E., Froio, R., Ferrara, L., et al. (2002).
Characterization of heat-induced lactosylation products in caseins by immunoenzymatic and
mass spectrometric methodologies. Biochimica et Biophysica Acta - Proteins and Proteomics,
1598(1-2), 30-39.
Schuck, P., Davenel, A., Mariette, F., Briard, V., Méjean, S., & Piot, M. (2002). Rehydration of
casein powders: effects of added mineral salts and salt addition methods on water transfer.
International Dairy Journal, 12(1), 51-57.
Swaisgood, H. E. (1996). Characteristics of milk. In O. R. Fennema (Ed.), Food Chemistry (3rd
ed., pp. 841-878). New York: Marcel Dekker.
24 of 37
van Boekel, M. A. J. S. (2001). Kinetic aspects of the Maillard reaction: a critical review.
Nahrung, 45(3), 150-159.
Van Vliet, T., Lucisano, M., & Casiraghi, E. (1991). Inventory of test methods. Bulletin of the
International Dairy Federation, 268, 16-25.
Warmbier, H. C., Schnickels, R. A., & Labuza, T. P. (1976a). Effect of glycerol on
nonenzymatic browning in a solid intermediate moisture model food system. Journal of Food
Science, 41(3), 528-531.
Warmbier, H. C., Schnickels, R. A., & Labuza, T. P. (1976b). Nonenzymatic browning kinetics
in an intermediate moisture model system - effect of glucose to lysine ratio. Journal of Food
Science, 41(5), 981-983.
Watkinson, P., Boston, G., Campanella, O., Coker, C., Johnston, K., Luckman, M., et al. (1997).
Rheological properties and maturation of New Zealand Cheddar cheese. Lait, 77(1), 109-120.
Watkinson, P., Coker, C., Crawford, R., Dodds, C., Johnston, K., McKenna, A., et al. (2001).
Effect of cheese pH and ripening time on model cheese textural properties and proteolysis.
International Dairy Journal, 11(4-7), 455-464.
Watkinson, P., & Jackson, L. F. (1999). New procedure for estimating the modulus of
deformability of cheese from uniaxial compression tests. Journal of Texture Studies, 30(5), 563-
580.
Zhou, P., Liu, X., & Labuza, T. P. (2008). Effects of Moisture-Induced Whey Protein
Aggregation on Protein Conformation, the State of Water Molecules, and the Microstructure and
Texture of High-Protein-Containing Matrix. Journal of Agricultural and Food Chemistry,
56(12), 4534-4540.

25 of 37
Table 1. Model Protein Bar Recipe.
ingredient % w/w
glucose 40
MPC 20
glycerol 15
water 15
cocoa butter 10
total 100
26 of 37
Table 2. Relaxation Rate Constants of the Fast-relaxing (T2,FAST) and Slow-relaxing (T2,SLOW)
PHC and Water Protons in Protein Bar Material after 5 and 48 Days of Storage at 20 °C. Also
Shown is the Percentage Change in the Relaxation Rates from Day 5 to Day 48.
T2,FAST (ms) T2,SLOW (ms)
day water PHCs water PHCs
5 3.8 3.3 10 15
48 2.4 0.8 8.5 13
change 37% 76% 15% 13%
27 of 37
Figure 1. Typical 1H NMR spectrum of protein bar material. The peaks are the proton signals
from: H2O (water), –OH (PHCs: glucose and glycerol), and –CHn (lipids).

28 of 37
Figure 2. Fracture stress of protein bar samples in a lubricated uniaxial compression test. Data
points are individual compression test results.
29 of 37
Figure 3. Confocal micrograph of protein bar material approximately 30 min after the
completion of mixing. Red indicates Nile Blue staining (lipid) and green indicates Fast Green
FCF staining (protein). Letters indicate: a, large lipid body; b, opaque protein particle with
concave surface; c, continuous phase containing soluble protein. The scale bar is 45 μm.

30 of 37
Figure 4. Confocal micrograph of protein bar material approximately 30 min after the
completion of mixing: left, Nile Blue signal (lipid); right, Fast Green FCF signal (protein) from
the same field of view. Letter ‘d’ indicates a spherical unstained area within a lipid body with
protein (letter ‘e’) at the interface. The scale bars are 45 μm.

31 of 37
Figure 5. Confocal micrographs of protein particles in protein bar material approximately 30
min after the completion of mixing. The Fast Green FCF (protein) signal was converted to
greyscale for clarity and the Nile Blue signal is not shown. A series of images were taken at
different focal depths with spacing 0.82 μm and each of the four frames shows different subsets
projected at maximum intensity. The scale bar is 10 μm.
32 of 37
Figure 6. Confocal micrograph of protein bar material on the day after manufacture. Red
indicates the signal from Nile Blue (lipid) and green indicates the signal from Fast Green FCF
(protein). A series of images were taken at different focal depths with spacing 1.33 μm and were
projected at maximum intensity. The scale bar is 45 μm.
33 of 37
Figure 7. Relaxation rate constants of fast-relaxing (T2,FAST) and slow-relaxing (T2,SLOW) water
protons in protein bar material during storage at 20 °C.

34 of 37
Figure 8. Relaxation rate constants of fast-relaxing (T2,FAST) and slow-relaxing (T2,SLOW) sugar
(glucose + glycerol) protons in protein bar material during storage at 20 °C.

35 of 37
Figure 9. Reactive lysine content of protein bar material as absorbance in the
orthophthalaldehyde (OPA) assay. The vertical bars are standard errors of triplicates.

36 of 37
Figure 10. Nonreduced SDS-PAGE of MPC (control lane 1) and extracts from protein bars
stored at 20 °C for 1, 12, 26, and 48 days.

37 of 37
Figure 11. Reduced SDS-PAGE of MPC (control lane 1) and extracts from protein bars stored at
20 °C for 1, 12, 26, and 48 days.

MASSEY UNIVERSITY
MASSEY RESEARCH ONLINE http://mro.massey.ac.nz/
Massey Documents by Type Journal Articles
Physicochemical changes in a modelprotein bar during storage
Loveday, SM2009
20/01/2020 - Downloaded from MASSEY RESEARCH ONLINE