physics - john wiley & sonscatalogimages.wiley.com/images/db/pdf/9780813806075.excerpt.pdf ·...
TRANSCRIPT

BLBS027-Gavin April 22, 2009 11:49
CHAPTER ONE
Physics
SECTION 1
Comparative Imaging
Patrick R. Gavin
Diagnostic imaging has always been a mainstay ofthe armamentarium for the veterinarian. Veterinari-ans have limited resources available as regards historyand routine screening procedures. Therefore, diagnos-tic imaging has a major role in the workup of numer-ous veterinary patients. An overreliance on diagnos-tic imaging has been observed by numerous clinicians;however, the move toward less invasive diagnostic pro-cedures with a high precision of diagnosis has contin-ued to drive this phenomenon. This chapter deals withthe advances in diagnostic imaging through the last 60years.
Diagnostic Radiology
Diagnostic radiology was invented in the late 1800s.The use of diagnostic radiology was rewarding primar-ily in the study of skeletal structures. However, dueto the cost of the equipment, lack of education, andpotential risks, the modality did not penetrate veteri-nary medicine until approximately the 1950s. Initially,these were the colleges of veterinary medicine in NorthAmerica that possessed the equipment to perform di-agnostic radiographic examinations. There were notrained radiologists at that time and in some places thestudies were often performed and interpreted by non-veterinarians. Clinicians did not know what to expect asthey had no prior knowledge of the diagnostic modal-ity. Clinicians were often asked if they wanted a V/D orlateral and would merely say “yes” at the answer andaccept the outcome. Much was to be learned.
Diagnostic radiology advanced rapidly in veterinarymedicine, and the first examinations for veterinaryradiologists were performed by charter diplomatesfor the American College of Veterinary Radiology in
1965. Following this beginning veterinary radiologyadvanced rapidly. Diagnostic radiology was utilizedin multiple species throughout colleges of veterinarymedicine and in selected practices. By the early to mid-1970s, advanced radiographic procedures includingfluoroscopy and angiography were available, thoughprimarily at colleges of veterinary medicine. The use ofdiagnostic radiology expanded with improved knowl-edge, especially with better understanding of its diag-nosis of various pathologic conditions. The use of diag-nostic radiology abated somewhat with the advance ofdiagnostic ultrasonography; however, it has remainedthe stalwart of diagnostic imaging in the veterinary pro-fession. At the current time, there is a major push tomove from conventional analog film screen technologyto computed and/or digital radiography. It is presumedthat veterinary radiology will continue to follow theprogression realized in human radiology.
Nuclear Medicine or
Gamma Scintigraphy
The previously used term, nuclear medicine, fell outof favor with the antinuclear movement of the 1970s.Medical personnel were quick to adopt the softer ter-minology of gamma scintigraphy that facilitated itscontinued development as an imaging modality. Whilegamma scintigraphy has the advantage of visualizingphysiologic and temporal pathologic changes, for themost part its greatest use in veterinary medicine hasbeen static studies for the diagnosis of skeletal disease.The use of the modality for the diagnosis of skeletal dis-ease is well documented. The challenges of using nu-clear isotopes, radiation safety concerns, and time de-lays are well documented. Some studies have become
1
COPYRIG
HTED M
ATERIAL

BLBS027-Gavin April 22, 2009 11:49
2 PHYSICS: COMPARATIVE IMAGING
rather routine in veterinary medicine. These includestudies of the thyroid gland that have been publishedand have led to a better understanding of thyroid dis-ease.
While this modality has been present since the turnof the century, it became rather commonplace in vet-erinary medicine in the 1980s. Its involvement as a di-agnostic modality has undergone little evolution in thelast two decades.
Computed Tomography
Computed tomography (CT) was first utilized in themid-1970s in veterinary medicine, primarily for thediagnosis of intracranial disease. The modality wasmodified for the study of large animal species shortlythereafter. CT has had a large expansion in the veteri-nary medical field. Virtually all colleges of veterinarymedicine provide this diagnostic modality. In the last10 years, extension into private veterinary practices hassignificantly expanded its availability. There are nownumerous large specialties, and even general practices,with CT on site. Many units were purchased as usedequipment, but many include state-of-the-art helicalunits.
CT uses the same basic physical principles as di-agnostic x-ray, except it depicts the shades of gray incross-section. It is also possible to better visualize dif-ferent tissues and the pathologic change within them,if present. Therefore while the modality is similar to di-agnostic x-ray, CT is superior in diagnosis because theaxial images are far superior to the two-dimensionalradiographic projections. CT has led a renaissance inthe understanding of three-dimensional anatomy andphysiologic principles.
Ultrasonography
Ultrasonography became a clinical imaging modalityin veterinary medicine in the late 1970s. It languishedin veterinary colleges through much of the 1980s as thetechnology advanced. The initial technology of staticB-mode machines was replaced by real-time machinesthat allowed an approximate 80% reduction in scanningtime. The resolution and utility of the studies improvedat the same time. However, diagnostic ultrasonogra-phy did not hit its stride and become mainstream in theUnited States until approximately the 1990s. Now, mostlarge veterinary practices (and certainly referral prac-tices) have diagnostic ultrasonography. This modality isalso available in many smaller private practices. There
have been numerous technologic advancements thathave improved the quality of this modality. Increasedavailability of traveling diagnostic radiologists and/orinterpretation via teleradiology have improved diag-nostic outcomes.
Other specialists utilizing diagnostic ultrasonogra-phy, including cardiologists and internists, have fur-ther fueled the expansion of this modality in veterinarymedical practice. Currently, most ultrasonographic ex-aminations are performed by licensed veterinarians.It is this author’s opinion that in the future, many ofthese procedures will be performed by trained ultra-sonographers and interpreted by radiologists, just asoccurs in the human field. In the human field, thereis a greater medical liability issue, and if physician ra-diologists can make it work, certainly veterinary ra-diologists can work in this format to further advancethis modality’s utility in the diagnosis of our veterinarypatients.
Magnetic Resonance
Imaging
Magnetic resonance imaging (MRI) came into clinicalutility in the mid-1980s. It was utilized in veterinarymedicine primarily as a research tool in the 1980s andearly 1990s. In the mid-1990s, some areas began to useMR as a routine clinical modality. The procedure wasapplied to large animal imaging a few years later. How-ever, the attitude of “not invented here” plagued the in-clusion of MRI for the diagnosis of veterinary patients atmany sites in the early years. Many veterinary sites hadantiquated equipment or equipment with poor reliabil-ity, which gave it the aura of an unreliable diagnosticmodality. However, as more sites gained modern di-agnostic equipment, the utility of the modality becameapparent.
Following the change of the millennium, MR becamethe modality of choice for the veterinary neurologistfor the examination of disease processes involving thebrain and spinal cord. Efforts to expand the use of themodality included corporate sponsorship of diagnos-tic facilities. At the time of this writing, this author isaware of more than 40 sites dedicated to MR imaging ofanimals using what would be considered modern state-of-the-art equipment. One limitation has been the non-availability of appropriately trained veterinary radiol-ogists with expertise in this modality capable of provid-ing accurate diagnoses of clinical conditions. Currently,the American College of Veterinary Radiology does notrequire training time minimums in MRI for their core

BLBS027-Gavin April 22, 2009 11:49
3 PRACTICAL SMALL ANIMAL MRI
curriculum, as not all training sites have this modalityavailable. Therefore many veterinary radiologists, andothers, must essentially undergo “on the job training”in the use of this modality.
There is a broad spectrum of equipment options.These options span from the currently availablebest, including machines capable of functional MRI,commonly utilized super conducting magnets, cost-effective mid-field units, to even less expensive but less
capable low field permanent magnets. It is this author’sopinion that equipment generally costs what it is worth.Therefore, equipment that is more expensive is of morediagnostic worth, and conversely, equipment that costsless has less diagnostic capability. The equipment pur-chase balance will be finding equipment that providesthe utility required for the financial reality of the prac-tice. There has been a rapid development of equipmentin the last few years.

BLBS027-Gavin April 22, 2009 11:49
SECTION 2
Basic Physics
Patrick R. Gavin
It is beyond the scope of this text to do an extensivetreatise of the physics of MRI. There are several excel-lent texts, as well as numerous study guides, and evenimpressive volumes of free information on the Inter-net that can be consulted for more in-depth informa-tion on patient MR physics. This chapter outlines thesalient features of the physics of MRI to allow a betterunderstanding of image, and artifact, production, andvisualization.
Current clinical applications for MRI rely on visual-ization of the hydrogen atom’s nucleus. This physicalproperty was previously known as nuclear magneticresonance, that is, the hydrogen atom nuclei resonate.The word nuclear does not refer to radioactivity, butmerely refers to the nucleus of the atom. For more po-litically correct names it has become known as MRI.The basic physical principle is that a moving electri-cal charge produces a magnetic field. The size of themagnetic field is dependent on the speed of movement(magnetic movement) and the size of charge. While thehydrogen nucleus has a small electric charge it spinsvery fast. These physical attributes in concert with theabundance of the hydrogen nucleus within the bodyproduce a detectable magnetic field.
Magnetic field strengths are measured in units ofgauss (G) and tesla (T). One tesla is equal to 10,000gauss. The earth’s magnetic field is approximately0.5 G. The strength of MRI is similar in strength to theelectromagnets used to pick up large heavy scrap metal.Materials can be ferromagnetic, paramagnetic, supra-paramagnetic, or diamagnetic. Ferromagnetic materi-als generally contain iron, nickel, or cobalt. These ma-terials can become magnetized when subjected to anexternal magnetic field. In MR images, these materialscause large artifacts characterized by the properties ofsignal and distortion of the image. These artifacts can beseen in MR images even when the ferromagnetic sub-stances are too small to be seen on conventional radio-graphy. Commonly seen sources of these artifacts are
microchips, ameroid constrictors, certain bone plates,gold-plated beads, and colonic contents.
Paramagnetic materials include ions of various met-als such as iron (Fe), manganese (Mg), and gadolinium(Gd). These substances can also have magnetic suscepti-bility, but only about 1/1,000 that of ferromagnetic ma-terials. These substances increase the T1 and T2 relax-ation rates. Because of this property, chelates of these el-ements make ideal components of MR contrast agents.Gadolinium chelates are the most common agents andgenerally cause an increase in T1-weighted signal. Thisis seen as increased hyperintensity (brightness) in T1-weighted images. At very high gadolinium concentra-tions, as seen in the urinary bladder, loss of signal canbe seen as a result of T2 relaxation effects dominating.
Supraparamagnetic elements are materials that haveferromagnetic properties. The most commonly used issuper paramagnetic iron oxide (SPIO), which is an iron(Fe)based contrast agent for liver imaging. These havebeen used minimally in veterinary MR. Diamagneticmaterials have no intrinsic magnetic moment, but canweakly repel the field. These materials include water,copper, nitrogen, and barium sulfate. They will cause aloss of signal and have been seen as a loss of MR sig-nal in images made after the administration of bariumsulfate suspensions.
Since hydrogen is the common element used to makean MR clinical image, we will discuss the process ofimage formation. When hydrogen is placed within alarge external magnetic field, the randomly spinningprotons (hydrogen nucleus) will come into alignmentwith the external field. Some of the protons align withthe field and some align against the field, largely cancel-ing each other out. A few more align with the field thanagainst it. The net number aligning with the magneticfield is very small. Approximately, three protons alignwith the field for every one million protons as 1.0 T.This number is proportional to the external magneticfield strength. While this number appears very small,
4

BLBS027-Gavin April 22, 2009 11:49
5 PRACTICAL SMALL ANIMAL MRI
the abundance of hydrogen allows for high-quality im-ages. For example, in a typical volume imaging elementtermed a voxel, the number of protons aligned with thefield would be roughly 6 × 10¹⁵.
Basic physics dictate that the energy is proportionalto the nuclei’s unique resonant frequency in MR; this iscalled the Larmor frequency. The frequency of the spin-ning of the hydrogen nuclei is relatively low. The res-onance frequency is proportional to the external mag-netic field, which for hydrogen is equal to 42.56 MHz/T.MRI is able to make high-quality images, not because ofthe energy of the spinning protons, but due to the abun-dance of hydrogen protons present in the body. Thespinning or “resonating” of nuclei occurs because ofunpaired electrons in the orbital shell. Each nucleuswith this characteristic will resonate at a unique fre-quency. The spinning protons act like toy tops thatwobble as they spin. The rate of wobbling is termedprecession. These precess at the resonance or Larmorfrequency for hydrogen.
If a radiofrequency (RF) pulse is applied at the res-onance frequency, the protons can absorb that energy.The absorption of energy causes the protons to jumpinto a higher energy state. This causes the net magne-tization to spiral away from the main magnetic field,designated B0. The net magnetization vector, therefore,moves from its initial longitudinal position a distanceproportional to pulse, which is determined by its tem-poral length and strength. After a certain length of time,the net magnetization vector would rotate 90◦ and lie ina transverse plane. It is at this position that no net mag-netization can be detected. When the RF pulse is turnedoff, three things start to happen simultaneously:
1. The absorbed energy is retransmitted at the reso-nance frequency.
2. The spins begin to return to their original longitu-dinal orientation, termed the T1 relaxation.
3. While the precessions were initially in-phase, theybegin to de-phase, termed T2 relaxation.
The return of the excited nuclei from the high energystate to their ground state is termed T1 relaxation (orspin–lattice relaxation). The T1 relaxation time is thetime required for the magnetization to return to 63% ofits original longitudinal length. The T1 relaxation rateis the reciprocal of the T1 time (1/T1). T1 relaxation isdependent on the magnetic field strength that dictatesthe Larmor frequency. Higher magnetic fields are asso-ciated with longer T1 times.
T2 relaxation occurs when spins in high and low en-ergy states exchange energy but do not lose energy
to the surrounding lattice as occurs in T1 relation. Itis, therefore, sometimes referred to as spin–spin re-laxation. This results in loss of transverse magnetiza-tion. In biological materials, T2 time is longer than T1time. T2 relaxation occurs exponentially like T1 and isdescribed as the time required for 63% of the trans-verse magnetization to be lost. In general, T2 values areunrelated to field strength. In patients, the magneticsignal decays faster than T2 would predict. There aremany factors creating imperfections in the homogene-ity of the magnetic field, including the magnet and pa-tient inhomogeneities including surface contours, air–tissue interfaces, and any metal the patients may havewithin them, including dental work, staples, and or-thopedic appliances. The sum effect of all of these in-homogeneities pronounces an effect called T2*. The T2relaxation comes from random interactions, while T2*comes from a combination of random and fixed causesincluding magnet and patient inhomogeneity.
To attempt to negate the fixed causes, a 180◦ refocus-ing pulse is used. Consider the following analogy, threecars in a race going at different speeds. At the start, allthe cars are obviously together, and can be thought of asbeing in-phase. At some time after the start of the race,there is a noticeable difference between them due to dif-ferent speeds; they are in essence out-of-phase. At thattime, everybody will turn around and go back towardthe starting line. If it is assumed that everyone is stillgoing at the same rate as before, then they will all ar-rive at the starting line together and in-phase. The timerequired for the atoms to come back in-phase is equalto the time it took for them to lose phase. This total timeis called the “TE” or echo time. The 180◦ pulse is usedto reverse the T2* de-phasing process. As soon as thespins come back into phase, they will immediately startto go out-of-phase again. The two variables of interest inspin echo (SE) sequences are (1) the repetition time (TR)and (2) the echo time (TE). All SE sequences include aslice-selective 90◦ pulse followed by one or more 180◦
refocusing pulses. This refocusing pulse can be appliedmultiple times. The use of multiple refocusing pulsesis the basis for fast or turbo spin–echo imaging, FSE, orTSE respectively.
Images of T1 and T2 relaxation are produced by sam-pling the signal at various times. Both effects are al-ways present; however, we will often accentuate oneeffect over the other such that the sequences are oftenproperly termed T1-weighted or T2-weighted images.To produce the cross-sectional images, gradient coilsare needed, which produce deliberate variation in themain magnetic field. There is one gradient coil in eachCartesian plane direction (X, Y, and Z planes). These
BLBS027-Gavin April 22, 2009 11:49
6 PHYSICS: BASIC PHYSICS
slight variations in the magnetic field will allow for sliceselection and phase and frequency encoding. The sliceselection gradient will be the Z, X, and Y gradients fora patient in supine position for the transverse, sagittal,and dorsal plane sequences, respectively.
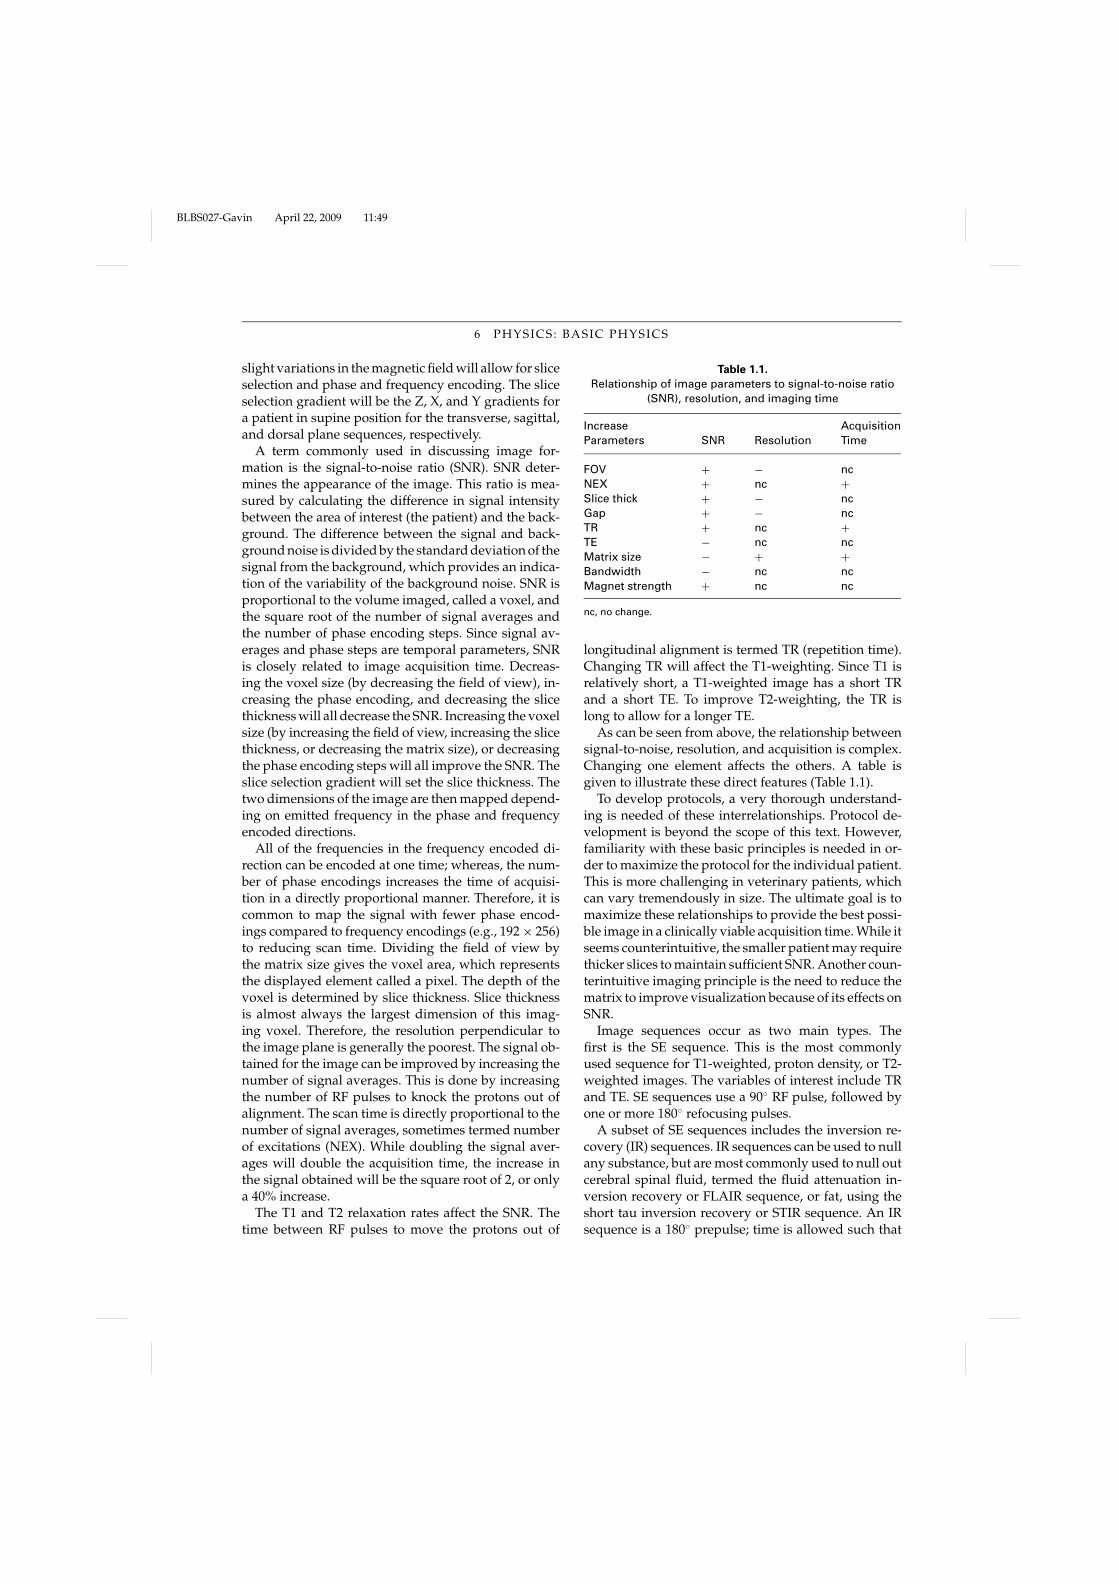
A term commonly used in discussing image for-mation is the signal-to-noise ratio (SNR). SNR deter-mines the appearance of the image. This ratio is mea-sured by calculating the difference in signal intensitybetween the area of interest (the patient) and the back-ground. The difference between the signal and back-ground noise is divided by the standard deviation of thesignal from the background, which provides an indica-tion of the variability of the background noise. SNR isproportional to the volume imaged, called a voxel, andthe square root of the number of signal averages andthe number of phase encoding steps. Since signal av-erages and phase steps are temporal parameters, SNRis closely related to image acquisition time. Decreas-ing the voxel size (by decreasing the field of view), in-creasing the phase encoding, and decreasing the slicethickness will all decrease the SNR. Increasing the voxelsize (by increasing the field of view, increasing the slicethickness, or decreasing the matrix size), or decreasingthe phase encoding steps will all improve the SNR. Theslice selection gradient will set the slice thickness. Thetwo dimensions of the image are then mapped depend-ing on emitted frequency in the phase and frequencyencoded directions.
All of the frequencies in the frequency encoded di-rection can be encoded at one time; whereas, the num-ber of phase encodings increases the time of acquisi-tion in a directly proportional manner. Therefore, it iscommon to map the signal with fewer phase encod-ings compared to frequency encodings (e.g., 192 × 256)to reducing scan time. Dividing the field of view bythe matrix size gives the voxel area, which representsthe displayed element called a pixel. The depth of thevoxel is determined by slice thickness. Slice thicknessis almost always the largest dimension of this imag-ing voxel. Therefore, the resolution perpendicular tothe image plane is generally the poorest. The signal ob-tained for the image can be improved by increasing thenumber of signal averages. This is done by increasingthe number of RF pulses to knock the protons out ofalignment. The scan time is directly proportional to thenumber of signal averages, sometimes termed numberof excitations (NEX). While doubling the signal aver-ages will double the acquisition time, the increase inthe signal obtained will be the square root of 2, or onlya 40% increase.
The T1 and T2 relaxation rates affect the SNR. Thetime between RF pulses to move the protons out of
Table 1.1.Relationship of image parameters to signal-to-noise ratio
(SNR), resolution, and imaging time
Increase Acquisition
Parameters SNR Resolution Time
FOV + − nc
NEX + nc +Slice thick + − nc
Gap + − nc
TR + nc +TE − nc nc
Matrix size − + +Bandwidth − nc nc
Magnet strength + nc nc
nc, no change.
longitudinal alignment is termed TR (repetition time).Changing TR will affect the T1-weighting. Since T1 isrelatively short, a T1-weighted image has a short TRand a short TE. To improve T2-weighting, the TR islong to allow for a longer TE.
As can be seen from above, the relationship betweensignal-to-noise, resolution, and acquisition is complex.Changing one element affects the others. A table isgiven to illustrate these direct features (Table 1.1).
To develop protocols, a very thorough understand-ing is needed of these interrelationships. Protocol de-velopment is beyond the scope of this text. However,familiarity with these basic principles is needed in or-der to maximize the protocol for the individual patient.This is more challenging in veterinary patients, whichcan vary tremendously in size. The ultimate goal is tomaximize these relationships to provide the best possi-ble image in a clinically viable acquisition time. While itseems counterintuitive, the smaller patient may requirethicker slices to maintain sufficient SNR. Another coun-terintuitive imaging principle is the need to reduce thematrix to improve visualization because of its effects onSNR.
Image sequences occur as two main types. Thefirst is the SE sequence. This is the most commonlyused sequence for T1-weighted, proton density, or T2-weighted images. The variables of interest include TRand TE. SE sequences use a 90◦ RF pulse, followed byone or more 180◦ refocusing pulses.
A subset of SE sequences includes the inversion re-covery (IR) sequences. IR sequences can be used to nullany substance, but are most commonly used to null outcerebral spinal fluid, termed the fluid attenuation in-version recovery or FLAIR sequence, or fat, using theshort tau inversion recovery or STIR sequence. An IRsequence is a 180◦ prepulse; time is allowed such that

BLBS027-Gavin April 22, 2009 11:49
7 PRACTICAL SMALL ANIMAL MRI
the tissue to be nulled has its vector in the horizon-tal magnetization plane. Then, the 90◦ RF pulse willonly affect those tissues that were not at the zero orhorizontal magnetization plane. Another way to nullfat is through fat saturation. These sequences consistof multiple 90◦ RF pulses that have relatively shortTR.
The other basic type of sequence acquisition is thegradient echo (GE or GRE) sequence. The basic se-quences are varied by adding de-phasing and re-phasing gradients at the end of the sequence. The
variables include TR and TE, but there is also the vari-able of flip angle. Generally, flip angles of less than90◦ are used. GE sequences can be used to acquire im-ages rapidly and are often used for breath holding tech-niques and visualization of moving structures, includ-ing the cardiovascular system. GE sequences generallyhave less contrast than SE sequences. Lower field MRunits often rely on GE sequences due to short TR andTE, permitting short imaging duration. The lack of stan-dard T1 and T2 contrast can limit the utility of thesesequences in multiple anatomical regions.

BLBS027-Gavin April 22, 2009 11:49
SECTION 3
Sequence Selection
Patrick R. Gavin
It is not the intent of this text to go through all the vari-ous imaging sequences that could be utilized with MR.These sequences are often explained similar to a recipein a cookbook. Just as there can be an exhaustive num-ber of recipes to cook with any given list of ingredients,the same is true for the number of imaging sequences.
Imaging sequences are generally either SE sequencesor GE sequences. The majority of imaging protocols forconventional clinical MR imaging use SE sequences. GEsequences do have some specific uses. Low field mag-nets are often heavily dependent on GE sequences toprovide shorter examinations with relatively thin sec-tions. However, many GE sequences suffer from lack ofcontrast or increased magnetic susceptibility artifacts.Because of these limitations, this author favors tradi-tional SE sequences over GE sequences. GE sequencesand their specific use(s) will be highlighted throughoutthe book, but the coverage in this book is not exhaus-tive.
Standard clinical imaging sequences most commonlyutilize T2-weighted sequences, STIR sequences, and T1-weighted sequences. T1 sequences are fundamental incontrast studies with the administration of a paramag-netic gadolinium-based contrast agent.
Other sequences that are commonly utilized are theFLAIR sequence, the GE sequence for the detectionof hemorrhage, and heavily T2-weighted images forthe visualization of fluid structures, including the sub-arachnoid CSF columns, the biliary system, or the fluidcontaining inner ear structures of the cochlea and semi-circular canals.
T2 Sequence
T2-weighted sequences are often the bulwark of imag-ing protocols. When performed with fast SE techniques,reasonable imaging time is achieved and it producesimages in which both fat and fluid are seen as relativelyhigh signal intensity. Some systems use T2-weighted
fat suppression to further increase conspicuity of fluid,and have the advantage of negating the need to ad-ditionally acquire STIR images. Bright fluid in imagesis desirable as most pathologic abnormalities have anincreased fluid signal. The fluid can be from either in-tracellular fluid, in the case of cellular abnormalitiesincluding neoplasia or granulomatous conditions, orintercellular fluid from diseases such as abscessationor edema.
T1 Sequence
T1-weighted sequences are generally utilized with con-trast agents. The T1-weighted precontrast study is “al-ways” necessary. One cannot definitively assess con-trast enhancement without the pre-enhanced study,and a shortcut eliminating this sequence can lead toserious misinterpretation. In T1-weighted images, fatis hyperintense and fluid is hypointense. Following theadministration of contrast, abnormal tissue often hasan increased vascular supply leading to increased sig-nal intensity. In some cases there are breaks in tissuestructure, such as the blood–brain barrier, that allowthe contrast agent to leak into the tissue and changethe relaxation of the tissue leading to increased signalintensity. It must be remembered that the gadoliniumcontrast agent is not visualized. The only element thatcan be visualized at this time is the element hydrogen.Therefore, the gadolinium-based agents affect the re-laxation of the protons in the molecules. This fact needsto be remembered, as the amount of contrast requiredfor the paramagnetic effect on the proton relaxation isnot as concentration dependent as iodine-based con-trast agents for CT.
If a T1-weighted image (prior to the administrationof gadolinium) has hyperintensity in tissues that arenot related to fat, then paramagnetic substances mustbe present. The only paramagnetic substances withinthe body are iron and manganese. Since the amount
8

BLBS027-Gavin April 22, 2009 11:49
9 PRACTICAL SMALL ANIMAL MRI
of manganese present is in a very small degree, theonly reasonable element that could be present wouldbe iron. For iron to be bright on T1-weighting, it re-quires a degradation of iron through normal processesuntil it reaches extracellular methemoglobin. The vari-ous stages of the iron degradation process that can beseen in MR images will be given with examples utiliz-ing the brain. Again, since T1-weighted images resultin high signal intensity with fat, it is often preferableto perform T1-weighted images with fat suppression.However, following the administration of contrast, it ispossible that the lesion can have a relaxation time simi-lar to that of fat and its signal can be nulled. Therefore,it is advisable to always have some postcontrast stud-ies used without fat suppression to make certain thatlesions are not lost.
STIR Sequence
The STIR sequence is a workhorse sequence as it allowsfor a T2-weighted type of image with uniform loss ofthe fat signal. The IR sequence is an easily performedstudy utilizing a 180◦ prepulse, prior to the 90◦ excita-tion pulse. The relaxation time of fat is known for allmagnet strengths. Therefore, it is easy to set the timeof inversion (TI) for a specific magnetic field strength,which will ensure uniform and generalized suppres-sion of the fat signal. STIR sequences should alwaysbe performed prior to the administration of contrast. Itis possible that contrast enhancement could change therelaxation time of the tissues similar to fat, and again thetissue’s signal will be nulled on a STIR sequence if per-formed after contrast administration. STIR sequencesare utilized as they display normal vascular or otherfluid-filled structures as bright on a generalized darkbackground. Typically, pathologic changes in tissue areeasily detected as “stars” in a dark sky.
FLAIR Sequence
The FLAIR sequence is similar to the STIR sequence ex-cept it uses an inversion time to get null fluid signal. Ingeneral, the FLAIR is utilized in the brain and gets rid ofthe usually hyperintense fluid signal from the cerebralspinal fluid. Therefore, lesions that are periventricularare easier to detect as increased signal intensity, adjacentto a black or darkened cerebral spinal fluid. The atten-
uation appearance of cerebral spinal fluid is somewhatdependent on time of inversion as well as other factorsspecific to MR unit. With some protocols, one is capableof detecting abnormal cerebral spinal fluid from its ap-pearance on the FLAIR sequence. The abnormal signalappearance could be due to increased protein contentand/or cellularity or associated CSF flow.
This sequence can be useful when applied to otherfluids. A FLAIR sequence can be used to get a T2-weighted image of a urinary bladder tumor. Since urineis basically acellular and with no proteins, the TI for CSFcan be used. The nulling out of fluid from conditionssuch as hydrothorax allows darkening of the effusionwhile still allowing visualization of T2-weighted imagecharacteristics of the thoracic wall and organs. IR timesfor such studies vary due to many parameters, but es-sentially all fluid, including urine, synovial fluid, tho-racic and abdominal effusions, or cerebral spinal fluidcan be nulled with the FLAIR technique.
Gradient Echo Sequence
GE techniques are the most commonly used sequencefor rapid studies, and as such are often utilized for local-ization sequences. In the brain, its most common clini-cal application is to verify the presence of hemorrhage.GE sequences are very sensitive to magnetic field inho-mogeneities. Therefore, the iron concentration withinhemorrhagic tissue is detected as a magnetic field inho-mogeneity. Unfortunately, this same degree of inhomo-geneity can cause massive image artifacts from smallmetallic implants including BBs, steel bird shot, thewire around microchip placement, or simple anatomi-cal tissue differences including the frontal sinuses (air)next to the brain. Other than the benefit of detectinghemorrhage, the overall tissue contrast is poor with GEsequences, even though T1- and T2-weighted GE se-quences are available. Therefore, this author tends tolimit them to the detection of hemorrhage in studiesof the CNS. GE sequences are commonly used in thethoracic and abdominal studies to minimize motion ar-tifact.
In the subsequent chapters, we will utilize a few addi-tional sequences for the visualization of specific struc-tures. These are often heavily T2-weighted images thatallow the visualization of structures including vascularstructures, the equivalent of an MR myelogram, or thefluid in the semicircular canals and cochlea.

BLBS027-Gavin April 22, 2009 11:49
SECTION 4
Artifacts
Patrick R. Gavin
The goal of all imaging modalities is to aid in visual-ization of normal anatomy and disease states. Unfortu-nately, all imaging modalities have some artifacts thatcan mimic pathologic change and lead to misdiagnosis.MR is no different. Knowledge of the common MR ar-tifacts and the ability to distinguish artifactual change,which may be mimicking pathologic change from a truepathologic abnormality, are critical to accurate interpre-tation of MR images.
Hardware Artifacts
Some artifacts come from the magnetic field inhomo-geneity. The artifacts can be intensity, spatial, or both.An artifactual bending of the spine may be seen whenat the edge of the main magnetic field (Figure 1.1). Thepatient should be repositioned in the gantry if this iscreating a diagnostic dilemma.
Artifacts can also occur from defects in the RF shield-ing. The shield could be faulty but often these artifactsare from transient breaks in the shielding and most of-ten are seen if someone enters the magnet room during asequence. This type of “zipper” artifact can be avoidedby waiting until the end of a sequence to enter the room(Figure 1.2).
The advantage of MRI over CT is its ability to visual-ize the body in any plane. As mentioned, the three com-mon planes are (1) transverse (axial), (2) dorsal (coro-nal), and (3) the sagittal plane. The images are madefrom different slices within these planes, which areformed from the three magnetic gradients used. Whenunderstanding the orientation gradients, it is useful toassume that the patient went into the bore of the magnethead first and supine for the imaging study. One of thegradients is selected for the slice selection to providethe desired plane. In this scenario, the gradient in theZ direction is used for transverse or axial slices, the Xdirection is used for sagittal slices, and the Y directionis used for coronal or dorsal slices. All gradients canbe modified depending on the patient positioning. For
instance, if the patient is in the right decubitus position,then the Y gradient would be used for the sagittal slicesof the body.
The other two gradients map the signal in the twodimensions of the slice plane. The signal is mapped ac-cording to its phase and frequency. The frequencies ofthe signals are similar to the range frequencies of dif-ferent radio stations. Think of the phase as a time zone.There could be an FM 101.1 station in Denver, Colorado,and a station with the same frequency in Los Angeles,California. Then, if one were to realize that the timezones are a continuum from east to west, this allowsfor many more time zones than the current artificiallydrawn time zones for a 24-h clock. The number of fre-quencies and the number of phases are often 256, butcan go much higher.
Phase and Frequency
Artifacts
Some artifacts are propagated in the frequency direc-tion while others are propagated in the phase direction.Therefore, a prior knowledge of the direction of theseencodings is needed to determine the image artifact.Some institutions print this information in the images.It is always part of the DICOM header information thatcan be assessed if one can access this file. It is oftensimpler to find some ubiquitous motion artifact fromflowing blood, for example, that will be propagated inthe phase direction. By changing the background of theimage, one can readily depict this in the background(Figure 1.3). Motion artifact can be from gastrointesti-nal motion, respiratory motion, blood flow, or patientmotion. Attempts to limit some of this motion can bemade by gaiting the acquisition to the respiratory or car-diac cycles. This form of image acquisition will prolongthe study to a degree and may limit its clinical utility.Therefore, some motion is generally an accepted con-sequence of MRI.
10

BLBS027-Gavin April 22, 2009 11:49
11 PRACTICAL SMALL ANIMAL MRI
A B
Figure 1.1. (A) T2-weighted sagittal imaging. Arrows show the bending of the field at the edge of the field of view. This isfrom magnetic inhomogeneity at the periphery of the imaging volume. (B) Sagittal STIR sequence of the lumbar spine of thesame patient showing bending at the opposite end of the patient from the same affect.
The signal from flowing blood is often accentuatedfollowing the administration of contrast due to the in-creased signal intensity of the blood with the contrastagent. Pseudolesions can be seen that would mimicpathologic change. Swapping the phase and frequency
Figure 1.2. Zipper artifact: T2-weighted transverse imagewith a horizontal zipper artifact (arrows).
encoding directions allows one to ascertain, with cer-tainty, if this is artifactual or real (Figure 1.4).
Chemical Shift Artifact
Another artifact that can be confused with pathologicchange is a chemical shift artifact. This artifact is amis-mapping that occurs at water–fat interfaces and inthe frequency direction. The artifact is often easily rec-ognized in abdominal studies, but in other areas canmimic pathologic change (Figure 1.5). The same abilityto swap the phase and frequency encoding directionsand to change the direction of the chemical shift artifacthelps clarify the existence of the artifact versus patho-logic change (Figure 1.6).
Fold-Over or Aliasing
Artifact
Fold-over or aliasing is another artifact that occurs inthe phase direction. This artifact occurs when a portionof anatomy is outside the selected image field of view.This anatomy can be wrapped around to the oppositeside of the image as a mirror image into the area ofinterest. This can confuse the interpretation (Figure 1.7).Field of view should be large enough to encompass

BLBS027-Gavin April 22, 2009 11:49
12 PHYSICS: ARTIFACTS
A B
C D
Figure 1.3. Motion artifact. (A) Apparent small lesion in the left occipital cortex on T1 postcontrast. (B) Lesion gone.(C) Brightened background and phase is ventral to dorsal and flow artifact is seen in alignment with the “lesion.” (D) Brightenedbackground with phase left to right.

BLBS027-Gavin April 22, 2009 11:49
13 PRACTICAL SMALL ANIMAL MRI
A B
C D
E F
Figure 1.4. (A) STIR sagittal sequence of the lumbosacral spine showing the presence of hyperintensity of the endplatesat L7-S1. (B) T2-weighted sagittal image of the thoracic spine showing hyperintensity of the endplates at two sites. (C) STIRsequence of the same location as (B). Hyperintensity is somewhat obscured due to flow artifact from the aorta. Phase directionis in the foot-to-head direction such that the aortic signal is bleeding into the spine at this site. (D) Contrast enhancement T1-weighted sequence with fat suppression. The aortic signal can readily be seen bleeding through the spine, spinal cord, and thedorsal spinous processes of the first few thoracic vertebrae. This type of flow artifact could be prevented by changing the phasedirection, but then the entire aortic signal would have motion artifact into the spinal cord. Therefore, foot-to-head directionas in this case is greatly preferred, but one must be cognizant of the artifact. (E), (F) T1 postcontrast images of a brain. Brain:phase is going in the direction of the arrows on the left-hand side of the image. The phase is left to right in this image and thearrows point to hyperintensities within the cerebellum. These are flow artifacts, probably from the internal carotid artery, andas in part (F) these hyperintensities are not present when the phase direction is changed to a ventrodorsal direction. Any timecontrast enhancements cannot be substantiated on multiple planes, they should be suspect. If one needs to prove the presenceof artifacts, the change in phase direction with a repeating of the sequence, as in this case, can be helpful.

BLBS027-Gavin April 22, 2009 11:49
14 PHYSICS: ARTIFACTS
A B
Figure 1.5. (A) Phase direction is ventrodorsal, which means the frequency direction is foot to head. This chemical shiftartifact can readily be seen as the black line at the posterior aspect of the spleen and the white line at the cranial aspect. Thischemical shift artifact occurs due to the water signal from the spleen interacting with the abdominal fat signal. When the phasedirection is changed, as in (B), to a ventrodorsal orientation, the change in direction of the chemical artifact is readily seen.
A B
Figure 1.6. (A) Chemical shift artifact in the spinal column. The phase direction is in the direction of the arrows on the left-hand side of the image, in a left-to-right direction. Therefore, the chemical shift is of a ventrodorsal nature. There is a decreasedsignal intensity at the dorsal aspect of the subarachnoid space, which is artifactual and slightly brighter ventrally, which is alsoartifactual. (B) The phase direction is ventrodorsal and the frequency direction is left to right. Now, there is a black line at theleft-hand side of the subarachnoid space and a bright line at the right side. These are both artifactual due to the chemical shiftbetween the water of the subarachnoid space and the epidural fat. This type of chemical shift artifact is often seen in large dogsdue to the amount of epidural fat. This should not be mistaken as a dural lesion.

BLBS027-Gavin April 22, 2009 11:49
15 PRACTICAL SMALL ANIMAL MRI
A B
Figure 1.7. (A) Fold-over or aliasing artifact of the pinna of the ear superimposed over the brain. These artifacts can benegated by a slight increase in the field of view to include the pinnae. One should also try to keep the pinnae close to thesurface of the head when imaging to help alleviate this problem while maintaining a relatively small field of view. (B) Aliasingartifact where the head is being superimposed over the caudal portion of the abdomen. The small arrows show the eye andthe larger arrows the brain, superimposed over the region of the urinary bladder. While the eye makes it relatively easy tosee this fold-over, if one was at a different sagittal plane, the artifact could be easily misinterpreted for a pathologic lesion.One of the best ways to prevent these confusions is to always obtain sequences in multiple planes, and be able to confirmlesions on more than one sequence and more than one plane.
the anatomy visualized or techniques for fold-over sup-pression need to be employed to avoid this artifact.Unfortunately, many of these suppression techniquesresult in increased scan time. Therefore, where possible,fold-over suppression should not be used to either re-duce acquisition time or improve signal-to-noise levels.Since fold-over is in the phase direction, the phase mustoften be set in a certain direction to prevent blood flowrelated artifacts within the area of interest. For instance,in sagittal images of the lumbar spine, it is preferred tohave phase oriented in a foot-to-head direction and,thus, the frequency going anterior to posterior. If onewere to have the phase encoding direction going ventralto dorsal, the blood flow artifact from the aorta wouldsuperimpose on the spinal cord leading to erroneousinterpretation. In this instance, the phase must be ori-ented foot to head and fold-over suppression is neededto prevent wrap-around artifact.
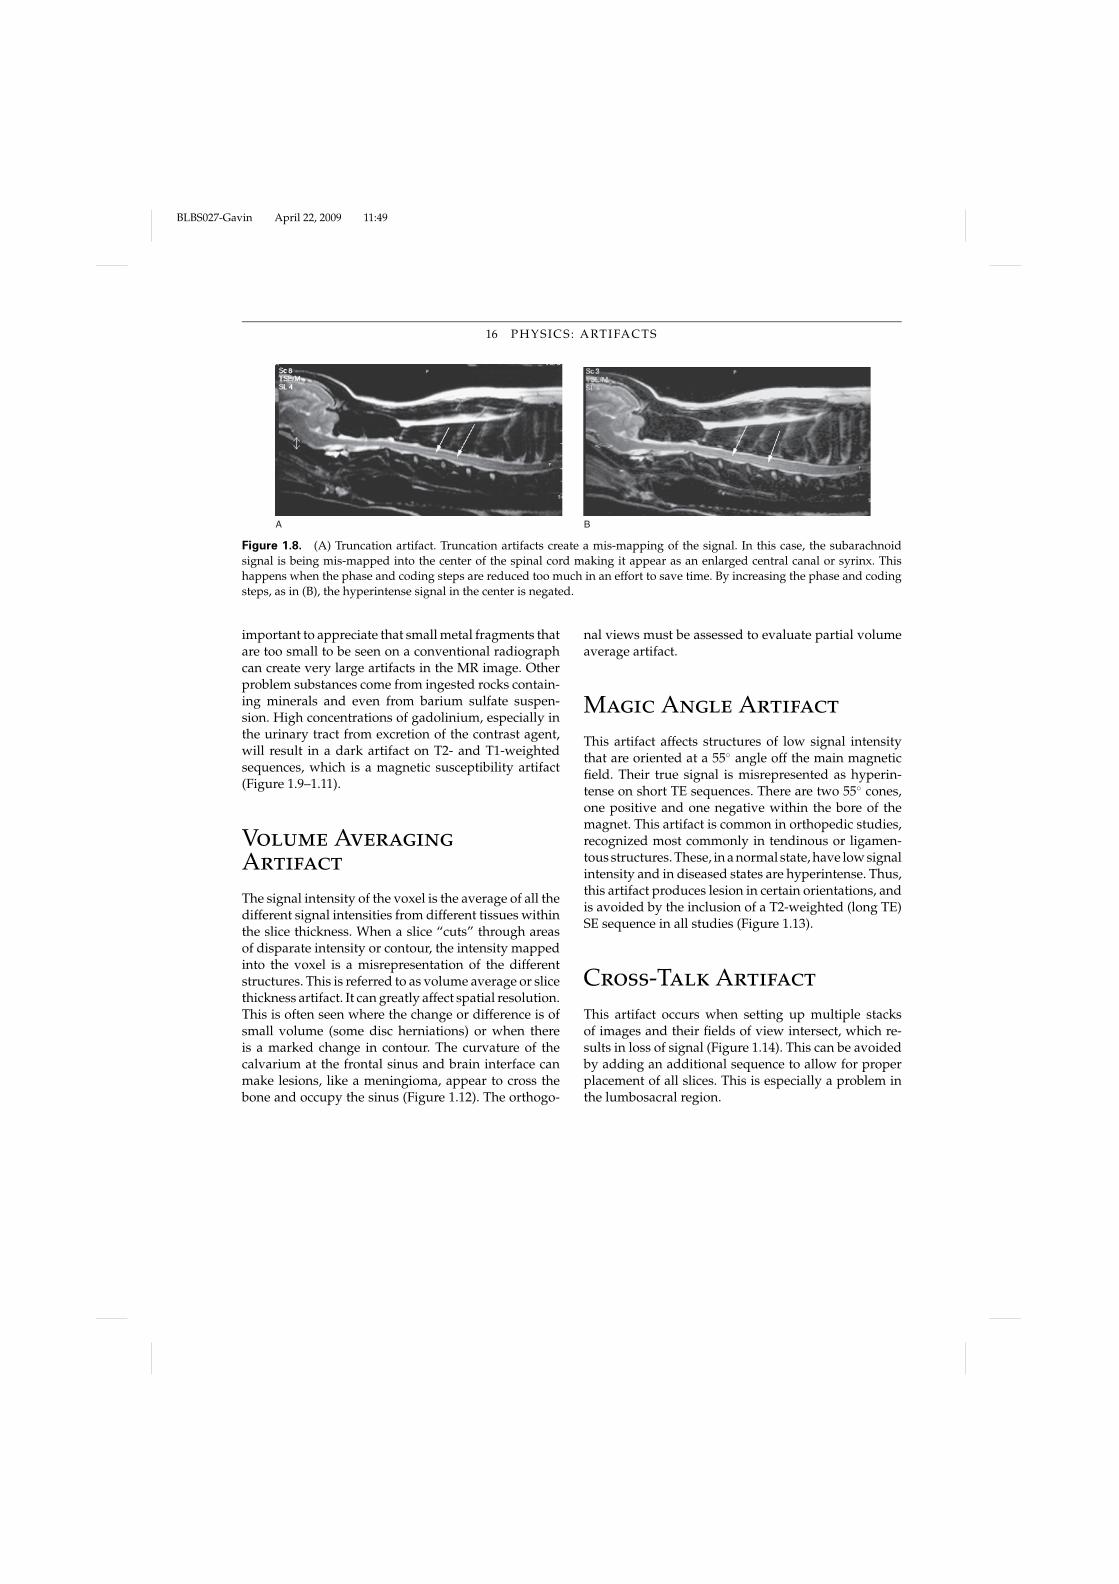
Truncation Artifact
Truncation artifact occurs when the number of phaseencoding steps is decreased in relation to the frequency
encoding steps to save time. With excessive reduction inphase encoding steps there may be a mis-mapping ofthe image in the phase direction. Truncation artifactscan make conditions such as a dilated central canalwithin the cervical spinal column or the appearanceof a syringohydromyelia appear in an image when,in fact, none exists. Often, this artifact is readily seenand ignored when the change is only seen on oneplane and cannot be confirmed on an orthogonal view(Figure 1.8).
Magnetic Susceptibility
Artifact
One of the more sizable artifacts is from magnetic sus-ceptibility. This artifact occurs when magnetic materialis present within the patient. Ferrous metal is espe-cially problematic, including BBs and steel bird shot.Other sources of this artifact can come from the springon the identification microchips, orthopedic devices,or small bits of metal left behind from a surgery. It is
BLBS027-Gavin April 22, 2009 11:49
16 PHYSICS: ARTIFACTS
A B
Figure 1.8. (A) Truncation artifact. Truncation artifacts create a mis-mapping of the signal. In this case, the subarachnoidsignal is being mis-mapped into the center of the spinal cord making it appear as an enlarged central canal or syrinx. Thishappens when the phase and coding steps are reduced too much in an effort to save time. By increasing the phase and codingsteps, as in (B), the hyperintense signal in the center is negated.
important to appreciate that small metal fragments thatare too small to be seen on a conventional radiographcan create very large artifacts in the MR image. Otherproblem substances come from ingested rocks contain-ing minerals and even from barium sulfate suspen-sion. High concentrations of gadolinium, especially inthe urinary tract from excretion of the contrast agent,will result in a dark artifact on T2- and T1-weightedsequences, which is a magnetic susceptibility artifact(Figure 1.9–1.11).
Volume Averaging
Artifact
The signal intensity of the voxel is the average of all thedifferent signal intensities from different tissues withinthe slice thickness. When a slice “cuts” through areasof disparate intensity or contour, the intensity mappedinto the voxel is a misrepresentation of the differentstructures. This is referred to as volume average or slicethickness artifact. It can greatly affect spatial resolution.This is often seen where the change or difference is ofsmall volume (some disc herniations) or when thereis a marked change in contour. The curvature of thecalvarium at the frontal sinus and brain interface canmake lesions, like a meningioma, appear to cross thebone and occupy the sinus (Figure 1.12). The orthogo-
nal views must be assessed to evaluate partial volumeaverage artifact.
Magic Angle Artifact
This artifact affects structures of low signal intensitythat are oriented at a 55◦ angle off the main magneticfield. Their true signal is misrepresented as hyperin-tense on short TE sequences. There are two 55◦ cones,one positive and one negative within the bore of themagnet. This artifact is common in orthopedic studies,recognized most commonly in tendinous or ligamen-tous structures. These, in a normal state, have low signalintensity and in diseased states are hyperintense. Thus,this artifact produces lesion in certain orientations, andis avoided by the inclusion of a T2-weighted (long TE)SE sequence in all studies (Figure 1.13).
Cross-Talk Artifact
This artifact occurs when setting up multiple stacksof images and their fields of view intersect, which re-sults in loss of signal (Figure 1.14). This can be avoidedby adding an additional sequence to allow for properplacement of all slices. This is especially a problem inthe lumbosacral region.

BLBS027-Gavin April 22, 2009 11:49
17 PRACTICAL SMALL ANIMAL MRI
A B
C D
Figure 1.9. (A), (B) Artifact from a small BB in the region of the subcutaneous tissues of this cat. A small BB still causes a verylarge magnetic susceptibility artifact negating visualization of the lumbar spine in this patient. Part (A) is the gradient echolocalizer sequence. Gradient echoes are more prone to magnetic susceptibility artifact and a very large black hole can be seen.Part (B) is a T2-weighted sequence showing some visualization of the spine, but marked warping of the image is due to themagnetic susceptibility artifact. (C) Two stainless steel orthopedic screws placed across the facets. While stainless steel createssome magnetic susceptibility artifact, it is nowhere near that seen with the steel of a BB. However, part (D) shows the warpingof the image from these stainless steel screws in the facets. The curvature of the spinal cord that appears in C3 is artifactual dueto the magnetic susceptibility artifact. (See Color Plates 1.9C,D.)

BLBS027-Gavin April 22, 2009 11:49
18 PHYSICS: ARTIFACTS
A B
C D
Figure 1.10. This image shows the difference between types of metal and the artifacts that are created. (A) Radiographshowing a small steel shot next to the vertebra. (B) This small piece of steel creates a huge magnetic susceptibility artifactnegating visualization of the spine in the L4 through L6 region. Part (C) is a radiograph of an animal that has suffered a gunshotwound. In this case, the metal is lead. While the radiograph shows fragmentation of the lead, the radiograph cannot depictthe spinal cord. Numerous small fragments of lead are identified with the arrows. (D) The MR shows that the lead does notcreate a magnetic susceptibility artifact and the spinal cord can be seen. The arrows point to a small osseous fragment that hasbeen created from the gunshot wound. The hyperintensity on this STIR sequence is hemorrhage and edema from the gunshotwound. (See Color Plates 1.10A–D.)
A B
Figure 1.11. (A) T1 fat-saturated postcontrast sagittal image. The very low signal intensity within the renal pelvis is due to thehigh concentration of gadolinium contrast agent that is being excreted by the urinary system. The concentration is so high thatinstead of being “enhanced,” it actually gets a low signal intensity with this high concentration. (B) T2-weighted sagittal imagefollowing the administration of contrast showing the same low signal intensity of the renal pelvis due to the high concentrationof gadolinium. This is also commonly seen in the urinary bladder and should not be mistaken for a lesion.

BLBS027-Gavin April 22, 2009 11:49
A B
Figure 1.12. Volume averaging artifact. (A) Sagittal T2 image. Dotted line (large white arrow) is the location of (B). Thesmallest white arrows depict the air-filled frontal sinus. The black arrows point to the periphery of the olfactory bulb of thecerebrum. (B) T2 transverse image. This image is the average of the signals from a 4 mm slice thickness, 2 mm on either side ofthe dotted line in (A). The smallest white arrows depict the air-filled frontal sinus. The black arrows point to the periphery ofthe olfactory bulb of the cerebrum. The larger white arrows indicate the volume averaging of the brain and frontal sinus in this4-mm-thick section.
A B
C D
Figure 1.13. Magic angle artifact. (A) Proton density fat-saturated image with hyperintensity in the biceps tendon (arrows).(B) T2 image of same slice as in (A) with normal intensity of the tendon (arrows). (C) Same image as (A) showing location of(D). (D) Transverse T2 image of the biceps tendon with uniform signal.
19

BLBS027-Gavin April 22, 2009 11:49
20 PHYSICS: ARTIFACTS
A B
Figure 1.14. Part (A) shows the lack of signal homogeneity due to cross-talk when multiple stacks intersect each other. Thiscommonly occurs at the lumbosacral area due to the change in the angulation. The transverse images should be perpendicularto the spinal canal. This can result in intersection between the images through the caudal lumbar area and those through thelumbosacral junction. The homogeneity of the signal can be seen in (B) where this problem was eliminated by a separate seriesof slices through the lumbosacral area with no intersection of neighboring slices.

BLBS027-Gavin April 22, 2009 11:49
SECTION 5
Equipment Consideration and Selection
Patrick R. Gavin
The main component of the magnetic resonance unitis obviously the magnet. The main magnetic field iscalled the B0 field. Within the magnet are gradient coilsneeded to produce a GE in the X, Y, and Z directions ora gradient in B0. Within the gradient coils are RF coilsthat provide the RF energy needed to rotate the nuclearspins by 90◦ or any other value selected by the sequence.The strength of the gradient coils determines the abilityof an MR unit to change the magnetic field per unitdistance. The strength of the gradient coils will havethe largest contribution to end-plane resolution. The RFcoil, besides an emitting RF coil, is also a receiving coilcapable of detecting the signal from the spins withinthe body.
Most modern magnets are self-shielded with an op-posing magnetic field such that they do not need to bemagnetically shielded. All magnets do, however, needto have some form of RF shielding. This shield not onlyprevents RF pulses from radiating out from the magnet,but also prevents RF signals from television, radio, cellphones, etc. from being detected by the imager.
MRI requires powerful computers since every com-ponent is under the control of the computer. The com-puter controls the shape and amplitude of the gradientfields, and the strength and duration of the RF pulses.The computer also provides the necessary method toconvert the received RF energy into an image.
The imaging magnet is the most expensive compo-nent. Permanent magnets are present as smaller fieldunits. These magnets must be pure and uniform. Per-manent magnets have the advantage of not requiringcryogens. They are heavy but their main drawbackis their field strength. Most higher field MR units aresuperconducting magnets. A superconducting magnetkeeps the temperature close to zero kelvin by immers-ing it in liquid helium. Once electrical current is initi-ated in the coil, it will continue so long as it is main-tained at this temperature. Liquid helium is at −269◦ Cor 4◦ above absolute zero. Large volumes of liquid he-lium are required, which is also costly with regard to
maintenance. In initial designs, the liquid helium wassurrounded by liquid nitrogen to decrease helium con-sumption. Currently, cryo-coolers are used to maintainthe liquid helium temperature and have eliminated theneed for liquid nitrogen. Early magnets required ap-proximately four refills per year of liquid helium. Cur-rent machines can be filled less than yearly and someevery ten years.
The gradient coils within the main magnet are fun-damental to image creation. While the “body coil” canbe used for a receiver coil, often specialized RF detectorcoils designed specifically for certain body areas are uti-lized to receive the image. There are numerous types ofcoils. Some of these are volume or quadrature coils withthe antenna coils running at right angles to each otherto better capture the signal. Other coils are linear coils.Linear coils are often flexible to allow for contouringof the coil to the patient. Circular coils are commonlyused for extremity work. The depth of penetration ofa circular coil is equal to its radius. One of the moreuseful coils for veterinary imaging is a multi-elementspine coil. Multiple element spine coils allow for theentire patient’s spine to be imaged without physicallyrepositioning the patient. This can greatly speed theimaging process while providing various fields of viewfor proper examination of the spinal column.
Safety
Safety is of critical importance with MRI. The safetyissues are related to dangers associated with ferromag-netic objects near the magnet. Ferromagnetic objectsthat are often forgotten include pagers, cell phones,hoof knives, scissors, and other sharp or heavy objects.Obviously, items such as ferrous oxygen tanks, stan-dard ECG machines, etc. can become flying, and poten-tially lethal, projectiles inside an MR suite. All person-nel entering an MRI suite should be given instructionson MR safety. Of special concern are those people that
21

BLBS027-Gavin April 22, 2009 11:49
22 PHYSICS: EQUIPMENT CONSIDERATION AND SELECTION
would rarely need to enter the suite, including mainte-nance personnel.
Some safety issues of extreme importance that aremuch less commonly experienced by veterinary ra-diologists deal with patients having pacemakers oraneurysmal clips being exposed to the magnetic field.This is less common in veterinary medicine; however,pacemakers are a definite contraindication. Typical or-thopedic appliances may cause an artifact, but do notcreate a hazard for the patient. Similarly, small objectsthat are ferrous, including BBs, “gold beads,” and steelshot used for water fowl hunting, all create large imag-ing artifacts but actually create no problem for the pa-tient. They will not become dislodged or move signifi-cantly within tissue, but will create a large artifact andmay prevent imaging in an area of interest. Similarly,
the small wire used in identification crystals can alsocreate an artifact. The veterinary profession will needto find a better site for implantation of these crystals,other than the neck of small dogs and cats, as the pop-ularity of MR continues. Cervical spinal studies can becompromised by these identification chips in small andtoy breeds. These chips must occasionally be removedto allow for proper evaluation of the study.
The amount of energy absorbed during an exami-nation is of concern. However, for the time utilized inveterinary imaging due to the anesthetic concerns, theamount of energy for MR studies has not been a prob-lem to date. If medically indicated and anesthesia con-cerns can be answered, there is no reason why pregnantpatients and neonates cannot be imaged with conven-tional MR units.