physiological and genetic diversity studies on
TRANSCRIPT

PHYSIOLOGICAL AND GENETIC DIVERSITY STUDIES ON REGENERATION OF
SANTALUM ALBUM L.
THESIS
SUBMITTED TO
COCHIN UNIVERSITY OF SCIENCE AND TECHNOLOGY
IN PARTIAL FULFILMENT OF THE DEGREE OF
DOCTOR OF PHILOSOPHY
IN ENVIRONMENTAL BIOTECHNOLOGY
UNDER THE FACULTY OF
ENVIRONMENTAL STUDIES
RAMYA. R
KERALA FOREST RESEARCH INSTITUTE
PEECHI, THRISSUR 680653, KERALA, INDIA
JULY 2010

CERTIFICATE
This is to certify that the thesis entitled, “PHYSIOLOGICAL AND GENETIC
DIVERSITY STUDIES ON REGENERATION OF SANTALUM ALBUM L.”
embodies the result of original work carried out by Ms. Ramya. R (Reg. No. 2701),
under our guidance and supervision. No part of this thesis has previously formed the
basis for the award of any degree, diploma, associateship or other similar titles of this or
other institutes or any University or Society.
Supervising Guide Cosupervising Guide
Dr. M. Balasundaran Dr. Jose Kallarackal Former Scientist F & Programme Coordinator Emeritus Scientist, CSIR Forest Genetics and Biotechnology Division Kerala Forest Research Institute Kerala Forest Research Institute Peechi680653, Thrissur, Kerala Peechi680653, Thrissur, Kerala

DECLARATION
I hereby declare that the thesis entitled “PHYSIOLOGICAL AND GENETIC
DIVERSITY STUDIES ON REGENERATION OF SANTALUM ALBUM L.”,
submitted for the degree of Doctor of Philosophy in Environmental Biotechnology
under the Faculty of Environmental Studies of Cochin University of Science and
Technology is my original work and has not previously formed the basis for the award
of any degree, diploma, associateship, fellowship or other similar titles or recognition.
Peechi
28072010 Ramya. R

ACKNOWLEDGEMENTS
I express my profound sense of gratitude to my Guide and teacher Dr. M. Balasundaran,
Former Scientist F and Programme Coordinator, FG & B Division, KFRI, for his efficient
guidance, constant encouragement, and support during the entire period of work at KFRI and
in the preparation of the thesis. I thank my CoGuide Dr. Jose Kallarackal, Emeritus Scientist,
CSIR, KFRI for his efficient guidance, valuable advice and support.
I thank Dr. R. V. Varma, former Chairman, Ph.D Programme Advisory Committee,
Dr. E. A. Jayson, present Chairman, Ph.D Programme Advisory Committee and Dr. K.
Swarupanandan, Research Coordinator for their support. I thank Dr. J. K. Sharma, former
Director and Dr. K. V. Sankaran, present Director KFRI for their support and for permitting me
to use the laboratory facilities of this Institute. My sincere thanks to Kerala State Council for
Science, Technology and Environment (KSCSTE) for the award of KSCSTE Research
Fellowship in Botany.
I thank Dr. T. B. Suma, Scientist, SCMS, Cochin for her valuable advice and support
during my work. I thank my colleagues Dr. Sreekanth. P. M, Dr. Mrs. Haseena. A, Mrs.
Anupama. C, Mr. Nishad, V. M, Mr. Arun Sebastian, Ms. Divya Varghese Pattath, Mrs. Arathy.
K, Mrs. Brinda, C. M, Mrs. Shilpa Mathew and Ms. Sheena. K. for their valuable help and
support. I thank all fellow coworkers at KFRI who have rendered their assistance and timely
help during the period of my work. I thank Mr. M. M. Roy for the help rendered to computerize
my thesis. I thank Mr. K. Mohandas, and Ms. T. G. Chandrika for their help and assistance
during the period of nursery studies at KFRI nursery. I especially thank Rev. Sr. Mary Ann, SIC,
Sisters and hostel mates at Bethany Convent, Vilanganoor, Peechi for their support and
prayers.
I indeed owe a lot to my husband and both of our families for their moral support, constant
encouragement and prayers. I bow before God, without his grace nothing would have been
possible.
Ramya. R

i
CONTENTS
LIST OF TABLES v
LIST OF FIGURES vii
ABBREVIATIONS x
1. INTRODUCTION 1
1.1. Sandal and its importance 1
1.2. Distribution of sandal 3
1.3. Studies conducted on sandal 4
1.4. Problems facing sandal growth 4
1.4.1. Lack of regeneration 4
1.4.2. Low seed setting in seed stands 5
1.4.3. Low seed germination and seedling mortality 6
1.4.4. Shade requirement 7
1.4.5. Host plant requirement 7
1.5. Objectives of the present study 8
2. REVIEW OF LITERATURE 9
2.1. Sandal and its importance 9
2.2. Major problems facing sandal 9
2.2.1. Lack of sandal regeneration 12
2.2.2. Loss of genetic diversity 12
2.2.3. Light/shade requirement at early seedling stage 13
2.2.4. Absence of appropriate host 14
2.2.5. Fungal disease and seedling mortality 14
2.2.6. Clonality and inbreeding in seed stand 14
2.3. Ecophysiology of host-parasite relationship 15
2.3.1. Parasitism 16
2.3.2. Host preference of parasites 16
2.3.3. Host influence on parasites 17
2.3.4. Santalum spp. and their host plants 18

ii
2.4. Shade requirement of seedlings 19
2.4.1. Seed reserves and seedling development 19
2.4.2. Chlorophyll fluorescence 21
2.4.3. Fv/Fm 22
2.4.4. Photoinhibition 24
2.5. Genetic diversity of trees 25
2.5.1. Methods of genetic diversity study 27
2.5.2. Randomly Amplified Polymorphic DNA 27
2.5.3. Inter Simple Sequence Repeats 28
2.5.4. Genetic diversity of sandal 30
2.6. Sandal seedling mortality and low germination percentage: genetic
diversity of Fusarium 31
2.6.1. The genus Fusarium 31
2.6.2. Diversity of fungal isolates and adaptability 33
2.6.3. Method of study of Fusarium diversity 33
3. AUTOTROPHIC AND PARASITIC PHASE OF SANDAL
SEEDLING GROWTH 36
3.1. Introduction 36
3.1.1. Host dependency of sandal plants 37
3.2. Materials and methods 38
3.2.1. Autotrophic phase of sandal seedlings 38
3.2.2. Host dependency of sandal plants 39
3.2.3. Sturdiness Quotient 40
3.2.4. Dickson Quality Index 40
3.2.5. Physiological measurements 41
3.2.6. Chlorophyll content estimation 42
3.3. Results 43
3.3.1. Autotrophic phase of sandal seedlings 43
3.3.2. Host dependency of sandal plants 43
3.3.3. Chlorophyll content estimation 52
3.4. Discussion 59
3.5. Conclusion 62

iii
4. EFFECT OF SHADE ON MORPHOLOGY, CHLOROPHYLL
CONCENTRATION AND CHLOROPHYLL FLUORESCENCE OF
SANDAL SEEDLINGS 63
4.1. Introduction 63
4.2. Materials and methods 64
4.2.1. Plant material 64
4.2.2. Shade treatments 65
4.2.3. Morphological measurements 66
4.2.4. Experimental design and statistical analysis 67
4.3. Results 67
4.4. Discussion 77
4.5. Conclusion 79
5. GENETIC DIVERSITY OF FUSARIUM OXYSPORUM Schlechtend
Fr ISOLATES CAUSING SANDAL SEEDLING WILT 80
5.1. Introduction 80
5.1.1. Fusarium wilt of sandal 80
5.1.2. Variability and spore formation in Fusarium 80
5.1.3. Genetic variability study of pathogenic fungi 81
5.1.4. Genetic variability of F. oxysporum 81
5.1.5. Objective of the present study 82
5.2. Materials and methods 82
5.2.1. Fungal isolates 82
5.2.2. Total genomic DNA extraction and purification 84
5.2.3. RAPD primers and PCR amplification 85
5.2.4. Data analysis 86
5.3. Results 87
5.4. Discussion 91
5.5. Conclusion 92
6. STUDIES ON GENETIC DIVERSITY OF SANDAL IN SEED STAND 93
6.1. Introduction 93
6.1.1. Establishment of seed stands 93
6.1.2. Poor seed setting in seed stand 94

iv
6.1.3. Importance of genetic diversity in seed stand 95
6.1.4. Clonality in sandal forests and its effect on seed production 95
6.1.5. Tools to study genetic diversity in natural forest and seed stands 95
6.1.6. ISSR marker as a tool to study genetic diversity 96
6.1.7. Objective of the present study 96
6.2. Materials and methods 96
6.2.1. Plant material 96
6.2.2. Genomic DNA extraction 99
6.2.3. ISSR primers and PCR amplification 100
6.2.4. Data analysis 101
6.3. Results 101
6.4. Discussion 108
6.5. Conclusion 109
7. SUMMARY 111
7.1. Autotrophic and parasitic phase of sandal seedling growth 112
7.2. Effects of shade on morphology, chlorophyll concentration and
chlorophyll fluorescence of sandal seedlings 113
7.3. Genetic diversity of Fusarium oxysporum Schlechtend Fr isolates
causing sandal seedling wilt 114
7.4. Studies on genetic diversity of sandal in seed stand 115
7.5. Conclusions 116
REFERENCES 118

v
LIST OF TABLES
Table No. Title Page
No.
Table 3.1. Autotrophic phase of nutrition during developmental stages of
sandal seedling after germination 43
Table 3.2. Final growth parameters of sandal plants with annual hosts
(mean ± SE) 45
Table 3.3 Final growth parameters of sandal plants with perennial hosts
(mean ± SE) 45
Table 3.4. ANOVA-Final growth parameters of sandal plants with annual
hosts 46
Table 3.5. Evaluation of annual host species’ growth based on root:shoot
ratio (mean ± SE) 47
Table 3.6. Evaluation of perennial host species’ growth based on
root:shoot ratio (mean ± SE) 47
Table 3.7. ANOVA - Evaluation of annual host species based on root
fresh weight, shoot fresh weight and root:shoot ratio 48
Table 3.8. Fv/Fm of sandal grown along with best annual hosts (mean ±
SE) 49
Table 3.9. Fv/Fm of sandal grown along with best perennial hosts (mean
± SE) 51
Table 3.10. Performance Index of sandal with and without annual host
plants (mean ± SE) 51
Table 3.11. Performance Index of sandal with perennial host plants (mean
± SE) 52
Table 3.12. Chlorophyll content of sandal leaves grown with two annual
host plants (mean ± SE) 52
Table 3.13. Chlorophyll content of sandal leaves grown with two perennial
host plants (mean ± SE) 52
Table 4.1.
Height (cm) of sandal seedlings under four shade treatments
monitored for six months from two months after germination
(mean ± SE)
68

vi
Table 4.2.
ANOVA-Height of sandal seedlings under four shade
treatments monitored for six months from two months after
germination
69
Table 4.3. Final morphological characteristics of sandal seedlings under
three shade treatments (mean ± SE) 69
Table 4.4. ANOVA-Final morphological characteristics of sandal
seedlings under three shade treatments 70
Table 4.5.
Mortality percentage of sandal seedlings under four shade
treatments monitored for six months from two months after
germination
71
Table 4.6.
Effect of shade on chlorophyll fluorescence (Fv/Fm) of four
shade treatments monitored for five months from three months
after germination
72
Table 4.7.
ANOVA-Variation in Fv/Fm under four shade treatments
monitored for five months from three months after
germination
73
Table 4.8.
Performance Index (PI) of sandal seedlings under four shade
treatments monitored for five months from three months after
germination
75
Table 4.9.
ANOVA-Variation in PI under four shade treatments
monitored for five months from three months after
germination
75
Table 4.10. Effect of shade on total chlorophyll content of sandal
seedlings under four shade treatments 76
Table 5.1. Primers used for RAPD analysis and their sequences 86
Table 5.2. Number of RAPD products from six isolates of F. oxysporum 90
Table 5.3. Nei’s (1978) genetic distance coefficients from six different
F. oxysporum isolates 90
Table 6.1. Girth of sandal trees growing in the experimental plots 99
Table 6.2. Primers used for the study and size range of amplicons
generated from S. album DNA 100
Table 6.3. Dice genetic similarity coefficients for 17 sandal trees in plot I 106
Table 6.4. Dice genetic similarity coefficients for 17 sandal trees in plot II 106

vii
LIST OF FIGURES
Figure No. Title Page
No.
Figure 3.1 Sandal seedlings grown in different potting media in root
trainers 39
Figure 3.2. Final growth parameters of sandal plants with different annual
hosts 44
Figure 3.3. Chart showing annual host species’ evaluation based on their
root:shoot ratio 48
Figure 3.4. DQI of sandal in association with annual hosts 49
Figure 3.5. Fv/Fm of sandal raised along with annual hosts 50
Figure 3.6. Typical fluorescent transients obtained from sandal plants
grown with annual and perennial hosts 50
Figure 3.7. Performance Index of sandal grown with best annual host
plants 51
Figure 3.8. Chlorophyll content analysis of sandal leaves grown along
with two annual host plants 53
Figure 3.9. Sandal with V. unguiculata 54
Figure 3.10. Roots of sandal and V. unguiculata showing haustorial
connection 54
Figure 3.11. Young sandal haustorium establishing connection with host
root 54
Figure 3.12. Sandal with O. sanctum 55
Figure 3.13. Roots of sandal and O. sanctum showing haustorial connection 55
Figure 3.14. Sandal with A. conyzoides 55
Figure 3.15. Roots of sandal and A. conyzoides showing haustorial
connection 55
Figure 3.16. Sandal with P. niruri 56
Figure 3.17. Roots of sandal and P. niruri showing haustorial connection 56
Figure 3.18. Sandal with L. hyssopifolia 56
Figure 3.19. Roots of sandal and L. hyssopifolia showing haustorial
connection 56
Figure 3.20. Sandal with V. cinerea 57
Figure 3.21. Roots of sandal and V. cinerea showing haustorial connection 57
Figure 3.22. Sandal with L. camara 57

viii
Figure 3.23. Roots of sandal and L. camara showing haustorial connection 57
Figure 3.24. Sandal with P. pinnata 58
Figure 3.25. Roots of sandal and P. pinnata showing haustorial connection 58
Figure 3.26 Sandal without host plant showing unhealthy growth 58
Figure 3.27. Stunted root growth of sandal 58
Figure 4.1. Sandal seedlings grown under shade net enclosures 65
Figure 4.2. Sandal seedlings under different shade intensity 66
Figure 4.3. Sandal seedlings under 100% sunlight 66
Figure 4.4. Height of sandal seedlings under four shade treatments
monitored for six months from two months after germination 68
Figure 4.5. Final morphological characteristics of sandal seedlings under
three shade treatments 70
Figure 4.6.
Percentage mortality of sandal seedlings under four shade
treatments monitored for six months from two months after
germination
71
Figure 4.7. Typical fluorescent transients obtained from three different
shade treatments in sandal seedlings at 7th
month 72
Figure 4.8. Variation in Fv/Fm under four shade treatments monitored for
five months from three months after germination 73
Figure 4.9. Monthly variation of Fv/Fm monitored for five months from
three months after germination 74
Figure 4.10. Variation in PI under four shade treatments monitored for five
months from three months after germination 76
Figure 4.11. Chlorophyll content variation under four different shade
treatments 76
Figure 5.1. Sandal seedlings showing typical symptoms of wilt caused by
F. oxysporum 84
Figure 5.2.
F. oxysporum isolates selected for RAPD analysis
Fo.P1, Fo.P2 and Fo.P3: Isolates from Peechi, Thrissur
Fo.M1, Fo. M2 and Fo.M3: Isolates from Marayur
85
Figure 5.3.
RAPD profile of six isolates of F. oxysporum obtained using
primers B1, B4 and B7. Lane 1: DNA marker (100 bp + 1.5 kb
DNA ladder, BIOENZYME, USA); lane 2: negative control,
lane 3-8: DNA profile using primer B1; lane 9-14: DNA
profile using primer B4; lane 15-20: DNA profile using primer
B7
88

ix
Figure 5.4.
RAPD profile of six isolates of F. oxysporum obtained using
primers B10, B11 and B14. Lane 1: DNA marker (100 bp +
1.5 kb DNA ladder, BIOENZYME, USA); lane 2: negative
control, lane 3-8: DNA profile using primer B10; lane 9-14:
DNA profile using primer B11; lane 15-20: DNA profile using
primer B14
89
Figure 5.5.
RAPD profile of six isolates of F. oxysporum obtained using
primers B15, D18 and D19. Lane 1: DNA marker (100 bp +
1.5 kb DNA ladder, BIOENZYME, USA); lane 2: negative
control, lane 3-8: DNA profile using primer B15; lane9-14:
DNA profile using primer D18; lane 15-20: DNA profile using
primer D19
89
Figure 5.6. UPGMA Dendrogram based on Simple Matching coefficients 90
Figure 6.1.
a & b
Sandal trees in clusters in the experimental plots in Marayur
seed stand 97
Figure 6.2.
a & b
Sandal tree positions in the experimental plots in Marayur
seed stand 98
Figure 6.3.
ISSR profile of sandal amplified by the primer UBC-836.
Lane 1 and 20: DNA marker (100 bp ladder); lane 2: negative
control; lanes 3-19: DNA profiles of 1-17 trees of plot I
103
Figure 6.4.
ISSR profile of sandal amplified by the primer UBC-836.
Lane 1 and 20: DNA marker (100 bp ladder); lane 2: negative
control; lanes 3-19: DNA profiles of 1-17 trees of plot II
103
Figure 6.5.
ISSR profile of sandal amplified by the primer UBC-841.
Lane 1 and 20: DNA marker (100 bp ladder); lane 2: negative
control; lanes 3-19: DNA profiles of 1-17 trees of plot I
104
Figure 6.6.
ISSR profile of sandal amplified by the primer UBC-841.
Lane 1 and 20: DNA marker (100 bp ladder); lane 2: negative
control; lanes 3-19: DNA profiles of 1-17 trees of plot II
104
Figure 6.7.
ISSR profile of sandal amplified by the primer UBC-807.
Lane 1 and 20: DNA marker (100 bp ladder); lane 2: negative
control; lanes 3-19: DNA profiles of 1-17 trees of plot I
105
Figure 6.8.
ISSR profile of sandal amplified by the primer UBC-807.
Lane 1 and 20: DNA marker (100 bp ladder); lane 2: negative
control; lanes 3-19: DNA profiles of 1-17 trees of plot II
105
Figure 6.9. UPGMA dendrogram based on Dice genetic similarity
coefficients of seventeen sandal trees of plot I 107
Figure 6.10. UPGMA dendrogram based on Dice genetic similarity
coefficients of seventeen sandal trees of plot II 107

x
ABBREVIATIONS
µM : micro molar
AFLP : Amplified Fragment Length Polymorphism
ANOVA : Analysis of Variance
bp : base pair
cc : cubic centimeter
Chl a : Chlorophyll a
CTAB : Cetyl Trimethyl Ammonium Bromide
DBH : Diameter at Breast Height
DNA : Deoxyribo Nucleic Acid
dNTP : deoxyribo Nucleotide Tri-Phosphate
DQI : Dickson Quality Index
EDTA : Ethylene Diamine Tetra Acetate
ELISA : Enzyme Linked Immunosorbant Assay
ETR : Electron Transport Rate
Fv : variable fluorescence
Fm : maximum fluorescence
Fo : minimal fluorescence
GIS : Geographic Information System
ha : hectare
HWE : Hardy-Weinberg Equilibrium
ICFRE : Indian Council of Forestry Research and
Education
IGS : Intergenic Spacer
ISSR : Inter Simple Sequence Repeat
ITS : Internal Transcribed Spacer
IUCN : International Union for
Conservation of Nature and Natural
Resources
KFRI : Kerala Forest Research Institute
kg : kilogram
m : meter
M : Molar
mg : milligram

xi
ml : millilitre
mM : milli molar
mm : millimeter
ms : millisecond
ng : nanogram
nM : nano molar
nrDNA : nuclear ribosomal DNA
NTSYS : Numerical Taxonomy system
ºC : degree celsius
PAR : Photosynthetically Active Radiation
PCR : Polymerase Chain Reaction
PDA : Potato Dextrose Agar
PI : Performance Index
PPB : Percentage of Polymorphic Bands
PS II : Photo System II
PTC : Peltier Thermal Cycler
PVPP : Poly Vinyl Poly Pyrrolidone
RAPD : Random Amplified Polymorphic DNA
RFLP : Restriction Fragment Length Polymorphism
RNase : Ribo Nuclease
rpm : revolutions per minute
rRNA : ribosomal Ribo Nucleic Acid
s : second
SAHN : Sequential Agglomerative Hierarchical and
Nested Clustering
SE : Standard Error
spp : species
SPSS : Statistical Package for Social Service
SQ : Sturdiness Quotient
SSR : Simple Sequence Repeat
TBE : Tris Borate EDTA
UPGMA : Unweighted Pair Group Method with
Arithmetic Averages
UV : Ultra Violet

CHAPTER 1
INTRODUCTION

1
1. INTRODUCTION
1.1. SANDAL AND ITS IMPORTANCE
Sandal, Santalum album L. is intimately associated with Indian culture and heritage
and is acclaimed as the most precious and valuable among Indian forest trees.
Sandalwood trees are the source of highly priced and fragrant heartwood, the ‘East
Indian Sandalwood’ which on steam distillation yields on an average 57% oil (Mc
Kinnell, 1990) of high perfumery value. The fixative property and tenacious aroma of
the oil are due to alpha and beta santalolsthe major odoriferous sesquiterpenic
components constituting 90 per cent of the oil (Shankaranarayana et al., 1998). The
heartwood is commercially important; the close grains make it highly amenable for
carving and fabricating exquisite handicraft items that are fragrant, elegant and largely
self protected from termites and wood borers (Srinivasan et al., 1992). Heartwood of
sandal is estimated to fetch up to Rs. 3.7 million/ton and wood oil Rs. 70,000
100,000/kg in the international market (Gairola et al., 2007). Sandalwood oil is in great demand for manufacture of perfumes, cosmetics, soaps and in ayurvedic and allopathic
systems of medicine (Srinivasan et al., 1992; Tandon, 1995).
S. album is an evergreen partial root parasite attaining 1015 m height and 12 m
girth at full maturity when it reaches the age of 6080 years (Ghosh et al., 1985, Jain et al., 1999). The tree flourishes well from sea level up to 1200 m altitude in regions with different soil types and varying climatic conditions and an annual precipitation of 600
1600 mm. Bark is reddish brown to dark brown in colour, smooth in young trees,
becoming rough with deep vertical fissures as the tree matures. Leaves are opposite,
decussate, flowers unscented, strawyellow coloured turning to deep purplish brown on
maturation and occurs in axillary or terminal cymose panicles. Flowering generally
occurs twice a year from March to May and September to December. The fruit is single
seeded succulent drupe, purplish black when mature (Srinivasan et al., 1992). Sandal is
a highly polymorphic species (Kulkarni, 1995). Morphological studies have shown that
the trees vary significantly in leaf length and width, colour of the heartwood and in oil
content (Kushalappa, 1983; Bagchi and Veerendra, 1985; Kulkarni, 1995). A study of

2
the anatomical characteristics viz; xylem cell diameter, epidermal thickness, cortex
width and number of vascular bundles have shown that there are genotypic differences
in sandal populations (Veerendra and Bagchi, 1986).
Natural regeneration occurs by means of seeds. Seeds are usually dispersed by
birds and normally take 4 to 8 weeks to germinate (Venkatesan, 1995). Seeds have a
post drop dormancy period up to 2 months due to their impermeable outer covering and
retain their viability for 6 to 12 months. Germination is hastened by soaking seeds in
0.05 per cent gibberellic acid. Soaked seeds are sown in germination trays filled with
vermiculite or with sieved sand and soil in 1:2 ratio. The germination media in trays
must be treated with nematicide and fungicide, periodically as a prophylactic measure.
Artificial regeneration is achieved by dibbling seeds in pits, sowing on mounds and
trenching around mother trees for wounding the roots for inducing root sucker
production. Planting nurseryraised, vegetatively multiplied and tissue cultureraised
seedlings are also carried out (Rai and Kulkarni, 1986). Vegetative propagation is
achieved through stem cuttings, grafting, air layering or through root suckers; but
rooting of stem cuttings has been achieved only in 1520 per cent of cuttings (Rao and
Srimathi, 1976; Uniyal et al., 1985; Balasundaran, 1998; Sanjaya et al., 1998).
Micropropagation through axillary shoot proliferation, somatic embryogenesis and
adventitious shoot induction has also been reported (Bapat et al, 1990; Bapat and Rao,
1999; Gairola et al., 2007).
A growing sandal tree under natural conditions can put up an increment of 1 kg of
heartwood/year and a girth of one cm/year (Venkatesan, 1980; Rai, 1990). The
heartwood and oil content vary with locality and from tree to tree, and increase with
girth and age of the tree. Oil percentage is higher in the heartwood of root as compared
to stem and hence the tree is invariably harvested by uprooting. Global demand for
sandalwood is about 50006000 tons/year and that of oil is 100 tons/year (Joshi and
Arun Kumar, 2007). Out of this, nearly 7080 per cent is met from Karnataka (Rao et
al., 2007). Market trend indicates that sandal heartwood prices have increased from Rs.
365/ton in 1900 to Rs. 6.5 lakhs/ton in 19992000 and to Rs. 37 lakhs/ton in 2007. India
has suffered a substantial decline in sandalwood production from 3176 tons/year during

3
196065 to 1500 tons/year in 199798, and to 500 tons/year in 2007 (Jain et al., 2003;
Gairola et al, 2007). Oil production has also declined from 60 tons/year during 1981
1994 to 4050 tons/year during 19992000 (Ananthapadmanabha, 2000).
1.2. DISTRIBUTION OF SANDAL
The genus Santalum is tropical in distribution, between latitude 30° North and 40°
South, from India in the West to Juan Fernandez Islands in the East and from Hawaiian
Archipelago in the North to New Zealand in the South (George, 1984; Srinivasan et al.,
1992). The economically important and widely distributed genus Santalum comprises of
16 species (Shea et al., 1998; Ansari et al., 2007) which are xylemtapping root
hemiparasites belonging to family Santalaceae. Santalum album L., due to its religious
significance and high santalol content is acclaimed as the most economically important
of all Santalum species (Srinivasan et al., 1992; Radomiljac et al., 1998b) and is the
sole species yielding high quality wood and oil (Jeeva et al., 1998). Sandal grows in a
wide range of temperature and soil types in tropical and subtropical areas of India, Sri
Lanka and Indonesia (Mc Comb and Jones, 1998). Four Santalum species are native to
Western Australia viz. S. spicatum (R. Br.) A. DC., S. acuminatum (R. Br.) A. DC., S.
murrayanum (Mitchell) C. Gardn. and S. lanceolatum R. Br. (Shea et al., 1998). Of all
the species, S. album has the highest oil content (57%) while S. spicatum (2%) and S.
lanceolatum (35%) yield poorly scented and low quality oil (Mc Kinnell, 1990 and
Applegate et al., 1990).
S. album is indigenous to peninsular India and is naturally distributed over 9600
km 2 (Srinivasan et al., 1992; Radomiljac et al., 1998b) from Kerala in the South to Uttar
Pradesh in the North, in regions with varying ecoclimatic conditions and edaphic factors
(Jain et al., 1998). In Kerala, Sandal is spread over 15 km 2 mainly in Marayur in Idukki
district, Wayanad district and Thenmalai in Kollam district (Srimathi et al., 1995). Over
90 per cent of sandal is distributed in Karnataka (5245 km 2 ) and Tamil Nadu (3045
km 2 ), rest in Andhra Pradesh (175 km 2 ), Orissa (35 km 2 ), Madhya Pradesh (33 km 2 ) and
Maharashtra (84 km 2 ) (Jeeva et al., 1998).

4
1.3. STUDIES CONDUCTED ON SANDAL
Institute of Wood Science and Technology (IWST) has identified 9 potential
sandalwood provenances across the country on the basis of population density, phenotypic characters, latitude and longitude. These provenances are Bangalore,
Tangali and Mandagadde from Karnataka, Chitteri and Javadi hills from Tamil Nadu, Marayur from Kerala, Koraput from Orissa, Seoni from Madhya Pradesh and Horesly
Hills (Chittoor East) from Andhra Pradesh (Jain et al., 1998).
In sandal, most of the earlier work was focused on sandal spike disease, its causes
and control. Thomas and Balasundaran (1999) have developed Sandal Spike Phytoplasma Purification Kit and Immuno Detection Kit for purifying sandal spike
phytoplasma and detecting the pathogen in sandal. They used PCRRFLP technique to confirm the identity of sandal spike phytoplasma as belonging to group I of the eleven
major phytoplasma groups. Indirect ELISA tests had also been developed for early detection of spike disease before symptom expression (Thomas and Balasundaran, 2001).
Genetic variation of sandal had been a subject of study by a few investigators.
Brand (1994) investigated the genetic diversity in 10 West Timor and two Indian
populations of sandal using 23 enzyme systems and found that West Timor and Indian
populations are genetically well separated. The genetic diversity among Indian populations and provenances have been documented through isozyme and RAPD
studies (Angadi et al., 2003; Sashidhara et al., 2003; Suma and Balasundaran, 2003, 2004; Rao et al., 2007). The diversity was large among provenances probably because of their geographic isolation but it was very low within provenances probably due to inbreeding caused by genetic erosion.
1.4. PROBLEMS FACING SANDAL GROWTH
1.4.1. Lack of regeneration
Depletion of sandal resources can be attributed to several factors, both natural and anthropogenic. Hurdles to natural regeneration of sandal in forests include recurrent annual fires in natural sandal areas, lopping of trees for fodder, excessive grazing, hacking, encroachments and spread of sandal spike disease (Venkatesan and Srimathi, 1981).

5
While these factors hinder regeneration in forest areas and diminish the growing stock, the situation is accelerated by human activities of chronic overexploitation and illicit felling.
1.4.2. Low seed setting in seed stands
Sandal is predominantly an out breeding species (Sindhuveerendra and
Ananthapadmanabha, 1996). The seeds are produced twice a year and are capable of
self regeneration (Srinivasan et al., 1992). Seeds from various seed sources exhibit significant variation morphologically and physiologically. Presence of genotypic
barriers for embryo development has resulted in lower percentage of mature fruits in
spite of good percentage of fruit initiation (Sindhuveerendra et al., 1999). The tendency for out breeding in sandal is reinforced by asynchronous flowering, insect pollination,
heterostyly and selfincompatibility (Kulkarni and Muniyamma, 1998).
Alternatively, S. album regenerates asexually by means of root suckers. Root suckers generally originate as shoot primordia from injured or severed roots and are confined to
an area around the mother tree. Studies have shown that natural stands of sandal in Sri
Lanka have spread clonally by prolific root suckering (Tennakoon et al., 2000). Recruitment by root suckering has been observed to be the sole method of increase in
population size in seven remnant populations of S. lanceolatum in Victoria (Trueman et al., 2001). Though the trees flowered, little or no fruit production occurred within these small populations. Allozyme and RAPD analysis of the populations showed that sexual
reproduction had not been contributing to recruitment. Each population appeared to exist as
a clone composed of numerous ramets of a single genotype formed through asexual
reproduction by root suckering. Lack of seedling recruitment in remnant populations of
S. lanceolatum was partly explained by pollenpistil incompatibility and pistil dysfunction which is expected in a cross pollinated species. Clonality may also be due
to the past management practices and/or disturbances triggering asexual reproduction.
A parallel situation has happened in one of the seed stands in Marayur. Two seed
stands had been established in Nachivayal Reserve II during 19801981. Recently it has
been reported that expected quantity of seeds are unavailable from these seed stands.
Trees were seen growing in groups or clusters. Most of the sandal trees within the
clusters flowered profusely, but seed setting was extremely poor. As sandal is a cross

6
pollinated plant, fruit setting and seed formation will take place usually when
pollination and fertilization take place between genetically unrelated genotypes. Failure
to develop mature seeds may occur due to unsuccessful pollination and fertilization,
pathogenic infection of developing fruits, premature flower and fruit fall, etc. But such
major problems were not observed. Since root sucker induction had been adopted as a
method of sandal regeneration for the last few decades in Marayur and the seed stand in
particular, we investigated the genetic profile of trees in samples plots in order to find
out whether clonality existed in the seed stand.
1.4.3. Low seed germination and seedling mortality
Seeds are obtained by removing the fleshy portion of the fruit. Seeds vary in their
size and shape. Under normal conditions they retain their viability upto six months and
then gradually diminish. Fresh seeds exhibit dormancy for 2 months (Sreenivasan et al., 1992). Pathogen infection, rabbit and rodent menace, grazing by animals, high
atmospheric temperature and excessive moisture content are the factors which
considerably reduce the survival of seedlings (Bapat and Rao, 1998). Sandalwood
seedlings and grafted plants are prone to attack from insect pests and diseases, which
take a heavy toll and sometimes wipe off the whole stock. Damping off, vascular wilt,
web blight, stem infection and seedling blight caused by Fusarium oxysporum, Phytophthora, Pythium and Rhizoctonia are the most serious diseases that cause severe damage and economic loss in nurseries (Remadevi et al., 2005; Ramalaksmi and
Rathore, 2007). Among these F. oxysporum is the most serious pathogen which affects seedlings in nurseries as well as in natural forests.
Seedling mortality caused by F. oxysporum affects sandal at various stages causing preemergence damping off, collar rot, stem and root infection. The disease has been reported from Karnataka and Tamil Nadu (Remadevi et al., 2005) and throughout Kerala including high altitude areas such as Marayur. F. oxysporum, a common soil borne fungus with a worldwide distribution, has no known sexual stage. This organism probably causes more economic damage in nurseries than any other plant pathogen. Fusarium has been shown to constitute as much as 8090 per cent of the total fungal microflora in the rhizosphere of several agricultural crops and is responsible for wilt and cortical rot

7
diseases of more than 100 economically important host plants (Swifty, 2002). Wide variability exists in the pathogenicity of the fungal isolates from different geographical
regions. In Fusarium species, various formae speciales (f. sp) and physiological races are known. Though, sexual stage of the fungus has not been reported so far, the isolates show wide variability and this variability of the pathogen has been considered as the cause of its adaptability and virulence. The genetic diversity of F. oxysporum which may be the reason for its wide spread occurrence and virulence has not been studied so far. Information on the variability of the fungus is necessary for planning its management through the application of appropriate fungicide and also for prophylactic treatment.
1.4.4. Shade requirement
In the early stages of seedling development, sandal derives nutrition from the
relatively large seed reserves and later, the formation of host attachment through root connection becomes critical for seedling survival and growth (Barrett and Fox, 1997). The duration of dependency on the kernel as the food source needs to be studied. Sandal is a sciophile in the seedling stage, becomes more heliophilic once established. Full sun light is detrimental to the survival of sandal germinants and they need to be grown in greenhouse, shade house or in a shady area. So the level of shade is important for seedling growth. Early growth of sandal after seed germination is found to be better in the shades of bushes and clumps of vegetation (Rao, 1942; Fox et al, 1994b). Fox et al. (1994b) have shown that some shade is beneficial for the first three years; the length of time for optimum benefit has not yet been elucidated.
1.4.5. Host plant requirement
Sandalwood, being a hemiroot parasitic tree, root connection with a host species is required for nutrition to young plants as well as to the adult trees (Rao, 1942; Fox et al., 1994a; Fox et al., 1994b). Additionally, host plants can also provide shade required for the healthy growth of seedlings. Sandal benefits from a primary host at the nursery stage and from a secondary host (long term) in the field (Srinivasan et al., 1992; Barrett and Fox, 1995; Fox et al., 1996; Radomiljac et al., 1998a; Fox, 2000). Early nursery growth is found to be more rapid and secure when grown with a pot host which functions both

8
in plant nutrition and water relations of sandal and reduces outplanting stress when transferred to the field (Fox, 2000). Poor growth without a primary host even after
application of supplementary nutrition has revealed that a pot host is important for healthy and robust development of sandal. So also successful, establishment of sandal seedlings in plantations requires the utilisation of appropriate pot host (Radomiljac et al., 1998b; Luong, 2002). This feature has contributed to low regeneration, both naturally and artificially (Radomiljac, 1994).
1.5. OBJECTIVES OF THE PRESENT STUDY
Deterioration of natural sandal populations due to illicit felling, encroachments and diseases have an adverse effect on genetic diversity of the species. The loss of genetic diversity has aggravated during recent years due to extensive logging and changing landuse patterns and poor natural regeneration of sandal. The consequent genetic erosion is of serious concern affecting tree improvement programme in sandal. Conservation as well as mass propagation are the two strategies to be given due importance. To initiate any conservation programme precise knowledge of the factors
influencing regeneration and survival of the species is essential. Hence the major objectives of the present study are:
(i) Investigation on the impact of host plant root connection on seedling growth and
survival.
(ii) Investigation on the impact of shade on photosynthetically active radiation (PAR)
and chlorophyll content.
(iii) Investigation on high seedling mortality caused by fungal infection identification
of the fungus causing the disease and genetic diversity of the fungal pathogen using
RAPD marker.
(iv) Investigation on low seed setting in Marayur seed stand ISSR marker study of
sandal seed stand for estimating genetic diversity.
The thesis is organised into six chapters, Introduction, Review of Literature and
four chapters dealing with the four major objectives. This is followed by a chapter on
summary and conclusions and a common chapter for Reference.

CHAPTER 2
REVIEW OF LITERATURE

9
2. REVIEW OF LITERATURE
2.1. SANDAL AND ITS IMPORTANCE
Sandal has been intimately associated with human civilisation since time
immemorial. Extensive studies have indicated that S. album is the sole species yielding high quality sandalwood and oil. A few other species of Santalum and four other genera also yield fairly scented wood oil, but the quality of S. album oil and wood is superior
(Srinivasan et al., 1992). Sandalwood (heartwood) is immune to termite attack and wood borers; it is one of the finest woods for carving and ranks only next to ivory. Its
smoothness, uniform fibers, straight close grains and knots lend it to intricate
workmanship (Dey, 2001). The sapwood and sometimes the mixed woods are used for
manufacturing joss sticks. Sandal is highly valued for its fragrant heartwood which
yields oil preferred for perfumeries, cosmetics and medicines (Sanjaya et al., 1998). The
oil is present in the heartwood and roots, and hence the tree is invariably harvested by
uprooting for oil extraction (Bapat and Rao, 1992). Indian sandalwood oil has a
characteristic sweet, woody odour for which it is widely employed in the fragrance
industry, more particularly in the higherpriced perfumes. It has excellent blending
properties and the presence of a large proportion of highboiling constituents in the oil
(about 90 per cent Santalols) makes it valuable as a fixative for other fragrances. In
India, it is used for the manufacture of traditional attars such as rose attar; the delicate
floral oils are distilled directly into sandalwood oil. Sandalwood oil has antipyretic,
antiseptic, antiscabetic, and diuretic properties. It is also effective in the treatment of
bronchitis, cystitis, and dysuria (Gairola et al., 2007).
2.2. MAJOR PROBLEMS FACING SANDAL
Most of the existing sandal populations are not dense. They are devoid of large
girth class trees due to illicit felling, hacking, forest fire and encroachments (Parthiban et al., 1998). The sandal area is declining drastically due to over exploitation, poor seed germination, poor regeneration and failure of artificial regeneration (Jeeva et al., 1998).
Though seed germination is generally profuse, population density is poor due to abiotic

10
and biotic interferences. In view of the high price it fetches, live sandal trees in their
endemic habitats have been ruthlessly felled and removed by smugglers. These
activities have selectively removed trees possessing large dimensions and quality
heartwood, resulting in narrowing of the gene pool leaving population of trees with
mostly sapwood. The magnitude of illicit removals has been so intense that sandal has
now been enlisted as a ‘vulnerable’ species by IUCN (IUCN, 2010). Extensive
extraction of heartwood has severely decimated the natural stands of the tree in the
forests and has rendered many populations fragmented (Nageswara Rao et al., 2007). Since much of the sandal wealth and natural sandal bearing areas have been lost, the
remaining sandal trees are to be protected effectively and natural sandal bearing areas
are to be preserved (Swaminathan et al., 1998).
In the early stages of seedling development sandal derives nutrition from the
relatively large seed reserves and later, the formation of host attachment becomes
critical for seedling survival and growth (Barrett and Fox, 1997). The selection of
appropriate hosts is vital to ensure successful sandal plantation establishment
(Radomiljac, 2000). Failure of regeneration efforts is one of the main causes of sandal
depletion. Failure of artificial regeneration is due to poor understanding of the host
parasite relationship and edaphic factors (Surendran et al., 1998). The hemiparasitic
nature of sandal is not fully understood and silvicultural techniques to establish it are
not fully known.
Spike disease is the most widespread and destructive disease of the species which
has attracted world wide attention. Infected trees die within one to two years after the
appearance of disease symptoms which is characterised by extreme reduction in the size
of leaves and internodes accompanied by stiffening of the leaves. In advanced stage,
owing to the progressive reduction in leaf size and internodes, the whole shoot looks
like a ‘spike inflorescence’. Spiked plants do not bear any flowers or fruits;
occasionally, only phylloid or abortive flowers are developed. The disease is caused by
nonculturable phytoplasmas which are pleomorphic and fragile organisms multiplying
within the sieve tubes (phloem) of leaves, petioles, stem and root causing symptoms as
yellowing of leaf, little leaf and phyllody. The pathogen is around 0.4 to 1.0 µm in
diameter, has a cell membrane, ribosomes and DNA. Because of the absence of cell

11
wall, the mycoplasmas are pleomorphic and can pass through pores as small as 220 nm
(Thomas and Balasundaran, 2001).
Sandal reserves in Marayur Forest Division of Kerala were considered to be free
from spike disease till Ghosh et al. (1985) reported the widespread occurence of the disease in the sandal reserve 51. It was found that a large number of trees were affected
with typical spike disease. Staining techniques had been developed for the detection of
sandal spike phytoplasma. Sandal Spike Phytoplasma Purification Kit and Immuno
Detection Kit were used for purifying sandal spike phytoplasma and detecting the
pathogen in sandal. For PCR detection of phytoplasma, oligonucleotide primers specific
to the conserved region of 16S rRNA gene were used to amplify a 558 bp sequence of
the phytoplasma. Four DNA fragments were obtained when the PCR products obtained
after 20 cycles of amplification were subjected to restriction fragment length
polymorphism analysis (RFLP) with AluI restriction endonuclease. This technique confirmed that sandal spike phytoplasma belonged to group I of the eleven major
phytoplasma groups (Thomas and Balasundaran, 1999). Indirect ELISA tests have
helped in the early detection of spike disease (Thomas and Balasundaran, 2001).
Sandalwood seedlings and grafted plants face problems from insect pests and
diseases, which take a heavy toll and sometimes the whole stock is wiped off. Fusarium oxysporum, Rhizoctonia, Phytophthora spp. and Pythium spp. cause serious damping off and wilting of sandal seedlings (Remadevi et al., 2005). Mortality of seedlings due
to preemergence and postemergence damping off, root rot, and wilting of older
seedlings were recorded. Asochyta santali, Macrophomina phaseoli, Asterina congesta and Sphaecelomia santali are the most common fungi causing leaf spot disease
(Sreenivasan et al., 1992).
More than 150 insects are known to occur on S. album, but only a few have been
recorded as serious pests of economic importance. Sandal seedlings in nursery are
attacked by defoliators and sap suckers. Defoliators such as Cryptothelea cramerii Westwood cuts off the young seedlings at ground level. A weevil, Sympiezomias
cretaceous Faust feeds on the leaves. Nymphs of Holochora albida Kirby, Letana inflata Brunner and Teratodes monticollis Gray gnaw tender shoots of sandalwood

12
seedlings. Bagworms Acanthopsyche moorei Heyl and Pteroma plagiophleps Hampson
defoliate young sandalwood seedlings giving a burnt appearance. Two species of
coccids Saisettia coffeae and Saisettia nigra cause wilting and yellowing of leaves of sandal seedlings in nursery. Two coccids Pulvinaria psidii Mask and Pulvinaria
maxima Green infest sandal seedlings causing premature leaf fall (Remadevi et al., 2005). Lac insect Tachardia lacca Kerr has been observed on nursery plants and seedlings along with severe attack on mature sandal trees.
2.2.1. Lack of sandal regeneration
In India, though sandal is distributed all over the country, nearly 90 per cent of its
natural production is in Karnataka and Tamil Nadu and to some extent in Kerala and
Andhra Pradesh. Until 2002, state governments had monopoly control over all sandal
resources including those on private land. But, this monopoly has neither deterred
illegal and indiscriminate felling by smugglers and poachers nor has it helped conserve
the species in its natural habitat (Viswanath et al., 2007). Sandalwood smuggling is the
major problem in all the states where sandal grows (Rao et al., 1999). Most of the
sandal populations are devoid of larger girth class trees due to selective illicit felling and
other biotic interferences. Owing to such dysgenic selection perpetrated by the
smugglers, the existing population comprises mostly of inferior trees causing genetic
erosion (Venkatesan, 1995; Parthiban et al., 1998). Uma Shankar et al. (2000) reported decline in the genetic diversity of natural population of sandal due to indiscriminate
extraction. Jeeva et al. (1998) also reported drastic decline due to over exploitation, poor seed germination, and failure of natural and artificial regeneration. Extensive
extraction of heartwood has severely decimated the natural stands in the forests and
rendered many populations fragmented (Rao et al., 2007).
2.2.2. Loss of genetic diversity
Genetic diversity is a necessary prerequisite for long term survival and adaptability
(Young et al., 2000; Bahuguna, 2007). The most serious consequence of depletion of
genetic diversity is genetic erosion followed by extinction of species (Kemp et al., 1993). Hence, the magnitude and distribution of population genetic diversity are the

13
most fundamental piece of information required for proper genetic management of
species (Brown, 1978). Genetic diversity in sandal is imperilled owing to the wanton
felling perpetrated by smugglers and also due to the destruction caused by spike disease
(Muthana, 1995).
Reduction in sandal wealth and its genetic erosion is a global phenomenon.
Reduction in S. album population in West Timor, the second largest population after
India has been attributed to low viability (low germination %) of sandalwood seeds due
to inbreeding depression (Setiadi and Komar, 2001). Assessment on the genetic
structure and clonality within five southernmost populations of S. lanceolatum at
Victoria in Australia using allozymes and RAPD analyses has shown that asexual
reproduction by root suckering alone was responsible for the increase in the population
size (Trueman et al., 2001). Natural regeneration of S. spicatum has been reported to be
poor in Western and Southern Australia due to habitat fragmentation, parasitic nature of
sandal, grazing and poor seed dispersal (Murphy and Garkaklis, 2003).
2.2.3. Light/shade requirement at early seedling stage
Among the main environmental factors, light is perhaps the most influential factor
involved in the survival, growth and reproduction of tropical species. Light responses
usually provoke physiological alterations, which are determinants for CO2 assimilation
and optimization of gas exchange (Sands, 1995). Light availability is the primary
limiting factor of seedling growth, as demonstrated in several experiments carried out
after controlling nutrients and water supply, but with light availability (Kitajima, 1992a;
Kitajima, 1996). Despite the necessity of light for autotrophic organisms, no plant is
capable of using 100 per cent of maximum solar irradiation for photosynthesis
(Demmig et al., 1997). Environments that are either too much shaded or under full sunlight can inhibit the photosynthetic process (Zhang et al., 2003). When irradiance
exceeds the normal level that can be used for photochemistry, protective mechanisms
have to be used to dissipate excess excitation energy to avoid damage to plant tissues.
Too much of light causes damage to the photosynthetic apparatus by means of
photoinhibition. Hence, the optimum amount of shade required for the healthy growth
of sandal seedlings need to be evaluated.

14
2.2.4. Absence of appropriate host
Intriguingly, despite the large host range of the majority of parasitic plants, many of
them also show high level of host preference. Impact of hosts on parasite communities
not only depend on what is parasitised but also when parasitism occurs. Being a hemi
parasite the silvicultural requirements of sandal are unique and there is no adequate
understanding of the same. Its regeneration and establishment has been problematic
because of the poor knowledge of hostparasite relationships (Surendran et al., 1998). So, an understanding of the complementary and competitive influence of the host plant
on sandal is necessary for growing sandal successfully. Proper selection of host species
to give maximum benefit to sandal is critical for establishing economically viable
sandal plantations (Radomiljac et al., 1999).
2.2.5. Fungal disease and seedling mortality
Fungal pathogens are also unique among plant pathogens in being able to breach
the plant surface directly, utilizing a number of biochemical and morphogenetic
mechanisms in order to penetrate host tissues. For this reason, their control is of great
significance to the agricultural and forest economy (Talbot, 1998). As suggested by the
theory of adaptive polymorphism (Hunter and Fraser, 1990), genetic diversity is likely
to enhance the ability of a species to survive in a wider variety of environmental
conditions. Studying the mechanisms of pathogenicity and extent of genetic variation in
plant pathogens is therefore critical for the future control of fungal disease.
2.2.6. Clonality and inbreeding in seed stand
Seed stands are highly relevant since they assure immediate availability of adequate
quantities of seeds. Knowledge of genetic variation within and between the seed stands
is crucial for adopting proper seed management in the seed production areas and in tree
improvement programmes (Jagadish et al., 2007; Sreekanth, 2009). Two seed stands had been established in Nachivayal reserve now coming under Marayur Sandal Division
during 198081. But, recently it has been reported that expected quantity of seeds are
unavailable from these seed stands. Most of the sandal trees flower profusely, but they

15
do not set seeds. As sandal is a cross pollinated plant, fruit setting and seed formation
will take place usually if pollination and fertilization take place between genetically
unrelated genotypes. Lack of seeds has been reported from Santalum yasi trees in Fiji (Jiko, 2000). Trueman et al. (2001) observed lack of fruit and seed production in
remnant populations of S. lanceolatum in Victoria due to clonality. Though, failure to develop mature seeds may occur due to unsuccessful pollination and fertilization,
pathogenic infection of developing fruits, premature flower and fruit fall, etc., such
major problems did not come to our notice. Hence the genetic diversity of sandal seed
stand was analysed using ISSR marker.
Fragmented populations can also exhibit disturbed pollination as a result of
restricted pollinator movement, inadequate flowering for pollinator attraction and
insufficient quantity of pollen or incompatible pollen (Byers, 1995; Oostermeijer et al.,
1996). Poor fruit set has been observed in S. lanceolatum resulting in poor pollen deposition due to limited pollinator visitation (Cindy et al., 2000). Sexual reproductive failure in remnant selfincompatible populations poses a threat to persistence (Holsinger
and Vitt, 1997) and small populations may be particularly susceptible to catastrophic
events or losses of habitat quality (Cropper, 1993; Oostermeijer et al., 1996).
2.3. ECOPHYSIOLOGY OF HOSTPARASITE RELATIONSHIP
Parasitic plants are a diverse group accounting for 1 per cent of angiosperm species
(about 4000 species) within 270 genera and more than 20 families. They are common in
many natural and seminatural ecosystems from tropical rain forests to the high Artic
(Musselman and Press, 1998; Nickrent and Duff, 1996). They occur in many life forms,
including annual and perennial herbs (e.g. Rhinanthus spp. and Bartsia spp.), vines (e.g. Cuscuta spp. and Cassytha spp.), shrubs (e.g. Olax spp. and mistletoes) and trees (sandalwoods) (Malcolm and Gareth, 2005). Parasitism is a successful mode of life in
many flowering plants (Knutson, 1983; Musselman and Press, 1998) and it has evolved
on at least seven separate occasions.
Generally, parasitism reduces host productivity and/or reproductive effort, as has
been extensively documented for both root parasites and shoot parasites (Malcolm and

16
Gareth, 2005). The acquisition of host resources can exert strong effects on host growth,
allometry, reproduction and physiology which lead to changes in competitive balances
between host and nonhost species and therefore affect community structure, vegetative
zonation and population dynamics (Press et al., 1999).
2.3.1. Parasitism
The major characteristic of these plants is that during a part of their life cycle, they
depend on the host plant for some or all of their nutrients. Two types of parasitic
relationships exist: holoparasitic (obligate parasites) and hemiparasitic (facultative
parasites). Holoparasites are totally dependent on their hosts for nutrition, since they
possess no chlorophyll or capacity to assimilate carbon and inorganic nitrogen.
Hemiparasites such as sandal are not totally nutritionally dependent on their hosts, since
they possess chlorophyll, but require water, minerals and physical support from their
host at varying levels depending upon the species. They acquire some or all of their
water, carbon and nutrients via the vascular tissue of the host’s roots or shoots. They
access their host resources through a key organ called the haustorium, which provides a
physical as well as a physiological bridge between the parasite and the host, directing
the host’s resources to the parasite and functioning at multiple stages in the parasitism
(Kuijt, 1969). A broad diversity is found in the internal structure of the haustoria
belonging to different parasitic plant species. The morphology of the haustorium is
directly related to access host resources through either direct vascular continuity,
interfacial parenchyma, or a combination of both. Futhermore, there is variability in the
extent to which different nutrients and solutes are obtained by parasitic plants (Pate et al., 1990b).
2.3.2. Host preference of parasites
Intriguingly, despite the large host range of the majority of parasitic plants, many
also show high levels of host preference. Impact of hosts on parasite communities not
only depend on what is parasitised but also when parasitism occurs. Studies have shown
that both root and shoot parasites often prefer hosts with a high nitrogen content, such
as legumes (Matthies, 1997; Radomiljac et al., 1999), or hosts that have readily

17
accessible vascular systems (Kelly et al., 1988) and/or lower defence capacity
(Cameron, 2004). Hosts may also be preferred if they are available as a resource for
longer period for e.g. a preference for woody perennials over herbaceous annuals (Kelly et al., 1988) or if they have ready access to limiting resources for e.g. a preference for
deep rooted hosts with access to the water table during drought (Pate et al., 1990a). Cuscuta shows greater biomass and reproduction within patches of preferred/good hosts (Kelly et al., 1988; Kelly, 1990). Host preference may also depend on the diversity of
potential hosts available; mistletoes of Loranthaceae show a low host preference in
heterogeneous tropical rain forests and high host preference in less diverse temperate
forests.
2.3.3. Host influence on parasites
Greater abundance and/or performance of preferred hosts will enhance the
performance (growth and reproduction) of the parasite. Root hemiparasites are
particularly common in grassland ecosystems because grasses are often preferred hosts,
having abundant root systems (i.e. easy to locate) and fine roots that are easy to
penetrate. The uptake of host alkaloids by roothemiparasitic Orobanchaceae has been
well documented and reductions in herbivory or herbivore performance when feeding
on the alkaloid acquiring parasites have been observed (Marko and Stermitz, 1997).
Loveys et al. (2001) observed that fruits of the root hemiparasite, Santalum acuminatum (the quandong) contained a natural insecticidal compound acquired from neighbouring
Melia azadirachta hosts. The uptake of such compounds from the host was proposed to be beneficial because a bioassay using the apple moth (Epiphyas postvittana) showed that its larvae suffered high mortality on feeding on fruits of S. acuminatum growing
near Melia hosts. This also explains the observation of commercial growers that Santalum growing near Melia have fruits that suffer less insect attack. In addition to such direct benefits, the parasite may also gain indirect benefits from uptake of
secondary metabolites. In the case of Castilleja endivisa, Adler (2000) observed that the root hemiparasite not only gained from reduced herbivory by insect larvae when
acquiring alkaloids from ‘bitter’ lupine hosts, but the reduced herbivory of floral parts
increased the visitation by humming bird pollinators.

18
2.3.4. Santalum spp. and their host plants
Just as in the case of other root hemiparasites, sandalwood is partly dependent on
host species for water and nutrients, with leguminous hosts being generally better
sources of nitrogen than other species (Tennakoon et al. 1997). Host selection is the single most important silvicultural parameter influencing S. album plantation establishment (Radomiljac, 1994). Studies on xylem transfer of organic solutes between
Santalum acuminatum (R. Br.) A. DC. and their respective host plants have shown that substantial differences in amino acid, sugar and organic acid composition of the xylem
stream of the parasite occurs when associated with different host species. Such
differences have been used alongside parasite growth data to explain why some hosts
are markedly superior to others in terms of overall benefit to the parasite (Radomiljac et al., 1998a). Moreover studies by Tennakoon and Pate (1998) on the biological and
physiological aspects of the woody root hemiparasite S. acuminatum and its common hosts have shown that haustoria of S. acuminatum function as major sites of synthesis and export of proline, and might therefore play an important role in osmotic adjustment
of S. acuminatum in acquiring water from hosts under differing levels of stress. In S. spicatum, lack of certain nutrients, or insufficient uptake via host attachments was associated with increased leaf fall (Fox and Barrett, 1994).
Radomiljac (1994) has found pot host species Alternanthera nana and Sesbania formosa to be best as hosts to S. album in plantation establishment at Ord River
Irrigation area, Western Australia. Successful haustorial formation is the key to the
survival of the individuals of the ecologically important plant S. album (Tennakoon and Cameron, 2006). Anatomically, the haustorium of S. album resembles that of Olax (Pate
et al., 1990b; and Tennakoon and Pate, 1997) and Osyris (Niranjana and Shivamurthy, 1987) in possessing an endophyte which spreads laterally around the surface of the host
xylem. The primary host Cajanus cajan as an effective species for nourishing sandal in
nursery has been reported by many authors like Subbarao et al. (1990) and Taide et al. (1994). But Annapurna et al. (2007) has reported that C. cajan as a traditional primary host has several disadvantages, such as its fast growth, high level of competiton with
sandal seedlings for light and nutrients, susceptibility to fungal attacks, insect pests and
also the requirement for intensive management.

19
The selection of appropriate pot host species is critical to ensure high levels of S.
album field survival and growth. Like all autophytes, S. album posseses leaf chlorophyll and is able to synthesise carbohydrates. Generally, parasitic plants are smaller in size
than their hosts, such as the herbaceous root parasite Rhinanthus serotinus. However, S.
album has a large tree habit and, therefore the host is not the sole source for amino acids and carbohydrates (Radomiljac, 1994). So also a suitable sowing regime is required. If
sown too early, pot host species will overcrowd the pot. Conversely, if sown too late,
insufficient time for haustorial connection before field establishment will result in S. album suffering outplanting stress.
2.4. SHADE REQUIREMENT OF SEEDLINGS
The capacity of a plant to use and dissipate light energy is a function of both
genotype and environmental conditions. Most plants have the ability to acclimatise to a
specific light environment. Excess light can affect plant growth and reduce field
productivity as a result of photoinhibition (Kitao et al., 2000a; Goncalves et al., 2001; Marenco et al., 2001; Kull, 2002). Apart from a group of pioneer species (shade intolerant species), the majority of tropical forest tree species are shade tolerant.
However, survival and growth of seedlings in shade varies widely and continuously
among tropical tree species closely reflecting light requirements of varying intensities as
the seedlings grow and establish in forest soil. In S. album, though earlier works (Fox
and Barrett, 1994) show that some level of shade is beneficial for first three years, the
length of time for optimum benefit has not been elucidated.
2.4.1. Seed reserves and seedling development
The seedling phase is uniquely different from the later stages of plant life in terms
of dependency on maternallyderived resources and rapid developmental changes in
morphology and allocation patterns. In a strict physiological sense, a plant developed
from a seed is a seedling as long as it depends on seed reserves (Fenner, 1987). Initially
after radicle emergence, a developing seedling acquires all necessary resources from
seed reserves and its growth rate is independent of external resource availability. This is

20
the stage of complete dependency on seed reserves. Then, following the development of
organs necessary for autotrophy, such as photosynthetic cotyledons or leaves for
acquisition of energy and roots for acquisition of mineral nutrients, a seedling starts
uptake of externally available resources. During this transitional stage, a seedling
utilizes both internal (seedderived) and external sources with increased dependency on
the latter, until the former becomes of negligible importance (Kitajima, 1996).
Ecophysiology of cotyledons deserves special attention because of the high
diversity of morphology, degree of exposure, position and associated functions of
cotyledons found among tropical tree species (Kitajima, 1992b). Before seed
germination, cotyledons absorb resources from the endosperm and the mother plant
(Murray, 1985). During and after germination, cotyledons transfer reserve materials
(lipids, carbohydrates, mineral nutrients) to developing shoot and roots (Ernst, 1988).
Cotyledons of some species serve strictly as organs to store and transfer seed reserves
throughout their lifespan, while cotyledons of other species develop a second function,
photosynthetic carbon assimilation (Kitajima, 1992b). Completely storage cotyledons
are globoid, remain partially or completely in the seed coat (cryptocotylar), and are
typically positioned at or below the ground level (hypogeal). Photosynthetic cotyledons
are free of seed coat (phanerocotylar), thin and paperlike (papyraceous), and raised
above ground (epigeal). Physiological function of cotyledons is of great importance in
determining growth responses of seedlings to light environment.
Early seedling development is the process by which seed tissues rich in reserves are
transformed into seedling tissues. Different mineral nutrients in seeds are exhausted at
different rates (Brookes et al., 1980). In various temperate herbaceous species, nitrogen
is the first among mineral nutrients to become insufficient in supply from seed reserves
(Fenner and Lee, 1989). Nitrogen, most of which is stored in the form of storage
protein in seeds, is used for synthesis of various enzymes necessary during seedling
development, including those of early photosynthetic organs, such as photosynthetic
cotyledons or the first leaves. Little is known about utilization of other mineral nutrients
in seeds of tropical tree species. Seedlings of temperate Quercus species depend on
cotyledon reserves rather than on soil for phosphorus and potassium for the first year
(Brookes et al., 1980).

21
The duration of seed reserve dependancy is an important aspect of the ecology of
seedling establishment (Fenner, 1987; Kitajima and Fenner, 2000). Initially, seedlings
are completely dependent on seed reserves for all resources except water, but they
gradually become dependent on the external supply of resources acquired by shoots
(light energy fixed carbonbased compounds) and roots (mineral nutrients) (Krigel,
1967; Fenner, 1986). The duration of strict seed dependency for a given resource may
vary among species in relation to four characteristics; seed size (total seed mass); seed
quality (concentration of the focal resource); major function of cotyledons (whether
cotyledons serve as photosynthetic or storage organs of seed reserves after
germination); and inherent rate of seedling growth and development.
2.4.2. Chlorophyll fluorescence
Photosynthesis is considered as the most fundamental biological process. Photons
are absorbed by molecules of antenna complex and the excitation energy produced is
transferred to reaction centres of the photosystems. The energy drives primary photo
chemical reactions that initiate the photosynthetic energy conversion in photochemical
and biochemical pathway. The excess energy can be dissipated as heat or it can be re
emitted as lightchlorophyll fluorescence. These three processes occur in competition,
such that any increase in the efficiency of one will result in a decrease in the yield of the
other two. Hence, by measuring the yield of chlorophyll fluorescence, information
about changes in the efficiency of photochemistry and heat dissipation can be gained
(Maxwell and Johnson, 2000). Fluorescence is the energy predominantly emitted (35%
absorbed energy) from chlorophyll complexes of Photosystem II (PSII) (Govindjee,
1995). In recent years, the technique of chlorophyll fluorescence has become ubiquitous
in plant ecophysiological studies. No investigation into the photosynthetic performance
of plants under field conditions seems complete without fluorescence data.
The first significant realization of the relationship between primary reactions of
photosynthesis and Chl a fluorescence came from Kautsky and Hirsh (1931). They were the first to report that, upon illumination of a dark adapted sample, the Chl a
fluorescence emission is not constant but exhibits a fast rise to a maximum followed by
a decline to reach finally, in a range of some minutes to a steady level. They further

22
showed that the declining phase of the fluorescence transient is correlated with an
increase in the CO2 assimilation. Changes in the yield of chlorophyll fluorescence were
first recorded by Kautsky et al. (1960). There is a fundamental relationship between the quantum yield of fluorescence and photochemical energy conversion. Fluorescence can
be used to measure the efficiency of PSII photochemistry, acclimatisation of plants to
different microenvironments and to understand the effects of low and high temperatures.
It also gives insight into the ability of a plant to tolerate environmental stresses and to
the extent to which those stresses have damaged the photosynthetic apparatus (Maxwell
and Johnson, 2000).
Chlorophyll a fluorescence at 20 s, 2 ms, and 30 ms and the time required to
achieve maximum fluorescence are termed as the O, J, I and P step, respectively. Based
on the analysis of how the data from the JIP fluorescence transient can be processed, a
test has been developed called the “JIP test” after the steps of the transient. This test
can be used as a tool for the rapid screening of many samples providing adequate
information on the structure, conformation and function of their photosynthetic
apparatus (Strasser and Strasser, 1995; Strasser et al., 1996). Many investigators have
used Fo (minimal fluorescence), Fv (variable fluorescence) and Fm (maximum
fluorescence) parameters of chlorophyll a fluorescence for testing.
2.4.3. Fv/Fm
The ratio of variable fluorescence to maximal fluorescence (Fv/Fm) of darkadapted
leaves is used commonly to assess the relative state of PSII. Fv/Fm is used frequently as
an expression of photoinhibition which is typically associated with, chlorophyll
degradation (Griffin et al., 2004). Normally, the measurement of pigments from chloroplasts and analysis of chlorophyll fluorescence are used as stress indicators of
high irradiance in plants (Stancanto et al., 2002). Synthesis and degradation of
chlorophyll occurs naturally in the presence of light. Nonetheless, the excess of light
can cause greater degradation and reduction in the levels of total chlorophyll.
Additionally, excess of light can cause decrease of photosynthetic capacity and lead to
occurrence of photoinhibition (Kitao et al., 2000b). Shade grown plants often have relatively large antenna complexes for maximum light capture (Lambers et al., 1998).

23
When exposed to high irradiance, the energy absorbed by these relatively large light
capturing complexes turn to be detrimental to the plant if not efficiently dissipated.
Even plants that have been grown under high light conditions can experience
supraoptimal irradiance. When this occurs, photoinhibition, or a decrease in quantum
efficiency of photosystem II (PSII) becomes significant. It is in this context that studies
on chlorophyll fluorescence become important. Chlorophyll fluorescence is a useful
physiological test because it is non invasive, non destructive and rapid (Vidaver et al.,
1989). Chlorophyll fluorescence is an indicator of photosynthetic performance of plants
and has been increasingly used to understand both the mechanism of photosynthesis and
the factors affecting it (Maxwell and Johnson, 2000).
A study with four Virginia Piedmont tree species showed that ratio of variable
fluorescence to maximal fluorescence (Fv/Fm) increased with shade, suggesting that quantum yield increased, thereby allowing more efficient energy transfer from chlorophyll
to PSII (Groninger et al., 1996). Khan et al. (2000) studied the effects of shade on morphology, chlorophyll concentration, and chlorophyll fluorescence of four Pacific
Northwest Conifer species and found that photochemical efficiency of all four species was lower under higher irradiation. Studies by Goncalves et al. (2005) on growth, photosynthesis and stress indicators in young Aniba rosaeodora Ducke plants under different light intensities showed that the photosynthetic activity of the species may be
limited when grown in shaded environments or environments with high light intensity, either due to insufficient light intensity in the shaded environment or due to photoinhibition
as a consequence of excess light in the open environment. Ishida et al. (1999) studied the diurnal changes in the leaf gas exchange and chlorophyll fluorescence of two
dipterocarps, Shorea leprosula (a high light requiring species) and Neobalanocarpus heimii (a low light requiring species), and a pioneer tree species (Macaranga gigantea) growing in open and gap sites. Data obtained provide evidence to the hypothesis that ecophysiological characteristics link with plant’s regeneration behaviour and
successional status. In studies with white spruce (Picea glauca (Moench) Voss) seedlings, Vidaver et al. (1989) suggested that chlorophyll fluorescence provide useful information about photosynthetic responses to environmental stresses such as freezing temperatures and moisture stress. Studies were conducted to evaluate the growth
performance of Adathoda beddomei under different shade levels (Neerakal et al., 2005).

24
2.4.4. Photoinhibition
When leaves are exposed to more light than that can be utilised through the process of photosynthesis, PSII function can be affected in a stress condition called photoinhibition. The value 0.8 for Fv/Fm ratio is considered as the threshold value for photoinhibition by Liittge et al. (1998). Pronounced altitudinal variation in photochemical efficiency of PS II (Fv/Fm) was observed in five indigenous fodder species namely Quercus leucotrichophora A. Camus (temperate), Celtis australis Linn (subtropical), Grewia optiva Drummond (subtropical), Bauhinia purpurea Linn (tropical) and Melia azedarach Linn (tropical). The Fv/Fm ratio ranged from 0.390.87 and two species were found to be photosynthetically most active. This study provided the basis of screening physiologically active and fast growing tree species at different altitudes. Furthermore, studies on chlorophyll fluorescence gave fairly good idea on productivity and suitability of species for cultivation under a given area (Husen et al., 2004). Effect of industrial pollution on Scot pine needles was detected by measurement of fluorescence parameters (Pukacki, 2000). Studies on chlorophyll fluorescence parameters in populations of two legume trees Stryphnodendron adstringens (Mart.). coville (Mimosoideae) and Cassia ferruginea (Schrad.) Schrad. ex DC (Caesalpinoideae) have revealed fluorescence measurements to be an efficient technique to investigate the photosynthetic performance when grown under a nonstressful environment also (Filho et al., 2004). In C. ferruginea plants, Fv/Fm value of 0.783 had been observed. However, it was observed under low light level and so was not due to photoinhibition (Filho et al., 2004).
Studies on photosynthesis, chlorophyll fluorescence and carbohydrate content of Illicium taxa grown under varied irradiance showed that three of the eleven taxa experienced less photoinhibition than the other and maintained greater photochemical efficiency of absorbed light (Griffin et al., 2004). Chlorophyll fluorescence transients have been used as an indirect method to distinguish between submergence tolerant and susceptible rice cultivars (Sarkar et al., 2004). Niu et al. (2004) studied gas exchange and chlorophyll fluorescence response to simulated rainfall in Hedysarum fruticosum var. mongolicum and found that PSII activity was really impaired by water stress and could recover to the normal status only when the water stress disappeared.
The quantitative relationship between chlorophyll fluorescence and the efficiency of photosynthetic energy conversion opens new ways of application in plant breeding,
25
development of new varieties and evaluation of plant productivity. Slapakauskas and Ruzgas (2005) estimated fluorescence level of newly developed winter wheat varieties. In studies of forest decline and more generally in studies of effects of air pollution on plants and photosynthesis, chlorophyll fluorescence has become an important tool, not only in screening the effects but also in elucidating the nature of damage to photosynthesis (Nordenkampf and Oquist, 1993). Chlorophyll fluorescence measurements can help in determining the health status of a plant before and after disease symptoms appear (Santos et al., 2000), especially for early detection of fungal infection (Wagner et al., 2006).
2.5. GENETIC DIVERSITY OF TREES
Forest and forest products are renewable resources and contribute substantially to
economic development. They play a major role in enhancing the quality of the
environment. Forests preserve the genetic diversity of living resources, which is
necessary to sustain and improve agricultural and forestry production; forest is the raw
material for scientific and industrial innovation. Tropical forests are characterised by a
great diversity of tree species and this range of variation provides the basis for selection
and improvement of forest products (Kemp et al., 1993). The extent of forest in India is 75 million ha which works out to be 19.27 per cent of our geographical area; and this is
far below the requirement of 33 per cent (ICFRE, 2000).
Genetic diversity is essential for both the longterm stability and shortterm
productivity of forest ecosystems. The amount of genetic variation within a species and
its distribution within and among populations provides clues to the factors that govern
the maintenance of variation, inbreeding and gene flow. Genetic diversity is required for
maintaining evolutionary potential in a changing environment, resist pests and avoid the
negative consequences of inbreeding (Newton et al., 1993; Bawa and Dayanandan, 1998).
Characterization of genetic diversity is a prerequisite for exploitation of genetic
resources for plant improvement. Morphological characterization is often faced with the
problems of low penetrance and heritability. Molecular markers are highly heritable, are
available in high numbers, and often exhibit enough polymorphism to dicriminate
closely related individuals. Knowing the distribution of diversity within and among

26
populations of a species is important for conservation because it provides useful
guidelines for the preservation of genetic diversity within the species as a whole. If a
large proportion of the diversity resides among populations, then more populations must
be conserved than if each population contains much of the specieslevel diversity
(Fransico et al., 2000).
Population genetics is the quantitative study of the amount and distribution of
genetic variation in populations, and the dynamics of the underlying genetic processes.
Description of population genetic structure and its dynamics is based on the analysis of
allele and genotype frequencies of simple traits whose transmission follow Mendelian
rules of inheritance (Frankel, 1983). The estimate of allele frequencies at a locus from
knowledge of genotype frequencies is forthright under the assumptions of the Hardy
Weinberg principle. The HardyWeinberg principle provides the foundation for all
population genetic investigations. The principle states that in a large randommating
population with nonoverlapping generations, the allele and genotype frequencies will
remain constant from generation to generation, when there is no mutation, migration
and natural selection which can alter the frequencies. A population is said to be in
HardyWeinberg equilibrium (HWE) when frequencies of three genotypes viz.,
homozygous dominant (AA), heterozygous (Aa) and homozygous recessive (aa) at a
diallelic locus (dominant and recessive) are p 2 , 2pq and q 2 respectively such that
p 2 +2pq+q 2 =1, where the allele frequencies p (A) and q (a) can be calculated from
genotype frequencies (Yeh, 2000).
To characterize population genetic structure, the following parameters that describe
and quantify the genetic and geographic variation patterns are usually investigated viz.
polymorphisms (P) to describe what proportion of gene loci are variable, average number of
alleles per locus (A), average heterozygosity (h) to describe what proportion of all gene
loci are heterozygous and the level of among population differention GST (Brown,
1989). Forest trees have been exposed to various geographical disturbances and extreme
life history characteristics such as long cycle, greater opportunity for accumulation of
mutations and exposure to stresses. Thus, to develop and implement effective genetic
improvement and conservation strategies in forest trees, it is necessary to integrate the
information drawn from the above mentioned population genetic diversity parameters.

27
2.5.1. Methods of genetic diversity study
The use of genetic markers in plant breeding dates back to the beginning of the
century when, in peas, Bateson and Punnett (1905) indicated the possibility of genetic linkage, between genes controlling flower petal colour and shape of the pollen grain.
Prior to 1960’s, markers used in plant genetics and breeding were those derived from genes controlling discrete phenotypes of easy visual identification such as dwarfism,
chlorophyll deficiencies, flower and seed and their morphology. But these morphological markers are limited in number, expressed only at the whole plant level, greatly
influenced by environment and exhibit only a low per cent of polymorphism. This picture began to change in the 1960’s with the development of molecular markers based
on isozyme polymorphism (Lewontin and Hubby, 1966) which continued to provide simple and inexpensive method of obtaining genetic information in tree species also (Grattapaglia et al., 1992). However, isozymes detect only a fewer number of loci and only a limited subset of isozyme loci can be assayed across the life cycle stages for most tree species.
The advent of molecular techniques based on the analysis of DNA polymorphisms
radically expanded the frontier area of this study as it mitigated the limitations of
morphological and biochemical markers both in terms of numbers available and their genetic properties. With the development and application of molecular markers over the
last 20 years, we now know more about the genetic structure of forest tree species and the spatial and temporal dynamics of genetic processes, such as mating and gene flow,
than ever before. These molecular markers include Randomly Amplified Polymorphic DNA (RAPD), Inter Simple Sequence Repeats (ISSRs), Amplified Fragment Length
Polymorphism (AFLP), microsatellites or Simple Sequence Repeats (SSRs), Restriction Fragment Length Polymorphism (RFLP) and Single Nucleotide Polymorphisms (SNPs).
2.5.2. Randomly Amplified Polymorphic DNA
In Randomly Amplified Polymorphic DNA marker (RAPD), genomic DNA
samples are amplified by applying PCR using randomly constructed oligonucleotides as primers. Each RAPD cycle consists of three steps, DNA denaturation (9094ºC), primer
annealing (3036ºC) and primer extension (72ºC). The template DNA is denatured by subjecting to temperature between 9094ºC. In annealing step, temperature is rapidly

28
reduced to 3036ºC allowing the hybridization of each primer to their complementary
regions. The extension step involves the addition of nucleotides using target sequences as templates resulting in the synthesis of a new copy of target sequence in each cycle.
The cycle is generally repeated for 2045 cycles and the amplification process follows geometric progression (Welsch and Mc Clelland, 1990). RAPD is being successfully
used to differentiate species, varieties, cultivars, and clones in many crop plants.
RAPD has been successfully applied in differentiating between varieties and clones
of Camellia sinensis and in evaluating the genetic diversity among elite tea (Camellia sinensis var. sinensis) accessions (Kaundun et al., 2000). The technique has been used to study genetic diversity in many plant genera such as mahoganies (Chalmers et al., 1994), Eucalyptus (Keil and Griffin, 1994), mango (Schnell et al., 1995), Populus spp. (Castiglione et al., 1993), oil palm (Shah et al., 1994), Norway spruce (Scheepers et al., 1997), Cacao (Whitkus et al.,1998), Amaranthus (Chan and Sun, 1997), cotton (Iqbal et al., 1997) and brassicas (Jain et al., 1994). They have also been used to tag genes of agronomic importance (Michelmore et al., 1991; Hormaza et al., 1994) and to develop genetic maps in Norway Spruce (Binelli and Bucci, 1994) and Populus spp. (Bradshaw et al., 1994). RAPD markers can be effectively used to determine the specificity in plantpathogen interaction and to identify markers linked to a resistant gene of interest
within a short time (Naqvi et al., 1995; Kuginuki et al., 1997).
2.5.3. Inter Simple Sequence Repeats
Since 1994, a new molecular technique called Inter Simple Sequence Repeat
(ISSR) has become available (Zietkiewicz et al., 1994). ISSRs are semiarbitrary markers amplified by PCR in the presence of one primer complimentary to a target microsatellite. ISSR markers use short microsatellite motif containing primers anchored
at the 3´ or 5´end by two to four arbitrary degenerate nucleotides to amplify the DNA sequence lying between two microsatellite regions (Zietkiewicz et al., 1994). PCRISSR amplification does not require prior genome sequence information (Bornet et al., 2002b). Each band corresponds to a DNA sequence delimited by two inverted
microsatellites. ISSR was first used by Zietkiewicz et al. (1994) to differentiate between closely related individuals. ISSRs have been used to study genetic diversity in plants

29
such as corn (Kantety et al., 1995), potato (Bornet et al., 2002a; Provan et al., 1996; Prevost and Wilkinson, 1999) and rice (Blair et al., 1999). They are widely used to investigate clonal diversity and population genetic structure (Tani et al., 1998; Esselman et al., 1999; Rossetto et al., 1999). Extremely high variability and high "mapping density" as compared with RFLP and RAPD data make these new microsatellitebased
molecular markers ideal for producing genetic maps of individual species (Nagaoka and Ogihara, 1997). Moreover they can be used for systematic, molecular, ecological,
evolutionary and crop improvement studies at the population level and among closely related species (Tsumura et al., 1996; Hollingsworth et al., 1998; Esselman et al., 1999).
ISSR markers have been successfully used for varietal identification and
assessment of genetic relationships in many plant species (Narayanan et al., 2007). They are widely used in population studies because of their highly variable nature; less
investment in time, money and labor than other methods (Wolfe and Liston, 1998; Harris, 1999) and the fact that they exhibit Mendelian inheritance (Gupta et al., 1994; Tsumura et al., 1996). They have been instrumental in determining variability and correcting misidentifications in large germplasm collections (Fang et al., 1997; Gilbert et al., 1999;
Lanham and Brennan, 1999, Charters and Wilkinson, 2000). They have also been used to determine the genetic diversity of species of conservation concern (Esselman et al., 1999; Camacho and Liston, 2001; Mc Glaughlin et al., 2002; Smith and Bateman, 2002).
ISSRs have been successful in distinguishing subspecies of Plantago major L. (Plantaginaceae), a cosmopolitan species (Wolfe and Morgan Richards, 1998) and in
determining the levels of genetic variation between sympatric species of Alnus (Betulaceae) in Italy (King and Ferris, 2000). They have been useful for cultivar
identification in numerous plant species, including Rice (Joshi et al., 2000), Apple (Goulao and Oliveira, 2001), Strawberry (Arnau et al., 2003) and assessment of genetic variations in plants such as Citrus (Fang and Roose, 1997), Viola pubescens (Culley and Wolfe, 2000), Potato (Prevost and Wilkinson, 1999) and Oryza (Qian and Hong, 2001).
ISSR markers are thought to be particularly useful for study of closely related individuals which exhibit low levels of polymorphism (Zietkiewicz et al., 1994) and have been applied as a very useful alternative to fingerprinting and genetic analysis in fruit crops including Citrus (Citrus L. spp) (Fang and Roose, 1997; Fang et al., 1997),

30
Grape (Vitis vinifera L.) (Moreno et al., 1998), Gooseberry (Ribes L.) (Lanham and Brennan, 1999) and Plum (Prunus L. spp) (Goulao and Oliveira, 2001). Cervera et al. (1998), Moreno et al. (1998) and Sensi et al. (1996) reported discrimination of grape clones using ISSR assays. ISSR profiling has been used as a powerful method for molecular characterisation of Leucadendron varieties (Pharmawati et al., 2005) and has proved to be a potentially useful tool for the identification of strawberry varieties (Arnau et al., 2003). They have been used to screen markers for ascertaining sex in Carica papaya (Parasnis et al., 1999), Humulus lupulus (Danilova and Karlov, 2006) and Cycas circinalis (Gangopadhyay et al., 2007). Genetic relations between various coffee species and determination of the family ties between coffee hybrids (Paulo et al., 2003) was carried out using ISSR marker analysis. In the same way the technique was
effective for the study of genetic variation in Changium smyrnioides (Apiaceae) (Ying Xiong et al., 2004) and inter and intraspecies variation of genus Penstemon. ISSRs have been used in studies of cultivated species to produce genetic linkage maps (Kojima et al., 1998; Cekic et al., 2001) and to determine the relatedness of lines of agriculturally important species. In a comparitive study of RAPD markers, ISSR markers, and allozymes designed to assess clonal diversity in Calamogrostis porteri spp. insperata, Esselman et al. (1999) found that ISSR markers detected more variation than did RAPD and allozymes.
2.5.4. Genetic diversity of sandal
RAPD markers had been used to assess genetic variation of 54 sandalwood genotypes distributed in India (Shashidhara et al., 2003). They concluded that the sandalwood germplasm from India constituted a broad genetic base. Angadi et al. (2003) assessed genetic distance between 8 different provenances of sandal using isozyme markers and found that all the sandal provenances are genetically well separated. Using 23 enzyme systems, Brand (1994) investigated the levels of genetic diversity in 10 West Timor and two Indian sandal populations and found that West Timor and Indian populations are genetically well separated. Suma and Balasundaran (2003; 2004) have assessed the level
of genetic variation within and between 11 southern Indian S. album populations using isoenzymes and RAPD markers. Studies on genetic diversity and seedling survival of eight Indian provenances (Suma and Balasundaran, 2007) have shown that Marayur provenance has better genetic diversity; Marayur provenance also showed better

31
adaptability not only in Marayur but also in low altitude areas of Kerala than other provenances. Using allozyme markers, Nageswara Rao et al. (2007) analyzed the genetic diversity of 19 sandal populations distributed over different parts of Peninsular India.
2.6. SANDAL SEEDLING MORTALITY AND LOW GERMINATION PERCENTAGE : GENETIC DIVERSITY OF FUSARIUM
2.6.1. The genus Fusarium
Fungi are responsible for serious plant diseases worldwide. Fungi are characterised by a greater complexity and diversity of form than other microbial pathogens. This
diversity is highlighted by the extraordinary host range observed by some pathogens and the extreme pathogenic specialization of others. The genus Fusarium contains many species that attack a large number of crops, causing seed rots, root rots, foot rots, stalk rots, wilts, yellow and ear and kernel rots. The genus was first described by Link (1809)
and later classified within Fungi Imperfecti in the class Hyphomycetes. The sexual or perithecial stage belongs to the order Hypocreales of subdivision Ascomycotina (Prasad et al., 2007). This variable fungus, composed of many pathogenic species and strains, lives in the soil and attacks all cultivated crops and many wild plants. The fungus is
capable of attacking all parts of the plant. Serious loss may result, especially on susceptible cultivars when weather conditions are favourable for disease development
(George et al., 1992). Fusarium spp. penetrates roots principally through wounds made by nematodes. The fungus grows through the waterconducting tissues, producing
toxins that kill the cells, stunt the plant, and yellow the leaves. Often the plant wilts and dies from lack of water. Symptoms usually appear only on one side of the stem and
progress upward until the foliage is killed and the stem dies. The water conducting tissues just under the bark turn brown; the discolouration is visible in crosssections of
stems near the base of infected plants (George et al., 1992).
The taxonomy of Fusarium spp. is confusing and various classification systems
have been proposed. Diagnosis of Fusarium at the species level is based on conventional methods, which include the description of colonies on appropriate media
(texture, colour and pigment) and microscopic description of conidiogenous cells and

32
conidia. Species identification by morphological traits is problematic because
characteristics like mycelia pigmentation, formation, shape and size of conidia are
unstable and highly dependent on composition of media and environmental conditions.
Phenotypic variation is abundant and much expertise is required to distinguish between
closely related species and to recognize variation within species. Random PCR
approaches are being increasingly used to generate molecular markers, which are useful
for taxonomy and for characterizing fungal populations.
Fusarium is a large cosmopolitan genus of imperfect fungi and is of primary interest because numerous species are important plant pathogens, produce a wide range
of secondary metabolites, and/or cause opportunistic mycoses in humans (Singh et al., 2006). Fusarium oxysporum Schlechtend. Fr. is the sole species of the section Elegans which comprises fungal strains which are morphologically and physiologically similar
(Woo et al., 1998). This group of cosmopolitan, soil borne, filamentous fungi are economically important because many members are the causal agents of vascular wilt or
root rot diseases in diverse agricultural and ornamental crops throughout the world. F.
oxysporum is anamorphic and comprises nonpathogenic strains also which
asymptomatically colonize plant roots or grow saprophytically, as well as pathogenic
strains which colonize the xylem, causing diseases (Booth, 1971; Nelson et al., 1981).
The plant host specificity of the pathogen denotes a specialized form of the fungus: the
formae speciales, and the strains of these different formae speciales are not
morphologically distinguishable (Synder and Hansen, 1940). More than 120 different
formae speciales have been described for F. oxysporum (Hawksworth et al., 1995), although some fungal strains have been found to have a broad host range and may
attack closely related plant species as well as unrelated genera (Kistler, 1997). F.
oxysporum is a cosmopolitan fungal pathogen responsible for wilt and cortical rot diseases of more than 100 economically important plant hosts (Booth, 1971).
Studies on fungal pathogens in natural environments often require simultaneous
analysis of their broad taxonomic range. The laborious nature of microscopic analysis for
identification is the driving force behind developing methods such as molecular verification of identified morphotypes by means of PCRRFLP or such other molecular markers
(Horton and Bruns, 2001). Before the advent of DNA markers, pathologists used a

33
range of phenotypic characters to characterize fungal diversity. Many characters such as
colony appearance, growth rate, spore size, spore colour etc. are still used extensively in
epidemiological studies; but, they are under polygenic control and hence are of limited
value in inheritance studies. DNAbased technologies are used in taxonomic studies since
more markers can be scored simultaneously than with other systems. Application of a
range of DNAbased techniques have revolutionized the discipline of fungal systematics
and provided tools for discrimination of closely related fungi (Mills et al., 1998).
Historically, RFLPs were used initially as markers (Raeder et al., 1989) and then RAPDs. More recently, they have been augmented and partly superseded by AFLPs and
SSRs, though they can all be used together. PCR based methods for the rapid detection
and identification of Candida species include Restriction Fragment Length Polymorphism (RFLP) analysis, PCRwith speciesspecific probes and Random Amplification of
Polymorphic DNA (RAPD) analysis (Fujita et al., 2001). PCR with fungusspecific primers, targeting the conserved sequences of 5.8S and 28S ribosomal DNAs (rDNAs)
as well as those of 18S and 28 S rDNAs, results in the respective amplification of the speciesspecific internal transcribed spaces (ITS) regions which vary in amplicon length
and sequence according to the species (Gardes et al., 1991; Henry et al., 2000).
2.6.2. Diversity of fungal isolates and adaptability
Accurate and rapid identification of pathogens is necessary for appropriate management of plant diseases. Genetic characterization of pathogenic variants of plant
pathogens prevalent in an area is required for efficient management of the disease and to
improvise methods to increase plant productivity. The ability of fungal pathogens to
generate extensive genetic diversity is likely to be responsible for the great adaptability
which allows them to colonize in a wide range of habitats (Sullivan and Coleman,
1998). So, studying mechanisms of pathogenicity and sources of genetic variation in
plant pathogens is critical for the control of fungal disease (Talbot, 1998).
2.6.3. Method of study of Fusarium diversity
Random Amplified Polymorphic DNA (RAPD) assay has been used extensively to
explore fungal populations at species, intraspecific, race and strain levels. PCRRAPD

34
has been applied widely to study the genetic relatedness of various fungal species such
as Armillaria genets (Smith et al., 1994), Aspergillus niger (Magnegneau et al., 1993), Colletotrichum spp. (Mills et al., 1992; Fabre et al., 1995), Gibberella fujikuroi and Fusarium (Voigt et al., 1995), Metarhizium anisopliae (Fegan et al., 1993; Bidochka et
al.,1994), Puccinia striiformis (Chen et al., 1993) and Rhizoctonia solani (Duncan et al., 1993). The technique has ben used to identify and discriminate between pathotypes of Fusarium oxysporum f. sp. ciceris (Kelly et al., 1994) and Leptosphaeria maculans
(Goodwin and Annis, 1991); races of Fusarium solani f. sp. vasinfectum (Assigbetse et al., 1994), F. oxysporum f. sp. pisi (GrajalMartin et al., 1993) and for variety differentiation in Hirsutella longicolla (Strongman and Mackay, 1993). Arbitrary primers
(10mers) have been used to detect genetic diversity in Colletrotrichum acutatum, C. gloeosporioides and C. fragariae. RAPD analysis revealed higher levels of polymorphisms, and in some cases, individual strains were recognized, making RAPD useful for strain
identification for commercially important species such as Trichoderma reesei and T. harzianum. RAPDs have been used to assess the diversity at the intra and interspecific level in the genera Colletotrichum and Trichoderma. Linkage maps already exist for
several plant pathogens such as Magnaporthe grisea (Farnian and Leong, 1995), Cladosporium fulvum (Arnau et al., 1994), and Giberella fujikuroi (Desjardins et al., 1996).
Studies on molecular variability in F. oxysporum are numerous, and vary
depending upon the objectives and desired applications. PCRRFLP analyses of nuclear
rDNA and RAPD analysis have been used to determine molecular variability of F.
oxysporum. Repetitive DNA sequences detected by RFLP and southern analyses have been most frequently used in taxonomic investigations among various Fusarium species. A combination of RFLPs and RAPD analysis along with pathogenicity and
vegetative compatibility test was used to characterize isolates of F. oxysporum f. sp. phaseoli, the causal agent of bean yellows or wilt disease of Phaseolus vulgaris from various geographic origins (Woo et al., 1998). RAPD analysis was found to be useful in
distinguishing nonpathogenic F. oxysporum isolates from pathogenic isolates of F. oxysporum f. sp. dianthi (Manulis et al., 1994; Kalc Wright et al., 1996). F. oxysporum f. sp. vasinfectum (Assigbetse et al., 1994). F. oxysporum f. sp. ciceris (Kelly et al., 1994)
and F. oxysporum f. sp. albedinis (Fernandez and Tantaoui, 1994; Tantaoui et al., 1996).

35
RAPD analysis has been used effectively to distinguish between species of
Fusarium. The results indicate that RAPD analysis can be effectively employed as a reliable DNA fingerprinting technique to study the spread of the pathogen (Amy et al., 1997). RAPD was used to determine the genetic variability among 15 isolates of F.
graminearum collected from different regions of India. Large genetic variation was detected at the DNA levels which indicated the ability of a pathogen to adapt to
different lifecycle conditions (Saharan et al., 2007). Gherbawy et al. (1999) used
RAPD technique to analyse different formae speciales of F. oxysporum. Moller et al. (1999) studied fungal populations of F. moniliforme and F. subglutinans using RAPD technique. Gherbawy et al. (2002) used RAPD technique for identifying Fusarium
subglutinans, F. proliferatum and F. verticillioides strains isolated from maize in Austria. Pasquali et al. (2003) characterized isolates of F. oxysporum pathogenic to Argyranthemum frutescens L. using RAPD technique. Genetic variability in pea wilt
pathogen F. oxysporum f. sp. pisi in northwestern Himalayas was studied using RAPD and protein (native protein and esterase isozyme) markers (Sharma et al., 2006). Genetic diversity of F. oxysporum isolates from cucumber was studied using RAPD by
Vakalounakis and Fragkiadakis (1999).
F. oxysporum has received considerable attention from plant pathologists over the
past 80 years because of its ability to cause vascular wilt or root rot diseases on a wide
range of plants. Nijs et al. (1997) studied variation in RAPD patterns within Fusarium species from cereals from various parts of the Netherlands. Moller et al. (1999) studied
fungal populations of F. moniliforme and F. subglutinans using RAPD technique. Genetic diversity and recombination within populations of F. pseudograminearum from Western Canada was investigated using restriction digestion of nuclear ribosomal DNA
(nrDNA) using 3 restriction enzymes (EcoRI, Hae III and Pst I), and ISSR markers. The study revealed a substantially high genetic diversity within populations of F. pseudograminearum recovered from infected wheat seeds in the provinces of Alberta
and Saskatchewan in Western Canada (Mishra et al., 2006).

CHAPTER 3
AUTOTROPHIC AND PARASITIC PHASE OF SANDAL SEEDLING GROWTH

36
3. AUTOTROPHIC AND PARASITIC PHASE OF SANDAL SEEDLING GROWTH
3.1. INTRODUCTION
The seedling phase is unique for the later stages of plant life in terms of
dependency on maternallyderived resources and rapid developmental changes in
morphology and resource allocation patterns. Early seedling development is the process
by which seed tissues rich in reserves are transformed to seedling tissue. In a strict
physiological sense, a plant developed from a seed is a seedling as long as it depends on
seed reserves (Fenner, 1987). Initially after radicle emergence, a developing seedling
acquires all the necessary resources from seed reserves (cotyledons/endosperm) and its
growth rate is independent of external resource availability. This is the stage of
complete dependency on seed reserves. Then, following development of organs needed
for autotrophy, as the photosynthetic cotyledons or leaves for acquisition of energy and
roots for acquisition of mineral nutrients, a seedling starts to uptake externally available
resources (Kitajima, 1996).
Before seed germination, cotyledons absorb resources from the endosperm and the
mother plant. During and after germination, cotyledons transfer reserve materials
(lipids, carbohydrates and mineral nutrients) into developing shoot and roots. Initially,
seedlings are completely dependent on seed reserves, but they gradually become
dependent on the external supply of resources acquired by shoots (light energy fixed in
carbonbased compounds) and roots (mineral nutrients). As seed resources become
exhausted, growth of the seedling becomes significantly slower (Kitajima, 2002). This
indicates the end of seed reserve dependency. At this point of time, the seedling requires
an external supply of resources for further growth. Therefore, the duration of seed
reserve dependency is an important aspect of the ecology of seedling establishment
(Fenner, 1987; Kitajima and Fenner, 2000).
The period upto which seedlings can grow by utilizing reserves varies with the
species (Kitajima, 1996). Knowledge of such a phase of autotrophic nutrition is
important in nursery management as seedlings grown by sowing seeds in sterile or

37
nutrient deficient medium needs to be pricked out before seed reserves are fully
exhausted. The objective of this study was to understand the seed reserve (cotyledonary)
dependency of Santalum album L. seedlings.
3.1.1. Host dependency of sandal plants
Parasitic plants are taxonomically diverse group of angiosperms that rely partially
or completely on hosts for carbon, nutrients and water, which they acquire by attaching
to host roots or shoots using specialised structures known as haustoria and by
penetrating host xylem and/or forming close connections with the phloem. The site of
attachment to the host and the presence or absence of functional chloroplasts defines the
parasite further as being either hemiparasitic or holoparasitic, respectively (Malcom and
Gareth, 2005).
Sandal is a hemi root parasite. In the early stages of S. album development,
nutrition is derived from the relatively large seed reserves and presumably also the soil
via the plant’s own roots. Later, the formation of host attachment becomes critical for
survival (Barrett and Fox, 1997). Nagaveni and Srimathi (1985) have noted that 70 per
cent of seedlings of S. album, in the presence of potential hosts, initiate haustoria within
30 days of germination, and 90 per cent within one year. They further suggested that S.
album could survive without hosts for a period of 2 to 3 years, but with poor survival
and growth.
For the establishment of sandal in plantations, healthy nursery seedlings with a pot
host is essential. Earlier, sandal hosts were classified into three categories by
Radomiljac and Mc Comb (1998) as pothosts, intermediate hosts and longterm hosts.
The pot host functions both in nutrition and water relations of S. album, and it reduces
outplanting stress when transferred to the field. The intermediate host acts as a
‘bridgingagent’ between the pothost and longterm host. Stimulating early growth may
be an important determining factor in the future heartwood production of S. album.
Studies have reported that S. album benefits from a primary host at the nursery
stage and a secondary host (long term) in the field (Srinivasan et al., 1992; Surata,

38
1992; Barrett and Fox, 1995; Fox et al., 1996; Radomiljac, 1998; Fox, 2000). Sandal
depends on nutrients derived from its hosts for growth and development. Hosts are
suggested as the source of Ca, Fe, N, P, K, Mg, Cu and Zn for sandal (Barrett and Fox,
1997). Raising plantable quality of sandal seedlings under nursery conditions has been
found to be difficult since efficient hosts which enhance the growth of sandal need be
supplied. Tennakoon et al. (2000) found high chlorophyll content in parasitized S.
album (with host) seedlings as compared to control (without host). Though chlorophyll
fluorescence technique has been applied to assess the nursery seedling quality in
Pseudotsuga menziesii (Franco) (Fisker et al., 1995) and also to study the effects of
shade on four pacific Northwest conifer species (Khan et al., 2000), it has not yet been
used so far to study hostsandal interactions. Moreover, measurement of chlorophyll
fluorescence provides a very good criteria to assess the seedling performance.
Many studies have been conducted earlier on host association of sandal and its
growth enhancement. There are many plants which have not been reported to be
haustorised by sandal though luxuriant growth of sandal in association with them is
observed under nursery conditions. However, no report is available describing
physiological basis supporting growth enhancement. In view of these facts, an
experiment was conducted with a few selected annuals and perennials to examine the
host preferences of sandal seedlings under nursery conditions through physiological
measurements and chlorophyll estimation of sandal.
3.2. MATERIALS AND METHODS
3.2.1. Autotrophic phase of sandal seedlings
Sandal seedlings emerging out of seeds with cotyledons intact were pricked out to
root trainers of 150cc capacity containing sterile quartz sand, vermiculite and soil (Fig
3.1). Each category had 48 seedlings. Seedlings in sterile quartz sand and vermiculite
were maintained under irrigation using distilled water, whereas the seedlings in soil
were irrigated using tap water. Conditions of cotyledons, leaves and seedlings as a
whole were noted daily for 230 days (Table 3.1.).

39
In soil In quartz sand In vermiculite
Figure 3.1: Sandal seedlings grown in different potting media in root trainers
3.2.2. Host dependency of sandal plants
Sandalwood seeds were sown in germination trays. After germination, seedlings
were transferred to polybags containing potting medium comprising a 2:1:1 mixture of
soil:sand:farm yard manure. Seedlings were maintained in nursery conditions under 75
per cent shade for about 8 months and later were transferred to full sunlight. When
sandal seedlings were about 4monthold, seedlings of host plants were planted in each
polybag and growth of sandal seedlings with host was monitored for about a year for
annuals and about two years for perennials. Perennials were transplanted to earthen pots
within a year. Sandal seedlings were grown with annuals such as Vigna unguiculata (L.)
Walp. (Fabaceae), Ocimum sanctum L. (Verbenaceae), Ageratum conyzoides L.
(Asteraceae), Phyllanthus niruri L. (Euphorbiaceae), Mikania micrantha Kunth ex. H.
B. K. (Asteraceae), Ludwigia hyssopifolia (G Don) Exell (Onagraceae), Scoparia dulcis
L. (Scrophulariaceae) and Vernonia cinerea (L.) Lem. (Asteraceae) and perennials such
as Pongamia pinnata (L.) Pierre (Fabaceae) and Lantana camara L. (Verbenaceae)
(Fig. 3.9.3.27.). These species were selected as hosts since sandal seedlings showed
better growth with them under nursery conditions when compared with sandal seedlings
growing without host. From our earlier observations it was noticed that sandal seedlings
haustorise Vigna ungiculata as early as 30 days of planting. But we had provided the
hosts only after 4 months since they were found to outgrow and compete with sandal
seedlings for resources. Sandal plants grown with different hosts showed different
growth responses. The polybags were hand weeded as and when necessary.

40
At the end of the experiment (one year for annuals and two years for perennials)
both the set of plants were destructively harvested and measurements of height, collar
diameter, total biomass, shoot and root fresh weight, number of haustorial connections,
chlorophyll fluorescence and chlorophyll contents of sandal seedlings, and total
biomass, shoot and root fresh weight of host plants were recorded. In addition, dry
weights of sandal seedlings were measured after partitioning them into shoots and roots,
and oven dried at 75°C for 48 hours.
The quality of the seedlings was determined using the following criteria:
• Sturdiness Quotient (SQ)
• Dickson Quality Index (DQI)
• Performance Index (PI) using JIP test
3.2.3. Sturdiness Quotient
This is a seedling quality index that can be measured by a simple and non
destructive method. SQ compares height (cm) over root collar diameter (mm). A small
quotient indicates a sturdy plant with a higher expected chance of survival.
SQ = H/D (Thompson, 1986)
where,
H= Final shoot height (cm)
D= Final collar diameter (mm)
SQ has been used to assess height to stem diameter ratio, which tends to increase
with shade and is considered as an important morphological adaptation to shade (Wang et al., 1994).
3.2.4. Dickson Quality Index
The shoot:root ratio has been conventionally used as an important measure for
seedling survival. It relates the transpiring area (shoot) to the water absorbing area
(root). It can also evaluate the carbon allocation above and below the ground. It is
measured by determining the root and shoot dry weights. However, this ratio has been
modified by bringing in the SQ component also into it, resulting in the Dickson Quality
Index.

41
DQI= TDW/ ([H/D] + [SDW/RDW]) (Dickson et al., 1960)
where,
TDW= Final total seedling dry weight (g)
H/D = Sturdiness Quotient (SQ)
SDW= Final shoot dry weight (g)
RDW= Final root dry weight (g)
A higher value for the index is an indication of a healthy seedling.
3.2.5. Physiological measurements
Chlorophyll fluorescence was repeatedly measured at regular intervals on a
subsample of seedlings with a Plant Efficiency Analyzer (Handy PEA, Hansatech
Instruments Ltd., Norfolk, UK). Chlorophyll fluorescence measurement can yield
valuable data on the performance of the photosynthetic apparatus, especially the PS II.
The chlorophyll fluorescence transients were induced by light intensity of 1500 µmol m
2 s 1 and recorded from 10 µs to 1 second. All measurements were made on attached
leaves which were fully dark adapted for 10 to 20 minutes using leaf clips supplied with
the instrument. Measurements were taken between 09.00 and 12.00 hours. The data
collected from the various treatments were downloaded to a computer and analysed for
the JIP test using BIOLYZER program (Rodriguez, R. M. Bioenergetic Laboratory,
University of Geneva; available at www.unige.ch/sciences/ biologie/bioen). Chlorophyll
a fluorescence at 20 s, 2 ms, and 30 ms and the time required to achieve maximum
fluorescence are termed as the O, J, I and P step, respectively. JIP test involves the
analysis of the transient fluorescent curves given by the chlorophyll when subjected to
high light intensity. The JIP test refers to the analysis of structural integrity of
chloroplasts and function based on the fluorescence emission data. From the induction
of fluorescence of fast kinetics, the initial fluorescence (Fo), maximum fluorescence
(Fm), variable fluorescence (Fv=FmFo) and photochemical efficiency of PS II (Fv/Fm)
were obtained.
From the data collected during the initial second, a large number of parameters
were available for further analysis of physiological performance. Out of these,

42
Performance Index (PI) was selected. PI is a synthesized parameter, taking into account
several other parameters and is a very useful term providing information concerning
‘relative vitality’ (Handy PEA, Hansatech Instruments Ltd., Norfolk, UK).
PI = ABS /CS x RC/ ABS x TR/DI x ET/dQA/dt (Strasser et al., 1999) where,
ABS= Photon flux absorbed by chlorophyll a CS= Cross sectional area of the leaf
RC= Number of reaction centres
TR= Trapping flux of energy
DI= Dissipated photon flux
ET= Energy flux corresponding to electron transport
dQA/dt= Flux of excitons trapped per reaction center
3.2.6. Chlorophyll content estimation
For the estimation of chlorophyll content, fresh leaves were collected from host
plants showing higher Fv/Fm values. 250 mg of leaf sample was homogenised with 5 ml
of 80 per cent acetone (prechilled). The homogenate was centrifuged at 5000 rpm for 5
minutes and the supernatant was transferred to a 100 ml conical flask. The procedure
was repeated until the residue was colourless. The final volume was made upto 25 ml
with 80 per cent acetone. The absorbance of the solution was read at 645 and 663 nm
against the blank solvent (80 per cent acetone) using a spectrophotometer (Genova
MK3, UK). Using the absorption coefficient, the amount of chlorophyll was calculated
based on the protocol of Sadasivam and Manickam (1992). Chlorophyll content of
sandal plants and hosts were analysed and compared using the formulae.
mg chlorophyll a / g tissue = 12.7 (A663) 2.69 (A645) x V / 1000 x W
mg chlorophyll b/g tissue = 22.9 (A645) 4.68 (A663) x V/1000 x W and
mg chlorophyll / g tissue = 20.2 (A645) + 8.02 (A663) x V / 1000 x W
where,
A= absorbance at specific wavelengths
V= final volume of chlorophyll extract in 80 per cent acetone and
W= fresh weight of the extracted tissue (g)

43
3.3. RESULTS
3.3.1. Autotrophic phase of sandal seedlings
Complete withering of cotyledons in quartz sand occurred within 26 days of radicle
emergence (Table 3.1.). Hence, sandal seedlings need to be transferred to polybags
containing a 1:2:1 mixture of sand:soil:farm yard manure within 26 days after
germination for proper growth and development.
Table 3.1. Autotrophic phase of nutrition during developmental stages of sandal
seedling after germination
Part of the seedling
Condition of the seedling part
Potting media used
Soil Quartz sand Vermiculite
Endosperm/seed
Colour: Creamish brown 06 days 04 days 46 days Brown 68 days 47 days 68 days Complete fall off 825 days 825 days 820 days
Cotyledon
Colour: Green 02 days 02 days 04 days
Yellowish green 46 days 48 days 47 days
Light Brown 1424 days 1416 days 719 days Complete fall off 2427 days 1926 days 1934 days
Leaf Emergence 620 days 425 days 620 days Initiation of leaf fall 220 days 210 days 220 days
Whole seedling Healthy 061 days 069 days 082 days Wilting started 210220 days 220230 days 220230 days
3.3.2. Host dependency of sandal plants
On the basis of initial growth of sandal, eight annual and two perennial host species
were screened for better sandal seedling growth (Fig 3.2.; Table 3.2.; Table 3.3.). Data
for annuals were analysed using one way ANOVA (SPSS 16 software). All the
morphological parameters were found to be significantly different for sandal plants
grown with different annual hosts (Table 3.4.). However, the suitability of host could

44
not be judged based on any single growth parameter of sandal. Among the annual host
plants better performance for height, sturdiness quotient (SQ), SDW/RDW, Dickson
Quality Index (DQI) and haustorial numbers were shown by V. unguiculata, S. dulcis,
M. micrantha, V. cinerea and O. sanctum. Among these, V. unguiculata showed better
performance for height, SQ, DQI and number of haustoria. The perennial species
Pongamia and Lantana were found to give good support to sandal seedling growth
(Table 3.3.). The results of the growth data on height, collar diameter, total fresh weight,
total dry weight and shoot dry weight:root dry weight of sandal plants grown with
annual hosts (Table 3.2.) revealed that V. unguiculata had given good support for
sandal as host. Sandalwood plants with V. unguiculata was significantly distinct in
growth. Vigna being an annual, can function as a superior primary host of sandal. With
the perennial host species, sandal plants with Pongamia showed better performance for
height, collar diameter, total fresh weight, total dry weight, DQI and number of
haustoria (Table 3.3.). Pongamia was found to be the best long term host, being a
perennial tree species.
Figure 3.2. Final growth parameters of sandal plants with different annual hosts
Height = Shoot height (cm); C.D = Collar diameter (mm); SQ = Sturdiness Quotient= Height (cm) / Collar diameter (mm); TFW = Total Fresh Weight (g); SFW = Shoot Fresh Weight (g); RFW = Root Fresh Weight (g); TDW = Total Dry Weight (g); SDW = Shoot Dry Weight (g); RDW = Root Dry Weight (g); SDW/ RDW = Shoot Dry Weight / Root Dry Weight; DQI= Dickson Quality Index
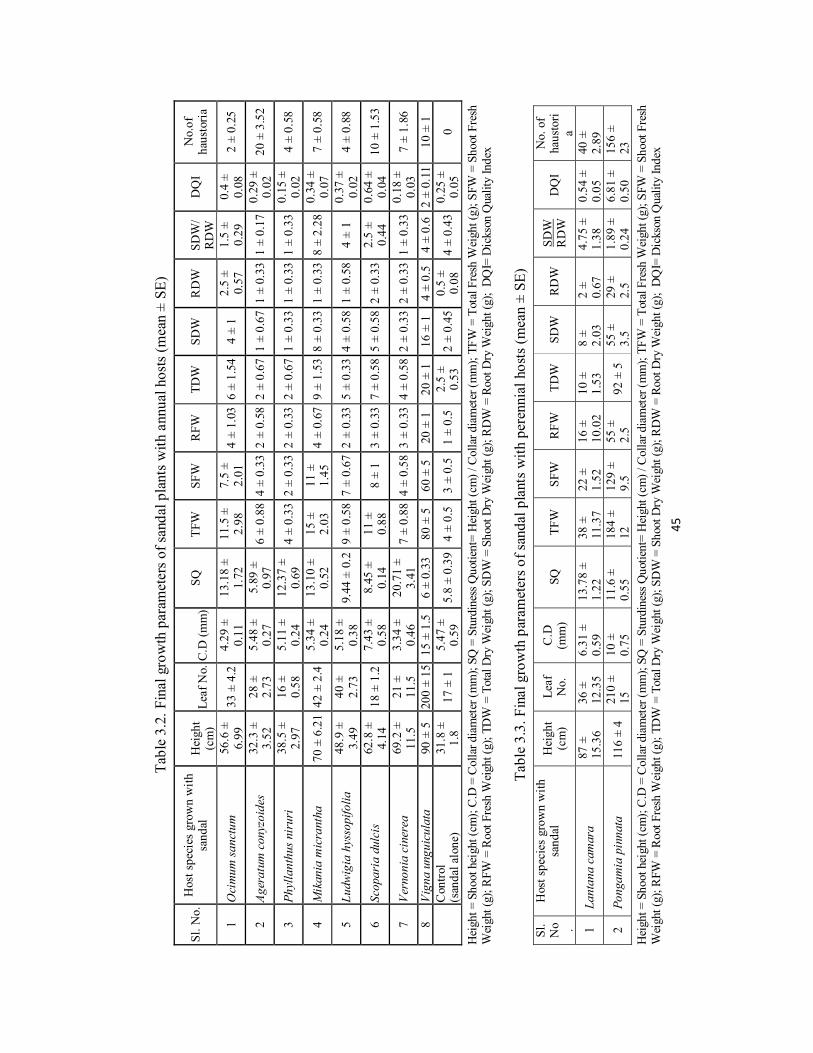
45
Table3.2. Final growth param
eters o
f sandal plants w
ithannualhosts (mean ± SE
)
Sl. N
o. Host species grown with
sandal
Height
(cm)
Leaf No. C.D (m
m)
SQ
TFW
SFW
RFW
TD
W
SDW
RDW
SDW/
RDW
DQI
No.of
haustoria
1 Ocimum sanctum
56.6 ±
6.99
33 ± 4.2
4.29 ±
0.11
13.18 ±
1.72
11.5 ±
2.98
7.5 ±
2.01
4 ± 1.03 6 ± 1.54
4 ± 1
2.5 ±
0.57
1.5 ±
0.29
0.4 ±
0.08
2 ± 0.25
2 Ageratum conyzoides
32.3 ±
3.52
28 ±
2.73
5.48 ±
0.27
5.89 ±
0.97
6 ± 0.88 4 ± 0.33 2 ± 0.58 2 ± 0.67 1 ± 0.67 1 ± 0.33 1 ± 0.17 0.29 ±
0.02
20 ± 3.52
3 Phyllanthus niruri
38.5 ±
2.97
16 ±
0.58
5.11 ±
0.24
12.37 ±
0.69
4 ± 0.33 2 ± 0.33 2 ± 0.33 2 ± 0.67 1 ± 0.33 1 ± 0.33 1 ± 0.33 0.15 ±
0.02
4 ± 0.58
4 Mikania micrantha
70 ± 6.21 42 ± 2.4
5.34 ±
0.24
13.10 ±
0.52
15 ±
2.03
11 ±
1.45
4 ± 0.67 9 ± 1.53 8 ± 0.33 1 ± 0.33 8 ± 2.28 0.34 ±
0.07
7 ± 0.58
5 Ludwigia hyssopifolia
48.9 ±
3.49
40 ±
2.73
5.18 ±
0.38
9.44 ± 0.2 9
± 0.58 7 ± 0.67 2 ± 0.33 5 ± 0.33 4 ± 0.58 1 ± 0.58
4 ± 1
0.37 ±
0.02
4 ± 0.88
6 Scoparia dulcis
62.8 ±
4.14
18 ± 1.2
7.43 ±
0.58
8.45 ±
0.14
11 ±
0.88
8 ± 1
3 ± 0.33 7 ± 0.58 5 ± 0.58 2 ± 0.33
2.5 ±
0.44
0.64 ±
0.04
10 ± 1.53
7 Vernonia cinerea
69.2 ±
11.5
21 ±
11.5
3.34 ±
0.46
20.71 ±
3.41
7 ± 0.88 4 ± 0.58 3 ± 0.33 4 ± 0.58 2 ± 0.33 2 ± 0.33 1 ± 0.33 0.18 ±
0.03
7 ± 1.86
8 Vigna unguiculata
90 ± 5 200 ± 15 15 ± 1.5
6 ± 0.33
80 ± 5
60 ± 5
20 ± 1
20 ± 1
16 ± 1
4 ± 0.5
4 ± 0.6
2 ± 0.11
10 ± 1
Control
(sandal alone)
31.8 ±
1.8
17 ± 1
5.47 ±
0.59
5.8 ± 0.39 4 ± 0.5
3 ± 0.5
1 ± 0.5
2.5 ±
0.53
2 ± 0.45
0.5 ±
0.08
4 ± 0.43 0.25 ±
0.05
0
Height = Shoot height (cm
); C.D = Collar diameter (m
m); SQ
= Sturdiness Q
uotient= Height (cm
) / Collar diameter (m
m); TF
W = Total Fresh W
eight (g); SFW
= Shoot Fresh
Weight (g); R
FW = Root Fresh W
eight (g); TDW = Total Dry W
eight (g); SDW = Shoot DryWeight (g); R
DW = Root D
ry W
eight (g); DQI= Dickson Quality Index
Table 3.3. Final growth param
eters o
f sandal plants w
ith perennial hosts (m
ean ± SE
) Sl.
No .
Host species grown with
sandal
Height
(cm)
Leaf
No.
C.D
(mm)
SQ
TFW
SFW
RFW
TD
W
SDW
RDW
SDW
RDW
DQI
No. of
haustori
a
1 Lantana camara
87 ±
15.36
36 ±
12.35
6.31 ±
0.59
13.78 ±
1.22
38 ±
11.37
22 ±
1.52
16 ±
10.02
10 ±
1.53
8 ±
2.03
2 ±
0.67
4.75 ±
1.38
0.54 ±
0.05
40 ±
2.89
2 Pongamia pinnata
116 ± 4
210 ±
15
10 ±
0.75
11.6 ±
0.55
184 ±
12
129 ±
9.5
55 ±
2.5
92 ± 5
55 ±
3.5
29 ±
2.5
1.89 ±
0.24
6.81 ±
0.50
156 ±
23
Height = Shoot height (cm
); C.D = Collar diameter (m
m); SQ
= Sturdiness Q
uotient= Height (cm
) / Collar diameter (m
m); TF
W = Total Fresh W
eight (g); SFW
= Shoot Fresh
Weight (g); R
FW =Root Fresh W
eight (g); TDW = Total Dry W
eight (g); SDW = Shoot Dry W
eight (g); R
DW = Root D
ry W
eight (g); DQI= Dickson Quality Index

46
Table 3.4. ANOVA Final growth parameters of sandal plants with annual hosts
Sum of Squares df Mean
Square Calculated F value
Table F value
Height Between Groups 6966.30 7 995.19 8.10* 2.66 Within Groups 1965.48 16 122.84 Total 8931.79 23
CD Between Groups 153.21 7 21.89 35.13* 2.66 Within Groups 9.97 16 .62 Total 163.18 23
SQ Between Groups 199.51 7 28.50 3.93* 2.66 Within Groups 116.12 16 7.26 Total 315.63 23
TFW Between Groups 8457.89 7 1208.27 97.38* 2.66 Within Groups 198.52 16 12.41 Total 8656.41 23
SFW Between Groups 4699.39 7 671.34 87.08* 2.66 Within Groups 123.35 16 7.710 Total 4822.74 23
RFW Between Groups 611.92 7 87.42 63.34* 2.66 Within Groups 22.08 16 1.38 Total 634.00 23
TDW Between Groups 451.62 7 64.52 19.62* 2.66 Within Groups 52.62 16 3.29 Total 504.25 23
SDW
Between Groups 342.07 7 48.87 39.74* 2.66 Within Groups 19.68 16 1.23
Total 361.75 23
RDW Between Groups 37.07 7 5.29 2.85* 2.66 Within Groups 29.71 16 1.86 Total 66.78 23
SDW/RD W
Between Groups 15.09 7 2.16 0.83 2.66 Within Groups 41.57 16 2.59 Total 56.67 23
DQI Between Groups 4.96 7 .71 77.46* 2.66 Within Groups .15 16 .01 Total 5.11 23
Haustoria Between Groups 305.21 7 43.60 5.78* 2.66 Within Groups 120.75 16 7.55 Total 425.96 23
* significant at 5 % level

47
Among the annual host species evaluated, V. unguiculata registered higher root
biomass (18 g) and root:shoot ratio (1.11) (Table 3.5. & 3.7.; Fig 3.3.). Among the
perennial host species evaluated P. pinnata registered higher root biomass (1122 g) and
root:shoot ratio (1.63) (Table 3.6.). DQI was highest for sandal with V. unguiculata (2).
DQI of sandal without any host was 0.25 (Table 3.2.; Fig 3.4.). Among sandal with
perennial hosts DQI was highest for sandal with Pongamia (6.81) (Table 3.3.).
Table 3.5. Evaluation of annual host species’ growth based on root:shoot ratio
(mean ± SE)
Sl. No. Annual host species grown
with sandal
Mean Fresh weight Root:Shoot
ratio Shoot (g) Root (g)
1 Ocimum sanctum 6 ± 0.58 1 ± 0.88 0.17 ± 0.09
2 Ageratum conyzoides 4 ± 0.71 0.7 ± 0.23 0.18 ± 0.02
3 Phyllanthus niruri 3 ±1.45 2 ± 0.58 0.67 ± 0.09
4 Mikania micrantha 12 ± 1.15 11 ± 0.58 0.92 ± 0.08
5 Ludwigia hyssopifolia 11 ± 0.88 2 ± 0.33 0.18 ± 0.04
6 Scoparia dulcis 8 ± 0.58 3 ± 0.88 0.38 ± 0.08
7 Vernonia cinerea 5 ± 0.58 1 ± 0.33 0.2 ± 0.09
8 Vigna unguiculata 20 ± 2.5 18 ± 2 1.11 ± 0.04
Table 3.6. Evaluation of perennial host species’ growth based on root:shoot
ratio (mean ± SE)
Sl. No. Perennial host species
grown with sandal
Mean Fresh weight Root:Shoot
ratio Shoot (g) Root (g)
1 Lantana camara 84 ± 2 87 ± 2.5 1.04 ± 0.01
2 Pongamia pinnata 687 ± 116 1122 ± 67.5 1.63 ± 0.27

48
Figure 3.3. Chart showing annual host species’ evaluation based on their
root:shoot ratio
Table 3.7. ANOVA Evaluation of annual host species based on root fresh
weight, shoot fresh weight and root:shoot ratio
Sum of
Squares df
Mean
Square
Calculated
F value
Table F
value
RFW
Between Groups 1054.82 7 150.69 98.30* 2.71
Within Groups 22.99 15 1.53
Total 1077.82 22
SFW
Between Groups 610.78 7 87.25 28.56* 2.71
Within Groups 45.83 15 3.06
Total 656.61 22
RFW/SFW
Between Groups 1.66 7 .24 13.63* 2.71
Within Groups .26 15 .02
Total 1.92 22
RFW = Root fresh weight; SFW = Shoot fresh weight
* significant at 5 % level

49
Figure 3.4. DQI of sandal in association with annual hosts
Fv/Fm ratio [Fv=Fm–Fo; where Fv = variable fluorescence, Fo = initial fluorescence
and Fm = maximum fluorescence] is linearly correlated with the quantum yield of net
photosynthesis and indicates the intrinsic (maximum) photosynthetic efficiency of
photosystem II. Dark adapted values of Fv/Fm are used as a sensitive indicator of plant
photosynthetic performance, with the optimum values around 0.8 measured for most
plant species. Changes in Fv/Fm and Fo are still accepted and widely used as reliable
diagnostic indicators of photoinhibition (Filho et al., 2004). Fv/Fm values were evaluated
for sandal growing well with best annual hosts (Table 3.8.; Fig 3.5. & Fig 3.6.). Fv/Fm values were found to be higher for sandal growing with annuals V. unguiculata (0.75) and O. sanctum (0.67). Fv/Fm values were found to be highest for sandal growing with
perennials P. pinnata (0.82) followed by L. camara (0.76) (Table 3.9.), Fv/Fm values of sandal growing without host was 0.29 (Table 3.8.).
Table 3.8. Fv/Fm of sandal grown along with best annual hosts (mean ± SE)
Host plant name Fv/Fm of sandal
with annual host
O. sanctum 0.67 ± 0.03
V. unguiculata 0.75 ± 0.01
S. album without host (control) 0.29 ± 0.03

50
Figure 3.5. Fv/Fm of sandal raised along with annual hosts
Figure 3.6. Typical fluorescent transients obtained from sandal plants grown with annual and perennial hosts
Curves No. 13 : Sandal seedlings with Lantana camara as host Curves No. 79 : Sandal seedlings with Vigna unguiculata as host Curves No. 1012 : Sandal seedlings with Pongamia pinnata as host Curves No. 1314 : Sandal seedlings with Ocimum sanctum as host
0.01 0.1 1 10 100 1000 1.0E+4
Time [ms ]
0
500
1000
1500
2000
2500
3000
3500
4000
Fluo
resc
ence
[mV]
Fluorescence Raw Curv es
0.05 0.10 0.30 2.00 30.00
1
2
3
7
8
9 10 11
12 13
14 141213
7,1 10,3 9,11 8 2

51
Table 3.9. Fv/Fm of sandal grown along with best perennial hosts (mean ± SE)
Host plant name Fv/Fm of sandal
with perennial host
L. camara 0.76 ± 0.01
P. pinnata 0.82 ± 0.02
Performance Index values were highest for sandal seedlings growing with annual hosts O. sanctum (61.65) and V. unguiculata (27.49) than the values for sandal without host
(control) (Table 3.10.; Fig 3.7.). Performance Index values were higher for sandal
seedlings growing with perennial host P. pinnata (90.84) (Table 3.11.).
Table 3.10. Performance Index of sandal with and without annual host plants (mean ± SE)
Sandal with host Performance Index
Sandal with V. unguiculata 27.49 ± 11.13
Sandal with O. sanctum 61.65 ± 2.64
Sandal without host (control) 2.49 ± 1.66
Figure 3.7. Performance Index of sandal grown with best annual host plants

52
Table 3.11. Performance Index of sandal with perennial host plants (mean ± SE)
Sandal with host Performance Index
Sandal with L. camara 17.83 ± 5.84
Sandal with P. pinnata 90.84 ± 19.16
3.3.3. Chlorophyll content estimation
Chlorophyll content of sandal leaf was also significantly influenced by the host
plant association (Table 3.12.; Fig 3.8.). Sandal seedlings with annual host Vigna
unguiculata showed the maximum chlorophyll content (17.61) followed by Ocimum
sanctum (10.55). Sandal seedlings with perennial host P. pinnata showed the maximum
chlorophyll content (14.86) followed by L. camara (8.62) (Table 3.13). Sandal
seedlings without hosts showed reduced chlorophyll content (4.49).
Table 3.12. Chlorophyll content of sandal leaves grown with two annual host plants
(mean ± SE)
Host plant Chlorophyll a
(mg/g tissue)
Chlorophyll b
(mg/g tissue)
Total chlorophyll
(mg/g tissue)
Ocimum sanctum 6.32 ± 0.06 4.23 ± 0.09 10.55 ± 0.08
Vigna unguiculata 9.21 ± 0.07 8.40 ± 0.08 17.61 ± 0.12
Without host (control) 2.22 ± 0.07 2.27 ± 0.07 4.49 ± 0.08
Table 3.13. Chlorophyll content of sandal leaves grown with two perennial host plants
(mean ± SE)
Host plant Chlorophyll a
(mg/g tissue)
Chlorophyll b
(mg/g tissue)
Total chlorophyll
(mg/g tissue)
Lantana camara 4.89 ± 0.10 3.73 ± 0.16 8.62 ± 0.26
Pongamia pinnata 8.59 ± 0.14 6.27 ± 0.05 14.86 ± 0.13

53
Figure 3.8. Chlorophyll content analysis of sandal leaves grown along with two
annual host plants
Number of haustorial connections had direct correlation with the growth
parameters. Haustorial connections were found to be higher with the best annual host
(Vigna10 ± 1.53) and best perennial hosts (Pongamia 156 ± 23) and (Lantana 40 ±
2.8). Sandal seedlings grow vigorously and suffer less mortality when more number of
haustorial connections with the host plants develop, resulting in increased absorbing
surface; hence higher amount of nutrient absorption becomes possible. Sandalwood
plants growing without host connections showed poor growth and vitality. Root growth
appeared stunted with no haustoria. Mortality of sandal plants was highest in control (no
host plant) as well as with poor hosts compared with plants having Vigna unguiculata
and Pongamia pinnata as hosts.
Annual herbaceous plants such as Ocimum sanctum, Ageratum conyzoides,
Phyllanthus niruri, Ludwigia hyssopifolia, Scoparia dulcis and Vernonia cinerea were
observed to be growing along with sandal seedlings in nursery without overgrowing
sandal. Mikania micrantha is a perennial weed. Sandal seedlings were seen to
haustorise these plants (Figs. 3.93.27). Growth rate of sandal seedling varied with each
association. The number and size of haustorial connections also varied.

54
Figure 3.9: Sandal with V. unguiculata Figure 3.10: Roots of sandal and V. unguiculata showing haustorial connection
Figure 3.11: Young sandal haustorium establishing connection with host root
Haustorial connection
Sandal root Vigna root
Sandal root
Vigna root
Vigna nodule
Haustoria
Vigna Sandal

55
Figure 3.12: Sandal with O. sanctum Figure 3.13: Roots of sandal and O. sanctum showing haustorial connection
Figure 3.14: Sandal with A. conyzoides
Figure 3.15: Roots of sandal and A. conyzoides showing haustorial connection
Sandal Ageratum
Haustoria
Ocimum root
Sandal root Ocimum
Sandal
Haustoria
Sandal root
Ageratum root

56
Figure 3.16: Sandal with P. niruri
Figure 3.17: Roots of sandal and P. niruri showing haustorial connection
Figure 3.18: Sandal with L. hyssopifolia
Figure 3.19: Roots of sandal and L. hyssopifolia showing haustorial connection
Sandal Ludwigia
Haustoria
Phyllanthus root
Sandal root
Phyllanthus
Sandal
Haustoria
Sandal root
Ludwigia root

57
Figure 3.20: Sandal with V. cinerea Figure 3.21: Roots of sandal and V. cinerea showing haustorial connection
Figure 3.22: Sandal with L. camara Figure 3.23: Roots of sandal and L. camara showing haustorial connection
Haustoria
Sandal root
Lantana root
Sandal
Lantana
Sandal root
Vernonia root
Haustoria
Sandal
Vernonia

58
Figure 3.24: Sandal with P. pinnata Figure 3.25: Roots of sandal and P. pinnata showing haustorial connection
Figure 3.26: Sandal without host plant showing unhealthy growth
Figure 3.27: Stunted root growth of sandal
Pongamia
Sandal
Haustoria
Sandal root
Pongamia root

59
3.4. DISCUSSION
The requirement of a suitable host plant for successful establishment of sandal had
been widely recognised. Host plants were considered as good, medium and poor hosts
depending on growth, biomass and number of haustoria produced by sandal when
associated with different hosts (Ananthapadmanabha et al. 1984; 1988). Host plants were further categorised into pot hosts, intermediate hosts and long term hosts (Fox et
al., 1990). Considerable variation existed between pot hosts in increasing sandal survival and field growth (Radomiljac, 1998). Hence, selection of appropriate pot hosts
is critical to ensure successful establishment of sandal plantation. However, many of the
conclusions drawn by earlier workers were not based on sound experimental results. In
this chapter we have examined the comparative merits of ten potential host plants.
The study has shown that host plants need be provided within 34 months after
transfer of sandal seedlings from mother bed to polybags. In the absence of a host, the
chlorophyll content will be drastically reduced, resulting in very low photosynthetic
efficiency and poor seedling growth. Earlier studies have shown that sandal seedlings
without a host did not show significant difference in growth up to 34 months as
compared to seedlings with hosts. This might be due to the fact that sandal could draw
nutrients by its root system and maintain normal seedling growth up to 3 months
(Barrett and Fox, 1997). Annapurna et al. (2006) has reported that requirement of host and its growth stage play a significant role in the growth of S. album seedlings in root
trainers. They reported that hosts when supplied immediately after transplantation to
root trainers resulted in better growth of sandal seedling in terms of height, collar
diameter, total dry weight and quality indices as compared to hosts provided after 15
months.
Earlier studies by Radomiljac (2000) on the influence of pot host species, seedling
age and supplementary nutrition on S. album plantation establishment in Western
Australia has concluded that selection of suitable pot host species depended on a
multitude of parameters and its use increased the level of S. album survival and growth
in the field. The selection of the best compatible host to support maximum growth while
minimizing competition for nutrients, water and light was very important for quality
seedling production of sandal. The pot host species must be compatible with sandal
seedlings’ nursery and field cultural regimes and an understanding of pot host growth

60
and vigour also is necessary. Consequently, a suitable pot host ‘pricking in’ regime is
required. If sown too early, the pot host will compete with S. album within the pot. Conversely, if sown too late, insufficient time for adequate haustorial connections
before the field establishment will result in outplanting stress to the sandal seedling.
Radomiljac and Mc Comb (1998) had observed differences in root:shoot ratio in their
study and suggested that partitioning of resources changes from root to shoot once
effective haustorial connections have been established. So the parasite will be very
vulnerable to water and nutrient deficits if the host plants are to die. Earlier studies have
also concluded that the requirement of host and the stage of host introduction played a
significant role in the growth of Santalum album (Barrett and Fox, 1997). In our study
we have observed increased height, collar diameter, fresh weight, DQI, Fv/Fm ratio, PI
and chlorophyll content for sandal seedlings grown with hosts when compared with
sandal seedlings without host (control).
So also, selection of proper hosts is important for growth and survival of sandal
seedlings. Cajanus cajan had been reported to be a suitable primary host (Rai, 1990;
Srinivasan et al., 1992; Srimathi et al., 1995). Being a leguminous host, it supported the growth of sandal at the nursery stage and at initial establishment in the field. However,
the rapid growth of C. cajan necessitated frequent pruning. So also it was prone to
fungal diseases and insect attacks, which necessitated intensive prophylactic and control
measures. Moreover, the high genetic variability of C. cajan also resulted in non uniform growth of S. album seedlings which adversely affect sandal seedling growth
(Annapurna et al., 2006). Among the leguminous and nonleguminous species examined by others, Alternanthera spp (Surata, 1992) and Alternanthera nana (Radomiljac, 1998) significantly improved seedling growth of S. album in terms of
height and collar diameter. Similarly A. sessilis was proved as the best host for S. austrocaledonicum (Bule and Daruhi, 1990). Ananthapadmanabha et al. (1988), Rai (1990) and Taide et al. (1994) had observed Casuarina equisetfolia to be the best pot
host in large size containers. In our study Vigna ungiculata, was found to be the best primary host. The present study has confirmed that legumes do have an advantage over
non legumes as hosts for sandal. Vigna unguiculata served as the best primary host
during the early stages of sandal seedling development till they were field transplanted. Pongamia pinnata, a leguminous tree species was found best suited as a long term host.

61
Moreover, leguminous hosts supported maximum chlorophyll content in sandal as
compared to nonleguminous host. Haustorial size was also found to be bigger with
leguminous hosts. Large haustoria ensure better nutrient absorption and growth of
sandalwood seedlings. Annapurna et al. (2006) found Mimosa pudica, another
herbaceous leguminous plant as the best primary host for S. album seedling growth in root trainers in terms of height, collar diameter, total dry weight, root:shoot ratio, root
surface area and quality index at nursery stage.
The growth performance of a seedling is determined by the plant’s physiological
activity. In the present study, chlorophyll fluorescence and chlorophyll content
measurements were used to test the best host combinations for sandal. We have used the
chlorophyll fluorescence parameters such as Fv/Fm values and Performance Index values
to assess the performance of sandal seedlings with four host plants under nursery
conditions. Performance Index (PI) values were found to be higher for sandal seedlings
growing with Ocimum (61.65) as host followed by Vigna (27.49). But, DQI values (Table 3.2), Fv/Fm values (Table 3.8) and chlorophyll content (Table 3.12) were higher
when Vigna was the host plant when compared to Ocimum as host. Moreover, Vigna, an annual leguminous species could grow well under shade along with sandal seedlings
whereas Ocimum required sunlight for its growth. So, V. unguiculata was chosen to be
the best annual pot host for sandal. Likewise, sandal plants showed higher PI, DQI and
Fv/Fm values, and chlorophyll content when P. pinnata was the host plant indicating its superiority over L. camara as a field host plant.
Studies conducted by Radomiljac et al. (1998a) on xylem transfer of organic solutes in S. album grown in association with leguminous and nonleguminous hosts
have shown that legumes over perform eucalypts as hosts for sandal. When grown in
association with N2 fixing hosts, Santalum shoot growth was markedly greater than when grown without a host. This difference has been directly attributed to the
substantial benefit in terms of nitrogen gain accruing from the intake of xylem solutes
from a well nodulated legume host. The beneficial effect on sandal would be increased
foliar Nitrogen concentrations, leaf chlorophyll contents and leaf photosysnthesis and
eventually large increase in leaf area. Rai (1990) and Taide et al. (1994) had earlier reported Casuarina equisetifolia L. (Casuarinaceae), a nitrogen fixing tree with large root nodules to be a good host, although in their experiments several nonnitrogen

62
fixing species were found to be better hosts than the leguminous species such as Albizia
lebbeck (L.) Benth., Acacia auriculiformis Cunn. Ex. Benth., Leucaena leucocephala (Lam.). De Wit (all Mimosaceae) and Cassia fistula (Caesalpinaceae). There are other reports of root hemiparasites performing particularly poor on nonleguminous hosts,
such as Olax phyllanthi (Labill) R. Br. attached to Amaranthus caudatus L. and Portulaca oleraceae L. (Tennakoon and Pate, 1996).
3.6. CONCLUSION
The present study has concluded that plantable quality of S. album seedling can be
produced in polybags within 68 months by providing Vigna unguiculata as the primary (pot) host among the eight potential annual host plants tested. On field transplantation
Pongamia pinnata can be supplied as the long term host. This protocol is useful for raising sandal seedlings under nursery conditions and subsequent field transplantation.

CHAPTER 4
EFFECTS OF SHADE ON MORPHOLOGY, CHLOROPHYLL CONCENTRATION AND
CHLOROPHYLL FLUORESCENCE OF SANDAL SEEDLINGS

63
4. EFFECTS OF SHADE ON MORPHOLOGY, CHLOROPHYLL CONCENTRATION AND CHLOROPHYLL FLUORESCENCE OF
SANDAL SEEDLINGS
4.1. INTRODUCTION
Sandalwood resource in India is currently threatened because of illicit felling,
smuggling, forest fire, grazing and to some extent spike disease. Due to these factors
there has been a drastic reduction in the production of sandalwood. Solutions suggested
to prevent the loss of sandal wealth are not only the adoption of effective conservation
measures and prevention of uncontrolled exploitation, but also implementation of
programs of reintroduction of this species in the ecosystem. For the species introduction
to be successful, it is necessary to obtain sufficient information about its
ecophysiological characteristics.
For achieving successful propagation, a better understanding of the seedling’s
morphological and physiological requirements under nursery conditions are necessary.
Among the major environmental factors, light is perhaps the most influential factor
involved in the survival, growth and reproduction of any tree species. Light responses
usually evoke physiological alterations, which are determinants for CO2 assimilation
and optimization of gas exchange. Environments that are either shaded or under full
sunlight can inhibit photosynthetic processes. Excess of light causes degradation and
reduction in the levels of total chlorophyll and reduction in field productivity as a result
of photoinhibition (Francisco et al., 2005). Therefore the optimum light required for each species need be evaluated for their healthy growth.
Quality seedlings should be used for raising successful plantations. In the past,
seedling quality was evaluated primarily on the basis of morphological characteristics
such as height, collar diameter and shoot:root ratio. In recent years, physiological
characterization has been used more in quality assessment. Chlorophyll fluorescence is
a useful physiological test because it is noninvasive and rapid (Vidaver et al., 1989), and provides information on the qualitative and quantitative changes in photosynthesis.
It also facilitates analysis of chlorophyll fluorescence of intact live leaves (Slapakauskas
and Ruzgas, 2005).

64
Chlorophyll fluorescence of a predarkened leaf exhibits a characteristic temporal
pattern (Kautsky and Hirsh, 1931). Chlorophyll fluorescence rises rapidly from a
ground state (Fo) when all the electron acceptors are fully oxidised, to a maximum level
(Fm), when electron acceptors are fully reduced and unable to accept and transfer
electrons. Chlorophyll fluorescence then decreases slowly to a steady state (Fs) as
photochemistry and CO2 assimilation increases (Krause and Weis, 1991). Fv/Fm (where
Fv=FmFo) is a parameter commonly known as the maximum quantum yield of primary
photochemistry or maximal relative electron transport rate (ETR) of Photosystem II
(Waldhoff et al, 2002). It is frequently used as an expression of photoinhibition which decreases with photoinhibition (Critchley, 1998; Kitao et al., 2000a), is linearly
correlated with the quantum yield of net photosynthesis (Krause and Somersalo, 1989)
and is a good measure of seedling vigour.
Normally, the measurement of the pigments from the chloroplasts and the analysis
of fluorescence from chlorophyll a are used as stress indicators of high irradiance in plants (Francisco et al., 2005). Chlorophyll fluorescence is also used as a diagnostic tool
to study environmental stress (Binder and Fielder, 1996; Balasimha and Namboothiri,
1996), genotypic variation (Janssen et al., 1995), species specific diurnal changes (Joshi, 1995), early diagnosis of stress (Pukacki and Modrzynski, 1998), responses to
shade (Khan et al., 2000), screening of physiologically active and fast growing trees at different altitudes (Husen et al., 2004) and leaf photosynthetic performance
(Slapakauskas and Ruzgas, 2005).
The objective of this study was to evaluate the effects of shade on morphology,
chlorophyll concentration and chlorophyll fluorescence of sandal seedlings under
nursery conditions.
4.2.MATERIALS AND METHODS
4.2.1. Plant material
Seeds were sown in vermiculite. During the second month after germination the
seedlings were transplanted to individual polybags containing 2:1:1 mixture of
soil:sand:farm yard manure (FYM). There were four treatments as given below, each
with 25 seedlings.

65
(i) Seedlings grown under full sunlight
(ii) Seedlings grown under 25 per cent shade
(iii) Seedlings grown under 50 per cent shade
(iv) Seedlings grown under 75 per cent shade
4.2.2. Shade treatments
Seedlings were grown under full sunlight and under shade nets that provided
approximately 25 per cent, 50 per cent and 75 per cent shade. Shade net samples
obtained from market were checkmeasured for Photosynthetically Active Radiation
(PAR) penetration using a Quantum sensor (LiCor, Nebraska, USA). The shade given
by these nets was then quantified and graded according to their light interception. These
shade nets were fabricated on metallic frames so that the height of the enclosures ranged
from 1.8 to 2 m from the ground (Fig 4.1). Accordingly, the four treatments provided
full sunlight (no shade net), and 25 per cent, 50 per cent and 75 per cent shade. Seedlings
were watered regularly, and polybags handweeded as and when necessary. No fertilizer
was applied because the potting medium was considered to have adequate fertility.
Figure 4.1: Sandal seedlings grown under shade net enclosures

66
4.2.3. Morphological measurements
Measurements were made at regular intervals on height, collar diameter, number of leaves and leaf area of seedlings grown under each shade percentage (Fig. 4.2 & 4.3). At the end of the study (i.e. eight months after germination), each seedling was harvested and measurements made on height, number of leaves, leaf area, collar diameter, total biomass, shoot biomass and root biomass. In addition, dry weights of shoot and root were recorded after partitioning the seedlings into shoots and roots and oven drying at 75°C for 48 hours.
Figure 4.2: Sandal seedlings under different shade intensity
Figure 4.3: Sandal seedlings under 100 % sunlight
The quality of the seedlings was determined using SQ, DQI and PI as discussed in
chapter on host relationships of sandal seedlings (Chapter 3). Chlorophyll a, chlorophyll b and total chlorophyll concentrations were measured on leaves of randomly selected seedlings from each treatment following the protocol given below.
For the estimation of chlorophyll content, fresh leaves were collected from each
group; 250 mg of leaf sample was weighed and homogenised with 5 ml of 80 per cent
acetone (prechilled). The homogenate was centrifuged at 5000 rpm for 5 minutes and
the supernatant was transferred to a 100 ml conical flask. The procedure was repeated
until the residue was colourless. The final volume was made upto 25 ml with 80 per

67
cent acetone. The absorbance of the solution was read at 645 and 663 nm against blank
solvent (80 per cent acetone) using a spectrophotometer (Genova MK3, UK). Using the
absorption coefficient, the amount of chlorophyll was calculated based on the protocol
of Sadasivam and Manickam (1992). Chlorophyll content of sandal plants from each
treatment were analysed and compared using the formulae.
mg chlorophyll a / g tissue = 12.7 (A663) 2.69 (A645) x V/1000 x W
mg chlorophyll b / g tissue = 22.9 (A645) 4.68 (A663) x V/1000 x W
mg chlorophyll / g tissue = 20.2 (A645) + 8.02 (A663) x V/1000 x W
where,
A= Absorbance at specific wavelengths
V= Final volume of chlorophyll extract in 80 per cent acetone
W= Fresh weight of the tissue extracted (g)
4.2.4. Experimental design and statistical analysis
For the experiment a Completely Randomised Block Design with 4 treatments and
25 replicates was accepted. Measurements of morphological characters were made on
all the seedlings. Four seedlings of each treatment were randomly selected for
chlorophyll fluorescence and chlorophyll concentration measurements. The data were
analysed using one way ANOVA (SPSS 16 software).
4.3. RESULTS
The height of the seedlings did not differ much among the treatments during the
initial months. But, none of the seedlings exposed to full sunlight survived beyond 6
months from the start of the experiment (Table 4.1 and Figure 4.4). Significant difference in
seedling growth and morphological characteristics among the four treatments was
observed at the 3 rd (February) and 4 th month (March) of observation and at the 6 th month
(May) among the surviving three treatments (Table 4.1, 4.2, 4.3 and Fig 4.4).
The final mean height of the seedlings ranged between 10.8 cm12.78 cm, shoot
fresh weight ranged between 2.793.17g, shoot dry weight ranged between 2.162.56g,
root fresh weight ranged between 1.722.08g, root dry weight ranged between 1.26
1.54g and shoot:root dry weight ranged between 1.611.74g among the treatments. The

68
shoot:root dry weight was lowest under 75 per cent shade followed by 25 per cent shade
and 50 per cent shade. SQ value of sandal seedlings ranged between 5.757.11 and DQI
value ranged between 0.350.47 among the treatments. DQI was highest under 25 per
cent shade followed by 50 per cent shade and 75 per cent shade. Performance Index (PI)
value was highest for 75 per cent shade treatment (2.59) followed by 25 per cent shade
treatment (1.5) and 50 per cent shade treatment (1.06) (Table 4.3, 4.4 and Fig 4.5).
Except collar diameter (CD), Sturdiness Quotient (SQ) and Performance Index (PI), all
other parameters showed significant difference between the treatments (P=0.05).
Table 4.1. Height (cm) of sandal seedlings under four shade treatments monitored for six months from two months after germination (mean ± SE )
Shade %
Dec Jan Feb Mar Apr May
0 10.2 ± 0.41
10.6 ± 0.48
10.9 ± 0.48
11.5 ± 0.53
25 10.25 ± 0.06
10.3 ± 0.36
11.1 ± 0.36
11.3 ± 0.52
11.57 ± 0.55
12.78 ± 0.45
50 10.1 ± 0.32
10.3 ± 0.25
10.4 ± 0.31
10.5 ± 0.31
10.5 ± 0.32
10.8 ± 0.33
75 10.25 ± 0.28
10.3 ± 0.35
10.5 ± 0.35
10.58 ± 0.32
10.7 ± 0.38
11.5 ± 0.38
Figure 4.4: Height of sandal seedlings under four shade treatments monitored for six months from two months after germination

69
Table 4.2. ANOVA Height of sandal seedlings under four shade treatments monitored for six months from two months after germination
Sum of Squares df Mean
Square F Table F value at 5%
December Between Groups 1.639 3 .546 .183 2.76 Within Groups 250.485 84 2.982
Total 252.123 87
January Between Groups 29.393 3 9.798 2.715 2.76 Within Groups 303.115 84 3.609
Total 332.509 87
February Between Groups 32.796 3 10.932 2.957* 2.76 Within Groups 310.522 84 3.697
Total 343.318 87
March Between Groups 48.961 3 16.320 3.452* 2.76 Within Groups 397.083 84 4.727
Total 446.044 87
April Between Groups 25.342 2 12.671 2.699 3.15 Within Groups 295.757 63 4.695
Total 321.099 65
May Between Groups 59.413 2 29.707 7.955* 3.15 Within Groups 235.268 63 3.734
Total 294.681 65
* significant at 5 % level
Table 4.3. Final morphological characteristics of sandal seedlings under three shade treatments (mean ± SE)
% Shade
Height CD TFW SFW SDW RFW RDW SDW/ RDW SQ DQI PI
25 12.78 ± 0.45
1.8 ± 0.07
5.33 ± 0.13
3.17 ± 0.11
2.56 ± 0.11
2.08 ± 0.07
1.54 ± 0.07
1.66 ± 0.11
7.11 ± 0.37
0.47 ± 0.02
1.5 ± 0.21
50 10.81 ± 0.33
1.88 ± 0.06
4.56 ± 0.14
2.79 ± 0.08
2.19 ± 0.08
1.72 ± 0.08
1.26 ± 0.07
1.74 ± 0.36
5.75 ± 0.48
0.37 ± 0.08
1.06 ± 0.48
75 11.05 ± 0.38
1.68 ± 0.11
4.66 ± 0.10
2.83 ± 0.07
2.16 ± 0.06
1.84 ± 0.08
1.34 ± 0.06
1.61 ± 0.20
6.57 ± 0.47
0.35 ± 0.02
2.59 ± 0.66
Height = Shoot height (cm); CD = Collar diameter (mm); TFW = Total Fresh Weight (g); SFW = Shoot Fresh Weight (g); SDW = Shoot Dry Weight (g); RFW = Root Fresh Weight (g); RDW = Root Dry Weight (g); SDW/RDW = Shoot Dry Weight/ Root Dry Weight; SQ = Sturdiness Quotient; DQI = Dickson Quality Index; PI = Performance Index

70
Figure 4.5: Final morphological characteristics of sandal seedlings under three shade
treatments
Table 4.4. ANOVA Final morphological characteristics of sandal seedlings under
three shade treatments
Variable Degrees of freedom
Calculated F value
Table F value
Height 2,69 7.424* 3.15 Collar diameter 2,69 1.652 3.15 Total Fresh Weight 2,69 10.890* 3.15 Shoot Fresh Weight 2,69 5.012* 3.15 Shoot DryWeight 2,69 5.825* 3.15 Root Fresh Weight 2,69 5.309* 3.15 Root Dry Weight 2,69 4.163* 3.15 Shoot Fresh Weight / Root Fresh Weight
2,69 14.836* 3.15
Sturdiness Quotient 2,69 1.858 3.15 Dickson Quality Index 2,69 13.678* 3.15 Performance Index 2,10 0.157 4.10
* significant at 5 % level

71
Seedlings grown under zero per cent shade (full sunlight) displayed stress symptoms;
chlorosis was especially noticeable compared to other treatments. By the end of the
fourth month, about 92 per cent of the seedlings kept exposed to full sunlight wilted and
within a month complete mortality was recorded (Table 4.5 and Fig 4.6).
Table 4.5. Mortality percentage of sandal seedlings under four shade treatments monitored for six months from two months after germination
Shade % % mortality
Dec Jan Feb Mar Apr May
0 0 4 4 4 92 100
25 0 4 8 8 8 12
50 0 0 0 0 0 0
75 0 0 0 0 0 0
Figure 4.6. Percentage mortality of sandal seedlings under four shade treatments monitored for six months from two months after germination
Figure 4.7 gives the normalization plot of the typical fluorescent transients obtained
from the three shade treatments.

72
Figure 4.7: Typical fluorescent transients obtained from three different
shade treatments in sandal seedlings at 7 th month
Curves No. 15 : Seedlings under 75% shade Curves No. 610 : Seedlings under 50% shade Curves No. 1216 : Seedlings under 25% shade
The effect of shade treatment on chlorophyll fluorescence in sandal is shown in
table 4.6. as Fv/Fm ratio during the five months of observation. There was significant
difference in Fv/Fm values between the four different shade treatments during the
months of January and February for sandal seedlings (Table 4.7 and Fig. 4.8). The
highest fluorescence was shown by seedlings subjected to 75 % shade.
Table 4.6. Effect of shade on chlorophyll fluorescence (Fv/Fm) of four shade treatments
monitored for five months from three months after germination
% Shade Jan Feb Mar Apr May
0 0.34 ± 0.07 0.41 ± 0.04 0.53 ± 0.04 Plants did not survive
Plants did not survive
25 0.58 ± 0.04 0.58 ± 0.03 0.57 ± 0.03 0.60 ± 0.02 0.62 ± 0.03 50 0.61 ± 0.01 0.62 ± 0.02 0.63 ± 0.06 0.61 ± 0.04 0.59 ± 0.01 75 0.67 ± 0.03 0.65 ± 0.02 0.58 ± 0.03 0.58 ± 0.04 0.61 ± 0.05
0.01 0.1 1 10 100 1000 1.0E+4 Time [ms]
0.0
200.0
400.0
600.0
800.0
1000.0
1200.0
1400.0
1600.0
1800.0
2000.0
2200.0
2400.0
2600.0
2800.0
3000.0
3200.0
3400.0
3600.0
3800.0
4000.0
Fluores
cenc
e [m
V]
Normalization Plot
0.05 0.10 0.30 2.00 30.00
1
2
3
4
5
6
7
8
9
10
11
12 13
14 15 16
75 % Shade
50 % Shade
25 % Shade

73
Table 4.7. ANOVAVariation in Fv/Fm under four shade treatments monitored for five
months from three months after germination
Sum of Squares df Mean Square Calculated F value
Table F value
January Between Groups .251 3 .084 10.511* 3.49
Within Groups .096 12 .008
Total .347 15 February Between Groups .135 3 .045 11.409* 3.49
Within Groups .047 12 .004 Total .182 15
March Between Groups .021 3 .007 .904 3.49 Within Groups .091 12 .008
Total .112 15 April Between Groups .006 2 .003 .273 4.26
Within Groups .094 9 .010 Total .100 11
May Between Groups .005 2 .002 .269 4.26 Within Groups .076 9 .008
Total .081 11
* significant at 5 % level
Figure 4.8: Variation in Fv/Fm under four shade treatments monitored for five months from three months after germination

74
Figure 4.9: Monthly variation of Fv/Fm monitored for five months from three months after germination
There was significant difference in Performance Index (PI) between the four shade
treatments during January and February and not during subsequent months (Table 4.8 &
4.9; Fig 4.10). The PI was highest for seedlings raised under 75 per cent shade during
fourth and fifth month growth. Analysis of final morphological characteristics and
chlorophyll fluoresecence data indicated that the sandal seedlings performed well under
75 per cent shade. Performance Index values also support this observation.

75
Table 4.8. Performance Index (PI) of sandal seedlings under four shade treatments monitored for five months from three months after germination
% Shade
Jan Feb Mar Apr May
0 0.30 ± 0.18 0.35 ± 0.20 0.36 ± 0.15 Plants did not
survive Plants did not
survive 25 1.61 ± 0.31 1.47 ± 0.42 1.51 ± 0.05 1.74 ± 0.37 1.5 ± 0.21
50 1.37 ± 0.32 2.13 ± 0.24 1.63 ± 0.57 1.41 ± 0.19 1.07 ± 0.45
75 3.45 ± 0.61 2.21 ± 0.39 1.33 ± 0.55 1.78 ± 0.23 2.6 ± 0.67
Table 4.9. ANOVA Variation in PI under four shade treatments monitored for five
months from three months after germination
Sum of Squares
df Mean Square F Table F value
January Between Groups 11.158 3 3.719 4.802* 3.41
Within Groups 10.068 13 .774
Total 21.226 16
February Between Groups 7.501 3 2.500 5.224* 3.41
Within Groups 6.222 13 .479
Total 13.723 16
March Between Groups 3.445 3 1.148 1.479 3.41
Within Groups 10.090 13 .776
Total 13.534 16
April Between Groups .132 2 .066 .207 4.10
Within Groups 3.177 10 .318
Total 3.308 12
May Between Groups .374 2 .187 .157 4.10
Within Groups 11.874 10 1.187
Total 12.248 12
* significant at 5 % level

76
Figure 4.10: Variation in PI under four shade treatments monitored for five months from three months after germination
Chlorophyll a, chlorophyll b and total chlorophyll per g leaf tissue was highest for seedlings raised under 50 per cent shade (Table 4.10; Figure 4.11) when tested during
the sixth month.
Table 4.10. Effect of shade on total chlorophyll content of sandal seedlings under four shade treatments
% Shade Chlorophyll a mg/g tissue
Chlorophyll b mg/g tissue
Total chlorophyll mg/g tissue
0 3.12 ± 0.04 2.43 ± 0.05 5.55 ± 0.05 25 2.06 ± 0.04 1.57 ± 0.04 3.63 ± 0.08 50 3.45 ± 0.06 3.42 ± 0.06 6.87 ± 0.11 75 1.92 ± 0.04 1.57 ± 0.03 3.49 ± 0.05
Figure 4.11: Chlorophyll content variation under four different shade treatments

77
4.4. DISCUSSION
Seedling quality is a concept, widely used in forestry, which has received
considerable attention in Europe and the U.S. It is of prime importance since the
afforestation programmes cannot receive the same attention as of individual fruit trees
in an orchard or ornamental plants. Once planted, the seedlings have to survive the
harsh environmental conditions. Many studies have shown that field survival and
productivity are related to the quality of seedlings used (McTague and Tiius, 1996). As
most of the morphological parameters can be measured easily, they are used for
determining seedling quality (Thompson, 1986).
Many seedling quality parameters such as shoot dry weight:root dry weight ratio,
have been conventionally used for assessing the quality of seedlings used for planting.
According to Thompson (1986), as the planting site becomes more arid, the optimum
seedling height for survival is lesser. Larsen et al. (1986), Tuttle et al. (1987), Wilder
Ayers and Tolliver (1987), and Mexal and South (1991) reported a negative correlation
between seedling survival and seedling height. Mexal and Landis (1990) has reported
that shorter, stockier seedlings are preferred for arid sites whereas taller seedlings for
sites where vegetative competition or animal damage is severe. Seedling root collar
diameter also is generally accepted to be better than height as a positively correlated
morphological measure of seedling survival and growth (Thompson, 1986; Mexal and
Landis, 1990). Root biomass is often correlated with seedling diameter; but shoot
height, collar diameter and shoot biomass have been found to be better predictors of
field survival.
Sturdiness quotient (SQ) is a simple and nondestructive method of determining the
sturdiness of the plant based on a relation between the height and collar diameter of the
seedlings. Based on investigations conducted earlier, it has been specified that for
seedlings of temperate species the SQ should not be more than 6 for a good seedling.
This value cannot be taken as the sole criterion for comparison with tropical plants,
although it is generally agreed that if SQ increases, the seedlings will be less sturdy.
Unfortunately in India this criterion has not been used to determine the seedling quality.
Hence, it is difficult to pinpoint a particular SQ value for optimum seedling quality.
According to Ritchie (1984), the final test of a forest tree seedling is its performance
after out planting. It is important to study the survival of different species with different

78
SQ values in different locations under varying climatic conditions, especially for
tropical species. The SQ values for sandal seedlings grown under different shade
treatments in our study ranged from 5.757.11. SQ was lowest (5.75) for seedlings
under 50 per cent shade, followed by 75 per cent shade and 25 per cent shade.
The shoot dry weight:root dry weight ratio is another important measure indicative
of seedling survival. It relates the transpiring area (shoot) to the water absorbing area
(root). Usually a seedling which shows 1:1 to 1:2 shoot:root ratio is considered as
healthy. However, in this ratio the height of the plant or collar diameter, which are
important factors to be considered in determining the seedling quality, are not taken into
consideration. Hence, Dickson Quality Index (DQI) is a more refined value which takes
into account both these parameters and so also the total biomass of the seedling. This
index is very informative in determining the quality of the seedlings, although
destructive sampling is required. In the present study DQI of sandal seedlings ranged
from 0.35 to 0.47.
The growth performance of a seedling is basically determined by the physiological
activity of the plant. There are very few physiological criteria that can be practically
used to test the quality of the seedlings. Measurements of chlorophyll fluorescence have
been found to be useful as an indicator for stress identification in plants. However, it has
now been realized that there are several other derived parameters such as Performance
Index that are much more sensitive in determining the performance of the photosystem
in plants. In our study, Fv/Fm ratio ranged between 0.34 and 0.67. Fv/Fm values were
almost similar under 50 per cent and 75 per cent shade. Lower Fv/Fm values were
observed for sandal seedlings grown under full sunlight. It might be due to impairment
of PSII function due to photoinhibition. Seedlings grown under full sunlight exhibited
extreme stress symptoms as chlorosis and wilting; 100 per cent mortality was recorded
within six months of start of the experiment. Performance Index (PI) value was greater
for sandal seedlings under 75 per cent shade (2.6) in comparison with other treatments.
Studies on Tectona grandis also had shown a steady increase in PI as shade increased upto five months from January to May (Chacko et al., 2002).
Generally, the level of chlorophyll a and b tends to decrease with the increase in light intensity. Studies on four Pacific Northwest conifer species have shown that the
concentration of chlorophyll a increased as the level of shade increased (Khan et al.,

79
2000). In our study on sandal seedlings under different shade treatments, chlorophyll a
and b concentration and total chlorophyll content were found to be higher under 50 per cent shade. Though higher chlorophyll content was initially observed in seedlings under
full sunlight complete mortality was recorded within six months of the start of the
experiment.
Our results indicate that the JIPtest parameters are a good indication of the
performance of the photosynthetic apparatus. The visual symptoms are sometimes
deceptive or difficult to be used to assess the performance of the seedlings in the
nursery. Whereas, the JIPtest, which is rather simple to apply and noninvasive, is very
helpful in picking the most suitable treatment from a group of plants under different
shade treatments. When the Performance Index given by the JIPtest is applied along
with the morphological indices, SQ and DQI, it is possible to make meaningful
assessments of the seedling quality.
4.5. CONCLUSION
Evaluating seedling response to shade is of utmost importance in a successful
regeneration programme. Shadegrown seedlings can be considered as more efficient
than sun grown seedlings in utilising low levels of light because of a much lowered light
compensation point. Studies on vegetative competition has shown that a high ratio of
height to diameter in seedlings can result in a subsequent decline in growth, leading to
suppression and death (Khan et al., 2000).
Sandal seedlings are sciophilic in the early phase, becoming more heliophilic once
established. Data from our studies indicate that 50 per cent75 per cent shade is optimal
for growth of sandal seedlings up to one year. Results indicate that the photosynthetic
activity of sandal seedlings may be limited due to photoinhibition when grown in open
environments with high light intensity. Extremes of light intensity can cause mortality
of the seedlings as observed in our study.

CHAPTER 5
GENETIC DIVERSITY OF FUSARIUM OXYSPORUM Schlechtend Fr ISOLATES
CAUSING SANDAL SEEDLING WILT

80
5. GENETIC DIVERSITY OF FUSARIUM OXYSPORUM Schlechtend Fr ISOLATES CAUSING SANDAL SEEDLING WILT
5.1. INTRODUCTION
Sandalwood seedlings are affected by fungal diseases and insect pests, which take a heavy toll in nurseries and sometimes, the whole stock is wiped off. Fusarium oxysporum, Rhizoctonia solani, Phytophthora spp. and Pythium spp. cause serious dampingoff and wilting of sandal seedlings. Mortality of seedlings due to pre emergence and postemergence damping off, root rot, collar rot, stem infection and wilting of older seedlings have been recorded (Remadevi et al., 2005). Asochyta santali, Macrophomina phaseoli, Asterina congesta and Sphaecelomia santali are the most common fungi causing leaf spot disease.
5.1.1. Fusarium wilt of sandal
Fusarium oxysporum Schlechtend Fr is the most common and most virulent fungal pathogen infecting sandal seedlings causing preemergence decay, vascular wilt, root rot and wilting of older seedlings (Sreenivasan et al., 1992). Remadevi et al. (2005) have reported high incidence of damping off and seedling wilt due to Fusarium oxysporum in sandal nurseries in Karnataka and Tamil Nadu which wiped out the entire nursery stock. The F. oxysporum isolates from infected tissues were grown on PDA medium and inoculated to healthy seedlings under controlled conditions. Wilt symptoms and chlorosis developed 710 days after fungus inoculation. Pathogen was reisolated from diseased plants proving Koch’s postulates.
5.1.2. Variability and spore formation in Fusarium
Fungi belonging to the genus Fusarium contain many species that attack a large number of crops, causing seed rot, root rot, foot rot, stalk rot, wilt, yellows, and ear and kernel rots. Fusarium species are present in both temperate and tropical climatic regions of the world. There is wide variability in the pathogenicity of the fungal isolates, and in many Fusarium spp. various formae speciales (f. sp) and physiological races are known. The genus Fusarium composed of many pathogenic species and strains, lives in the soil and attacks cultivated crops and many wild plants. Serious loss may result, especially on

81
susceptible cultivars when weather conditions are favourable for disease development and spread (George et al., 1992). Fusarium spp. produce three kinds of spores microconidia which are colourless, single celled, spherical spores, about 615 µm in length and 35 µm in diameter, the sickle shaped, colourless macroconidia, having three to five cross walls and average length of 3050 µm and a diameter of 25 µm and the smooth, spherical single cells about 10 µm in diameter called chlamydospores produced on older mycelium. All three spore types are produced in soil or on infected plants. After infected plants die, the fungus and its spores are returned to soil, where they may persist indefinitely (George et al.,1992).
5.1.3. Genetic variability study of pathogenic fungi
Traditional markers used to study variability in plant pathogens are based on
cultural characteristics, morphological features and biochemical capabilities of the
pathogen besides infection on differential hosts. However, these markers are influenced
by host age, inoculum quality and environmental conditions. Moreover, these
techniques are timeconsuming and laborious. Hence, recently, molecular markers are
used for studying genetic variability in plant pathogens. PCRbased DNA fingerprinting,
particularly with short oligonucleotide primers, has been used by various researchers for
the analysis of genetic variation in plant pathogens. Molecular markers, apart from
elucidation of genetic variability, can also be used to study evolution and monitoring
movement of pathogen population over time and space (Sharma et al., 2006). PCR methods have several advantages over those of RFLP analysis since very little DNA is
needed, many samples can quickly be screened and numerous experiments are possible
within a short time. RAPD offers a promising, versatile and informative PCR based tool
to detect genetic variation within populations of plant pathogens (Saharan et al., 2007).
5.1.4. Genetic variability of F. oxysporum
F. oxysporum is the sole species of the section Elegans which comprises pathogenic and nonpathogenic strains. Plant pathogenic forms cause wilt disease and are grouped
into formae speciales based on their host range; some are further subdivided into
pathogenic races. Molecular markers have been used to characterize genetic diversity of
different isolates of F. oxysporum, formaespeciales (AlvesSantos et al., 2002) and

82
races within form species (Kelly et al., 1994, 1998; Balmas et al., 2005; Liu et al.,
2006). F. oxysporum causes extensive disease problems such as a vascular wilt on a variety of crops worldwide (Singh et al., 2006). Genetic diversity studies using RAPD markers were carried out on F. oxysporum isolates from Cucumber (Vakalounakis and
Fragkiadakis, 1999), Chickpea (Singh et al., 2006; Honnareddy and Dubey, 2006), Carnation (Manulis et al., 1994) and isolates from three agroclimatically different regions of northwestern Himalayas (Sharma et al., 2006), causing vascular wilt on
Erythroxylum coca var. coca in cocagrowing regions of Huallaga Valley in Peru (Amy et al., 1997) and causing wilt of lentil plants in Northwest Algeria (Belabid et al., 2004). A detailed review on this topic is provided in Review of Literature (Chapter 2).
5.1.5. Objective of the present study
F. oxysporum, a common soil borne fungus with a worldwide distribution, has no
known sexual stage. This organism probably causes more economic damage than any
other plant pathogen, and has been shown to constitute as much as 8090 per cent of the
total fungal microflora in the rhizosphere of several agricultural crops; it is responsible
for wilt and cortical rot diseases of more than 100 economically important host plants
(Swifty, 2002). No previous studies have been done on the genetic variability of F.
oxysporum which cause serious damping off and wilting of sandal seedlings taking a heavy toll and wiping off the whole nursery stock. The objective of our study was to
evaluate the genetic diversity of F. oxysporum causing heavy mortality to S. album
seedlings under nursery and forest conditions.
5.2. MATERIALS AND METHODS
5.2.1. Fungal isolates
Fusarium oxysporum isolates were obtained from infected root, stem and collar
region from germinating seedlings to 3monthold seedlings collected from sandal
nursery at KFRI, Peechi, Thrissur campus, and from sandal nursery and sandal
regeneration experimental plot in Nachivayal sandal reserve in Marayur Sandal
Division, Idukki District, Kerala (Figure 5.1). Seeds were sown in polybags filled with
soil, sand and farm yard manure in the ratio 2:1:1 at KFRI nursery and the seedlings

83
were examined at various stages of growth for fungal infection. Out of the 1720
germinated seedlings 336 (19.5%) died due to serious infection of F. oxysporum during a period of nine months at KFRI, Peechi. The infected portions were gently washed first
in tap water and then in sterile water, cut into small pieces of about 25 mm, and were
transferred to sterile petriplates. These pieces were then surface sterilized with 0.1 per
cent HgCl2 solution for 15 seconds. The tissue sections were immediately transferred to
Petri dishes containing sterile distilled water and washed repeatedly to remove traces of
the surface sterilant. The surface sterilised tissues were inoculated to sterile petriplates
containing Potato Dextrose Agar (PDA) medium amended with 30mg/l of Streptomycin
sulphate to prevent bacterial growth.
After 45 days, fungal colonies growing on PDA medium in petriplates were
streaked onto fresh PDA plates for obtaining pure cultures. The new plates were then
incubated at 25 ± 1ºC and examined for cultural characteristics and for conidial
morphology. All the isolates were identified as F. oxysporum based on the characters described by Booth (1971). Pure cultures were obtained from diseased sandal seedlings
from KFRI nursery at Peechi, Thrissur District, from diseased seedlings from sandal
nursery raised at Marayur and the seedlings growing on forest floor in KFRI sandal
regeneration experimental plot at Marayur. We had isolated 48 isolates from Peechi and
54 isolates from Marayur. Three isolates were randomly selected based on cultural
variations from Peechi isolates (Fo.P1, Fo.P2 and Fo.P3) and three from Marayur
isolates (Fo.M1, Fo. M2 and Fo.M3) for genetic diversity studies using RAPD markers
(Fig 5.2). Isolates subcultured onto PDA slants were stored at 4ºC for further
experiments. The composition of PDA medium is provided below.
Peeled Potato250g
Dextrose20g
Agar15g
Distilled Water1000ml
pH6.8
Potato was peeled into thin chips, boiled in 500 ml of water and extract collected.
To the extract, the weighed quantity of dextrose was added. Agar was melted in the
other half of water and mixed with potatodextrose solution and the volume was made
up to a litre before sterilising.

84
5.2.2. Total genomic DNA extraction and purification
Genomic DNA was extracted from mycelial tissue following slightly modified method
of Doyle and Doyle (1990). For DNA extraction, fungal mycelium scrapped out from
individual cultures grown on PDA medium for 23 days were used. The mycelium was
homogenated in CTAB buffer containing 100 mM Tris pH 8.0, 20 mM EDTA pH 8.0, 1.4
M NaCl, 1 per cent PVPP and an additional 2 M NaCl (200 µl). To the fine homogenate,
RNase (20 µl) and proteinase (4 µl) were added and incubated at 60ºC for 45 minutes. Samples
were then extracted in an equal volume of chloroform:Isoamyl alcohol (24:1) followed by
centrifugation at 10,000 rpm for 10 minutes. The supernatant was transferred to an
eppendorf tube, equal volume of chloroform added, shaken and again centrifuged at 10,000
rpm for 10 minutes. To the supernatant, double the volume of icecold ethanol (100%) was
added. After incubation at 20ºC for 12 hours, DNA was precipitated by centrifugation at
10,000 rpm for 10 minutes. The supernatant was discarded. The DNA pellet was resuspended
in ethanol (80%) and centrifuged twice at 8,000 rpm for 10 minutes. The air dried pellet
was dissolved in 100 µl of double distilled water and checked for purity on agarose gel.
Infection on seedling stem
Infection at collar region Infection at collar region
Figure 5.1. Sandal seedlings showing typical symptoms of wilt caused by F. oxysporum

85
Fo.P1 Fo.P2
Fo.P3 Fo.M1
Fo.M2 Fo.M3
Figure 5.2. F. oxysporum isolates selected for RAPD analysis Fo.P1, Fo.P2 and Fo.P3: Isolates from Peechi, Thrissur Fo.M1, Fo.M2 and Fo.M3: Isolates from Marayur
5.2.3. RAPD primers and PCR amplification
Twenty four RAPD primers were initially screened for F. oxysporum DNA amplification and production of clear, sharp and repeatable amplicons. Of these, 9 primers viz., OPB01, OPB04, OPB07, OPB10, OPB11, OPB14, OPB15 of kit OPB and OPD18 and OPD19 of kit OPD which produced repeatable and unambiguous amplicons on agarose gel were selected for RAPD analysis of the 6

86
isolates of F. oxysporum (Table 5.1). RAPDPCR amplifications were carried out in a final volume of 25 µl consisting of 1.5 mM MgCl2, 200 µM of dNTPs, 5 µM of primer, 0.125 µl (0.375 U) of Taq DNA Polymerase (Bangalore Genei, Bangalore, India), 2.5 µl of 10X reaction buffer (500 mM KCl, 15 mM MgCl2, 100 mM TrisHClpH 8.0) and approximately 2 µl (3050 ng) of template DNA. PCR amplifications were performed in PTC100 Thermal cycler (MJ Research, WaterTown, MA, USA) under the following conditions: Initial denaturation at 94°C for 5 minutes; 30 cycles of PCR, each of 94°C
for 1 min (denaturation), 37ºC for 1 min (primer annealing) and 72°C for 2 minutes (strand synthesis and extension) and a final extension of 72°C for 5 minutes. PCR products were stored at 80°C. The amplification products were separated by electrophoresis on 1.5 per cent agarose gel in 1X TBE buffer. After running for approximately 90 minutes at 75V, the gel was stained with 0.05 per cent ethidium bromide and viewed on a UV transilluminator. The DNA profile was photographed using Gel Doc System DPCF011 (Vilber Lourmat, France) and transferred to a computer.
Table 5.1. Primers used for RAPD analysis and their sequences
Primer code Primer sequence (5´3´)
OPB01 GTT TCG CTCC
OPB04 GGA CTG GAGT
OPB07 GGT GAC GCAG
OPB10 CTG CTG GGAC
OPB11 GTA GAC CCGT
OPB14 TCC GCT CTGG
OPB15 GGA GGG TGTT
OPD18 GAG AGC CAAC
OPD19 CTG GGG ACTT
5.2.4. Data analysis
The DNA fragment size was estimated by comparing with DNA size markers
(100bp DNA ladder, Bangalore Genei) run on the same gel and DNA fragment size
estimated using the software Kodak Digital Science Electrophoresis Documentation and
Analysis System 120 (Kodak, USA). Amplified loci were scored for presence (1) or

87
absence (0) of bands. Only data from intensely stained, unambiguous, clear bands were
included in the analysis. The per cent of polymorphic loci (polymorphic bands per total
bands), gene diversity index (h) (Nei, 1973) and Nei’s genetic distance indices were
calculated using POPGENE version 1.31 (Yeh et al., 1999). Pairwise comparison of
the isolates based on the presence or absence of unique or shared fragments were used
to generate a similarity matrix based on the Simple Matching (SM) coefficient (Sokal
and Michener, 1958) using the NTSYSpc (Numerical Taxonomy and Multivariate
Analysis System for personal computers) software, version 2.1(Rohlf, 2000). From the
similarity matrix, a sequential, agglomerative, hierarchical, and nested (SAHN) cluster
analysis was performed and dendrogram constructed with Unweighted Pair Group
Method with Arithmetic Averages (UPGMA) algorithm using NTSYSpc (Rohlf, 2000)
package to determine the grouping of isolates.
5.3. RESULTS
The study was designed to characterize and determine the degree of genetic
variation in six different cultures of F. oxysporum isolated from wilt affected seedlings from sandal nursery and forests of Marayur and KFRI Central nursery Peechi. Fifty four
isolates were obtained from sandal nursery and sandal forest of Marayur and forty eight
isolates from Peechi. Out of these, 3 isolates each selected at random from each locality
(total 6) were used for RAPD analysis. Seven primers from OPB series viz. OPB 1,
OPB 4, OPB 7, OPB 10, OPB 11, OPB 14, OPB 15 and two primers from OPD series
viz. OPD 18 and OPD 19 were chosen based on the number and reproducibility of
amplified fragments out of 20 primers tested. The PCR amplified RAPD products were
run on 1.5 per cent agarose gel, stained using 0.05 per cent ethidium bromide and
screened for presence or absence of bands (Fig. 5.3, 5.4 and 5.5). The size of the
amplified fragments ranged between 1501500 base pairs. Only sharp, clear and
unambiguous bands were enumerated. The numbers of amplicons generated by each
primer are given in table 5.2. Assuming that each RAPD product represented a single
locus, 98.39 per cent of the loci were found to show polymorphism (122 out of 124).
The estimation of gene diversity index (h) (Nei, 1973) showed that a few of the loci
were found genetically identical; for the rest of the loci, gene diversity ranged from 0.27
to 0.50 and the mean gene diversity was 0.37.

88
Genetic distance coefficients (Nei, 1978) (Table 5.3) showed that, F. oxysporum isolate Fo.M2 and Fo.M3 from Marayur were the genetically nearer ones (D=0.2985) and isolate Fo.P1 from KFRI nursery and isolate Fo.M2 from Marayur were the
genetically distant ones (D=0.9701). The UPGMA dendrogram (NTSYSpc, Rohlf, 2000) constructed based on the genetic similarity coefficients revealed the genetic
relatedness of the six isolates of F. oxysporum. The gene diversity, genetic distance coefficients between pair of isolates and dendrogram obtained from cluster analysis
(UPGMA dendrogram) revealed a great deal of heterogeneity among the isolates. The isolates formed two distinctly major clusters (Fig. 5.6) at the similarity coefficient value
of 0.46. The first major cluster separated into two subclusters at similarity value of 0.56. The first subcluster consisted of isolates from KFRI nursery, Peechi (Fo.P1, Fo.P2) and the second subcluster consisted of 4 isolates. Two isolates Fo.M1 and Fo.M3 which originated from Marayur showed similarity at 0.78 while the isolate Fo.M2 from Marayur joined with the cluster at similarity coefficient 0.70. One isolate
from KFRI nursery, Fo.P3 joined separately to the second subcluster at 0.57.
Figure 5.3: RAPD profile of six isolates of F. oxysporum obtained using primers B1, B4 and B7. Lane 1: DNA marker (100 bp + 1.5 kb DNA ladder, BIOENZYME, USA); lane 2: negative control, lane 38: DNA profile using primer B1; lane 914: DNA profile using primer B4; lane 1520: DNA profile using primer B7.
B1 B4 B7 1 2 3 4 5 6 7 8 9 10 11 12 13 14 15 16 17 18 19 20

89
Figure 5.4: RAPD profile of six isolates of F. oxysporum obtained using primers B10, B11 and B14. Lane 1: DNA marker (100 bp + 1.5 kb DNA ladder, BIOENZYME, USA); lane 2: negative control, lane 38: DNA profile using primer B10; lane 914: DNA profile using primer B11; lane 1520: DNA profile using primer B14.
Figure 5.5: RAPD profile of six isolates of F. oxysporum obtained using primers B15, D18 and D19. Lane 1: DNA marker (100 bp + 1.5 kb DNA ladder, BIOENZYME, USA); lane 2: negative control, lane 38: DNA profile using primer B15; lane 914: DNA profile using primer D18; lane 1520: DNA profile using primer D19.
1 2 3 4 5 6 7 8 9 10 11 12 13 14 15 16 17 18 19 20 B10 B11 B14
1 2 3 4 5 6 7 8 9 10 11 12 13 14 15 16 17 18 19 20 B15 D18 D19

90
Table 5.2. Number of RAPD products from six isolates of F. oxysporum
F. oxysporum Primer and Number of Amplicon produced
Sl.
No. Isolates OPB 1 OPB 4 OPB 7 OPB10 OPB11 OPB14 OPB15 OPD18 OPD19
1 Fo.P1 10 11 6 6 5 4 4 7 4
2 Fo.P2 5 8 8 7 5 1 3 7 4
3 Fo.P3 5 5 10 10 7 5 3 11 4
4 Fo.M1 1 4 2 9 3 2 1 2 2
5 Fo.M2 3 1 1 1 1 7 7 7 8
6 Fo.M3 2 1 3 1 4 1 1 9 3
Total 26 30 30 34 25 20 19 43 25
Table 5.3. Nei’s (1978) genetic distance coefficients from six different F. oxysporum
isolates
=========================================================== F. oxysporum Isolates Fo.P1 Fo.P2 Fo.P3 Fo.M1 Fo.M2 Fo.M3 =========================================================== Fo.P1 **** Fo.P2 0.4258 **** Fo.P3 0.9285 0.6306 **** Fo.M1 0.8129 0.6306 0.5436 **** Fo.M2 0.9701 0.8313 0.7259 0.4636 **** Fo.M3 0.7427 0.6614 0.4895 0.2559 0.2985 **** ===========================================================
Simple Matching Coefficient 0.46 0.54 0.62 0.70 0.78
Fo.P1
Fo.P2
Fo.P3
Fo.M1
Fo.M3
Fo.M2
Figure 5.6. UPGMA Dendrogram based on Simple Matching Coefficients
91
5.4. DISCUSSION
RAPD provides a rapid and efficient means of comparing the overall genetic
diversity among different pathogen isolates and also for its molecular characterization
(Goodwin and Annis, 1991). Because of these advantages, RAPD markers have been
widely used to study genetic variations within and between fungal populations
(Crowhurst et al., 1991; Guthrie et al., 1992). In the present study, molecular
characterization of F. oxysporum isolates responsible for wilting of sandal seedlings collected from two different localities, KFRI nursery at Peechi, Thrissur and sandal
nursery and sandal forest at Marayur in Idukki district, was carried out using RAPD
markers. The genetic similarity of the isolates was also assessed from the RAPD data
generated.
The various genetic diversity measures viz. percentage of genetic polymorphism
and gene diversity index (h) were determined in a group of six F. oxysporum isolates. Majority (122 out of 124) of the loci were found to be polymorphic across the six
isolates. Similar level of genetic polymorphism was also observed in F. oxysporum isolates from Cucumber (97 out of 107) (Vakalounakis and Fragkiadakis, 1999) and in F. oxysporum f. sp. ciceris isolates causing chickpea wilt (122 out of 135) (Honnareddy
and Dubey, 2006).
A gene diversity value ranging from 0.4 to 0.52 was reported by Alfonso et al.
(2000) in Botrytis cinerea and 0.03 to 0.42 in S. homoeocarpa isolates (Hsiang and Mahuku, 1999), while a relatively low amount of gene diversity was reported in Erysiphe graminis ranging from 0.150.23 (Mc Dermott and Mc Donald, 1993). The
gene diversity values observed in the present study (ranging from 0.27 to 0.50) thus
exhibited a significant level of genetic divergence or differentiation. Genetic drift and
low level of inter population gene flow might be the reason for the high level of gene
divergence (Hartl and Clark, 1989).
The genetic distance coefficients ranged between 0.2985 to 0.9701. The UPGMA
dendrogram revealed the genetic relatedness of the six isolates. The most genetically
similar ones were collected from KFRI nursery while the genetically distant ones were
collected from KFRI nursery and Marayur. The two locations are geographically far
apart, a distance of approximately 175 km. Generally, organisms originating from same

92
geographical area show genetic similarity. In the present study F. oxysporum isolates
from Marayur have shown genetic similarity among themselves (lesser genetic distance)
and they have aligned into one cluster. But, instead of aligning all the three isolates from
Peechi nursery into one cluster, one of them Fo.P3 joined with the Marayur isolates (Fig
5.6). The sandal seeds used for raising nursery at Peechi had originated from Marayur
forests. Hence, it might be possible that the seeds collected from the forest floor at
Marayur might have been contaminated with the pathogen and reached Peechi as the
contaminant along with the seeds or probably carried with the soil sticking to the seeds.
5.5. CONCLUSION
F. oxysporum, the fungal pathogen responsible for causing various types of seedling wilt in a wide range of economically important plants, is having a worldwide
distribution. Fusarium wilt has very high occurrence in sandal seedling nurseries and is known to cause heavy seedling mortality. It is therefore important to have knowledge
on the biology and diversity of the pathogen, as it possesses a wide host range.
By using RAPD technique, it is revealed that there is a wide range of genetic
variation among the Fusarium genotypes. The large genetic variation detected at the
DNA level indicates the ability of the pathogen to adapt to different ecoclimatic
conditions. The pathogen has the potential to be highly successful in infecting sandal
seedlings at different growth stages. Since, the pathogen is prevalent in the soils of
Marayur, the seeds originating from Marayur will be contaminated with the fungus.
Hence, a prophylactic treatment of sandal seeds, preferably with a systemic fungicide is
very important. Since the pathogen infects at different growth stages of the seedlings
and the infected plant usually perishes, prophylactic fungicidal treatment has to be given
at various stages of seedling growth. Studies combining morphological characters from
traditional techniques with those from molecular techniques are expected to enhance our
knowledge of the complex biodiversity of F. oxysporum in soil.

CHAPTER 6
STUDIES ON GENETIC DIVERSITY OF SANDAL IN SEED STAND

93
6. STUDIES ON GENETIC DIVERSITY OF SANDAL IN SEED STAND
6.1. INTRODUCTION
Genetic variation is an important conservation factor, providing the necessary
resilience to allow populations to respond to environmental pressures. It provides a
given species adaptability to respond to environmental changes, natural evolution, and
survival in the long run (Sheng et al., 2005). Isolated and island populations tend to
experience reduced genetic variability for a variety of reasons such as small population
size, founder effect, and low gene flow from neighboring populations (Frankham,
1997). Knowledge of genetic variation between and within populations plays a
significant role in the formulation of appropriate management strategies directed
towards their conservation (Lynch and Milligan, 1994). S. album is a ‘vulnerable’
species (IUCN, 2010) and hence it is of paramount importance to evaluate and maintain
genetic variability within and among populations because populations consisting of
genetically uniform individuals will be vulnerable to major climatic changes, and pest
and diseases outbreaks (Aradhya and Philips, 1993). Indiscriminate felling of sandal due
to its commercial importance has resulted in depletion of the valuable bioresource. In
order to redress this problem, organized efforts of conservation, tree improvement and
plantation establishment are needed, which requires high quality planting material.
Kulkarni (1995) attributed the wide variation in seed output and reproductive capability
in S. album to phenological variations with respect to tree’s flowering.
6.1.1. Establishment of seed stands
Tree improvement is initiated with population survey, documenting variability
within the species and identifying the variability pattern in economically or
commercially important traits (Kumar and Joshi, 2007). In sandal, tree improvement
began in 1980s and was mainly aimed at evolving trees that can yield more heartwood
and oil, can resistant spike disease, attack of heartwood borers and other pests and
diseases. As part of this programme, with the intention of clonal propagation and seed

94
collection, candidate plus trees showing (i) fast growth indicated by higher DBH, clear
bole, height, good crown, and pest and disease resistance (ii) higher heartwood and oil
content and (iii) fragrance and heartwood colour were selected in Karnataka, Tamil
Nadu, Andhra Pradesh and Kerala. Besides this programme, for collecting high quality
seeds, seed stands had been located at Anchalpatty (Marayur, Kerala), Chitteri and
Javadis (Tamil Nadu), and Arabithittu and Thindlu (Karnataka) (Sindhuveerendra and
Ananthapadmanabha, 1998). In Anchalpatty, located at Nachivayal sandal reserve in
Marayur, the seed stand was established in 5.3 ha in order to collect seeds for raising
sandal plantations and for augmenting sandal population in reserve forests.
Seed stands are seed production areas (SPAs) of suitable provenance which have
grown from seeds of a reasonably large number of unrelated trees and managed
specifically for seed production. In order to meet the annual planting requirement, SPAs
are usually developed by culling inferior trees from evenaged high quality plantations
and retaining sufficient number of superior and healthy trees with more than average
seed production. Since, cutting and removal of live sandal trees were prohibited by rule,
seed production areas (SPAs) of sandal were selected from natural stands of the
provenances for use in afforestation programmes. Quality nursery stock raised from
sourceidentified, improved seeds are expected to ensure increased plantations
productivity.
6.1.2. Poor seed setting in seed stand
Seed stands are highly relevant since they assure an immediate supply of adequate
quantities of quality seeds. But, recently it has been reported that the expected quantities
of seeds are unavailable from the seed stand at Marayur. Earlier studies by Kulkarni and
Muniyamma (1998) on flowering, fruit development and fruit set at five selected sites in
natural sandal forests at Bangalore, Coimbatore, Tirupattur, Salem and Tanjavur Forest
Divisions showed that only a small proportion of flowers eventually mature to fruits;
this may be due to lack of effective pollination and fertilization, pollen sterility and
incompatibility, and immature fall of flowers and fruits. Shepherd (1992) reported that
S. album is a facultatively selfing and preferentially outcrossing species. The tendency for outbreeding in sandal is reinforced by asynchronous flowering, insect pollination,
heterostyly, and selfincompatibility.

95
6.1.3. Importance of genetic diversity in seed stand
Kulkarni and Muniyamma (1998) reported that in sandal, the high amount of
flower and fruit abortion had been correlated with self incompatibility. Moreover, the
estimation of natural selfing had showed the presence of high percentage of abnormality
in the halfsib seedling populations with lower fitness value indicating the deleterious
effects of inbreeding (Kulkarni, 1995). Hence, knowledge of genetic variation within and
between the SPAs is crucial for adopting proper seed management in the seed production
areas and in tree improvement programmes (Jagadish et al., 2007; Sreekanth, 2009).
6.1.4. Clonality in sandal forests and its effect on seed production
Natural stands of S. album in Sri lanka has shown that it spread clonally by prolific
root suckering (Tennakoon et al., 2000). Trueman et al. (2001) assessed the genetic structure and level of clonality within five southernmost populations of S. lanceolatum at Victoria using allozyme and RAPD markers and found that each of the remnant
populations existed as a single unique clone, recruiting individual plants via root suckers.
Examination of pollination and fruit set indicated that little or no sexual reproduction
was occurring in the remnants, due to pollen sterility in one population and self
incompatibility or pistil dysfunction in the others. Both, allozymes and RAPD studies
could not detect genetic variation within populations, suggesting that each population
consisted of single genotype. This resulted in inbreeding and extremely poor seed setting.
6.1.5. Tools to study genetic diversity in natural forest and seed stands
In conventional tree breeding programmes, genetic variation and heritability are
studied through progeny trial and evaluating the performance of the progenies. Because
of long generation period of trees, a successful completion of progeny trial takes a long
period. Molecular markers provide a powerful method to generate a large amount of
information on genetic diversity and phylogenetic relationships in the germplasm within
a short period of time. Some of the widely used PCR based DNA markers for studying
genetic diversity are RAPDs (Williams et al., 1990), SSRs or microsatellites (Tautz, 1989), ISSRs (Zietkiewicz et al., 1994) and AFLPs (Vos et al., 1995). Each marker technique has its own advantages and disadvantages. A detailed review of molecular
markers are provided in the chapter on Review of Literature (para 2.5.1 2.5.3).

96
6.1.6. ISSR marker as a tool to study genetic diversity
PCRISSR which uses the occurrence of SSRs in the plant genome, has also been
used successfully to characterize genetic diversity within and among plant populations
(Qian et al., 2001). They have proved to be efficient in population genetic studies, especially in detecting clonal diversity and fingerprinting closely related individuals
(Zietkiewicz et al., 1994; Wolfe and Liston, 1998; Esselman et al., 1999). ISSR markers
are much more effective in genotype identification because the amplification is based on
SSRs, which are extremely variable in eukaryotes. A detailed review of ISSR markers
are provided in para 2.5.3. of Review of Literature.
6.1.7. Objective of the present study
One of the reasons for poor sandal regeneration in natural forests of Marayur is
high seedling mortality. This demands large quantity of seeds for sowing in new
localities as well as in sandal forests where practically very little regeneration takes
place. Lack of availability of good quality seeds have been reported from forest ranges.
But, recently it had been reported that expected quantity of seeds are unavailable from
the seed stands established in Nachivayal reserve during 198081. Most of the sandal
trees flower profusely, but they do not set seeds. Sandal, being a cross pollinated plant,
fruit setting and seed formation take place usually if pollination and fertilization occurs
between genetically unrelated genotypes. Though, failure to develop mature seeds may
occur due to pathogenic infection of developing fruits, premature flower and fruit fall,
etc., such major problems did not come to our notice. Hence, our objective was to assess
the level of clonality and genetic diversity of sandal trees which may be causing
inbreeding in sample plots in the seed stand at Marayur using ISSR markers.
6.2. MATERIALS AND METHODS
6.2.1. Plant material
The sandal seeds for the study were located in the seed stand established in the
Nachivayal II sandal reserve at Anchalpatty, Marayur. The sketch of the seed stand was
drawn on a graph paper and then divided into 20m x 20m plots. Two plots of 20m x
20m size with sufficient number of trees were randomly selected for the study. There

97
were 17 sandal trees in the first plot and 17 trees in the second plot (Fig 6.1. a & b). The
positions of the trees in the sample plots were plotted on a graph paper and a chart
showing their position are provided (Fig. 6.2. a & b). The girth at breast height (GBH)
measurements of the selected trees are provided in table 6.1. Leaf samples were
collected from all the trees in both the plots for DNA extraction.
a
b Figure 6. 1. a & b: Sandal trees in clusters in the experimental plots in
Marayur seed stand

98
a
b
Figure 6. 2. a & b: Sandal tree positions in the experimental plots in Marayur seed stand

99
Table 6.1. Girth of sandal trees growing in the experimental plots
Experimental plot I Experimental plot II Tree No. GBH (cm) Tree No. GBH (cm)
1 45 1 44 2 52 2 44 3 42 3 55 4 33 4 40 5 20 5 63 6 29 6 30 7 79 7 39 8 59 8 51 9 31 9 49 10 68 10 48 11 51 11 47 12 34 12 52 13 41 13 55 14 36 14 39 15 41 15 50 16 52 16 20 17 47 17 55
6.2.2. Genomic DNA extraction
Genomic DNA was extracted from approximately 250 mg of fresh leaf sample using GeNei TM spin plant genomic DNA preparation kit (Bangalore Genei). The kit contained (for 20 purifications) Lysis buffer (15 ml), Wash buffer (20 ml), Precipitation solution (5 ml), RNase (lyophilized) 5 mg, Proteinase K (lyophilized) 1.5 mg, Elution buffer (6 ml), Spin columns (20 Nos.), tissue grinder (20 Nos.) and 2 ml collection tubes (20 Nos.). Leaf tissue was ground in a sterilized mortar and pestle and 750 µl of lysis buffer was added followed by 5 µl of Proteinase K. The sample was incubated at 65°C in a water bath for 15 minutes with mild shaking and then centrifuged at 12,000 rpm for 10 minutes at room temperature. The supernatant containing genomic DNA was transferred to a fresh tube, 10 µl of RNase was added and incubated at room temperature for 15 minutes. 200 µl of precipitation solution was added to the above sample and the tube incubated in ice for 5 minutes. It was then followed by centrifugation at 12,000 rpm for 10 minutes. To the clear supernatant, equal volume of ethanol (100%) was added, mixed and loaded onto the column provided in the kit. Centrifugation was carried out at 10,000 rpm for 20 seconds. The eluate was discarded after each spin. The column was washed with 500 µl of wash buffer twice by centrifugation at 10,000 rpm for two minutes discarding the

100
eluate each time. A final spin was given at 10,000 rpm for two minutes. Finally, the column was incubated at 65°C for five minutes. DNA was eluted with 150 µl of preheated elution buffer (65°C) by spinning the column at 10,000 rpm for two minutes.
6.2.3. ISSR primers and PCR amplification
ISSR primers with sequence (AG)8CA(UBC836), (GA)8TC(UBC841), (AG)8T(UBC807), (CA)8G(UBC818), (CA)8AG(UBC848) and (CT)8GC(UBC844) were selected from the primer sequences provided by University of British Columbia (UBC) (Vancover, Canada) and from research papers dealing with ISSR markers (Nagaoka and Ogihara, 1997; Bahulikar et al., 2004; Hou et al., 2005; Dje et al., 2006). The six primers were screened initially for obtaining maximum polymorphic bands with clarity and reproducibility. Accordingly, three ISSR primers which showed clear and consistent bands were finally selected (Table 6.2.). The oligos (primers) were supplied by Bangalore Genei (Bangalore). PCR reactions were carried out in a final volume of 25 µl consisting of 1.5 mM MgCl2, 100 µM of dNTPs, 100 pM of primer, 3 U of Taq DNA polymerase, 10X reaction buffer and approximately 2 µl (2040 ng) of template DNA. PCR amplifications were performed in PTC100 Thermal Cycler (MJ Research, Watertown, MA, USA) under the following conditions: initial denaturation at 95°C for 5 minutes; 30 cycles, each of 95°C for 30 seconds, 58°C (annealing temperature for each primer changed suitably) for 45 seconds, 72°C for 2 minutes and finally 95°C for 5 minutes. PCR products were then stored at 80°C. The amplification products were separated by electrophoresis on 1.5 per cent agarose gel in 1X TBE buffer. After running for approximately 90 minutes at 75V, the gel was stained with 0.05 per cent ethidium bromide, viewed on a UV transilluminator and photographed using Gel Doc System DPCF011 (Vilber Lourmat, France) and transferred to a computer. Scoring of the bands for presence (1) or absence (0) was performed by visual analysis of the gel photographs. Molecular size of the fragments was estimated using the software Kodak Digital Science Electrophoresis Documentation and Analysis System 120 (Kodak, USA), comparing the fragment size with 100 bp DNA ladder.
Table 6.2. Primers used for the study and size range of amplicons generated from S. album DNA
Primer Sequence(5´3´) Size range of amplicons UBC836 AGAGAGAGAGAGAGAGCA 2501250 UBC841 GAGAGAGAGAGAGAGATC 2501250 UBC807 AGAGAGAGAGAGAGAGT 3501250

101
6.2.4. Data analysis
Amplified fragments were scored for presence (1) and absence (0) of bands. Data
from intensely stained, unambiguous, clear bands were included in the analysis. The
data matrices were entered into POPGENE version 1.31 software and genotype
comparisons were made (Yeh et al., 1999). Percentage of polymorphic loci and gene
diversity index (h) (Nei, 1973) was calculated using POPGENE version 1.31. Indices of
genetic similarity were calculated using Dice genetic similarity coefficient (Dice, 1945)
using NTSYSpc software in order to estimate the genetic relationship between trees.
From the similarity matrix, a sequential, agglomerative, hierarchical, and nested
(SAHN) cluster analysis was performed and dendrogram constructed using the
Unweighted Pair Group Method with Arithmetic Averages (UPGMA) algorithm,
computed using NTSYSpc (Numerical Taxonomy and Multivariate Analysis System for
personal computers) software, version 2.1 (Rohlf, 2000).
6.3.RESULTS
The study was designed to determine the level of clonality and genetic diversity of
sandal trees using ISSR analysis in two sample plots selected in the seed stand at
Marayur. Three primers (viz. UBC836, UBC841 and UBC807) were chosen out of 6
primers tested for maximum number of amplicons having clarity, sharpness and
consistency. Leaf DNA samples of 17 sandal trees from each plot were screened for
genetic variation using the three selected primers. The resulting ISSR products
(Figs.6.36.8) were screened for presence or absence of bands. The molecular products
ranged from 2501250 base pairs. Assuming that each ISSR product represented a
single locus, 11of the 25 loci were found to show polymorphism in plot I and 12 of 25
loci were found to show polymorphism in plot II. The per cent of polymorphism was 44
and 48 respectively in plot I and plot II. The estimation of gene diversity index (h) (Nei,
1973) showed that many of the loci were found to have similar values and the mean
diversity for plot I was 0.1478 and for plot II it was 0.17.
A close look at the Dice similarity coefficient values showed that the values
between pairs of trees in plot I ranged from 0.73 to 1 (Table 6.3). The similarity
coefficients between tree numbers 2 and 3, 5 and 6 and 16 and 17 were one, indicating

102
that trees in each pairs were genotypically identical; in other words, they were clones. It
could be possible that one of the two trees from each pair might have originated as root
sucker from the root of the other tree. It was further observed that similarity coefficients
between trees 2 and 5, 2 and 6, 2 and 7, 2 and 8, 3 and 5, 3 and 6, 3 and 8, 5 and 7, 5
and 8, 6 and 7, 6 and 8 and 7 and 8, were 0.95 or above, which revealed that trees of
each pair were genetically almost identical. The dendrogram (Fig.6.9) further showed
that the tree numbers 2, 3, 5, 6, 7 and 8 were genetically closely related each other by
virtue of their grouping in one sub cluster at the similarity coefficient vale of 0.95. In
the seed stand also, these trees were clustered together as evident from fig.6.2a. Besides
those trees, tree numbers 9 and 10, and 14 and 15 also showed similar clustering both in
the dendrogram (Fig.6.9) and in the seed stand (Fig.6.2a). In plot II, the Dice similarity
coefficient values ranged from 0.78 to 1 (Table 6.4). Trees 14 and 16 showed complete
genotypic identity (Dice similarity coefficient = 1). The similarity coefficient values for
tree numbers, 1 and 11, 1 and 14, 1 and 16, 7 and 11, 7 and 14, 7 and 16, 11 and 14 and
11 and 16 were 0.95 or above indicating that the genotype of the paired trees were
almost identical. The dendrogram (Fig.6.10) also showed that these five trees formed a
small sub cluster. In the seed stand also these five trees were closely located forming
cluster of trees as evident from the Figure 6.2b.
The dendrogram generated using the Dice similarity coefficients (NTSYSpc, Rohlf,
2000) revealed the genetic relatedness of the 17 S. album trees in plot I and II (Fig. 6.9
& Fig. 6.10). Half of the trees sampled showed high genetic similarity (≥ 0.95)
indicating the fact that they were either clones and probably had originated as root
sucker or they were of highly inbred seed origin. The 17 genotypes of sandal trees from
plot I (Fig. 6.9), first separated to two major clusters at genetic similarity coefficient
value of 0.84. Cluster I consisted of twelve genotypes and rest of the genotypes were
grouped in cluster II. The 17 genotypes of sandal trees from plot II (Fig. 6.10) also first
separated into two clusters at genetic similarity coefficient value of 0.84. Sixteen
genotypes were grouped into one large cluster while a lone tree, tree No. 8 formed the
other cluster. The large cluster separated into two subclusters at Dice similarity
coefficient value of 0.87. Both the subclusters consisted of eight trees.

103
Figure 6.3: ISSR profile of sandal trees amplified by the primer UBC 836. Lane 1 and 20: DNA marker (100 bp ladder); lane 2: negative control; lanes 319: DNA profiles of 117 trees of plot I.
Figure 6.4: ISSR profile of sandal trees amplified by the primer UBC836. Lane 1 and 20: DNA marker (100 bp ladder); lane 2: negative control; lanes 319: DNA profiles of 117 trees of plot II.
Tree No. 1 2 3 4 5 6 7 8 9 10 11 12 13 14 15 16 17 1 2 3 4 5 6 7 8 9 10 11 12 13 14 15 16 17 18 19 20
Tree No. 1 2 3 4 5 6 7 8 9 10 11 12 13 14 15 16 17 1 2 3 4 5 6 7 8 9 10 11 12 13 14 15 16 17 18 19 20

104
Figure 6.5: ISSR profile of sandal trees amplified by the primer UBC841. Lane 1 and 20: DNA marker (100 bp ladder); lane 2: negative control; lanes 319: DNA profiles of 117 trees of plot I.
Figure 6.6: ISSR profile of sandal trees amplified by the primer UBC841. Lane 1 and 20: DNA marker (100 bp ladder); lane 2: negative control; lanes 319: DNA profiles of 117 trees of plot II.
Tree No. 1 2 3 4 5 6 7 8 9 10 11 12 13 14 15 16 17 1 2 3 4 5 6 7 8 9 10 11 12 13 14 15 16 17 18 19 20
Tree No. 1 2 3 4 5 6 7 8 9 10 11 12 13 14 15 16 17 1 2 3 4 5 6 7 8 9 10 11 12 13 14 15 16 17 18 19 20

105
Figure 6.7: ISSR profile of sandal trees amplified by the primer UBC807. Lane 1 and 20: DNA marker (100 bp ladder); lane 2: negative control; lanes 319: DNA profiles of 117 trees of plot I.
Figure 6.8: ISSR profile of sandal trees amplified by the primer UBC807. Lane 1 and 20: DNA marker (100 bp ladder); lane 2: negative control; lanes 319: DNA profiles of 117 trees of plot II.
Tree No. 1 2 3 4 5 6 7 8 9 10 11 12 13 14 15 16 17 1 2 3 4 5 6 7 8 9 10 11 12 13 14 15 16 17 18 19 20
Tree No. 1 2 3 4 5 6 7 8 9 10 11 12 13 14 15 16 17 1 2 3 4 5 6 7 8 9 10 11 12 13 14 15 16 17 18 19 20

106
Table 6.3: Dice genetic similarity coefficients for 17 sandal trees in plot I
Tree No. Tree Numbers
1 2 3 4 5 6 7 8 9 10 11 12 13 14 15 16 17
1 1.00
2 0.91 1.00
3 0.91 1.00 1.00
4 0.91 0.94 0.94 1.00
5 0.89 0.97 0.97 0.92 1.00
6 0.89 0.97 0.97 0.92 1.00 1.00
7 0.86 0.95 0.94 0.94 0.97 0.97 1.00
8 0.86 0.95 0.95 0.89 0.98 0.98 0.95 1.00
9 0.87 0.85 0.85 0.77 0.82 0.82 0.79 0.80 1.00
10 0.83 0.81 0.81 0.73 0.79 0.79 0.75 0.76 0.96 1.00
11 0.80 0.85 0.85 0.84 0.82 0.82 0.84 0.80 0.93 0.80 1.00
12 0.88 0.92 0.92 0.91 0.89 0.89 0.92 0.87 0.81 0.77 0.88 1.00
13 0.91 0.95 0.95 0.89 0.97 0.97 0.95 0.95 0.85 0.81 0.84 0.92 1.00
14 0.88 0.91 0.91 0.85 0.89 0.89 0.86 0.86 0.93 0.89 0.93 0.88 0.91 1.00
15 0.85 0.89 0.89 0.82 0.86 0.86 0.83 0.84 0.90 0.87 0.90 0.91 0.89 0.97 1.00
16 0.83 0.92 0.92 0.86 0.95 0.95 0.92 0.98 0.82 0.79 0.82 0.84 0.92 0.83 0.81 1.00
17 0.83 0.92 0.92 0.86 0.95 0.95 0.92 0.98 0.82 0.79 0.82 0.84 0.92 0.83 0.81 1.00 1.00
Table 6.4. Dice genetic similarity coefficients for 17 sandal trees in plot II
Tree
No.
Tree Numbers
1 2 3 4 5 6 7 8 9 10 11 12 13 14 15 16 17
1 1.00
2 0.93 1.00
3 0.82 0.89 1.00
4 0.90 0.82 0.81 1.00
5 0.87 0.89 0.82 0.81 1.00
6 0.84 0.86 0.91 0.78 0.91 1.00
7 0.93 0.90 0.84 0.93 0.89 0.81 1.00
8 0.84 0.86 0.85 0.83 0.85 0.81 0.81 1.00
9 0.95 0.92 0.81 0.90 0.86 0.78 0.93 0.89 1.00
10 0.87 0.94 0.88 0.81 0.88 0.85 0.89 0.85 0.92 1.00
11 0.95 0.88 0.82 0.95 0.87 0.79 0.98 0.84 0.95 0.87 1.00
12 0.90 0.82 0.81 0.90 0.81 0.78 0.93 0.78 0.90 0.86 0.95 1.00
13 0.93 0.89 0.89 0.87 0.89 0.91 0.85 0.91 0.87 0.83 0.88 0.82 1.00
14 0.98 0.90 0.85 0.93 0.85 0.82 0.95 0.82 0.93 0.85 0.98 0.93 0.90 1.00
15 0.93 0.90 0.89 0.88 0.89 0.86 0.90 0.86 0.88 0.84 0.93 0.88 0.95 0.95 1.00
16 0.98 0.90 0.85 0.93 0.85 0.82 0.95 0.82 0.93 0.85 0.98 0.93 0.90 1.00 0.95 1.00
17 0.93 0.95 0.89 0.82 0.94 0.91 0.90 0.86 0.87 0.89 0.88 0.82 0.95 0.90 0.95 0.90 1.00

107
Figure 6.9. UPGMA dendrogram based on Dice genetic similarity coefficients of
seventeen sandal trees of plot I
Figure 6.10: UPGMA dendrogram based on Dice genetic similarity coefficients of
seventeen sandal trees of plot II
Dice Similarity Coefficient 0.84 0.88 0.92 0.96 1.00
Tree1 Tree2 Tree3 Tree5 Tree6 Tree8 Tree13 Tree7 Tree16 Tree17 Tree4 Tree12 Tree9 Tree10 Tree11 Tree14 Tree15
Dice Similarity Coefficient 0.84 0.88 0.92 0.96 1.00
Tree1 Tree14 Tree16 Tree7 Tree11 Tree9 Tree4 Tree12 Tree2 Tree10 Tree3 Tree6 Tree5 Tree13 Tree15 Tree17 Tree8

108
6.4. DISCUSSION
Sandal trees growing in Nachivayal sandal reserve, especially in seed stand at
Anchalpatty were not producing sufficient seeds. Being a cross pollinated plant,
pollination and fertilization between genetically similar trees may cause inbreeding,
resulting in poor seed setting, failure to produce viable seeds or poor performance of
seedlings from inbred seeds. In several places of Nachivayal seed stand of Marayur
Forest Division, sandal trees were growing in clusters with individual trees of a cluster
located very close to one another. Such prominent conglomeration of trees of different
sizes prompted us to investigate whether the trees around a larger tree are clones which
might have arisen as root suckers from the roots of the mother tree. In order to
investigate the genetic similarity of the trees, two sample plots were selected at random
in the seed stand, each of size 20m x 20m with 17 trees in each plot. The trees in the
plots were subjected to DNA profiling using ISSR markers. The ISSR study showed
complete identity of DNA profiles of 3 pairs of trees in plot I and one pair of tree in plot
II. This indicated that individual trees of each pair could be clones which might have
arisen as root suckers from either of the trees of each pair (Figs 6.36.10). Amplicons
from such pairs of trees were monomorphic. Moreover, in plot I, three clusters of trees,
one cluster comprising seven trees and the other two comprising two trees each showed
similarity coefficients of more than 0.95 among individuals of each cluster indicating
very high levels of genetic similarity. Similarly, in plot II, five trees (tree numbers 1, 14,
16, 7 and 11) which showed similarity coefficient values of 0.95 or above were among a
cluster of trees. The percentage of polymorphism (P) was 44 in plot I and 48 in plot II.
The mean genetic diversity (h) was 0.1478 in plot I and 0.17 in plot II. Low percentage
of polymorphism and low genetic diversity indicated very high prevalence of inbreeding
in the seed stand which could be the major reason for low production of seeds.
ISSR marker techniques have been widely applied to assess genetic diversity and
clonality in several economically important crops and fruit plants as part of experiments
connected with germplasm conservation since they provide a large amount of data
within a short time. ISSR markers also provide a clear portrayal of relationships among
closely related congeneric species (Gang et al., 2002). Hence, we opted for this method
in order to assess the level of clonality of sandal trees in the sample plots at Marayur

109
seed stand. Furthermore, evidences have shown that ISSRs can generate even more
information than RAPD markers, and, therefore, show great potential in studies on
clonal diversity and genotype identification (Ang Li and Song Ge, 2001).
Similar low per cent level of polymorphic loci and gene diversity was observed in
Rhododendron fortunei (P=48.23%, h=0.182) by Jin et al. (2006) and in studies on
endangered species Camellia nitidissima Chi (P=42.44%, h= 0.098) (Bin et al., 2005),
and at population level in the endangered species Sinocalycanthus chinensis
(P=23.65%, h=0.084) (Jin and Li, 2007) and Emmenopterys henryi Oliv. (P=22.56%,
h=0.071) (Li and Jin, 2008).
Inbreeding depression reduces fitness and vigor in terms of survival, growth and
fertility through increased homozygosity of deleterious recessive alleles in a normally
out breeding population. One of the reasons for poor seed germination and poor
seedling recruitment observed in the experimental plot at Marayur might be due to
inbreeding depression, since many of the trees have been observed to be clones. Pollen
transfer and seed dispersal determine a plant’s reproductive success, range expansion,
and population genetic structure. In this case, S. album, being a crosspollinated species
might have failed to produce viable seeds due to crosspollination between genetically
similar trees or clones. ISSR marker technique is an ideal tool for genotype
characterization and assessment of genetic similarity of clones and genetically closely
related trees.
6.5. CONCLUSION
The ISSR marker study done in the Anchalpatty seed stand of Marayur Division
has shown clonality and very high genetic similarity among the sandal trees. The
clonality is presumed to be caused as a result of sandal regeneration through root
suckers. Since natural regeneration through seedlings was poor in seed stand because of
slow growth and very high mortality, forest department had been carrying out
regeneration through root sucker induction for the last few decades. Even though,
mortality due to drought occurred among the plantlets arising from root suckers also,
this practice continued because root suckers were generally fast growing during the
initial stages. Since root suckers arise through vegetative reproduction from root of a

110
mother tree, there will be complete genetic identity among such trees or in other words
they are clones. In the present study, besides clonality, a large number of trees showed
very high genetic similarity (>0.95) probably because of very high rate of inbreeding
among the sandal trees in the Anchalpatty seed stand. Low percentage of
polymorphism, low genetic diversity and clonality indicated very high chance of
inbreeding which could be the major reason for poor seed production in the seed stand.
Hence, the practice of root sucker induction by trenching around sandal trees in forests
especially seed stands has to be discontinued because the technique increases clonality
which in turn reduces genetic diversity in the seed stand.

CHAPTER 7
SUMMARY

111
7. SUMMARY
S. album L. is the source of highly priced and fragrant heartwood which on steam
distillation yields on an average 57 per cent oil of high perfumery value. Global
demand for sandalwood is about 50006000 tons/year and that of oil is 100 tons/year.
Heartwood of sandal is estimated to fetch up to Rs. 3.7 million/ton and wood oil
Rs.70,000100,000/kg in the international market. Sandal heartwood prices have
increased from Rs. 365/ton in 1900 to Rs. 6.5 lakhs/ton in 19992000 and to Rs. 37
lakhs/ton in 2007. Substantial decline in sandalwood production has occurred from 3176
tons/year during 1960‘65 to 1500 tons/year in 199798, and to 500 tons/year in 2007.
Depletion of sandal resources is attributed to several factors, both natural and
anthropogenic. Low seed setting, poor seed germination, seedling mortality, lack of
haustorial connection with host plant roots, recurrent annual fires in natural sandal
forests, lopping of trees for fodder, excessive grazing, hacking, encroachments, seedling
diseases and spread of sandal spike disease are the major problems facing sandal. While
these factors hinder sandal regeneration in forest areas, the situation is accelerated by
human activities of chronic overexploitation and illicit felling.
Deterioration of natural sandal populations due to illicit felling, encroachments and
diseases has an adverse effect on genetic diversity of the species. The loss of genetic
diversity has aggravated during recent years due to extensive logging, changing land
use patterns and poor natural regeneration. The consequent genetic erosion is of serious
concern affecting tree improvement programme in sandal. Conservation as well as mass
propagation are the two strategies to be given due importance. To initiate any
conservation programme, precise knowledge of the factors influencing regeneration and
survival of the species is essential. Hence, the present study was undertaken with the
objective of investigating the autotrophic and parasitic phase of sandal seedlings
growth, the effects of shade on morphology, chlorophyll concentration and chlorophyll
fluorescence of sandal seedlings, genetic diversity in sandal seed stands using ISSR
markers, and the diversity of fungal isolates causing sandal seedling wilt using RAPD
markers. All these factors directly influence regeneration and survival of sandal
seedlings in natural forests and plantations.

112
7.1. AUTOTROPHIC AND PARASITIC PHASE OF SANDAL SEEDLING
GROWTH
Knowledge of autotrophic phase of nutrition is important in sandal nursery management as seedlings grown by sowing seeds in nutrient deficient medium needs to be pricked out before seed reserves are fully exhausted. The objective of our study was to evaluate the seed reserve (cotyledonary) dependency of S. album seedlings. Sandal seedlings emerging out of seeds with cotyledons intact were pricked out to root trainers of 150cc containing sterile quartz sand, vermiculite and soil. Conditions of cotyledons, leaves and seedlings as a whole were noted daily for 230 days. Complete withering of cotyledons in quartz sand occurred within 26 days of radicle emergence. Hence, it was concluded that sandal seedlings need to be transferred to polybags containing potting mixture within 26 days after germination for proper growth and development.
Though, many studies had been conducted earlier on host association of sandal and its growth enhancement, there are several plants which have not been reported to be haustorised by sandal. Moreover, no report is available describing physiological basis of growth enhancement. In view of these facts, an experiment was conducted with selected annuals and perennials to examine the host preferences of sandal seedlings under nursery conditions through physiological measurements and chlorophyll estimation of sandal leaves. Fourmonthold sandal seedlings were planted with seedlings of host plants, and growth of sandal seedlings with hosts was monitored for a year for annuals and about two years for perennials.
Eight annual and two perennial host species were selected based on screening for better initial sandal seedling growth. Annual host species were Vigna unguiculata (L.) Walp. (Fabaceae), Ocimum sanctum L. (Verbenaceae), Ageratum conyzoides L. (Asteraceae), Phyllanthus niruri L. (Euphorbiaceae), Mikania micrantha Kunth ex. H. B. K. (Asteraceae), Ludwigia hyssopifolia (G Don) Exell (Onagraceae), Scoparia dulcis L. (Scrophulariaceae) and Vernonia cinerea (L.) Lem. (Asteraceae) and perennial host species were Pongamia pinnata (L.) Pierre (Fabaceae) and Lantana camara L. (Verbenaceae). At the end of the experiment, measurements of height, collar diameter, total biomass, shoot and root fresh weight and dry weight, number of haustorial connections, chlorophyll fluorescence and chlorophyll contents were recorded. The quality of the seedlings was determined using Sturdiness Quotient (SQ), Dickson Quality Index (DQI) and Performance Index (PI) using JIP test. Chlorophyll

113
fluorescence was measured at regular intervals on a subsample of seedlings with a Plant Efficiency Analyzer (Handy PEA, Hansatech Instruments Ltd., Norfolk, UK). Data were analysed using one way ANOVA.
All the morphological parameters were found to be significantly different for sandal plants grown with different hosts. Performance Index values were higher for sandal seedlings growing with O. sanctum (61.65) and V. unguiculata (27.49). DQI values, Fv/Fm values and chlorophyll content for sandal were higher when V. unguiculata was the host plant than for sandal with O. sanctum. Moreover, since V. unguiculata, a leguminous annual, can grow under shade along with sandal seedlings, V. unguiculata was chosen to be a better primary host for sandal. Among the perennial host species, sandal plants with P. pinnata showed better performance for height, collar diameter, total fresh weight, total dry weight, DQI, PI, Fv/Fm values, chlorophyll content and number of haustoria. P. pinnata was found to be the best long term host, being a perennial tree species.
7.2. EFFECTS OF SHADE ON MORPHOLOGY, CHLOROPHYLL CONCENTRATION AND CHLOROPHYLL FLUORESCENCE OF
SANDAL SEEDLINGS
To evaluate the influence of shade on morphology, chlorophyll concentration, and
chlorophyll fluorescence, sandal seedlings were grown under full sunlight and under shade
nets that provided approximately 25 per cent, 50 per cent and 75 per cent shade. At the
end of the study, each seedling was harvested and height, number of leaves, leaf area,
collar diameter, total biomass, shoot biomass and root biomass were measured. The quality
of the seedlings was determined using SQ, DQI and PI. Chlorophyll content was measured
on leaves from each treatment and the data were analysed using one way ANOVA.
The results indicated that sandal seedlings performed well under 75 per cent shade
upto one year. Total chlorophyll concentrations were found to be higher in 50 per cent
shade. Fv/Fm ratio ranged between 0.34 and 0.67. Fv/Fm values were almost similar
under 50 per cent and 75 per cent shade. Lower Fv/Fm values were observed for sandal
seedlings grown under full sunlight. Performance Index (PI) value was greater for
sandal seedlings under 75 per cent shade (2.6) in comparison with other treatments.
Sandal seedlings are sciophilic in the early phase becoming more heliophilic once
established. Data from our studies indicated that 50 75 per cent shade is optimal for

114
growth of sandal seedlings up to one year after germination. The measurements were
conducted for six months starting from two months after germination. Exposure to full
sunlight proved to be detrimental to sandal seedlings. Sandal seedlings exposed to
sunlight exhibited extreme stress symptoms such as chlorosis and wilting, and 100 per
cent mortality was recorded within six months of the start of the experiment.
7.3. GENETIC DIVERSITY OF FUSARIUM OXYSPORUM Schlechtend Fr ISOLATES CAUSING SANDAL SEEDLING WILT
Fusarium oxysporum Schlechtend Fr is the most common and most virulent fungal
pathogen infecting sandal seedlings causing preemergence decay, vascular wilt, root rot
and wilting of older seedlings. The objective of our study was to evaluate the degree of
genetic variation in six different cultures of F. oxysporum isolated from wiltaffected sandal seedlings of sandal nursery located at Marayur in Idukki district and Peechi in
Thrissur district of Kerala state. F. oxysporum isolates were obtained from infected root,
stem and collar region from germinating seedlings to 3monthold seedlings collected
from sandal nursery at KFRI, Peechi, Thrissur campus, and from sandal nursery and
sandal regeneration experimental plot in Nachivayal II sandal reserve forest in Marayur
Sandal Division, Idukki District. Out of 102 isolates obtained from the two different
localities, three isolates were randomly selected from Peechi isolates (Fo.P1, Fo.P2 and Fo.P3) based on cultural variations and three from Marayur isolates (Fo.M1, Fo.M2 and
Fo.M3) for genetic diversity studies using RAPD markers.
Genomic DNA was extracted from mycelia following slightly modified method of
Doyle and Doyle (1990). Seven primers from OPB series viz. OPB 1, OPB 4, OPB 7,
OPB 10, OPB 11, OPB 14, OPB 15 and two primers from OPD series viz. OPD 18 and
OPD 19 were chosen based on the number and reproducibility of amplified fragments
out of 20 primers tested. RAPD analysis showed that 98.39 per cent of the loci were
polymorphic (122 out of 124). The gene diversity indices (h) showed that a few of the
loci were genetically identical; for the rest of the loci, gene diversity ranged from 0.27
to 0.50 and the mean gene diversity was 0.37. Genetic distance coefficients showed that, F. oxysporum isolate Fo.M2 and Fo.M3 from Marayur were the genetically nearer ones
(D=0.2985) and isolate Fo.P1 from KFRI nursery and isolate Fo.M2 from Marayur
were the genetically distant ones (D=0.9701). The UPGMA dendrogram revealed the

115
genetic relatedness of the six isolates of F. oxysporum. The gene diversity, genetic
distance coefficients between pair of isolates and dendrogram obtained from cluster
analysis (UPGMA dendrogram) revealed a great deal of heterogeneity among the isolates.
The most genetically similar ones were collected from KFRI nursery while the
genetically distant ones were collected from KFRI nursery and Marayur. The two
locations are geographically far apart, a distance of approximately 175 km. Generally, organisms originating from same geographical area show genetic similarity. In the
present study F. oxysporum isolates from Marayur have shown genetic similarity among themselves (lesser genetic distance) and they have aligned into one cluster. But, instead
of clustering together all the three isolates from Peechi nursery, one of them Fo.P3 clustered with the Marayur isolates. For raising seedlings at Peechi, seeds were brought
from Marayur. Hence, the isolate Fo.P3 might have reached Peechi as a seed contaminant while collecting fallen seeds from forest floor at Marayur.
By using RAPD technique, it was revealed that there existed a wide range of genetic
variation among the F. oxysporum genotypes. The large genetic variation detected at the DNA level indicated the ability of the pathogen to adapt to different ecoclimatic
conditions. The pathogen would be highly successful in infecting sandal seedlings at
different stages of the seedlings as revealed by several studies. Hence, prophylactic
treatment of sandal seeds, preferably with a systemic fungicide is suggested.
7.4. STUDIES ON GENETIC DIVERSITY OF SANDAL IN SEED STAND
S. album is a ‘vulnerable’ species and hence it is of paramount importance to evaluate and maintain genetic variability within and among populations because
populations consisting of genetically uniform individuals will be vulnerable to major climatic changes, and pest and disease outbreaks. One of the reasons for poor sandal
regeneration in natural forests is high seedling mortality. This demands large quantity of seeds for sowing in new localities as well as in sandal forests where practically very
little regeneration takes place. Recently it has been reported that expected quantity of seeds are unavailable from the seed stands established during 198081 at Anchalpatty in
Nachivayal reserve, Marayur Sandal Division in Idukki District, Kerala State. Most of the sandal trees flower profusely, but they do not set seeds. Sandal being a cross
pollinated plant, fruit setting and seed formation takes place usually if pollination and

116
fertilization occurs between genetically unrelated genotypes. Though, failure to develop
mature seeds may occur due to unsuccessful pollination and fertilization, pathogenic infection of developing fruits, premature flower and fruit fall, etc., such major problems
did not come to our notice. Hence, we assessed the level of clonality and genetic diversity of sandal trees in sample plots from seed stand at Marayur using ISSR markers. Two plots,
each of 20m x 20m size with 17 trees in each plot were randomly selected for the study.
Three primers (viz. UBC836, UBC841 and UBC807) were chosen out of 6 primers
tested for maximum number of amplicons having clarity, sharpness and consistency.
Leaf DNA samples of the 17 sandal trees from each plot were screened for genetic
variation using the three selected primers. The resulting PCR amplified products were
screened for presence or absence of bands. The per cent of polymorphism was 44 and
48 respectively in plot I and plot II. The mean gene diversity index values were 0.1478
for plot I and 0.17 for plot II which were poor for a cross pollinated tree such as sandal.
Dice similarity coefficient values calculated using the software NTSYSpc ver 2.1
ranged from 0.73 to 1 in plot I and 0.78 to 1 in plot II. Half of the total number of trees
sampled showed very high genetic similarity (0.951) among each pair of trees. This
suggested that one of the two trees from each pair might have originated as root sucker
from the other. The dendrogram generated using the Dice similarity coefficients also
revealed the genetic relatedness of the 17 S. album trees within in each plot. The 17 genotypes of sandal trees from plot I first separated to two major clusters at the genetic
similarity coefficient value of 0.84. Cluster I consisted of twelve genotypes and rest of
the genotypes were grouped in cluster II. The 17 genotypes of sandal trees from plot II
first separated into a large cluster comprising 16 genotypes and another one with only
one genotype at the genetic similarity coefficient value of 0.84. The large cluster
consisted of two subclusters, each with eight genotypes.
7.5. CONCLUSIONS
It can be concluded from the present study that sandal seedlings need to be transferred
to polybags containing a potting mixture within 26 days after germination for proper
growth and development. Host plants need to be provided within 34 months after transfer
of sandal seedlings to polybags. Plantable quality of seedling can be produced in

117
polybags by providing V. unguiculata as the primary (pot) host. On field transplantation
Pongamia pinnata can be supplied as the long term host. This protocol is useful for raising sandal seedlings under nursery conditions and subsequent field transplantation.
Sandal seedlings are sciophilic in the early phase, becoming more heliophilic once
established. Data from studies on the effect of shade on morphology, chlorophyll
concentration and chlorophyll fluorescence of sandal seedlings indicated that 5075 per
cent shade is optimal for growth of sandal seedlings up to one year. Results indicated
that the photosynthetic activity of sandal seedlings would be limited when grown in
environments with high light intensity due to photoinhibition. Extremes of light
intensity can cause mortality of the seedlings as observed in the present study.
Fusarium wilt causes heavy seedling mortality in sandal seedling nurseries and
natural forests. Information on the biology and genetic diversity of the pathogen is
extremely important, as the pathogen possessed a wide host range. By using RAPD
technique, it was revealed that there existed a wide range of genetic variation among the
F. oxysporum genotypes. The large genetic variation detected at the DNA level indicated the ability of the pathogen to adapt to different ecoclimatic conditions. Since,
the pathogen was prevalent in the soils of Marayur, a major source of good quality
sandal seeds, the seeds originating from Marayur could be contaminated with the
fungus. Hence, a prophylactic treatment of sandal seeds, preferably with a systemic
fungicide is very important. Since the infected plant usually perishes, prophylactic
fungicidal treatment has to be given at various stages of seedling growth.
Sandal trees growing in Nachivayal sandal reserve, especially in seed stand were not
producing expected quantity of seeds. Being a cross pollinated plant, pollination and
fertilization between genetically similar trees may cause inbreeding resulting in failure
to produce viable seeds or poor performance of inbred seeds. The ISSR marker study
showed identity of DNA profiles of sandal trees indicating that such trees could be
clones which might have arisen from root suckers. Low percentage of polymorphism
and low genetic diversity showed very high chance of inbreeding in the seed stand
which could be the major reason for poor seed production in the seed stands. Hence, the
practice of root sucker induction by trenching around sandal trees in forests especially
seed stands has to be discontinued because the technique increases clonality which in
turn reduces genetic diversity in the seed stand.

REFERENCES

118
REFERENCES
Adler, L. C. 2000. Alkaloid uptake increases fitness in a hemiparasitic plant via reduced herbivory and increased pollination. American Naturalist. 156: 9299.
Alfonso, C., Raposo, R. and Melgarejo, P. 2000. Genetic diversity in Botrytis cinerea populations on vegetable crops in greenhouse in Southeastern Spain. Plant Pathology. 49: 243251.
Alves Santos, F. M., CordeiroRodrigues, L., Sayagues, J. M., MartinDominguez, R., GarciaBenavides, P., Crespo, M. C. and Eslava, A. P. 2002. Pathogenicity and race characterization of Fusarium oxysporum f. sp. phaseoli isolates from Spain and Greece. Plant Pathologist. 51: 605611.
Amy. J. N., Karol. S. E., Arevalo, E. G., Lee. C. D. and Bryan. A. B. 1997. Genetic characterization by RAPD analysis of isolates of Fusarium oxysporum f. sp. erythroxyli associated with an emerging epidemic in Peru. Phytopathology. 87: 12201225.
Ananthapadmanabha, H. S. 2000. Sandalwood and its marketing trend. My Forest. 36: 147151.
Ananthapadmanabha, H. S., Nagaveni, H. C., and Rai, S. N. 1988. Influence of host plants in growth of sandal. My Forest. 24: 154160.
Ananthapadmanabha, H. S., Rangaswamy, C. R., Sarma, C. R., Nagaveni, H. C., Jain, S. H., and Krishnappa, H. P.1984. Host requirement of sandal. Indian Forester. 84: 264268.
Ang Li and Song Ge. 2001. Genetic variation and clonal diversity of Psammochloa villosa (Poaceae) detected by ISSR markers. Annals of Botany. 87: 585590.
Angadi, V. G. S., Jain, S. H. and Shankaranarayana, K. H. 2003. Genetic diversity between sandal populations of different provenances in India. Sandalwood Research Newsletter. 18: 45.
Annapurna, D., Rathore, T. S. and Geetha. J. 2006. Modern nursery practices in the production of quality seedlings of Indian sandalwood (Santalum album L.) stage of host requirement and screening of primary host species. Journal of Sustainable Forestry. 22: 3355.

119
Annapurna, D., Rathore, T. S. and Geeta. J. 2007. Integrated nursery practices for mass production of quality planting stock of Santalum album L. In Proceedings of the National Seminar on Conservation, Improvement, Cultivation and Management of Sandal (Santalum album L.), IWST, Bangalore, 1213 December, 2007. Edited by S. Gairola, T. S. Rathore, G. Joshi, A. N. Arun Kumar, and P. Aggarwal. Institute of Wood Science and Technology, Bangalore. pp. 6773.
Ansari, S. A., Narayanan, C. and Kumar, P. 2007. Molecular marker analysis of sandalwood. In Proceedings of the National Seminar on Conservation, Improvement, Cultivation and Management of Sandal (Santalum album L.), IWST, Bangalore, 1213 December, 2007. Edited by S. Gairola, T. S. Rathore, G. Joshi, A. N. Arun Kumar, and P. Aggarwal. Institute of Wood Science and Technology, Bangalore. pp 7881.
Applegate, G. B., Chamberlain, J., Dahuri, G., Feigelson, J. L., Hamilton, L., Mc Kinnell, F. H., Neil, P. E., Rai, S. N., Rodehn, B., Statham, P. C. and Stemmermann, L. 1990. Sandalwood in the Pacific. A state of the knowledge synthesis and summary from the April 1990 symposium. In Proceedings of the symposium on Sandalwood in the Pacific, 911 April, 1990, Honolulu, Hawaii. USDA Forest Service Tech. Rep. PSW 122. pp 111.
Aradhya, A. M. and Philips, V. D. 1993. Genetic variability in fourteen provenances of Eucalyptus species in Hawaii. Silvae Genetica. 42: 915.
Arnau, G., Lallemand, J. and Bourgoiu, M. 2003. Fast and reliable strawberry cultivar identification using inter simple sequence repeat (ISSR) amplification. Euphytica. 129: 6979.
Arnau, J., Housego, A. P. and Oliver, R. P. 1994. The use of RAPD markers in the genetic analysis of the plant pathogenic fungus Cladosporium fulvum. Current Genetics. 25: 438444.
Assigbetse, K. B., Fernandez, D., Dubois, M. P. and Geigern, J. P. 1994. Differentiation of Fusarium oxysporum f. sp. vasinfectum races on cotton by random amplified polymorphic DNA (RAPD) analysis. Phytopathology. 84: 622626.
Bagchi, J. K. and Veerendra, H. C. S. 1985. Study on intratree and intertree variations in leaves of Santalum album.My Forest. 21: 3339.
Bahuguna, A. 2007. Conservation genetics: A management tool. Annals of Forestry. 15: 159200.

120
Bahulikar, R. A., Lagu, M. D., Kulkarni, B. G., Pandit, S. S., Suresh, H. S, Rao, M. K. V., Ranjekar, P. K. and Gupta, V. S. 2004. Genetic diversity among spatially isolated populations of Eurya nitida Korth. (Theaceae) based on InterSimple Sequence Repeats. Current Science. 86: 824831.
Balasimha, D and Namboothiri, C. G. N. 1996. Chlorophyll fluorescence of Cocoa in relation to drought tolerance. Plant Physiology and Biochemistry. 23: 6466.
Balasundaran, M. 1998. A method for clonal propagation of sandal. In Sandal and its Products. Edited by A. M. Radomiljac, H. S. Ananthapadmanabha, R. M. Welbourn, and K. Satyanarayana Rao. ACIAR Proceedings. No. 84. ACIAR, Canberra, Australia. pp. 126129.
Balmas, V. S. B., Primo, P., Di Rau, D., Marcello, A. and Migheli, Q. 2005. Molecular characterization of vegetative compatibility groups in Fusarium oxysporum f. sp. radicislycopersici and f.sp. lycopersici by random amplification of polymorphic DNA and microsatelliteprimed PCR. European Journal of Plant Pathology. 111: 18.
Bapat, V. A. and Rao, P. S. 1998. Biotechnological approaches for propagation of Sandal (Santalum album L.). In Sandal and its Products. Edited by A. M. Radomiljac, H. S. Ananthapadmanabha, R. M. Welbourn, and K. Satyanarayana Rao. ACIAR Proceedings. No.84. ACIAR, Canberra, Australia. pp. 4244.
Bapat, V. A. and Rao, P. S. 1999. Somatic embryogenesis in Santalum album L. Sandalwood Research Newsletter. 8: 4.
Bapat, V. A., Fulzele, D. P., Heble, M. R. and Rao. P. S. 1990. Production of sandalwood somatic embryos in bioreactors. Current Science. 59: 746748.
Barrett, D. R. and Fox, J. E. D. 1995. A protocol suitable for raising seedlings of S. album in Timor. In Sandalwood seed nursery and Plantation Technology. Edited by L. Gyerum, J. E. D. Fox, L. Ehrhart. Field Document. FAO, Suva, Fiji. pp. 163164
Barrett, D. R. and Fox, J. E. D. 1997. Santalum album: Kernel composition, morphological and nutrient characteristics of preparasitic seedlings under various nutrient regimes. Annals of Botany. 79: 5966.
*Bateson, W. and Punnett, R. C. 1905. Experimental studies in the physiology of heredity. In Reports in the Evolution Committee of the Royal Society. Harrison and Sons. London. UK. 2: 1131.

121
Bawa, K. and Dayanandan, S. 1998. Global climatic change and tropical forest genetic resources. Climatic change. 39: 373385.
Belabid, L., Baum, M., Fortas, Z., Bouznad, Z. and Eujayi. I. 2004. Pathogenic and genetic characterization of Algerian isolates of Fusarium oxysporum f. sp. lentis by RAPD and AFLP analysis. African Journal of Biotechnology. 3: 2531.
Bidochka, M. J., Mc Donald, M. A., St. Legu, R. J. and Roberts, D.W. 1994. Differentiation of species and strains of entomopathogenic fungi by Random Amplification of Polymorphic DNA (RAPD). Current Genetics. 25: 107113.
Bin, X. Y., Tang, S. Q. and Zhou, J. Y. 2005. ISSR analysis on genetic diversity of Camellia nitidissima Chi (Theaceae) in China. Journal Wuhan Botanical Research. 23: 2026.
Binder, W. D. and Fielder, P. 1996. Chlorophyll fluorescence as an indicator of forest hardiness in white spruce seedlings from different latitudes. New Forests. 11: 233 253.
Binelli, G. and Bucci, G. 1994. A genetic linkage map of Picea abies KARST, based on RAPD markers, as a tool in population genetics. Theoretical and Applied Genetics. 88: 283288.
Blair, M., Panaud, O. and Mc Couch, S. R. 1999. Intersimple sequenece repeat (ISSR) amplification for analysis of microsatellite motif frequency and fingerprinting in rice (Oryza sativa L.). Theoretical and Applied Genetics. 98: 780792.
Booth, C. 1971. The Genus Fusarium. Commonwealth Mycological Institute, Kew, UK.
Bornet, B. C., Muller, F. P. and Branchard, M. 2002a. Highly informative nature of inter simple sequence repeat (ISSR) sequences amplified using tri and tetra nucleotide primers from DNA of cauliflower (Brassica oleraceae var 'botrytus' L). Genome. 45: 890896.
Bornet, B., Goraguer, F., Joly, G. and Branchard, M. 2002b. Genetic diversity in European and Argentinian cultivated potatoes (Solanum tuberosum subsp. tuberosum) detected by intersimple sequence repeats (ISSRs). Genome. 45: 481484.
Bradshaw, H. D. JR., Villar, M., Watson, B. D., Otto, K. G., Stewart, S. and Stettler, R. F. 1994. Molecular genetics of growth and development of Populus. A genetic linkage map of hybrid poplar composed of RFLP, STS and RAPD markers. Theoretical and Applied Genetics. 89: 167178.

122
Brand, J. E. 1994. Genotypic variation in Santalum album. Sandalwood Research Newsletter. 2: 24.
Brookes, P. D., Wingston, D. L. and Bourne, W. F. 1980. The dependence of Quercus robur and Q. petraea seedlings on cotyledon potassium, magnesium, calcium and phosphorus during the first year of growth. Forestry. 53: 167177.
Brown, A. H. D. 1978. Isozymes, plant population genetic structure and genetic conservation. Theoretical and applied Genetics. 52: 145157.
Brown, P. T. H. 1989. DNA methylation in plant and its role in tissue culture. Genome. 31: 717729.
Bule, L. and Daruhi, G. 1990. Status of the sandalwood resources in Vanuatu. In Proceedings of a symposium on Sandalwood in the Pacific. Edited by L. Hamilton, and C. E. Conrad. Honolulu, Hawaii. Pacific Southwest Research Station, USDA Forest Service, Berkeley. pp. 4660.
Byers, D. L. 1995. Pollen quantity and quality as explanations for low seed set in small populations exemplified by Eupatorium (Asteraceae). American Journal of Botany. 82: 10001006.
Camacho, F. J. and Liston, A. 2001. Population structure and genetic diversity of Botrychium pumicola (Ophioglossaceae) based on Intersimple sequence repeats (ISSR). American Journal of Botany. 88: 10651070.
Cameron, D. D. 2004. Role for differential host resistance to the hemiparasitic angiosperm, Rhinanthus minor (L.) in determining the structure of host plant communities. Ph.D. thesis. University of Aberdeen, U.K.
Castiglione, S., Wang, G., Damiani, G., Bandi, C., Bisoffi, S. and Sala, F. 1993. RAPD fingerprints for identification and for taxonomic studies of elite poplar (Populus spp.) clones. Theoretical and Applied Genetics. 87: 5459.
Cekic, C., Battey, N. H. and Wilkinson, M. J. 2001. The potential of ISSRPCR primer pair combinations for genetic linkage analysis using the seasonal flowering locus in Fragaria as a model. Theoretical and Applied Genetics. 103: 540546.
Cervera, M. T., Cabezas, J. A., Sancha, J. C., MartinezdeToda, F. and Martinez Zapater, J. M. 1998. Application of AFLPs to the characterization of grapevine Vitis vinifera L. genetic resources: A case study with accessions from Rioja (Spain). Theoretical and Applied Genetics. 97: 5159.

123
Chacko, K. C., Pandalai, R. C., Balasundaran, M., Mohanan, C., Varma, R. V., Jose Kallarackal., Sujatha, M. P. and Kumaraswamy, S. 2002. Standardization of root trainer technology for Tectona grandis, Eucalyptus tereticornis, E. grandis, E. globulus, E. camaldulensis, Acacia auriculiformis, A. mangium and Paraserianthes falcataria. KFRI Research Report No. 229. Kerala Forest Research Institute, Peechi, Thrissur. pp. 97128.
Chalmers, K. J., Newton, A. C., Waugh, R., Wilson, J. and Powell, W. 1994. Evaluation of the extent of genetic variation in mahoganies (Meliaceae) using RAPD markers. Theoretical and Applied Genetics. 89: 504508.
Chan, K. F. and Sun, M. 1997. Genetic diversity and relationships detected by isozyme and RAPD analysis of crop and wild species of Amaranthus. Theoretical and Applied Genetics. 95: 865873.
Charters, Y. M. and Wilkinson, M. J. 2000. The use of selfpollinated progenies as 'in groups' for the genetic characterization of cocoa germplasm. Theoretical and Applied Genetics. 100: 160166.
Chen, X., Line, R. F. and Leung, H. 1993. Relationship between virulence, variation and DNA polymorphism in Puccinia striiformis. Phytopathology. 83: 14891497.
Cindy, L. W., Elizabeth. A. J., Yvonne. J. F., Stephen. J. T. and Helen. M. W. 2000. Clonality and sexual reproductive failure in remnant populations of Santalum lanceolatum (Santalaceae). Biological Conservation. 96: 4554.
Critchley, C. 1998. Photoinhibition. In Photosynthesis : A comprehensive treatise. Edited by A. S. Raghavendra. Cambridge University Press. Cambridge, United Kingdom. pp. 264272.
Cropper, S. C. 1993. Management of Endangered Plants. CSIRO Publications. Melbourne.
Crowhurst, R. N., Hawthorne, E. H., Rikkerink, E. H. A. and Templeton, M. D. 1991. Differentiation of Fusarium solani f. sp. cucurbitae races 1 and 2 by random amplification of polymorphic DNA. Current Genetics. 20: 391396.
Culley, T. M. and Wolfe, A. D. 2000. Population genetic structure of the cleistogamous plant species Viola pubescens Aiton (Violaceae), as indicated by allozyme and ISSR molecular markers. Heredity. 86: 545556.

124
Danilova, T. V. and Karlov, G. I. 2006. Applications of Inter Simple Sequence Repeat (ISSR) polymorphism for detection of sexspecific molecular markers in hop (Humulus lupulus L.). Euphytica. 151: 1521.
Demmig, A. B., Adams, W. W., III. and Grace, S. C. 1997. Physiology of light tolerance in plants. Horticultural Review. 18: 215246.
Desjardins, A. E., Plattner, R. D. and Proctor, R. H. 1996. Linkage among genes responsible for fuminosin biosynthesis in Giberrella fujikuroi mating population. Applied and Environmental Microbiology. 62: 25712576.
Dey, S. 2001. Mass cloning of Santalum album L. through somatic embryogenesis: scale up in bioreactor. Sandalwood Research Newsletter. 13: 13.
*Dice, L. R. 1945. Measures of the amount of ecological association between species. Ecology. 26: 297302.
*Dickson, A., Leaf, A. L. and Hosner, J. F. 1960. Quality appraisal of white spruce and white pine seedling stock in nurseries. Forest Chronicle. 36: 1013.
Dje, Y., Tahi, G. C., Zoro, B. I. A., Malice, M., Baudoin, J. P. and Bertin. P. 2006. Optimization of ISSR marker for African edibleseeded Cucurbitaceae species’ genetic diversity analysis. African Journal of Biotechnology. 5: 8387.
Doyle, J. J. and Doyle, J. L. 1990. Isolation of DNA from fresh plant tissue. Focus. 12: 1315.
Duncan, S., Barton, J. E. and O’Brieu, P. A. 1993. Analysis of variation in isolates of Rhizoctonia solani by random amplified polymorphic DNA assay. Mycological Research. 97: 10751082.
Ernst, W. H. O. 1988. Seed and Seedling ecology of Bachystegia spiciformis, a predominant tree component in Miombo woodlands in South Central Africa. Forest Ecology and Management. 25: 195210.
Esselman, E, J., Jianqiang, L., Crawford, D, J., Winduss, J, L. and Wolfe, A, D. 1999. Clonal diversity in the rare Calamogrostis porteri ssp. Insperata (Poaceae): Comparitive results for allozymes and random amplified polymorphic DNA (RAPD) and Inter Simple Sequence Repeat (ISSR) markers. Molecular Ecology. 8: 443451.

125
Fabre, J. V., Julien, J., Parisof, D. and Dron, M. 1995. Analysis of diverse isolates of Colletotrichum lindemuthianum infecting common bean using molecular markers. Mycological Research. 99: 429435.
Fang, D. Q. and Roose, M. L. 1997. Identification of closely related citrus cultivars with intersimple sequence repeat markers. Theoretical and Applied Genetics. 95: 408 417.
Fang, D, Q., Roose, M, L., Kiueger R, R. and Federici, C, T. 1997. Fingerprinting trifoliate orange germplasm accession with accession with isozymes, RFLP's and intersimple sequence repeat markers. Theoretical and Applied Genetics. 95: 211 219.
Farnian, M. L. and Leong, S. A. 1995. Genetic and physical mapping of telomeres in the rice blast fungus, Magnaporthe grisea. Genetics. 140: 479492.
Fegan, M., Manners, J. M., Maclean, D. J., Irwin, J. A. M., Samuels, K. D. Z., Holdom, D. G. and Li, D. P. 1993. Random amplified polymorphic DNA markers reveal a high degree of genetic diversity in the entomopathogenic fungus Metarhizium anisopliae var. anisopliae. Journal of General Microbiology. 139: 20752081.
Fenner, M. 1986. A bioassay to determine the limiting minerals for seeds from nutrient deprived Senecio vulgaris plants. Journal of Ecology. 74: 497505.
Fenner, M. 1987. Seedlings. New Phytologist. 106: 3547.
Fenner, M. and Lee, W. G. 1989. Growth of seedlings of pasture grasses and legumes deprived of single mineral nutrients. Journal of Applied Ecology. 26: 223232.
Fernandez, D. and Tantaoui, A. 1994. Random Amplified Polymorphic DNA (RAPD) analysis: a tool for rapid characterization of Fusarium oxysporum f. sp. albedinis isolates. Phylopathologia Mediterranea. 33: 223229.
Filho, J. P. L., Goulart, M. F. and Lovato, M. B. 2004. Chlorophyll fluorescence parameters in populations of two legume trees. Stryphnodendron adstringens (Mart.) Coville (Mimosoideae) and Cassia ferruginea (Shrad.) Shrad. ex DC (Caesalpinoideae). Revista Brasileira de Botanica. 27: 527532.
Fisker, S. E., Rose, R., and Hause, D. L. 1995. Chlorophyll fluorescence as a measure of cold hardiness and freezing stress in 1+1 Douglasfir seedlings. Forest Science. 41: 564575.
Fox, J. E. D. 2000. Sandalwood : The royal tree. The Biologist. 47: 3134.

126
Fox, J. E. D. and Barrett, D. R. 1994. Silvicultural characteristics associated with the ecology and parasitic habit of sandalwood. In papers presented at the Sandalwood workshop held at Noumea, New Caledonia, August 112, 1994. Australian Centre for International Agricultural Research (ACIAR). CIRAD/FAO. pp. 122125.
Fox, J. E. D., Barrett, D. R., Surata, K. I. and Markum. E. 1994b. Protocol for establishment of Santalum album in Timor, Indonesia. In papers presented at the Sandalwood workshop held at Noumea, New Caledonia, August 112, 1994. Australian Centre for International Agricultural Research (ACIAR). CIRAD/FAO. pp. 134148.
Fox, J. E. D., Doronila, A. I. and Barrett, D. R. 1994a. The selection of superior pot hosts for maximum nursery growth in Santalum album. In papers presented at the Sandalwood workshop held at Noumea, New Caledonia, August 112, 1994. Australian Centre for International Agricultural Research (ACIAR). CIRAD/FAO. pp. 111.
Fox, J. E. D., Doronila, A. I., Barrett, D. R. and Surata, K. 1996. Desmanthus virgatus (L.) Willd., an efficient intermediate host for the parasitic tree species Santalum album L. Timor. Indonesia. Journal of Sustainable Forestry. 3: 1323.
Fox, J. E. D., Surata, I. K. and Sutarjo, S. 1990. Nursery potting mixture for sandal in Timor. Mulga Research Centre Journal. 10: 3844.
Francisco, D. C. G. J., Caranhas, D. S. B. D., Ulysses, M. D. S. JR., Andreia, V. F., Paulo, D. T. B. S. and Marcos, S. B. 2005. Growth, photosynthesis and stress indicators in young rosewood plants (Aniba rosaeodora Ducke) under different light intensities. Brazilian Journal of Plant Physiology. 17: 325334.
Frankel, O. H. 1983. The place of management in conservation. In Genetics and Conservation A reference for managing wild animals and plant populations. Edited by C. M. SchonewaldCox., S. M. Chambers., B. Mac Bryde., and L. Thomas. Benjamin/Cummings, Mento Park, CA, USA. pp. 114.
Frankham, R. 1997. Do Island populations have less genetic variation than mainland populations?. Heredity. 78: 311327.
Fransico, O. J., Arnoldo S. G., Seung. C. K. and Daniel J. C. 2000. Plant genetic diversity in the Canary Islands: A conservation perspective. American Journal of Botany. 87: 909919.

127
Fujita, S. I., Senda, Y., Nakaguchi, S. and Hashimoto, T. 2001. Multiplex PCR using Internal Transcribed Spacer 1 and 2 regions for rapid detection and identification of yeast strains. Journal of Clinical Microbiology. 39: 36173622.
Gairola, S., Ravi Kumar, G. and Aggarwal, P. 2007. Status of production and marketing of Sandalwood (Santalum album L.) In Proceedings of the National Seminar on Conservation, Improvement, Cultivation and Management of Sandal (Santalum album L.), IWST, Bangalore, 1213 December, 2007. Edited by S. Gairola, T. S. Rathore, G. Joshi, A. N. Arun Kumar, and P. Aggarwal. Institute of Wood Science and Technology, Bangalore. pp. 18.
Gang, H., DongHee, L., June, S. L. and Nam, S. L. 2002. A study of taxonomical relationships among species of Korean Allium sect. sacculiferum (Alliaceae) and related species using Intersimple Sequence Repeat (ISSR) markers. Botanical Bulletin of Academia Sinica. 43: 6368.
Gangopadhyay, G., Roy, S. K., Ghose, K., Poddar, R., Bandhopadhyay, T., Basu, D. and Mukherjee, K. K. 2007. Sex detection of Carica papaya and Cycas circinalis in preflowering stage by ISSR and RAPD. Current Science. 92: 524526.
Gardes, M., White, T. J., Fortin, J. A., Bruns, T. D. and Taylor, T. W. 1991. Identification of indigenous and introduced symbiotic fungi in ectomycorrhizae by amplification of nuclear and mitochondrial ribosomal DNA. Canadian Journal of Botany. 69: 180190.
George, A. S. 1984. Santalum. In Flora of Australia. Vol. 22. Australian Govt. Publishing Service, Canberra. pp. 6166.
George B. L., Campbell, L. C. and Leon T. L. 1992. Introduction to Plant Diseases. Identification and Management. Van Nostrand Reinhold, New York. pp. 178181.
Gherbawy, Y. A. M. H. and AbdelZaher, H. M. A. 1999. Isolation of fungi from tomato rhizosphere and evolution of the effect of cellulase enzymes of Nectria haematococca and Pythium ultimum var. ultimum. Czech Mycology. 51: 23.
Gherbawy, Y. A. M. H., Adler, A. and Prillingar, H. 2002. Genotypic identification of Fusarium subglutinans, F. proliferatum and F. verticillioides strains isolated from maize in Austria. Mycobiology. 30: 139145.
Ghosh, S. K., Balasundaran, M. and Ali, M. I. M. 1985. Studies on spike disease of Sandal. KFRI Research Report. No 37. Kerala Forest Research Institute, Peechi. Thrissur. pp. 56.

128
Gilbert, J. E., Lewis, R. V., Wilkinson, M. J. and Caligare, P. D. S. 1999. Developing an appropriate strategy to assess genetic variability in plant germplasm collections. Theoretical and Applied Genetics. 98: 11251131.
Goncalves, J. F. C., Barneto, D. C. S., Santos Junior, V. M., Fernandes, A. V. Sampaio, P. T. B. and Buckeridge, M. S. 2005. Growth, photosynthesis and stress indicators in young rosewood plants (Aniba rosaeodora Ducke) under different light intensities. Brazilian Journal of Plant Physiology. 17: 325334.
Goncalves, J. F. C., Marenco, R. A. and Vieira, G. 2001. Concentration of photosynthetic pigments and chlorophyll fluorescence of mahogany and tonka bean under two light environments. Brazilian Journal of Plant Physiology. 13: 149157.
Goodwin, P. H. and Annis, S. L. 1991. Rapid identification of genetic variation and pathotype of Leptosphaeria maculans by random amplified polymorphic DNA assay. Applied and Environmental Microbiology. 57: 24822486.
Goulao, L. and Oliveira, C. M. 2001. Molecular characterization of cultivars of apple (Malus X domestica Borkh) using microsatellite (SSR and ISSR) markers. Euphytica. 122: 8189.
Govindjee, R. 1995. Sixtythree years since Kautsky: Chlorophyll a fluorescence. Australian Journal of Plant Physiology. 22: 131160.
GrajalMartin, M. J., Simon, C. J. and Muehlbauer, F. J. 1993. Use of Random Amplified Polymorphic DNA (RAPD) to characterize Race 2 of Fusarium oxysporum f. sp. pisi. Phytopathology. 83: 612614.
Grattapaglia, D., O’Mally, D. M. and Dvovak, W. 1992. Multiple applications of RAPD markers to genetic analysis of Eucalyptus sp. In Proceedings of the IUFRO International Conference on Breeding Tropical Trees, Section 2.02.08. Columbia. pp.436450.
Griffin, J. J., Ranney, T. G. and Pharr, D. M. 2004. Photosynthesis, chlorophyll fluorescence, and carbohydrate content of Illicium taxa grown under varied irradiance. Journal of American Society of Horticultural Science. 129: 4653.
Groninger, J. W., Seiler, J. R., Peterson, J. A. and Kreh, R. E. 1996. Growth and photosynthetic responses of four Virginia Piedmont tree species to shade. Tree Physiology. 16: 773778.
129
Gupta, M., Chyi, Y. S., RomeroSeverson, J. and Owen, J. L. 1994. Amplification of DNA markers from evolutionary diverse genome using single primers of simple sequence repeats. Theoretical and Applied Genetics. 89: 9981006.
Guthrie, P. A., Magill, C. W., Frederiksen, R. A. and Odvody, G. N. 1992. Random Amplified Polymorphic DNA markers: a system for identifying and differentiating isolates Colletotrichum graminicola. Phytopathology. 82: 832835.
Harris, J. 1999. RAPDs in systematic a useful methodology. In Molecular Systematics and plant evolution. Edited by P. M. Hollingsworth, R. M. Bateman, and R. J. Gornall. Taylor and Francis, London, UK. pp. 221228.
Hartl, D. L. and Clark, A. G. 1989. Principles of Population Genetics. Sunderland, MA, USA: Sinauer Associates, Inc. pp. 226234.
Hawksworth, D. L., Kirk, P. M., Sutton, B. C. and Pegler, D. N. 1995. Ainsworth and Bisby’s Dictionary of the Fungi. 8 th edn. CAB International, Wallingford, Oxon.
Henry, T., Iwen, P. C. and Hinrichs, S. H. 2000. Identification of Aspergillus species using Internal Transcribed Spacer regions 1 and 2. Journal of Clinical Microbiology. 38: 15101515.
Hollingsworth, M. L., Hollingsworth, P. M., Jenkins, G. I., Bailey, J. P. and Ferris, C. 1998. The use of molecular markers to study patterns of genotypic diversity in some invasive alien Fallopia spp. (Polygonaceae). Molecular Ecology. 7: 1681 1691.
Holsinger, K. E. and Vitt, P. 1997. The future of conservation biology: What’s a geneticist to do?. In The Ecological Basis of Conservation: Heterogeneity, Ecosystems and Biodiversity. Edited by S. T. A. Pickett, R. S. Ostfeld, M. Shachak, and G. E. Likens. Chapman & Hall, New York. pp. 202216.
Honnareddy, N. and Dubey, S. C. 2006. Pathogenic and molecular characterization of Indian isolates of Fusarium oxysporum f. sp. ciceris causing chickpea wilt. Current Science. 91: 661666.
Hormaza, J. J., Dollo, L. and Polito, V. S. 1994. Identification of a RAPD marker linked to sex determination in Pistacia vera using bulked segregant analysis. Theoretical and Applied Genetics. 89: 913.
Horton, T. R. and Bruns, T. D. 2001. The molecular revolution in ectomycorrhizal ecology: peeking into the black box. Molecular Ecology. 10: 18551871.

130
Hou, Y. C., Yan, Z. H., Wei, M. Y. and Zheng, Y. L. 2005. Genetic diversity in barley from West China based on RAPD and ISSR analysis. Barley Genetic Newsletter. 35: 922.
Hsiang, T. and Mahuku, G. S. 1999. Genetic variation within and between local populations of Sclerotinia homeocarpa. Plant Pathology. 48: 8394.
Hunter, P. R. and Fraser, C. A. M. 1990. Application of the theory of adaptive polymorphism to the ecology and epidemiology of pathogenic yeasts. Applied and Environmental Microbiology. 15: 3954.
Husen, A., Khali, R. and Nautiyal, S. 2004. Attitudinal variation in chlorophyll fluorescence/photosynthetic efficiency in seedlings of some indigenous fodder species. Indian Forester. 130: 8994.
ICFRE, 2000. Forest Statistics India, Directorate of Statistics. M/S Valley Offset Printers, Dehra Dun. pp. 308.
Iqbal, M. J., Aziz, N., Saeed, N. A., Zafar, Y. and Malik, K. A. 1997. Genetic diversity evaluation of some elite cotton varieties by RAPD analysis. Theoretical and Applied Genetics. 94: 139144.
Ishida, A., Nakano, T., Matsumoto, Y., Sakoda, M. and Ang, L. H. 1999. Diurnal changes in leaf gas exchange and chlorophyll fluorescence in tropical tree species with contrasting light requirements. Ecological Research. 14: 7788.
IUCN. 2010. 2010 IUCN Red list of threatened species. (www.iucnredlist.org).
Jagadish, M. R., Ahmed, S. M., Madhu, K. S., Viswanath, S. and Rathore, T. S. 2007. Effect of seed source and collection time in Santalum album L. on germination parameters. In Proceedings of the National Seminar on Conservation, Improvement, Cultivation and Management of Sandal (Santalum album L.), IWST, Bangalore, 1213 December, 2007. Edited by S. Gairola, T. S. Rathore, G. Joshi, A. N. Arun Kumar, and P. Aggarwal. Institute of Wood Science and Technology, Bangalore. pp. 4751.
Jain, A., Bhatia, S., Banga, S. S., Prakash, S. and Lakshmikumaran, M. 1994. Potential use of Random Amplified Polymorphic DNA (RAPD) technique to study the genetic diversity in Indian mustard (Brassica juncea) and its relationship to heterosis. Theoretical and Applied Genetics. 88: 116122.

131
Jain, S. H, Angadi, V. G., Rajeevalochan, A. N., Sankaranarayana, K. H., Theagarajan, K. S. and Rangaswamy, C. R. 1998. Identification of provenances of sandal in India for genetic conservation. In Sandal and its Products. Edited by A. M. Radomiljac, H. S. Ananthapadmanabha, R. M. Welbourn, and K. Satyanarayana Rao. ACIAR Proceedings. No. 84, ACIAR, Canberra, Australia. pp. 117122.
Jain, S. H., Angadi, V. G. and Shankaranarayana, K. H. 2003. Edaphic, environmental and genetic factors associated with growth and adaptability of Sandal (Santalum album L.) in provenances. Sandalwood Research Newsletter. 17: 67.
Jain, S. H., Angadi, V. G., Ravikumar, G., Theagarajan, K. S. and Shankaranarayana, K. H. 1999. Studies on cultivation and chemical utilisation of Sandal (Santalum album L.) Fafai Journal. pp. 4953.
Janssen L. H. J., Oeveren, V. P. R., Hassett, V. and Kuiper, P. J. C. 1995. Genotypic variation in chlorophyll fluorescence parameters, photosynthesis and growth of tomato grown at low temperature and low irradiance. Photosynthetica. 31: 301 314.
Jeeva, V., Saravanan, S., Devaraj. P. and Lakshmidevi, R. 1998. Malady and remedy of sandal cultivation in farmlands and private lands An overview. In Sandal and its Products. Edited by A. M. Radomiljac, H. S. Ananthapadmanabha, R. M. Welbourn, and K. Satyanarayana Rao. ACIAR Proceedings. No.84. ACIAR, Canberra, Australia. pp. 16.
Jiko, L. R. 2000. Status and current interest in sandalwood in Fiji. Sandalwood Research Newsletter. 10: 13.
Jin, Z. X. and Li, J. M. 2007. ISSR analysis on genetic diversity of endangered relic shrub Sinocalycanthus chinensis. Chinese Journal of Applied Ecology. 18: 247253.
Jin, Z. X., Li, J. M. and Gu, Q. P. 2006. Genetic diversity in the natural populations of Rhododendron fortunei revealed by ISSR molecular markers. Acta Horticulturae Sinica. 33: 12631267.
Joshi, G. and Arun Kumar. A. N. 2007. Standardization of optimum conditions for storage of Santalum album L. seeds for ex situ germplasm conservation. In Proceedings of the National Seminar on Conservation, Improvement, Cultivation and Management of Sandal (Santalum album L.), IWST, Bangalore, 1213 December, 2007. Edited by S. Gairola, T. S. Rathore, G. Joshi, A. N. Arun Kumar, and P. Aggarwal. Institute of Wood Science and Technology, Bangalore. pp. 5254.

132
Joshi, S. C. 1995. Species specific diurnal changes in chlorophyll fluorescence in tropical deciduous and evergreen plants growing in the field during summer. Photosynthetica. 31: 549557.
Joshi, S. P., Gupta, V. S., Aggarwal, R. K., Ranjekar, P. K. and Brar, D. S. 2000. Genetic diversity and phyolgenetic relationship as revealed by Inter Simple Sequence Repeat (ISSR) polymorphism in the genus Oryza. Theoretical and Applied Genetics. 100: 13111320.
Kalc Wright, G. F., Guest, D. I., Wimalajeeva, D. L. S. and Van. H. R. 1996. Characterization of Fusarium oxysporum isolated from carnation in Australia based on pathogenicity, vegetative compatibility and random amplified polymorphic DNA (RAPD) assay. European Journal of Plant Pathology. 102: 451457.
Kantety, R. V., Zeng, X. P., Bennetzen, J. L. and Zehr, B. E. 1995. Assessment of genetic diversity in dent and popcorn (Zea mays L.) inbred lines using intersimple sequence repeat (ISSR) amplification. Molecular Breeding. 1: 365373.
Kaundun, S. S., Alexander Zhyvoloup and Toung G. P. 2000. Evaluation of the genetic diversity among elite tea (Camellia sinensis var. sinensis) accessions using RAPD markers. Euphytica. 115: 716.
*Kautsky, H. and Hirsh, A. 1931. Neue Versuche zur Kohlensaureassimilation. Naturwissenschaften. 19: 964.
Kautsky, H., Appel, W. and Amann, H. 1960. Chlorophyll fluorescenzund Kohlensaureassimilation. Biochenische Zeitschriff. 322: 277292.
Keil, M. and Griffin, A. R. 1994. Use of Random Amplified Polymorphic DNA (RAPD) markers in the discrimination and verification of genotypes in Eucalyptus. Theoretical and Applied Genetics. 89: 442450.
Kelly, A., AlcalaJimenez, A. R., Bainbridge, B. W., Heale, J. B., PerezArtes, E. and JimenezDiaz, R. M. 1994. Use of genetic fingerprinting and random amplified polymorphic DNA to characterise pathotypes of Fusarium oxysporum f. sp. ciceris infecting chickpea. Phytopathology. 84: 12931298.
Kelly, A. G., Bainbridge, B. W., Heale, J. B., PerezArtes, E. and JimenezDfaz, R. M. 1998. Plantapolymerasechain reaction detection of the wilt inducing pathotype of Fusarium oxysporum f.sp. ciceris in chickpea (Cicer arietinum L.). Physiology and Molecular Plant Pathology. 52: 397409.

133
Kelly, C. K. 1990. Plant Foraging: a marginal value model and coiling response in Cuscuta subinclusa. Ecology. 71: 19161925.
Kelly, C. K., Venable, D. L. and Zimmerer, K. 1988. Host specialization in Cuscuta costaricensis: An assessment of host use relative to host availability. Oikos. 53: 315320.
Kemp, R. H., Namkoong, G. and Wadsworth, F. H. 1993. The nature of forest genetic resources. In Conservation of genetic resources in tropical forest management Principles and concepts. FAO Forestry paper 107. Rome. pp. 514.
Khan, S. R., Rose, R., Haase, D. L. and Sabin, T. E. 2000. Effects of shade on morphology, chlorophyll concentration, and chlorophyll fluorescence of four Pacific Northwest Conifer Species. New Forests. 19: 171186.
King, R. A. and Ferris, C. 2000. Chloroplast DNA and nuclear DNA variation in the sympatric older species Alnus cordata (Lois.) Duby and A. Glutinosa (L.) Gaertm. Biological Journal of the Linnean Society. 70: 147160.
Kistler, H. C. 1997. Genetic diversity in the plant pathogenic fungus Fusarium oxysporum. Phytopathology. 87: 474479.
Kitajima, K. 1992a. The importance of cotyledon functional morphology and patterns of Seed Reserve Utilization for the Physiological Ecology of Neotropical Tree Seedlings. Ph.D. Thesis. University of Illinois, Urbana.
Kitajima, K. 1992b. Relationship between photosynthesis and thickness of cotyledons for tropical tree species. Functional Ecology. 6: 582584.
Kitajima, K. 1996. Ecophysiology of Tropical Tree Seedlings. In Tropical Forest Plant Ecophysiology. Edited by Stephen S. Mulkey, Robin L. Chazdon and Alan P. Smith. Chapman & Hall. International Thomson Publishing Company. pp. 559 592.
Kitajima, K. 2002. Do shade tolerant tropical tree seedlings depend longer on seed reserves? Functional growth analysis of three Bignoniaceae species. Functional Ecology. 16: 433444.
Kitajima, K. and Fenner, M. 2000. Seedling regeneration ecology. In Seeds: Ecology of Regeneration in Plant Communities. Edited by M. Fenner. CAB International, Wallingford, U.K. pp. 331360.

134
Kitao, M., Lei, T. T., Koike, T., Tobita, H. and Maruyama, Y. 2000a. Susceptibility to photoinhibition of three deciduous broadleaf tree species with different successional traits raised under various light regimes. Plant Cell & Environment. 23: 8189.
Kitao, M., Lei, T. T., Koike, T., Tobita, H., Maruyama, Y., Matsumoto, Y. and Ang, L. H. 2000b. Temperature response and photoinhibition investigated by chlorophyll fluorescence measurements for four distinct species of dipterocarp trees. Physiologia Plantarum. 109: 284290.
Knutson, D. M. 1983. Physiology of misttetoe parasitism and disease responses in the host. In The Biology of mistletoes. Edited by M. Calder and P. Bernhardt. Academic Press, Sydney, Australia. pp. 295316.
Kojima, T., Nagaoka, T., Noda, K. and Ogihara, Y. 1998. Genetic linkage map of ISSR and RAPD markers in Einkorn wheat in relation to that of RFLP markers. Theoretical and Applied Genetics. 96: 3745.
Krause, G. H. and Somersalo, S. 1989. Fluorescence as a tool in photosynthesis research. Applications in studies of photo inhibition, cold acclimation, and freezing stress. Philosophical Transactions of the Royal Society B: Biological Sciences London. 323: 281293.
Krause, G. H. and Weis, E. 1991. Chlorophyll fluorescence and photosynthesis: The basics. Annual Review of Plant Physiology and Plant Molecular Biology. 42: 313 349.
Krigel, I. 1967. The Early requirement for plant nutrients by subterranean clover seedlings (Trifolium subterraneum). Australian Journal of Agricultural Research. 18: 879886.
Kuginuki, Y., Ajisaka, H., Yui, M., Yoshikawa, H., Hida, K. and Hirai, M. 1997. RAPD markers linked to a club root resistance locus in Brassica rapa. L. Euphytica. 98: 149154.
Kuijt, J. 1969. The Biology of Parasitic Flowering Plants. Berkeley, CA, USA: University of California Press.
Kulkarni, H. D. 1995. Studies on variations and tree improvement aspects of sandal (Santalum album L.). Ph.D thesis submitted to University of Mysore, Manasagangotri, Mysore. pp. 197198.

135
Kulkarni, H. D. and Muniyamma, M. 1998. Floral biology and breeding systems in sandal. Santalum album L. In Sandal and its Products. Edited by A. M. Radomiljac, H. S. Ananthapadmanabha, R. M. Welbourn, and K. Satyanarayana Rao. ACIAR Proceedings. No. 84. ACIAR, Canberra, Australia. pp. 135146.
Kull, O. 2002. Acclimation of photosynthesis in canopies: models and limitations. Oecologia. 133: 267269.
Kumar, A. A. N. and Joshi, G. 2007. Tree Improvement in SandalwoodRetrospect and Prospect. In Proceedings of the National Seminar on Conservation, Improvement, Cultivation and Management of Sandal (Santalum album L.), IWST, Bangalore, 1213 December, 2007. Edited by S. Gairola, T. S. Rathore, G. Joshi, A. N. Arun Kumar, and P. Aggarwal. Institute of Wood Science and Technology, Bangalore. pp. 3237.
Kushalappa, K. A. 1983. Sandal as a species for social forestry. My Forest. 19: 185187.
Lambers, H., Chapin, III, F. S. and Pons, T. L. 1998. Plant Physiological Ecology. SpringerVerlag, New York, U. S. A.
Lanham, P. G. and Brennan, R. M. 1999. Genetic characterization of gooseberry (Ribes grossularis subgenus Grossularia) germplasm using RAPD, ISSR and AFLP markers. Journal of Horticultural Science and Biotechnology. 74: 361366.
Larsen, H. S., South, D. B. and Boyer, J. M. 1986. Root growth potential, seedling morphology and bud dormancy correlate with survival of Loblolly pine seedlings planted in December in Alabama. Tree Physiology. 1: 253263.
*Lewontin, R. C. and Hubby, J. 1966. A molecular approach to the study of genetic heterozygosity in natural populations of Drosophila pseudoobscura. Genetics. 54: 595609.
Li, J. M. and Jin, Z. X. 2008. Genetic structure of endangered Emmenopterys henryi Oliv. based on ISSR polymorphism and implications for its conservation. Genetica. 133: 227234.
Liittge, U., Haridasan, M., Fernandes, G. W., Mattos, E. A., Trimborn, P., Franco, A. C., Caldas, L. and Ziegler, H. 1998. Photosynthesis of mistletoes in relation to their hosts at various sites in Tropical Brazil. Trees. 12: 167174.
*Link, H. F. 1809. Observations in Ordines Plantarum Naturales, Mag. Res. Natureforschung Freunde. Berlin.

136
Liu, J., Chen, X., Wang, B., He, Z., Peng, A. and Cai, M. 2006. Race identification and SCAR markers development for the pathogen of banana Panama disease Fusarium oxysporum f. sp. cubense. Acta Phytopathologica Sinica. 36: 2834.
Loveys, B. R., Tyerman, B. D. and Loveys, B. R. 2001. Transfer of photosynthate and naturally occurring insecticidal compounds from host plants to the root hemiparasitie Santalum acuminatum (Santalaceae). Australian Journal of Botany. 49: 916.
Luong, T. M. 2002. Competitive effects within and between Santalum album and pot host Alternanathera dendata. Sandalwood Research Newsletter. 16: 47.
Lynch, M. and Milligan, B. G. 1994. Analysis of population genetic structure with RAPD markers. Molecular Ecology. 3: 9199.
Magnegneau, B., Debets, F. and Hoekstra, R. F. 1993. Genetic variability and relatedness in the complex group of block Aspergilli based on random amplification of polymorphic DNA. Current Genetics. 23: 323329.
Malcolm, C. P. and Gareth. K. P. 2005. Impacts of parasitic plants on natural communities. New Phytologist. 166: 737751.
Manulis, S., Kogan, N., Reuven, M. and BenYephet, Y. 1994. Use of the RAPD technique for identification of Fusarium oxysporum f. sp. dianthi from Carnation. Phytopathology. 84: 98101.
Marenco, R. A., Goncalves, J. F. C. and Vieira, G. 2001. Leaf gas exchange and carbohydrate in tropical trees differing in successional status in two light environments in Central Amazonia. Tree Physiology. 21: 13111318.
Marko, M. D. and Stermitz, F. R. 1997. Transfer of alkaloids from Delphinium to Castilleja via root parasitism. Norditerpenoid alkaloid analysis by electrospray mass spectrometry. Biochemical systematics and Ecology. 25: 279285.
Matthies, D. 1997. Parasitehost interaction in Castillega and Orthocarpus. Canadian Journal of Botany. 751: 12521260.
Maxwell, K. and Johnson, G. N. 2000. Chlorophyll fluorescence a practical guide. Journal of Experimental Botany. 51: 659668.
Mc Comb, J. A. and Jones, M. G. K. 1998. Interspecific hybridization between Santalum album and Santalum spicatum. In Sandal and its Products. Edited by A. M. Radomiljac, H. S. Ananthapadmanabha, R. M. Welbourn, and K. Satyanarayana Rao. ACIAR Proceedings. No.84. ACIAR, Canberra, Australia. pp. 3641.

137
Mc Dermott, J. M. and Mc Donald, B. A. 1993. Gene flow in plant pathosystems. Annual Revision of Plant Pathology. 31: 353373.
Mc Glaughlin, M., Karoly, K. and Kaye, T. 2002. Genetic variation and its relationship to population size in reintroduced populations of pink sand verbena, Abronia umbellata subsp. breviflora (Nyctaginaceae). Conservation Genetics. 20: 411420.
Mc Kinnell, F. H. 1990. Status of management and silviculture research on Sandalwood in Western Australia and Indonesia. In Proceedings of the Symposium on Sandalwood in the Pacific. Edited by L. Hamilton, and C. E. Conrad. U.S. Department of Agriculture, General Technical Report. PSW 122, Hawaii. pp. 19 25.
Mc Tague, J. P. and Tiius, R.W. 1996. Forest site weather on field survival of Ponderosa pine. Tree Planters’ Notes. 47: 1623.
Mexal, J. G. and Landis, T. D. 1990. Target seedling concepts: height and diameter. In Target Seedling Symposium: Proceedings, Combined Meeting of the Western Forest Nursery Associations. August 117, 1990. Edited by R. Rose, S. J. Campbell, and T. D. Landis. General Technical Report. RM 200. Fort Collins, CO: USDA Forest Service, Rocky Mountain Forest and Range Experiment Station. pp. 1735.
Mexal, J. G. and South, D. B. 1991. Bareroot seedling culture. In Forest regeneration manual. Edited by M. L. Duryea, and P. M. Dougherty. Kluwer Academic Publishers. pp. 89115.
Michelmore, R. W., Paran, I. and Kesseli, R. V. 1991. Identification of markers linked to diseaseresistance genes by bulked segregant analysis: A rapid method to detect markers in specific genomic regions by using segregating populations. Proceedings of National Academy of Sciences. U.S.A. 88: 98289832.
Mills, P. R., Sreenivasaprasad, S. and Brown, A. E. 1992. Detection and differentiation of Colletotrichum gloeosporioides isolates using PCR. FEMS Microbiology Letters. 98: 137144.
Mills, P. R., Sreenivasaprasad, S. and Muthumeenakshi, S. 1998. Assessing diversity in Colletotrichum and Trichoderma species using molecular markers. In Molecular Variability of Fungal Pathogens. Edited by P. Bridge, Y. Couteaudier and J. Clarkson. CAB International, UK. pp. 105120.

138
Mishra, P. K., Tewari, J. P., Clear, R. M. and Turkington, T. K. 2006. Genetic diversity and recombination within populations of Fusarium pseudograminearum from Western Canada. International Microbiology. 9: 6568.
Moller, E. M., Chelkouski, T. and Geiger, H. H. 1999. Species specific PCR assays for the fungal pathogens Fusarium moniliforme and Fusarium subglutinans and their application to diagnose maize ear rot disease. Journal of Phytopathology. 147: 497 508.
Moreno, S., Martin, J. P. and Ortiz, J. M. 1998. Inter Simple Sequence Repeats PCR for characterization of closely related grapevine germplasm. Euphytica. 110: 117125.
Murphy, M. and Garkaklis, M. 2003. Hopping into a bright futureThe Woylie Sandalwood Story. Sandalwood Research Newsletter. 18: 67.
Murray, D. R. 1985. Seed Physiology. Vol.2, Germination and Reserve Mobilization. Academic Press, Sydney.
Musselman, L. J. and Press, M. C. 1998. Mistletoes as parasites: host specificity and speciation. Trends in Ecology and Evolution. 13: 101105.
Muthana, M. A. 1995. Spike disease of sandal (Santalum album). Indian Forester. 81: 500508.
Nagaoka, T. and Ogihara, Y. 1997. Applicability of inter simple sequence repeat polymorphisms in wheat for use as DNA markers in comparison to RFLP and RAPD markers. Theoretical and Applied Genetics. 94: 597602.
Nagaveni, H. C. and Srimathi, R. A. 1985. A note on haustorialess sandal plants. Indian Forester. 111: 161162.
Nageswara Rao, M. K. N., Ganeshaiah, K. N. and Uma Shaanker, R. 2007. Assessing threats and mapping sandal resources to identify genetic ‘hotspot’ for in situ conservation in peninsular India. Conservation Genetics. 8: 925935.
Naqvi, N. I., Bonman, J. M., Mackill, D. J., Nelson, R. J. and Chattoo, B. B. 1995. Identification of RAPD markers linked to major blast resistant gene in rice. Molecular Breeding. 1: 341348.
Narayanan, C., Wali, S. A., Shukla, R. K., Mandal, A. K. and Ansari, S. A. 2007. RAPD and ISSR markers for molecular characterization of teak (Tectona grandis) plus trees. Journal of Tropical Forest Science. 19: 218225.

139
Neerakal, I., Rajagopal, R. and Vijayakumar, K. R. 2005. Influence of inanimate shade on growth of rooted adalodakam (Adhatoda beddomei C.B. Clarke) cuttings. Journal of Tropical Agriculture. 43: 9193.
Nei, M. 1973. Analysis of gene diversity in subdivided populations. Proceedings National Academy of Sciences. 70: 33213323.
Nei, M. 1978. Estimation of average heterozygosity and genetic distance from a small number of individuals. Genetics. 89: 583590.
Nelson, P. E., Toussoun, T. A. and Cook, R. J. 1981. Fusarium: Diseases, Biology and Taxonomy. The Pennsylvania State University Press, University Park.
Newton, A. C., Baker, P., Ramnarine, S., Mesen, J. F. and Leakey, R. B. 1993. The Mahogany shoot borer: prospects for control. Forest Ecology and Management. 57: 301328.
Nickrent, D. L. and Duff, R. J. 1996. Molecular studies of parasitic plants using ribosomal RNA. In Advances in Parasitic Plant Research. pp. 2852.
Nijs, M., Larsen, J. S., Gams, W., Rombous, F. M., Wernars, K., Thrane, U. and Notermans, S. H. W. 1997. Variations in random amplified polymorphic DNA patterns and secondary metabolite profiles within Fusarium species from cereals from various parts of the Netherlands. Food Microbiology. 14: 449457.
Niranjana, R. and Shivamurthy, G. R. 1987. Graniferous tracheary elements in the haustorium of Osyris arborea Wall (Santalaceae). Annals of Botany. 59: 237243.
Niu, S. L., Li, K. H., Jiang, G. M., Gao, L. M., Li, Y. G., Peng, Y. and Liu, M. Z. 2004. Gas exchange and chlorophyll fluorescence response to stimulated rainfall in Hedysarum fruticosum var. mangolicum. Photosynthetica. 42: 16.
Nordenkampf, B. H. R. and Oquist, G. 1993. Chlorophyll fluorescence as a tool in photosynthesis research. In Photosynthesis and production in a changing Environment. A field and Laboratory Manual. Edited by D. O. Hall, J. M. O. Scurloch, H. R. BolharNordenkampf, R. C. Leegood and S. P. Long, Chapman & Hall. pp. 193206.
Oostermeijer, J. G. B., Berholz, A. and Poschold, P. 1996. Genealogical aspects of fragmented plant populations: a review. In Species Survival in Fragmented Landscapes. Edited by Settele., C. Margules, P. Poschold, and K. Henle. Kluwer Academic Publishers. Dordrow. pp. 93101.

140
Parasnis, A. S., Ramakrishna, W., Chowdari, K. V., Gupta, V. S. and Ranjekar, P. K. 1999. Microsatellite (GATA)n reveals sex specific differences in Papaya. Theoretical and Applied Genetics. 99: 10471052.
Parthiban, K T., Surendran, C., Murugesh, M. and Bhuvaneswaran, C. 1998. Invitro strategies for the mass multiplication of Sandal. In Sandal and its Products. Edited by A. M. Radomiljac, H. S. Ananthapadmanabha, R. M. Welbourn, and K. Satyanarayana Rao. ACIAR Proceedings. No. 84. ACIAR, Canberra, Australia. pp. 7478.
Pasquali, M., Acquandro, A., Balmas, V., Mighali, Q., Garibaldi, A. and Gullino, M. L. 2003. RAPD characterization of Fusarium oxysporum isolates pathogenic on Argyranthemum frutescens. L. Journal of Phytopathology. 151: 3035.
Pate, J. S., Davidson, N. J., Kuo, J. and Milburn, J. A. 1990a. Water relations of the root hemiparasite Olax phyllanthi (Labill). R. Br. (Olacaceae) and its multiple hosts. Oecologia. 84: 186193.
Pate, J. S., Pate, S. R., Kuo, J. and Davidson, N. J. 1990b. Growth, resource allocation and haustorial biology of the root hemiparasite Olax phyllanthi (Olaceae). Annals of Botany. 65: 437449.
Paulo, M., Ruas, C., Ruas, F., Leandro, R., Valdemar, P., Carvalho, A. E. and Tumoro, S. 2003. Genetic relationship in Coffea species and parentage determination of interspecific hybrids using ISSR. Genetics and Molecular Biology. 26: 519523.
Pharmawati, M., Yan, G. and Finnegan, P. M. 2005. Molecular variation and fingerprinting of Leucadendron cultivars (Proteaceae) by ISSR markers. Annals of Botany. 95: 11631170.
Prasad, R. D., Sharma, T. R. and Prameela Devi, T. 2007. Molecular variability and Detection of Fusarium species by PCR based RAPD, ISSR and ITSRFLP Analysis. Journal of Mycology and Plant Pathology. 37: 311318.
Press, M. C., Scholes, J. D. and Watling, J. R. 1999. Parasitic plants: Physiological and ecological interactions with their hosts. In Physiological Plant Ecology. Edited by M. C. Press, J. D. Scholes and M. G. Barker Oxford, U.K. Blackwell. Science, pp. 175197.
Prevost, A. and Wilkinson, M. J. 1999. A new system of comparing PCR primers applied to ISSR fingerprinting of potato cultivars. Theoretical and Applied Genetics. 98: 107112.

141
Provan, J., Powell, W. and Waugh, R. 1996. Analysis of cultivated potato (Solanum tuberosum) using inter microsatellite amplification. Genome. 39: 767769.
Pukacki, P. M. 2000. Effects of sulphur, fluoride, and heavy metal pollution on the chlorophyll fluorescence of Scots pine (Pinus sylvestris L.) needles. Dendrobiology. 45: 8388.
Pukacki, P. M. and Modrzynski, J. 1998. The influence of ultravioletB radiation on the growth, pigment production and chlorophyll fluorescence of Norway spruce seedlings. Acta Physiologiae Plantarum. 20: 245250.
Qian, W., Ge, S. and Hong, D. Y. 2001. Genetic variation within and among populations of a wild rice Oryza granulata from China detected by RAPD and ISSR markers. Theoretical and Applied Genetics. 102: 440449.
Radomiljac, A. M. 1994. The influence of pot host species, seedling age and nursery nutrition on Santalum album Linn. Plantation establishment. Ord River Irrigation Area, Western Australia. In papers presented at the Sandalwood workshop held at Noumea, New Caledonia, August 112, 1994. Australian Centre for International Agricultural Research (ACIAR). CIRAD/FAO. pp. 6078.
Radomiljac, A. M. 1998. The influence of pot host species, seedling age and supplementary nursery nutrition on Santalum album Linn. (Indian sandalwood) plantation establishment within the Ord River Irrigation Area, Western Australia. Forest Ecology and Management. 102: 193201.
Radomiljac. A. M. 2000. The influence of pot host species, seedling age and supplementary nutrition on S. album plantation establishment in Western Australia. Sandalwood Research Newsletter. 9: 45.
Radomiljac, A. M. and Mc Comb, J. A. 1998. Nitrogenfixing and nonnitrogen fixing woody host influences on the growth of the root hemiparasite Santalum album L. In Sandal and its Products. Edited by A. M. Radomiljac, H. S. Ananthapadmanabha, R. M. Welbourn, and K. Satyanarayana Rao. ACIAR Proceedings. No.84. ACIAR, Canberra, Australia. pp. 5457.
Radomiljac, A. M., Mc Comb, J. A. and Pate, J. S. 1999. Gas exchange and water relations of the root hemiparasite Santalum album L. in association with legume and nonlegume hosts. Annals of Botany. 83: 215224.

142
Radomiljac, A. M., Mc Comb, J. A., Pate, J. S. and Tennakoon, K. U. 1998a. Xylem transfer of organic solutes in Santalum album L. (Indian sandalwood) in association with legume and nonlegume hosts. Annals of Botany. 82: 675682.
Radomiljac, A. M., Shea, S. R., Mc Kinnell, F. H. and Mc Comb, J. A. 1998b. An overview of sandalwood and the development of sandal in farm forestry in Western Australia. In Sandal and its Products. Edited by A. M. Radomiljac, H. S. Ananthapadmanabha, R. M. Welbourn, and K. Satyanarayana Rao. ACIAR Proceedings. No.84. ACIAR, Canberra, Australia. pp. 915.
Raeder, U., Thompson, W. and Broda, P. 1989. RFLP based map of Phanerochaete Chrysosporium ME446: lignin peroxidase genes occur in clusters. Molecular Microbiology. 3: 911918.
Rai, S. N. 1990. Status and cultivation of sandalwood in India. In Proceedings of a Symposium on Sandalwood in the Pacific. Edited by L. Hamilton, and C. E. Conrad. Honolulu, Hawaii. Pacific Southwest Research Station, USDA Forest Service, Berkeley. pp. 6671.
Rai, S. N. and Kulkarni, H. D. 1986. Sandalwood plantations. In Plantations Crops Vol I. Opportunities and constraints. Edited by H. C. Srivastava, Bharatendu Vatsya, and K. K. G. Menon. Oxford and IBH Publishing Co., New Delhi. pp. 295300.
Ramalakshmi, B. S. and Rathore, T. S. 2007. Role of Trichoderma viride and T. harzianum in the biocontrol of plant pathogens of sandalwood in nursery. In Abstracts of the National Seminar on Conservation, Improvement, Cultivation and Management of Sandal (Santalum album L.), IWST, Bangalore, 1213 December, 2007. Edited by S. Gairola, T. S. Rathore, G. Joshi, A. N. Arun Kumar, and P. Aggarwal. Institute of Wood Science and Technology, Bangalore. pp. 26.
Rao, L. N. 1942. Studies in the Santalaceae. Annals of Botany. 6: 151175.
Rao, N. M., Padmini. S., Ganeshaiah, K. N. and Uma Shaanker, R. 1999. Sandal genetic resources of South India: threats and conservation approaches. In National Symposium on Role of Plant Tissue Culture in Biodiversity Conservation and Economic Development. Kosi Katarmal, Almora, UP. pp. 63.
Rao, N. M., Ravikanth, G., Ganeshaiah, K. N., Rathore, T. S. and Uma Shaanker, R. 2007. Assessing threats and identifying the ecological niche of sandal resources to identify ‘hotspots’ for in situ conservation in Southern India. In Proceedings of the National Seminar on Conservation, Improvement, Cultivation and Management of

143
Sandal (Santalum album L.), IWST, Bangalore, 1213 December, 2007. Edited by S. Gairola, T. S. Rathore, G. Joshi, A. N. Arun Kumar, and P. Aggarwal. Institute of Wood Science and Technology, Bangalore. pp. 2331.
Rao, P. S. and Srimathi, R. A. 1976. Vegetative propagation of sandal (Santalum album L.) Current Science. 46: 276277.
Remadevi, O. K., Nagaveni, H. C. and Muthukrishnan, R. 2005. Pests and diseases of sandalwood plants in nurseries and their management. In Diseases and Insects in Forest Nurseries Proceedings of the 5 th Meeting of IUFRO Working Party S7. 03. 04, May 68, 2003, Peechi, Kerala, India. Edited by A. Lilja, J. R. Sutherland, M. Poter. and C. Mohanan. Working papers of the Finnish Forest Research Institute, Finland. 11: 6975.
Ritchie, G. 1984. Assessing seedling quality. In Forest Nursery manual: production of bareroot seedlings. Edited by M. L. Duryea and T. D. Landis. The Hague: Martinus Nijhoff / Dr.Junk, W. Oregon State University, Forest Research Laboratory, Corvallis. pp. 243259.
Rohlf, J. F. 2000. NTSYSpc. Numerical Taxonomy and Multivariate Analysis System. Version 2.1. Exeter Software, Setauket. New York.
Rossetto, M., Jezierski, G., Hopper, S, D. and Dixon, K, W.1999. Conservation genetics and clonality in two critically endangered eucalypts from the highly endemic south western Australian flora. Biological Conservation. 88: 321331.
Sadasivam, S. and Manickam, A. 1992. Biochemical methods for Agricultural Sciences. Wiley Eastern Limited and TNAU, Coimbatore. pp. 184.
Saharan, M. S., Naef, A., Kumar, J. and Tiwari, R. 2007. Characterization of variability among isolates of Fusarium graminearum associated with head scab of wheat using DNA markers. Current Science. 92: 230235.
Sands, P. J. 1995. Modeling canopy production. II. From single leaf photosynthetic parameters to daily canopy photosynthesis. Australian Journal of Plant Physiology. 22: 603614.
Sanjaya, Ananthapadmanabha, H. S. and Ravishankar Rai, V. 1998. In vitro shoot multiplication from the mature tree of Santalum album L. In Sandal and its Products. Edited by A. M. Radomiljac, H. S. Ananthapadmanabha, R. M. Welbourn, and K. Satyanarayana Rao. ACIAR Proceedings. No. 84. ACIAR, Canberra, Australia. pp. 60–65.

144
Santos, L., Lucio, J., Odair, J., Carneiro, M. L. and Alberto, C. 2000. Symptomless infection of banana and maize by endophytic fungi impairs photosynthetic efficiency. New Phytologist. 147: 609615.
Sarkar, R. K., Panda, D., Rao, D. N. and Sharma, S. G. 2004. Chlorophyll fluorescence parameters as indicators of submergence tolerance in rice. IRRN. 29, 1. Crop Management and Physiology. 1: 6668.
Scheepers, D., Eloy, M. C. and Briquet, M. 1997. Use of RAPD patterns for clone verification and in studying provenance relationships in Norway Spruce (Picea abies). Theoretical and Applied Genetics. 94: 480485.
Schnell, R. J., Ronning, C. M. and Knight, J. R. 1995. Identification of cultivars and validation of genetic relationships in Mangifera indica L. using RAPD markers. Theoretical and Applied Genetics. 90: 269274.
Sensi, E., Vignani, R., Rohde, W. and Biricolti, S. 1996. Characterization of genetic biodiversity with Vitis vinifera L. Sangiovese and Colorino genotypes by AFLP and ISTR DNA marker technology. Vitis. 35: 183188.
Setiadi, D. and Komar, T. E. 2001. Current Sandalwood Seed Source in Timor Island. Sandalwood Research Newsletter. 13: 13.
Shah, F. H., Rashid, O., Simons, A. J. and Dunsdon, A. 1994. The utility of RAPD markers for the determination of genetic variation in oil palm (Elaeis guinensis). Theoretical and Applied Genetics. 89: 713718.
Shankaranarayana, K. H., Ravikumar, G., Rangaswamy, R. and Theagarajan, K. S. 1998. Sandalwood, HESP and ESPO oils from the heartwood of Santalum album L. In Sandal and its Products. Edited by A. M. Radomiljac, H. S. Ananthapadmanabha, R. M. Welbourn, and K. Satyanarayana Rao. ACIAR Proceedings. No.84. ACIAR, Canberra, Australia. pp. 8992.
Sharma, P., Sharma, K. D., Sharma, R. and Plaha, P. 2006. Genetic variability in pea wilt pathogen Fusarium oxysporum f. sp. pisi in northwestern Himalayas. Indian Journal of Biotechnology. 5: 298302.
Shashidhara, G., Hema, M. V., Koshy, B. and Farooqi, A. A. 2003. Assessment of genetic diversity and identification of core collection in sandalwood germplasm using RAPDs. Journal of Horticultural Science and Biotechnology. 78: 528536.

145
Shea, S. R., Radomiljac, A. M., Brand, J. and Jones, P. 1998. An overview of sandalwood and the development of sandal in farm forestry in Western Australia. In Sandal and its Products. Edited by A. M. Radomiljac, H. S. Ananthapadmanabha, R. M. Welbourn, and K. Satyanarayana Rao. ACIAR Proceedings. No.84. ACIAR, Canberra, Australia. pp. 915.
Sheng. Y., Weihong. Zheng., Kequan Pei. and Keping Ma. 2005. Genetic variation within and among populations of a dominant desert tree Haloxylon ammodendron (Amaranthaceae) in China. Annals of Botany. 96: 245252.
Shepherd, D. P. 1992. The breeding systems of the Western Australian Sandalwood, Santalum spicatum and the Indian sandalwood, Santalum album. Biology project, Curtin University of Technology, Perth, WA.6001. Australia.
Sindhuveerendra, H. C. and Ananthapadmanabha, H. S. 1996. The breeding system in sandal (Santalum album L.). Silvae Genetica. 45: 188190.
Sindhuveerendra, H. C. and Ananthapadmanabha, H. S. 1998. A Further Tree Improvement Strategy in Sandal (Santalum album L.). In Sandal and its Products. Edited by A. M. Radomiljac, H. S. Ananthapadmanabha, R. M. Welbourn, and K. Satyanarayana Rao. ACIAR Proceedings. No.84. ACIAR, Canberra, Australia. pp. 135146.
Sindhuveerendra, H. C., Ramalakshmi, R. and Mallesha, B. B. 1999. Variation in seed characteristics in provenances of sandal (Santalum album L.). Indian Forester. 125: 308312.
Singh, B. P., Saikia, R., Yadav, M., Singh, R., Chauhan, V. S. and Dilip. K. Arora. 2006. Molecular characterization of Fusarium oxysporum f. sp. ciceri. causing wilt of chickpea. African Journal of Biotechnology. 5: 497502.
Slapakauskas, V. and Ruzgas, V. 2005. Chlorophyll fluorescence characteristics of different winter wheat varieties. (Triticum aestivum L.). Agronomy Research. 3: 203209.
Smith, J. F. and Bateman, T. A. 2002. Genetic differentiation of rare and common varieties of Eriogonum shockleyi (Polygonaceae) in Idaho using ISSR variability. Western North American Naturalist. 62: 316326.
Smith, M. L., Bruhn, J. N. and Anderson, J. B. 1994. Relatedness and spatial distribution of Armillaria genets infecting red pine seedlings. Phytopathology. 84: 822829.

146
*Snyder, W. C. and Hansen, H. N. 1940. The species concept in Fusarium. American Journal of Botany. 27: 6467.
*Sokal, R. R. and Michener, C. D. 1958. A statistical method for evaluating systematic relationships. University of Kansas Scientific Bulletin. 38: 14091438.
Sreekanth, P. M. 2009. Population genetic structuring and gene flow estimates in Tectona grandis L.f. using AFLP markers. Ph. D. Thesis submitted to Forest Research Institute, Dehradun, Uttaranchal. pp. 7879.
Srimathi, R. A., Kulkarni, H. D. and Venkatesan, K. R. 1995. In Recent Advances in Research and Management of Santalum album L. in India. Edited by R. A. Srimathi, H. D. Kulkarni, and K. R. Venkatesan. Associated Publishing Co., New Delhi. pp. 416.
Srinivasan, V. V., Sivaramakrishna, V. R., Rangaswamy, C. R., Ananthapadmanabha, H. S. and Shankaranarayana, K. H. 1992. Sandal (Santalum album L.). Indian Council of Forestry Research and Education, Dehradun. pp. 233.
Stancato, G. C., Mazzafera, P. and Buckeridge, M. S. 2002. Carbon assimilation and partitioning in epiphyte Orchid Cattleya forbesii Lindl. x Laelia tenebrosa Rolfe under extreme levels of irradiance. Revista Brasileira de Botanica. 25: 229235.
Strasser, B. J. and Strasser, R. J. 1995. Measuring fast fluorescence transients to address environmental questions. The JIP test. In Photosynthesis: from light to biosphere. Edited by P. Mathis. Kluwer Academic. The Netherlands. 5: 977980.
Strasser, R. J., Eggenberg, P. and Strasser, B. J. 1996. How to work without stress but fluorescence. Bulletin of Royal Society of Sciences of Liege. 65: 330349.
Strasser, R. J., Srivastava, A. and TsimilliMichael. 1999. Screening the vitality and photosynthetic activity of plants by fluorescent transient. In Crop improvement for food security. Edited by R. K. Behl, M. S. Punia, and B. P. S. Lather. SSARM, Hissar, India. pp. 72115.
Strongman, D. B. and Mackay, R. M. 1993. Discrimination between Hirsutella longicolla var. longicolla and Hirsutella cornuta using random amplified polymorphic DNA fingerprinting. Mycologia. 85:6570.
Subba Rao, N. S., Yadav, D., Padmanabha, A., Nagaveni, C. S., Singh, S. and Kavimandan, S. K. 1990. Nodule haustoria and microbial features of Cajanus and Pongamia pinnata parasitized by sandal (sandalwood). Plant and Soil. 128: 249256.

147
Sullivan, D. and Coleman, D. 1998. Variability of Human Pathogenic Fungi. In Molecular Variability of Fungal Pathogens. Edited by P. Bridge, Y. Couteaudier and J. Clarkson. CAB International, UK. pp. 219220.
Suma, T. B. and Balasundaran. M. 2003. Isozyme variation in five provenances of Santalum album in India. Australian Journal of Botany. 51: 243249.
Suma, T. B. and Balasundaran. M. 2004. Genetic diversity of eight Santalum album provenances of India based on RAPD analysis. Indian Journal of Genetics and Plant Breeding. 64: 167168.
Suma, T. B. and Balasundaran. M. 2007. Variation in genetic diversity and seedling survival of sandal provenances. In Proceedings of the National Seminar on Conservation, Improvement, Cultivation and Management of Sandal (Santalum album L.), IWST, Bangalore, 1213 December, 2007. Edited by S. Gairola, T. S. Rathore, G. Joshi, A. N. Arun Kumar, and P. Aggarwal. Institute of Wood Science and Technology, Bangalore. pp. 4046.
Surata, K. 1992. Effect of host plants on growth of sandalwood (Santalum album) seedlings. Santalum. 9: 110.
Surendran, C., Parthiban, K. L., Bhuvaneshwaram, C. and Murugesh, M. 1998. Silvicultural strategies for augmentation of sandal regeneration. In Sandal and its Products. Edited by A. M. Radomiljac, H. S. Ananthapadmanabha, R. M. Welbourn, and K. Satyanarayana Rao. ACIAR Proceedings. No.84. ACIAR, Canberra, Australia. pp. 6973.
Swaminathan, M. H., Hosmath, B. J. and Mallesha, B. B. 1998. The status of Sandalwood in India. In Sandal and its Products. Edited by A. M. Radomiljac, H. S. Ananthapadmanabha, R. M. Welbourn, and K. Satyanarayana Rao. ACIAR Proceedings. No. 84. ACIAR, Canberra, Australia. pp. 38.
Swifty, C. E. 2002. Vegetative compatibility groups of Fusarium oxysporum f.sp. cepae from Onion in Colarado. Plant Disease. 86: 606610.
Taide, Y. B., Babu, J. C. and Abraham, C. C. 1994. Influence of host species on the initial growth of sandal (Santalum album L.). Indian Journal of Forestry. 17: 288292.
Talbot, N. J. 1998. Molecular variability of fungal pathogens: using the Rice blast fungus as a case study. In Molecular Variability of Fungal Pathogens. Edited by P. Bridge, Y. Couteaudier and J. Clarkson. CAB International, UK. pp. 118.

148
Tandon, J. N. 1995. Sandalwood oil industry. In Recent Advances in Research and Management of Santalum album L. in India. Edited by R. A. Srimathi, H. D. Kulkarni, and K. R. Venkatesan. Associated Publishing Company, New Delhi. pp. 186193.
Tani, N., Tomaru, N., Tsumura, Y., Araki, M. and Ohba, K. 1998. Genetic structure within a Japanese stone pine (Pinus pumila Ragel) population on Mt.Aikodake in Central Honshu, Japan. Journal of Plant Research. 111: 715.
Tantaoui, A., Ouinten, M., Geiger, J. P. and Fernandez, D. 1996. Characterization of a single clonal lineage of F. oxysporum f. sp. albedinis causing Bayoud disease of date palm in Morocco. Phytopathology. 86: 787792.
Tautz, D.1989. Hypervariabilty of simple sequences as a general source for polymorphic DNA markers. Nucleic Acids Research. 17: 64636471.
Tennakoon, K. U., Ekanayake, S. P. and Etampawala, E. R. L. B. 2000. An overview of Santalum album research in Sri Lanka. Sandalwood Research Newsletter. 11: 14.
Tennakoon. K. U. and Cameron. D. D. 2006. The anatomy of Santalum album (sandalwood) haustoria. Canadian Journal of Botany. 84: 16081616.
Tennakoon, K. U. and Pate, J. S. 1996. Heterotrophic gain of carbon from hosts by the xylemtapping root hemiparasite Olax phyllanthi. Oecologia. 105: 369376.
Tennakoon, K. U. and Pate, J. S. 1997. Xylem fluxes of fixed N through nodules of the legume Acacia littorea and the haustoria of an associated N dependent root hemiparasite Olax phyllanthi. Journal of Experimental Botany. 48: 10611069.
Tennakoon, K. U. and Pate, J. S. 1998. Biological and physiological aspects of the woody root hemiparasite Santalum acuminatum (Quandong) and its common hosts. In Sandal and its Products. Edited by A. M. Radomiljac, H. S. Ananthapadmanabha, R. M. Welbourn, and K. Satyanarayana Rao. ACIAR Proceedings. No.84. ACIAR, Canberra, Australia. pp. 5859.
Tennakoon, K. U., Pate, J. S. and Stewart, G. R. 1997. Haustorium related uptake and metabolism of host xylem solutes by the root hemiparasitic shrub Santalum acuminatum (R. Br.) A. DC. (Santalaceae). Annals of Botany. 80: 257264.
Thomas, S. and Balasundaran, M. 1999. Detection of sandal spike phytoplasma by polymerase chain reaction. Current science. 76: 15741576.
Thomas, S. and Balasundaran, M. 2001. Purification of sandal spike phytoplasma for the production of polyclonal antibody. Current Science. 80: 14891494.

149
Thompson, B. E. 1986. Seedling morphological evaluationwhat you can tell by looking. In Evaluating seedling quality: principles, procedures, and predictive abilities of major tests. Edited by M. L. Duryea. Oregon State University, Portland, Oregon, USA. pp. 5971.
Trueman, S., Warburton, C., James, E., Fripp, Y. and Wallace, H. 2001. Clonality in remnant populations of Santalum lanceolatum. Sandalwood Research Newsletter. 14: 14.
Tsumura, Y., Ohba, K. and Strauss, S, H. 1996. Diversity and inheritance of intersimple sequence repeat polymorphism in Douglas Fir (Pseudotsuga menziesii) and Sugi (Cryptomeria japonica). Theoretical and Applied Genetics. 92: 4045.
Tuttle, C. L., South, D. B., Golden, M. S. and Meldahl, R. S. 1987. Relationship between initial seedling height and survival and growth of loblolly pine seedlings planted during a droughty year. Southern Journal of Applied Forestry, 11: 139143.
Uma Shaanker, R., Ganeshaiah, K. N. and Rao, N. M. 2000. Conservation of sandal genetic resources in India: problems and prospects. In International Conference of Science and Technology for Managing Plant Diversity in the 21st century, Kuala Lumpur, Malaysia. pp. 73.
Uniyal, D. F., Thapaliyal, R. C. and Rawat, M. S. 1985. Vegetative propagation of sandal by root cuttings. Indian Forester. 111: 145148.
Vakalounakis, D. J. and Fragkiadakis, G. A. 1999. Genetic diversity of Fusarium oxysporum isolates from cucumber: Differentiation by pathogenicity, vegetative compatibility and RAPD fingerprinting. Phytopathology. 89: 161168.
Veerendra, H. C. S. and Bagchi, S. K. 1986. Analysis of inter tree variability in anatomical characters of S. album. L. Indian Forester. 112: 8084.
Venkatesan, K. R. 1980. A fresh look at the management of sandal. Sandal Research Centre. Bangalore. In Proceedings of Second Forestry Conference, F.R.I. & Colleges, Dehra Dun.
Venkatesan, K. R. 1995. Sandal and Social Forestry. In Recent Advances in Research and Management of Santalum album L. in India. Edited by R. A. Srimathi, H. D. Kulkarni, and K. R. Venkatesan. Associated Publishing Company, New Delhi. pp. 199206.
Venkatesan, K. R. and Srimathi, R. A. 1981. The sandal population a genetic survey. Paper presented at AllIndia Sandal Seminar held at Salem, Tamil Nadu. pp. 19.

150
Vidaver, W., Binder, W., Brooke, R. C., Lister, G. R. and Toivonen, P. M. A. 1989. Assessment of photosynthetic activity of nursery grown Picea glauca seedlings using an integrated fluorometer to monitor variable chlorophyll fluorescence. Canadian Journal of Forestry Research. 19: 14781482.
Viswanath, S., Dhanya, B. and Rathore, T. S. 2007. Financial viability of sandal (Santalum album L.) cultivation practices. In Proceedings of the National Seminar on Conservation, Improvement, Cultivation and Management of Sandal (Santalum album L.), IWST, Bangalore, 1213 December, 2007. Edited by S. Gairola, T. S. Rathore, G. Joshi, A. N. Arun Kumar, and P. Aggarwal. Institute of Wood Science and Technology, Bangalore. pp. 158164.
Voigt, K., Schleier, S. and Bruckner, B. 1995. Genetic variability in Gibberella fujikuroi and some related species of the genus Fusarium based on random amplification of polymorphic DNA (RAPD). Current Genetics. 27: 528535.
Vos, P., Hogers, R., Bleeker, M.,Van der Lee T., Hornes, M., Fritgers, A., Pof, J., Peleman, J., Kuiper, M. and Zabeau, M. 1995. AFLP: A new technique for DNA fingerprinting. Nucleic Acids Research. 23: 44074414.
Wagner, A., Michalek, W. and Jamiolkowska. 2006. Chlorophyll fluorescence measurements as indicators of fusariosis severity in tomato plants. Agronomy Research. 4: 461464.
Waldhoff, D., Furch, B. and Junk, W. J. 2002. Fluorescence parameters, chlorophyll concentration, and anatomical features as indicators for flood adaptation of an abundant tree species in central Amazonia: Symmeria paniculata. Environmental and Experimental Botany. 48: 225235.
Wang, G. G., Qian, H. and Klinka, K. 1994. Growth of Thuja plicata seedlings along a light gradient. Canadian Journal of Botany. 72: 17491757.
Welsch, J. and Mc Clelland, M. 1990. Fingerprinting genomes using PCR with arbitrary primers. Nucleic Acids Research. 18: 72137218.
Whitkus, R., Cruz, M., MotaBravo, L. and GomezPompa, A. 1998. Genetic diversity and relationships of cacao (Theobroma cacao. L.) in Southern Mexico. Theoretical and Applied Genetics. 96: 621627.
WilderAyers, J. A. and Tolliver, J. R. 1987. Relationships of morphological root and shoot characteristics to the performance of outplanted bare root and containerized seedlings of loblolly pine. In Proceedings, 4 th Biennial Southern Silvicultural Research Conference. Gen. Tech. Rep. Se42 Asheville, NC: USDA Forest Service, Southeastern Forest Experiment Station. pp. 206211.

151
Williams, J. G. K., Kubelik, A. R., Livak, K. J., Rafalski, J. A. and Tingy, S. V. 1990. DNA polymorphisms amplified by arbitrary primers are useful as genetic markers. Nucleic Acids Research. 18: 62316235.
Wolfe, A. D. and Liston, A. 1998. Contributions of PCRbased methods to plant systematics and evolutionary Biology. In Molecular Systematics of Plants.II. DNA Sequencing. Edited by D. E. Soltis, P. S. Soltis. and J. J. Doyle. New York. Chapman and Hall. pp. 4386.
Wolfe, K. and MorganRichards, M. 1998. PCR markers distinguish Plantago major subspecies. Theoretical and Applied Genetics. 96: 282286.
Woo, S. L., Noviello, C. and Lonito, M. 1998. Sources of molecular variability and applications in characterization of the plant pathogen Fusarium oxysporum. In Molecular Variability of Fungal Pathogens. Edited by P. Bridge, Y. Couteaudier and J. Clarkson. CAB International, UK. pp. 187208.
Yeh, F. C. 2000. Population Genetics. In Forest Conservation GeneticsPrinciples and Practice. Edited by A.Young, D. Boshier and T. Boyle. CSIRO Publishing, Australia. pp. 2137.
Yeh, F. C., Yang, R. And Boyle, T. 1999. POPGENE version 1.31: Microsoft Windows based Freeware for Population Genetic Analysis. A Quick User’s Guide. A joint project developed by Centre for International Forestry Research and University of Alberta, Canada. pp. 25.
Ying Xiong, Q., De Yuan, H., Cheng, X. F. and Kenneth, M. C. 2004. Genetic variation in the endangered and endemic species Changium smyrnioides (Apiaceae). Biochemical Systematics and Ecology. 32: 583596.
Young, A., Boshier, D. and Boyle, T. 2000. Forest Conservation Genetics: Principles and Practice. Edited by A. Young, D. Boshier and T. Boyle. CSIRO Publishing, Collingwood VIC, Australia. pp. 13.
Zhang, S., Keping, M. and Lingzhi, C. 2003. Response of photosynthetic plasticity of Paeonia suffruticosa to changed light environments. Environmental and Experimental Botany. 49: 121133.
Zietkiewicz, E., Rafalski, A. and Labuda, D. 1994. Genome fingerprinting by simple sequence repeat (SSR)anchored polymerase chain reaction. Genomics. 20:176183.
*original not seen