physiological measures for human performance …ehsanesf/ieee_access2017.pdfamirhossein h. memar,...
TRANSCRIPT

Date of publication xxxx 00, 0000, date of current version xxxx 00, 0000.
Digital Object Identifier 10.1109/ACCESS.2018.2790838
Physiological Measures for HumanPerformance Analysis in Human-RobotTeamwork: Case of Tele-ExplorationAMIRHOSSEIN H. MEMAR, (Student Member, IEEE)and EHSAN T. ESFAHANI, (Member, IEEE)Department of Mechanical and Aerospace Engineering, University at Buffalo, Buffalo, NY 14260 USA
Corresponding author: Ehsan T. Esfahani (e-mail: [email protected]).
ABSTRACT Continuous monitoring of mental workload and situation awareness in operational environ-ments are useful for understanding and prediction of human performance. Such information can be usedto develop real-time adaptive systems to enhance human performance. In this paper, we investigate the useof workload- and attention-related physiological measures to predict operator performance and situationawareness in the context of tele-exploration with a small team of robots. A user study is conducted basedon a simulated scenario involving visual scanning and manual control tasks with varying levels of task-load. Brain activity and eye movements of the participants are monitored across the experimental tasksusing electroencephalogram (EEG) and eye tracker sensors. The performances of the subjects are evaluatedin terms of target detection and situation awareness (primary metrics) as well as reaction time and falsedetection (secondary metrics). Moreover, individual differences in two specific visual skills, visual search(VS) and multi-object tracking (MOT), are considered as between-subject factors in the experimental design.The main effects of task type and individual differences reveal that VS and MOT skill have significant effectson target detection and situation awareness, respectively. The correlations of physiological measures withthe task performance and situation awareness are analyzed. The results suggest that brain-based features(mental workload and distraction) which represent the covert aspect of attention are better suited to predictthe secondary performance metrics. On the other hand, glance based features which represent the overtaspect of attention, are shown to be the best predictors of the primary performance metrics.
INDEX TERMS Human-Robot Interaction, Human Performance, Individual Differences, Mental Work-load, Physiological Measures, Situation Awareness.
I. INTRODUCTION
MOBILE robots are becoming more involved in thevariety of tele-exploration tasks such as surveillance
of large areas [1], search and rescue [2] and military missions[3]. However, fully autonomous systems are still vulnerablein unconstrained environments where unanticipated eventsand uncertainties are unavoidable. As a result, human-robotteamwork is often required in time-critical and risk-sensitivemissions. Depending on the level of autonomy and the natureof the task, one human operator may even be able to coop-erate with multiple robots simultaneously [4]. For instance,in supervisory control where team coordination is the maintask of the operator, it would be feasible for a single operatorto cooperate with up to 12 unmanned aerial vehicles [5], [6].However, for low-level control tasks such as visual scanning
or manual maneuvering, which is the focus of this study,the size of the human-robot team is significantly smaller toattenuate the cognitive burden on the operator [7].
To consistently sustain vigilance, an operator needs tomaintain a high-level of Situation Awareness (SA) whiledividing his/her attention among team members. The mostimportant factors contributing to the loss of SA are mentalworkload, level of expertise and multitasking (managementof attention) [8]. For instance, performing multiple tasks witha limited level of autonomy may increase the mental work-load to the extent that it exceeds operator mental capabilitiesand ultimately leads to the loss of SA and performancedegradation. To predict and avoid such situations, a coherenthuman-aware framework is required to enhance human per-formance by adapting the system behaviors, modifying the
VOLUME X, 2018 1

task allocations or changing robots’ initiative level, in orderto maintain the operator’s performance within an acceptablerange.
The main challenge in the design of such adaptive frame-works is the lack of direct and real-time evaluations ofperformance factors. For instance, although reaction time andthe accuracy of the target detection are the most popularperformance metrics in visual search tasks [9], their assess-ments require prior knowledge about the exact locations ofthe targets which are not available in real tele-operationscenarios. In other words, the performance metrics are hiddenvariables that need to be estimated from some observablemeasurements.
To address this issue, this paper proposes a cognitivemodel to estimate the operator’s performance and situationawareness from their physiological measurements and alsotaking into account their individual differences in cognitiveabilities. For this purpose, we have considered cognitivefeatures extracted from two physiological modalities: brainactivity and eye movements. By studying the relationshipbetween these features and the operator’s performance andsituation awareness, we develop a model to estimate his/herperformance in real-time. In the next section, we providea background on physiological monitoring in human-robotinteraction and summarize the main contributions of thispaper.
II. LITERATURE REVIEWRecent advances in the non-invasive sensing technologieshave provided portable and wearable solutions to record andprocess physiological data in out-of-lab settings. As a result,these systems have received much attention in recent years toestimate different cognitive states such as mental workload,engagement [10], satisfaction [11], distraction and fatigue[12], or task difficulty [13].
For instance, Bekele and Sarkar [14] developed an adap-tive framework to modify the behavior of a social robotthrough monitoring physiological responses. Esfahani andSundararajan [11] proposed an approach to detect human sat-isfaction level in human-robot interaction. Largest Lyapunovexponents and alpha-asymmetry in the frontal cortex werethe main features of that study which were extracted frombrain activity of the subjects. Wright et al. [15] studied therelationship between eye movement features and subjectivemeasures of workload and SA in a collaborative task with ateam of mobile robots. They observed positive correlationsbetween eye fixation count and self-reported workload andSA in manual control of robots. Novak et al. [16] utilizedphysiological signals including EEG, autonomic nervous sys-tem responses and eye tracking to estimate human workloadand effort in physical interactions with a robotic arm. Similarmodalities are also used to classify task difficulty in softwaredevelopment to avoid programmers from introducing bugs intheir codes [13].
Physiological data has also been studied to estimate humanperformance in variety of domains such as driving [17],
aviation [18], rehabilitation [19] and surgical training [20]. Inmost of these applications, mental workload has been exten-sively investigated as the main cognitive factor that influenceshuman performance. In these cases, adaptive automationtechniques are used to keep operator workload within anacceptable level [21], [22]. Although mental workload-basedadaptive frameworks have been found to enhance the per-formance of human-machine interaction, they face severalchallenges that limit their successful implementation [23].Some of these limitations are summarized as follow:
First, individual differences in cognitive abilities signif-icantly influence the human performance in multi-taskingenvironments. Depending on the nature of a task, differentcognitive skills such as attentional control, spatial ability,working memory capacity and gaming experience can affectthe operator’s performance in supervisory control of multiplerobots [24], [25]. In complex visual demanding tasks, action-video-gamers have been found to outperform infrequent/non-gamers. They have demonstrated enhanced spatial resolu-tion in visual processing [26], faster reaction time [27]and improved attention allocation [28]. Therefore, a reliableperformance estimation model should properly include theindividual differences most relevant to each performancemetric.
Second, mental workload estimated from the brain activ-ity, particularly EEG, is task-specific [23], [29]. An EEG-based classifier can determine the mental workload very wellwhen used for the task on which the classifier was trained,but may fail if used for similar tasks not included in thetraining data. This is particularly important in the case oftele-operation, where the physical separation between theoperator and the physical environment increases the variabil-ity and uncertainty in the task type and make it impracticalto train a classifier on all possible scenarios. Yet, there isno study to demonstrate to what extent the standard EEG-based workload classifiers can be applied for performanceprediction in complex human-machine systems.
Third, increasing the level of mental workload typicallyleads to performance degradation, however based on thenature of a task, performance and workload might be dissoci-ated [30]. Therefore, workload-based adaptation methods aremore effective in high-risk or long duration tasks [31] whereoperators are subjected to high levels of workload and safetyis the main concern. It has been suggested that measuresof both mental workload and SA are vital for elevating theperformance of complex human-machine systems as theycomplement each other [32], [33].
The purpose of the present study is to examine the relation-ship between physiological measures, operator performanceand SA in a tele-exploration task with a small group ofrobotic drones. Compared to prior works which are mostlylimited to the workload analysis [16], [17], [20], [31], inthis study we aim to address the above mentioned problemsthrough: (1) Developing a more comprehensive performanceprediction model by including cognitive features extractedfrom two different modalities (eye movement and brain ac-
2 VOLUME X, 2018

tivity) as well as the effect of individual differences in ourassessment analysis. The cognitive features are selected tocapture information about the mental workload and both theovert and covert aspect of attention. (2) We also examinethe effects of individual differences on the physiologicalmeasures and show how the identified factors can be usedto individualize the performance estimation models. (3) Fur-thermore, we investigate the generalizability of EEG indicesof workload and distraction obtained from standard neuro-cognitive assessment tests, to be used in operational environ-ments.
In general, the outcome of this study is expected to ad-vance knowledge on the real-time prediction of the operator’sperformance and his/her level of situation awareness in tele-operations. The developed performance prediction model inthis paper can be utilized in future studies to define anddevelop an intelligent layer (e.g., [34]) between human op-erators and robotic agents, where the estimated performancemetrics play a critical role in the adaption of the systembehavior and enhancing task performance.
Eye tracker Simulation Environment
Graphical User Interface
Brain Computer Interface
Joystick
FIGURE 1: The recording setup of the experiment.
III. MATERIALS AND METHODSAn interactive physics-based simulation environment is de-veloped to study the cognition of human operators during in-teraction with a small team of robots (Fig. 1). Eye movementsand brain activity, recorded in terms of EEG signals, arethe two physiological modalities used to determine humancognitive states. An eye tracker provides physiological datain terms of gaze location that is usually an indicator ofthe overt aspect of attention, while EEG signals reflect theneural activity of the brain which can be considered as thecovert aspect of attention. Therefore, by combining these twomodalities we took the advantage of both overt and covertaspects of attention in our cognitive analysis. The details ofthe experimental setup and conducted user study are providedin this section.
A. PARTICIPANTS22 subjects (16 males and 6 females) were recruited fromUniversity at Buffalo School of Engineering. Participants’ages ranged from 23 to 37 years (M = 26.8, SD = 3.7)and they had normal or corrected to normal vision. None of
the participants had prior experience with manual control ofrobotic drones, however, they were frequent computer users.
B. APPARATUSIn order to conduct experiments in a controlled environment,a simulator is developed based on the V-REP framework[35] which enables users to create and visualize detailed andrealistic 3D virtual environments. A customized version ofthe built-in drone model in V-REP is used as the roboticagent. Two vision sensors are attached to the drone’s mainbody to provide users with RGB video streams from the top-down and front field of views. The angle of view for visionsensors is set to 45◦. Drone dynamics and correspondinglow-level controllers are also implemented in the simulationenvironment such that each drone can fly in either stabilizedmanual or autonomous mode by tracking point-to-point tra-jectories. The details of the developed interactive simulationenvironment can be found in [36].
Furthermore, a graphical user interface (GUI) is developedto enable users to interact with the robotic drones for thetele-exploration task of this study. For each drone, this GUIprovides users with a message box, rough map, and videostream switchable between the front and top-down cameras.A commercial 4-axes joystick is also used as the commandinterface and navigation tool for the manual control.
C. DATA COLLECTION1) Brain ActivityThe B-Alert X10 wireless headset (Advanced Brain Mon-itoring ©, Carlsberg, CA, USA) is utilized to capture thebrain activity of the subjects, non-invasively. EEG signalsare recorded with a sampling rate of 256 Hz at 9 sensorlocations on the scalp and referenced with respect to linkedelectrodes placed on the mastoids. The sensor locations areFz, Cz, POz, F3, F4, C3, C4, P3, and P4 channels basedon the 10/20 international EEG system. Real-time cognitivestates including the level of mental workload and distractionare then extracted from artifact-free EEG data for each 1-second epoch [10].
2) Eye MovementThe Eye Tribe eye tracker (The EyeTribe ©, Copenhagen,Denmark) is used to record eye movements at a samplingrate of 30 Hz. This is a non-contact tracking system thatcaptures user’s binocular gaze information via an infraredcamera. The Eye Tribe is placed below the users’ monitorand calibrated for each individual participant prior to theexperimental study. Eye movement features are extractedfrom estimated gaze location on the computer display as wellas pupil dilation.
3) Individual DifferencesVisual Search (VS) and Multiple Object Tracking (MOT)tests are used to capture individual differences in visual skills.These two skills are shown to be related to the performance of
VOLUME X, 2018 3

video gamers in terms of target detection, situation awarenessand reaction time [28]. In our specific application, VS isused as an indication of how fast and accurate targets can bedetected, whereas MOT represents the number of objects thatan individual can track simultaneously. The results of thesequantitative assessments are used to categorize subjects’ skilllevels into low and high groups. This information is thenused in the statistical analysis and also personalizing theperformance prediction models.
D. INDIVIDUAL DIFFERENCES ASSESSMENTAfter briefing the participants about the experimental proce-dure, individual differences in visual skills are assessed. EEGbaseline of cognitive states is also recorded by conductinga neuro-cognitive test. Finally, participants are instructed toperform a tele-exploration task in which their brain activity,eye movements, and performance are measured. Followingsare the description of the experiments for recording VS, MOTand EEG baselines.
1) Visual SearchThe VS test conducted in this study is adopted from the easydisplay VS experiment designed by Castel et al. [37]. Fig. 2illustrates the sequence of a VS trial.
+
+
L
L
L
L
L
T
L
Fixation
Stimuli
Response
500 (ms)
1000 (ms)
RT (ms)
FIGURE 2: Trial sequence of the Visual Search paradigm.
Participants are asked to determine the presence or absenceof a target letter (“T”) by pressing keyboard buttons “p” forpresence and “a” for absence. At the beginning of each trial,a cross shape is illustrated in the center of the display asthe fixation point for 500 ms. In each trial, the target letterand a set of distractors are randomly located on the screenwith 50% probability for the presence of the target letter. Atotal number of 200 trials are recorded from each participant.These trials are randomly selected from four different sizesof 8, 12, 16 and 20 letters, each of which repeated 50 times.Upon receiving a response key from the participant, thetrial is ended and both the reaction time and response keyare recorded. Participants are asked to react as quickly andaccurately as possible. A publicly-available MATLAB code[38] based on PsychToolbox [39] is modified and used tomeasure participants’ VS skill.
2) Multiple Object TrackingMOT test offers an experimental approach to evaluate thenumber of moving objects that a person can track simul-taneously [40], [41]. Contrary to the VS task that requiresdiscrete shifts of attention over time, MOT task depends uponconcurrent allocation of attention to several moving objects.For example, driving requires allocation of attention to mul-tiple moving objects, such as other vehicles and pedestrians.Likewise, in the case of interaction with multiple drones, thelevel of operator’s MOT skill can potentially affect his/herperformance and situation awareness.
FIGURE 3: Trial sequence of Multiple Object Tracking paradigm. Redcircles in the third screen represent the target objects which the participantswere asked to keep track of them.
Fig. 3 demonstrates the sequences of a sample MOT trialthat is conducted in this study. At the beginning of eachtrial, a set of 12 identical circles appear on the screen andmove in random directions. After 4 seconds, a random subsetof these circles is temporally highlighted to identify thetarget objects. After 4 seconds of temporary highlights, thetarget objects turn back to the normal color and becomevisually indistinguishable from the others. Participants areasked to track the moving targets even after the highlightsare removed. After 6 seconds of tracking, circles stop and theparticipants are asked to identify all the target circles. Thisexperiment is conducted with 5 sets of 2 to 6 targets. Tentrials are repeated per each set resulting in a total of 50 trials.The number of correctly identified targets is averaged overall the trials and is used as the MOT score.
3) EEG BaselinesUpon the completion of VS and MOT tests, a neuro-cognitiveassessment (Auditory Psycho-Vigilance [10], [42]) is con-ducted to individualize the EEG classifiers. It is a standardeyes closed vigilance task used as a baseline for estimatingthe level of distraction/relaxed wakefulness of subjects.
E. EXPERIMENTAL PROCEDUREParticipants receive training and then practice on the simu-lator’s elements and the required tasks. They are also askedto perform a short practice trial to gain adequate experiencein controlling the drones by joystick and accomplish all the
4 VOLUME X, 2018

(a) (b)Top View
Side View
M GMC
FMC
(d)
Build 1
Bu
ild 2
Build 3
(c)
FIGURE 4: Simulated tele-exploration task: (a) top view of search area, (b)Random distributions of targets and distractors over the search area, (c) sideview of the search area, (d) Target shapes (cube and torus) and 6 distractors.
task objectives independently. In the main experiment, partic-ipants perform an aerial exploration using two robotic dronesto detect and identify specific geometrical objects amongdistractors (Fig. 4d), which are randomly distributed over thesearch area (Fig. 4b). The experiment is approximately 20minutes long during which participants monitor two drones;one always in autonomous mode, and the other one requiresmanual control after a while.
Tasks
VS-VS
LVS-VS HVS-VS
Low Task-Load High Task-Load
Task-Type 1
1st Drone : Autonomous
2nd Drone : Autonomous
MC-VS
GMC-VS FMC-VS
Low Task-Load High Task-Load
Task-Type 2
1st Drone : Manual
2nd Drone : Autonomous
FIGURE 5: Factorial design of the experiment.
As shown in Fig. 5, the experimental scenario consists oftwo levels of Task-Type, each of them includes two levelsof Task-Load resulting in a factorial design. The experimentbegins with the simultaneous visual scanning of the camerafeeds of the two drones (VS-VS). In this level of Task-Type, both drones autonomously track predefined trajectoriesand the participant is asked to visually scan the capturedvideos from top-down cameras and record the location ofobserved targets by pressing a button on the joystick. Twolevels of Task-Load including low (LVS-VS) and high (HVS-VS) visual load are included in the experiment. The highervisual task load is achieved by increasing the speed of thedrones and accordingly faster video streams to process bythe operator.
The second level of Task-Type is composed of simulta-neous manual control and visual scanning tasks (MC-VS).Instantly after VS-VS task, the first drone sends a messageand asks to be switched to the manual mode while the seconddrone continues the exploration in the autonomous mode.In the manual mode, users have access to the drone’s frontcamera to navigate easier. There are also two levels of Task-Loads in manual maneuvering, that are gross and fine manualcontrol. In the Gross Manual Control (GMC), subjects areasked to navigate the first drone along a provided path onthe map (see the GMC path in Fig. 4a) and simultaneouslydetect targets on the second drone’s camera (GMC-VS). Thismaneuvering is conducted in the presence of no obstacle, thusit is considered as low level difficulty. Contrary to GMC-VS,the second level of Task-Load requires fine manual controlof the first drone along with visual scanning of the seconddrone (FMC-VS). This task is called fine manual controlsince obstacle avoidance and fine motion control are neededto enter and explore the inside of two abandoned buildings(see Fig. 4a and c).
IV. DATA ANALYSISA. EYE TRACKING METRICSEye tracking metrics are mainly defined in an overall or AOI-based (Area Of Interest) fashions. AOIs are regions of thedisplay or visual stimuli that contain objects of interest andare usually defined based on the semantic information of thedisplay. In this study, the GUI is divided into 7 AOIs as shownin Fig.6. These AOIs include the message boxes, maps andcamera views of the drones.
FIGURE 6: Operator GUI and defined AOIs along with a heatmap of gazelocations corresponding to a sample practice session.
To identify periods of gaze fixations from noisy data ofeye movements, a publicly available software [43] relying ona dispersion-threshold identification algorithm [44] is used.This method identifies each fixation as a group of consecutivepoints within a particular dispersion, or maximum separationin a sliding window of 11 samples (corresponding to about360 ms). For each trial, a threshold of 7.5% of the maximumvariance is used to identify saccades corresponding to peaksin signal variance. Then, the fixation detection criterion is de-fined as the period of time between two successive saccades
VOLUME X, 2018 5

with a minimum duration of 120 ms as suggested in [44].The optimal choices of thresholds for variance and minimumfixation duration are obtained through visual inspection ona random subset of the recorded data. Each fixation point isthen compared with the predefined AOIs to identify glancesmade at each of the AOIs.
Holmqvist et al. [45] have gathered a comprehensive re-view of different eye tracking measures among which threemetrics are adopted in this study that best represent underly-ing cognitive activities of the tele-exploration. These metricsare Fixation Rate (FR), Glance Ratio (GR) and Pupil Size(PS) which are defined as follow:
Fixation Rate: FR is the number of fixations occurredwithin one second time windows. The interpretation of thismetric varies based on the task type and associated cognitivefunctions. Usability studies have shown that in general, FRis related to semantic informativeness and search difficulty[46].
Glance Ratio: GR represents the percent of time glancesare within an area of interest. In our study, it is defined as thepercentage of the glances within AOIs associated with thefirst drone (1, 3 and 5) to the ones associated with the seconddrone (2, 4 and 6). Typically, glance duration correlates withthe level of attention to an AOI [45].
Pupil Size: PS or dilation is one of the relatively continu-ous measurements that is provided by eye tracker systems.The pupil size is idiosyncratic and varies across subjects.To address this issue, we convert the raw PS values to z-scores for each individual. Moreover, to minimize the effectof luminance variation on PS, the scene light is maintainedrelatively at the same level throughout the experiment.
B. EEG METRICS
Two cognitive measures, Mental Workload (MW) and Dis-traction level (DS), are extracted from EEG signals. MWreflects working memory load and cognitive processing. Itcorresponds to the level of task difficulty and reasoningprocess. DS represents the inability of a subject to maintainpassive attention and consequently involuntary switching ofattention. The B-Alert© software is used to acquire EEGsignals and quantify the aforementioned EEG metrics. Fol-lowing is a brief description of the procedure and mainfeatures used by the B-Alert software to extract these metrics.Additional details on signal processing and classificationmethods can be found in [10], [47].
All the EEG signals are band-passed filtered (0.1-70 Hzand 20 dB/decade roll-off) and then converted to digitalformat with 256 Hz sampling rate and 16 bits/sample res-olution. Filtered signals are then transmitted via Bluetoothto a PC. Wavelet transformation is then used to identify anddecontaminate artifacts caused by muscle movements andeye blinks [10]. Finally, EEG absolute and relative powerspectral density (PSD) for bipolar electrodes listed in Table1 are computed using Fast-Fourier transform applied to 1-secepoch data with 50% overlapping Kaiser windowing.
TABLE 1: EEG variables used for classification of mental workload anddistraction level.
1-4 Hz 5-7 Hz 8-13 Hz 14-24 Hz 25-40 Hz
Absolute and relative PSD variables for MW classifier
C3C4 × × × ×
CzPOz × ×
F3Cz × × ×
F3C4 × × ×
FzC3 × × ×
FzPOz × × × ×
Absolute and relative PSD variables for DS classifier
FzPOz × ×
CzPOz × × × × ×
Mental workload is quantified based on a linear Discrim-inant Function Analysis (DFA) trained on a dataset of EEGsignals recorded from 67 participants who performed threeworking memory benchmark tasks (mental arithmetic, gridlocation and digit-span tasks) with different levels of diffi-culty. Regarding distraction, a quadratic DFA is used by theB-Alert© software. The coefficients of this model are indi-vidualized for each participant according to the baseline tasksdescribed in the experimental procedure. The correspondingPSD features used by the workload and distraction classifiersare listed in Table 1.
C. INDIVIDUAL DIFFERENCESParticipants are divided into two groups of low and highskill with respect to their VS scores. For each participant,the average score of recorded reaction times is used to assigngroup membership. Participants with reaction times less thanone standard deviation below the mean (M = 1.68, SD = .23)are categorized as high and the rest as low skill level. Sim-ilarly, participants are categorized into high and low MOTskills. The average percentage of correctly identified movingtargets is used to define the skill level of each participant.One standard deviation above the mean (M = .84, SD = .07)is considered as the threshold to group participants into twolevels of MOT skill. Fig. 7 illustrates the group distributionof VS and MOT skills.
Visual Search score (sec)1.3 1.4 1.5 1.6 1.7 1.8 1.9 2 2.1 2.2
Mu
ltip
le O
bje
ct T
rack
ing
sco
re (
%)
0.65
0.7
0.75
0.8
0.85
0.9
0.95
1
High MOT
Low MOT
HighVS
LowVS
FIGURE 7: The group distribution of VS and MOT skills. Dashed linesindicate the threshold values.
D. TASK PERFORMANCE METRICSSteinfeld et al. [48] have studied common operator perfor-mance metrics for task-oriented human-robot interaction and
6 VOLUME X, 2018
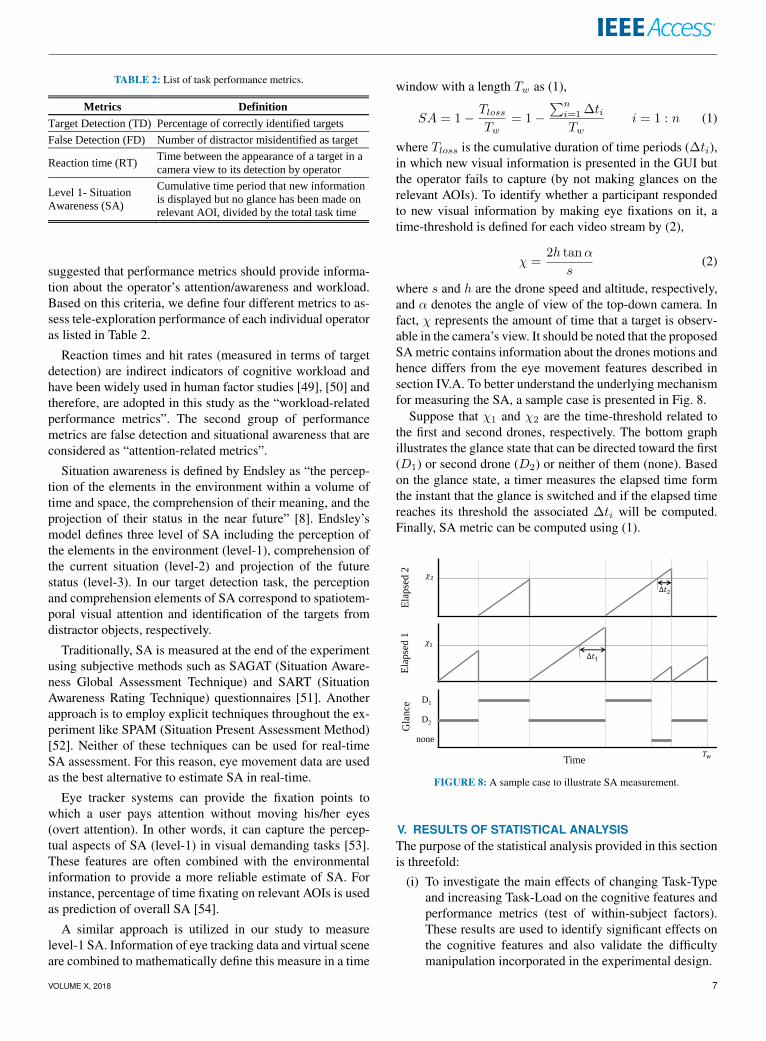
TABLE 2: List of task performance metrics.
Metrics Definition
Target Detection (TD) Percentage of correctly identified targets
False Detection (FD) Number of distractor misidentified as target
Reaction time (RT) Time between the appearance of a target in a
camera view to its detection by operator
Level 1- Situation
Awareness (SA)
Cumulative time period that new information
is displayed but no glance has been made on
relevant AOI, divided by the total task time
suggested that performance metrics should provide informa-tion about the operator’s attention/awareness and workload.Based on this criteria, we define four different metrics to as-sess tele-exploration performance of each individual operatoras listed in Table 2.
Reaction times and hit rates (measured in terms of targetdetection) are indirect indicators of cognitive workload andhave been widely used in human factor studies [49], [50] andtherefore, are adopted in this study as the “workload-relatedperformance metrics”. The second group of performancemetrics are false detection and situational awareness that areconsidered as “attention-related metrics”.
Situation awareness is defined by Endsley as “the percep-tion of the elements in the environment within a volume oftime and space, the comprehension of their meaning, and theprojection of their status in the near future” [8]. Endsley’smodel defines three level of SA including the perception ofthe elements in the environment (level-1), comprehension ofthe current situation (level-2) and projection of the futurestatus (level-3). In our target detection task, the perceptionand comprehension elements of SA correspond to spatiotem-poral visual attention and identification of the targets fromdistractor objects, respectively.
Traditionally, SA is measured at the end of the experimentusing subjective methods such as SAGAT (Situation Aware-ness Global Assessment Technique) and SART (SituationAwareness Rating Technique) questionnaires [51]. Anotherapproach is to employ explicit techniques throughout the ex-periment like SPAM (Situation Present Assessment Method)[52]. Neither of these techniques can be used for real-timeSA assessment. For this reason, eye movement data are usedas the best alternative to estimate SA in real-time.
Eye tracker systems can provide the fixation points towhich a user pays attention without moving his/her eyes(overt attention). In other words, it can capture the percep-tual aspects of SA (level-1) in visual demanding tasks [53].These features are often combined with the environmentalinformation to provide a more reliable estimate of SA. Forinstance, percentage of time fixating on relevant AOIs is usedas prediction of overall SA [54].
A similar approach is utilized in our study to measurelevel-1 SA. Information of eye tracking data and virtual sceneare combined to mathematically define this measure in a time
window with a length Tw as (1),
SA = 1 − TlossTw
= 1 −∑n
i=1 ∆tiTw
i = 1 : n (1)
where Tloss is the cumulative duration of time periods (∆ti),in which new visual information is presented in the GUI butthe operator fails to capture (by not making glances on therelevant AOIs). To identify whether a participant respondedto new visual information by making eye fixations on it, atime-threshold is defined for each video stream by (2),
χ =2h tanα
s(2)
where s and h are the drone speed and altitude, respectively,and α denotes the angle of view of the top-down camera. Infact, χ represents the amount of time that a target is observ-able in the camera’s view. It should be noted that the proposedSA metric contains information about the drones motions andhence differs from the eye movement features described insection IV.A. To better understand the underlying mechanismfor measuring the SA, a sample case is presented in Fig. 8.
Suppose that χ1 and χ2 are the time-threshold related tothe first and second drones, respectively. The bottom graphillustrates the glance state that can be directed toward the first(D1) or second drone (D2) or neither of them (none). Basedon the glance state, a timer measures the elapsed time formthe instant that the glance is switched and if the elapsed timereaches its threshold the associated ∆ti will be computed.Finally, SA metric can be computed using (1).
Time
Ela
pse
d 1
Ela
pse
d 2
none
Gla
nce
Δ𝑡1
Δ𝑡2
𝑇𝑤
𝜒2
𝜒1
D2
D1
FIGURE 8: A sample case to illustrate SA measurement.
V. RESULTS OF STATISTICAL ANALYSISThe purpose of the statistical analysis provided in this sectionis threefold:
(i) To investigate the main effects of changing Task-Typeand increasing Task-Load on the cognitive features andperformance metrics (test of within-subject factors).These results are used to identify significant effects onthe cognitive features and also validate the difficultymanipulation incorporated in the experimental design.
VOLUME X, 2018 7

TABLE 3: Significant Main Effect of MANOVA and follow-up ANOVAanalysis.
Main MANOVA Follow up ANOVA
Effect Group F* P-value 2 Factor F** P-value 2
Task Type
Performance 10.3 <0.001 0.73
TD 14.7 0.001 0.45
RT 34.3 <0.001 0.65
SA 24.2 <0.001 0.57
Eye 42.2 <0.001 0.89
GR 16.5 0.001 0.48
FR 11.1 0.004 0.38
PS 130.0 <0.001 0.88
Brain 19 <0.001 0.69 MW 37.8 <0.001 0.68
DS 21.5 <0.001 0.55
Task Load
Performance 7.9 0.001 0.68 TD 9.6 0.006 0.35
SA 36.8 <0.001 0.67
Eye 5.3 0.01 0.5 GR 10.9 0.001 0.47
Brain 5.18 0.017 0.38 DS 10.4 0.005 0.37
Type x
Load
Performance 6.2 0.004 0.62 RT 19.8 <0.001 0.53
Eye 16.2 <0.001 0.75 GR 12.2 0.001 0.5
PS 23.9 <0.001 0.57
MOTx Load
Eye 3.3 0.049 0.38
PS 8.3 0.01 0.32
* MANOVA Analysis: Performance F(4,15), Eye F(3,16), EEG F(2,17) **ANOVA Analysis: F(1,18)
(ii) To study the influence of individual differences on theperformance metrics and their interactions with cogni-tive features.
(iii) To construct a linear model for predicting the perfor-mance and situation awareness (hidden states) fromcognitive features (observable states) by taking intoaccount characterized individual differences.
For this purpose, task performance, eye movement, andEEG metrics are separately subjected to a series of 2 × 2 ×2 × 2 (VS × MOT × Task-Type × Task-Load) multivariateanalysis of variance (MANOVA) with VS and MOT groupsas between-subject factors, whereas Task-Type and Task-Load are assigned as within-subject factors. When significantresults are identified, multiple univariate ANOVAs are con-ducted for each dependent variable as a follow-up procedureto interpret the multivariate effect.
To protect against Type-I error inflation due to conductingmultiple univariate tests, Bonferroni adjustment of the alphavalue (α / number of dependent variables) is imposed. Thisadjustment leads to α =.0125, .0167 and .025 for perfor-mance, eye features and EEG features, respectively. In caseof a significant two-way interaction, test of simple maineffects is conducted to examine the differences between eachlevels of independent factors.
A. MAIN EFFECTS OF WITHIN-SUBJECT FACTORSMANOVA reveals statistically significant main effects ofTask-Type and Task-Load on the performance metrics, eye-tracker features as well as EEG features. A significant Task-Type × Task-Load interaction is also observed in the per-formance and eye-tracker metrics but not EEG features.MOT × Task-Load interaction is also found significant foreye-tracker metrics. The detailed statistical analysis of thesignificant main effects performed by the MANOVA and the
0
0.3
0.6
0.9
1.2
1.5
-1
1
3
5
7
9
-0.1
0.1
0.3
0.5
0.7
0.9
** *
Target
Detection (%)
(a)
(b)
(c)
** *
** *
LVS-VS HVS-VS GMC-VS FMC-VS
False
Detection (#)
Reaction
Time (sec)
Situation
Awareness (%)
*
** *
**
Pupil Size (Z-Score)Fixation Rate Glance Ratio
DistractionMental Workload
*
*
FIGURE 9: Mean and standard deviations of (a) performance, (b) eyemovement, and (c) EEG metrics. * indicates a significant simple main effect.
follow-up ANOVA analysis are listed in Table.3.Fig. 9a shows the mean and standard deviation of perfor-
mance metrics in each of the the two Task-Types and Task-Loads. Statistical analysis indicates that changing the Task-Type from visual search to manual control and increasingTask-Load degrade the performance in terms of target de-tection (TD) and situation awareness (SA) consistently. Forreaction time (RT) a two-way interaction of Task-Type ×Task-Load is found significant. Follow-up tests of simplemain effects for this interaction demonstrate that increasingTask-Load in the visual scanning (VS-VS) results in a fasterRT, however, an opposite behavior is observed for manualcontrol (MC-VS) task. No significant observation is obtainedfor false detection (FD).
Fig. 9b illustrates the results regarding the eye-trackingfeatures. Univariate tests of within-subject factors revealsignificant main effects of Task-Type on fixation rate (FR),glance ratio (GR) and pupil size (PS) and a significant maineffect of Task-Load on GR. These results indicate that byswitching from visual scanning to manual control FR de-creases, whereas GR and PS increase. Task-Type × Task-Load interactions are revealed for GR and PS. Tests of simple
8 VOLUME X, 2018

main effects for these interactions indicate that increasingTask-Load in MC-VS task led to higher PS and GR, whereasincreasing Task load in the VS-VS task results in a smallerpupil size and no significant change in GR.
Finally, the follow-up ANOVAs for EEG features reveal asignificant main effect of Task-Type on the mental workload(MW) and distraction (DS) as well as a significant maineffect of Task-Load on the DS. Tests of simple main effectsreveal that switching from visual scanning to manual controlcauses an increase in MW and a decrease in DS. However,increasing the Task-Load within the Task-Types leads tono significant change in the EEG features. Fig. 9c providea comparison between the EEG indices of workload anddistraction recorded during the two Task-Types and Task-Loads.
(a) (b)
FIGURE 10: The effect of individual differences in VS and MOT skill on(a) target detection and (b) situation awareness.
B. MAIN EFFECTS OF BETWEEN-SUBJECTS FACTORSUnivariate tests of between-subject factors reveal signifi-cant main effects of Visual Search (VS) skill on targetdetection (F (1, 18) =7.4, p=.012, η2p =.3) and MOT skill onsituation awareness (F (1, 18) =8.12, p=.011, η2p =.31). Par-ticipants with high VS skills outperform others in targetdetection. As shown in Fig.10a, increasing the task load hasno effect on their target detection performance, however, itaffects the performance of the remaining subjects in lowVS group significantly. Interestingly, for the situation aware-ness (SA), MOT score is the dominant individual differenceamong the subjects. As shown in Fig.10b, subjects with highMOT scores demonstrate a higher situation awareness.
Moreover, an MOT × Task-Load interaction is revealed(F (1, 18) = 8.3, p= .01, η2p = .32) that significantly affectsPS. Tests of simple main effects show that increasing Task-Load only increase the pupil sizes of participants with lowMOT and has no effect on the ones with high MOT scores.
C. RESULTS OF REGRESSION ANALYSISIn addition to the MANOVAs, separate stepwise multiplelinear regressions are conducted to identify significant cor-relations between observable cognitive features and hiddenperformance metrics. The results are summarized in Ta-ble 4. The statistical significance of each of the regressionmodels can be realized through the adjusted coefficient ofdetermination R2. By comparing this value for each of theregression models, it can be seen that situation awareness andtarget detection can be described very well with only threeregressors out of which one is an individual difference metric.
TABLE 4: Results of the regression analysis.
Performance Significance Variable Weight P-value
TD F*= 44.3, R2 =0.75
P-value <0.001
GR -0.53 <0.001
PS -0.54 0.001
Task Type x VS 0.38 0.001
SA F*= 77.5, R2 = 0.85
P-value <0.001
GR -0.59 <0.001
PS -0.29 0.004
MOT 0.27 <0.001
RT F**= 44.3, R2 =0.59
P-value <0.001
GR 0.69 <0.001
MW 0.29 0.006
FD F**= 44.3, R2 = 0.2
P-value <0.001
FR 0.34 0.019
DS 0.33 0.02
*F(3,40), **F(2,41)
The results of stepwise regression analysis shows that PShas a negative relationship with TD and SA; FR is negativelyrelated to FD; MW has a negative correlation with RT. More-over, GR is found to be the dominant predictor of operatorperformance, as it is strongly related to variations in TD, RTand SA. DS is also found as a significant predictor for FDsuch that an increased number of wrongly detected targets isassociated with high DS. Furthermore, the individual differ-ences in terms of VS and MOT skills are positively correlatedwith TD and SA, respectively.
VI. DISCUSSIONLet’s recall that our performance metrics are categorized intotwo groups: workload-related (Target Detection and ReactionTime), and attention/awareness-based (Situation Awarenessand False Detection). Among these factors, RT and FDare considered as the secondary measures since they can’tcapture the inability of subjects in processing the incominginformation. For instance, increasing the load in the visualscanning task improves the reaction time (see Fig. 9c). This isdue to higher visual load which is imposed by increasing thedrones’ speed and consequently providing participants witha shorter time window to process video streams and makedecisions. Thus, participants miss more targets (lower TD)while the identified ones are detected faster (lower RT). Asimilar trend is observed in FD. The number of incorrectlydetected targets is reduced in tasks with higher workload butit doesn’t imply a better performance as SA is significantlydecreased.
With respect to the primary metrics, significant perfor-mance degradation in target detection and situation aware-ness is observed as the task becomes cognitively more chal-lenging (switching to manual control or increasing the taskload). This is well-documented in the human factor literature[25] that higher mental workload will cause performancedegradation and loss of situation awareness. Although thesetwo observations are often accompanied, they are two distinctconcepts that are intricately related such that one affectsand is affected by the other [55]. They both are influencedby many of the same human factors (e.g., limited workingmemory, individual differences) and system variables (tasktype and difficulty). A conceptual relationship between men-
VOLUME X, 2018 9
W
O
R
L
D
Task Type
& Load
Performance
Perception +
Mental
Workload
Situational
Awareness
Working
Memory
Long term
Memory
+
Expertise
Attentional
Resources
Strategic
Management
EEG and Eye
Features
EEG and Eye
Features
Individual
Differences
VS + MOT
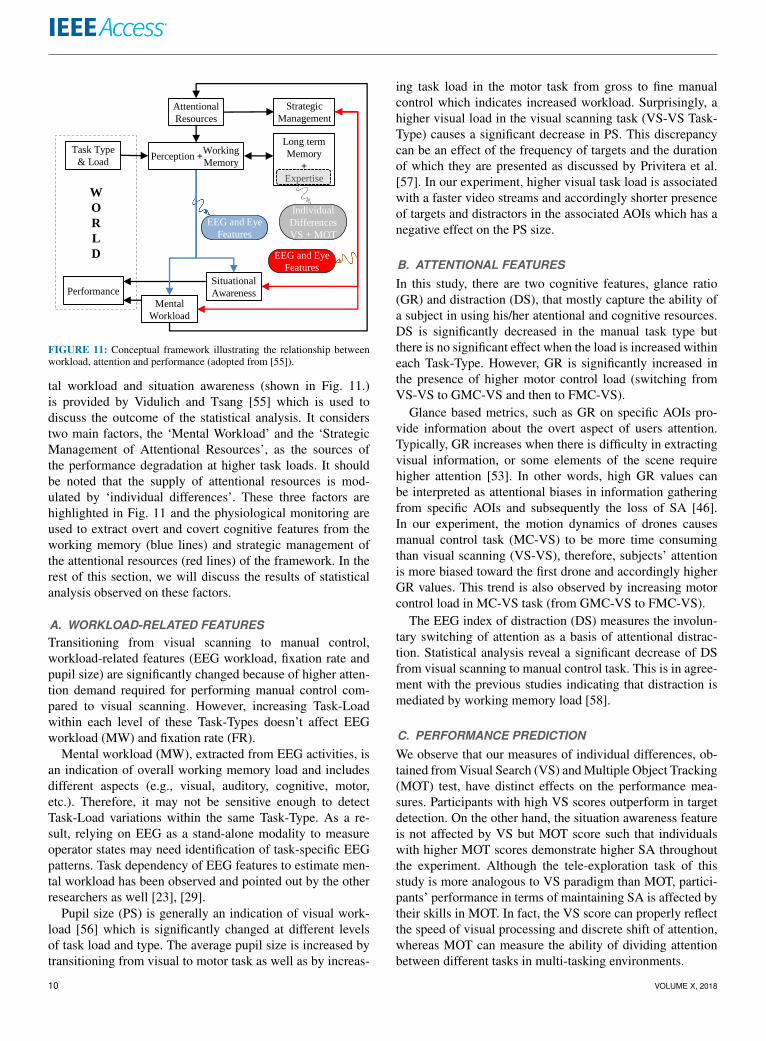
FIGURE 11: Conceptual framework illustrating the relationship betweenworkload, attention and performance (adopted from [55]).
tal workload and situation awareness (shown in Fig. 11.)is provided by Vidulich and Tsang [55] which is used todiscuss the outcome of the statistical analysis. It considerstwo main factors, the ‘Mental Workload’ and the ‘StrategicManagement of Attentional Resources’, as the sources ofthe performance degradation at higher task loads. It shouldbe noted that the supply of attentional resources is mod-ulated by ‘individual differences’. These three factors arehighlighted in Fig. 11 and the physiological monitoring areused to extract overt and covert cognitive features from theworking memory (blue lines) and strategic management ofthe attentional resources (red lines) of the framework. In therest of this section, we will discuss the results of statisticalanalysis observed on these factors.
A. WORKLOAD-RELATED FEATURESTransitioning from visual scanning to manual control,workload-related features (EEG workload, fixation rate andpupil size) are significantly changed because of higher atten-tion demand required for performing manual control com-pared to visual scanning. However, increasing Task-Loadwithin each level of these Task-Types doesn’t affect EEGworkload (MW) and fixation rate (FR).
Mental workload (MW), extracted from EEG activities, isan indication of overall working memory load and includesdifferent aspects (e.g., visual, auditory, cognitive, motor,etc.). Therefore, it may not be sensitive enough to detectTask-Load variations within the same Task-Type. As a re-sult, relying on EEG as a stand-alone modality to measureoperator states may need identification of task-specific EEGpatterns. Task dependency of EEG features to estimate men-tal workload has been observed and pointed out by the otherresearchers as well [23], [29].
Pupil size (PS) is generally an indication of visual work-load [56] which is significantly changed at different levelsof task load and type. The average pupil size is increased bytransitioning from visual to motor task as well as by increas-
ing task load in the motor task from gross to fine manualcontrol which indicates increased workload. Surprisingly, ahigher visual load in the visual scanning task (VS-VS Task-Type) causes a significant decrease in PS. This discrepancycan be an effect of the frequency of targets and the durationof which they are presented as discussed by Privitera et al.[57]. In our experiment, higher visual task load is associatedwith a faster video streams and accordingly shorter presenceof targets and distractors in the associated AOIs which has anegative effect on the PS size.
B. ATTENTIONAL FEATURES
In this study, there are two cognitive features, glance ratio(GR) and distraction (DS), that mostly capture the ability ofa subject in using his/her atentional and cognitive resources.DS is significantly decreased in the manual task type butthere is no significant effect when the load is increased withineach Task-Type. However, GR is significantly increased inthe presence of higher motor control load (switching fromVS-VS to GMC-VS and then to FMC-VS).
Glance based metrics, such as GR on specific AOIs pro-vide information about the overt aspect of users attention.Typically, GR increases when there is difficulty in extractingvisual information, or some elements of the scene requirehigher attention [53]. In other words, high GR values canbe interpreted as attentional biases in information gatheringfrom specific AOIs and subsequently the loss of SA [46].In our experiment, the motion dynamics of drones causesmanual control task (MC-VS) to be more time consumingthan visual scanning (VS-VS), therefore, subjects’ attentionis more biased toward the first drone and accordingly higherGR values. This trend is also observed by increasing motorcontrol load in MC-VS task (from GMC-VS to FMC-VS).
The EEG index of distraction (DS) measures the involun-tary switching of attention as a basis of attentional distrac-tion. Statistical analysis reveal a significant decrease of DSfrom visual scanning to manual control task. This is in agree-ment with the previous studies indicating that distraction ismediated by working memory load [58].
C. PERFORMANCE PREDICTION
We observe that our measures of individual differences, ob-tained from Visual Search (VS) and Multiple Object Tracking(MOT) test, have distinct effects on the performance mea-sures. Participants with high VS scores outperform in targetdetection. On the other hand, the situation awareness featureis not affected by VS but MOT score such that individualswith higher MOT scores demonstrate higher SA throughoutthe experiment. Although the tele-exploration task of thisstudy is more analogous to VS paradigm than MOT, partici-pants’ performance in terms of maintaining SA is affected bytheir skills in MOT. In fact, the VS score can properly reflectthe speed of visual processing and discrete shift of attention,whereas MOT can measure the ability of dividing attentionbetween different tasks in multi-tasking environments.
10 VOLUME X, 2018

Individual differences in VS and MOT are also found tobe significant factors in the performance prediction. Task-Type × VS is revealed as a predictor of target detection andMOT as a predictor of situation awareness indicating howindividual differences can be effectively used to individualizeregression models to predict performance based on physio-logical data.
The overall results of performance prediction based onregression analysis indicate that metrics measuring covertaspects of attention, such as EEG indices of mental workload(MW) and distraction (DS), mainly contribute to the predic-tion of secondary performance metrics that are reaction timeand false detection.
VII. CONCLUSIONIn this paper, we present a multi-modal physiological mon-itoring approach to estimate the performance and situationawareness of human operator in tele-exploration with a smallteam of robotic drones. Unlike previous works which aremostly limited to the workload analysis, our proposed ap-proach consider individual differences as well as attention-based features in addition to workload features.
EEG features are task and subject specific and thereforEEG workload classifiers need to be trained on data of eachspecific tasks which may not be practical in multi-taskingdomains. Using a standard working memory test, we demon-strate that even without including the task specific informa-tion in the EEG analysis, EEG features measuring the covertaspect of attentions are suitable for estimating the secondaryperformance metrics (reaction time and false detection). Wealso demonstrate that the primary performance metrics arewell predicted by eye tracking features measuring the overtaspect of attention. Our final contribution is to identify thatthe individual differences in multiple object tracking andvisual search have significant effect in prediction of situationawareness and target detection, respectively. In fact, by re-moving the individual differences from the regression analy-sis, we observe that the adjusted coefficient of determination,R2, decreases from 0.75 to 0.67 in the case of target detectionand from 0.85 to 0.78 in the case of situation awareness. Thisresult can also be extended to other domains such as drivingthat include both visual scanning and motor control tasks.
The future works should further investigate the individ-ualization of the performance prediction model based onthe identified individual factors. Moreover, the prediction ofsecondary performance metrics can benefit from includingEEG features that provides the modulations of attentions andvisual workload. Nonlinear and probabilistic models can alsobe investigated as an alternative for multiple linear regressionanalysis.
It is also crucial to note that we only conducted our ex-periment with the minimum possible team of robotic agentsto reduce the complexity of the interaction. Future workshould also take into consideration the effect of the numberof robots. Moreover, this study was only focused on the sta-tistical analysis of the main effects and correlations between
hidden performance factors and observable physiologicalfeatures. Future work should use the presented road-map, todevelop a probabilistic approach to estimate the operator’sperformance in real-time using the suggested physiologicalfeatures.
REFERENCES[1] D. Perez, I. Maza, F. Caballero, D. Scarlatti, E. Casado, and A. Ollero, “A
Ground Control Station for a Multi-UAV Surveillance System,” Journal ofIntelligent & Robotic Systems, vol. 69, no. 1-4, pp. 119–130, jan 2013.
[2] M. Bernard, K. Kondak, I. Maza, and A. Ollero, “Autonomous transporta-tion and deployment with aerial robots for search and rescue missions,”Journal of Field Robotics, vol. 28, no. 6, pp. 914–931, nov 2011.
[3] K. P. Valavanis and G. J. Vachtsevanos, Handbook of Unmanned AerialVehicles. Springer Publishing Company, Incorporated, 2014.
[4] J. W. Crandall and M. L. Cummings, “Developing performance metrics forthe supervisory control of multiple robots,” Proceeding of the ACM/IEEEinternational conference on Human-robot interaction - HRI ’07, p. 33,2007.
[5] M. L. Cummings and P. J. Mitchell, “Predicting controller capacity insupervisory control of multiple uavs,” IEEE Transactions on Systems,Man, and Cybernetics-Part A: Systems and Humans, vol. 38, no. 2, pp.451–460, 2008.
[6] R. Parasuraman, S. Galster, P. Squire, H. Furukawa, and C. Miller, “Aflexible delegation-type interface enhances system performance in humansupervision of multiple robots: Empirical studies with roboflag,” IEEETransactions on systems, man, and cybernetics-part A: Systems and Hu-mans, vol. 35, no. 4, pp. 481–493, 2005.
[7] J. Y. C. Chen and M. J. Barnes, “Supervisory Control of Multiple Robots:Effects of Imperfect Automation and Individual Differences,” HumanFactors, vol. 54, no. 2, pp. 157–174, apr 2012.
[8] M. R. Endsley, “Toward a Theory of Situation Awareness in DynamicSystems,” Human Factors, vol. 37, no. 1, pp. 32–64, mar 1995.
[9] V. J. Gawron, Human Performance, Workload, and Situational AwarenessMeasures Handbook, 2nd Edition. CRC Press, 2008.
[10] C. Berka, D. J. Levendowski, M. N. Lumicao, A. Yau, G. Davis, V. T.Zivkovic, R. E. Olmstead, P. D. Tremoulet, and P. L. Craven, “EEGcorrelates of task engagement and mental workload in vigilance, learning,and memory tasks.” Aviation, space, and environmental medicine, vol. 78,no. 5 Suppl, pp. B231–44, may 2007.
[11] E. Esfahani and V. Sundararajan, “Using brain-computer interfaces to de-tect human satisfaction in human-robot interaction,” International Journalof Humanoid Robotics, vol. 8, no. 1, pp. 87–101, 2011.
[12] G. Borghini, L. Astolfi, G. Vecchiato, D. Mattia, and F. Babiloni, “Mea-suring neurophysiological signals in aircraft pilots and car drivers for theassessment of mental workload, fatigue and drowsiness,” Neuroscience &Biobehavioral Reviews, vol. 44, pp. 58–75, 2014.
[13] T. Fritz, A. Begel, S. C. Müller, S. Yigit-Elliott, and M. Züger, “Usingpsycho-physiological measures to assess task difficulty in software devel-opment,” in Proceedings of the 36th International Conference on SoftwareEngineering. ACM, 2014, pp. 402–413.
[14] E. Bekele and N. Sarkar, “Psychophysiological feedback for adaptivehuman-robot interaction (hri),” in Advances in Physiological Computing.Springer, 2014, pp. 141–167.
[15] J. L. Wright, S. A. Quinn, J. Y. Chen, and M. J. Barnes, “Individualdifferences in human-agent teaming an analysis of workload and situationawareness through eye movements,” in Proceedings of the Human Factorsand Ergonomics Society Annual Meeting, vol. 58, no. 1. SAGE Publica-tions, 2014, pp. 1410–1414.
[16] D. Novak, B. Beyeler, X. Omlin, and R. Riener, “Workload estimationin physical human-robot interaction using physiological measurements,”Interacting with Computers, vol. 27, no. 6, pp. 616–629, 2015.
[17] K. A. Brookhuis and D. de Waard, “Monitoring drivers’ mental workloadin driving simulators using physiological measures,” Accident Analysis &Prevention, vol. 42, no. 3, pp. 898–903, 2010.
[18] C. Collet, P. Averty, and A. Dittmar, “Autonomic nervous system andsubjective ratings of strain in air-traffic control,” Applied ergonomics,vol. 40, no. 1, pp. 23–32, 2009.
[19] A. Koenig, X. Omlin, L. Zimmerli, M. Sapa, C. Krewer, M. Bolliger,F. Muller, and R. Riener, “Psychological state estimation from physi-ological recordings during robot-assisted gait rehabilitation,” Journal ofrehabilitation research and development, vol. 48, no. 4, p. 367, 2011.
VOLUME X, 2018 11
[20] K. A. Guru, E. T. Esfahani, S. J. Raza, R. Bhat, K. Wang, Y. Hammond,G. Wilding, J. O. Peabody, and A. J. Chowriappa, “Cognitive skillsassessment during robot-assisted surgery: separating the wheat from thechaff,” BJU International, vol. 115, no. 1, pp. 166–174, jan 2015.
[21] C.-H. Ting, M. Mahfouf, A. Nassef, D. A. Linkens, G. Panoutsos,P. Nickel, A. C. Roberts, and G. R. J. Hockey, “Real-Time AdaptiveAutomation System Based on Identification of Operator Functional Statein Simulated Process Control Operations,” IEEE Transactions on Systems,Man, and Cybernetics - Part A: Systems and Humans, vol. 40, no. 2, pp.251–262, mar 2010.
[22] G. F. Wilson and C. A. Russell, “Performance enhancement in an unin-habited air vehicle task using psychophysiologically determined adaptiveaiding.” Human factors, vol. 49, no. 6, pp. 1005–18, dec 2007.
[23] Y. Ke, H. Qi, F. He, S. Liu, X. Zhao, P. Zhou, L. Zhang, and D. Ming,“An eeg-based mental workload estimator trained on working memory taskcan work well under simulated multi-attribute task,” Frontiers in humanneuroscience, vol. 8, p. 703, 2014.
[24] R. McKendrick, T. Shaw, E. de Visser, H. Saqer, B. Kidwell, andR. Parasuraman, “Team Performance in Networked Supervisory Controlof Unmanned Air Vehicles: Effects of Automation, Working Memory, andCommunication Content,” Human Factors, vol. 56, no. 3, pp. 463–475,may 2014.
[25] J. Y. C. Chen and M. J. Barnes, “Human-Agent Teaming for MultirobotControl: A Review of Human Factors Issues,” IEEE Transactions onHuman-Machine Systems, vol. 44, no. 1, pp. 13–29, feb 2014.
[26] C. Green and D. Bavelier, “Action-Video-Game Experience Alters theSpatial Resolution of Vision,” Psychological Science, vol. 18, no. 1, pp.88–94, jan 2007.
[27] M. W. Dye, C. S. Green, and D. Bavelier, “Increasing Speed of ProcessingWith Action Video Games,” Current Directions in Psychological Science,vol. 18, no. 6, pp. 321–326, dec 2009.
[28] M. Dye, C. Green, and D. Bavelier, “The development of attention skills inaction video game players,” Neuropsychologia, vol. 47, no. 8-9, pp. 1780–1789, jul 2009.
[29] D. Popovic, M. Stikic, T. Rosenthal, D. Klyde, and T. Schnell, “Sensitive,diagnostic and multifaceted mental workload classifier (physioprint),” inInternational Conference on Augmented Cognition. Springer, 2015, pp.101–111.
[30] W. J. Horrey, M. F. Lesch, and A. Garabet, “Dissociation between drivingperformance and drivers’ subjective estimates of performance and work-load in dual-task conditions,” Journal of safety research, vol. 40, no. 1, pp.7–12, 2009.
[31] M. Boyer, M. Cummings, L. B. Spence, and E. T. Solovey, “Investigatingmental workload changes in a long duration supervisory control task,”Interacting with Computers, vol. 27, no. 5, pp. 512–520, 2015.
[32] R. Parasuraman, T. B. Sheridan, and C. D. Wickens, “Situation awareness,mental workload, and trust in automation: Viable, empirically supportedcognitive engineering constructs,” Journal of Cognitive Engineering andDecision Making, vol. 2, no. 2, pp. 140–160, 2008.
[33] R. Ma and D. B. Kaber, “Situation awareness and workload in drivingwhile using adaptive cruise control and a cell phone,” International Journalof Industrial Ergonomics, vol. 35, no. 10, pp. 939 – 953, 2005.
[34] D. A. Sanders, H. M. Sanders, A. Gegov, and D. Ndzi, “Rule-based systemto assist a tele-operator with driving a mobile robot,” in Proceedings of SAIIntelligent Systems Conference. Springer, 2016, pp. 599–615.
[35] E. Rohmer, S. P. N. Singh, and M. Freese, “V-REP: A versatile and scalablerobot simulation framework,” in 2013 IEEE/RSJ International Conferenceon Intelligent Robots and Systems. IEEE, nov 2013, pp. 1321–1326.
[36] A. Memar and E. T. Esfahani, “Human Performance in a Mixed Human-Robot Team: Design of a Collaborative Framework,” in ASME 2016International Design Engineering Technical Conferences and Computersand Information in Engineering Conference. Charlote, NC: ASME, 2016,pp. V01BT02A056–13.
[37] A. D. Castel, J. Pratt, and E. Drummond, “The effects of action video gameexperience on the time course of inhibition of return and the efficiency ofvisual search,” Acta Psychologica, vol. 119, no. 2, pp. 217–230, jun 2005.
[38] K. A. Ehinger, “PsychToolbox examples: Visual cognitionexperiments [Computer software],” 2015. [Online]. Available:http://kehinger.com/PTBexamples.html
[39] D. H. Brainard, “The Psychophysics Toolbox,” Spatial Vision, vol. 10,no. 4, pp. 433–436, jan 1997.
[40] Z. Pylyshyn, “Multiple object tracking,” Scholarpedia, vol. 2, no. 10, p.3326, 2007.
[41] Z. W. Pylyshyn and R. W. Storm, “Tracking multiple independent targets:Evidence for a parallel tracking mechanism,” Spatial vision, vol. 3, no. 3,pp. 179–197, 1988.
[42] R. R. Johnson, D. P. Popovic, R. E. Olmstead, M. Stikic, D. J. Lev-endowski, and C. Berka, “Drowsiness/alertness algorithm developmentand validation using synchronized EEG and cognitive performance toindividualize a generalized model,” Biological Psychology, vol. 87, no. 2,pp. 241–250, may 2011.
[43] V. C. Laboratory, “Fixations identification algo-rithm [Computer software],” 2015. [Online]. Available:http://www.unifr.ch/inph/vclab/home/internal/eye-tracking-software
[44] D. D. Salvucci and J. H. Goldberg, “Identifying fixations and saccades ineye-tracking protocols,” in Proceedings of the 2000 symposium on Eyetracking research & applications. ACM, 2000, pp. 71–78.
[45] J. Holmqvist, K., Nyström, M., Andersson, R., Dewhurst, R., Jarodzka,H., van de Weijer, Eye Tracking: A Comprehensive Guide to Methods andMeasures. Oxford, UK.: Oxford University Press, 2011.
[46] R. J. K. Jacob and K. S. Karn, “Eye tracking in human-computer interac-tion and usability research: Ready to deliver the promises,” in The Mind’sEye: Cognitive and Applied Aspects of Eye Movement Research, eds. J.Hyona, R. Radach, and H. Deubel, Ed. Oxford: Elsevier Science, 2003,pp. 573–605.
[47] C. Berka, D. J. Levendowski, M. M. Cvetinovic, M. M. Petrovic, G. Davis,M. N. Lumicao, V. T. Zivkovic, M. V. Popovic, and R. Olmstead, “Real-time analysis of eeg indexes of alertness, cognition, and memory acquiredwith a wireless eeg headset,” International Journal of Human-ComputerInteraction, vol. 17, no. 2, pp. 151–170, 2004.
[48] A. Steinfeld, T. Fong, D. Kaber, M. Lewis, J. Scholtz, A. Schultz, andM. Goodrich, “Common metrics for human-robot interaction,” in Pro-ceeding of the 1st ACM SIGCHI/SIGART conference on Human-robotinteraction - HRI ’06. New York, New York, USA: ACM Press, 2006,p. 33.
[49] D. Crundall, G. Underwood, and P. Chapman, “Driving experience and thefunctional field of view,” Perception, vol. 28, no. 9, pp. 1075–1087, 1999.
[50] C. J. Patten, A. Kircher, J. Östlund, and L. Nilsson, “Using mobile tele-phones: cognitive workload and attention resource allocation,” Accidentanalysis & prevention, vol. 36, no. 3, pp. 341–350, 2004.
[51] M. R. Endsley, S. J. Selcon, T. D. Hardiman, and D. G. Croft, “AComparative Analysis of Sagat and Sart for Evaluations of SituationAwareness,” Proceedings of the Human Factors and Ergonomics SocietyAnnual Meeting, vol. 42, no. 1, pp. 82–86, oct 1998.
[52] C. Durso, F.T., Truitt, T.R., Hackworth, C.A., Crutchfield, J.M., Nikolic,D., Moertl, P.M., Ohrt, D. & Manning, “Expertise and chess: A pilot studycomparing situation awareness methodologies,” in In D. J. Garland &M. Endsley (Eds.) Experimental Analysis and Measurement of SituationAwareness, Daytona Beach, FL, 1995.
[53] G. Hauland, “Measuring Individual and Team Situation Awareness DuringPlanning Tasks in Training of En Route Air Traffic Control,” The Interna-tional Journal of Aviation Psychology, vol. 18, no. 3, pp. 290–304, may2008.
[54] K. Moore and L. Gugerty, “Development of a Novel Measure of SituationAwareness: The Case for Eye Movement Analysis,” Proceedings of theHuman Factors and Ergonomics Society Annual Meeting, vol. 54, no. 19,pp. 1650–1654, sep 2010.
[55] M. A. Vidulich and P. S. Tsang, “Mental workload and situation aware-ness,” in Handbook of Human Factors and Ergonomics. John Wiley &Sons, Inc., 2012, pp. 243–273.
[56] G. Marquart, C. Cabrall, and J. de Winter, “Review of eye-related measuresof drivers’ mental workload,” Procedia Manufacturing, vol. 3, pp. 2854–2861, 2015.
[57] C. M. Privitera, L. W. Renninger, T. Carney, S. Klein, and M. Aguilar,“Pupil dilation during visual target detection,” Journal of Vision, vol. 10,no. 10, pp. 3–3, 2010.
[58] F. B. Parmentier, “The cognitive determinants of behavioral distraction bydeviant auditory stimuli: A review,” Psychological Research, vol. 78, no. 3,pp. 321–338, 2014.
12 VOLUME X, 2018

AMIRHOSSEIN H. MEMAR (M’15) receivedthe B.Sc. and M.Sc. degrees in mechanical en-gineering from Isfahan University of Technologyand University of Kashan, Iran, respectively. In2014, he was a researcher at PRISMA Lab, Uni-versity of Naples Federico II, Italy. He is cur-rently a Ph.D. candidate in the mechanical andaerospace engineering department of Univeristyat Buffalo - SUNY. His research interests includeRobotics, Human-Robot Interaction, Haptics and
Brain-Computer Interfaces.
EHSAN T. ESFAHANI (M’06) received the M.S.degree in electrical engineering and the Ph.D. de-gree in mechanical engineering from the Univer-sity of California Riverside, Riverside, CA, USA,in 2012. He is currently an Assistant Professor inthe Department of Mechanical and Aerospace En-gineering, University at Buffalo, SUNY, Buffalo,NY, USA. His main research interests include hu-man in the loop systems, human robot interactions,human activity monitoring and biorobotics.
VOLUME X, 2018 13