physiological observations and synthesis of … observations and synthesis of subharmonic voices...
TRANSCRIPT

Physiological Observations and Synthesis ofSubharmonic Voices
Ken-Ichi Sakakibara∗, Hiroshi Imagawa† , Hisayuki Yokonishi† , Miwako Kimura‡, and Niro Tayama§∗ Department of Communication Disorders, Health Sciences University of Hokkaido, Sapporo, Japan
E-mail: [email protected]† Department of Otolaryngology, The University of Tokyo, Tokyo, Japan
‡ Tokyo Voice Center, Sanno Hospital, International University of Health and Welfare, Tokyo, Japan§ Department of Otolaryngology, Head and Neck Surgery, National Center for Global Health and Medicine, Tokyo, Japan
Abstract—A subharmonic voice is a voice generated by sub-harmonic vibrations which include integer-multiple periodicity,such as periodic-double and periodic-triple. In this paper, varioustypes of subharmonic voices were observed using high-speeddigital imaging. A new laryngeal source model for synthesis ofsubharmonic voices were proposed based on the results of phys-iological observations. The proposed model consists of severalmodules, such as dumping function, and amplitude modulator.Parameters of the model were estimated by referring to the glottalarea function, kymograph, and laryngotopography obtained byanalysis of high-speed images. Synthesized sounds were scaledin similarity to diplophonia and the R (roughness) parameterof the GRBAS scale in listening tests. As a result, the proposedmodel was effective for synthesis of subharmonic voices, such asdiplohphonia and rough voices.
I. INTRODUCTION
A subharmonic voice is defined as a voice which includessubharmonic frequential components or is generated by asubharmonic vibration. A subharmonic vibration is a vibrationwhich includes vibratory modes with lower frequency thanfundamental frequency in a ratio of 1/n where n ∈ N. Asubharmonic vibration in F0/n is referred to as a period-nvibration.
Subharmonic voices are frequently observed in pathologicalvoices, such as diplophonia [11]. Even in non-pathologicalvoices, subharmonic voices are found under the boundaryconditions for a vocal fold oscillation, such as of low-poweror high-power oscillation. For example, subharmonic vibratorypatterns are observed in vocal fray, as well as periodic andaperiodic vibratory patterns [14]. Furthermore subharmonicvoices are also found in some singing styles of folk music,such as Tyvan khoomei [5], [18], South African umngqokolo[15], Sardinian chants [1], and so on. In khoomei and Sar-dinian chants, subharmonic voices are generated by vocal-ventricular phonations, in which the vocal and ventricularfolds simultaneously vibrate and the ventricular folds vibratein F0/n. In growl, such as umngqolo, subharmonic voicesare generated by vocal-aryepiglottic phonations, in which thevocal and aryepiglottic folds simultaneously vibrate and thearyepiglottic folds vibrate in F0/n.
In this paper, we observe vocal fold vibratory patterns ofsubharmonic voices of pathological voices using high-speeddigital imaging (HSDI) and analyze physical mechanisms of
generation of subharmonic voices. We also propose a newlaryngeal source model for pathological and non-pathologicalsubharmonic voices based on a many-parameter model forlaryngeal source in [16]. A method of parameter estimation isprocessed based on physiological observations. We also eval-uate effectiveness of the model for synthesis of subharmonicvoices by listening tests.
II. PHYSIOLOGICAL OBSERVEATIONS OF SUBHARMONICVOICES IN PATHOLOGICAL CASES
For synthesis of subharmonic voices, we observe and ana-lyze vocal fold vibratory patterns of pathological voices whichinclude subharmonic vibrations using HSDI. We extract usefulinformation for the parameter estimation of a laryngeal sourcemodel from a glottal area function , glottal width, and vibratorymodes, and synthesize subharmonic voices in the frameworkof source-filter formant synthesis [4].
The high-speed digital camera Photoron, FASTCAM-1024PCI at a frame rate 4500 fps, image resolution of400×512 pixels, 8bit grayscale, and memory size of 12 GBallowing sampling duration of 11.1 s, was employed. A rigidendoscope (# 4450.501, Richard Wolf) was attached to anattatchment lens (f = 35 mm, Nagashima Med. InstrumentCorp.) connected to the camera. HSDI (high-speed digital im-ages) were simultaneouosly recorded with EGG (electroglot-tography) and sound signals.
A. Vocal fold paralysis
Fig. 1 shows the multi-line kymograph, sound waveform,and EGG waveform of a patient with left vocal fold paralysis(recurrent nerve paralysis), female, age of 22, perceived asdiplophonia.
The multi-line kymograph in Fig. 1 has five kymographswhich are displayed in correspondence with red lines from topto bottom in the laryngeal view at the left. In the laryngealview of the left, the anterior part of the larynx is seen at thebottom and the posterior is seen at the top. Therefore, the rightvocal fold is seen at the left, and the left vocal fold is seen atthe right of Fig. 1.
This research was partly supported by Japan and Grant-in-Aid (KAK-ENHI:20500161) from the MEXT, Japan.
APSIPA ASC 2011 Xi’an

Fig. 1. Multi-line kymograph of HSDI of a patient with left vocal foldparalysis (recurrent nerve paralysis). Left: laryngeal view, Top of right: soundwaveform, Middle of right: EGG waveform, Bottom of right: multi-linekymographs (five kymographs correspond with red lines in the laryngeal viewof the left).
In kymograph, lines extracted from HSDI are rotated by−90 degree and laterally displayed along with time axis,.Therefore, the left vocal fold is seen on the top side and theright vocal fold is seen on the bottom side.
Fig. 2 shows an enlarged kymograph in Fig. 1. A ratio ofthe vibratory frequencies of the left vocal fold to the rightvocal fold observed in Fig. 1 is 3:4. This means that the vocalfold vibration includes subharmonic vibrations. In fact, the leftvocal fold vibrates in F0/4 and the right vocal fold vibratesin F0/3.
The amplitudes of the vibrations of the left and right vocalfolds are dumped in each period. A white dashed line in Fig. 2depicts the amplitude envelope of the left vocal fold vibration.The amplitude of the left vocal fold decreases in a period. Theglottal closure of this case is incomplete.
The vibratory frequencies of the left and right vocal foldsobtained by analyzing HSDI are 450 Hz and 360 Hz respec-tively.
LR
Fig. 2. Kymograph of a pathient with left vocal fold paralysis
B. Vocal fold cyst
Fig. 3 shows the multi-line kymograph, sound waveform,and EGG waveform of a patient with a cyst of the right vocalfold, female, age of 70, perceived as diplophonia and rough.The cyst is formed in the middle of the right vocal fold andprevents mucosal wave propagation.
In comparison with the case of the vocal fold paralysisin Fig. 1, differences of vibratory frequencies between the
Sound
EGG
LR
Fig. 3. Multi-line kymograph of HSDI of a patient with the right vocal foldcyst. Left: laryngeal view, Top of right: sound waveform, Middle of right:EGG waveform, Bottom of right: multi-line kymographs (five kymographscorrespond with red lines in the laryngeal view of the left).
left and right vocal folds are unclearly observed from thekymography.
Fig. 4 shows the laryngotopograph of the same patient withthe right vocal fold cyst.
Laryngotopography is a method for analyzing HSDI basedon pixel-wise Fourier analysis of a time-varying brightnesscurve for each pixel across images [6], [17]. The procedure ofanalysis is as follows: (i) a rectangular area is selected; (ii) atime-varying raw brightness curve is extracted from the images(Figure 1); (iii) for each pixel, the average level of brightnessof consecutive frames (512 or 256 frames) are calculated; (iv)the brightness curve is normalized by subtracting the averagelevel from the original raw brightness curve; (v) The Hammingwindow is applied to the normalized brightness curve anddiscrete Fourier transform (DFT) of 1024 points by addingzero-padding to increase a frequency resolution is applied tothe normalized brightness curve. When the high-speed imagingis conducted at 4500 fps, the frame size for analysis is 0.114s (512 frames) or 0.057 s (256 frames) and the frequencyresolution is 3.7 Hz.
The laryngotopgraphic image at (g) of Fig. 4 shows anamplitude spectrum of the brightness curve at the point slightlybehind the anterior commissure. Three different significantpeaks are observed in the spectrum. The first component isat 251 Hz, the second is at 313 Hz, and the third is at 379 Hz.
In Fig. 4, (a) and (b) show distributions of amplitude andphase of the component of 251 Hz, respectively. (c) and (d)show distributions of amplitude and phase of the componentof 313 Hz, respectively. (e) and (f) show distributions ofamplitude and phase of the component of 379 Hz, respectively.
In this case, the vocal fold vibration is mostly the superpo-sition of three different vibratory modes of 251, 313, 379 Hz.More precisely, if the horizontal vibratory mode with degree
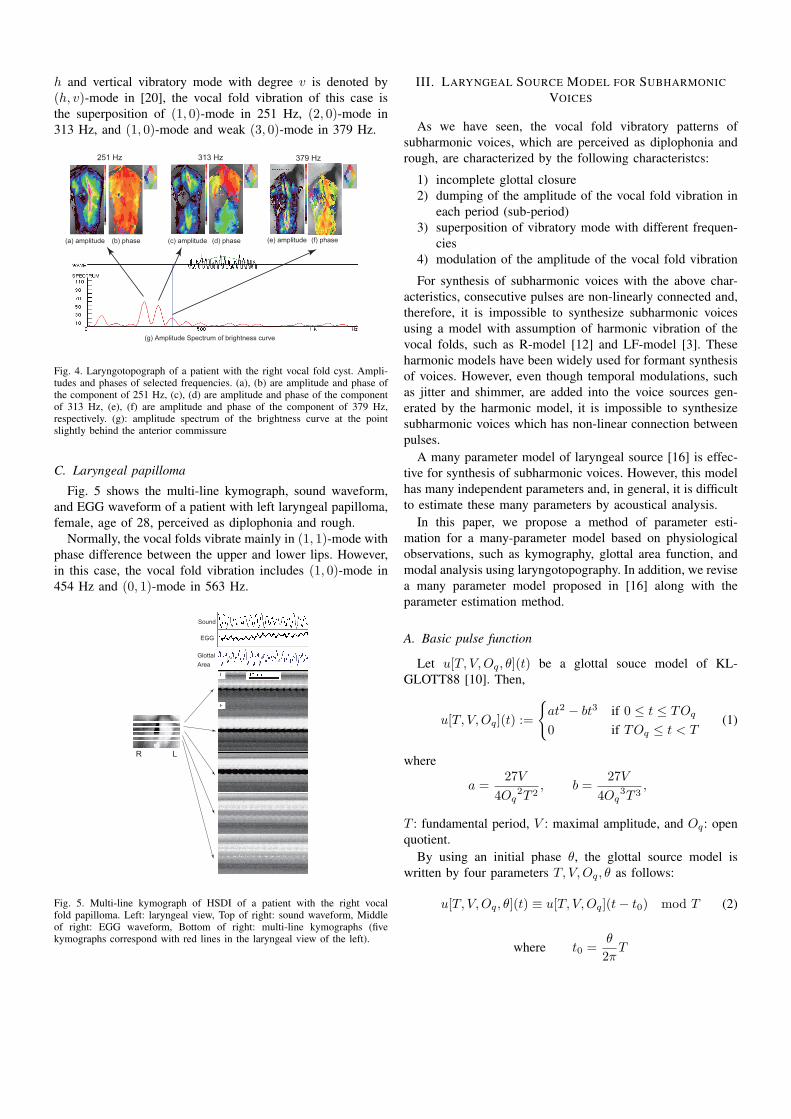
h and vertical vibratory mode with degree v is denoted by(h, v)-mode in [20], the vocal fold vibration of this case isthe superposition of (1, 0)-mode in 251 Hz, (2, 0)-mode in313 Hz, and (1, 0)-mode and weak (3, 0)-mode in 379 Hz.
(a) amplitude (b) phase (c) amplitude (d) phase
251 Hz 313 Hz 379 Hz
(e) amplitude (f) phase
(g) Amplitude Spectrum of brightness curve
Fig. 4. Laryngotopograph of a patient with the right vocal fold cyst. Ampli-tudes and phases of selected frequencies. (a), (b) are amplitude and phase ofthe component of 251 Hz, (c), (d) are amplitude and phase of the componentof 313 Hz, (e), (f) are amplitude and phase of the component of 379 Hz,respectively. (g): amplitude spectrum of the brightness curve at the pointslightly behind the anterior commissure
C. Laryngeal papilloma
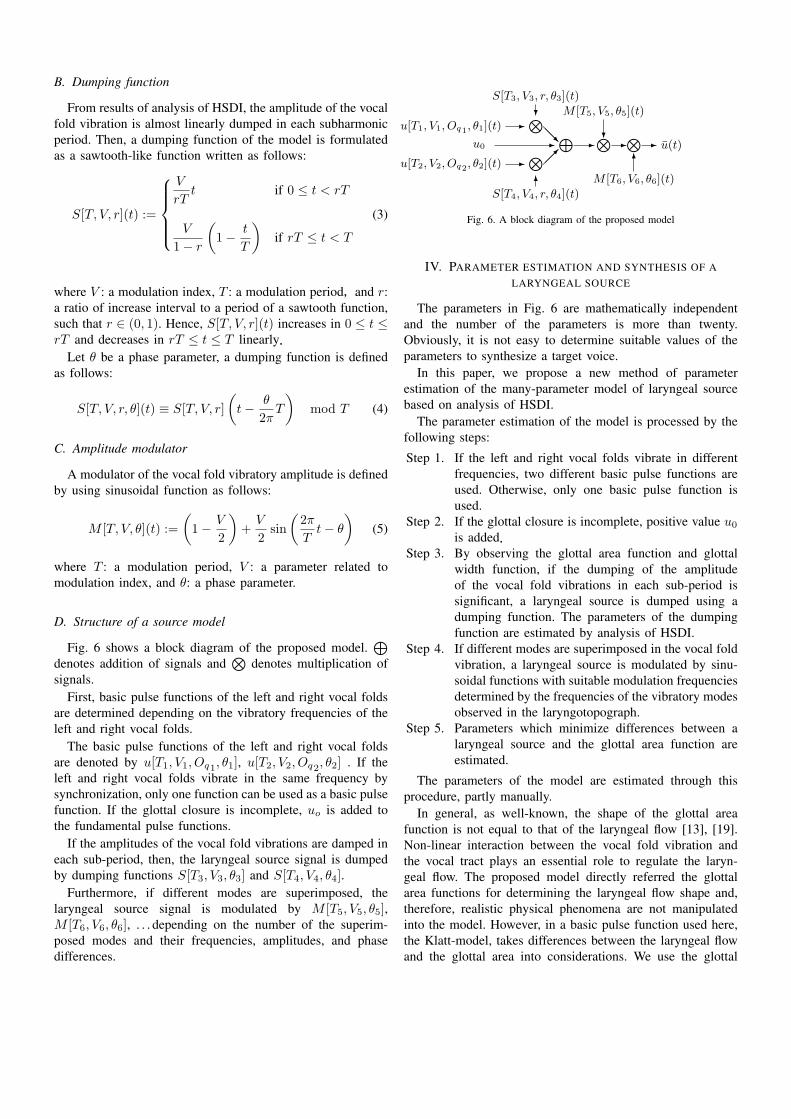
Fig. 5 shows the multi-line kymograph, sound waveform,and EGG waveform of a patient with left laryngeal papilloma,female, age of 28, perceived as diplophonia and rough.
Normally, the vocal folds vibrate mainly in (1, 1)-mode withphase difference between the upper and lower lips. However,in this case, the vocal fold vibration includes (1, 0)-mode in454 Hz and (0, 1)-mode in 563 Hz.
LR
Sound
EGG
Glottal
Area
Fig. 5. Multi-line kymograph of HSDI of a patient with the right vocalfold papilloma. Left: laryngeal view, Top of right: sound waveform, Middleof right: EGG waveform, Bottom of right: multi-line kymographs (fivekymographs correspond with red lines in the laryngeal view of the left).
III. LARYNGEAL SOURCE MODEL FOR SUBHARMONICVOICES
As we have seen, the vocal fold vibratory patterns ofsubharmonic voices, which are perceived as diplophonia andrough, are characterized by the following characteristcs:
1) incomplete glottal closure2) dumping of the amplitude of the vocal fold vibration in
each period (sub-period)3) superposition of vibratory mode with different frequen-
cies4) modulation of the amplitude of the vocal fold vibration
For synthesis of subharmonic voices with the above char-acteristics, consecutive pulses are non-linearly connected and,therefore, it is impossible to synthesize subharmonic voicesusing a model with assumption of harmonic vibration of thevocal folds, such as R-model [12] and LF-model [3]. Theseharmonic models have been widely used for formant synthesisof voices. However, even though temporal modulations, suchas jitter and shimmer, are added into the voice sources gen-erated by the harmonic model, it is impossible to synthesizesubharmonic voices which has non-linear connection betweenpulses.
A many parameter model of laryngeal source [16] is effec-tive for synthesis of subharmonic voices. However, this modelhas many independent parameters and, in general, it is difficultto estimate these many parameters by acoustical analysis.
In this paper, we propose a method of parameter esti-mation for a many-parameter model based on physiologicalobservations, such as kymography, glottal area function, andmodal analysis using laryngotopography. In addition, we revisea many parameter model proposed in [16] along with theparameter estimation method.
A. Basic pulse function
Let u[T, V, Oq, θ](t) be a glottal souce model of KL-GLOTT88 [10]. Then,
u[T, V, Oq](t) :=
{at2 − bt3 if 0 ≤ t ≤ TOq
0 if TOq ≤ t < T(1)
where
a =27V
4Oq2T 2
, b =27V
4Oq3T 3
,
T : fundamental period, V : maximal amplitude, and Oq: openquotient.
By using an initial phase θ, the glottal source model iswritten by four parameters T, V, Oq, θ as follows:
u[T, V, Oq, θ](t) ≡ u[T, V,Oq](t − t0) mod T (2)
where t0 =θ
2πT
B. Dumping function
From results of analysis of HSDI, the amplitude of the vocalfold vibration is almost linearly dumped in each subharmonicperiod. Then, a dumping function of the model is formulatedas a sawtooth-like function written as follows:
S[T, V, r](t) :=
V
rTt if 0 ≤ t < rT
V
1 − r
(1 − t
T
)if rT ≤ t < T
(3)
where V : a modulation index, T : a modulation period,and r:a ratio of increase interval to a period of a sawtooth function,such that r ∈ (0, 1). Hence, S[T, V, r](t) increases in 0 ≤ t ≤rT and decreases in rT ≤ t ≤ T linearly.
Let θ be a phase parameter, a dumping function is definedas follows:
S[T, V, r, θ](t) ≡ S[T, V, r](
t − θ
2πT
)mod T (4)
C. Amplitude modulator
A modulator of the vocal fold vibratory amplitude is definedby using sinusoidal function as follows:
M [T, V, θ](t) :=(
1 − V
2
)+
V
2sin
(2π
Tt − θ
)(5)
where T : a modulation period, V : a parameter related tomodulation index, and θ: a phase parameter.
D. Structure of a source model
Fig. 6 shows a block diagram of the proposed model.⊕
denotes addition of signals and⊗
denotes multiplication ofsignals.
First, basic pulse functions of the left and right vocal foldsare determined depending on the vibratory frequencies of theleft and right vocal folds.
The basic pulse functions of the left and right vocal foldsare denoted by u[T1, V1, Oq1, θ1], u[T2, V2, Oq2, θ2] . If theleft and right vocal folds vibrate in the same frequency bysynchronization, only one function can be used as a basic pulsefunction. If the glottal closure is incomplete, uo is added tothe fundamental pulse functions.
If the amplitudes of the vocal fold vibrations are damped ineach sub-period, then, the laryngeal source signal is dumpedby dumping functions S[T3, V3, θ3] and S[T4, V4, θ4].
Furthermore, if different modes are superimposed, thelaryngeal source signal is modulated by M [T5, V5, θ5],M [T6, V6, θ6], . . . depending on the number of the superim-posed modes and their frequencies, amplitudes, and phasedifferences.
u[T1, V1, Oq1, θ1](t) - ⊗?S[T3, V3, r, θ3](t)
u[T2, V2, Oq2, θ2](t) - ⊗6
S[T4, V4, r, θ4](t)
⊕u0 -@@R
���-⊗?
M [T5, V5, θ5](t)
-⊗6
M [T6, V6, θ6](t)
- u(t)
Fig. 6. A block diagram of the proposed model
IV. PARAMETER ESTIMATION AND SYNTHESIS OF ALARYNGEAL SOURCE
The parameters in Fig. 6 are mathematically independentand the number of the parameters is more than twenty.Obviously, it is not easy to determine suitable values of theparameters to synthesize a target voice.
In this paper, we propose a new method of parameterestimation of the many-parameter model of laryngeal sourcebased on analysis of HSDI.
The parameter estimation of the model is processed by thefollowing steps:
Step 1. If the left and right vocal folds vibrate in differentfrequencies, two different basic pulse functions areused. Otherwise, only one basic pulse function isused.
Step 2. If the glottal closure is incomplete, positive value u0
is added.Step 3. By observing the glottal area function and glottal
width function, if the dumping of the amplitudeof the vocal fold vibrations in each sub-period issignificant, a laryngeal source is dumped using adumping function. The parameters of the dumpingfunction are estimated by analysis of HSDI.
Step 4. If different modes are superimposed in the vocal foldvibration, a laryngeal source is modulated by sinu-soidal functions with suitable modulation frequenciesdetermined by the frequencies of the vibratory modesobserved in the laryngotopograph.
Step 5. Parameters which minimize differences between alaryngeal source and the glottal area function areestimated.
The parameters of the model are estimated through thisprocedure, partly manually.
In general, as well-known, the shape of the glottal areafunction is not equal to that of the laryngeal flow [13], [19].Non-linear interaction between the vocal fold vibration andthe vocal tract plays an essential role to regulate the laryn-geal flow. The proposed model directly referred the glottalarea functions for determining the laryngeal flow shape and,therefore, realistic physical phenomena are not manipulatedinto the model. However, in a basic pulse function used here,the Klatt-model, takes differences between the laryngeal flowand the glottal area into considerations. We use the glottal

area functions and other characteristics obtained by analysisof HSDI only for controlling modulation and dumping.
A. Examples of synthesized voices1) Vocal fold paralysis: The following parameter setting is
used for synthesis of a voice with the vocal fold paralysis:
[T1, V1, Oq1, θ1] = [1/270, 0.60, 0.8, 2π/45][T2, V2, Oq2, θ2] = [1/360, 0.32, 0.9, 0]
u0 = 0.1[T4, V4, r, θ4] = [1/90, 0.50, 0.08, −5π/6]
In the case of the vocal fold paralysis in Fig. 1, frequencies ofthe left and right vocal fold vibration are different. Therefore,two basic pulse functions in 270 Hz and 360 Hz. Dumpingof the amplitude of the vocal fold vibrations was observed inFig. 1, therefore, a dumping function used.
Fig. 7 shows synthesized laryngeal source and the glottalarea function of the case with the vocal fold paralysis.
0 5 10 15 20 25 30
0
0.1
0.2
0.3
0.4
0.5
0.6
0.7
0.8
t [ms]
Fig. 7. Synthesized laryngeal source (green solid line) and glottal area function(blue dashed line) for the vocal fold paralysis
2) Vocal fold cyst: The following parameter setting is usedfor synthesis of a voice with the vocal fold cyst:
[T1, V1, Oq1, θ1] = [1/251, 1.00, 0.8, 0]u0 = 0.05
[T5, V5, θ5] = [1/313, 0.10, −7π/18][T6, V6, θ6] = [1/379, 0.30, −7/9π]
In the case of the vocal fold cyst in Fig. 3, the mode in251 Hz was dominant in the vocal fold vibration, and, hence,only a basic pulse function in 251 Hz is used. Two modulationfunctions are used to manipulate other vibratory modes in 313Hz and 379 Hz.
Fig. 8 shows the synthesized laryngeal source and the glottalarea function of the case with the vocal fold cyst.
3) Laryngeal papilloma: The following parameter settingis used for synthesis of a voice with the laryngeal papilloma:
[T1, V1, Oq1, θ1] = [1/484, 0.20, 1.0, 0]u0 = 0.8
[T5, V5, θ5] = [1/563, 0.30, −π/9][T6, V6, θ6] = [1/971, 0.15, 5π/9]
As well as the case of the vocal fold cyst, first, one basicpulse function in 484 Hz is used and modulation function in563 Hz is used as (0, 1)-mode of 563 Hz.
0 5 10 15 20 25 30
0
0.1
0.2
0.3
0.4
0.5
0.6
0.7
0.8
t [ms]
Fig. 8. Synthesized laryngeal source (green solid line) and glottal area function(blue dashed line) for the vocal fold cyst
In the case of the laryngeal papilloma, a higher frequentialcomponent was observed at 971 Hz in both the glottal areafunction and the laryngotopograph. Therefore, a modulationfunction with 971 Hz is added.
Fig. 9 shows the synthesized laryngeal source and the glottalarea function of the case with the laryngeal papilloma.
0 5 10 15 20 25 30
0
0.1
0.2
0.3
0.4
0.5
0.6
0.7
0.8
t [ms]
Fig. 9. Synthesized laryngeal source (green solid line) and glottal area function(blue dashed line) for the laryngeal papilloma.
V. PERCEPTUAL EVALUATION
We evaluate the effectiveness of our laryngeal source modelby listening tests.
In the sense of synthesis of subharmonic voices, the pro-posed model is incomparable with the harmonic models, suchas R-model and LF-model, because the harmonic models isnot able to synthesize subharmonic sounds. Therefore, theeffectiveness of the model in synthesis of subharmonic voicesis evaluated by using the R (rough) parameter of the GRBASscale [7] and diplophonic perception.
Diplophonia is a pathological voice in which two or morepitches are simultaneously perceived. There are a variety ofproduction mechanisms of diplophonic voices, as seen in thispaper and [11]. However, perceptual evaluation of diplophonicvoices is simply carried out by asking whether two or morepitches are perceived or not, and therefore, it is a binarydecision. Hence, perceptual evaluation of diplophonic voicesare simpler and easier than the R parameter with 4-point scaleof the GRBAS scale.
A. Method
For synthesis of stimuli for listening tests, two basic pulsefunctions are used. The set of stimuli was synthesized bychanging the following parameters: (i) a ratio of the fre-quencies; (ii) a ratio of the amplitudes; (iii) the fundamentalfrequencies of two basic pulse functions.
Six participants consisting of medical doctors of the oto-laryngology, speech therapists, and speech scientists joined thelistening tests. They were instructed to scale the synthesizevoices using both the R parameter with 4-point scale from 0to 3 of the GRBAS scale and the diplophonic binary scale.
As the values of parameters for synthesis in Fig. 6, we setOq1 = Oq2 = 0.96,θ1 = θ2 = 0 , u0 = 0 to be constant, andchange the values of (T1, V1, T2, V2). The synthesized laryn-geal source is convoluted with transfer function of the vowel[a], and the glottal noises are not added in the framework ofKlatt synthesizer [9].
B. Results
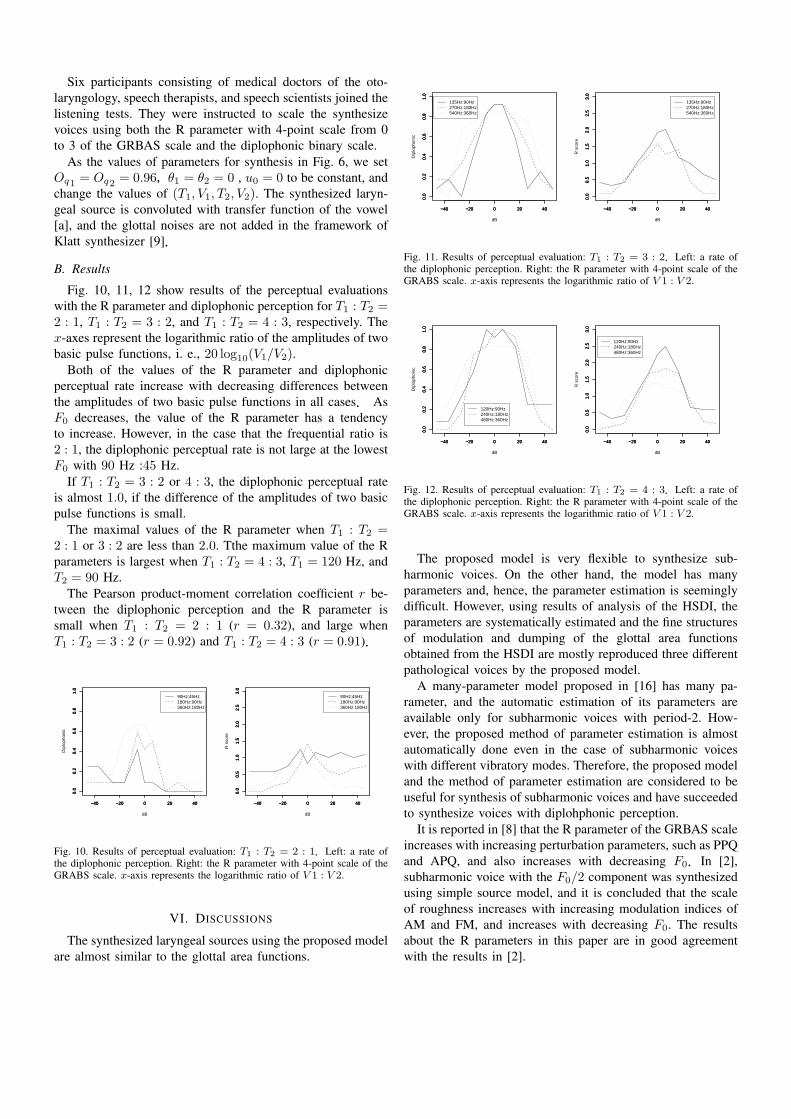
Fig. 10, 11, 12 show results of the perceptual evaluationswith the R parameter and diplophonic perception for T1 : T2 =2 : 1, T1 : T2 = 3 : 2, and T1 : T2 = 4 : 3, respectively. Thex-axes represent the logarithmic ratio of the amplitudes of twobasic pulse functions, i. e., 20 log10(V1/V2).
Both of the values of the R parameter and diplophonicperceptual rate increase with decreasing differences betweenthe amplitudes of two basic pulse functions in all cases. AsF0 decreases, the value of the R parameter has a tendencyto increase. However, in the case that the frequential ratio is2 : 1, the diplophonic perceptual rate is not large at the lowestF0 with 90 Hz :45 Hz.
If T1 : T2 = 3 : 2 or 4 : 3, the diplophonic perceptual rateis almost 1.0, if the difference of the amplitudes of two basicpulse functions is small.
The maximal values of the R parameter when T1 : T2 =2 : 1 or 3 : 2 are less than 2.0. Tthe maximum value of the Rparameters is largest when T1 : T2 = 4 : 3, T1 = 120 Hz, andT2 = 90 Hz.
The Pearson product-moment correlation coefficient r be-tween the diplophonic perception and the R parameter issmall when T1 : T2 = 2 : 1 (r = 0.32), and large whenT1 : T2 = 3 : 2 (r = 0.92) and T1 : T2 = 4 : 3 (r = 0.91).
−40 −20 0 20 40
0.0
0.2
0.4
0.6
0.8
1.0
−40 −20 0 20 40
0.0
0.2
0.4
0.6
0.8
1.0
−40 −20 0 20 40
0.0
0.2
0.4
0.6
0.8
1.0
dB
Dip
loph
onic
90Hz:45Hz180Hz:90Hz360Hz:180Hz
−40 −20 0 20 40
0.0
0.5
1.0
1.5
2.0
2.5
3.0
−40 −20 0 20 40
0.0
0.5
1.0
1.5
2.0
2.5
3.0
−40 −20 0 20 40
0.0
0.5
1.0
1.5
2.0
2.5
3.0
dB
R s
core
90Hz:45Hz180Hz:90Hz360Hz:180Hz
Fig. 10. Results of perceptual evaluation: T1 : T2 = 2 : 1.Left: a rate ofthe diplophonic perception. Right: the R parameter with 4-point scale of theGRABS scale. x-axis represents the logarithmic ratio of V 1 : V 2.
VI. DISCUSSIONS
The synthesized laryngeal sources using the proposed modelare almost similar to the glottal area functions.
−40 −20 0 20 40
0.0
0.2
0.4
0.6
0.8
1.0
−40 −20 0 20 40
0.0
0.2
0.4
0.6
0.8
1.0
−40 −20 0 20 40
0.0
0.2
0.4
0.6
0.8
1.0
dB
Dip
loph
onic
135Hz:90Hz270Hz:180Hz540Hz:360Hz
−40 −20 0 20 40
0.0
0.5
1.0
1.5
2.0
2.5
3.0
−40 −20 0 20 40
0.0
0.5
1.0
1.5
2.0
2.5
3.0
−40 −20 0 20 40
0.0
0.5
1.0
1.5
2.0
2.5
3.0
dB
R s
core
135Hz:90Hz270Hz:180Hz540Hz:360Hz
Fig. 11. Results of perceptual evaluation: T1 : T2 = 3 : 2.Left: a rate ofthe diplophonic perception. Right: the R parameter with 4-point scale of theGRABS scale. x-axis represents the logarithmic ratio of V 1 : V 2.
−40 −20 0 20 40
0.0
0.2
0.4
0.6
0.8
1.0
−40 −20 0 20 40
0.0
0.2
0.4
0.6
0.8
1.0
−40 −20 0 20 40
0.0
0.2
0.4
0.6
0.8
1.0
dB
Dip
loph
onic
120Hz:90Hz240Hz:180Hz480Hz:360Hz
−40 −20 0 20 40
0.0
0.5
1.0
1.5
2.0
2.5
3.0
−40 −20 0 20 40
0.0
0.5
1.0
1.5
2.0
2.5
3.0
−40 −20 0 20 40
0.0
0.5
1.0
1.5
2.0
2.5
3.0
dB
R s
core
120Hz:90Hz240Hz:180Hz480Hz:360Hz
Fig. 12. Results of perceptual evaluation: T1 : T2 = 4 : 3.Left: a rate ofthe diplophonic perception. Right: the R parameter with 4-point scale of theGRABS scale. x-axis represents the logarithmic ratio of V 1 : V 2.
The proposed model is very flexible to synthesize sub-harmonic voices. On the other hand, the model has manyparameters and, hence, the parameter estimation is seeminglydifficult. However, using results of analysis of the HSDI, theparameters are systematically estimated and the fine structuresof modulation and dumping of the glottal area functionsobtained from the HSDI are mostly reproduced three differentpathological voices by the proposed model.
A many-parameter model proposed in [16] has many pa-rameter, and the automatic estimation of its parameters areavailable only for subharmonic voices with period-2. How-ever, the proposed method of parameter estimation is almostautomatically done even in the case of subharmonic voiceswith different vibratory modes. Therefore, the proposed modeland the method of parameter estimation are considered to beuseful for synthesis of subharmonic voices and have succeededto synthesize voices with diplohphonic perception.
It is reported in [8] that the R parameter of the GRBAS scaleincreases with increasing perturbation parameters, such as PPQand APQ, and also increases with decreasing F0.In [2],subharmonic voice with the F0/2 component was synthesizedusing simple source model, and it is concluded that the scaleof roughness increases with increasing modulation indices ofAM and FM, and increases with decreasing F0. The resultsabout the R parameters in this paper are in good agreementwith the results in [2].

VII. CONCLUSION
The vocal fold vibratory patterns of pathological subhar-monic voices were observed using high-speed digital imaging(HSDI) . Production mechanisms of subharmonic voices wereanalyzed. A new laryngeal source model for pathological andnon-pathological subharmonic voices was proposed and theparameter estimation was processed based on physiologicalobservations.
We also evaluated the effectiveness of the model for syn-thesis of subharmonic voices by listening tests. The proposedmodel has succeeded to synthesize subharmonic voices per-ceived as rough or diplophonic.
It is addressed as a future study to propose a full automaticparameter estimation method in the framework of A-b-S in theacoustic domain and method to add turbulent noises based onphysiological and physical mechanisms.
ACKNOWLEDGMENT
We thank Takaharu Nito for his helpful supports.
REFERENCES
[1] L. Bailly, N. Henrich, and X. Pelorson, Vocal fold and ventricular foldvibration in period-doubling phonation: Physiological description andaerodynamic modeling, J. Acoust. Soc. Am. , 127(5):3212–3222, 2010.
[2] C. C. Bergan and I. R. Titze, Perception of pitch and roughness in vocalsignals with subharmonics, J. Voice, 15(2):165–175, 2001.
[3] G. Fant and J. Liljencrants and Q.-g. Lin, A four-parameter model ofglottal flow, KTH STL-QPSR, 4/1985:1–14, 1985.
[4] J. L. Flanagan, Speech analysis synthesis and perception, 2nd Ed.,Springer-Verlag, 1972.
[5] L. Fuks, B. Hammarberg, and J. Sundberg, A self-sustained vocal-ventricular phonation mode: acoustical, aerodynamic and glottographicevidences, KTH TMH-QPSR, 3/1998:49–59, 1998.
[6] S. Granqvist and P.-A. Lindestad, A method of applying Fourier analysisto high-speed laryngoscopy, J. Acoust. Soc. Am., 110(6):3193–3197, 2001.
[7] M. Hirano, Clinical examination of the voice, Springer, 1982.[8] S. Imaizumi, Acoustiic measures of roughness in pathological voice, J.
Phonetics, 14:457–462, 1986.[9] D. H. Klatt, Software for a cascade/paraleel formant synthesizer, J.
Acoust. Soc. Am., 67(3):971–995, 1980.[10] D. H. Klatt and L. C. Klatt, Analysis, synthesis, and perception of voice
quality variations among female and male talkers, J. Acoust. Soc. Am.,87(2):820–857, 1990.
[11] S. Niimi and M. Miyaji, Vocal fold vibration and voice quality, FoliaPhoniat., 52:32–38, 2000.
[12] A. E. Rosenberg, Glottal shape on the quality of natural vowels, J.Acoust. Soc. Am., 49(2):583–590, 1970.
[13] M. Rothenberg, Acoustic interaction between the glottal source and thevocal tract, Vocal fold physiology, K. N. Stevens and M. Hirano Ed., pp.305–328, Univ. Tokyo Press. 1981.
[14] K.-I. Sakakibara, Production mechanism of voice quality in singing, J.Phonetic Soc. Jpn., 7(3):27–39, 2003.
[15] K.-I. Sakakibara, L. Fuks, H. Imagawa, and N. Tayama, Growl voicein pop and ethnic styles, Proc. International Symposium on MusicalAcoustics, 2004, 2004.
[16] K.-I. Sakakibara and H. Imagawa, A many-parameter model of laryngealflow with ventricular resonance and supraglottal vibration, Proc. ForumAcusticum 2005, 2005.
[17] K.-I. Sakakibara and H. Imagawa, Modal analysis of vocal fold vibra-tions using laryngotopography, Proc. Interspeech 2010, 2010.
[18] K.-I. Sakakibara, K. Kondo, E. Z. Murano, M. Kumada, H. Imagawa,and S. Niimi, Vocal and false vocal fold vibrations and synthesis ofkhoomei, Proc. International Computer Music Conference, 135–138,2001.
[19] I. R. Titze, Principles of voice production, Prentice-Hall, 1994.[20] I. R. Titze and D. T. Talkin, A theoretical study of the effects of various
laryngeal configurations on the acoustics of phonation, J. Acoust. Soc.Am., 66(1):60–74, 1979.