physiological response to plasma exchange in patients in
TRANSCRIPT

THE PHYSIOLOGICAL RESPONSE TO PLASMA EXCHANGE IN
PATIENTS IN BURN SHOCK
by
Melva D. Kravitz
A dissertation submitted to the faculty of The University of utah
in partial fulfillment of the requirements for the degree of
Doctor of Philosophy
College of Nursing
The University of Utah
August 1984

Copyright @ 1984 Melva D. Kravitz
All Rights Reserved

THE UNIVERSITY OF UTAH GRADUATE SCHOOL
SUPERVISORY COMMITTEE APPROVAL
of a dissertation submitted by
Melva \). Kravitz
This dissertation has been read by each member of the following supervisory committee and by majority vote has been found to be satisfactory.
Ann Voda, Ph.D .
.s-- 20 -8='-1
Glenn D. Warden, M.D.
Ph.D.
THE UNIVERSITY OF UTAH GRADUATE SCHOOL
FINAL READING APPROVAL
To the Graduate Council of The University of Utah:
I have read the dissertation of Mel va D. Krav i tz In Its final form and have found that (I) its format, citations, and bibliographic style are consistent and acceptable; (2) its illustrative materials including figures, tables, and charts are in place; and (3) the final manuscript is satisfactory to the Supervisory Committee and is ready for submission to the Graduate School.
Ann Voda, ph.D.
Member. Supervisory C(Jmrnitlee
Appro '�d for the Major Department !
\ '.
Linda K. Amos, Ed. D., F.A.A.N. Chairman Dean
Approved for the Graduate Council

ABSTRACT
The physiological consequences of major thermal in
jury center around profound, life-threatening shock oc
curring in conjunction with the burn and consisting of
two pathological syndromes: hypovolemic and cellular
shock. Intravascular hypovolemia following major thermal
injury results from increased capillary permeability with
subsequent loss of intravascular fluid into the inter
stitium. Investigations of burn shock have demonstrated
the release of circulating factors which effect this
change in capillary permeability. The purpose of this
study was to evaluate the effect of a therapeutic regime
involving the removal of the circulating factors by per
forming plasma exchange. Fourteen adult patients with
burns of 40% total body surface area (TBSA) served as
subjects. Seven were randomly assigned to the control
group which received standard burn shock resuscitation.
Seven were randomly assigned to the treatment group which
received the same resuscitation in combination with plas
ma exchange. The study period was the first 48 hours
postburn with the plasma exchange procedures performed as
soon as was clinically feasible. A total of 937 measure-

ments of physiological variables were made on each pa
tient. These included vital signs, cardiopulmonary para
meters, respiratory status, and serum content analysis
measured upon admission and every 4 hours thereafter
during the study period. Hourly fluid intake and output
records were compiled. Descriptive data included age,
sex, percent TBSA burn and resuscitation requirements.
Data were analyzed for statistical significance. The
findings were as follows: the sample was unevenly dis
tributed, with the treatment group more critically ill
than the control on the basis of the variable of percent
TBSA full-thickness injury (p < .01) and the incidence of
documented inhalation injury. No significant difference
was found between the groups on the variable of fluid re
quirement, either in subjects with or without associated
inhalation injury. Plasma exchange significantly de
creased platelet count (p < .05) in the treatment group
when compared with the control but did not alter other
serum chemistry values. The coagulopathy reported to oc
cur in burn patients was not observed in this group of 14
subjects. The plasma exchange group was in significantly
(p<.05) more normal base excess balance at both postburn
hour 16 and 24 than the control. There was no evidence
that plasma exchange performed during burn shock for the
purpose of removing circulating factors was harmful in
v

any way to the treatment subjects. It is recommended
that the study as designed be continued until the sample
size permits statistical significance to be reached or
rejected.
vi

CONTENTS
ABSTRACT •••••.••••••.•••..••••. iv
Chapter
I. INTRODUCTION AND STATEMENT OF THE PROBLEM •• 1
II.
III.
Pathophysiology of Burn Shock • • • 2 Purpose • • • . . • • • . . • • • • • .16
THEORETICAL FRAMEWORK • .17
Pathophysiological Response to Thermal Injury •••.••••••••..•.• 17
Cardiovascular Response to Thermal Injury .18 Cellular Response to Thermal Injury .••. 25 Immunologic Response to Thermal Injury .•. 34 Pulmonary Factors in the Response to
Thermal Injury .......••••..• 40 Evaporative Water Loss as a Factor in
Response to Thermal Injury ••..•... 42 Resuscitation of Burn Shock .•.••••. 46 Plasmapharesis as a Therapeutic
Intervention ...••••..••.... 58 Plasma Exchange in Burn Patients .....• 69 Summary • . . . • • . . . • • . • • 71
DESIGN AND METHODOLOGY . •• 75
The Sample .•. . • . •. • •...• 97 Des ign . • . • . . . .74 Methodology •.••...••...••.• 74
IV. RESULTS .. 97
Resuscitation Requirements. . .• 101 Physiologic Variables and the Effect of
Plasma Exchange .. •.. ... 112 Hematology • . • • . . • . . 112 Chemistries • . . . . . . • • . . • . . . 115 Coagulation Studies . . .•....• 123

Pulmonary Variables . • • Base Excess . • . • • . . Cardiopulmonary Profile •
• • 123 • • • • 132 • • • • 132
V. DISCUSSION • 141
The Sample ••• • • • • • • • . • • • • 141 Resuscitation Requirements .••••••• 142 Physiologic Variables • Hematology • • • • Chemistries • • •• ••• Coagulation Studies ••• Pulmonary Variables • • • • .
• 143 • • • • • 143
•. •• . 143 • • • • 144
• • 144 • • • • 145 Cardiopulmonary Profile
Conclusions • • • • • • . . . . . . . • 146
Appendices
A. LUND AND BROWDER CHART WITH DESCRIPTION OF DEPTH OF INJURY • •• •••••••. 148
B. BLOOD REQUIREMENTS FOR LAB VALUES. • 154
C. CARDIOPULMONARY PARAMETERS . 156
D. COMPOSITION OF SOLUTIONS AND FLUIDS •••• 166
E. RANDOM NUMBER ASSIGNMENT SEQUENCE. · 168
F. BODY SURFACE AREA CHART. • • 170
G. PATHOLOLGY LABORATORY VALUES • • . . . 172
H. VARIABLE LIST .•... · 174
I. NURSES' RESPONSIBILITY FOR PLASMA EXCHANGE RESEARCH PROTOCOL. •• • ••.•••• 179
J. RESUSCITATION CALCULATIONS • 182
REFERENCES •.•..•..••.••••••..•• 184
viii

CHAPTER I
INTRODUCTION AND STATEMENT
OF THE PROBLEM
The physiological consequences of major thermal in
jury center around the profound, life-threatening hypo
volemic shock which occurs in conjunction with cellular
and immunological disruption within a few minutes of the
injury. In contrast, the effects of minor and moderate
burn injuries are limited to the skin. Individuals with
minor and moderate burn injuries will experience discom
fort until healing or skin grafting is accomplished, but
these burns are not life-threatening. With a major burn
injury, a systemic pathophysiology ensues which requires
therapeutic intervention to sustain life. The American
Burn Association (1) has defined a major burn injury as
one that involves greater than 25% of the total body sur
face area (TBSA) because this is the extent of injury
which produces a systemic insult. Major burns are not a
skin problem; instead, systemic trauma resulting in cel
lular pathophysiology of all body systems produces the
condition defined as burn shock.
The problem of burn shock was recognized only fairly

2
recently and the cause remains unknown. Currently, burn
shock is treated with large volumes of intravenous re
suscitation fluid. Since the 1940s, various fluid resus
citation formulas have succeeded in maintaining patients
through the initial hypovolemic state of burn shock. In
the past, treatment has been supportive rather than
therapeutic. The sequence of events is as follows:
Within minutes of a major burn injury, the normally semi
permeable capillary system becomes an open system.
Intravascular fluid leaks into the interstitial space,
which results in hypovolemic shock. This process con
tinues for about 24 hours postburn at which time the sys
tem regains its capillary integrity. Burn shock resusci
tation involves the infusion of intravenous fluid at a
rate faster than the rate of the leak of circulating
volume fluid for the 24 hour postburn shock period. When
fluid resuscitation does not occur, the rapidly progres
sive hypovolemia leads to death. Survival of a major
burn injury requires prompt fluid resuscitation to sup
port the patient through the burn shock phase. However,
at this time, burn shock resuscitation is a supportive,
rather than a therapeutic, intervention.
pathophysiology of Burn Shock
Burn shock consists of two pathological syndromes:
Hypovolemic shock and cellular shock. The major as
sumption of this study is that both are nonadaptive com-

pensatory mechanisms; therefore, altering either or both
syndromes back toward homeostasis will be beneficial to
the burn patient.
3
The syndrome of intravascular hypovolemia and de
creased cardiac output following major burn injury results
from increased capillary permeability with subsequent loss
of intravascular fluid into the interstitium. The et
iology of this increase in capillary permeability has not
been defined. Loebl (2), in 1968, demonstrated that
cross-perfusion from burned dogs to unburned animals led
to a decreased cardiac output in the unburned animals,
suggesting there are circulating factors in the burn se
rum responsible for burn shock. Investigations of burn
shock have documented the release of mediators of the in
flammatory response which can lead to loss of capillary
seal following major thermal injuries. These substances
include vasoactive amines (histamines, serotonin),
products of platelet activation (thromboxanes), products
of complement activation (C3a, C5a), prostaglandins,
kinins and endotoxins. Moreover, increased metabolic
hormones (catecholamines, glucocorticoids) are also asso
ciated with edema formation (3). More than one circulat
ing etiological factor appears to be involved in the
pathophysiology of hypovolemic shock following thermal
injury.
The second aspect of burn shock is cellular shock.
4
Increasing data are being accumulated on the mechanisms oc-
curring in the early postburn period at the cellular le-
vel. There appears to be depressed function of the
sodium-potassium membrane pump and altered adenosine tri-
phosphate (ATP) dynamics. Alteration of the levels of
ionized magnesium and calcium in the cellular milieu sug-
gests depressed energy utilization; magnesium and calcium
fluxes occurring in the cell may be important in the
generation of altered cellular permeability. Experiments
by Baxter (4) using intracellular electrical potential
measurements demonstrate membrane potential to be greatly
decreased following thermal injury with failure to return
to normal even after successful fluid resuscitation. The
immunological alterations demonstrated by many inves-
tigators are another aspect of cellular shock associated
with major thermal injury. The immune response is de-
pressed and the release of histamine and serotonin in-
creased. Burn toxins and circulating myocardial depres-
sant factors have also been described.
Physiological Consequences of Fluid Resuscitation
The immediate consequence of successful fluid resus-
citation is restoration of the circulating cardiovascular
volume to a level compatible with life. Without fluid re-
suscitation, most patients with major thermal injury die
of hypovolemic shock. There are a variety of resuscita-

tion formulae which are successful in restoring circu
lating volume but none are specifically administered for
the purpose of restoring cellular function. Present
therapy is limited to cardiovascular support rather than
alteration of the burn shock syndrome.
5
Fluid resuscitation for burn shock focuses on in
fusing intravenous fluid at a rate which produces a mini
mum of 30-50 milliliters (mL) per hour of urine output.
Various fluid resuscitation formulas are used to predict
the amount of fluid which might be necessary to achieve
the output criteria. The most widely used fluid resusci
tation formula is the Parkland Formula (5) whereby
Ringer's lactate is infused at a rate of 4 mL per kilogram
(kg) of body weight per percent total body surface area
(TBSA) burn during the first 24 hours postburn. Approxi
mately one-half of this total fluid volume is given during
the first eight hours postburn and one-fourth during each
of the second and third eight hour periods.
Resuscitation formulas are used as guidelines only;
the hourly volume of resuscitation fluid administered is
determined by the clinical parameter of urine output.
Baxter and Shires (5) report 70 to 80% of all burn
patients require 4 mL/kg/% TBSA burn of resuscitation
fluid during the first 24 hours postburn. Moreover, 95%
of all burn patients required between 3.5 and 4.5 mL/kg/%
TBSA burn. The problem is that even though 95% of all

6
thermally injured patients can be successfully resusci
tated using the Parkland formula, the burn shock remains
so severe for 24 hours postburn that the volume of fluid
required merely supports the patient's circulatory system
but does not alter the shock syndrome itself. Patients
with major burns greater than 60% TBSA may require 20 to
30 liters of intravenous fluid during the first 24 hours
postburn. This progresses to massive iatrogenic edema
which leads to mechanical airway obstruction necessita
ting tracheal intubation, increased severity of the
interstitial pulmonary edema associated with inhalation
injury, prolonged ileus with bowel wall edema, compro
mised circulation to the extremities necessitating escha
rotorny or fasciotomy, and to a rapid depletion of serum
protein with resultant lowered albumin levels. In addi
tion, edema has been demonstrated to impair wound healing
secondary to decreased oxygen tension at the cellular
level.
The internal environment in which various cellular
components of the body must exist is drastically altered
from normal following thermal injury. Even though ther
mally injured patients demonstrate altered cellular
function, these abnormalities can be returned to normal
when the cell is removed from the burn environment. It is
clinically not possible to remove these cells for the pur
pose of restoring them to normal; thus, therapeutic inter-

7
vention has to be aimed at restoring the burn environment
toward normal. This information indirectly supports the
use of any treatment modality which could "mimic" removal
of the cell from the toxic environment.
With the development of in vivo blood cell separa
tors, the separation and removal of specific blood compo
nents for therapeutic purposes is now a practical possibil
ity in the clinical setting. Although the procedure is
commonly referred to as plasmapheresis (to take away plas
ma (6)), plasma exchange is the preferred term for the
procedure as used in burn patients since the volume of re
moved plasma is replaced with an equal volume of fresh
frozen banked plasma. The removal of plasma followed by
the return of the cellular components of blood was first
described by Orosez (7) in 1913 for the purpose of cor
recting uremia in bilaterally nephrectomized dogs.
During the Twentieth Century, whole blood exchange revo
lutionized the management of hemolytic diseases of the
newborn. Ten years have elapsed since the introduction
of in vivo blood cell separators into clinical medicine.
These machines were initially developed for the collec
tion of granulocytes and platelets from normal donors;
however, their availability in general hospitals has led
to their therapeutic use in a wide range of medical con
ditions. Plasmapheresis has a definitive role in the
management of many immunoproliferative and autoimmune

8
disorders for the purpose of restoring a physiologic
internal environment. Plasma exchange to reverse or
alter burn shock has the same goal.
In summary, fluid resuscitation as it is currently
accomplished is successful in 95% of all burn patients.
However, its aim is to support the patient through burn
shock which requires massive volumes of intravenous fluid
and leads to iatrogenic complications. Plasma exchange
seeks to restore the internal environment toward normal
by removal of hypothesized circulating toxic factors and
replacing them with banked fresh frozen plasma, which may
alter the burn shock syndrome in a manner to restore the
capillary seal. If plasma exchange accomplishes this
aim, the burn shock and, thus, the massive volume of
fluid required for resuscitation, will be altered.
Nursing Treatment of Burn Shock: State of the Art
Burn shock is not addressed specifically as a nursing
problem in the literature. Burn nursing has traditionally
occurred within a multidisciplinary setting with all mem-
bers addressing all problems. Pruitt (8) states that the
vast increase in burn care knowledge confirms the ef-
fectiveness of multidisciplinary care and research. A re-
flection of the overall philosophy of burn care is the
idea that the people responsible for patient care are the
ones in a position to identify clinical problems deserving

9
of study and resolution. Pruitt states an indigenous
nursing staff is of primary importance in the list of
factors essential for burn care and research because its
members not only provide the intensive care necessary for
optimum survival but assist in the identification of
clinical problems.
The first burn center staffed by a multidisciplinary
team in the united States opened at Brooke Army Medical
Center at Fort Sam Houston, Texas, in 1947. By 1979,
there were 172 burn facilities with 1,511 beds (9). The
American Burn~ssociation was established in 1967 with
membership open to any professional with one year's ex
perience in burn care. Marvin (9) reports that although
the physician is regarded as the "captain of the ship,"
the nurse on the burn team traditionally holds the role
of coordinator of all activities directed toward the care
of burned patients. Thus there is no nursing research
per se in burn care but rather a series of articles
authored by members of the burn team which prominently
includes nurses. This multidisciplinary approach to burn
care and its practice in a physically designated area has
resulted in a higher patient survival rate and a hospital
time about one-half that of nonunit care (10).
~rchambeault-Jones and Feller (11) state patients with
major burns require meticulous and comprehensive care for
survival and the key member in structuring an environment

10
for recovery is the nurse. The concept that clinical
nurses are responsible for structuring an environment is
consistent with the current concept of nursing diagnosis.
Yet the intensive care setting is where the nursing
medical diagnosis confusion abounds. Dracup (12) reports
critical care nurses constantly deal with patients in
physiological crises but physiological nursing diagnoses
remain the most problematic. She gives as examples the
diagnoses of "alterations in cardiac output" and
lIimpaired gas exchange."
Guzetta and Dossey (13) have described nursing diag
nosis in terms of its framework, process, and problems.
They have identified the problems with using nursing diag
nosis in critical care as multifaceted and complex. One
problem which tends to overshadow all others is that of
territory or, as these authors refer to it, the dependent
vs. interdependent and independent role of the critical
care nurse. They state that the dependent and independent
roles theoretically can be defined yet the lines that se
parate these roles in practice become fuzzy. Burn nurses
have the distinct advantage in that their role has been
accepted as one of interdependence since 1947 by all mem
bers of the multidisciplinary team, including the nurse.
Thus activities in a burn unit are burn nursing with burn
shock resuscitation an integral part of that nursing.
Shock as a physiologic consequence of thermal injury

11
was recognized only fairly recently. Prior to the early
1900s, burns were considered a skin problem and therapy
was focused on wound care. Then in 1897, Tommasoli
started to treat patients with severe burns by saline in
fusion (14). Warden (15) correlates the dawn of modern
burn care with three discoveries. The first was the dis
covery of anesthesia by Morton, the second was the eluci
dation of the nature and treatment of burn wound infec
tion by Lister, and the third was the use of sodium
chloride in the resuscitation of burn shock by Parascan
dolo in 1901. Fluid resuscitation is now universally
recognized as the primary intervention in the emergent
(first 48 hours postburn) phase. Wooldridge-King (16)
lists the goals of fluid resuscitation as a) correction
of antecedent fluid, electrolyte, and protein deficits;
b) replacement of continuing losses and maintenance of
fluids without overloading; and c) prevention of exces
sive edema formation. She also states that basic fluid
therapy is ordered by the physician but the amount
infused each hour is based on nursing judgment within
established protocols. O'Malley and Snow (17) report
burn unit nurses participate fully in moment-to-moment
evaluation and treatment by initiating fluid changes and
beginning ventilatory support when these measures are
necessary. Christopher (18) describes a model for hemo
dynamic balance to describe burn shock.

12
Nurses working in burn intensive care areas perform
nursing assessments which in effect determine the rate of
intravenous fluid infusion for patients in burn shock.
These decisions are based upon both knowledge and expec
tations: specifically, several formulas exist which
predict these fluid requirements. The most commonly used
formula is the Parkland formula which predicts that a
patient with major thermal injury will require 4 mL of
intravenous fluid for each percent TBSA burn per kg of
body weight during the 24 hour postburn period.
The trained burn nurse assumes complete responsi
bility for determinig the rate of administration. This
is appropriate since Gordon and Sweeney (19) list among
areas of nursing diagnoses the states of altered skin in
tegrity, fluid volume, and cardiac output. Nurses in
burn intensive care units stabilize the patient's urine
output by titrating the rate of intravenous fluid admini
stration.
Nursing is a practice discipline which occurs in a
variety of settings. One such setting is an intensive
care unit: specifically, a burn unit. Here patients are
critically ill as a result of a catastrophic injury which
has allowed no time for adaptation, either physiological
ly or psychologically. The goal of intervention is to
support the patient through a series of physiologic
changes as the body attempts to establish compensatory

13
adaptations. Burn shock is not a physiologic change to
which the body can adapt; an external source of adapta
tion is required for survival. The nursing intervention
is to provide cardiovascular support via the administra
tion of intravenous fluids at a rate to assure survival
until the cessation of burn shock, which is usually self
limited in a 24-hour time-frame. Fluid resuscitation is
currently routinely performed by highly skilled burn
nurses. However the method of plasma exchange, a recent
advance in therapy for burn shock, has necessitated a
reevaluation of the methods previously used to resusci
tate burn patients.
Plasma exchange is a procedure which involves
removing the patient's plasma and replacing it with
banked fresh frozen plasma. The nursing implications of
this procedure when performed on a patient in burn shock
are not known, yet the nurse remains responsible for the
administration of appropriate fluid volumes to assure
cardiovascular stability while at the same time assessing
the effect of the procedure. The effects of plasma ex
change on the patient's fluid requirements and cardiovas
cular status are unknown. Therefore, nursing research is
essential to document the patient's response to plasma
exchange. At this point, plasma exchange is an experi
mental procedure when used for the purpose of therapeu
tically altering burn shock.

14
A desired outcome of plasma exchange is to stop the
loss of capillary seal and, in fact, restore capillary
integrity. If this occurs, the amount of intravenous
fluid required to support the cardiovascular system would
decrease proportionately. The purpose of plasma exchange
during burn shock is to reverse the loss of capillary
seal; if this does not occur, there is no reason to
continue to perform the procedure.
A review of the literature for the purpose of identi
fying a nursing model based on a higher theoretical
framework than nursing diagnosis revealed that none of
the nursing models were appropriate because none had been
applied in the intensive care setting. The nursing mo
dels reviewed are strangely silent on the topic of deva
stating traumatic injury or disease during the initial
post trauma period. Rogers includes a cardiac patient in
an example of the use of her continuum model, but the
time-frame involves teaching the patient about the life
style changes necessary after an acute myocardial in
farction. No mention is made of the patient during the
time of the acute insult (20). Neuman's model focuses on
the patient's perception of the illness and is noted to
be particularly relevant to patients with hypertension
(21). The core of Orem's self-care nursing model is that
man has an innate ability to care for himself (22).
Roy's adaptation model identifies the environment as the

15
source of stimuli to which the person must adapt with
nursing actions either maintaining or promoting adapta
tion (23). Hollen proposes a holistic model of health
which is based on the belief that health is choice (24).
Guzzetta and Dossey (13) clarify the central concepts of
the holistic model as one which includes the patient as
an active participant at all times. The model is also
inappropriate since concepts of the response to severe
life-threatening acute trauma have not been validated in
the intensive care setting where no decisions are made by
the patient and all decisions are made by the health care
team for a period often covering many days.
A review of literature on nursing research in the
clinical intensive care areas revealed that nursing
models are not utilized in the theoretical underpinnings
of the research. Rather, the physiologic response to
trauma was consistently found as the basis of the re
searcher's review of the literature. Another assumption
of this study is that nursing models have not been tested
in intensive care settings. This was especially evident
in the coronary intensive care research efforts where
measurements with Swan-Ganz catheters were used. In burn
nursing clinical research, the focus tends to be on the
metabolic alterations which occur as a result of the burn
injury.
The consistent practice of conducting intensive care

16
unit physiological research without incorporation into a
nursing model appears to be due to a temporal gap in
existing nursing models when no time for, nor means of,
adaptation occurs. In IeU settings, nurses need to adapt
to the needs of a helpless, severely-traumatized patient.
It is only much later that the nurse can work with the
patient to facilitate adaptation to the magnitude and im
plications of the illness/injury.
Purpose
The purpose of this study was to determine the
effect of plasma exchange on the pathophysiology of burn
shock. This research is designed to answer the following
specific questions:
1. Is the volume of resuscitation fluid decreased
in thermally injured subjects when plasma exchange is
combined with standard fluid resuscitation using the
Parkland formula?
2. What is the effect of plasma exchange combined
with standard burn shock resuscitation using the Parkland
formula on measurable physiological variables in thermally
injured subjects?

CHAPTER II
THEORETICAL FRAMEWORK
This chapter presents the theoretical framework of
the study. The material is organized as follows so as to
comprise a physiological shock framework. First is an
overview of the physiologic response to thermal injury
which includes the cardiovascular, cellular and im-
munologic responses. Second, the factors of pulmonary
injury and increased evaporative water loss in response
to thermal injury are presented. Next is a review of the
principles of fluid resuscitation and the variety of
formulas currently in use. Then plasmapheresis and its
current clinical application is discussed. Following
this is a review of the current use of plasma exchange in
burn patients. To conclude the chapter, a summary is
presented.
Pathophysiological Response to Thermal Injury
Burn shock appears to consist of both a hypovolemic
and a cellular component. Hypovolemic shock results from
an increase in capillary permeability which begins with
the onset of thermal injury and persists for approximately
24 hours postburn, even when adequate resuscitation fluid
18
is given. Investigators have documented the release of
many mediators of the inflammatory response which may
play roles in the cardiovascular response to burns. Evi-
de nee has also accumulated suggesting that cellular me-
tabolism is disrupted with onset of the burn wound
resulting in altered membrane permeability and loss of
normal electrolyte homeostasis. This cellular defect may
be the pathophysiologic process responsible for the gene-
sis of burn shock. Also, the many circulating factors
demonstrated in burn serum may play a role in the genera-
tion of the cellular abnormalties known to occur. While
recognizing that the cardiovascular or systemic response
is intricately interwoven into the cellular response,
they will nevertheless be discussed as separate entities
for the purpose of describing their components.
Cardiovascular Response to Thermal Injury
The end result of a major burn injury is hypo~olemic
shock. This burn shock is proportional to the depth and
extent of the injury. Burns involving 25 to 40% TBSA re-
quire cardiovascular support via intravenous fluid but pa-
tients usually tolerate the treatment in a fairly predic-
table manner. Burns involving greater than 40% TBSA are
potentially lethal injuries which are often accompanied
by a stormy clinical course. In general, the burn shock
research model refers to an involvement of 40% TBSA burn

19
or greater.
Cope and Moore (25) in 1944, were among the first to
describe the alteration in capillary permeability which
results in a fluid shift to the interstitium. This was
measured indirectly in that the fluid content of burn
blisters was analyzed for protein content and found to be
protein-rich. Almost simultaneously, Fox and Keston (26)
in 1945 demonstrated massive redistribution of sodium in
burned mice, with the sodium content of injured skin and
muscle greatly increased in proportion to water gain.
Many further studies were performed in experimental burns
and in clinical burn treatment to document the magnitude
of the capillary leak of intravascular fluid into the in
terstitium. Ganrot et al. (27) demonstrated the
lymph/plasma ratio of all proteins except that of alpha-
2-macroglobulin increased after experimental scalding of
dogs, indicating an increased capillary permeability to
proteins with molecular weights up to 300,000. These
findings were significant because normally the inter
stitial fluid is essentially an ultrafiltrate of plasma
in equilibrium with plasma but containing little protein
and nearly equal amounts of sodium. Wachtel et al. (28)
in 1983, used Wick catheters to obtain direct measure
ments of the interstitial fluid pressures while at the
same time measuring serum oncotic pressures in six se
verely burned patients. The study showed no consistent

20
relationship between oncotic pressures of serum and in
terstitial fluid. Thus, after extensive thermal injury,
a sequential series of fluid shifts occurs involving the
redistribution of body water, salt, and protein. The in
crease in capillary permeability allows the intravascular
fluid, except for the red blood cells and white blood
cells, to leak into the interstitial spaces. This re
sults in a marked decrease in the available circulating
volume: thus the terminology, burn shock.
It has long been recognized that cardiac dysfunction
is also a component of major thermal injury. Burn shock
is accompanied by a sudden precipitous drop of the car
diac output which does not parallel the gradual reduction
of blood volume. Furthermore, the infusion of intra
venous fluids in amounts to restore the circulating
volume does not return the cardiac output to preburn
levels. This was demonstrated in 1957 by Dobson and
Warner (29) using dye-dilution techniques to measure
changes in cardiac output, plasma volume, and liver blood
flow in burned dogs. Their most striking finding was the
almost immediate and precipitous fall in cardiac output
not associated in the initial stages with a significant
reduction in plasma volume. The liver blood flow
paralleled the decline in cardiac output in this study.
Merriam (30) in 1962, using ventricular function curves
as an index of myocardial contractility in burned dogs,

determined that the burn produced impairment of myo
cardial contractility but was unable to identify the
mechanism. Many further studies were performed to
measure the magnitude of myocardial dysfunction but it
was not until the early 1970s, with the advent of the
Swan-Ganz thermodilution catheter, that the full phys
iologic impact was described. Aikawa et al. (31) in
21
1978 presented pulmonary artery catheterization and
thermodilution cardiac output determinations in 39 criti
cally burned patients. Their findings included a) pul
monary artery wedge pressures, which reflect left ven
tricular function relative to its afterload, were found
to be a more reliable indicator of circulating volume
than the central venous pressure which reflects right
ventricular function, and b) depressed myocardial
function was present in these patients.
The consistent burn shock finding of inappropriately
low cardiac output in the presence of vigorous intravenous
fluid resuscitation led to the suggestion of a specific
myocardial depressant factor. Baxter et al. (32) sugges
ted in 1966 the presence of circulating material capable
of selectively depressing myocardial function. Their work
involved cross-perfusion of burned to normal dogs and
showed a decrease in cardiac output of 45 to 70% in the
unburned animals occurring within three to five minutes of
cross-perfusion. Glenn and Lefer (33) in 1971 demon-

22
strated that intravenous infusion of isolated myocardial
depressant factor into intact anesthetized cats in amounts
equivalent to that present in the plasma of cats in shock
resulted in a profound shock state 30 to 60 minutes post
infusion.
A similar myocardial depressant factor was described
by Lefer et ale (34) in studies of a hemorrhagic shock cat
model. They found the substance to be dialyzable and
therefore of low molecular weight. In addition, a marked
depression in the contractility of isolated cat cardiac
muscle when exposed to plasma from cats in late hemor
rhagic shock was noted. Further work by Lefer and
Blattberg (35) revealed not only a myocardial depressant
factor but also a reticuloendothelial depressing factor.
The source of the myocardial depressant factor
remained elusive. Lefer and Martin (36) in 1970 suggested
the pancreas as the primary site of production of the
precursor of myocardial depressant factor, its activator,
or the factor itself. Rosenthal et ale (37) suggested
the burned skin as the source of the factor. After iso
lating a "toxic factor" from burned skin, its action was
shown to be primarily on the myocardium. After isolating
purified burn toxin and its competetin, their data sug
gested competition for the same myocardial receptor
sites. Raffa and Trunkey (38) demonstrated even more
specific effects in a study of the function of rabbit

interventricular septum depression after myocardial de
pressant factor exposure.
23
The chemical structure of the myocardial depressant
factor was characterized by Goldfarb et al. (39) as con
taining L-leucine, an amino acid which is a demonstrated
cardiac depressant. And, while most investigators focused
on the immediate postburn period as the time of maximum
effect of myocardial depressant factor, DeSantis et al.
(40) report even greater activity at four to five days
postburn.
The gut has also been implicated as the source of an
endotoxin producing a shock syndrome. Caridis et al. (41)
discuss persistent shock in nonseptic disorders due to en
dotoxin. They point out that endotoxin is continuously
absorbed from the intestinal tract but is promptly cleared
by the reticuloendothelial system. As mentioned in a pre
viously cited reference (35) the reticuloendothelial sys
tem is depressed with shock; thus it is possible that the
circulating endotoxin accumulates with progressive
vascular collapse as the consequence.
Hamer-Hodges et al.(42) in 1974 demonstrated the
role of intraintestinal Gram-negative bacterial flora in
major thermal injury by comparing a burned rabbit model
exposed either to Gram-negative or to Gram-positive exo
toxin. The shock response was overwhelming in the group
with exposure to Gram-negative flora but relatively mild

24
in the group with Gram-positive exposure. An additional
finding was a separate vasoactive agent released from the
burn into the circulation during a period of several
hours. This agent was reported to cause a generalized
increase in vascular permeability which allows the
transmural movement of living bacteria and endotoxin from
the intestinal lumen. The burn wound itself was also
postulated as the source of the vasoactive substance by
Cuevas et ale (43). Isolation of a substance from the
venous blood of burned rabbits with a large burn followed
by its injection into unburned animals produced a capil
lary leak which then allowed mobilization of endotoxin
from the intestine. At the same time, Little and Stoner
(44) failed to find a role for intestinal bacterial endo
toxin in burn shock. Kremer et ale (45) in 1981 produced
additional strong evidence for a specific burn toxin
which has as its source the burned skin and as its action
direct damage to mitochondria. Their conclusion is that
one important aspect of burn treatment should be the eli
mination of the toxic substances if possible.
In summary, while there is agreement that myocardial
dysfunction is present with all major burn injuries, the
etiology of the depression remains to be described except
in the most general terms. It is now accepted that there
is no simple specific myocardial depressant factor but,
rather, a cascade of events which are generally termed

25
the cellular response to burn injury and include both
metabolic and immunologic factors. These factors
initiate the cardiovascular sequence of loss of capillary
seal and subsequent hypovolemic shock.
Cellular Response to Thermal Injury
Major trauma effects the entire physiologic system
but the survival of the patient depends upon its ultimate
impact at the cellular level. This is as true for major
burn patients as for any other form of shock-trauma pa
tient. The cellular response to burn injury will be dis
cussed in two general categories: Metabolic response and
immunologic response.
The basic syndrome is referred to as the "sick cell
syndrome." Welt et ale (46) were among the first to des
cribe this phenomenon as a membrane transport defect. In
1967 their work with erythrocytes in burn and other types
of patients revealed an alteration in the steady state
composition characterized by high intracellular concentra
tions of sodium, a defect in the active transport of this
cation in the presence of adequate levels of adenosine
triphosphate (ATP). Rosenthal and Tabor (47) in 1945, had
reported an elevation of serum potassium in shocked ani
mals with the source of the potassium being intracellular
from both traumatized and nontraumatized areas.
Actual measurement of changes in transmembrane

26
potential of rat skeletal muscle in a hemorrhagic shock
model was performed by Cunningham et ale (48) in 1971.
The finding of a consistent depression of transmembrane
potential difference and a gradual elevation of inter
stitial potassium in association with prolonged severe
hypotension parallels the findings by others in burn
patients. Further work by Cunningham et ale (49)
measured the resting membrane potential difference of
skeletal muscle in 26 normal human subjects, seven
patients with mild illness, and 21 patients with severe
debilitating medical disorders. As with the animal
model, the combination of a low resting membrane poten
tial and a high intracellular sodium concentration in the
ill patients was found. Shires et ale (50) demonstrated
the same findings in a group of 22 baboons in hemorrhagic
shock but they carried the experiment one step further
and demonstrated that the effects are reversible with
adequate ~esuscitation measures. Trunkey et ale (51)
found a marked decrease in primate muscle extracellular
water and an increase in both intracellular sodium and
water during hypovolemic shock. In addition, there was
an associated decrease in resting membrane potential, a
decrease in amplitude of the action potential, and pro
longation of both the repolarization and depolarization
time in association with a decreased muscle intracellular
potassium concentration. Resuscitation reversed the

27
changes acutely. Trunkey et ala (52) demonstrated that
these alterations are due to circulating factors rather
than ischemia. This was done by primate cross-perfusion
studies with three groups. Group 1 was an ischemic
model, Group 2 was the control, and Group 3 was the cir
culating model. Differences between the groups confirmed
the changes were limited to the circulating cross-per
fusion animals.
Cunningham et ala (53) studied the changes in intra
cellular sodium and potassium content of red blood cells
in a group of burn patients during the first few hours af
ter admission. Early sampling of burn patients revealed
consistently normal red cell sodium levels regardless of
the extent of the burn (range: 20-95% TBSA). Sayeed et
ala (54) in their study of the effect of hemorrhagic shock
on rat hepatic transmembrane potentials, supported the
concept of hepatic cell volume being regulated by met
abolically linked sodium extrusion but not by an e~ually
coupled sodium-potassium pump. This failure of cellular
energy-related electrogenic sodium extrusion is the sug
gested etiology of hepatic cell swelling with shock.
The cellular dysfunction of burn injury extends
beyond the transmembrane potential disruption and the
sodium-potassium pump impairment. Turinsky et ala (55)
suggest that muscles underlying the burn in a rat model
also show a loss of intracellular magnesium and phosphate.

28
Deets and Glaviano (56) have verified the effect of shock
on muscle by demonstrating an elevated lactic dehydro
genase (LDH). Burned dogs showed a marked increase in
total plasma LDH accompanied by a significant decrease in
cardiac output and an increase in total peripheral resis
tance and hematocrit. Their finding of negative myo
cardial uptake of LDH indicated the cardiac muscle was
the source of the circulating LDH.
In summary, the above studies suggest impairment of
the basic cellular functions such as the sodium-potassium
pump as the underlying cause of the diminished membrane
potentials. The data suggest a decrease in the efficiency
of the pump: a change which can be reversed by adequate
resuscitation over time. This points to evidence for the
presence of circulating factors versus ischemic factors.
Stress reactions to severe trauma also involve the
response of the sympathetic nervous system and other ho
meostatic regulators. Catecholamines are found in ele
vated amounts in both serum and urine of burn patients.
Okamoto et al. (57) report changes in lipid metabolism
described as an elevation in plasma free fatty acids (FFA)
and a decrease in plasma cholesterol and phospholipids si
multaneously with the elevated catecholamines. Wilmore et
al. (58) in 1974 conducted in-depth research of 20 burn
patients and four normal individuals in a metabolic cham
ber environment for the purpose of studying the hypermeta-
29
bolic response to injury. They found all burn patients
were hypermetabolic at all ambient temperatures and their
core and mean temperatures were significantly elevated
above control values. However, burn patients are in
ternally warm, not externally cold. The metabolic rate
increased with burn size in a curvilinear relationship,
with oxygen consumption rarely exceeding two and one-half
times basal levels. Burn patients treated in a warm en
vironment (32 degrees C) demonstrated lower metabolic
rates than when treated in a cool environment (22 degrees
C). Despite this finding, it is apparent that evapora
tive water loss and surface cooling in the burn patient
are not the primary stimulus for the hypermetabolic state.
These authors found evidence for mediation by catechola
mines as the etiology of the increased heat production in
response to a direct effect on cellular calorigenic acti
vity. Associated injuries in patients with greater than
40% TBSA burn exert little or no metabolic effect, for
the thermal injury has already caused a maximal stress
response. Burn patients were found to have reset their
thermal regulatory set-point upward. Additional findings
include: a) fasting blood glucose is above normal levels
following the injury; and b) the hyperglycemia is related
to the extent of the injury. Hauben et ale (59) report on
eight burn patients with concommitant smoke inhalation
injury, seven of whom demonstrated elevated levels of

30
plasma vasopressin (antidiuretic hormone (AOH)) during
the shock phase of burn injury. The level of elevation
was found to be related to the severity of the burn.
Serum sodium and potassium levels did not show any signi
ficant alterations. Burn injuries are known to produce a
sympathetic stress response. The reflex arc mobilizes
neural and/or hormonal afferent stimuli to the
hypothalmus. This produces a catecholamine response ma
nifested clinically as hypermetabolism, hyperthermia, and
hyperglycemia.
Evidence also exists that the burn wound itself
directly mediates the response to injury at both the local
and systemic level. Wilmore et ale (60) report that the
body's priority response to injury is the wound itself and
that the general systemic events appear to occur as if in
response to tissue inflammation. That is, vasodilation,
increased capillary permeability, and edema occur to pro
mote healing. The distribution of the peripheral circula
tion following thermal injury transports both heat and
glucose preferentially to the wound. The energy cost of
these repairative and transport processes is reflected in
the increased metabolism and hyperdynamic circulation pre
viously reported by Wilmore et ale (58). The signal for
the response is unknown since patients whose wounds have
been denervated continue to have the posttraumatic metabo
lic response. Gump et ala (61) also analyzed blood flow

31
and oxygen consumption in patients with severe burns.
They found that the extensive evaporative heat loss char
acteristic of burn patients is met, at least in part, by
increased visceral heat production. Analysis of the data
suggested that peripheral blood flow was increased beyond
metabolic tissue requirements.
Studies describing the effect of injury and infection
on visceral metabolism and circulation were also performed
by Wilmore et ala (62). Thirty-one burn patients were
studied to characterize the role of the liver and kidney.
Seven of the patients were in the early phase of burn in
jury and all demonstrated splanchnic uptake of lactate and
pyruvate greater than normal. Assuming complete hepatic
conversion of lactate and pyruvate to glucose, these two
substrates accounted for 30 to 50% of the glucose produced
by the liver. The study showed that hepatic glucose pro
duction increases following thermal injury.
Hypothalamic function alterations following thermal
injury were evaluated by Wilmore et ala (63) to determine
the role of the central nervous system in directing the
metabolic response to injury. Nine burn patients were
studied in an environmental chamber and were found to have
elevated human growth hormone (HGH) serum levels in the
presence of hyperglycemia. Since HGH is normally sup
pressed by hyperglycemia, it is suggested that the injury
produces an alteration in hypothalamic function which aug-

32
ments HGH elaboration at the same time it increases sympa
thetic discharge.
The relative significance of thermal and metabolic
demands on burn hypermetabolism was evaluated by Aulick et
ale (64) by studying 20 burn patients and five normal con
trols in an environmental chamber. They found that the
hypermetabolic rate is not decreased during rest, sleep,
or warmth in burn patients. Since the increased oxygen
consumption could not be accounted for on the basis of the
elevated body temperature alone, it was concluded that an
elevated metabolic state, and not a thermoregulatory
drive, is responsible for the increased heat production.
Glucose and lactate kinetics are also altered fol
lowing burn shock. While tissue hypoxia produces lactic
acidosis, its persistence in the presence of adequate tis
sue perfusion suggests an increased rate of glycogenoly
sis. Wolfe et ale (65) in a study on a guinea pig model,
found the percentage of gluconeogenesis originating from
lactate was elevated postburn. Wilmore et ale (66) in a
discussion of glucose metabolism, report that an absolute
or relative insulin deficiency in combination with an ex
cess of glucocorticoid, glucagon, and/or catecholamine are
the signals which promote gluconeogenesis. In the early
burn phase, insulin concentrations are low but then rise
toward normal with resuscitation. The hyperglycemia is a
result of increased hepatic glucose production. The cel-
33
lular components of the injured tissue utilize glucose as
their primary fuel and convert this sugar to lactate which
is recycled to the liver and reprocessed to new glucose.
Evidence of hepatic response to injury is also char
acterized by alterations of the clotting factor. Burn pa
tients are often classified as "hypercoagulable" in that
plasma fibrinogen concentration is elevated while pro
thrombin time (PT) and activated partial thromboplastin
time (PTT) are shortened. McManus et al. (67) studied the
syndrome of disseminated intravascular coagulation (DIC)
in burn patients. The syndrome results in incoagulability
(PT, PTT), clotting factor consumption (Factors V, VIII,
platelet count), and a resultant secondary fibrinolysis.
A review of 274 burn patients revealed that five went on
to develop clinically documented DIC. Baxter, in discus
sing this paper, reports laboratory findings reflecting
progressive thrombocytopenia in conjunction with elevated
fibrin split products and fibrinogen, as "normal" findings
in 100 patients with 30% or greater TBSA burns.
In summary, extensive thermal injury initiates the
most marked alterations in body metabolism associated with
any illness. Much of the work explaining this response
has been conducted by Wilmore and Aulick (3) who report
the persistent tachycardia, hyperpnea, hyperpyrexia, and
marked body wasting seen in the burn patient reflects
heightened metabolic activity and accelerated body catabo-
34
lism. These systemic alterations occur as a result of
the cutaneous inflammatory process and are thought to
facilitate wound repair. The neural component of this
alteration is in response to a sympathetic reaction which
releases catecholamines and vasopressin in large amounts.
Immunologic Response to Thermal Injury
The immunologic response to burn injury is im
mediate, prolonged, and severe. The end result in pa
tients surviving burn shock is an increased suscepti
bility to potentially fatal systemic burn wound sepsis.
Alexander and Moncrief (68) reported in 1966 thermal in
jury results in a susceptibility to infection which con
tinues to be the greatest single cause of death in
patients surviving the initial shock. This discussion
will be limited to the immunologic changes associated
with the shock phase.
The role of these circulating factors in the genera
tion of burn shock has been extensively studied. Serum
or plasma from burned subjects has since been shown to
induce a variety of phenomena associated with the burn
state. Warden et al. (69) in 1974, evaluated leukocyte
chemotaxis in vitro in 46 thermally injured patients.
During the first 72 hours postburn, all patients demon
strated a decrease in leukocyte migration with the de
crease inversely correlated with burn size. A further

35
study by the same group and reported in 1975 assessed the
effect of normal serum upon burn-suppressed leukocytes
and the effects of three commonly used topical chemo
therapeutic agents upon the chemotaxis exhibited by
granulocytes from normal controls (70). They found that
placing the burn-suppressed leukocytes into serum ob
tained from normal donors returned the levels to 107% of
normal activity. Additionally, burn serum was demon
strated to suppress normal leukocytes from unburned
donors. The use of commercially available albumin did
not restore chemotactic function. Both mafenide and sil
ver sulfadiazine suppressed the chemotactic function of
granulocytes obtained from normal controls. Further work
by Miller and Baker (71) reports suppressive mononuclear
cells are at least partially responsible for the de
creased immunocompetence of burn patients. Ninnemann
(72) reported the participation of both a serum-borne
factor and a specific subset of B lymphocytes in the
generation of such suppressor cells. Moreover, he has
demonstrated the presence of prostaglandins, endotoxins,
and interferon in the sera of thermally injured patients
and suggests that these substances may be responsible for
the above described phenomenon. Ninemann et ale demon
strated that lymphocyte function is compromised in the
presence of burn sera (73). Rapaport and Bachvaroff (74)
report that thermal injury is associated with significant

enhancements in the rate of generation of antibody
forming cells in response to T cell dependent antigens
and that the effect is most pronounced in mice immunized
within 24 hours postburn.
Altered white blood cell (WBC) superoxide activity
36
was reported by Edgar et ale (75) when cells were incubated
in burn serum. Loebel et al. (2) reported markedly
shortened red blood cell (RBC) survival and an increase
in RBC destruction when normal RBCs were placed in burn
patients. A return to normal longevity of the RBCs was
noted when the cells were placed into normal individuals.
From these studies it can be concluded that, although
thermally injured patients demonstrate altered leukocyte
function, these abnormalities can be returned to normal
when the leukocyte is removed from the burn environment.
A host of chemicals found to be present in burn plas
ma in altered concentrations may playa role in burn
shock. These include vasoactive amines (histamine, sero
tonin), products of complement activiation (C3a, C5a),
prostaglandins, kinins, endotoxin, and the metabolic hor
mones (catecholamines, glucocorticoids).
Heideman et ale (76) have demonstrated a decrease in
the complement components C3a and C5a in the circulation
following thermal injury and suggest that the injury non
specifically activates the complement system. Activation
of complement in the injured tissue results in an inflam-

37
matory response due to the release of histamine and sero
tonin by C3a and C5a. This appears to alter capillary
permeability, leading to edema formation. Gelfand et al.
(77) found pre rential activation and depletion of the
alternative complement pathway in eight adult burn pa
tients. The alternative pathway titer was reduced by more
than 90%, suggesting preferential depletion of this
pathway.
A consumptive opsoninopathy has been reported by
Alexander et al. (78). While normally opsonin renders
bacteria susceptible to phagocytosis, this study showed
reduced ability of a group of patients' serum to opsonize
bacteria. Bjornson et al. (79) likewise found consumption
of C3, properdin, and Factor B following thermal injury
and suggested a consumptive opsoninopathy had occurred.
They were able to demonstrate that burn serum contained an
inhibitor of C3 conversion which would lead to decreased
opsonization and polymorphonuclear (PMN) neutrophil
function.
The vasoactive amines (histamine and serotonin)
initiate the inflammatory response along with kinin
polypeptides and other chemical mediators (80). As a
result of these vascular changes, fluid and fibrinogen
leave the dilated, permeable vessels. Prostaglandins
function in the inflammatory process by regulating the
metabolism of the cells of inflammation (lymphocytes,

38
macrophages, and neutrophils). In addition to the release
of effector substances, burn injury has be~n shown to
cause platelet consumption and activation; release of
thromboxanes; and inhibition of heart muscle contraction.
Studies into the pharmacologic alteration of the
histamine-serotonin release have been performed by Markley
et ale (81) and Holliman et ale (82). Markley found that
preinjury doses of purines and histamines produced an
increased blood volume and lower hematocrit values after
burning of mice. The mechanism remains obscure but two
possibilities appear feasible: a) vasoconstriction
decreased fluid loss into the interstitium, or b) the drug
increased fluid loss at the site of injection, where it
was held while fluids were lost at the site of injury, and
then returned it to the circulation after the fluid loss
due to injury had reached its peak. Holliman evaluated
the effect of ketanserin, a specific serotonin antagonist,
on burn shock in a pig model and found the ketanserin
treated groups demonstrated improved cardiac index, de
creased pulmonary artery pressures, and smaller arterio
venous oxygen content differences compared to the control
group. Donati et al.(83) have reported on the marginal
effectiveness of the administration of the immunomodula
ting agents methysoprinol and timostimoline in partially
restoring neutrophil function. Ishizawa et ale (84) have
used thymosin to reverse the T lymphocyte depression seen

39
acutely postburn.
Another management approach is to alter the internal
burn environment. In altering the environment, treatment
possibilities include either plasmapheresis or hemodialy
sis to remove the various circulating toxins. Warden et
al. (85) have presented preliminary results using plasma
exchange therapy in 21 patients not responding to conven
tional burn management. Plasma exchange was initiated
for a) fluid resuscitation failure, b) massive myo
globinuria following electrical injury, c) metabolic ex
haustion, d) acute respiratory distress syndrome fol
lowing delayed resuscitation, and e) documented sepsis.
In all patients, clinical values returned toward normal
as a result of plasma exchange. Among the 5 groups, the
most spectacular results were seen in the inadequate re
suscitation group. Preliminary work by Ninnemann(80) in
the same group of patients suggests that this procedure
also corrects at least some postburn immunologic prob
lems. A brief report by Baxter(85) utilizing exchange
transfusion in pediatric burn patients not responding to
conventional fluid volumes showed reversal of the fluid
requirements toward normal resuscitation volumes.
The significance of adrenal hormones in response to
burn injury has been detailed in a case study by stratta
et al. (86) of an adrenalectomized patient. This 29 year
old white male's past medical history was remarkable for a

bilateral adrenalectomy performed 13 years earlier for
presumed Cushing's disease. Since that time he had been
maintained on replacement corticosteroids. The patient
presented with a 35.5% TBSA burn, 3.5% of which appeared
to be full-thickness. He also had a serious inhalation 133
injury confirmed by Xenon perfusion scan. This pa-
40
tient demonstrated an inadequate response to fluid resus-
citation and excessive third-space fluid losses, defective
thermogenesis, profound nutritional abnormalities, im-
paired wound healing, and compromised immunologic
function. The patient was discharged 114 days following
injury with nearly complete burn wound closure and normal
range of motion in all extremities.
Pulmonary Factors in the to Thermal Injury
There are two physiologic mechanisms responsible for
the pulmonary response to burn injury. The first is in
response to the hypermetabolism of burn injury and the se-
cond is in response to the direct trauma of an inhalation
injury. Petroff et al.(87) report that uncomplicated burn
patients have a minute ventilation twice that of healthy
normal subjects. This hyperventilation is in large part
due to the increased metabolic demands of the burn patient
since oxygen consumption has been shown to be as much as
twice basal levels.
The second component is due to inhalation of noxious

41
products of combustion. The damage is not from heat, since
air is cooled by the time it reaches the bronchus unless
live steam is inhaled. Inhalation injury refers to direct
insult at the alveolar level secondary to chemical fume or
smoke inhalation. The subsequent response involves inter
stitial edema as the inflammatory process is initiated.
The edema is a diffusion defect which prevents the passage
of oxygen across the lung. No immediate clinical signs or
symptoms are evidenced except by history. The injury
manifests itself as acute respiratory distress syndrome
(ARDS) at 48 to 72 hours postinjury. The initial chest
radiograph and arterial blood gas values will be within
normal limits. The edema is progressive and, since the
lungs have a total surface area of approximately 70
square meters in an adult (88), the amount of sequestered
fluid can be three to five liters. The severity of the
injury is proportional to the concentration and duration
of contact with the noxious agent and is in no way corre
lated with the extent of the TBSA burn. Diagnosis is
made by 133-Xenon lung scan and/or fiberoptic broncho
scopy.
Moylan et al. (89) evaluated the use of 133-Xenon in
measurements of both the perfusion and the diffusion
ventilation phases of pulmonary function in 50 burn pa
tients. They found uniform agreement between the 133-
Xenon scan diagnosis of inhalation injury and patholo-

42
gical finding. The mortality rate in burn patients with
inhalation injury is higher than in those patients with
either injury alone. This series of patients had a 60%
mortality.
Moylan et ale (90) studied a group of 25 burn pa-
tients undergoing fiberoptic bronchoscopy for the purpose
of diagnosing inhalation injury. The positive finding of
injury in 15 of the 25 patients studied revealed the use-
fulness of this technique. Three of the patients with
airway injuries had skin burns of less than 5% TBSA. At
the time of admission, only two patients had symptoms of
ARDS.
Evaporative Water Loss as ~ Factor in the Response to Thermal Injury
One of the major purposes of intact skin is to serve
as a barrier to evaporative water loss from the body.
With major burn injury, this ability of the skin to regu-
late evaporative water loss is totally disrupted. In 1962
Moncrief and Mason (91) attempted to determine the magni-
tude of such a loss. They reported that the use of the
parameter of insensible weight loss in burn patients had
previously been used as an approximation of insensible wa-
ter loss. Using the same parameter and a scale with an
accuracy of ~ 50 g, 19 patients were studied over four
hour time periods. The data revealed evaporative water
loss to be extensive in burned patients, being in the

43
range of 20 times normal in the early phase of injury and
gradually decreasing as wound closure was achieved.
Later studies by Wilmore et al. (58) report that while
present, the evaporative water loss and surface cooling
in the burn patient is not the primary stimulus for burn
hypermetabolism but rather, the hypermetabolic response
is related to endogenous metabolic activity. Vaporiza-
tional heat loss is a route of transfer of this excess
heat from the body. The insensible water loss through
the skin is not from evaporation of water from sweat
glands but from water vapor formed within the body and
lost through the skin (92).
Calculation of the amount of fluid lost via evapora-
tive water loss includes losses from all sources. While
normally the skin is the major source of insensible loss
(75%) and the lungs are minor sources (25%), the amount is
only about 600-800 ml per day. This changes dramatically
with burn shock because not only does the skin's loss in-
crease but so does the lung loss. Hypermetabolism and hy-
perventilation, especially in an intubated patient, may
result in losses up to 1.5 L/day. Replacement of the los-
ses is mandatory to prevent volume deficit. Moncrief (93)
reports a minimum of 2,000 mL/day is necessary for basal 2
requirements, and in larger burns 100 to 150 mL/m BSA/
hour is average in adults. The actual criterion for
evaluation is a serum sodium of 130 to 140 mEq/L since a

level below 130 mEq/L represents overhydration and above
140 mEq/L represents dehydration.
44
Each gram of evaporated water removes approximately
0.58 kcal of heat from the body. If thermal neutrality is
to be maintained, the metabolic rate of the patient must
increase to replace the lost heat. This may be accom
plished, in part, by the shivering seen in burn patients.
This increased heat need may be as much as 3,000 kcal per
day over normal levels. The energy expended for such an
increased demand would reduce that available for other
metabolic functions. Harrison et ale (94) in 1964,
measured simultaneously the insensible water loss and the
metabolic rate of 21 patients with burns of varied se
verity. A strong relationship was found between insensi
ble loss and percent TBSA burn irrespective of whether
the wound was partial- or full-thickness. Both types of
burns are equally poor barriers to water loss during the
early postburn period. This study reported a total water
loss, including urine, insensible loss, and exudate as
2.0 to 3.1 mL/kg/% burn. Roe and Kinney (95) report the
evaporative water loss in two patients with 50% TBSA burn
as about 5 L/daYi this is an expenditure of 2,880
kcal/day merely to maintain a stable body temperature.
They also report the serum sodium level as the most sen
sitive index of water balance. Birke et ale (96)
measured evaporative water losses exceeding 7 L/day in a

45
group of 17 burn patients with the highest losses occur
ring during the first days after injury. During the ini
tial stage, fluid was lost directly as exudate from the
wound as well as via increased evaporation from the in
jured epithelium. Lamke and Liljedahl (97) studied 16
burn patients and found that evaporative water loss from
normal, intact skin in burn patients was not altered.
First degree burns emitted as little water as normal
skin. Thus, in calculating fluid requirements, areas of
partial- and full-thickness injury are the basis of the
formula. Lamke (98) also reports that evaporative water
loss can be minimized by maintaining environmental condi
tions at a warm (32 degree C) and relatively humid (25%)
setting. The patient's core body temperature should be
maintained at 38 degrees C and shivering avoided.
Zawacki et ale (99) report that application of a water
proof film to the burn wound was associated with a marked
reduction in insensible weight loss but no significant
change in the elevated metabolic rate. Carnes et ale
(100) report increased evaporative water loss as a phe
nomenon which continues even after the wound is clinical
ly healed.
The cumulative information on evaporative water loss
made it apparent that the loss was of significant clinical
importance. Only by the administration of large volumes
of fluid could the burn patient maintain fluid balance. A

46
formula was developed for the purpose of estimating the
volumes of fluid which might be required to replace eva-
porative water loss (see page 89 for further discussion).
The type of fluid administered depends upon the patient's
serum sodium content, acid-base balance, general electro-
lyte status, and renal function. The route of fluid ad-
ministration depends upon the patient's ability to ingest
fluids, either orally or via an enteral feeding tube to
the duodenum, after resolution of the paralytic ileus as-
sociated with major thermal injury. Initially, all fluid
is administered by the intravenous route.
Resuscitation of Burn Shock
Burn shock and its associated hypovolemia have been a
recognized component of burn care since 1930. The princi-
pIes of burn shock therapy have been aimed at supportive
rather than therapeutic interventions; that is, the goal
of treatment is to support the patient's cardiovascular
system with large volumes of fluid until burn shock
ceases. This treatment, while usually effective, is not
effective for all patients. A 1980 survey of burn survi-
val by Curreri et ale (101) reports that 15% of 75 deaths
in a population of 937 burn patients were the result of
irreversible burn shock. Baxter (102) in 1981 reported
on 954 patients with 54 deaths occurring in the first ten
days postburn. Thirty-two of the 54 patients died within
the first 24 hours postburn and 37 died within the first

47
48 hours. Sevitt (103) in 1972, reported 12% of 156 burn
deaths as due to early shock or cardiac failure. Deaths
due to burn injury represent a significant societal prob
lem since Artz and Yarbrough (104) report there were 7,645
deaths due to burn accidents in the United States in 1960.
The extent of the TBSA involved is the single most impor
tant factor influencing prognosis and treatment. Baxter
(105) states patients with zero to 20% burns do not have
to be resuscitated at all. With most burns in the physio
logic age range, between 20 and 35% volume restoration of
almost any kind, so long as it contains electrolytes, will
suffice. Where optimal resuscitation, which Baxter de
fines as restoration of all physiologic systems at the
earliest possible time, becomes critical is in the 35 to
60% burn. In burns exceeding 65% TBSA, other factors in
fluence ultimate survival.
There are two components to fluid resuscitation for
mulas: The volume/time and the chemical content of the
fluid administered. Caldwell(106) states that almost any
solution containing sodium will serve to adequately resus
citate young and healthy patients. This fact does not
help to define the ideal salt and water combination. The
need for fluid has been well-established since death soon
occurs in patients with large burns but without admini
stered fluid. Leape (107), in assessing the volume/time
factor, reported that the initiation of early fluid resus-

48
citation improved survival in a rat study. untreated rats
with a 50% TBSA burn all died by 24 hours, 92% by 12 hours
postburn. Mean survival time in untreated animals was 7.4
hours. The administration of fluid at four hours improved
survival time but was less than half the effect of giving
fluid within the first hour. Animals given 30% body
weight of fluid did better than those given 20%.
Recognition of the necessity for large volumes of re
suscitation fluid has resulted in a great decrease in the
early mortality of burn patients. Since the 1940s, formu
las for burn resuscitation have been based on several
pathophysiologic observations. First, immediately fol
lowing thermal injury, there begins a rapid leakage of
fluid from the vascular space into the interstitium. This
fluid loss is greatest during the first six to eight hours
postburn, after which it gradually declines so that by 24
to 36 hours postburn, capillary integrity is generally
restored. While capillary leakage following minor burns
in localized to the wound area, burns involving greater
than 25% TBSA result in systemic leakage and total body
edema. Isotope dilution studies (26) have demonstrated
loss of up to 50% of the effective extracellular fluid
(ECF) volume during unresuscitated burn shock (5). The
initial disruption of capillary integrity permits even
large protein molecules to permeate freely into the inter
stitium (27). For this reason, colloid-containing resus-

49
citation solutions are usually withheld until the restora
tion of capillary integrity at 24 to 36 hours postburn, at
which time colloids may be effective in reexpanding the
vascular compartment. The key ingredient of all resusci
tation fluid appears to be the sodium ion, and various re
gimens have been shown to be effective in treating burn
shock in proportion to their sodium content. Bull (108)
reports there are several successful fluid regimens
varying greatly in sodium content, both absolutely and rel
atively to water. The underlying problem remains that
the circulatory volume needs to be maintained in spite of
a continuing leak. When the volume is replaced as free
water, water intoxication occurs. It is now known that
sodium enters cells as the sodium-potassium pump becomes
dysfunctional. This theoretically explains the tremen
dous salt load necessary in the burn shock period to pre
vent hyponatremia. In addition, Moncrief (109) reports a
precipitous drop in cardiac output, to about 50% of
resting normal values, precedes any measurable change in
blood or plasma volume. Thus, the time after injury when
cardiovascular support is necessary for survival is far
shorter than would be expected based on the factor of
capillary permeability alone. Moylan et ale (110) showed
that the untreated burn dog model had cardiac outputs of
30% of normal by six hours postburn. This study also
found the sodium dosage and the water dosage of resusci-

tation fluids to be independent determinants of early
restoration of cardiac output.
50
The clinical criteria for the amount of fluid admini
stered is urine output. Pruitt (Ill) is in agreement with
other sources when stating the resuscitation fluid regimen
is adjusted to obtain 30 to 50 mL of urine per hour in the
burned adult. Greater hourly urine outputs are achieved
at the expense of additional edema formation.
There are many resuscitation formulas. The first
established formula was the Evans formula, followed by
the Brooke formula. The one most widely used at the cur
rent time is the Parkland formula. The hypertonic saline
method is used in some institutions as is the hypertonic,
albuminated fluid-demand (HALFD) method. A British
model, the dextran saline method or Mount Vernon formula,
has also also been used in some burn centers. As reported
by Baxter et ale (112), the various regimens have in com
mon an almost identical quantity of isotonic volume for
each percent TBSA of injury. However, they differ widely
in the ratio of colloid to crystalloid volumes and in the
time intervals recommended for effective administration.
Burn shock differs from other types of hypovolemic shock
in that it is primarily due to a loss of plasma rather
than whole blood. In fact, hemoconcentration occurs as
the less viscous fluid exits and leaves behind only red
blood and white blood cells.

51
The hourly rate of fluid replacement depends on the
specific resuscitation formula used to treat the patient.
But, as Rogenes and Moylan (113) report, the formula is
only a guideline. Observation of the patient for signs of
fluid deficit or overload and electrolyte imbalance, com
bined with an understanding of the physiological conse
quences of thermal injury is essential for the nurse to
regulate the fluid replacement. For, while the basic
fluid therapy in major burns is prescribed by the physi
cian, the amount of fluid administered each hour becomes a
nursing deoision.
The Evans formula (114) is a crystalloid and colloid
formula with both products being given throughout the 48
hour period postburn. The formula was derived from a pro
spective resuscitation study of 68 burn patients. During
the first 24 hours, colloid in the form of dextran 70 in
normal saline solution is administered at the volume of 1
mL/kg/% TBSA burn/24 hours along with the crystalloid in
the form of normal saline at a volume of 1 mL/kg/% TBSA
burn/24 hours. In conjunction with this, the patient is
given 2,000 mL of 5% dextrose in water (D5W) over the 24
hour period. Half of the fluid is given in the first
eight hours postburn and the other half is given over the
subsequent 16 hour period. In the second 24 hours, the
colloid and crystalloid are given at a rate of 0.5 mL/kg/%
TBSA burn/24 hours with the amount of maintenance fluid

S2
remaining at 2,000 mL of DSW over the 24 hours. The maxi
mum calculated burn is to be SO% TBSA.
The Brooke formula (lIS), which is also a crystalloid
and colloid formula, is a modification of the Evans formu
la. The colloid is administered in the form of plasma at
a rate of O.S mL/kg/% burn/24 hours. The crystalloid, in
the form of lactated Ringer's solution, is administered at
a volume of 1.5 mL/kg/% burn/24 hours along with mainte
nance water of 2,000 mL D5W over 24 hours. Half of the
fluid is given in the first eight hours and half during
the next 16 hours. During the second 24 hours, the col
loid is administered at a volume of 0.25 mL/kg/% TBSA/24
hours and the crystalloid at 0.7S mL/kg/% TBSA burn/24
hours. The maintenance water volume remains at 2,000
mL/24 hours. The maximum burn size to be calculated is
SO% TBSA.
Hutcher and Haynes (116), in comparing the two
formulas find the difference to be mainly in the ratio of
crystalloid to colloid, the Evans being 1:1 whereas the
Brooke is 3:1. Both formulas require similar amounts of
sodium and both use SO% TBSA as the maximum calculated
burn. ReekIer and Mason (117) evaluated the records of 50
burn patients resuscitated with the Brooke formula and
found that while this formula satisfactorily predicted the
clinically required volume administration in burns smaller
than SO%, larger burns on the average required in excess

53
of the predicted amounts.
The Parkland formula (4) utilizes Ringer's lactate at
a volume of 4 mL/kg/% TBSA burn for 24 hours postburn. No
colloid is administered. One half of the fluid is given
in the first eight hours postburn and the second half is
given over the subsequent 16 hours. The calculation is by
absolute percent of burn with no IImaximum calculation. 1I
In the second 24 hours, D5W is administered at a rate to
maintain the serum sodium at 140 mEq/L. Plasma is given
between 24 and 30 hours postburn in the following amounts:
40-50% burn, 250 to 500 mL: 50-70% burn, 500 to 800 mLi
and greater than 70% burn, 800 to 1,200 mL with rapid in
fusion (118). Baxter (119), in a retrospective analysis
of 438 adult burn patients, found the formula to accurate
ly predict the fluid requirements at 4 mL (+0.3 mL)/kg/%
TBSA burn/24 hours in 70% of the cases. The use of
Ringer's lactate rather than the previously reported nor
mal saline was of concern in that it could theoretically
aggravate the existing lactic acidosis of shock. Canizaro
et ale (120) performed 639 lactate and pyruvate determina
tions in 84 patients resuscitated with Ringer's lactate.
The findings included a significant decrease in lactate
and excess lactate levels and a return toward normal of pH
and base excess values during the period of shock while
Ringer's lactate solution was being infused.
The amount of edema formation with the previously

54
discussed formulas is massive. Efforts to deliver the re
quisite salt in a smaller volume of water resulted in the
development of a hypertonic resuscitation formula. The
fluid used contains 250 mEq of sodium/L and is admin
istered during the first 24 hours at a rate to maintain
urine output at 30 to 40 mL/hour. In the second 24
hours, one-third isotonic salt solution is administered
orally. No colloid is given during the 48 hour period.
If possible, the isotonic salt solution is administered
orally; either way, fluid intake is restricted to 3,500
mL in the second 24 hours. Monafo et ale (121) report
that the initial hypertonic sodium solution contained 300
mEq sodium/L but that this caused hypernatremia with
serum sodium levels greater than 165 mEq/L and alkalosis.
Subsequently, the solution is now intended to contain 250
mEq/L of sodium, 150 mEq/L of chloride, and 100 mEq/L of
racemic lactate. Moylan et ale (122) compared hypertonic
lactate saline solution with isotonic resuscitation ac
cording to the Brooke formula in a dog model and found
that the hypertonic resuscitation produced natriuresis
and no gain in weight. Shimazaki et ale (123) measured
body fluid changes during hypertonic lactated saline
(HLS) solution therapy for burn shock in 12 patients com
pared to 26 patients receiving Ringer's lactate and col
loid solutions. While finding that the total infusion
volume during the first 48 hours postburn in the HLS

55
group was only one-half to two-thirds of the other group,
the intrinsic complications of hyperosmolarity and hyper
natremia were of clinical significance. Caldwell et ale
(124) treated 13 burn patients with a solution containing
300 mEq/L of sodium, 100 mEq/L of chloride, 200 mEq/L of
lactate, and an osmolality of 600 mosm/L. The total
volume of fluid given in the first 48 hours was 23% less
and the sodium load administered 86% greater than would
have been given using the Brooke formula. All patients
developed hypernatremia and increased serum osmolality.
Fox (125) administered solutions containing from 75 to
300 mEq/L of sodium in various dosages to scalded mice
and found a wide range of solutions was effective. The
most effective solution appeared to be composed of 225
mEq/L of sodium. Hypotonic solutions were less effective
at all dosage levels.
A modification of the hypertonic resuscitation is the
use of a hypertonic, albumin-containing fluid demand regi
men (HALFD). This method, as described by Jelenko et ale
(126), consists of a resuscitation fluid composed of a 240
mosm/L hypertonic fluid plus 12.5 giL of albumin. A com
parison between randomly selected groups of burn patients
resuscitated using hypotonic fluid alone, hypertonic fluid
alone, or hypertonic plus albumin resulted in the latter
group requiring smaller amounts of resuscitation fluid.
The parameter evaluated was mean arterial pressures.

56
A British formula for fluid resuscitation (127) re
ports a formula calculated upon (percent TBSA burn x
weight in kg) divided by 2. This volume is given in each
of the following successive periods: four hours, four
hours, four hours, six hours, six hours, 12 hours over
the first 36 hours postburn. This formula, the Mount
Vernon formula, recommends the use of reconstituted dried
human plasma as the main transfusion fluid (128). Al
though the fluid of choice is plasma, Dextran 70 in nor
mal saline or Hartmann's solution can be used if neces
sary. The goal is 50 to 100 mL/hour of ~rine output.
This formula is predictive of much less total volume than
any other currently used formula.
Hall and Sorensen (129) treated 43 patients for burn
shock by fluid resuscitation using a dextran saline solu
tion in 21 patients and Ringer's lactate in 22 patients.
They found the volume of fluid intake over the first 48
hours was the same in both groups. Hemoconcentration was
much greater in the Ringer group, but acid-base balance
was restored to normal more rapidly than in the dextran
group. No clinical differentiation could be made between
the progress of the patients in the two groups.
It becomes apparent that in the clinical setting
there are a variety of fluid resuscitation formulas which
enable clinicians to bring patients through burn shock.
All formulas stress that they are guidelines only; the

57
hourly volume of fluid administered is determined by the
clinical parameter of urine output and that is kept to a
minimum of 30 to 50 mL/hour. Even so, the volumes of
fluid administered are extremely large. For example, the
Parkland formula of resuscitating a 70 kg patient with a
50% TBSA burn would predict a fluid need of 14,000 mL in
the first 24 hours postburn. Patients with burns greater
than 60% TBSA may require 20 to 30 L of intravenous fluid
during the first 24 hours. The hypovolemic burn shock is
the problem but the iatrogenic complications are also a
problem. The massive edema associated with burn shock
resuscitation can lead to mechanical airway obstruction
necessitating tracheal intubation, increased severity of
the interstitial pulmonary injury associated with inhala
tion injury, prolonged ileus with bowel wall edema, com
promised circulation to the extremities necessitating
escharotomy or fasciotomy, and to a rapid depletion of
serum protein with resultant lowered albumin levels. In
addition, edema has been demonstrated to impair wound
healing secondary to decreased oxygen tension at the cel
lular level. At the end of the resuscitation period,
mobilization of fluid can cause cardiac congestion and
pulmonary edema. In addition, a major cause of mortality
in patients with very large burns is failure to resusci
tate.
These reported investigations reveal that the in-

58
ternal milieu in which various cellular components of the
body must exist is drastically altered following thermal
injury. Although thermally injured patients demonstrate
altered cellular function, these abnormalities can be re-
turned to normal when the cell is removed from the burn
environment. Clinically it is impossible to remove these
cells; thus, therapeutic intervention has to be aimed at
returning the burn environment to normal. This concept
indirectly supports the use of plasma exchange as poten-
tially beneficial in removing circulating toxic sub-
stances thereby returning the cellular environment toward
compatibility with homeostasis.
Plasmapheresis as ~ Therapeutic Intervention
The removal of plasma and the return of cellular
components of the blood was first described by Abell et
ale in 1913 to relieve uremia in bilaterally nephrec-
tomized dogs (7). The term pheresis derives from a Greek
word, aphairesis, which means "taking away (6)."
Although the procedure is commonly referred to as plasma-
pheresis, plasma exchange is a better term for the pro-
cedure as used in burn patients since the volume of re-
moved plasma is replaced with an equal volume of fresh
frozen banked plasma. In the past, small scale whole
blood exchange was carried out using manual exchange.
During the Twentieth Century, this technique of whole

59
blood exchange revolutionized the management of hemolytic
diseases of the newborn. Ten years have elapsed since
the introduction of in vivo blood cell separators into
clinical medicine. These machines were initially de
veloped for the collection of granulocytes and platelets
from normal donors; however, their availability in gen
eral hospitals has led to their therapeutic use in a wide
range of medical conditions. Current technology now al
lows two liters of plasma to be exchanged per hour.
Linker (130) describes a plasmapheresis procedure as
performed on a continuous flow cell separator. Blood is
removed from a patient and anticoagulated with a citrate
solution. The blood then enters a centrifuge and is
separated into cellular components and plasma. The cel
lular components are returned to the patient along with
the replacement fluid of choice. The plasma is collected
in a reservoir. The amount of the large-volume plasma
exchange is a factor which has to be individualized to
each patient. Plasma volume in humans is normally 40
mL/kg of body weight. By exchanging increasing numbers
of plasma volume, Linker reports an intravascular marker
will be depleted to an increasing extent (Table 1). A
plasma exchange of 1.5 times the calculated plasma volume
will deplete an intravascular substance by about two
thirds. Exchanging a larger volume gives small addi
tional yield. An assumption implicit in these con-
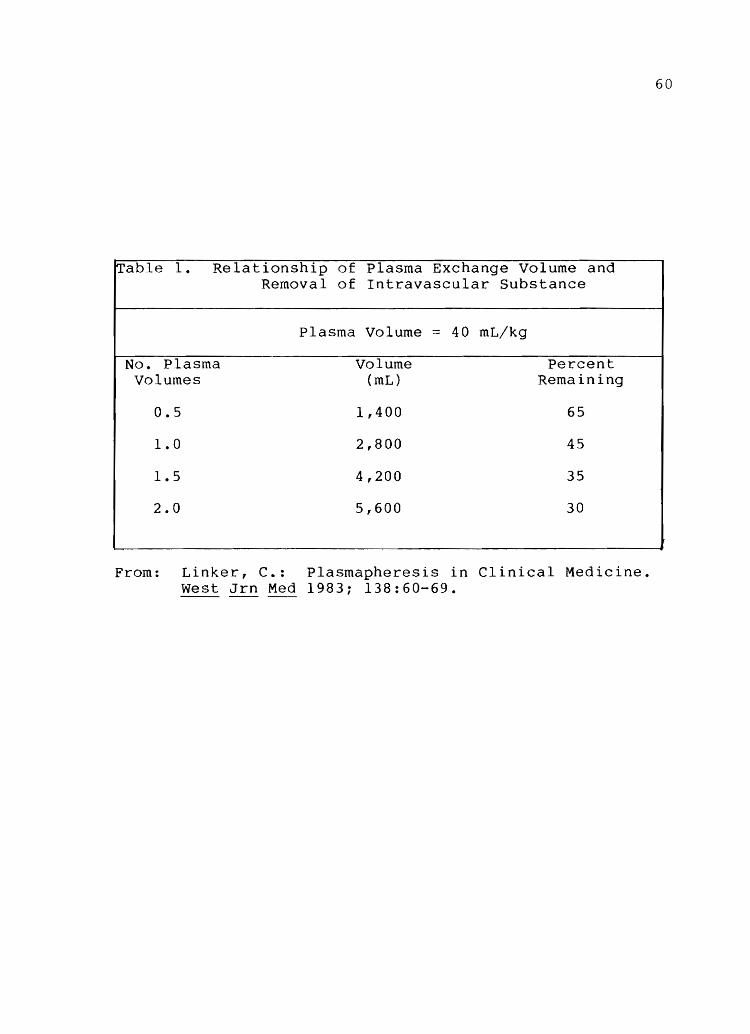
60
Table 1. Relationship of Plasma Exchange Volume and Removal of Intravascular Substance
Plasma Volume ::: 40 mL/kg
No. Plasma Volume Percent Volumes (mL) Remaining
0.5 1,400 65
1.0 2,800 45
1.5 4,200 35
2.0 5,600 30
From: Linker, C.: Plasmapheresis in Clinical Medicine. West Jrn Med 1983; 138:60-69.

elusions is, as Berkman (131) reports, that no net shift
occurs between the extravascular and intravascular space
and that there is no further major synthesis of the fac
tor being removed.
61
Taft (132) reports the most efficient pheresis proce
dures are those involving cells of density significantly
less than that of the predominant erythrocyte population.
In plasma exchange, the extent of depletion of components
not present in the replacement fluid depends on the rate
of replacement, their extravascular concentration and syn
thetic rate. Since apheresis procedures have access only
to the intravascular compartment, the success of the
treatment is largely related to volume of blood processed
and the rapidity with which clearance occurs.
As reported by Linker (130), plasmapheresis is a
field of medicine that has been created by the availabili
ty of a new technology. There are currently three dif
ferent pieces of equipment designed for on-line cell
and/or plasma separation, procurement, or removal. Sil
vergleid (133) lists these as Haemonetics' Model 30 (Hae
monetics Corp., Braintree, Mass.), IBM's 2997 (IBM Bi
omedical Systems, Princeton, New Jersey), and Fenwal's CS
3000 (Fenwal Laboratories, Deerfield, Illinois). All
three are designed to create an interface between dif
ferent constituents of the blood based on the differen
tial effect of centrifugation, and to effect collection

and/or removal of the desired component based on har
vesting at that interface. The Haemonetics Model 30 re
lies on a disposable bowl in which separation occurs; is
an operator-dependent function; and is a discontinuous,
or intermittent procedure. The procedure can be per
formed through one venipuncture. Both the IBM 2997 and
the Fenwal CS 3000 are based on continuous flow. In ad
dition, the IBM is partially, and the Fenwal almost com
pletely, automated and therefore less dependent upon
operator judgment. Two venipunctures are necessary to
perform the continuous exchange.
62
Despite the design of the unit, the potential for
operator error exists. This is a relatively new procedure
often performed by inexperienced personnel. Werynski et
ala (134) report that setting the plasma flow rate above a
certain critical value can result in hemolysis. The
physical feature of hemoconcentration is a significant
variable in this excessive value. Wiltbank et ala (135)
and Malchesky et ala (136) in an attempt to overcome
plasmapheresis based on centrifugation and thereby
limited in efficiency by the sedimentation rate blood
cells, developed a new approach using cross-flow filtra
tion. By using a microporous membrane, having pore
dimensions between 0.4 and 0.8 um and flowing the blood
across a laminar field parallel to the membrane while
maintaining a positive transmembrane pressure, plasma
63
filtration without red blood cell damage and/or membrane
clogging occurred. The problem with the system was the
time necessary to accomplish even a small plasmapheresis;
it was found not to be of value with large-volume ex-
changes. Filters with specific macromolecular weight
cut-offs are also being evaluated. Kayashima et ala
(137) conducted an evaluation of three kinds of hollow
fiber type membrane filters used as a second stage mem-
brane filtration unit in an effort to return essential
substances. They found they could, in fact, return sub-
stances such as albumin to the patient. This preliminary
work demonstrates the possible clinical application of
selective removal filters and the need for further re-
search. This area of research, referred to as cascade
filtration, is being actively pursued. Gurland (138) re-
ports a tremendous decline in the membrane surface area
of plasma filters. Early models had a membrane surface 2
area of 6,500 cm i the smallest currently available com-
mercial devices (Dideco, Travenol and Cobe) require only 2
about 1,500 cm. The clinical significance is related to
the amount of blood in the filter at any given time and
to cost.
The increasing availability of cell separators has
made it possible to investigate the use of large-volume
plasma exchange to modify diseases associated with high
levels of circulating antibody or antigen-antibody com-

64
plexes. Jones (139) reports a large variety of sizes of
immune complexes and that some complexes may be more
harmful than others. At the present time, the state of the
art is that molecular weight alone determines upon which
side of the membrane filter a cell will locate. Feng
(140) reports that the American Red Cross currently lists
61 disease states treatable by therapeutic plasmapheresis,
and the list is still expanding. The majority of reports
about the use of plasmapheresis are highly anecdotal, and
there is a paucity of controlled trials. Kleit (141) in
an editorial, states that randomized controlled studies in
apheresis will be expensive, complicated, time consuming,
and possibly lethal to some patients. Some of the issues
to be resolved, as reported by Wenz and Barland (142), in
clude patient selection; frequency, intensity, and dura
tion of the procedure; amount and type of replacement
fluids; serological monitoring, and outcome criteria for
continued use.
The use of plasmapheresis in clinical practice in
cludes its use by Wood et ale (143) for two patients with
refractory myasthenia gravis, one rhesus-sensitized woman,
one procedure to diminish the anti-A titre in a patient
requiring bone marrow transplant, and one procedure for S
concentration reduction of a sickle cell disease patient.
This group reported improvement and no complications asso
ciated with plasma exchange. Valbonesi et ale (144) re-

65
port that patients with high titers of circulating immune
complexes are most likely to benefit from plasmapheresis.
seventeen patients with immune complexes were plasma
pheresedi prepheresis, 14 of the patients had high complex
levels while three patients had no evidence of circulating
immune complex. The 14 high circulating level patients
showed clinical and immunochemical improvement postphere
sis while the other three patients showed no change.
Blacklock et ale (145) have treated 26 patients with Good
pasture's Syndrome or dysproteinemias and concluded that
the clinical improvement warranted the exchanges. Wenz
and Rubinstein (146) treated one patient with acquired
agammaglobulinemia and produced a clinical remission of
five month's duration. Robinson and Tovey (147) treated 14
high-risk cases of Rh alloimmunized women with intensive
plasma exchange throughout their pregnancies in weekly
procedures. Successful outcome was achieved in nine of
the 12 cases. Ginder et ale (148) used plasma exchange
three times in a patient with mixed cryoglobulinemia with
some success until the patient's death. Hepatic failure
has been treated by Fujita et al. (149), Kayashima et al.
(150), and Smith et al. (151) with mixed success in small
groups of patients. Evans et al. (152) discuss a case
study of the successful use of plasmapheresis in a patient
with systemic lupus erythematosus. There are a variety of
other reports but, as previously stated, the data is from

66
much too small a sample to be the basis for conclusions.
Silvergleid (133) reports five general categories, based
on the mechanics of the disease, which might theoretically
benefit from plasmapheresis. These are diseases asso
ciated with a) abnormal (or excess) plasma proteins,
toxins, or metabolic products; b) autoantibodies; c) al-
10antibodies; d) immune complexes; and e) miscellaneous
disorders.
Complications of plasmapheresis have been reported
to occur infrequently. Linker (130) reports that fi
brinogen, the third component of complement (C3), and im
mune complexes are depleted 75 to 85% after a 1.5 volume
exchange. Immunoglobulins are removed with a 65% deple
tion. Electrolytes, uric acid, and selected proteins
such as factor VIII are removed very inefficiently. Ery
throcyte loss is predicted to be in the range of 30 mL
per procedure. The platelet count will often be slightly
reduced, but thrombocytopenia to levels less than 50,000
ul occurs in about 10% of cases (130). Complications may
also attend the infusion of large amounts of plasma.
Silvergleid (133) identifies the possibilities of citrate
toxicity, cardiac arrhythmias, hepatitis, anaphylaxis,
and hemolysis. Also mentioned is the fact that approxi
mately 24 deaths directly attributable to plasma exchange
have been reported. The source is a personal communica
tion and no further information is provided. Huestio

67
(153) in an editorial, reports 42 deaths that seem to
have been associated with hemapheresis. Sixteen of these
deaths occurred in the United States, 20 occurred in
France, three occurred in Canada, and three in other
countries. The replacement fluid was either albumin (6
cases), fresh frozen plasma (23 cases), or both (7
cases). The major causes of death are cardiac, respira
tory, or anaphylactic.
McLeod (154) discusses the immunologic factors in
blood transfusions as consisting of two distinct etiolo
gies when plasma is the solution being infused. First,
the plasma can serve as a source of antibodies that may
react with cells in the recipient's bloodstream (intravas
cular hemolysis). In addition, plasma proteins may serve
as a source of antigen thus leading to the potential for
antigen-antibody reactions in subsequent transfusions.
Hepatitis is also a risk factor associated with transfu
sion.
The anticoagulant used in the tubing of most plasma
pheresis machines is an acid citrate dextrose (ACD) solu
tion, a solution known to bind serum calcium. Watson et
ale (155) and Morse et ale (156) have reported decreased
ionized calcium during therapeutic plasma exchange. Hypo
calcemia may lead to a decrease in the strength of cardiac
contractions. The problem is manifested on the electro
cardiogram as a lengthening of the QT interval and is as-

sociated with fibrillation.
Hypokalemia has also been reported in association
with plasma exchange. This problem is mani sted on the
electrocardiogram as a prolonged PR interval, low ampli
tude T-waves, premature ventricular contractions, and
fibrillation. Hypotension associated with hypovolemia
can occur if blood is removed from the patient too
rapidly.
68
Access sites and the tubing itself are also potential
sources of complications. The tubing itself may become a
source of free air leading to air embolus if there are
leaks in the system. In addition, severe uncontrolled
hemorrhage occurs if the access tubing becomes disconnec
ted from the plasmapheresis machine tubing. Sterile
technique is practiced at all interfaces between the pa
tient and machine to prevent bacterial contamination.
Crismon (157) reports that plasmapheresis is a new
type of therapy that holds promise for the treatment of an
array of critical disorders. Considered experimental un
til recently, the procedure's impact upon critical care
nursing is growing, as nurses become involved in the
treatment of plasmapheresis patients. The critical care
nurse must be prepared to continuously monitor the pa
tient's status during the procedure. Crismon states that
the critical care nurse normally monitors the patient's
condition and carries out nursing duties while another
69
person (a nurse or technician) who has received special
training in operation of the pheresis equipment performs
the treatment. Cona(158) reports that pheresis operators
are usually trained at the facility where they will be
working. The training is generally supplied by the
company from which the instrument is purchased.
Plasma Exchange in Burn Patients
There is currently only one burn center performing
plasma exchange in burn patients. Clinical evaluation of
plasma exchange was begun at the Intermountain Burn
Center, Salt Lake City, Utah, in 1979. Initial results of
this experience were published by Warden (85) and Warden et
al. (159) in 1983. Plasma exchange in burn patients was
performed on a group of patients when they failed to re
suscitate from burn shock using conventional therapy. Ir
reversible burn shock results from failure of fluid resus
citation and is almost invariably fatal. Because of the
implied role of circulating serum factors in the genera
tion of burn shock, the use of plasma exchange was
evaluated retrospectively in patients with major thermal
injuries who had failed to respond to conventional therapy
and had undergone plasma exchange.
Twenty-two patients with a mean burn size of 47.9%
TBSA and a mean age of 22.7 years underwent exchange for
ongoing burn shock after standard fluid resuscitation
failed. Fourteen of these patients were adults and under-

70
went plasma exchange; eight of the patients were children
who underwent exchange transfusion Qfwhole blood and
platelets. A therapeutic response was documented in
95.4% of the patients. The improvement was characterized
by a sharp decrease in fluid requirements from a mean of
260% above the predicted hourly volume to within calcu
lated requirements by 2.3 hours following the exchange.
Markedly improved urine output and resolution of lactic
acidosis were also demonstrated. No major complications
occurred.
The results of this study demonstrated that an al
tered internal environment exists following thermal in
jury. Whether the mechanism of action of plasma exchange
involves the removal of circulating toxic factors, the re
plenishment of specific deficiencies, or a combination of
the two remains to be determined. Conclusions from this
study were: a) plasma exchange can be performed safely in
critically injured burned patients; b) plasma exchange ar
rests ongoing burn shock through an as yet undefined
mechanism resulting in a dramatic reversal of fluid re
quirements, a brisk diuresis, a resolution of lactic aci
dosis, and a restoration of capillary integrity; and c)
plasma exchange facilitates resuscitation from burn shock
in a select group of patients who do not respond to con
ventional volume therapy.
Although this report is preliminary and involves a
71
heterogeneous patient population without adequate con
trols, the return toward normal of various clinical para
meters in nearly all of these patients was encouraging.
Plasma exchange in order to provide a potential alterna
tive in burn shock resuscitation by returning the altered
internal milieu toward normal was indicated. The nurse
administering the fluid volume would need to determine the
effect of plasma exchange on the fluid requirements.
Thus, a reseach question arises: Does plasma exchange
performed during burn shock alter the predicted resuscita
tion fluid requirements a burn nurse may expect to deliver
to a patient in burn shock?
Summary
Burn shock appears to consist of both a hypovolemic
and a cellular component. Hypovolemic shock results from
an increase in capillary permeability which begins with
the onset of thermal injury and persists for approximately
24 hours postburn, even when supportive therapy in the
form of fluid resuscitation is provided. Investigations
have documented the release of many mediators of the in
flammatory response which may play roles in the cardiovas
cular response to burns. These include vasoactive amines,
metabolic hormones, products of arachidonic acid metabo
lism, kinins, polypeptides, endotoxin, fibronectin, and
others. Evidence suggests that with onset of the burn

72
wound, cellular metabolism is also disrupted. This re
sults in altered membrane permeability and loss of normal
electrolyte homeostasis associated with the flux of sodium
and water into the cells and the loss of intracellular po
tassium. This cellular effect may be the pathophysiologic
process responsible for the genesis of burn shock. These
circulating factors altering fluid dynamics not only ef
fect the capillary permeability but also lead to decreased
vascular colloid osmotic pressure and a deranged capillary
hydrostatic pressure. The result is an excess of fluid in
the interstitial space in the form of edema and a de
creased circulating volume. Also, the many circulating
factors present in burn serum may play a reciprocal
role in the generation of the cellular abnormalities ob
served.
Preliminary investigations into plasma exchange in
the treatment of burn shock inpatients who have not
responded to conventional management report marked im
provement in several clinical settings, including refrac
tory resuscitation failure, acute respiratory distress,
myoglobinuria associated with major electrical injury,
and the syndrome of metabolic exhaustion or presepsis.
In treating patients suffering resuscitation failure,
plasma exchange has demonstrated an immediate decrease in
fluid requirements, resolution of lactic acidosis, and a
return to a normal resuscitation schedule.
73
The current paradigm of supportive burn therapy as
sumes that optimal care consists of the administration of
fluids at the same rate and in the same volume and compo
sition in which they are lost. This paradigm is outdated
in view of advances in knowledge and state of the art
technology available. A therapeutic paradigm imvolves
restoring cardiovascular and physiological integrity as
early as possible postburn. The combination of plasma
exchange with supportive therapy is the treatment para
digm supporting this study.

CHAPTER III
DESIGN AND METHODOLOGY
This chapter will present the design and methods of
procedure.
Design
The design chosen to answer the research questions
of this study was experimental with random assignment of
14 consenting burn subjects to one of two treatment
groups. One group of subjects received standard resusci
tation according to the Parkland formula. A second group
of subjects received standard resuscitation in con
junction with plasma exchange as the independent var
iable.
Methodology
Subject Selection
All patients between 15 and 60 years of age admitted
to the Intermountain Burn Center and suffering acute
burns of greater than or equal to 40% TBSA were con
sidered for inclusion as subjects in the study. Because
of the difficulty in estimating burn size in outlying
hospitals, no patient was admitted to the study as a sub-

ject prior to initial evaluation in the burn center it
self. Estimation of burn size was carried out using the
Lund and Browder Chart (Appendix A) and included esti
mates of both partial- and full-thickness burns. To be
included in the study, subjects had to have burn wound
involvement of 40% or greater TBSA injury.
Human Subjects
Human subjects· approval was obtained from the Hu-
man Subjects Committee of the University of Utah Medical
Center prior to data collection. Upon arrival at the
75
burn center, the extent of the wound was determined and
standard burn care initiated. After determining that the
patient had a burn injury of 40% TBSA or greater, the pa
tient and family were interviewed by a burn physician for con
sent to participate in the study. Informed consent from
the patient and next-of-kin was necessary for the patient
to be included in the study. Consent was obtained using
a specially written consent form which had been approved
by the Human Use Committee of the University of Utah
Medical Center. The consent form included descriptions
of both the invasive monitoring and of the plasma ex-
change procedure to be performed. No claims of docu-
mented efficacy for plasma exchange therapy were made.
Risks were explained verbally and in writing. Patient
participation was voluntary with the option to withdraw
from and/or ask questions about the study at any time.
Anonymity was maintained. In addition, the subjects were
told that if they were entered into the control group and
subsequently showed evidence of resuscitation failure,
they would have the option of undergoing plasma exchange
as a therapeutic procedure.
Because this study involved legally minor subjects,
the consent for entry into the study was signed by the
legal next-of-kin when the patient's age was 15 to 18
years.
Complications and Risks of the Study
The risks associated with participation in the study
were essentially threefold: complications associated
with placement of catheter lines, complications asso-
ciated with the plasma exchange procedure, and complica-
tions associated with the drawing of blood samples.
The complications associated with placement of the
two additional lines directly related to the study were
identified as a risk. The Swan-Ganz catheter was placed
for monitoring of cardiac parameters and obtaining mixed
venous blood gas samples; the additional l4-gauge venous
line was placed for the plasma exchange procedure access.
Both of these lines were placed under the direct supervi-
sion of one of the physician-directors of the Burn Cen-
ter. Potential risks from Swan-Ganz catheter placement
in any patient include pneumothorax, hemothorax, hydro-
76

thorax, arterial puncture, cardiac tamponade, and ar
rhythmias secondary to placement of the catheter. All of
these complications are exceedingly rare. In order to
minimize their occurrence further, an effort was made to
place all catheters through an internal jugular rather
than the subclavian approach. The internal jugular ap
proach was attempted because of the lower risk of pneumo
thorax and the greater ease in treating an arterial
puncture. In order to minimize the possibility of ar
rhythmia, all subjects had continuous ECG monitoring
during placement of the Swan-Ganz catheter. Lidocaine
and cardiopulmonary resuscitation equipment were im
mediately available. Placement of the 14-gauge line for
plasma exchange was performed in a femoral vein which has
few complications.
Potential complications associated with the plasma
exchange procedure were also identified as risks. The
procedure carries with it the associated risks of hypo
tension due to excessive volume withdrawal, air embolism
from operator error, and hepatitis from the volume of
fresh frozen plasma infused. Complications related to
the withdrawal of excessive volume were controlled by the
continuous flow technique employed. Fluid balance was
maintained at or near zero at all times during the proce
dure. The risk of air embolus was decreased by using on
ly fully-trained and experienced pheresis technicians who
77

were additionally alerted by both audible and visible
alarms built into the machine to signal an air-in-line
warning. The infusion of large quantities of fresh fro
zen plasma carried the theoretical risk of transfusion
reaction, although this was less than if whole blood had
been used. In addition, the possibility of transmission
of viral hepatitis existed.
Complications associated with the withdrawal of mul
tiple blood samples were also considered. Because the
subjects had an indwelling arterial line throughout the
study period, there were no complications associated with
the performance of venipuncture for the withdrawal of
blood samples. The total volume of blood to be withdrawn
during the course of the experiment was calculated to be
approximately 350 mL (Appendix B). Existing protocols in
the Burn Center required a similar battery of blood tests
to be obtained on all patients with major burns every six
hours; thus, the 350 mL represented an increase of ap
proximately 33% in the quantity of blood to be drawn from
study patients. The difference was between 120 and 150
mL in the 48 hour study period.
Invasive Monitoring
Upon admission to the burn center, all patients with
burns of 40% TBSA or greater routinely undergo placement
of the following invasive lines:
78

79
1. Nasogastric tube: Placement is via the naris
whenever possible; oral placement is an option. A 2-part
tube of appropriate size is placed, secured, documented to
be in physiologic position by radiographic exam, and
connected to low (20 to 40 mm Hg) constant suction.
2. Foley bladder catheter: Placement of a catheter
of the appropriate size is accomplished using sterile
technique. When in position, as verified by urine re
turn, the cathether is conneced to a down-drain bag with
a built-in urimeter.
3. Large-bore intravenous lines for fluid resusci
tation: At least one l4-gauge catheter is placed into
the internal jugular, subclavian or femoral vein using
sterile technique. The site selected for line placement
is based upon the location of the burn wound and the mo
bility and preference of the patient. Lines are sutured
in place and position verified by radiographic exam.
4. Arterial line: An arterial line is placed into
either the radial or femoral artery. A 20-gauge catheter
is routinely used for the radial artery and an IS-gauge
line for the femoral artery. The line is then attached
to a pressure transducer with flush system connected to a
patient monitor (Mennen Model 4S0, Clarence, NY) and su
tured into place.
In addition to the above lines, subjects in this
study underwent the placement of a Swan-Ganz thermodilu-

tion catheter (Model 93A-131-7F, Edwards, Inc., Santa
Ana, Ca.). The catheter was threaded through a hollow
plastic catheter introducer (Cordis, Inc., Miami, Fla.)
into either the internal jugular, subclavian, or femoral
vein. The balloon-tipped Swan-Ganz catheter is equipped
with pulmonary artery and central venous ports and an
electronic thermister. pulmonaiy artery pressure is
monitored by attachment of the catheter's distal port to
a pressure transducer connected to a patient monitor
equipped with oscilloscopic display of pressure tracings,
digital readout of pressures, and a strip recorder.
While continuously monitoring pressures, the catheter is
flow-directed into the proximal pulmonary artery and mea
surements of wedge pressure obtained. Appendix C lists
normal values and formulas used for the calculation of
cardiopulmonary profiles. During catheter placement, the
electrocardiogram (ECG) is monitored continuously for the
occurrence of arrhythmias; cardiopulmonary resuscitation
equipment and personnel certified in cardiopulmonary re
suscitation techniques are available at the bedside.
Once in position in the pulmonary artery, the catheter is
sutured into position and placement confirmed by a porta
ble chest radiograph.
Resuscitation
All subjects underwent initial resuscitation accor
ding to the Parkland formula. This formula called for
80

the intravenous infusion of lactated Ringer's solution
(Appendix D) at a rate of 4 mL/kg/% TBSA burn. Half of
the calculated volume was given over the initial eight
hours following thermal injury and the remainder over the
ensuing 16 hours. Standard guidelines for assessing the
success of fluid resuscitation were used with the primary
criteria being urine output. Subjects underwent the in
sertion of a Foley bladder catheter as soon as was clini
cally feasible; hourly urine output determinations were
made thereafter for a 48 hour period. Fluid volumes were
adjusted to maintain urine output at a range of 30-50 mL
per hour. Subjects whose urine output was less than this
value were given additional fluid in volumes sufficient
to improve urine output; subjects whose urine output was
in excess of this amount underwent appropriate decreases
in fluid infusion.
Patients transported to the burn center from long
distances had their fluid resuscitation begun prior to
transport. In no case was fluid resuscitation withheld
or adjustments in fluid resuscitation made according to
the planned entry of the patient into the study.
Documentation of Inhalation Injury
All subjects suffering potential exposure to toxic
products of combustion were evaluated for inhalation in
jury. The evaluation was based on clinical findings but,
81

133 in all cases, objective documentation was by xenon
perfusion scan. In addition, subjects who underwent en-
dotracheal intubation had fiberoptic bronchoscopy per-
formed. Diagnosis of inhalation injury was based upon
the presence of two of the following three criteria:
1. Clinical findings consisting of oropharyngeal
burns; carbonaceous sputum; respiratory distress or
wheezing; facial burns, singed vibrissae and facial hair;
or upper airway edema. 133
2. The presence of a positive xenon scan con-
sisting of retention of isotope beyond 90 seconds in seg-
mental areas of the lung or diffuse retention for longer
than 120 seconds.
3. Bronchoscopic evidence of inhalation injury con-
sisting of tracheal or broncheolar edema, erythema, des-
quamation, or carbonaceous deposits.
In addition, arterial blood gas analysis was per-
formed on admission to the burn center for the purpose of
assessing respiratory parameters and documenting carboxy-
hemoglobin content. An admission chest radiograph was
also obtained on all subjects.
Randomization of Subjects to plasma Exchange
The population of burn patients admitted to the burn
center was considered to be a true sample of all burn
patients from a large geographical area based on two
82

factors. The first factor is that the burn center has a
policy to accept all burn patients for admission. The
second factor is that the burn center is the regional re
ferral center for all hospitals in the intermountain
area. Thus, since essentially all hospitalized patients
with major burns are transferred to this burn center and,
since the burn center refuses no admissions, a basic
assumption is that the criteria for achieving representa
tive sampling of burn patients appeared to be met.
Random assignment of subjects into the treatment
group or control group was accomplished using a table of
random numbers (Appendix E). Prior to the beginning of
the study, 96 numbers were sequentially paired. Each
pair was then numbered sequentially one through 48.
Using the pair number, reference was made to a standard
table of random numbers with the first number of each
pair being assigned either to the treatment or control
group. The second number of each pair was then desig
nated to the other group. Based on these assignments, a
series of 96 envelopes were numbered sequentially; a card
designating that individual's group assignment was placed
inside; and the envelope was sealed. A box containing
all 96 envelopes in proper numerical sequence was placed
at the nurses' station. On admission to the burn center,
patients who qualified for the study were approached by a
physician for consent. After obtaining consent, the en-
83

velope in the front of the box was opened by a staff mem
ber to learn to which group the subject was assigned.
The rationale for pairing the subjects was to offset
both the seasonal nature of burn admissions and the not
infrequent occurrence of multiple admissions from a
single fire or other catastrophe. If random assignment
of 96 individual numbers had been performed, it would
have been possible for many numbers in series to be as
signed to the same group. If this occurred during the
winter months when patients have a higher incidence of
inhalation injury due to burn injuries sustained in a
house fire, a bias regarding the plasma exchange treat
ment could have resulted.
Similarly, if a number of patients injured in a
single accident were admitted simultaneously, the pairing
system assured that they were evenly and randomly as
signed to the two treatment groups. Finally, since the
pairing system assured that both the control and treat
ment groups contained an equal number of subjects, the
performance of periodic review of results facilitated
analysis of the data. Placing individual assignments in
sealed envelopes sequentially numbered assured that the
order of treatment assignment was not subject to bias.
Arrangement for assignment of 96 subjects was made to as
sure that the number of studies necessary to reach sta
tistical significance would not exceed the number ini-
84

tially randomly assigned. Because of limited knowledge
regarding the effect of plasma exchange on burn patients,
there was no way to predict the number of trials neces
sary to reach a conclusion prior to beginning the study.
Continual review of results was built in to the design so
that the endpoint of the study was statistical signifi
cance.
Performance of Plasma Exchange
Subjects randomized to undergo plasma exchange had
the procedure performed as soon as was clinically
feasible. That is, all access lines were immediately
placed and plasma obtained in readiness for the procedure
to begin as soon as consent was obtained. Patients who
were not admitted to the burn center in time to begin
plasma exchange by the fifteenth postburn hour were not
considered for entry into the study protocol.
Plasma exchange was performed using an IBM Model
2997 continuous blood cell separator (IBM Systems, Endi
cott, N.Y.). The performance of the procedure was under
the technical direction of the medical director of the
University of Utah Medical Center pheresis center and
blood bank. The procedure was performed by plasmaphere
sis technicians at the subject's bedside in the burn cen
ter.
The IBM 2997 separates whole blood into its major
components with the advantage over discontinuous cell se-
85

para tors of requiring virtually no extraneous volume from
the patient to prime the machine. Blood flow to and from
the patient is controlled by variable speed roller pumps.
A centrifuge separates the blood into its components
based upon their specific gravities. Strategically
placed pipettes within the machine collect the various
components of the blood as it is separated in the centri
fuge. Anticoagulant is injected into the blood as it is
removed, in a whole blood-to-anticoagulant ratio of 10:1.
Acid citrate dextrose (ACD) formula A (Fenwal Labs.,
Deerfield, Ill.) is employed as an anticoagulant. Blood
is withdrawan through one of the large intravenous cathe
ters and entered into the blood separation channel
(Ethox, Inc., Buffalo, N.Y.) in place in the machine. As
blood is spun, the plasma component is removed and col
lected in storage bags for research use. Erythrocytes,
platelets, and white cells are returned to the patient
through a second large bore intravenous line. Simul
taneously, the volume of plasma removed from the patient
is replaced mL for mL with type-specific fresh frozen
plasma from the University Hospital Blood Bank. The
fresh frozen plasma used is prepared from whole donor
blood in which the plasma is separated by centrifugation
and frozen at -30 degrees C within six hours of collec
tion. Fresh frozen plasma has a dating period of 12
months after which time it is deficient in Factor VIII
86

and must be discarded. The fresh frozen plasma is
quickly thawed immediately prior to use to prevent loss
of labile coagulation factors.
Subjects undergoing plasma exchange had a calculated
volume of exchange equal to one and one-half times their
calculated blood volume. This was based on the following
calculation (160): For males, blood volume equals 7% of
the body weight in kilogramsj for females, blood volume
equals 8% of body weight. The plasma exchange procedure
was regulated so as to be completed in the shortest pos
sible time. Because of mechanical limitations, the pro
cedure takes a minimum of two to five hours. Regulation
also kept the patient's balance of exchange fluid ap
proximately equal to zero thus preventing over- or under
hydration during the course of the exchange procedure.
Continuous monitoring of blood pressure and other vital
signs was performed throughout the procedure. Parkland
fluid resuscitation continued throughout the period of
plasma exchange and was modified according to the stan
dard parameter of urine output.
Completion of Resuscitation
Following resuscitation from burn shock, patients
with major burns have increased requirements for mainte
nance fluid. All subjects in this study had hourly urine
output determinations, with fluid requirements modified
87

88
as needed. When a subject was able to maintain a urine
output of 30 to 50 mL per hour for two hours with the
volume of fluid infusion equal to calculated maintenance,
fluid resuscitation ws considered complete and burn shock
reversed.
Maintenance fluid requirements in burn patients are
predicted by using two standard calculations. The first
calculates evaporative water losses from the burn wound
(161) : 2
(25 + % TBSA burn) (BSA m ) = evaporative loss in
mL/hour.
Formula components:
25 = constant as described in reference by Warden et
ale (161).
% TBSA burn = percent total body surface area burn as
described by Lund and Browder (Appendix A). 2
BSA m = body surface area as described by
Dubois (162). This formula, the "Height - Weight Formula,"
estimates the surface area of subjects when their height
and weight are known and is expressed as:
0.425 0.725 BSA = W X H x c
with BSA being surface area in square centimeters, W
the weight in kilograms, H the height in centimeters, and
C the constant, 71.84. A chart has been plotted from
this formula (Appendix F).
The second formula calculates other maintenance fluid

89
requirements (urine output, stool, respiratory losses) and
is expressed as: 2
(1500 mL) (BSA m ) = Maintenance requirements in mL
per 24 hours
or 2
(62.5 mL) (BSA m ) = Maintenance requirements in mL
per hour
Total maintenance fluids for burn patients are equal
to the addition of the two formulas or: 2
(25 + % TBSA burned + 62.5) (BSA m ) = mL per hour.
Thus, when a subject sustained an adequate urine
output of 30 to 50 mL per hour for two consecutive hours
on the predicted amount of infused maintenance fluid, re-
suscitation criteria were met. In addition to urine out-
put, completion of resuscitation was monitored by evalua-
tion of the subject's clinical status using other parame-
ters including vital signs and serum laboratory reports.
upon completion of resuscitation, all subjects received
an infusion of type-specific fresh frozen plasma equal to
20% of their calculated blood volume. All subjects were
then given standard maintenance therapy consisting of 5%
dextrose in 0.2% normal saline (D5.2NS) at a rate calcu-
lated to equal maintenance needs.
Data Collection
Subjects entered into the study had a number of

blood chemistry determinations made at specified times
throughout the 48 hour course of the study. Blood sam
ples were withdrawn by burn center staff through the ar
terial line, utilizing a three-way stopcock and sterile
technique. The line was flushed with normal saline fol
lowing each withdrawal. Blood was aspirated into sterile
plastic syringes and transferred to the appropriate tube
(Vacutainer Systems, Rutherford, N.J.) for transportation
to the pathology laboratory at University Hospital.
There the samples underwent standard automated techniques
employed for the determination of specific values. Ap
pendix G presents normal ranges of laboratory values.
For determination of arterial and mixed venous gas con
tents, blood was drawn into sterile preheparinized
plastic syringes (Concort Labs, Keene, N.H.), placed in
ice, and transported immediately to the pulmonary labora
tory at University Hospital. Appendix C presents normal
values for blood gas determinations.
Serum determinations were made serially on each sub
ject admitted to the study. Appendix H lists the vari
ables and the intervals postburn that samples were ob
tained.
Physiologic variables measured serially by burn
center staff included:
1. Vital signs: Heart rate, respiratory rate, core
body temperature utilizing the Swan-Ganz catheter connec-
90

ted to the Edwards cardiac output instrument, and sys
temic blood pressure using the arterial line transducer
connected to the Mennen monitoring instrument.
2. Swan-Ganz measurements: Pulmonary artery mean
and systolic/diastolic pressures; pulmonary capillary
wedge pressures; central venous pressures; and cardiac
output determinations. Determinations of cardiac output
were made by the technique of thermodilution using ste
rile D5W maintained in ice at a temperature of 0 degrees
C. A 10 mL aliquot of iced D5W was injected into the
proximal port of the Swan-Ganz catheter following verifi
cation of its position by pressure tracing and portable
chest radiograph. Measurement of blood temperature at
the distal pulmonary artery port was made by the thermis
tor incorporated into the catheter. Calculation was made
using the Edwards Model 9520 cardiac output computer.
91
All determinations were made in triplicate within one min
ute intervals and the mean of the three values used as
the recorded value. The normal values for these
parameters are presented in Appendix C.
3. Intake: All infusions were measured and recorded
according to content, amount, and route administered.
4. Output: All output, including urine, nasogastric
tube drainage, stools, emesis and estimated blood loss
were measured and recorded.
5. Ventilatory status including settings of venti-

lator and timing of changes made in settings. These pa
rameters include fraction of inspired oxygen (Fi02), ti
dal volume, mode of therapy, ventilator rate, and posi
tive and expiratory pressure (PEEP) setting.
Cardiac profiles were calculated by computer techni
cians using the Telemed Cardiopulmonary System (Tenet
Company, Salt Lake City, Utah) to determine arterial ve
nous oxygen difference, oxygen consumption, oxygen
availability, oxygen extraction, pulmonary vascular re
sistance index, systemic vascular resistance index, car
diac index, stroke index, and percent of shunt. The for
mulas used to calculate these values are presented in Ap
pendix C.
Data collected on each subject also included age;
sex; percent TBSA burn with division into partial- and
full-thickness injury; etiology of injury; time postburn
intravenous resuscitation was begun; time postburn admit
ted to burn center; presence of inhalation injury; con
commitant injury; preexisting disease and current med
ications; weight; height; body surface area; calculated
fluid and sodium requirements according to Parkland for
mula and maintenance formula; actual fluid and sodium re
quirements; amount of intake and output; survival; and,
in the treatment group, plasma exchange data.
The nursing staff of the burn center carried the
primary responsibility for adherence to the research pro-
92

tocol. The member of the burn center staff assigned to
deliver care to the patient was responsible for incor
porating the research protocol activities into the sub
ject's burn care. Assignment of staff is the responsibi
lity of the charge nurse on each shift. The nursing
staff works 12-hour shifts so that at least four dif
ferent nursing shifts were responsible for the care of
the subject during the 48 hour study period. All staff
caring for critically ill patients on admission are ex
perienced burn center personnel. In addition, the two
medical directors, the clinical specialist, and the head
nurse of the burn center were available as a resource at
all times during the study period. To clarify the speci
fic tasks associated with the study, a list of the
nurse's hourly responsibility during the plasma exchange
research study was developed (Appendix I). This list was
included in the envelopes containing the assignment to
group card so that it was ilnmediately available to the
nurse whose patient entered into the protocol.
Termination of the study
All study parameters were followed for a total of 48
hours from the time of burn injury. At that time, the
Swan-Ganz catheter was removed if the subject was suffi
ciently stable to warrant discontinuing this method of
monitoring. The arterial line was also removed at that
time if clinical circumstances permitted.
93

The participation in the study by an individual was
terminated at any time during the course of the study
under the following circumstances:
1. If the subject expressed a desire to withdraw
participation in the study.
2. If the subject's family expressed a desire for
the subject to be withdrawn from the study.
94
3. If significant complications arose as a result of
procedures incorporated into the study which were not
considered routine procedures; i.e., Swan-Ganz catheter
placement, plasma exchange procedure.
4. If plasma exchange could not be started by 15
hours postburn.
If a study subject died before the 48 hour postburn
period had elapsed, that subject remained in the study for
the purpose of analysis of all data gathered up to the
time of death.
other Burn Therapy
Entrance into and participation in this study did
not, in any way, compromise other aspects of burn care.
All standard protocols used in the burn center were con
tinued in subjects entered into the study. These in
cluded aggressive cimetadine and antacid prophylaxis to
guard against the development of gastric stress erosions;
aggressive nutritional support including vitamin therapy;
early excision and autografting of all full- and deep
partial-thickness burns; and early, vigorous physical
therapy.
Resuscitation Failure
Subjects entered into the plasma exchange protocol
who were randomized to be controls continued to be at
risk for developing resuscitation failure. Resuscitation
failure was defined as a subject who, at 18 hours
postburn, still required in excess of twice the calcu
lated volume of resuscitation fluid to maintain urine
output at the minimum acceptable level of 30 mL/hour. In
addition, subjects who required formal resuscitation with
lactated Ringer's solution for longer than 36 hours
postburn were considered resuscitation failures. Sub
jects in the control population who developed resuscita
tion failure were dropped from the control protocol; at
that time, they underwent a course of plasma exchange as
a therapeutic maneuver. Any monitoring devices in place
were continued throughout the 48 hour period. Inclusion
of such subjects in the control group was continued but
the development of failure to resuscitate placed them in
a subgroup for statistical analysis.
statistical Anal is Technique
Data collection was performed using two 24-hour flow
sheets for each subject. The data were collected on each
95

•
subject immediately after the conclusion of the 48 hour
study period. Data were analyzed using the Statistical
Package for the Social Sciences Program. A UNIVAC 1100
computer processed the statistical programs. Statistics
utilized to describe the sample were descriptive in
nature and included means, standard errors, ranges and
frequencies (%). In addition, t-test analysis was
performed on 321 selected variables measured to determine
whether or not significant differences occurred between
the control and treatment groups. Because of the ex
ploratory nature of the work and the small number of sub
jects studied, statistical significance is defined at
the .05 level. The technique of survival statistics was
also performed on both groups.
96

CHAPTER IV
RESULTS
An experimental study designed to evaluate the effect
of plasma exchange on subjects in burn shock was con
ducted. Subjects assigned to the control group received
standard burn shock resuscitation while the experimental
group (PLA/EX) received standard burn shock resuscitation
plus plasma exchange. Built into the design of the study
was a means to periodically evaluate the data. This
chapter presents the statistical analyses of data from an
initial sample of 14 subjects. These data are presented
in tabular form beginning with the description of the
sample. Following the descriptive data, the two specific
questions concerning the physiological response to treat
ment by group will be presented.
The Sample
Student's t-tests of 2-tail probability were conduc
ted to identify statistical differences between the two
groups on all variables. The list of all measured var
iables is presented in Appendix I.
Fourteen patients with 40% TBSA burn or greater were

98
admitted to the study between July 1982, and December
1983. Ten (71%) male and four (29%) females were included
(Table 2). The cause of injury in all cases was flame.
Five subjects (36%) had documented associated inhalation
injury. The mean age was 37.6 years (range: 20-52). The
mean percent total body surface area (TBSA) burn was 51.2
(range: 40-83) with a mean full-thickness component of
28.4% TBSA (range: 0-46). The mean body weight was 77
kg (range: 56-93) with a mean body surface area (BSA) of 2
1.9 m (range 1.55 to 2.25). Thirteen of the 14 subjects
(93%) survived burn shock. Eleven subjects (79%) sur-
vived the burn injury.
The two subject groups were compared for differences
on these variables (Table 3). The control group consis-
ted of six males (86%) and one female (14%); the PLA/EX
group consisted of four males (57%) and three females
(43%). The incidence of inhalation injury was documented
in one control subject (14%) and four PLA/EX subjects
(57%). The mean age of control subjects was 36.7 years
(range: 23-52). The PLA/EX group had a mean age of 38.4
years (range: 20-49). The control group had a mean burn
size of 48.9% TBSA (range: 40-83).
PLA/EX subjects had a mean burn size of 53.6% TBSA
(range: 44-71). There was no statistical difference
(p>.05) between the groups on these variables. A statis-
tical1y significant difference was found on the variable

Table 2 - Descriptive Characteristics of Sample (n=14 )*
Variable No.(%) Mean SE Range
Sex Male 10 (71) Female 4 ( 29)
Cause of Injury Flame 14 (100) Inhalation Injury 5 (36)
Age, Years 37.6 2.98 20-52 % TBSA Burn 51.2 3.47 40-83 % Full-Thickness
TBSA Burn 28.4 3.41 0-46 Weight, kg 77.0 3.07 56-93
2 BSA m 1.9 0.05 1.55-2.25 Survival of Burn
Shock 13 (93) Survival of Burn Injury 11 ( 79)
*Represents number of cases (No.), frequencies (%), mean, standard error (SE), and range.
99

Table 3 - Descriptive Characteristics of Groups*
variable No. ( % ) Mean SE Range Proba-bility
f'
Sex Male
Control ~ 6 (86) PLA/EX 4 (57)
Female Control 1 ( 14 ) PLA/EX 3 (43)
Inhalation Injury Control 1 ( 14) PLA/EX 4 (57) .111
Age, Years Control 7 36.7 4.86 23-52 PLA/EX 7 38.4 3.81 20-49 .787
% TBSA Burn Control 7 48.9 6.00 40-83 PLA/EX 7 53.6 3.78 44-71 .521
% Full-Thick-ness TBSA Burn Control 7 18.3 3.35 0-25 PLA/EX 7 38.4 2.33 27-46 .000
Weight, kg Control 7 79.0 3.63 66-93 PLA/EX 7 74.9 5.12 56-75 .522
2 BSA, m
Control 7 1.95 0.07 1.70-2.25 PLA/EX 7 1.89 0.08 1.55-2.20 .555
*Represents number of cases (No.), frequenciess (%), mean, standard error (SE), range, and t-test level of significance.
100

of percent full-thickness TBSA burn with controls having
a mean of 18.3% TBSA full-thickness involvement (range:
0-25) compared to 38.4% (range: 27-46) for PLA/EX sub-
jects (p<.Ol). The mean body weight for controls was
79.0 kg (range: 66-93) compared to a mean of 74.9 kg
(range: 56-75) in the PLA/EX group. Body surface area 2
(BSA) was a mean of 1.95 m for control (range: 1.70-2
2.25) and 1.89 m for PLA/EX subjects (range: 1.55-
2.20). No statistical difference between groups was
present in either of these variables (p>.05).
Resuscitation Requirements
The first proposed question in this study was as
follows:
101
Does plasma exchange performed during burn shock alter the predicted resuscitation fluid requirements a burn nurse may expect to administer to a patient in burn shock?
The Student's t-test was used to analyze the resusci-
tation data. The mean and standard error are reported in
this situation where the precision of the sample mean as
an estimate of the population mean was intended. The con-
trol had intravenous (IV) fluid started by a mean of 1.29
hours postburn (range: 1 to 2 hours). All PLA/EX sub-
jects had IVs infusing by one hour postburn (Table 4).
The postburn hour (PBH) of arrival in the burn center was
4.43 for the control (range: 1-7) and 3.43 for the PLA/EX
group (range: 2-5). During the first 24 hours postburn,

Table 4. Resuscitation Requirements First 24 Hours Postburn
Control Group (n=7) PLA/EX Group (n=7) Variable Mean SE Range Mean SE Range
PBH IV Started 1.29 .18 1-2 1.00 .00 1.00 PBH Arrival in
Burn Center 4.43 .81 1-7 3.43 .53 2-5 Fluids to Resusci-tate, 1st 24 hrs mL/kg/hr 3.23 .51 1.83-5.15 3.37 .47 1.90-4.99
Fluids to Resusci-tate to seal mL/kg/hr 3.30 .59 1.49-4.68 2.91 .49 1.32-5.67
Fluids to Resusci-tate, 1st 8 hrs mL/kg/hr 1.35 .22 0.50-2.24 1.88 .26 0.65-2.83
Fluids to Resusci-tate, 2nd 8 hrs, mL/kg/hr 1.12 .28 0.15-2.22 0.82 .24 0.09-1.60
Fluids to Resusci-tate, 3rd 8 hrs, mL/kg/kr 0.66 .15 0.24-1.34 0.73 .21 0.19-1.77 BH to Resucita-tion 27.9 3.14 14-37 22.30* 4.03 9-35 odium Infused to Resuscitation, mEq/kg/%TBSA burn 0.61 .09 0.31-0.95 0.67* .13 0.31-1.10 rine Output to Resucitation mL/hr 62.00 7.95 38-96 105.00*10.87 77-142
n=6; **p<.Ol
Probability
.172
.326
.845
.620
.139
.426
.768
.305
.698
.009**
f-J o tv

103
the control group received a mean of 3.23 mL/kg/hr of re
suscitation fluid (range: 1.83-5.15). The PLA/EX group
received a mean of 3.37 mL/kg/hr during the first 24 hours
postburn (range: 1.90-4.99). The mean amount of IV fluid
to resuscitate subjects until the time when clinical cri
teria for sealing was met was a mean of 3.30 mL/kg/hr for
the control (range: 1.49-4.68) and 2.91 mL/kg/hr for the
PLA/EX group (range: 1.32-5.67). Fluids to resuscitate
during the first eight PBH period were 1.35 mL/kg/hr for
the control (range: 0.50-2.24) and 1.88 mL/kg/hr for the
PLA/EX group (range: 0.65-2.83). Fluids to resuscitate
during the second eight PBH period were 1.12 mL/kg/hr for
the control (range: 0.15-2.22) and 0.82 mL/kg/hr for the
PLA/EX group (range: 0.09-1.60). Fluids to resuscitate
during the third eight PBH period were 0.66 mL/kg/hr for
the control (range: 0.24-1.34) and 0.73 mL/kg/hr for the
PLA/EX group (range: 0.19-1.77). The time to resuscita
tion for the control was 27.9 hours postburn (range: 14-
37) and 22.3 hours postburn for the PLA/EX group (range:
9-35). One PLA/EX subject died at PBH 36 without meeting
the clinical criteria for sealing. The amount of sodium
infused for resuscitation of the control was a mean of
0.61 mEq/kg/% TBSA burn (range: 0.31-0.95). The PLA/EX
group received a mean of 0.67 mEq/kg/% TBSA burn (range:
0.31-1.10). Urine output to resuscitation was a mean of
62 mL per hour for the control (range: 38-96) and 105 mL

per hour for the PLA/EX group (range: 77-142). This
variable was significantly different (p<.OI).
104
In comparing the control and PLA/EX groups, no dif
ference was found in any of the variables associated with
resuscitation requirements (p>.05). Comparison of the
control to a group designated experimental survivors was
then conducted. Survival in the group was dependent
upon clinical criteria of a normal response to burn in
jury. All control subjects responded as expected to burn
shock resuscitation and none were deemed resuscitation
failures. In the experimental PLA/EX group, three sub
jects (43%) failed to survive in the group. One patient
died at 36 hours and two patients failed to resuscitate
and had repeat plasma exchange procedures within 48 hours
of the burn. Failure to survive in the group was not
statistically Significant (p>.05) between the groups. A
subgroup of experimental subjects was identified and
designated as experimental survivors (EXP-SUR). Compari
son of the control to EXP-SUR group is reported in Table
5. Differences between the four EXP-SUR subjects and the
seven control subjects failed to achieve statistical sig
nificance (p>.05) on resuscitation variables due to low
t-test power.
The second 24 hours of burn shock was also studied
regarding fluid requirements (Table 6). The predicted
maintenance was determined using previously described

Table 5. Resuscitation Requirements First 24 Hours Postburn
Control Group (n=7) EXP-SUR Group* (n=4) Mean SE Range Variable Mean SE Range
PBH IV Started 1.29 PBH Arrival in
Burn Center 4.43 Fluids to Resusci-tate 1st 24 hrs mL/kg/hr 3.23
Fluids to Resusci-tate to seal, mL/ kg/hr 3.30
Fluids to Resusci-tate 1st 8 hrs mL/kg/hr 1.35
Fluids to Resusci-tate 2nd 8 hrs mL/kg/hr 1.12
Fluids to Resusci-tate 3rd 8 hrs mL/kg/hr 0.66
PBH to Resuscita-tion 27.9
Sodium Infused to Resuscitation mEq/kg/%TBSA burn 0.61
Urine Output to Resuscitation mL/hr 62
"*Experimenta1 survivors.
.18 1-2 1.00 .00
.81 1-7 3.25 .75
.51 1.83-5.15 3.46 .75
.59 1.49-4.68 2.S0 .71
.22 0.50-2.24 2.06 .29
.28 0.15-2.22 0.S6 .42
.15 0.24-1.34 0.48 .14
3.14 14-37 17.30 3.71
.09 0.31-0.95 0.60 .1S
7.95 38-96 98 15.26
1-1
2-5
1.90-4.99
1.32-5.67
1.53-2.83
0.09-1.60
0.19-0.83
9-27
0.31-1.10
77-142
Probability
.172
.318
.80S
.600
.094
.621
.402
.065
.955
.090
f--t o U1

Table 6. Resuscitation Requirements Second 24 Hours Postburn
Variable
Predicted Maintenance Rate mL/hr
Volume Delivered 2nd 24 hrs, mL/hr
Volume Resus. Time to PBH 48 mL/hr
Urine Output 2nd 24 hrs mL/hr
Urine Output Resus. timePBH 48, mL/hr
Predicted FFP Need, mL
FFP Admininistration, mL
PBH Administered
Control Group (n=7) PLA/EX Group (n=6) Mean SE Range Mean SE Range
267 17.72
337 38.27
376 45.04
106 30.25
131 26.16
858 76.81
866 79.77
31.6 2.30
217-360 267
226-481 392
276-549 380
48-258 84
57-213 86
660-1264 911
660-1250 1004
23-40 21.5
15.48 206-318
60.09 239-608
64.20 235-601
8.65 63-112
9.93 68-126
45.44 750-1120
138.00 800-1680
2.566 14-29
Probability
.986
.460
.959
.519
.150
.563
.413
.014
I-' o 0"\
107
methods (Appendix J). The controls were predicted to
need 267 mL/hr of IV fluid (range: 217-360) and the
PLA/EX group 267 mL/hr (range: 206-318). The actual
volume delivered during the second 24 hours postburn was
a mean of 337 mL/hr in the control (range: 226-481) com
pared with a mean of 392 mL/hr for the PLA/EX group
(range: 239-608). The volume delivered from the time
the subject met the clinical criteria of sealing until
PBH 48 was a mean of 376 mL/hr for the control (range:
276-549) and 380 mL/hr (range: 235-601) for the PLA/EX
group. Hourly urine output for the second 24 hour period
was a mean of 106 mL/hr (range: 48-258) for the control
and 84 mL/hr (range: 63-112) for the PLA/EX group.
Urine output from the time of sealing until PBH 48 was a
mean of 131 mL/hr for the control (range: 57-213) and 86
mL/hr (range: 68-126) for the PLA/EX group. The amount
of FFP to be delivered to each subject was determined
using previously described formulas (Appendix J). The
mean amount for the control was 858 mL (range: 660-
1,264) and the PLA/EX group mean was 911 mL (range: 750-
1,120). The actual mean amount of FFP delivered was 866
mL for the control (range:
the PLA/EX group (range:
660-1,250) and 1,004 mL for
800-1,680). The postburn hour
of administration was a mean of 31.6 hours for the con
trol (range: 23-40) and 21.5 hours for the PLA/EX group
(range: 14-29). There was no statistical difference be-

108
tween groups (p>.05) on any of the variables presented in
Table 6 except for PBH of administration of FFP. There
the control and PLA/EX groups differed significantly
(p<.Ol). The EXP-SUR group was again compared with the
control and the data are presented in Table 7. No sta
tistically significant differences between the groups
were found (p>.05) except for the variable PBH of FFP ad
ministration where statistical significance was again
reached (p<.05).
Data regarding the plasma exchange (PLA/EX) procedure
are presented in Table 8. The mean time of actually star
ting the procedure was PBH 10 (range: 7-19). The mean
time of ending PLA/EX was PBH 15 (range: 10-23). Using
previously described formulas (Appendix J) the calculated
amount of volume to be exchanged was determined to be a
mean of 8,278 mL (range: 6,720-9,555). The actual ex
changed volume was a mean of 7,539 mL (range: 6,000-
9,300). The urine volume during PLA/EX was a mean of 229
mL/hr (range: 119-507).
The past medical history of the subjects was reviewed
to determine any concomitant injury or illness. One sub
ject (7%) had preexisting cardiac problems (Table 9).
Two subjects (14%) had gastrointestinal disease; three
subjects (21%) had a history of alcohol abuse; one subject
(7%) had a history of drug abuse; and two subjects (14%)
had intercurrent trauma. Seven of the nine problems

Table 7. Resuscitation Requirements - Second 24 Hours Postburn
Control Group (n=7) EXP-SUR Group (n=4) Variable Mean SE Range Mean SE Range Probability
Predicted Mainte-nance Rate mL/hr 267 17.72 217-360 264.0 28.85 206-318 .933
Volume Delivered 2nd 24 hrs, mL/hr 337 38.27 226-481 369.0 86.04 239-608 .749
Volume Resus. time-PBH 48 mL/hr 376 45.04 276-549 359.0 83.78 235-601 .869
Urine Output 2nd 24 hrs mL/hr 106 30.25 48-258 72.0 5.25 63-84 .311
Urine output Resus. Time-PBH 48, mL/hr 131 26.16 57-213 71.0 2.02 68-77 .064
Predicted FFP Need, mL 858 76.81 660-1264 887.0 50.34 750-992 .757
FFP Administered 866 79.77 660-1250 1063.0 207.02 800-1680 .424 PBH Administered 31.6 2.30 23-40 21.8 2.87 15-29 .032
i-' o \.0
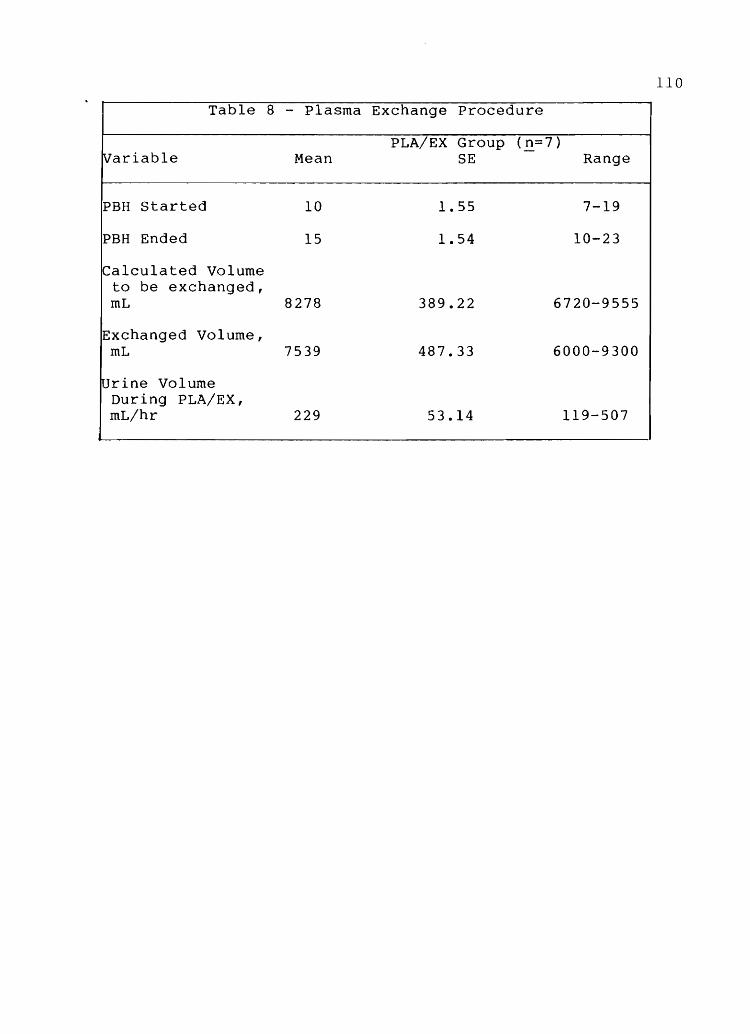
110
Table 8 - Plasma Exchange Procedure
PLA/EX Group (n=7) Variable Mean SE Range
PBH Started 10 1.55 7-19
PBH Ended 15 1.54 10-23
Calculated Volume to be exchanged, mL 8278 389.22 6720-9555
Exchanged Volume, mL 7539 487.33 6000-9300
IUrine Volume During PLA/EX, mL/hr 229 53.14 119-507

III
Table 9 - Past Medical History
~ariable No. (%) Group Assignment Control PLA/EX No. ( % ) No. ( % )
Ristory of Cardiac Disease 1 ( 7 ) 0 ( 0 ) 1 ( 14 )
Pulmonary Disease 0 ( 0 ) 0 ( 0 ) 0 ( 0 )
Diabetes 0 ( 0 ) a ( 0 ) a ( 0 )
Renal Disease 0 ( 0 ) a ( 0 ) a ( a )
Gastrointestinal Disease 2 ( 14 ) 1 ( 14 ) 1 (14)
Neurologic Disease 0 ( 0 ) 0 ( 0 ) 0 ( 0 )
Hepatic Disease a ( 0 ) a ( a ) a ( 0 )
Alcohol Abuse 3 ( 21 ) 1 (14) 2 ( 28 )
Drug Abuse 1 ( 7 ) 0 ( a ) 1 ( 14 )
Intercurrent Trauma 2 ( 14 ) 0 ( 0 ) 2 (28)

occurred in PLA/EX subjects.
Physiologic Variables and the Effect of Plasma Exchange--
The second specific research question was:
Does plasma exchange performed during burn shock alter measurable physiologic variables?
The total number of measured variables collected on each
112
subject entered into the research protocol was 945 (Appen-
dix H). For the purpose of this study, 321 selected rep-
resentative variables are reported. This includes the
previously described data plus the measured physiologic
variables for PBH 8, 16, 24, and 48. The data were sta-
tistically analyzed for difference between groups using
the Student's t-test. Because this was a clinical study
occurring in the rcu area, one limitation of the study was
that there were times when variables were not measured or
were not recorded. The number (N) and percent (%) of
total cases is therefore included in the tables to repre-
sent the actual sample size of each reported variable.
The representative times were chosen to identify early
burn shock effect (PBH 8), postplasma exchange effect
(PBH 16), end of burn shock phase (PBH 24), and restora-
tion of cardiovascular integrity (PBH 48).
Hematology
The white blood cell (WBC) count was initially ele-
vated in both the control and the PLA/EX group (Table 10).

113
Table 10 - Hematology
Variable PBH Group Mean SE Range No. (%)
WBC, K/uL 8 Control 19.9 3.39 8.0-32.0 6 (86) 16 14.1 3.37 2.7-24.3 6 (86) 24 10.6 2.86 3.9-22.0 6 (86) 48 4.6 1.38 1.8-10.8 6 (86)
8 PLA/EX 27.8 6.61 17.6-53.5 5 (72) 16 21.9 3.65 10.8-34.7 7(100) 24 18.1 3.67 3.6-27.9 7(100) 48 7.7 1.53 4.5-11.8 4 ( 57)
RBC, m/uL 8 Control 5.5 0.23 4.82-6.03 5 ( 72) 16 5.6 0.31 4.60-6.75 6 (86) 24 5.8 0.34 4.80-6.95 6 (86) 48 4.4 0.19 3.70-4.90 6 (86)
8 PLA/EX 5.0 0.62 3.20-6.80 5 ( 72) 16 5.4 0.32 3.80-6.00 7(100) 24 5.0 0.37 3.60-6.20 7(100) 48 4.8 0.18 4.30-5.20 4 (57)
HGB, g/dL 8 Control 17.6 1.04 14.6-21.3 6 (86) 16 17.2 0.88 13.9-19.6 6 (86) 24 17.4* 0.77 14.5-19.3 6 (86) 48 13.1 0.51 12.0-15.0 6 (86)
8 PLA/EX 14.7 1.63 9.5-18.9 5 (72) 16 15.7 0.96 11.4-18.2 7(100) 24 14.4 0.72 11.4-16.4 7(100) 48 13.9 0.46 13.0-15.0 4 ( 57)
HCT, % 8 Control 52 2.85 42.8-60.9 6 (86) 16 51 2.71 40.9-58.3 6 ( 86) 24 52* 2.54 42.9-59.1 6 ( 86) 48 40 1.45 35.8-45.5 6 (86)
8 PLA/EX 43 5.05 27.8-55.2 5 (72) 16 47 2.88 33.2-51.7 7(100) 24 44 2.92 32.8-55.5 7(100) 48 43 1.66 38.7-46.7 4 (57)
Platelets, 8 Control 295* 28.29 234-403 6 (86) K/uL 16 223* 13.67 175-266 6 (86)
24 193* 13.44 138-224 6 ( 86) 48 94* 8.59 67-126 6 (86)
8 PLA/EX 215 18.14 162-274 5 (72) 16 133 11.76 81-169 7(100) 24 101 21.74 45-215 7(100) 48 55 12.10 19-71 4 (57)
* p<.05
114
Both groups had WBC counts within normal limits (3.6 to
9.0 k/pL) (Appendix G) by PBH 48. At no measured time was
a statistically significant difference identified (p>.05)
on this variable. The red blood cell (RBC) count was
within normal limits (WNL ~ 4.71 to 5.77 m/pL) for both
groups throughout the measured times with the exception of
the PBH 48 control which was 4.4 m/uL. No statistical
difference was found between the groups on this variable
(p>.05). Hemoglobin (HGB) was significantly different
(p<.05) between the groups at PBH 24 when the control
mean was 17.4 g/dL and the PLA/EX mean was 14.4 g/dL.
Both groups maintained HGB levels at values within normal
limits (WNL) (14.5-17.1 g/dL) until PBH 48 when both de
creased. Hematocrit (Hct) was significantly different
between the groups at PBH 24 when the control mean value
was 52% and the PLA/EX mean was 44%. Other PBH means
were not different between the groups (p>.05). Both
groups ranged within normal limits (43 to 52%) except for
PBH 48 in the control when the mean was 40%. Platelets
were significantly lower (p<.05) in the PLA/EX group at
all times, including preplasma exchange. The mean pre
exchange value was 295 k/~L for the control and 215 kl;uL
for the PLA/EX group. The control dropped below the
lower limits of normal (140 to 440K!;uL) by PBH 48 and the
PLA/EX dropped below by PBH 16.

115
Chemistries
Serum sodium mean levels remained WNL (137 to 146
mEq/L) for both groups at all reported times until PBH 48
when both groups dropped below the lower normal limit
(Table 11). A statistically different (p<.Ol) sodium
level occurred between the group means at PBH 16. The
control mean sodium was 137 mEq/L compared to a mean 145
mEq/L in the PLA/EX group. No statistically significant
difference (p>.05) existed in other PBH means.
Potassium means were significantly different between
the groups at PBH 16 and PBH 24. The control potassium
mean was 4.3 mEq/L at both times compared to the PLA/EX
mean of 3.2 mEq/L at PBH 16 and 3.1 mEq/L at PBH 24
(p<.05). The control group mean potassium remained WNL
(3.8-5.3 mEq/L) until PBH 48, at which time the mean of
3.5 mEq/L was below the normal lower limit. The PLA/EX
group mean potassium was below the lower normal limits at
all measured PBH intervals.
Chloride mean values were slightly elevated from nor-
mal (100-109 mEq/L) at PBH 8, 16, and 24. PLA/EX values
remained WNL at all measures. A statistically significant
difference (p<.05) was found between the groups at PBH 24
when the mean control was III mEq/L compared to 106 mEq/L
for the PLA/EX group. No difference was found at other
measures (p>.05).
Total carbon dioxide (CO) was lower in the control 2

116
Table 11 - Chemistries 1
Variable PBH Group Mean SE Range No. ( % )
Sodium, 8 Control 137 0.99 134-141 6 ( 86) mEq/L 16 137* 2.56 134-140 6 ( 86)
24 137 2.75 133-150 6 (86) 48 133 1.63 127-139 6 (86)
8 PLA/EX 143 2.50 137-151 6 (86) 16 145 2.03 139-152 7(100) 24 143 1.92 136-149 7(100) 48 131 3.75 121-144 5 (72)
Potassium, 8 Control 4.1 0.20 3.6-4.8 6 (86) mEq/L 16 4.3* 0.23 3.7-5.2 6 (86)
24 4.3* 0.22 3.5-4.8 6 (86) 48 3.5 0.18 3.0-4.0 6 (86)
8 PLA/EX 3.5 0.42 2.5-5.0 6 (86) 16 3.2 0.13 2.7-3.8 7(100) 24 3.1 0.17 2.5-3.6 7(100) 48 3.7 0.28 3.0-4.0 5 (72)
Chloride, 8 Control III 1.20 106-114 6 (86) mEq/L 16 III 1.36 105-115 6 (86)
24 111* 0.58 109-113 6 (86) 48 105 1.34 100-109 6 (86)
8 PLA/EX 108 2.60 102-118 6 (86) 16 108 1.11 104-113 7(100) 24 106 1.13 104-112 7(100) 48 101 1.18 97-104 5 (72)
Total CO2, 8 Control 17 1.95 10-23 6 (86) mEq/L 16 19 1.17 17-23 6 ( 86)
24 18* 0.70 16-21 6 (86) 48 24 1.75 19-28 6 (86)
8 PLA/EX 22 2.71 10-29 6 ( 86) 16 24 2.29 17-33 7(100) 24 26 1.44 20-32 7(100) 48 24 2.16 20-31 5 (72)
BUN, mg/dL 8 Control 13 1.33 10-19 6 (86) 16 11 0.96 7-14 6 (86) 24 15 1.88 8-20 6 (86) 48 10 1.26 6-14 6 ( 86)
8 PLA/EX 13 1.34 7-17 6 ( 86) 16 14 1.82 7-22 7(100) 24 13 1.09 9-17 7(100) 48 9 1.97 3-14 5 (72)
1c p<.05

117
at all PBH means but a statistically significant differ-
ence (p<.05) occurred only at PBH 24 when the control mean
was 18 mEq compared to 26 mEq/L for the PLA/EX group mean.
Normal CO levels (21-27 mEq/L) were not reached by the 2
control until PBH 48 whereas the PLA/EX means remained WNL
at all PBH intervals.
Blood urea nitrogen (BUN) levels remained WNL (6-20
mg/dL) for both groups at all measured intervals. There
was no statistical difference between the control and
PLA/EX group BUN measures at any reported PBH.
Serum glucose means remained above normal limits (84-
119 mg/dL) at all PBH intervals in both groups (Table 12).
A statistically significant difference (p<.05) between the
group means existed at PBH 48 when the control mean glu-
cose level was 172 mg/dL compared to 206 mg/dL for the
PLA/EX group mean. No difference was found (p>.05) at
other PBH measures.
Serum creatinine levels remained WNL (0.9 to 1.4
mg/dL) for both groups at all PBH measures. No difference
was found between the control and PLA/EX group mean at any
measured PBH on this variable (p>.05).
Uric acid means were not significantly different be-
tween the control and PLA/EX group at any PBH. The mean
levels remained WNL (4.6-8.5 mg/dL) for both groups until
PBH 48 when the control mean decreased to 3.9 mg/dL and
the PLA/EX mean to 3.7 mg/dL.

118
Table 12 - Chemistries 2
Variable PBH Group Mean SE Range No.(%)
Glucose, 8 Control 141 17.29 91-211 6 (86) mg/dL 16 157 10.44 126-194 6 (86)
24 173 12.80 135-214 6 (86) 48 172* 11.15 141-222 6 (86)
8 PLA/EX 171 20.90 97-223 6 (86) 16 205 24.56 115-300 7(100) 24 164 16.25 87-208 7(100) 48 206 9.37 189-230 5 (72)
Creatinine, 8 Control 1.1 0.08 0.9-1.4 5 (72) mg/dL 16 1.1 0.08 0.9-1.4 6 ( 86)
24 1.3 0.17 0.9~1.9 6 (86) 48 1.1 0.09 0.9-1.5 6 (86)
8 PLA/EX 1.1 0.12 0.7-1.4 6 (86) 16 1.3 0.19 0.8-2.2 7(100) 24 1.3 0.12 0.9-1.7 7(100) 48 0.9 0.10 0.7-1.2 4 (57)
Uric Acid, 8 Control 6.2 0.44 5.1-7.3 5 (72) mg/dL 16 5.2 0.47 4.3-7.1 6 (86)
24 5.1 0.51 3.7-6.6 5 (72) 48 3.9 0.28 3.2-5.0 6 (86)
8 PLA/EX 5.6 1.17 3.4-7.4 3 (43) 16 6.3 0.84 3.4-9.7 7(100) 24 5.6 0.73 3.2-8.3 7(100) 48 3.7 1.02 2.2-6.7 4 (57)
Calcium, 8 Control 7.9* 0.19 7.4-8.4 5 (72) mg/dL 16 7.3 0.19 6.7-7.9 6 ( 86)
24 7.2 0.37 6.4-8.6 5 (72) 48 6.8 0.21 6.3-7.6 6 (86)
8 PLA/EX 6.8 0.16 6.4-7.1 4 (57) 16 6.8 0.27 6.1-8.2 7(100) 24 6.6 0.25 6.0-7.9 7(100) 48 6.0 0.43 5.3-7.2 4 (57)
Phosphate, 8 Control 3.5 0.43 2.4-4.8 5 (72) mg/dL 16 3.6 0.30 2.6-4.7 6 (86)
24 2.9 0.21 2.2-3.3 5 ( 72) 48 1.7 0.19 1.2-2.5 6 (86)
8 PLA/EX 3.1 0.48 2.1-4.4 4 (57) 16 2.9 0.61 1.0-6.0 7(100) 24 2.7 0.32 1.3-3.9 7(100) 48 1.4 0.28 0.9-2.2 4 (57)
* p<.05

119
Total calcium means were significantly different
(p<.05) at PBH 8 when the control mean was 7.9 mg/dL
compared to 6.8 mg/dL for the PLA/EX group. No other PBH
mean was significantly different on the variable (p>.05).
Both the control and PLA/EX means were below the lower
limit of normal (8.6-10.7 mg/dL) at all PBH intervals.
Serum phosphate mean levels were not significantly
different (p>.05) between the groups at any PBH interval.
Mean values remained WNL (2.4 to 4.1 mg/dL) until PBH 48
when both groups decreased below the lower limit of nor
mal.
Total bilirubin and direct bilirubin were both found
not to be significantly different (p>.05) between group
means at any PBH interval (Table 13). Total bilirubin
means remained WNL (0.3 to 1.9 mg/dL) as did direct bili
rubin means (0.0 to 0.3 mg/dL).
Total protein mean values were not significantly
different (p>.05) between the control and PLA/EX group at
any PBH interval. The means in both groups at all PBH
intervals remained below the lower limits of normal (6.4-
8.1 g/dL).
Albumin mean values were not significantly different
(p>.05) between the groups. At no time did the mean
levels reach the lower limits of normal for albumin (4.0
to 5.1 g/dL).
Cholesterol mean levels were initially WNL (128-288

120
Table 13 - Chemistries 3
Variable PBH Group Mean SE Range No. (%)
jI'ota1 Bi1i- 8 Control 1.0 0.16 0.6-1.5 5 (72) rubin, 16 0.9 0.14 0.5-1.3 6 (86) mg/dL 24 0.9 0.26 0.4-1.7 5 (72)
48 1.2 0.57 0.5-4.0 6 (86) 8 PLA/EX 0.9 0.19 0.5-1.4 4 (57)
16 1.5 0.32 0.3-2.4 7(100) 24 1.3 0.30 0.5-2.7 7(100) 48 1.2 0.36 0.5-2.1 4 (57)
Direct Bi1 8 Control 0.18 0.04 0.1-0.3 5 (72) rubin, 16 0.12 0.02 0.1-0.2 6 (86) mg/dL 24 0.12 0.02 0.1-0.2 5 (72)
48 0.13 0.02 0.1-0.2 6 (86) 8 PLA/EX 0.15 0.03 0.1-0.2 4 ( 57)
16 0.19 0.06 0.0-0.5 7(100) 24 0.16 0.02 0.1-0.2 7(100) 48 0.13 0.05 0.0-0.2 4 (57)
Total Protein 8 Control 4.5 0.36 3.4-5.0 4 (57) g/dL 16 3.3 0.36 2.0-5.0 6 (86)
24 3.4 0.60 1.8-5.5 5 (72) 48 3.5 0.20 3.0-4.0 6 (86)
8 PLA/EX 3.5 0.44 2.6-4.7 4 (57) 16 3.8 0.37 2.0-5.0 7(100) 24 3.8 0.30 2.8-5.2 7(100) 48 3.4 0.28 3.0-4.0 4 (57)
~lbumin, 8 Control 2.7 0.28 1.9-3.2 5 (72) g/dL 16 2.0 0.24 1.0-3.0 6 (86)
24 2.0 0.38 1.1-3.4 5 (72) 48 1.9 0.17 1.0-2.0 6 (86)
8 PLA/EX 2.0 0.36 1.3-3.0 4 (57) 16 2.4 0.22 1.0-3.0 7(100) 24 2.3 0.20 1.6-3.1 7(100) 48 2.0 0.13 2.0-2.0 4 (57)
Cholesterol, 8 Control 157 24.25 97-242 5 (72) mg/dL 16 119 12.40 84-158 6 (86)
24 III 17.06 66-147 5 (72) 48 98 8.16 74-122 6 (86)
8 PLA/EX 145 23.14 95-200 4 (57) 16 117 5.48 90-133 7(100) 24 114 6.26 89-144 7(100) 48 114 12.74 90-149 4 (57)

121
mg/dL) for both groups at PBH 8 but then decreased below
the lower limit of normal at all subsequent PBH intervals.
No significant difference was found on this variable be
tween the control and PLA/EX group (p>.05).
GGTP mean values remained WNL (5-85 rU/L) at all PBH
intervals (Table 14). A statistically significant dif
ference (p<.Ol) was found between the groups at PBH 24
when the control mean was 32 rU/L and the PLA/EX was 11
rU/L. No significant difference was found at other PBH
intervals (p>.05).
Alkaline phosphatase (ALK PHOS) means were not
significantly different between groups 1p>.05) at any PBH
interval. The mean values were WNL (40-139 rU/L) at all
PBH intervals in both the control and PLA/EX group.
LDH mean values were above normal (138-328 rU/L) in
the control group at PBH 8 and 24. The PLA/EX group had
elevated LDH means at all PHB intervals. No statistically
different mean values were found between the control and
PLA/EX group (p>.05).
SGOT mean values were above normal (11-43 rU/L) at
PBH 8 and 24 in the control and all PBH in the PLA/EX
group. No statistical difference was found between the
control and PLA/EX group on this variable.
SGPT mean values remained WNL (11-85 rU/L) in both
groups at all PBH intervals. No significant difference
was found between the groups.

122
Table 14 - Chemistries 4
Variable PBH Group Mean SE Range No. ( % )
~GTP, lUlL 8 Control 30 11.00 11-73 5 (72) 16 23 5.35 8-47 6 (86) 24 32* 2.56 25-41 5 (72) 48 13 2.02 9-20 5 ( 72)
8 PLA/EX 17 4.33 9-29 4 (57) 16 12 2.03 6-22 7(100) 24 11 1.26 8-18 7(100) 48 9 1.20 7-11 3 (43)
~LK PHOS, 8 Control 74 3.61 60-80 5 (72) lulL 16 53 7.61 26-81 6 (86)
24 54 13.84 27-105 5 (72) 48 57 4.21 44-68 5 (72)
8 PLA/EX 57 19.44 15-108 4 (57) 16 54 3.91 39-69 7(100) 24 55 3.21 42-67 7(100) 48 71 12.49 53-95 3 (43)
LDH, lulL 8 Control 404 52.13 311-519 4 (57) 16 305 38.97 202-440 6 ( 86) 24 343 59.65 230-558 5 (72) 48 289 38.31 225-407 5 (72)
8 PLA/EX 513 170.32 213-999 4 (57) 16 365 36.58 188-498 7(100) 24 414 78.26 273-852 7(100) 48 482 112.64 296-685 3 ( 43)
SGOT, lulL 8 Control 46 9.76 30-82 5 (72) 16 30 3.66 18-44 6 (86) 24 46 13.72 25-99 5 (72) 48 25 2.46 21-33 5 (72)
8 PLA/EX 51 16.62 25-99 4 (57) 16 45 8.29 17-79 7(100) 24 52 12.69 17-99 7(100) 48 57 22.05 24-99 3 (43)
SGPT, lulL 8 Control 35 8.88 20-69 5 (72) 16 30 4.88 15-45 6 (86) 24 38 9.87 5-67 5 (72) 48 20 3.62 12-33 5 (72)
8 PLA/EX 32 5.92 22-46 4 (57) 16 29 3.22 12-39 7(100) 24 31 6.71 12-56 7(100) 48 42 25.70 11-93 3 ( 43)
* p<.Ol

123
Lactic acid mean values were above normal (0.5-2.2
mEq/L) at all PBH intervals in both the control and PLA/EX
groups (Table 15). No statistically significant difference
was found between the groups at any PBH interval.
Coagulation Studies
Prothrombin time (PT), patient, was prolonged above
normal values (10.0-14.4 seconds) in the control group at
PBH 24 and in the PLA/EX group at PBH 8 (Table 16). Mean
values for PT, control, were WNL (32 to 48 seconds) at
all PBH intervals for both control and PLA/EX group. No
statistical difference was found between the two groups
on this variable (p>.05). Partial thromboplastin time
(PTT) patient and PTT control remained WNL in both the
control group and the PLA/EX group at all PBH intervals.
No significant difference between the means of control
and PLA/EX group was found (p>.05). Fibrinogen mean
values remained WNL (150-350 mg/dL) in both the control
and PLA/EX groups until PBH 48 when the control mean was
elevated to 552 mg/dL and PLA/EX mean was 490 mg/dL. No
statistically significant difference was found at any PBH
between group means (p>.05).
Pulmonary Variables
The fraction of inspired oxygen (FiO ) mean was above 2
that of room air (21%) at all PBH intervals in both groups
(Table 17). There was a statistically significant dif-

124
Table 15 - Chemistries 5
Variable PBH Group Mean SE Range No. ( % )
Lactic Acid, 8 Control 3.4 0.87 1.6-6.6 5 ( 72) mEq/L 16 3.5 0.90 1.0-7.0 6 (86)
24 4.1 0.85 1.9-7.0 6 (86) 48 2.6 0.24 2.0-4.0 6 (86)
8 PLA/EX 4.5 1.22 2.1-8.5 5 (72) 16 7.5 1.70 3.0-16.0 7(100) 24 5.2 0.77 2.7-7.6 7(100) 48 2.8 0.35 2.0-4.0 5 ( 72)

125
Table 16 - Coagulation Studies
Variable PBH Group Mean SE Range No. ( % )
PT patient, 8 Control 12.6 0.47 11.0-13.7 5 (72) Sec. 16 14.0 0.39 13.2-15.7 6 (86)
24 15.1 0.49 13.2-16.4 6 (86) 48 13.0 0.47 11.0-15.0 6 ( 86)
8 PLA/EX 14.9 1.82 12.1-22.0 5 (72) 16 14.0 0.58 12.4-16.3 7(100) 24 14.1 0.58 12.2-16.2 7(100) 48 13.3 0.34 12.0-14.0 5 (72)
~T Control, 8 Control 12.2 0.18 11.8-12.7 5 (72) Sec. 16 12.3 0.13 11.9-12.7 6 (86)
24 12.4 0.11 12.1-12.8 6 ( 86) 48 12.3 0.15 12.0-13.0 6 (86)
8 PLA/EX 13.2 0.87 11.9-16.6 5 ( 72) 16 12.7 0.39 11.7-14.8 7(100) 24 12.7 0.41 11.7-14.9 7(100) 48 12.5 0.26 12.0-13.0 5 (72)
PTT Patient, 8 Control 32 0.68 30-33 5 (72) Sec. 16 36 1.77 32-42 6 (86)
24 38 2.75 27-45 6 (86) 48 34 1.51 30-41 6 (86)
8 PLA/EX 40 3.91 30-54 5 (72) 16 42 2.35 35-53 7(100) 24 42 2.62 33-52 7(100) 48 36 2.28 30-42 5 (72)
PTT Control, 8 Control 38 1.14 34-40 5 ( 72) Sec. 16 38 1.02 34-41 6 (86)
24 39 0.43 37-40 6 (86) 48 38 0.49 37-40 6 (86)
8 PLA/EX 41 2.58 37-51 5 (72) 16 39 0.72 37-42 7(100) 24 40 1.06 36-45 7(100) 48 39 0.45 38-40 5 (72)
Fibrinogen, 8 Control 235 21.96 196-297 4 ( 57) mg/dL 16 249 15.86 197-290 6 ( 86)
24 319 34.00 255-380 4 (57) 48 552 39.39 450-694 6 (86/
8 PLA/EX 202 42.94 60-320 5 (72' 16 209 14.41 153-274 7(100' 24 256 23.36 170-265 7(100/ 48 490 65.33 322-626 4 (57~
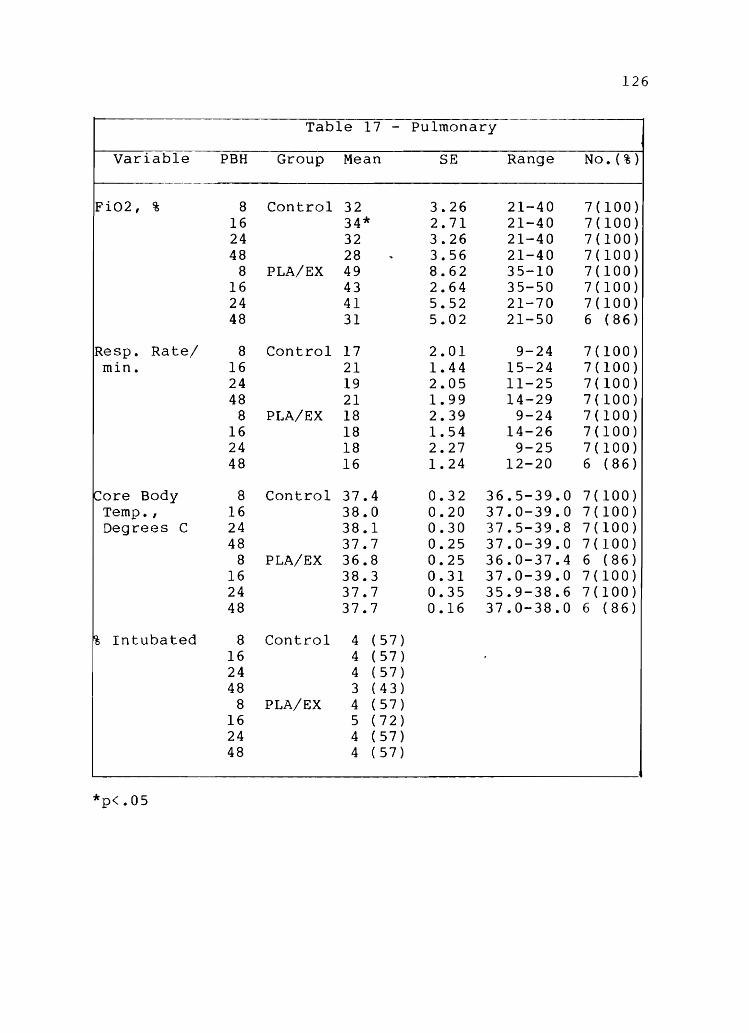
126
Table 17 - Pulmonary
Variable PBH Group Mean SE Range No. ( % )
Fi02, % 8 Control 32 3.26 21-40 7(100) 16 34* 2.71 21-40 7(100) 24 32 3.26 21-40 7(100) 48 28 .. 3.56 21-40 7(100)
8 PLA/EX 49 8.62 35-10 7(100) 16 43 2.64 35-50 7(100) 24 41 5.52 21-70 7(100) 48 31 5.02 21-50 6 (86)
Resp. Rate/ 8 Control 17 2.01 9-24 7(100) min. 16 21 1.44 15-24 7(100)
24 19 2.05 11-25 7(100) 48 21 1.99 14-29 7(100)
8 PLA/EX 18 2.39 9-24 7(100) 16 18 1.54 14-26 7(100) 24 18 2.27 9-25 7(100) 48 16 1.24 12-20 6 (86)
~ore Body 8 Control 37.4 0.32 36.5-39.0 7(100) Temp. , 16 38.0 0.20 37.0-39.0 7(100) Degrees C 24 38.1 0.30 37.5-39.8 7(100)
48 37.7 0.25 37.0-39.0 7(100) 8 PLA/EX 36.8 0.25 36.0-37.4 6 (86)
16 38.3 0.31 37.0-39.0 7(100) 24 37.7 0.35 35.9-38.6 7(100) 48 37.7 0.16 37.0-38.0 6 (86)
% Intubated 8 Control 4 (57) 16 4 (57) 24 4 (57) 48 3 (43)
8 PLA/EX 4 (57) 16 5 (72) 24 4 (57) 48 4 (57)
*p<.05
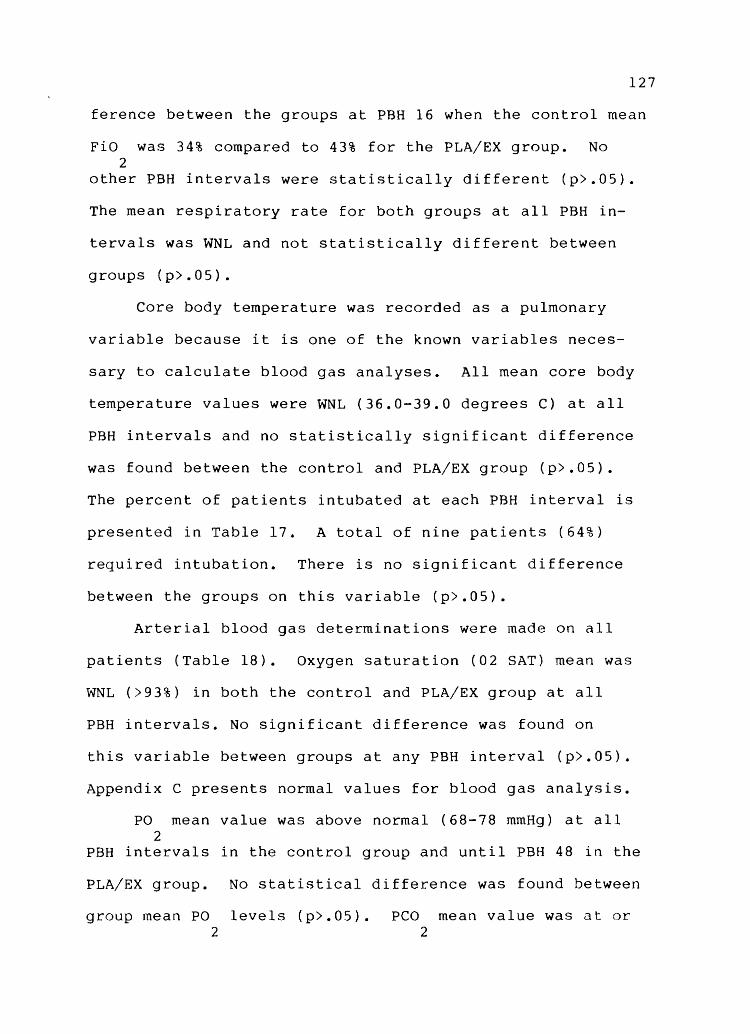
127
ference between the groups at PBH 16 when the control mean
FiO was 34% compared to 43% for the PLA/EX group. No 2
other PBH intervals were statistically different (p>.OS).
The mean respiratory rate for both groups at all PBH in-
tervals was WNL and not statistically different between
groups (p>.OS).
Core body temperature was recorded as a pulmonary
variable because it is one of the known variables neces-
sary to calculate blood gas analyses. All mean core body
temperature values were WNL (36.0-39.0 degrees C) at all
PBH intervals and no statistically significant difference
was found between the control and PLA/EX group (p>.OS).
The percent of patients intubated at each PBH interval is
presented in Table 17. A total of nine patients (64%)
required intubation. There is no significant difference
between the groups on this variable (p>.OS).
Arterial blood gas determinations were made on all
patients (Table 18). Oxygen saturation (02 SAT) mean was
WNL (>93%) in both the control and PLA/EX group at all
PBH intervals. No significant difference was found on
this variable between groups at any PBH interval (p>.OS).
Appendix C presents normal values for blood gas analysis.
PO mean value was above normal (68-78 mmHg) at all 2
PBH intervals in the control group and until PBH 48 in the
PLA/EX group. No statistical difference was found between
group mean PO levels (p>.OS). 2
PCO mean value was at or 2
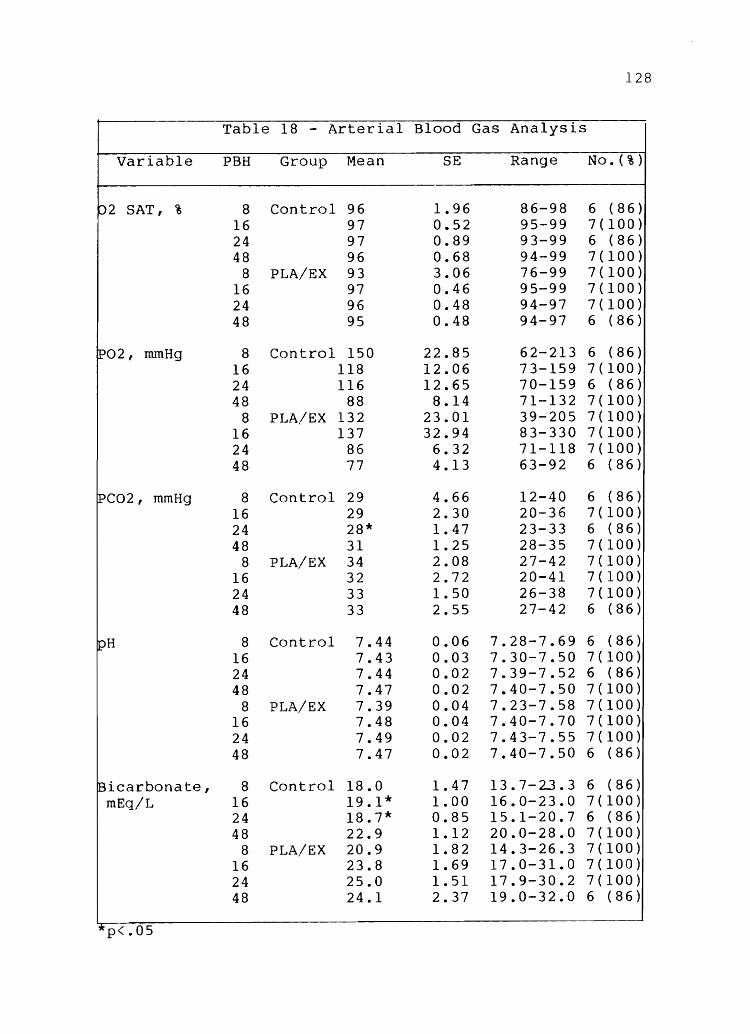
128
Table 18 - Arterial Blood Gas Analysis
Variable PBH Group Mean SE Range No. (%)
02 SAT, % 8 Control 96 1.96 86-98 6 (86) 16 97 0.52 95-99 7(100) 24 97 0.89 93-99 6 (86) 48 96 0.68 94-99 7(100)
8 PLA/EX 93 3.06 76-99 7(100) 16 97 0.46 95-99 7(100) 24 96 0.48 94-97 7(100) 48 95 0.48 94-97 6 (86)
P02, mmHg 8 Control 150 22.85 62-213 6 (86) 16 118 12.06 73-159 7(100) 24 116 12.65 70-159 6 (86) 48 88 8.14 71-132 7(100)
8 PLA/EX 132 23.01 39-205 7(100) 16 137 32.94 83-330 7(100) 24 86 6.32 71-118 7(100) 48 77 4.13 63-92 6 (86)
IPC02, mmHg 8 Control 29 4.66 12-40 6 (86) 16 29 2.30 20-36 7(100) 24 28* 1.47 23-33 6 (86) 48 31 1.25 28-35 7(100)
8 PLA/EX 34 2.08 27-42 7(100) 16 32 2.72 20-41 7(100) 24 33 1.50 26-38 7(100) 48 33 2.55 27-42 6 (86)
pH 8 Control 7.44 0.06 7.28-7.69 6 (86) 16 7.43 0.03 7.30-7.50 7(100) 24 7.44 0.02 7.39-7.52 6 (86) 48 7.47 0.02 7.40-7.50 7(100)
8 PLA/EX 7.39 0.04 7.23-7.58 7(100) 16 7.48 0.04 7.40-7.70 7(100) 24 7.49 0.02 7.43-7.55 7(100) 48 7.47 0.02 7.40-7.50 6 (86)
Bicarbonate, 8 Control 18.0 1.47 13.7-23.3 6 (86) mEq/L 16 19.1* 1.00 16.0-23.0 7(100)
24 18.7* 0.85 15.1-20.7 6 (86) 48 22.9 1.12 20.0-28.0 7(100)
8 PLA/EX 20.9 1.82 14.3-26.3 7(100) 16 23.8 1.69 17.0-31.0 7(100) 24 25.0 1.51 17.9-30.2 7(100) 48 24.1 2.37 19.0-32.0 6 (86)
* p<.05

129
below normal values (31-41 mmHg) at all measured PBH in-
tervals. PLA/EX group mean values were WNL at all PBH in-
tervals. A statistically significant difference was found
between PCO levels at PBH 24 when control mean was 28 2
mmHg compared to a mean PLA/EX value of 33 mmHg (p<.05).
other PBH means did not significantly differ between
groups (p>.05). Arterial pH values were different from
normal (7.35 to 7.45) in the control at PBH 48 and in the
PLA/EX group at PBH 16, 24, and 48. These differences
were not significant between the control and PLA/EX group
at any PBH interval.
Bicarbonate levels were below normal (22.0-26.0
mEq/L) in the control at PBH 8, 16, and 24 and in the
PLA/EX group at PBH 8. A statistically significant dif-
ference was found between groups at two PBH intervals, PBH
16 and 24 (p<.05). At PBH 16, the control mean bicarbo-
nate value was 19.1 mEq/L compared to 23.8 mEq/L in the
PLA/EX group. At PBH 24, the control mean was 18.7 mEq/L
compared to 25.0 mEq/L for the PLA/EX group. Other PBH
interval means were not significantly different (p>.05).
Mixed venous blood gas determinations were analyzed
for each patient (Table 19). Oxygen saturation (0 SAT) 2
was maintained WNL (60-85%) in both groups at all PBH in-
tervals (Appendix C presents normal values for mixed ve-
nous blood analysis). A significant difference (p<.05)
was found between the groups at PBH 16 when the control
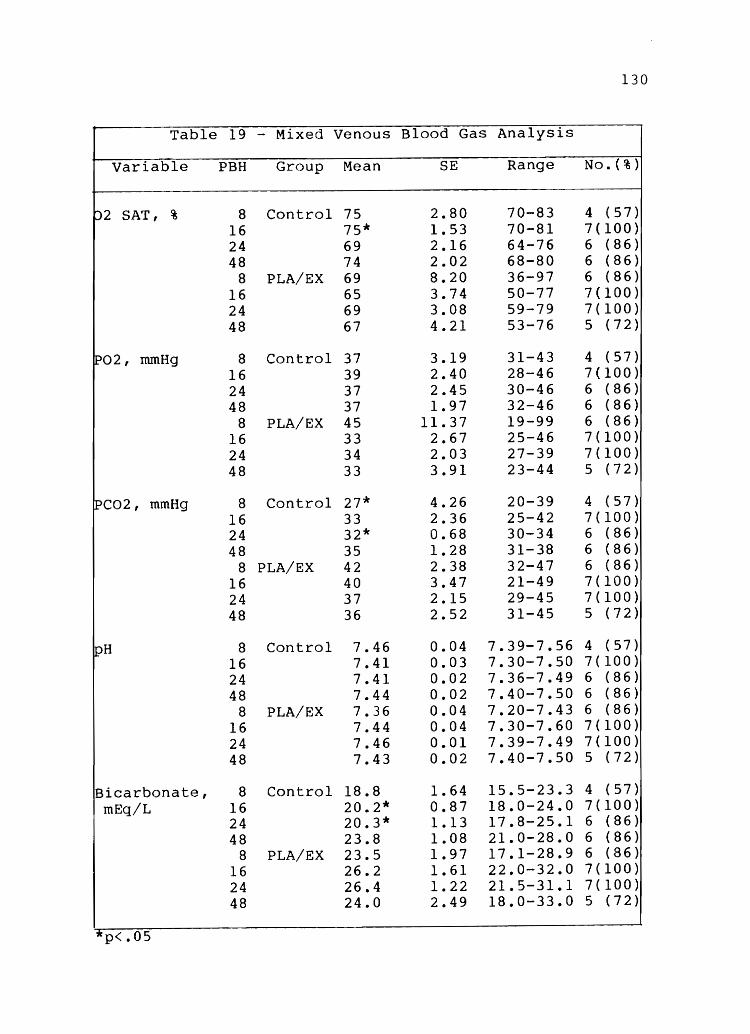
130
Table 19 - Mixed Venous Blood Gas Analysis
Variable PBH Group Mean SE Range No. (%)
02 SAT, % 8 Control 75 2.80 70-83 4 (57) 16 75* 1.53 70-81 7(100) 24 69 2.16 64-76 6 (86) 48 74 2.02 68-80 6 (86)
8 PLA/EX 69 8.20 36-97 6 (86) 16 65 3.74 50-77 7(100) 24 69 3.08 59-79 7(100) 48 67 4.21 53-76 5 (72)
~02, mmHg 8 Control 37 3.19 31-43 4 (57) 16 39 2.40 28-46 7(100) 24 37 2.45 30-46 6 (86) 48 37 1.97 32-46 6 (86)
8 PLA/EX 45 11.37 19-99 6 (86) 16 33 2.67 25-46 7(100) 24 34 2.03 27-39 7(100) 48 33 3.91 23-44 5 (72)
lPC02, mmHg 8 Control 27* 4.26 20-39 4 (57) 16 33 2.36 25-42 7(100) 24 32* 0.68 30-34 6 (86) 48 35 1.28 31-38 6 (86)
8 PLA/EX 42 2.38 32-47 6 (86) 16 40 3.47 21-49 7(100) 24 37 2.15 29-45 7(100) 48 36 2.52 31-45 5 (72)
pH 8 Control 7.46 0.04 7.39-7.56 4 (57) 16 7.41 0.03 7.30-7.50 7(100) 24 7.41 0.02 7.36-7.49 6 (86) 48 7.44 0.02 7.40-7.50 6 (86)
8 PLA/EX 7.36 0.04 7.20-7.43 6 (86) 16 7.44 0.04 7.30-7.60 7(100) 24 7.46 0.01 7.39-7.49 7(100) 48 7.43 0.02 7.40-7.50 5 (72)
Bicarbonate, 8 Control 18.8 1.64 15.5-23.3 4 (57) mEq/L 16 20.2* 0.87 18.0-24.0 7(100)
24 20.3* 1.13 17.8-25.1 6 (86) 48 23.8 1.08 21.0-28.0 6 (86)
8 PLA/EX 23.5 1.97 17.1-28.9 6 (86) 16 26.2 1.61 22.0-32.0 7(100) 24 26.4 1.22 21.5-31.1 7(100) 48 24.0 2.49 18.0-33.0 5 (72)
"* p<.05

mean 0 SAT was 75% compared with a PLA/EX group mean of 2
131
65%. Other PBH interval means were not significantly dif-
ferent (p>.05). PO mean values were also kept either at 2
or above normal values at all PBH intervals. There was no
significant difference between the groups at any PBH mean
value (p>.05).
peo mean control values were below the normal range 2
(38-50 mmHg) at all PBH intervals. The PLA/EX values were
WNL at PBH 8 and 16 and below normal at PBH 24 and 48.
There was a significant difference between the groups at
PBH 8 and 24 (p<.05). At PBH 8, the control peo was 27 2
mmHg compared to 42 mmHg for the PLA/EX group. At PBH 24,
the control peo was 32 mmHg compared to 37 mmHg for the 2
PLA/EX group. No significant difference was found between
the groups at other PBH intervals for this variable
(p>.05).
Serum pH mean levels were different from normals
(7.32-7.42) at PBH 8 and 48 in the control and at PBH 16,
24, and 48 in the PLA/EX group_ No significant difference
was found between the group means at any PBH interval
(p>.05). Bicarbonate levels were less than the lower
limit of normal (22-29 mEq/L) in the mean control values
at PBH 8, 16, and 24. All PLA/EX group means were WNL at
all PBH intervals. A significant difference was found
between the groups at PBH 16 and 24. The control mean
bicarbonate at PBH 16 was 20.2 mEq/L compared to 26.2

132
mEq/L for the PLA/EX group. At PBH 24, the control mean
was 20.3 mEq/L compared to the PLA/EX group value of 26.4
mEq/L. Other PBH intervals did not show a significant
difference.
Base Excess
Arterial blood gas (ABG) base excess mean values
were WNL (-3 to 3) at all PBH control intervals except
PBH 8 when the mean value was -3.5 (Table 20). The
PLA/EX group means remained WNL at all PBH intervals.
There was a significant difference between the groups
(p<.05) at PBH 16 and 24. At PBH 16, the control mean
base excess was -3.0 compared to 1.9 for the PLA/EX
group. At PBH 24, the control mean base excess was -3.1
comapred to 3.0 for the PLA/EX group. No significant
difference was found between the groups at other PBH in
tervals measured (p>.05). The mixed venous blood base
excess mean was WNL at all PBH intervals for the control
and all except PBH 24 for the PLA/EX group. There was a
significant difference between groups on PBH 16 and 24
(p<.05). The control PBH 16 mean was -2.8 compared to
2.7 for the PLA/EX group. The control PBH 24 mean value
was -2.6 compared to 3.5 for the PLA/EX group. There was
no significant difference between the groups at other PBH
intervals.
Cardiopulmonary Profile
The physiological variables either measured by or
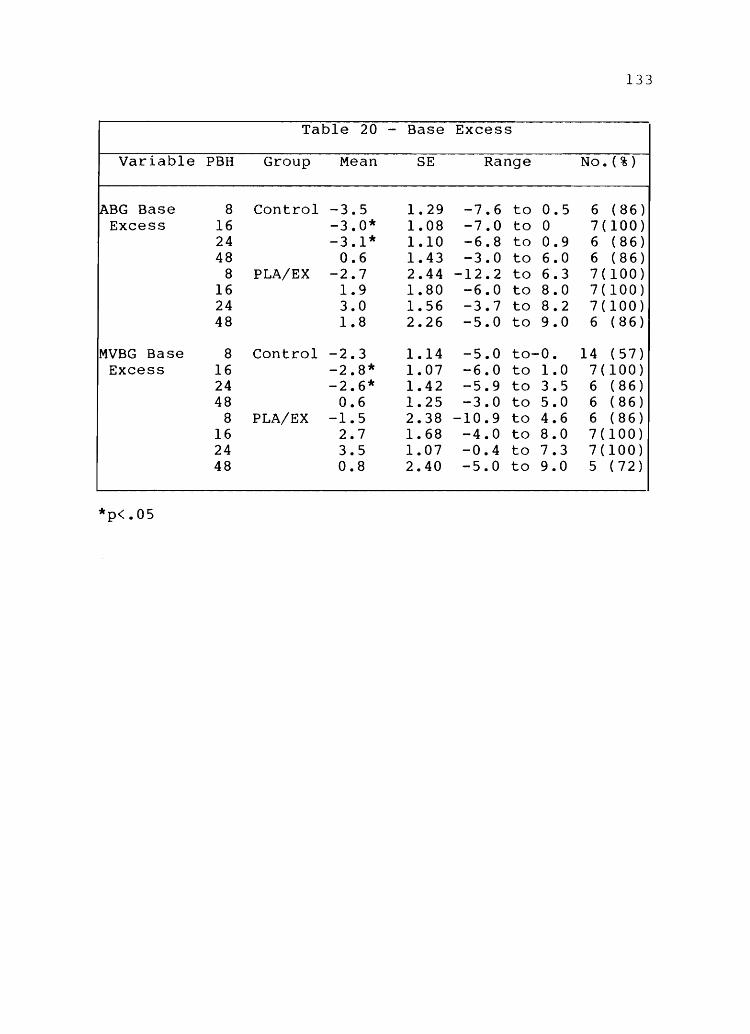
133
Table 20 - Base Excess
Variable PBH Group Mean SE Range No. ( % )
~BG Base 8 Control -3.5 1.29 -7.6 to 0.5 6 (86) Excess 16 -3.0* 1.08 -7.0 to 0 7(100)
24 -3.1* 1.10 -6.8 to 0.9 6 (86) 48 0.6 1.43 -3.0 to 6.0 6 (86)
8 PLA/EX -2.7 2.44 -12.2 to 6.3 7(100) 16 1.9 1.80 -6.0 to 8.0 7(100) 24 3.0 1.56 -3.7 to 8.2 7(100) 48 1.8 2.26 -5.0 to 9.0 6 (86)
MVBG Base 8 Control -2.3 1.14 -5.0 to-O. 14 (57) Excess 16 -2.8* 1.07 -6.0 to 1.0 7(100)
24 -2.6* 1.42 -5.9 to 3.S 6 (86) 48 0.6 1.25 -3.0 to 5.0 6 (86)
8 PLA/EX -l.S 2.38 -10.9 to 4.6 6 (86) 16 2.7 1.68 -4.0 to 8.0 7(100) 24 3.S 1.07 -0.4 to 7.3 7(100) 48 0.8 2.40 -S.O to 9.0 S (72)
*p<.OS

134
calculated from the Swan-Ganz catheter monitor system are
referred to as a cardiopulmonary profile. The normal pa-
rameters are presented in Appendix C.
The pulmonary artery (PA) mean pressure was WNL (9-18
mmHg) at all PBH intervals for both control and PLA/EX
groups (Table 21). There was no significant difference
between the groups on any PBH mean value (p>.05). The
pulmonary artery wedge pressure (PAWP) was WNL (6-15
mmHg) at all PBH intervals for the control and all except
PBH 8 for the PLA/EX group when the mean value was 5
mmHg. There was no statistical difference between the
control and PLA/EX group on any PBH mean value for PAWP
(p>.05).
Cardiac output was WNL (3.5-6.5 L/min) for the con-
trol from PBH 8 through 24 but was above normal at 6.9
L/min by PBH 48. The PLA/EX group remained WNL at all PBH
intervals. There was no statistical difference between
the control and PLA/EX group on this variable (p>.05).
Cardiac index as an indicator of cardiac output 2
per m BSA likewise showed no statistical difference 2
(p>.05). Stroke work index was WNL (41-51 mL/beat/m BSA)
for both groups at all PBH intervals. No statistical dif-
ference was found between the PBH mean values for this va-
riable (p>.05).
Systemic vascular resistance index (SVRI) was above 2 5
normal values (1970-2390 Dynes/second/m BSA/cm) at PBH 8

135
Table 21 - Cardiopulmonary Profile
Variable PBH Group Mean SE Range No. (%)
PA mean 8 Control 11 2.59 5-19 5 ( 72) mmHg 16 14 1.86 7-21 7(100)
24 15 1.46 10-19 6 (86) 48 17 2.91 6-28 6 (86)
8 PLA/EX 17 2.44 10-25 5 (72) 16 13 2.26 5-20 7(100) 24 17 2.92 10-27 7(100) 48 16 3.86 7-26 5 (72)
PAWP, mmHg 8 Control 7 1.00 4-10 5 (72) 16 7 1.55 3-13 6 (86) 24 8 1.34 5-11 5 (72) 48 10 2.26 1-16 6 (86)
8 PLA/EX 5 1.32 3-8 4 (57) 16 7 1.76 1-15 7(100) 24 8 2.31 0-18 7(100) 48 8 3.39 2-20 5 (72)
~ardiac Out- 8 Control 5.4 0.66 3.4-7.2 5 (72) put, L/Min 16 6.5 1.01 3.7-11.7 7(100)
24 4.9 0.52 2.9-6.6 6 (86) 48 6.9 1.02 4.4-9.8 6 (86)
8 PLA/EX 4.7 0.87 1.3-7.4 6 (86) 16 5.4 0.63 3.5-8.3 7(100) 24 5.8 0.45 4.5-7.8 7(100) 48 5.6 0.41 4.3-6.8 5 (72)
~ardiac Index, 8 Control 2.7 0.45 1.8-3.2 3 (43) L/Min/ 16 3.2 1.03 1.5-7.0 5 (72) m2 BSA 24 2.4 0.30 1.6-3.1 5 (72)
48 3.5 0.67 2.0-5.0 4 (57) 8 PLA/EX 2.6 0.52 0.6-4.3 6 (86)
16 3.0 0.43 2.0-5.0 7(100) 24 3.2 0.35 2.0-4.3 7(100) 48 3.1 0.33 3.0-4.0 5 (72)
~troke Work 8 Control 23.8 7.05 16.7-30.8 2 ( 28) Index, mL/ 16 36.0 14.46 19.0-65.0 3 (43) beat/ 24 24.6 7.38 14.3-38.9 3 (43) m2 BSA 48 29.4 5.77 19.0-44.0 4 ( 57)
8 PLA/EX 24.9 6.62 8.1-39.9 4 (57) 16 23.6 4.59 11.0-36.0 5 (72) 24 24.6 4.99 15.3-38.5 4 (57) 48 24.8 1.88 21.0-32.0 5 (72)

136
for both control and PLA/EX and then returned to WNL for
the remaining PBH intervals (Table 22). There was no sta-
tistical significance between the groups on this variable
(p>.05). Pulmonary vascular resistance index (PVRI) was 2 5
below normal values (225-315 Dynes/second/m BSA/cm ) in
the control at PBH 8, 16, and 48 and in the PLA/EX group
at PBH 16 and 48. No statistical difference in PVRI was
found at any PBH interval. Systemic blood pressure (BP)
mean was WNL (70-105 mmHg) at all PBH interval means in
both groups. Systemic BP diastolic was also WNL (60-90
mmHg) in both groups at all PBH intervals. There were no
significant differences between the group means on the va-
riables of mean BP or diastolic BP (p>.05).
Heart rate was above normal values (80-120 beats/min)
at PBH 8 in the control and at all intervals in the PLA/EX
group. The difference was not significant at any PBH
interval between groups (p>.05).
Arterial-venous oxygen difference (A-VO DIFF) was 2
above normal values (4.6-5.4 mL 0 /100 mL) at PBH 8 and 24 2
and below normal at PBH 16 and 48 in the control (Table
23). The PLA/EX group was above normal at PBH 8, 16, and
24 and WNL at PBH 48. There was not a significant dif-
ference between the mean PBH interval values (p>.05).
Oxygen consumption was above the normal of 240 mL/min
in both groups at all PBH intervals. The difference be-
tween the control and PLA/EX group on the mean 0 con-2

137
Table 22 - Cardiopulmonary Profile 2
Variable PBH Group Mean SE . Range No. ( % )
Systemic 8 Control 2967 1166.00 1801-4133 2 (28) Vascular 16 1919 399.36 903-3287 5 (72) Resistance 24 2051 219.91 1432-2667 5 (72) Index, 48 2032 536.69 916-3103 4 (57) Dynes/sec/ 8 PLA/EX 3865 2052.84 1142-9953 4 (57) m2 BSA/ 16 2360 282.75 1498-3116 6 (86) emS 24 2166 250.81 1336-2832 5 (72)
48 2462 186.03 1865-2886 5 (72)
Pulmonary 8 Control 174 44.50 129-218 2 (28) Vascular 16 158 30.57 37-198 5 (72) Resistance 24 248 104.98 108-666 5 (72) Index, 48 149 30.83 104-208 3 (43) Dynes/sec/ 8 PLA/EX 373 205.92 92-985 4 (57) m2 BSA/ 16 189 37.25 35-277 6 (86) emS 24 246 99.63 71-531 4 (57)
48 192 85.33 65-519 5 (72)
~ystemic BP, 8 Control 100 0.00 100 1 ( 14) mean, mmHg 16 87 12.01 72-111 3 ( 43)
24 71 5.49 62-81 3 (43) 48 80 6.38 62-91 5 (72)
8 PLA/EX 84 12.01 69-108 3 (43) 16 86 4.65 75-100 5 (72) 24 84 5.51 75-94 3 (43) 48 96 3.93 91-104 3 (43)
Systemic BP 8 Control 68 3.17 52-76 7(100) Diastolic, 16 68 5.82 51-92 7(100) mmHg 24 67 5.22 47-88 7(100)
48 63 5.18 45-80 7(100) 8 PLA/EX 66 7.08 41-89 6 (86)
16 71 3.50 58-83 7(100) 24 70 3.51 58-82 7(100) 48 76 3.37 62-87 6 ( 86)
Heart Rate, 8 Control 105 8.90 78-140 7(100) Beats/Min. 16 114 9.90 81-147 7(100)
24 126 8.09 89-151 7(100) 48 121 5.04 106-142 7(100)
8 PLA/EX 121 9.69 80-160 7(100) 16 133 8.93 104-164 7(100) 24 128 5.80 111-153 7(100) 48 125 4.64 108-140 6 (86)

138
Table 23 - Cardiopulmonary Profile 3
Variable PBH Group Mean SE Range No. ( % )
A-V 02 8 Control 6.4 2.35 4.0-8.7 2 (28) Diff, 16 4.1 0.68 3.0-5.0 3 ( 43) mL02/ 24 5.7 0.88 3.9-6.6 3 ( 43) 100mL 48 3.8 0.33 3.0-5.0 4 (57)
8 PLA/EX 5.7 0.63 4.0-7.0 4 (57) 16 6.1 0.76 4.0-9.0 6 (86) 24 7.2 0.75 5.2-8.8 4 (57) 48 5.2 0.65 3.0-7.0 5 (72)
02 Consump- 8 Control 256 40.00 216-296 2 (28) tion, mL/min 16 303 70.50 162-374 3 ( 43)
24 309 65.04 222-436 3 (43) 48 277 73.31 132-451 4 (57)
8 PLA/EX 279 71.02 73-376 4 (57) 16 317 83.69 155-727 6 (86) 24 427 59.15 333-596 4 (57) 48 280 18.52 224-324 5 ( 72)
02 Available 8 Control 537 80.00 457-617 2 (28) mL02/min/ 16 735 147.22 490-999 3 (43) m2 BSA 24 551 66.56 431-661 3 ( 43)
48 589 121.46 379-822 4 (57) 8 PLA/EX 488 120.17 140-653 4 (57)
16 530 62.63 390-814 6 (86) 24 585 92.27 468-860 4 (57) 48 489 23.20 416-550 5 (72)
02 Ex- 8 Control 27 7.20 20.0-34.4 2 (28) tracted, % 16 20 2.51 17.0-25.0 3 (43)
24 27 3.10 20.8-31.1 3 (43) 48 23 1.77 19.0-28.0 4 (57)
8 PLA/EX 31 2.76 24.4-36.9 4 (57) 16 31 4.25 17.0-49.0 6 (86) 24 38 0.80 36.3-39.9 4 ( 57) 48 27 6.96 2.0-44.0 5 (72)
A-a 02 8 Control 33 13.87 9-65 4 (57) Diff, mL02/ 16 48* 10.84 10-75 5 (72) 100 mL 24 43 10.60 15-72 5 ( 72)
48 39 15.38 3-99 7(100) 8 PLA/EX 144 86.83 33-490 5 (72)
16 113 19.09 34-157 6 (86) 24 112 34.18 2-291 7(100) 48 65 25.51 7-160 6 (86)
* p<.05

140
Table 24 - Cardiopulmonary Profile 4
Variable PBH Group Mean SE Range No. (%)
Shunt 8 Control 14 2.50 11-16 2 (28) (QS/QT) , % 16 22 2.80 16-30 5 (72)
24 26 6.74 9-47 5 (72) 48 26 2.72 18-30 4 (57)
8 PLA/EX 22 4.66 11-33 4 (57) 16 22 3.17 9-33 6 (86) 24 31 7.49 19-53 4 (57) 48 28 3.85 18-35 4 (57)
CVP, mmHg 8 Control 8 1.14 5-11 5 (72) 16 9 2.01 3-15 6 (86) 24 10 1.94 5-15 5 (72) 48 9 1.86 1-14 6 ( 86)
8 PLA/EX 8 2.29 2-17 6 (86) 16 7 2.13 1-15 6 (86) 24 9 2.03 2-15 7(100) 48 5 2.32 1-14 5 (72)
CHAPTER V
DISCUSSION
The purpose of this research was to analyze the data
collect~d on a group of 14 subjects entered into an ex
perimental design study for the evaluation of the effect
of plasma exchange during burn shock. The study was de
signed to allow periodic review for the purpose of deter
mining the number of cases necessary to achieve statisti
cal significance in a prospective manner. This study re
ports the preliminary findings and specifically addresses
two nursing research questions.
The Sample
The sample was found not to be evenly distributed on
the very important variable of percent TBSA burn full
thickness injury (p<.Ol). The control had an 18.3% full
thickness injury (range: 0-25) compared to the PLA/EX
group's 38.4% full-thickness injury (range: 27-46).
Thus, the subjects in the PLA/EX group were significantly
more injured than the control. This made the other study
parameters more difficult to interpret since an equal
result between two groups of subjects when one group is

142
much more severely injured does not necessarily carry the
same implications for both groups. In addition, while not
achieving statistical significance, the clinical signifi
cance of having four of the PLA/EX patients (57%) with in
halation injury compared to one patient (14%) in the con
trol further unbalances the severity of clinical injury.
Thus, the first conclusion is that the sample as now dis
tributed is uneven, with the PLA/EX group being much more
critically ill- than the control on the basis of two varia
bles: percent TBSA full-thickness injury and the inci
dence of inhalation injury.
Resuscitation Requirements
There was no statistically significant difference be
tween the groups in terms of fluid requirements in total
nor at PBH 8, 16, and 24. However, the argument could be
made that since the PLA/EX group was more severely in
jured, the equal requirement means the PLA/EX therapy
kept the requirements down. The identification of a sub
group of subjects, EXP-SUR, was made and this data com
pared to the control. Statistical significance was not
achieved on the fluid variable but the EXP-SUR group did
require less total fluid to resuscitate while, at the
same time maintaining a significantly higher hourly urine
output (p<.OI). In addition, the EXP-SUR group required
more fluid than the control in the first eight hours and
less in the subsequent two eight-hour periods. The power

143
of the t-test indicates the problem is one of small
sample size combined with wide ranges on the variables
measured. Thus, the second conclusion: The initial
trend appears to support the notion that PLA/EX decreases
fluid requirements during burn shock but significance has
not been reached due to insufficient sample size.
Physiologic Variables
The effect of PLA/EX on measurable physiologic vari
ables was also analyzed. Again, the power of the t-test
indicated an insufficient sample in all but a few vari
ables. The variables which have reached significance with
the current sample size are astonishingly strong.
Hematology
The parameters of WBC, RBC, HGB, and HCT initially
all showed the hemoconcentration effect of burn shock.
Platelets were significantly (p<.05) diminished in the
PLA/EX group thus demonstrating the reported removal of
platelets as a side-effect of the PLA/EX procedure. Thus,
the third conclusion: Plasma exchange significantly de
creases platelet counts.
Chemistries
Chemistry values were not significantly different nor
were there trends toward differences on most variables.
As expected, no electrolyte imbalances occurred because

144
all subjects were resuscitated with lactated Ringer's so
lution. The BUN and creatinine levels remained within
normal limits in both groups, indicating adequate renal
perfusion. Glucose levels were slightly elevated, an ex
pected finding secondary to the stress response. Two
other variables which differed from normals but were ex
pected in burn subjects were the findings of low albumin
levels and elevated lactic acid levels. Thus, conclusion
four: PLA/EX does not appear to alter serum chemistry
values from those expected in other burn patients.
Coagulation Studies
Coagulation studies, which included prothrombin time
and partial thromboplastin times, and fibrinogen, were
not different from normal laboratory control values, from
normal ranges, nor between study subjects. Thus, the
following conclusion is made: The coagulopathy reported
to occur in burn patients was not observed in this group
of study subjects.
Pulmonary Variables
The total group of patients (n=14) sustained flame
injury which resulted in five patients (36%) sustaining
inhalation injury. A total of nine patients (64%) re
quired intubation. One patient died at 36 hours postburn
from an overwhelming inhalation injury. Arterial and
mixed venous blood gas analysis determinations were ana-

145
lyzed for each subject. Except for occasional statis-
tica1ly significant differences in the pCO mean values, 2
there was no difference between groups. Again, since the
samples are uneven for incidence of inhalation injury
(1/7 for control; 4/7 for PLA/EX group), it can be argued
that equal results are actually an indicator of the bene-
fits of PLA/EX in minimizing the clinical response to in-2
halation injury. The FiO was significantly higher at
PBH 16 in the PLA/EX group but not at other PBH intervals.
In addition, the clinical expectation of patients with se-
vere inhalation injury is that they will require excessive
amounts of resuscitation fluid. This was not the case for
this group of subjects with inhalation injury. Thus the
next conclusion: Statistical significance was not
reached in the fluid requirements of subjects with inha-
lation injury. This appears to be a function of insuf-
ficient sample size. The base excess was significantly
different (p<.05) at PBH 16 and 24 in both MVBG and ABG
determinations with the PLA/EX being in a balance correc-
ted toward 0 while the control was in a much more severe
negative base excess. Thus the following conclusion:
The PLA/EX group was in significantly (p<.05) more normal
base excess balance at both PBH 16 and 24 than was the
control group.
Cardiopulmonary Profile
There were no statistically significant differences
146
between the control and the PLA/EX group on the measured
cardiopulmonary profiles. Again, this appears to be a
function of sample size as indicated by the minimal power
of the t-test. Since it is clinically and statistically
known that the PLA/EX group is much more severely injured,
if both groups have the same cardiac index, the results
may be implied to be better in the PLA/EX group. Thus,
the following conclusions: There were no statistically
significant differences between the control and the
PLA/EX group on the measured cardiopulmonary profiles.
This appears to be due to insufficient sample size.
Conclusions
1. The sample as now distributed is uneven, with the
PLA/EX group being much more critically ill than the
control on the basis of two variables: Percent TBSA full
thickness injury (p<.Ol) and the incidence of documented
inhalation injury.
2. Significance has not been reached on the vari
able of fluid requirement. This appears to be a function
of insufficient sample size as reflected by the low power
of the t-test.
3. PLA/EX significantly decreases platelet count
(p<.05).
4. PLA/EX does not appear to alter serum chemistry
values from the expected values of subjects with burn

injury.
5. The coagulopathy reported to occur in burn
patients was not observed in this group of subjects.
147
6. Statistical significance was not reached on the
fluid requirements of subjects with inhalation injury.
This appears to be a function of insufficient sample
size.
7. The PLA/EX group was in significantly (p<.05)
more normal base excess balance at both PBH 16 and 24.
8. There is no evidence that the PLA/EX is harmful
in any way to experimental subjects.
It is recommended that the study as designed be
continued until statistical significance is reached or
rejected.
APPENDIX A
LUND AND BROWDER CHART WITH DESCRIPTION OF DEPTH
OF INJURY
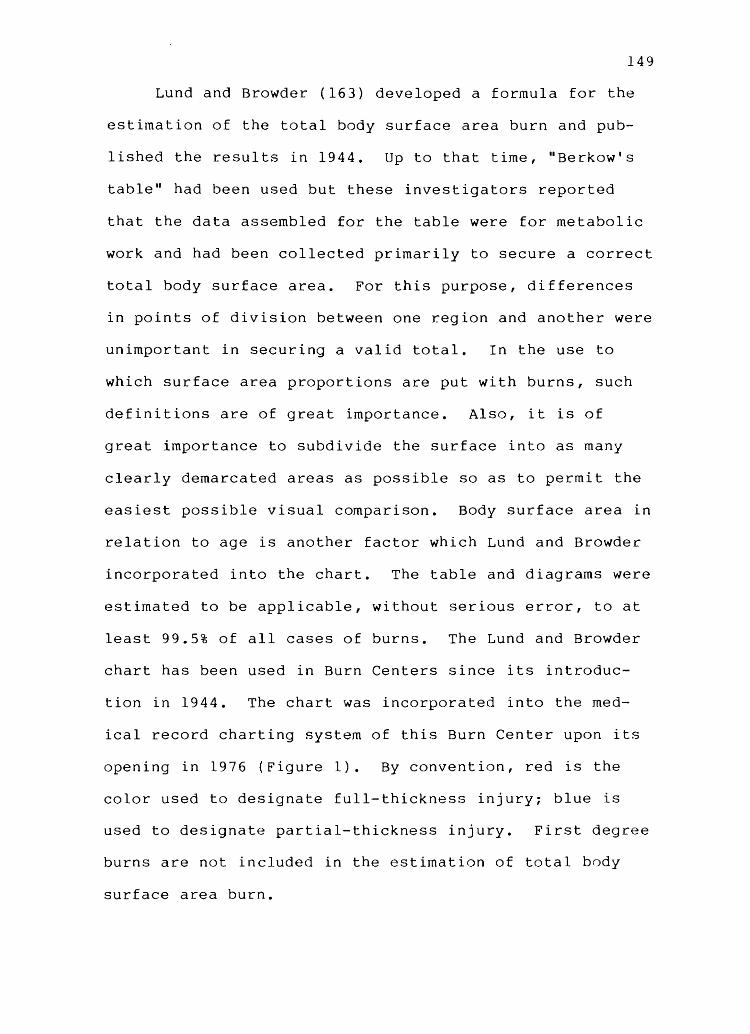
149
Lund and Browder (163) developed a formula for the
estimation of the total body surface area burn and pub
lished the results in 1944. Up to that time, "Berkow's
table" had been used but these investigators reported
that the data assembled for the table were for metabolic
work and had been collected primarily to secure a correct
total body surface area. For this purpose, differences
in points of division between one region and another were
unimportant in securing a valid total. In the use to
which surface area proportions are put with burns, such
definitions are of great importance. Also, it is of
great importance to subdivide the surface into as many
clearly demarcated areas as possible so as to permit the
easiest possible visual comparison. Body surface area in
relation to age is another factor which Lund and Browder
incorporated into the chart. The table and diagrams were
estimated to be applicable, without serious error, to at
least 99.5% of all cases of burns. The Lund and Browder
chart has been used in Burn Centers since its introduc
tion in 1944. The chart was incorporated into the med
ical record charting system of this Burn Center upon its
opening in 1976 (Figure 1). By convention, red is the
color used to designate full-thickness injury; blue is
used to designate partial-thickness injury. First degree
burns are not included in the estimation of total body
surface area burn.

University 01 Utah
Hospital
Burn Unit
Area
Head
Neck
Ant. Trunk
Post. Trunk
R.Buttock
L. Buttock
Genitalia
R. U. Arm
L. U. Arm
R. L. Arm
L. L. Arm
R. Hand
L. Hand
R. Thigh
L. Thigh
R.Leg
l. Leg
R.Foot
L. Foot
Birth 1 yr
19
2
13
13
2'h
2'/~'
1
4
4
3
3
2'/,
2'/~
5'1<
5'/2
5
5
3'12
3'/2
BURN ESTIMATE AND DIAGRAM AGE vs. AREA
1-4 5-9 10-14 15 yr yr yr. yr. Adult
17 13 11 9 7
2 2 2 2 2
13 13 13 13 13
13 13 13 13 13
2'h 2'/2 2'12 2'12 2'12
2";' 2'/, 2'/2 2'12 2'12
1 1 1 1 1
4 4 4 4 4
4 4 4 4 4
3 3 3 3 3
3 3 3 3 3
2'12 2'/2 2'12 2'12 2'12
2'12 2'12 2'/2 2'/2 2 '12
6'/2 8 8'/2 9 9'12
6'1< 8 8'12 9 9'/2
5 5'/2 6 6'12 7
5 5'/2 6 6'12 7
3'12 3'12 3'12 3'/2 3'12
3'12 3'12 3'12 3'/2 3'12
TOTAL
Donor
2° 3° Total Areas
BURN DIAGRAM o Cause of Burn~ ___ ~ __ ~ ________ _
Dateof Burn ~ __ . ____ _
Time of Bu rn ____ ._
Age __ ~~" ___ _
Sex _~ __ , ___ .. _
Weight __
COLOR CODE
Red --- 3°
Blue- 2° LUND AND BROWDER CHART
UHM(' I'!,;' 1\ 4,71
Figure 1. Burn estimate and diagram. Reprinted with permission of U of U Medical Center.
150

151
Depth of Burn Injury
Burn injury involves the destruction of the integu-
mentary system. The skin is divided into three layers
(Figure 2). The epidermis, or nonvascular outer layer of
the skin is about the thickness of a sheet of paper. It
is composed of epithelial cells that provide a protective
barrier to the skin, hold in fluids and electrolytes,
regulate heat, and keep harmful agents in the external
environment from injuring or invading the body. The
dermis, lying below the epidermis, is about 30 to 45
times thicker than the epidermis. The dermis contains
connective tissues with blood vessels and highly spec
ialized structures consisting of hair follicles, nerve
endings, sweat glands, and sebaceous glands. Under the
dermis lies the subcutaneous tissue containing major vas
cular networks, nerves, and lymphatics. The subcutaneous
tissue acts as a shock absorber and heat insulator for
the underlying structures: muscles, tendons, bones, in
ternal organs, etc.
In the past, burns were defined by degrees: first
degree, second degree and third degree. The American
Burn Association currently advocates a more explicit
physiological definition categorizing the burn according
to depth: partial- and full-thickness. Table 25 re
flects the comparison of the classification system (164).
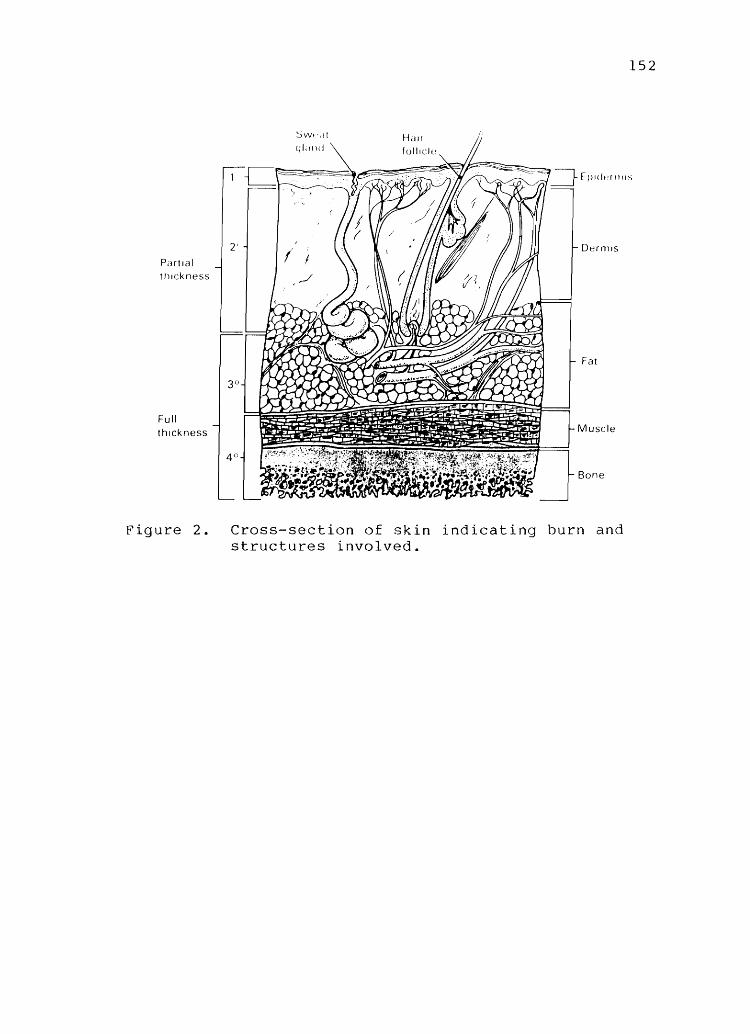
Pdrtlal , hlckness
Full thickness
Figure 2.
152
Cross-section of skin indicating burn and structures involved.

153
Table 25. Classification of Burns
Classification
Partial thickness 1st degree (Superficial)
Clinical Appearance and Cause
Characterized by erythema. Blanches on pressure. Pain and mild swelling present. No vesicles or blisters (although after 24 hours skin may blister and peel).
Caused by superficial sunburn or quick heat flash.
2nd degree (deep) Fluid-filled vesicles. Red, shiny, wet (if vesicles have ruptured). Very painful due to nerve injury. Mild to moderate edema.
Full thickness 3rd and 4th degree
Caused by flash, scald, or flame burn.
Dry, waxy white, leathery or hard. Thrombosed vessels often visible. Insensitive to pain and pressure. Due to nerve destruction. Can involve muscles, tendons and bones.
Caused by flame, scald, chemicals, tar or electric current.
Morphology
Only superficial devitalization with local hyperemia.
Involves both epidermis and dermis to varying depth. Some skin elements remain viable from which epithelial regeneration occurs.
All skin elements destroyed as well as nerve endings. Coagulation necrosis present.

APPENDIX B
BLOOD REQUIREMENTS FOR LAB VALUES

155
Table 26. Blood Requirements for Lab Values to be Drawn During the Randomized Trial of Plasma Exchange Therapy in Patients with Major Burns
Lab Value
Arterial blood gas
Mixed venous blood gas
CBC, with platelets
PT, PTT, fibrinogen
Electrolytes, BUN, Creatinine
SMA-20
Lactic acid
Frequency of sample, hours
2
2
4
4
4
4
4
Total number of samples
24
24
12
12
12
12
12
Total
Amount of Blood per sample, mL
2
2
3
3
3
7
5
Total volume required, mL
48
48
36
36
36
84
60
348

APPENDIX C
CARDIOPULMONARY PARAMETERS

157
Arterial and Mixed Venous Blood Gas
The values reported in this study were determined by
the Pulmonary Laboratory, University of Utah Medical
Center. All values have been adjusted for the elevation
above sea level and the barometric pressure at the time
of analysis. Normal values for this laboratory are pre
sented in Table 27.
Hemodynamic Parameters
Hemodynamic parameters are measured directly using
instrumentation previously described. The normal values
for these parameters are presented in Table 28.
Computed Cardiopulmonary Parameters
The computation of cardiopulmonary parameters is
performed within the Cardiopulmonary Profile Program
developed by Tenet Information Services, Salt Lake
City, Utah. Normal values are presented in Table 29.
The Cardiopulmonary Profile Program is designed to op
timally utilize values from arterial blood gases, mixed
venous blood gases and other data obtained from a Swan
Ganz catheter. The values are derived using the fol
lowing procedures.

158
Table 27. Arterial and Mixed Venous Blood Gas Normal Values Breathing Room Air
Value Arterial Normal Range
PO , mmHg 2
o Saturation, % 2
pH
PCO , mmHg 2
Base Excess
Bicarbonate mEq/L
Carboxyhemoglobin, %
68 to 78
> 93
7.35 to 7.45
31 to 41
-3 to 3
22 to 26
<2
Mixed Venous Normal Range
35 to 40
60 to 85
7.32 to 7.42
38 to 50
-3 to 3
22 to 29
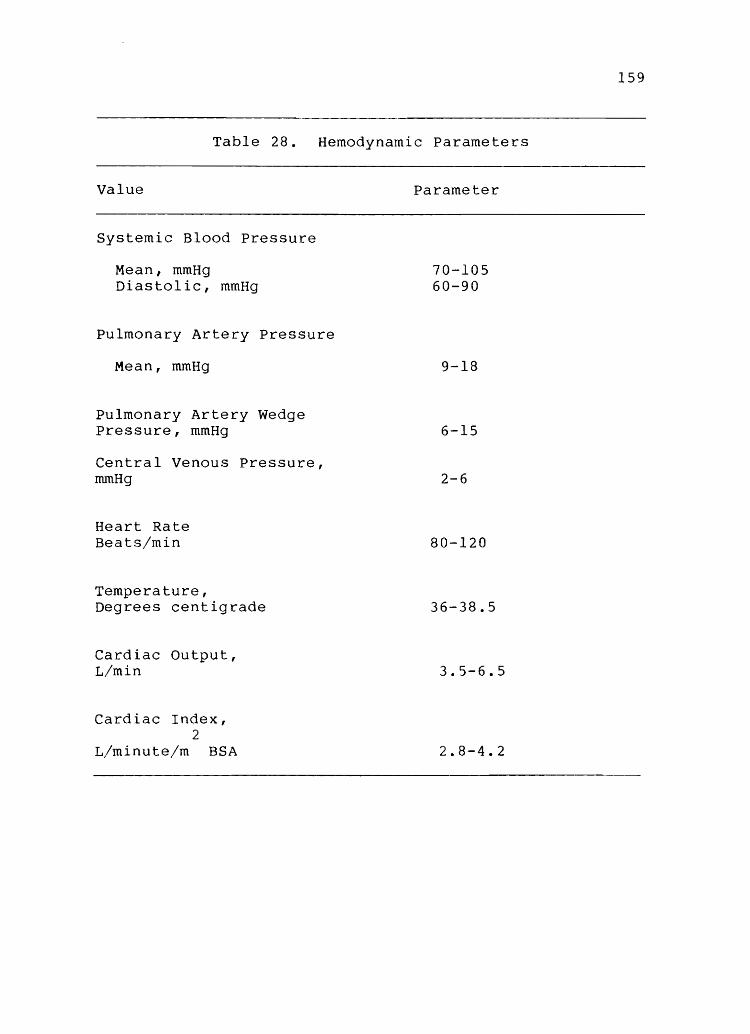
Table 28. Hemodynamic Parameters
Value Parameter
Systemic Blood Pressure
Mean, mmHg Diastolic, mmHg
Pulmonary Artery Pressure
Mean, mmHg
Pulmonary Artery Wedge Pressure, mmHg
Central Venous Pressure, mmHg
Heart Rate Beats/min
Temperature, Degrees centigrade
Cardiac Output, L/min
Cardiac Index, 2
L/minute/m BSA
70-105 60-90
9-18
6-15
2-6
80-120
36-38.5
3.5-6.5
2.8-4.2
159

160
Table 29. Cardiopulmonary Profile Predicted Values
Profile Predicted Value
A-V 0 Difference 2
o Consumption 2
o Availability 2
o Extraction 2
Systemic Arterial Mean Pressure
Pulmonary Artery Pressure Mean
Pulmonary Vascular Resistance Index
Systemic Vascular Resistance Index
Stroke Work Index
QS/QT (Shunt)
A-a 0 Difference 2
4.6 to 5.4 mL 0 /100 mL 2
240 mL/min
2 550 to 650 mL 0 /min/m BSA
2
23 to 27%
70 to 105 mmHg
9 to 16 mmHg
225 to 315 Dynes/second/ 2 5
m BSA/cm
1970 to 2390 Dynes/second/
m2 BSA/cm5
2 41 to 51 mL/beat/m BSA
17 to 31%
< 8

161
Arterial to Venous Oxygen Difference
Arterial to venous oxygen difference is calculated
if the following criteria are met:
1. Arterial PO or arterial oxygen content are 2
reported.
2. Mixed venous PO or mixed venous oxygen content 2
is reported:
A-VO diff 2
= Art. 0 2
cont. - venous 0 2
cont.
Oxygen Consumption
Oxygen consumption is calculated if the following
criteria are met:
1. No measured value is entered.
2. Measured cardiac output is entered.
3. The criteria for A-Va diff. are met. 2
va = Cardiac output (meas.) X 1000 X A-VO diff. 2 2
Oxygen Availability
Oxygen availability is calculated if the following
criteria are met:
1. Arterial 0
entered. 2
content and/or arterial PO 2
2. Cardiac output is entered or calculated.
3. Patient height and weight are entered.
are
o availability = (art. 0 content) (Cardiac index). 2 2

162
Oxygen Extration
Oxygen extraction is calculated if the criteria for
A-VO differences are met: 2
o ext = art. 0 2 2
content-VO cont. X 100% 2
art. 02 cont.
Systemic Arterial Pressure Mean (MAP)
MAP = Systolic Pressure +2 (Diastolic Pressure)
and
MAP = Diastolic Pressure
pulmonary Artery Pressure Mean (Mean PAP)
+
3
3
(Systolic-Diastolic Pressure)
Pulmonary artery pressure mean is calculated if the
following criteria are met:
1. Systolic pulmonary artery pressure is reported.
2. Diastolic pulmonary artery pressure is reported.
Mean PAP = (Systolic PAP-Diastolic PAP)+Diastolic PAP
3

Pulmonary Vascular Resistance Index
163
Pulmonary vascular resistance index is calculated if
the following criteria are met:
1. Systolic arterial blood pressure is reported.
2. Diastolic arterial blood pressure is reported.
3. Wedge pressure is reported.
4. Cardiac output (either measured or calculated)
is reported.
5. Patient weight and height are reported.
PVR = 79.96 (mean PAP - Wedge Pressure)
Cardiac Index
Systemic Vascular Resistance Index
Systemic vascular resistance index is calculated if
the following criteria are met:
1. Systemic systolic blood pressure is reported.
2. Systemic diastolic blood pressure is reported.
3. Central venous pressure is reported.
4. Cardiac output is reported.
5. Patient height and weight are reported.
SVR = 79.96 (mean SAP - Central Ven. Pressure)
Cardiac Output

164
SAP == Systemic arterial pressure,
mean SAP (Systolic SAP-Diastolic SAP)+Diastolic SAP
3
SVR index == 79.96 (mean SAP-Central Ven. Pressure)
Cardiac Index
Cardiac Index
This is reported if the following criteria are met:
1. The criteria for QT are met.
2. Patient height and weight are entered.
Cardiac index == (Cardiac Ouptut)
Body Surface Area Stroke Volume Index
This is calculated if the following criteria are
met:
1. The criteria for cardiac output are met.
2. Patient heart rate is entered.
3. Patient height and weight are entered.
Stroke index == (Stroke Volume)
Body Surface Area

Stroke volume :::: (Cardiac Output)
Heart Rate
Shunt (QS/QT)
met:
Shunt is calculated if the following criteria are
1. Criteria for capillary content are met.
2. Arterial PO or arterial oxygen content are 2
reported.
165
3. Mixed venous PO or mixed venous oxygen content 2
are reported:
QS/QT :::: Pul. Cap. a cont.-Art. a cont. 2 2
x 100.
Pule Cap. a cont.-Ven. a cont. 2 2

APPENDIX D
COMPOSITION OF SOLUTIONS AND FLUIDS
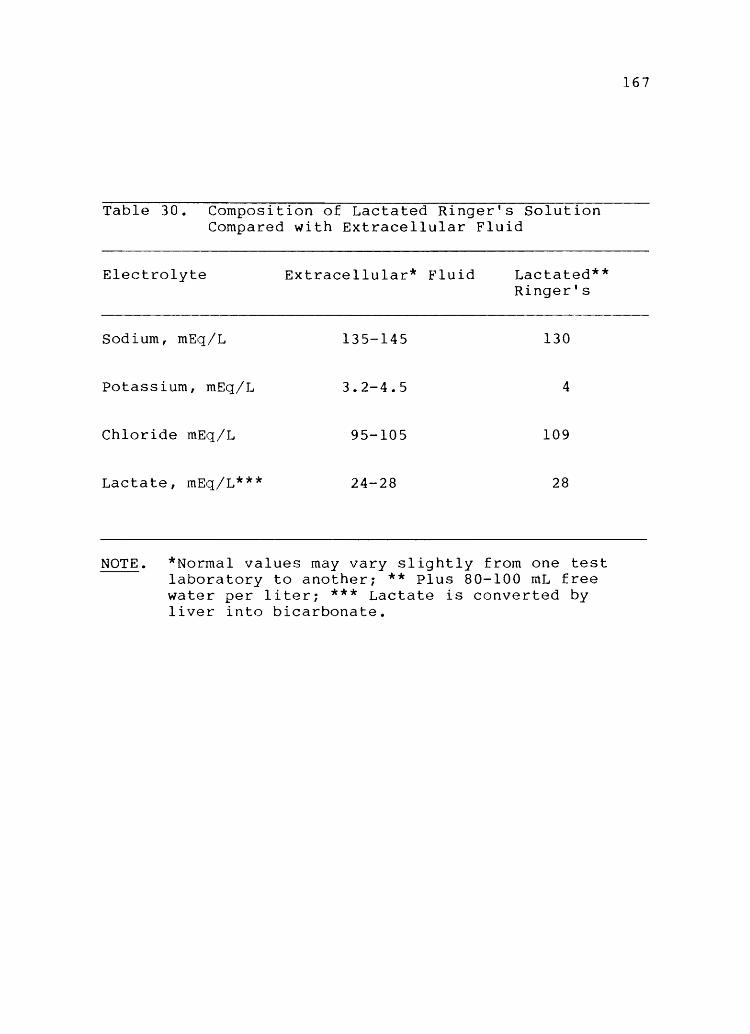
Table 30. Composition of Lactated Ringer's Solution Compared with Extracellular Fluid
Electrolyte Extracellular* Fluid
Sodium, mEq/L 135-145
Potassium, mEq/L 3.2-4.5
Chloride mEq/L 95-105
Lactate, mEq/L*** 24-28
Lactated** Ringer's
130
4
109
28
NOTE. *Normal values may vary slightly from one test laboratory to another; ** Plus 80-100 mL free water per liter; *** Lactate is converted by liver into bicarbonate.
167

APPENDIX E
RANDOM NUMBER ASSIGNMENT SEQUENCE

Case 1. 2. 3 • 4. 5. 6. 7. 8. 9 • 10. 11. 12. 13. 14. 15. 16. 17. 18. 19. 20. 21. 22. 23. 24. 25. 26. 27. 28. 29. 30. 31. 32. 33. 34. 35. 36. 37. 38. 39. 40. 41. 42. 43. 44. 45. 46. 47. 48.
Table 31. No.
Means of Assignment Control Exchange Control Exchange Control Exchange Control Exchange Control Exchange Control Exchange Control Exchange Exchange Control Control Exchange Exchange Control Control Exchange Exchange Control Control Exchange Control Exchange Control Exchange Exchange Control Exchange Control Control Exchange Exchange Control Exchange Control Control Exchange Control Exchange Exchange Control Control Exchange
Assigning Random Case No.
49. 50. 51. 52. 53. 54. 55. 56. 57. 58. 59. 60. 61. 62. 63. 64. 65. 66. 67. 68. 69. 70. 71. 72. 73. 74. 75. 76. 77. 78. 79. 80. 81. 82. 83. 84. 85. 86. 87. 88. 89. 90. 91. 92. 93. 94. 95. 96.
Numbers Assignment
Control Exchange Exchange Control Exchange Control Control Exchange Control Exchange Control Exchange Control Exchange Exchange Control Exchange Control Exchange Control Control Exchange Exchange Control Control Exchange Control Exchange Exchange Control Exchange Control Exchange Control Control Exchange Control Exchange Control Exchange Exchange Control Control Exchange Control Exchange Control Exchange
169

APPENDIX F
BODY SURFACE AREA CHART

171
Directions: To find body surface of a patient, locate the height in inches· (or centimeters) on scale I and the weight in pounds (or kilograms) on Scale II and place a straight edge (ruler) between these two points which will intersect Scale III at the patient's body surface area.
ss
so· so
z.!) 2Jj 2..'1 Z-6 Z.5 2..~ U u.. 1:...1 Z.O 1.9
r 1.a· ~ 1.7 :::! 2: 1.6
~ 1.S VI
.!:. 1·~4
~ 1.3 -(
w 1.2-o -< ~ 1.1 ::> VI
1.0
0.8
ua
0.1
0.6 0.56
III
.go
JI l5

APPENDIX G
PATHOLOGY LABORATORY VALUES

Table 32. Normal Ranges of Laboratory Values
Laboratory Value Normal Range
Hematology
White blood cell Red blood cell Hemoglobin Hematocrit Platelets
Chemistries
Sodium Potassium Chloride Carbon dioxide Blood urea nitrogen Glucose Creatinine Uric acid Calcium Phosphate Total bilirubin Direct bilirubin Total protein Albumin Cholesterol GGTP Alkaline phosphatase LDH SGOT SGPT Lactic acid
Coagulation
Prothrombin time Partial thromboplastin time Fibrinogen
3.6-9.0 K/pl 4.71-5.77 m/"uL 14.5-17.1 g/dL 43.0-52.0% 140-440 K/pL
137-146 mEq/L 3.8-5.3 mEq/L 100-109 mEq/L 21-27 mEq/L 6-20 mg/dL 84-119 mg/dL 0.9-1.4 mg/dL 4.6-8.5 mg/dL 8.6-10.7 mg/dL 2.4-4.1 mg/dL 0.3-1.9 mg/dL 0.0-0.3 mg/dL 6.4-8.1 g/dL 4.0-5.1 g/dL 128-288 mg/dL 5 to 85 lulL 40-139 lUlL 138-328 lulL 11-43 lulL 11-85 lUlL 0.5-2.2 mEq/L
10.0-14.4 seconds 32-48 seconds 150-350 mg/dL
173

APPENDIX H
VARIABLE LIST

Group assignment O=control l=treatment
Card number Age Sex
O=male l=female
% TBSA burn % Full-thickness burn Inhalation injury
O=no l=yes
Type of injury l=flame 2=scald 3=chemical 4=tar/asphalt 5=other
Time postburn IV Fluid resuscitation started
< 1 hour=l n hour=n
Hours postburn of arrival in burn center Total fluids to resuscitation expressed as
cc/kg/% TBSA burn/first 8 hrs postburn cc/kg/% TBSA burn/second 8 hrs postburn cc/kg/% TBSA burn/third 8 hrs postburn
Time to resuscitation Total sodium infused expressed as
mEq/kg/% TBSA burn/time to resuscitation Weight in kg Body surface area
175
Urine output expresed as mean cc/hr/time to resuscitation Past medical history
O=no history of disease l=history of disease Cardiac Pulmonary Diabetes Renal Gastrointestinal Neurologic Hepatic ETOH abuse Drug abuse other
Intercurrent trauma O=yes l=no

Survival of burn shock O==yes l==no
Survival of burn injury O=yes l==no
Group survival O=yes l=no
Plasma exchange group Postburn hour started Postburn hour stoppped Calculated volume:
males = (7% body weight in kg X 1.5) females = (8% X kg X 1.5)
Urine volume during procedure expressed as cc/hr predicted maintenance rate expressed in cc/hr Actual volume received in second 24 hours expressed in
mean cc/hr Actual volume received from resuscitation time through
postburn hour 48 expressed in mean cc/hr
176
Urine output expressed in mean cc/hr during 2nd 24 hours Urine output expressed in mean cc/hr during resuscitation
time Calculated amount FFP Delivered amount FFP Postburn hour of administration Blood products required
O=no n=amount
Postburn hour administration started Death in first 48 hours
O=no n=postburn hour of death
Death due to burn=days O=no n=postburn day of death
Cause of death O=no death l=overwhelming inhalation injury 2=metabolic exhaustion 3=sepsis 4=failure to resuscitate
Failure to survive in group O=no failure l=failure to survive
Reason O=no failure l=death 2=technical difficulties 3=failure to resuscitate.

177
The following variables were measured at admission and every four hours thereafter (PBH 4,8,12,16,20,24,28,32, 36,40,44 and 48).
Blood Analyses
white blood cell count Hemoglobin Hematocrit Platelets Red blood cell count Prothrombin time-patient prothrombin time-control Partial thromboplastin time-patient Partial thromboplastin time-control Fibrinogen Sodium Potassium Chloride Total carbon dioxide Blood urea nitrogen Glucose Creatinine Uric acid Total calcium phosphate Total bilirubin Direct bilirubin Total protein Albumin Alkaline phosphatase Lactate dehydrogenase (LDH) Serum glutamic-oxaloacetic transaminase (SGOT) Serum glutamic-pyruvate transaminase (SGPT) Cholesterol Lactate GGTP
Respiratory
Fraction inspired oxygen Method
O=room air l=nasal prongs 2=mask 3=intubated 4=manually ventilated with mask 5=manually ventilated with intubation 6=ventilated with Bear
Tidal volume O=spontaneous n=cc of air via ventilator

Mode O=spontaneous l=assist/control 2=intermittent mandatory ventilation 3=T-piece 4=manually delivered 5=CPAP
Positive end-expiratory pressure (PEEP) Spontaneous respiratory rate
Arterial Blood Gas
Body temperature Oxygen saturation P02 PC02 pH HC03 Base excess
Mixed Venous Blood Gas
Oxygen saturation P02 PC02 pH HC03 Base excess
Cardiac Parameters
Pulmonary artery mean pressure (PA mean) Pulmonary artery wedge pressure (PAWP) Cardiac output (C.O.) Cardiac index (C.l.) Stroke work index (SWl) Systemic vascular resistance index (SVRI) Pulmonary vascular resistance index (PVRI) Systemic blood pressure - mean Systemic blood pressure-diastolic Heart rate Arterial-venous oxygen difference Oxygen consumption Oxygen available Oxygen extracted Shunt (QS/QT) A-a oxygen difference Central venous pressure Carboxyhemoglobin
178
APPENDIX I
NURSES' RESPONSIBILITY FOR PLASMA EXCHANGE
RESEARCH PROTOCOL

1BO
Admission
Blood Draws Upon Admission:
1. ABG, MVBG, CBC with differential, SMA-6, SMA-20, Lactic Acid, PT, PTT, Fibrinogen (to lab on regular slips).
Plasma Exchange:
1. Draw (1) above pre- and postexchange. Send to lab with appropriate requisition slips. 2. Put plasma in fridge in dirty utility room after labeling it. 3. Do all cardiac parameters immediately pre- and postexchange.
48-Hour Routine:
1. 2. 3. 4. 5. 6. 7. B. 9. 10. 11. 12. 13. 14. 15. 16. 17. 18. 19. 20.
1. S-G: Record all Swan-Ganz parameters including CVP. 2. C.O.: Do 3 cardiac output measures and record average measure. 3. C.P.: Cardiac parameters. ABGs and MVBG and send slip to for cardiopulmonary profile. 4. V. S. : TPR, B. P.
Postburn Hour
V. S. , S-G, C.O. , C. P. , labs ( 1) , V. S. , C.O. , S-G V.S. V. S. , S-G. , C. o. , C. P. , lab ( 1 ) V.S. V. S. , C. o. , S-G V.S. V.S, S-G, C.O. , C. P. , lab ( 1 ) V.S. V. S. , C. o. , S-G V.S. V. S. , C. o. , S-G, C. P. , lab ( 1 ) V.S. V. S. , C. o. , S-G, V.S. V. S. , c.o. , S-G, C. P. , lab ( 1 ) V.S. V. S. , C. o. , S-G V.S. V. S. , C. o. , S-G, C. P. , lab ( 1 )
So S-G and C.O. plus computer technician
( 2) , ( 3 )

21. V.S. 22. V. S. , 23. V.S. 24. V. S. , 25. V. S. , 26. V.S. 27. V.S. 28. V. S. , 29. V.S. 30. V. S. , 31. V.S. 32. V.S., 33. V.S. 34. V.S. 35. V.S. 36. V. S. , 37. V.S. 38. V.S. 39. V.S. 40. V. S. , 41. V.S. 42. V. S. , 43. V.S. 44. V. S. , 45. V.S. 46. V.S. 47. V.S. 48. V. S. ,
c. 0., S-G
c.o., S-G, C.P., lab (1) START 24 hour urine
c.o., S-G
lab (1)
c. 0., S-G, c. P.
c.o., S-G, lab (1)
c.o., S-G, C.P.
lab (1)
c.o., S-G
c.o., S-G, C.P., lab (1), end 24 hour urine
181

APPENDIX J
RESUSCITATION CALCULATIONS

183
A. Fluid Balance
1. Total volume received during resuscitation=mL 2. Total urine output during resuscitation=mL 3. Resuscitation fluid received=
[Total volume received - (urine output+basal fluid requirements)]mL
4. Volume of fluid/kg body weight/% TBSA burn to resuscitate patient:
Total volume = mL/kg/% TBSA burn.
kg X % TBSA burn
B. Sodium Balance
1. Total sodium received=mEq/Kg% TBSA burn 2. mEq of sodium/kg body weight/% burn to
resuscitate patient:
Total mEq Sodium = mEq Sodium/kg/% TBSA burn.
kg X % TBSA burn
C. Basal Fluid Requirements
1. Body surface area using nomogram (Appendix F) 2. Basal fluid requirements=
2 a. 1500/mL/m BSA = mL per 24 hrs
2 b. 1500 mL/m BSA
= mL per hr. 24 hrs
D. Colloid Replacement:
1. Adult males: 20% (5% X kg) = mL fresh frozen plasma (FFP) 2. Adult females: 20% (8% X kg) = mL FFP.

REFERENCES

185
1. American Burn Association Committee on Specific Optimal Criteria for Hospital Resources for Care of Patients with Burn Injury. San Antonio, American Burn Association, 1976.
2. Loebl EC, Baxter CR, Curreri PW: The mechanism of erythrocyte destruction in the early post-burn period. Ann Surg 1973; 178: 681-686.
3. Wilmore DW, Aulick LH: Metabolic changes in burned patients. Surg Clin No Am 1978; 58: 1173-1187.
4. Baxter CR: Fluid volume and electrolyte changes of the early postburn period. Clin Plast Surg 1974; 1: 693-709.
5. Baxter CR, Shires, T: Physiological resposne to crystalloid resuscitation of severe burns. Ann NY Acad Sci 1968; 150: 874-894.
6. Hernandez B: Platelets: A short course. RN 1980; 43: 36-41.
7. Orosz JJ: A short history of bloodletting. Int Soc Art Org 1981; 5: 226-228.
8. Pruitt B: Multidisciplinary care and research for burn injury: 1976 Presidential address, American Burn Association meeting. J Trauma 1977; 17: 263-269.
9. Marvin JA: Burn nursing as a specialty. Heart Lung 1979; 8: 913-917.
10. Artz CP, Baxter CR, Jackson DM, Sorenson B: Trauma workshop report: Burns. J Trauma 1970; 10: 1058-1061.
11. nursing.
Archambeault-Jones C, Feller I: Burn nursing is Crit Care Nurs 1978; 1: 77-92.
12. Dracup K: Nursing diagnosis: A rose by any other name (editorial). Heart Lung 1983; 12: 211.
13. Guzzetta CE, Dossey BM: Framework, process and problems. 281-291.
Nursing diagnosis: Heart Lung 1983; 12:
14. Thomsen M: treatment of burns.
Historical landmarks in the Br J Plas Surg 1977; 30: 212-217.
15. Warden GD: The burned upper extremity -historical persepctives. In Salisbury RE, Pruitt BA

186
(eds) Burns of the upper extremity: Major problems in clinical surgery. Philadelphia, W.B. Saunders Co., 1976, pp 16-23.
16. Wooldridge-King M: Nursing considerations of the burned patient during the emergent period. Heart Lung 1982; 11: 353-361.
17. 1976; 6:
O'Malley P, Snow N: 43.
Fluid resuscitation. Nurs
18. Christopher KL: The use of a model for hemodynamic balance to describe burn shock. Nurs Clin No Am -----1980; 15: 617-627.
19. Gordon M, Sweeney MA: Nursing diagnosis: Methodological problems and issues. Adv Nurs Sci 1979; 2: 1-15.
20. Whelton B: An operationalization of Martha Rogers' theory throughout the nursing process. Int J of Nsg Stud 1979; 16: 7-20.
21. Utz SW: Applying the Neuman model to nursing practice with hypertension clients. Cardiovasc Nurs 1980; 16: 29-34.
22. Anna D, Christensen DG, Hohon SA, Ord L, Wells SR: Implementing Orem's conceptual framework. J Nsg Admin 1978; 8: 8-11.
23. Flaskerud JH, Halloran EJ: Areas in agreement in nursing theory development. Adv Nsg Serv 1980; 3: 1-7.
24. Hollen PA: A holistic model of individual and family health based on a continuum of choice. Adv Nsg Serv 1981; 3: 27-42.
25. Cope 0, Moore FD: A study of capillary permeability in experimental burns and burn shock using radioactive dyes in blood and lymph. ~ Clin Invest 1944; 23: 241-257.
26. Fox CL, Keston AS: The mechanism of shock from burns and trauma traced with radiosodium. Surg Gynecol, and Obstet 1945; 80: 561-567.
27. Ganrot K, Jacobson S, Rothman U: Transcapillary passage of plasma proteins in experimental burns. Acta Physiol Scand 1974; 91: 497-501.
28. Wachtel TL, Frank HA, Sanders R, Hargens AR,

187
Peters RM: Definition of the Starling forces in Wick catheter in burned patients. J Burn Care and Rehab 1983; 4: 331-336.
29. Dobson EL, Warner GF: early stages of thermal shock.
Factors concerned in the Circ Res 1957; V: 69-74.
30. Merriam TW: Myocardial function following thermal injury. Circ Res 1962; XI: 669-673.
31. Aikawa N, Martyn JAJ, Burke JF: Pulmonaryartery catheterization and thermodilution cardiac output determination in the management of critically burned patients. Am ~ Surg 1978; 135: 811-817.
32. Baxter CR, Cook WA, Shires GT: Serum myocardial depressant factor of burn shock. Surg Forum 1966; 17: 1-4.
33. Glenn TM, Lefer AM: Significance of splanchnic proteases in the production of a toxic factor in hemorrhagic shock. Circ Res 1971; XXIX: 338-349.
34. Lefer AM, Cowgill R, Marshall FF, Hall LM, Brand ED: Characterization of a myocardial depressant factor present in hemorrhagic shock. Am J Physio 1967; 213: 492-498.
35. Lefer AM, Blattberg B: Comparison of the effects of two factors present in plasma of shocked animals. J Reticuloendothel Soc 1968; 5: 54-60.
36. Lefer AM, Martin pressant factor in shock. 1427.
J: Origin of myocardial deAm J Physiol 1970; 218: 1423-
37. Rosenthal SR, Hawley PL, Hakim AA: Purified burn toxic factor and its competitin. Surg 1972; 71:, 527-536.
38. Raffa J, Trunkey DO: Myocardial depression in acute thermal injury. J Trauma 1978; 18: 90-93.
39. Goldfarb RO, Weber P, Estes JE: Characterization of circulating shock-induced cardiodepressant substances. Fed Proc 1978; 37: 2724-2728.
40. DeSantis 0, Phillips P, Spath MA, Lefer AM: Delayed appearance of a circulating myocardial depressant factor in burn patients. Ann Emerg Med 1981; 10: 22-24.
41. Caridis OT, Reinhold RB, Woodruff PWH, Fine J:

188
Endoxaemia in man. Lancet 1972; 1: 1381-1385.
42. Hamer-Hodges D, Woodruff P, Cuevas P, Kaufman A, Fine J: Role of the intraintestinal gram-negative bacterial flora in response to major injury. Surg Gyneco1, Obstet 1974; 138: 599-603.
43. Cuevas P, Ishiyama M, Koizumi S, Woodruff P, Kaufman A, Fine J: Role of endotoxemia of intestinal origin in early death from large burns. Surg Gynecol, Obstet 1974; 138: 725-730.
44. Little RA, Stoner HB: Studies on the mechanism of shock: Failure to find a role for intestinal bacterial endotoxin in burn shock. Br J Exp Pathol 1972; 53: 381-389.
45. Kremer B, Allgower M, Graf M, Schmidt KH, Schoelmerich J, Schoenenberger GA: The present status of research in burn toxins. Inten Care Med 1981; 7: 77-87. ----
46. Welt LG, Smith, EKM, Dunn MJ, Czerwinski A, Proctor H, Cole C, Balfer JW, Gitelman HJ: Membrane transport defect: the sick cell. Trans Assoc Am Physicians 1967; 80: 217-226.
47. Rosenthal SM, Tabor H: Electrolyte changes and chemotherapy in experimental burn and tramatic shock and hemorrhage. Arch Surg 1945; 51: 244-252.
48. Cunnigham IN Jr, Shires GT, Wagner Y: Cellular transport defects in hemorrhagic shock. Surg 1971; 70: 215-222.
49. Cunningham IN, Carter NW, Rector FC Jr, Seldin DW: Resting transmembrane potential difference of skeletal muscle in normal subjects and severely ill patients. ~ Clin Invest 1971; 50: 49-59.
50. Shires GT, Cunningham IN, Baker CRF, Reeder SF, Illner H, Wagner IY, Maher J: Alterations in cellular membrane function during hemorrhagic shock in primates. Ann Surg 1972; 176: 288-295.
51. Trunkey DD, Illner H, Wagner IY, Shires GT: The effect of hemorrhagic shock on intracellular muscle action potentials in the primate. Surg 1973; 74: 241-250.
52. Trunkey DD, Illner H, Arango, A, Holiday R, Shires GT: Changes in cell membrane function following shock and cross-perfusion. Surg Forum 1974; 1: 1-3.

189
53. Cunningham IN, Shires GT, Wagner Y: Changes in intracellular sodium and potassium content of red blood cells in trauma and shock. Am ~ Surg 1971; 122: 650-654.
54. Sayeed MM, Adler RJ, Chaudry IH, Baue AE: Effect of hemorrhagic shock on hepatic transmembrane potentials and intracellular electrolytes, in vivo. Am J Physiol 1981; 240: R211-R219.
55. Turinsky J, Gonnerman WA, Loose LD: Impaired mineral metabolism in postburn muscle. J Trauma 1981; 21: 417-423.
56. Deets DK, Glaviano VV: Plasma and cardiac lactic dehydrogenase activity in burn shock. Proc Soc Exp BioI Med 1973; 142: 412-416.
57. Okamoto R, Glaviano VV, Pindok M: Myocardial lipases and catecholamines in burn shock. Proc Soc Exp BioI Med 1971; 137: 347-353.
58. Wilmore DW, Long JM, Mason AD Jr, Skreen RW, Pruitt BA Jr: Catecholamines: Mediator of the hypermetabolic response to thermal injury. Ann Surg 1974; 180: 653-668.
59. Hauben DJ, LeRoith D, Glick SM, Mahler D. Nonoliguric vasopressin oversecretion in severely burned patients. Isr ~ Med Sci 1980; 16: 101-105.
60. Wilmore DW, Aulick LH, Mason AD Jr, Pruitt BA Jr: Influence of the burn wound on local and systemic responses to injury. Ann Surg 1977; 186: 444-458.
61. Gump FE, Price JB Jr, Kinney JM: Blood flow and oxygen consumption in patients with severe burns. Surg Gynecol, Obstet 1970; 130: 23-28.
62. Wilmore DW, Goodwin CW, Aulick LH, Powanda MC, Mason AD Jr, Pruitt BA Jr: Effect of injury and infection on visceral metabolism and circulation. Ann Surg 1980; 192: 491-500.
63. Wilmore DW, Orcutt TW, Mason AD, Pruitt BA: Alterations in hypothalamic function following thermal injury. J Trauma 1975; 15: 697-703.
64., Aulick LH, Hander EH, Wilmore DW, Mason AD Jr, Pruitt BA Jr: The relative significance of thermal and metabolic demands on burn hypermetabolism. J Trauma 1979; 19: 559-566.

190
65. Wolfe RR, Miller HI, Spitzer JJ: Glucose and lactate kinetics in burn shock. Am J Physiol 1977; 232: E415-E418.
66. Wilmore OW, Aulick HL, Goodwin CW: Glucose metabolism following severe injury. Acta Chir Scand 1979; 498: 43-47.
67. McManus WF, Eurenius K, Pruitt BA Jr: Disseminated intravascular coagulation in burned patients. J Trauma 1973; 13: 416-422.
68. Alexander JW, Moncrief JA: Alterations of the immune response following severe thermal injury. Arch Surg, 1966; 93: 75-83.
69. Warden GO, Mason AD Jr, Pruitt BA Jr: Evaluation of leukocyte chemotaxis in vitro in thermally injured patients. J Clin Invest 1974;-54: 1001-1004.
70. Warden GO, Mason AD, Pruitt BA Jr: Suppression of leukocyte chemotaxis in vitro by chemotherapeutic agents used in the management of thermal injuries. Ann Surg 1975; 181: 363-36.
71. Miller, CL, Baker CC: activity after thermal injury: cells. J Clin Invest 1979; 63:
Changes in lymphocyte The role of suppressor
202-210.
72. Ninnemann JL: Immunosupression following thermal injury through a B cell activation of suppressor T cells. J Trauma 1980; 20: 206-213.
73. Ninnemann JL, Fisher JC, Wachtel TL: Thermal injury associated immunosuppression: Occurrence and in vitro blocking effect of convalescent serum. J ImmunOI 1979; 122: 1736-1741.
74. Rapaport FT, Bachvaroff RJ: Kinetics of humoral responsiveness in severe thermal injury., Ann surg 1976; 184: 51-59.
75. Edgar MA, Heck E, Okita R, Masters BS, Baxter CR: Defective superoxide production in polymorphonuclear leukocytes from burned patients. Proc Am Burn Assoc, New Orleans, 1979.
76. Heideman M, Kaijser B, Gelin L: Complement activation and hematologic, hemodynamic and respiratory reactions early after soft tissue injury. J Trauma 1978; 18: 696-700.

191
77. Gelfand JA, Donelan M, Burke JF: Preferential activation and depletion of the alternative complement pathway by burn injury. Ann Surg 1983; 198: 58-62.
78. Alexander JW, McClellan MA, Ogle CK, Ogle JD: Consumptive opsoninopathy: Possible pathogenesis in lethal and opportunistic infections. Ann Surg 1976; 184: 672-678.
79. Bjornson AB, Altemeier WA, Bjornson HS: Changes in humoral components of host defense following burn trauma. Ann Surg 1977; 186: 88-96.
80. Ninnemann, JL: Immunologic defenses against infection: Alterations following thermal injuries. J Burn Care Rehab 1982; 3: 355-398.
81. Markley K, Smallman E, Thornton SW: Protection against burn, tourniquet and endotoxin shock by histamine, 5-hydroxytryptamine and 5-hydroxytryptamine derivatives. Br J Pharmacol 1971; 42: 13-24.
82. Holliman CJ, Meuleman TR, Larsen KR, Port JD, Stanley TH, Pace NL, Warden GO: The effect of ketanserin, a specific serotonin antagonist, on burn shock hemodynamic parameters in a porcine burn model. J Trauma 1983; 23: 867-871.
83. Donati L, Lazzarin A, Signorini M, Candiani P, Klinger M, Moroni M: Preliminary clinical experiences with the use of immunomodulators in burns. J Trauma 1983; 23: 816-831.
84. Ishizawa S, Sakai H, Sarles HE, Larson DL, Daniels JC: Effect of thymosin on T lymphocyte function in patients with acute thermal burns. J Trauma 1978; 18: 48-52.
85. Warden GO: The use of plasma exchange in the management of thermally injured patients. In Ninnemann, JL (ed): Traumatic injury: Infection and other immunologic sequelae. Baltimore, University Park Press, 1983.
86. Stratta RJ, Saffle JR, Holliman CJ, Kravitz M, Ninnemann JL, Warden GO. Thermal injury in an adrenalectomized patient. J Trauma 1983; 23: 934-938.
87. Petroff PA, Hander EW, Mason AD: ventilatory patterns following burn injury and effect of Sulfamylon. J Trauma 1975; 15: 650-656.
88. Guyton AC: Textbook of medical phsyiology (4th
192
ed) • Philadelphia, W.B. Saunders Company, 1971, p. 477.
Jr: lung
89. Moylan JA Jr, Wilmore DW, Mouton DE, Pruitt BA Early diagnosis of inhalation injury using 133-Xenon scan. Ann Surg 1972; 176: 477-484.
90. Moylan JA, Adib K, Birnbaum M: Fiberoptic bronchoscopy following thermal injury. Surg Gynecol, Obstet 1975; 140: 541-543.
91. Moncrief JA, Mason AD: Water vapor loss in the burned patient. Surg Forum 1962; 13: 38-41.
92. Shires GT, Canizaro PC. Fluid, electrolyte and nutritional management of the surgical patient. In Schwartz SI, Lillehei RC, Shires GT, Spencer FC, Storer EH (eds), Principles of surgery (2nd ed.). New York, McGraw-Hill, 1974, pp. 65-96.
93. Moncrief JA: Burns. In Schwartz SI, Lillehei RC, Shires GT, Spencer FC, Storer EH: Principles of surgery (2nd ed.). New York, McGraw-Hill, 1974, pp. 253-274.
94. Harrison HN, Moncrief JA, Duckett JW, Mason AD: The relationship between energy metabolism and water loss from vaporization in severely burned patients. Surg 1964; 56: 203-211.
95. Roe CF, Kinney JM: Water and heat exchange in third-degree burns. Surg 1964; 56: 212-220.
96. Birke G, Liljedahl SO, Olsson KE, Plantin La: Total exchange and insensible loss of water in severe burns during the first two weeks. Acta Chir Scand (Suppl) 1970; 136: 125-132.
97. Lamke La, Liljedahl so: Evaporative water loss from burns, grafts, and donor sites. Scand J Plast Reconstr Surg 1971; 5: 17-22.
98. Lamke La: Evaporative water loss from burns under different environmental conditions. Scand J Plast Reconstr Surg 1971; 5: 77-81.
99. Zawacki BE, Spitzer KW, Mason AD, Johns LA: Does increased evaporative water loss cause hypermetabolism in burned patients? Ann Surg 1970; 171: 236-240.
100. Carnes RW, Sollecito WA, Salisbury RE: Evaporative water loss from healed burn wounds. J Burn Care
Rehab 1981; 2: 239-247.
101. Curreri PW, Luterman A, Braun DW, Shires GT: Burn injury: Analysis of survival and hospitalization time for 937 patients. Ann Surg 1980; 192: 472-478.
193
102. Baxter CR: Guidelines for fluid resuscitation. J Burn Care Rehab 1981; 2: 279-286.
103. Sevitt S: Reflections on mortality and causes of death after injury and burns. Injury 1972; 4: 151-156.
104. Artz CP, Yarbrough DR III: Major body burn. JAMA 1973: 223: 1355-1357.
105. Baxter CR: Fluid resuscitation, burn percentage and physiologic age. J Trauma 1979: 19 (11 Supplement): 864-865.
106. Caldwell FT Jr: Hypertonic vs hypotonic resuscitation. J Trauma 1979; 19 (11 Supplement): 874.
107. Leape LL: Urgency of fluid administration in resuscitation of burn shock. J Surg Res 1971: 11: 513-514.
108. Bull, JP: Current trends in research on burns. Proc R Soc Med 1972: 65: 27-30.
109. Moncrief JA: Burns. New ~ ~ Med 1973: 288: 444-454.
110. Moylan JA, Mason AD Jr., Rogers PW, Walker HL. Postburn shock: A critical evaluation of resuscitation. J Trauma 1973; 13: 354-358.
Ill. Pruitt BA: Complications of thermal injury. C1in P1ast Surg 1974; 1: 667-691.
112. Baxter CR, Marvin J, Curreri PW: Fluid and electrolyte therapy of burn shock. Heart Lung 1973: 2: 707-713.
113. Rogenes PR, Moylan JA: in the patient with severe burns. 1952-1957.
Restoring fluid balance Am J Nurs 1976; 76:
114. Evans EI, Purnell OJ, Robinett PW, Batchelor A, Martin M: Fluid and electrolyte requirements in severe burns. Ann Surg 1952; 135: 804-817.

194
115. Reiss E, Stirman JA, Artz CP: Fluid and electrolyte balance in burns. JAMA 1953; 152: 1309-1313.
116. Hutcher N, Haynes BW Jr: The Evans formula revisited. J Trauma 1972; 12: 453-458.
117. Reckler JM, Mason AD: A critical evaluation of fluid resuscitation in the burned patient. Ann Surg 1971; 174: 115-118.
118. Baxter CR, Marvin JA, Curreri PW: Early management of thermal burns. Postgrad Med 1974; 55: 131-138.
119. Baxter CR: shock resuscitation. 1322.
Problems and complications of burn Surg Clin No Am 1978; 58: 1313-
120. Canizaro PC, Prager MD, Shires GT: The infusion of Ringer's lactate solution during shock: Changes in lactate, excess lactate, and pH. Am ~ Surg 1971; 122: 494-501.
121. Monafo WW, Chuntrasakul C, Ayvazian V: Hypertonic sodium solutions in the treatment of burn shock. Am ~ Surg 1973; 126: 778-783.
122. Moylan JA, Reckler JM, Mason AD Jr: Resuscitation with hypertonic lactate saline in thermal injury. Am ~ Surg 1973; 125: 580-584.
123. Shimazaki S: Yoshioka T: Tanaka N, Sugimoto T, Onji Y: Body fluid changes during hypertonic lactated saline solution therapy for burn shock. J Trauma 1977; 17: 38-43.
124. Caldwell FT, Casali RE, Flanigan WJ, Bowser B: What constitutes the proper solution for rescuscitation of the severely burned patient? Am J Surg 1971; 122: 655-661.
125. Fox CL: Hypertonic balanced sodium solution in burn shock. Int Surg 1975; 60: 348-351.
126. Jelenko C III, Williams JB, Wheeler ML, Callaway BD, Fackler VK, Albers CA, Barger AA: Studies in shock and resuscitation, I: Use of a hypertonic, albumincontaining, fluid demand regimen (HALFD) in resuscitation. Crit Care Med 1979; 7: 157-167.
127. Bhantooa D: Fluid replacement with special reference to burned patients. Nurs Times 1977; 73: 337-

195
338.
128. Muir I: The use of the Mount Vernon formula in the treatment of burn shock. Intensive Care Med 1981: 7: 49-53.
129. Hall KV, Sorensen B: The treatment of burn shock: A comparative controlled trial of treatment by colloid infusion (dextran-saline) and by exclusively electrolyte infusion (Ringer lactate). Scand J P1ast Reconstr Surg 1973: 7: 67-73.
130. Linker C: Plasmapheresis in clinical medicine. west J Med 1983: 138: 60-69.
131. Berkman E: Issues in therapeutic apheresis. New Eng ~ Med 1982: 306: 1418-1420.
132. 1983; 14:
Taft EG: 235-240.
Therapeutic apheresis. Hum Patho1
133. Si1verg1eid AJ: Applications and limitations of hemapheresis. Annu Rev Med 1983; 34: 69-89.
134. Werynski A, Ma1chesky PS, Sueoka A, Asanuma Y, Smith JW, Kayashima K, Herpy E, Sato H, Nose Y: Membrane plasma separation: Toward improved clinical operation. TransAm Soc Art Org 1981: 27: 539-543.
135. Wiltbank TB, Castino F, Grapka BH, Daniels JR, Solomon BA, Friedman LI: Filtration plasmapheresis in vivo. Transfusion 1981; 21: 502-510.
136. Ma1chesky PS, Wojcicki J., Nose Y: Advances in blood component separation and plasma treatment for therapeutics. J Parenter Sci Techno1 1983; 37: 2-4.
137. Kayashima K, Sueoka A, Smith JW, Matsubara S, Abe Y, Ueno M, Shinagawa S, Katsume C, Ma1chesky PS, Nose Y: Development of new hollow fiber membrane macromolecular filters. TransAm Soc Art Org 1982; 28: 66-69.
138. 1983; 7:
Gur1and HJ: 142-143.
Thoughts and progress. Art Org
139. Jones JV: Plasmapheresis: Current research and success. Heart Lung 1980; 9: 671-674.
140. Feng CS. Therapeutic plasmapheresis: letting" makes a return. Postgrad Med 1982; 72:
"Blood-251-255.
141. Kleit SH: Apheresis. Am J Kidney Dis 1983; 2:
573-575.
142. Wenz B, Barland P: Therapeutic intensive plasmapheresis. Semin Hematol 1981; 18: 147-162.
196
143. Wood L, Jacobs P, Dubovsky DW, Kernoff LM, Gunston KD, Botha I, Robertson L: The role of continuous-flow blood fraction separators in clinical practice. South Afr Med ~ 1981; 59: 99-104.
144. Valbonesi M, Garelli S, Mosconi L, Manca F, Cantarella S, Celada F: Patients with high titers of circulating immune complexes are most likely to benefit from plamapheresis treatment. Int ~ Art Org 1981; 4: 234-236.
145. Blacklock HA, Hill RS, Bridle M, Simpson IJ, Matthews JRD, Woodfield DG: Therapeutic plasmapheresis by continuous flow centrifugation. New Zealand Med ~ 1980; 92: 145-148.
146. Wenz B, Rubinstein A: Partial immunologic reconstitution of a patient with acquired agammaglobulinemia: A transient phenomenon accompanying therapeutic plasmapheresis. Blood 1982; 59: 233-235.
147. Robinson EAE, Tovey LAD: Intensive plasma exchange in the management of severe Rh disease. Br J Haematol 1980; 45: 621-631.
148. pheresis: patients.
Ginder PA, Middendorf DF, Abdou, NI: PlasmaA therapeutic option for treatment of selected ~ Kansas Med Soc 1982; 83: 140-142.
149. Fujita Y, Ohiwa T, Kubota Y, Shimizu H, Yoshida S, Hosoya R, Nishimura K: Clinical trial of plasmapheresis in hepatic failure. TransAm Soc Art Intern Org 1982; 28: 225-228.
150. Kayashima K, Smith JW, Barna R, Matsubara S, Abe Y, Ueno M, Katsume C, Valenzuela R, Clough JD, Malchesky PS, Nose Y: Improved white blood cell functions: Additional effects of membrane plasmapheresis. TransAm Soc Art Intern Org 1982; 28: 312-317.
151. Smith JW, Matsubara S, Horiuchi T, Kayashima K, Shinagawa S, Malchesky PS, Nose Y: Sorption-filtration therapy for chronic liver disease: in vitro testing and clinical correlation. TransAm Soc Art Intern Org, 1982; 28: 215-217.
152. Evans DTP, Giles M, DeL. Horne DJ, d'Apice AJF,

197
Riglar A, Toh BH: Cerebral lupus erythematosus responding to plasmapharesis and platelet pheresis. Postgrad Med J 1981; 57: 247-251.
153. Huestis DW: Mortality in therapeutic haemapharesis (letter). Lancet 1983; 1: 1043.
154. McLeod BC: Immunologic factors in reactions to blood transfusions. Heart Lung 1980: 9: 675-681.
155. Watson DK, Penny AF, Marshall RW, Robinson EAE: Citrate induced hypocalcaemia during cell separation. Br J Haematol 1980; 44: 503-507.
156. Morse EE, Hohnadel DC, Genco, P, Katz AJ: Decreased ionized calcium during therapeutic plasma exchange pharesis. Johns Hopkins Med J 1980; 146: 260-263.
157. Nurs 1984;
Crismon CH: 3: 17-23.
Plasmapheresis. Dimens Crit Care
158. Cona JA: Establishing a therapeutic pheresis program. Art Org 1981; 5: 229-233.
159. Warden GD, Stratta RJ, Saffle JR, Kravitz M, Ninnemann JL: Plasma exchange in patients failing to resuscitate from burn shock. J Trauma 1983; 23: 945-951.
160. Warden GD, Saffle JR, Kravitz M: A two-stage technique for excision and grafting of burn wounds. J Trauma 1982; 22: 98-103.
161. Pruitt BA: patients.
Warden GD, Wilmore DW, Rogees, PW, Mason AD, Hypernatremic state in hypermetabolic burn
Arch Surg 1973; 106: 420-427.
162. DuBois D, DuBois EF: A formula to estimate the approximate surface area if height and weight be known. Arch lnt Med 1916; 17: 863-871.
163. Lund CC, Browder NC: The estimation of areas of burns. Surg Gynecol, Obstetr 1944; 79: 352-358.
164. Elster SE: Burn client (Chap 13). In Lewis SM, Collier IC (eds), Medical-surgical nursing: Assessment and management of clinical problems. New York, McGraw-Hill Book Company, , pp. 269-292.