physiologically-based pharmacokinetic (pbpk) models for ... · formation clearance of morphine from...
TRANSCRIPT
Physiologically-Based Pharmacokinetic (PBPK) Models for the Description of Sequential Metabolism of Codeine to Morphine and
Morphine 3-Glucuronide (M3G) in Man and Rat
by
Shu Chen
A thesis submitted in conformity with the requirements for the degree of Master of Sciences
Department of Pharmaceutical Sciences University of Toronto
© Copyright by Shu Chen (2010)
ii
ii
Physiologically-Based Pharmacokinetic (PBPK) Models for the
Description of Sequential Metabolism of Codeine to Morphine and
Morphine 3-Glucuronide (M3G) in Man and Rat
Shu Chen
Master of Sciences
Department of Pharmaceutical Sciences
University of Toronto
2010
Abstract
Whole-body PBPK models were developed based on both the intestinal traditional model (TM)
and segregated-flow model (SFM) to describe codeine sequential metabolism in man/rat. Model
parameters were optimized with Scientist® and Simcyp® simulator to predict literature data
after oral (p.o.) and intravenous (i.v.) codeine administration in man/rat. In vivo codeine PK
studies on rats were performed to provide more data for simulation. The role of fm’ (fractional
formation clearance of morphine from codeine) in model discrimination between the TM and
SFM was investigated. A greater difference between the [AUCM3G/AUCMorphine]p.o. and
[AUCM3G/AUCMorphine]i.v. ratio existed for the SFM, especially when the fm’ was low. It was
found that our tailor-made PBPK models using Scientist® were superior to those from Simcyp®
in describing codeine sequential metabolism. Residual sum of squares and AUC’s were
calculated for each model, which demonstrated superiority of the SFM over TM in predicting
codeine sequential metabolism in man/rat.
iii
iii
Acknowledgments
I would like to thank my supervisor, Dr. K. Sandy Pang, who has mentored and encouraged me
throughout my MSc. study. I would not have advanced so far without her guidance and
mentorship.
I sincerely thank all the members in my advisory and examination committees (Dr. Laszlo
Endrenyi, Dr. Scott Walker, Dr Shirly Wu and Dr Carolyn Cummins) for their kind help and
suggestions.
I wish to thank the consistent support from my parents.
I want to thank all my lab mates for their generous and unconditional support and help during my
study.
I also would like to thank the financial support from U of T fellowship.
iv
iv
Table of Contents
Acknowledgments.......................................................................................................................... iii
Table of Contents........................................................................................................................... iv
Abbreviations and Terms............................................................................................................. viii
List of Tables ................................................................................................................................. ix
List of Figures ................................................................................................................................ xi
1 INTRODUCTION ......................................................................................................................1
1.1 The Intestine and Liver in First-Pass Absorption and Elimination......................................2
1.2 Factors Affecting Drug Disposition.....................................................................................3
1.2.1 Blood Flow...............................................................................................................4
1.2.2 Vascular/Tissue Binding..........................................................................................5
1.2.3 Enzymes...................................................................................................................6
1.2.4 Transporters .............................................................................................................7
1.2.5 Other Factors............................................................................................................8
1.3 Early Modeling of Drug Disposition and Limitations .........................................................9
1.4 Physiologically-Based Pharmacokinetic (PBPK) Modeling of Drug Disposition ............11
1.4.1 Traditional PBPK Models......................................................................................11
1.4.1.1 Models for Hepatic Drug Clearance........................................................12
1.4.1.2 Models for Intestinal Drug Clearance .....................................................13
1.4.2 Segregated-Flow Model (SFM) for Drug Absorption in the Intestine ..................14
1.4.2.1 Route Dependent Metabolism .................................................................14
1.4.2.2 Intestinal Segregated-Flow Model ..........................................................16
1.4.3 Whole Body PBPK Model.....................................................................................17
1.4.4 PBPK Models for Sequential Metabolism.............................................................18
1.5 Codeine as Study Probe for PBPK Modeling of Sequential Metabolism..........................19
v
v
1.5.1 Codeine and Metabolites........................................................................................19
1.5.2 Codeine Sequential Metabolism for Validation of the SFM .................................22
1.6 Statement of Research........................................................................................................22
1.6.1 Goals to Achieve in the Studies .............................................................................22
1.6.1.1 Theoretical ...............................................................................................23
1.6.1.2 Experimental............................................................................................23
1.6.1.3 Combining Theoretical and Experimental...............................................23
1.6.2 Hypothesis to be Tested .........................................................................................24
1.7 Significance........................................................................................................................24
2 STATEMENT OF PURPOSE OF INVESTIGATION ............................................................26
2.1 Hypothesis..........................................................................................................................27
2.2 Thesis Outline ....................................................................................................................28
3 PBPK MODELS FOR SEQUENTIAL METABOLISM OF CODEINE TO MORPHINE AND M3G IN RAT: THEORETICAL AND EXPERIMENTAL STUDY .............................29
3.1 Abstract ..............................................................................................................................30
3.2 Introduction........................................................................................................................31
3.3 Materials and Methods.......................................................................................................34
3.3.1 Literature Data Collecting and Processing ............................................................34
3.3.2 Codeine PK Study in Rat In Vivo ..........................................................................35
3.3.2.1 Chemicals ................................................................................................35
3.3.2.2 Animal Studies ........................................................................................35
3.3.2.3 Assay Procedure ......................................................................................36
3.3.2.4 Pharmacokinetic Calculation...................................................................37
3.3.3 Modeling................................................................................................................38
3.3.3.1 Whole Body PBPK Modeling .................................................................38
vi
vi
3.3.3.2 Parameter Estimation...............................................................................39
3.3.4 Simulations and Kinetic Analysis..........................................................................45
3.3.5 Statistical Comparisons..........................................................................................46
3.4 Results................................................................................................................................46
3.4.1 LC-MS/MS Assay for In Vivo PK Studies ............................................................46
3.4.2 PK Studies of Codeine IV and Oral Dosing to Rats ..............................................49
3.4.3 Modeling and Simulation.......................................................................................52
3.4.3.1 Intrinsic Clearances and Rate Constants for Codeine in Rat...................53
3.4.3.2 Tissue-Blood Partition Coefficients for Codeine Dosing to Rat .............54
3.4.3.3 Simulated Results with Literature and Experimental Data .....................55
3.4.4 Calculated AUC Ratios for Codeine Sequential Metabolism in Rat .....................59
3.4.5 Model Discrimination ............................................................................................60
3.5 Discussion..........................................................................................................................61
3.6 Statement of Significance of Chapter 3 .............................................................................65
4 MODELING AND SIMULATION OF SEQUENTIAL METABOLISM OF CODEINE TO MORPHINE AND M3G IN MAN.....................................................................................67
4.1 Abstract ..............................................................................................................................68
4.2 Introduction........................................................................................................................69
4.3 Methods..............................................................................................................................71
4.3.1 Literature Data Collecting and Processing ............................................................71
4.3.2 Modeling................................................................................................................72
4.3.2.1 Parameter Estimation...............................................................................73
4.3.3 Simulations and Kinetic Analysis..........................................................................77
4.3.4 Model Discrimination ............................................................................................78
4.4 Results................................................................................................................................79
vii
vii
4.4.1 Physiological Parameters for Codeine in Man.......................................................79
4.4.2 Intrinsic Clearances and Rate Constants for Codeine Dosing to Man...................80
4.4.3 Tissue-Blood Partition Coefficients for Codeine Dosing to Man..........................81
4.4.4 Simulated Results with Literature Data for Both Morphine and Codeine Administration .......................................................................................................81
4.4.5 Calculated AUC Ratios for Codeine Sequential Metabolism in Man ...................84
4.4.6 Role of Fractional Formation of Morphine from Codeine in Discrimination between SFM and TM ...........................................................................................85
4.4.7 Model Discrimination ............................................................................................86
4.5 Discussion..........................................................................................................................87
4.6 Statement of Significance of Chapter 4 .............................................................................90
5 GENERAL DISCUSSION AND CONCLUSION ...................................................................92
References......................................................................................................................................98
Appendix......................................................................................................................................108
viii
viii
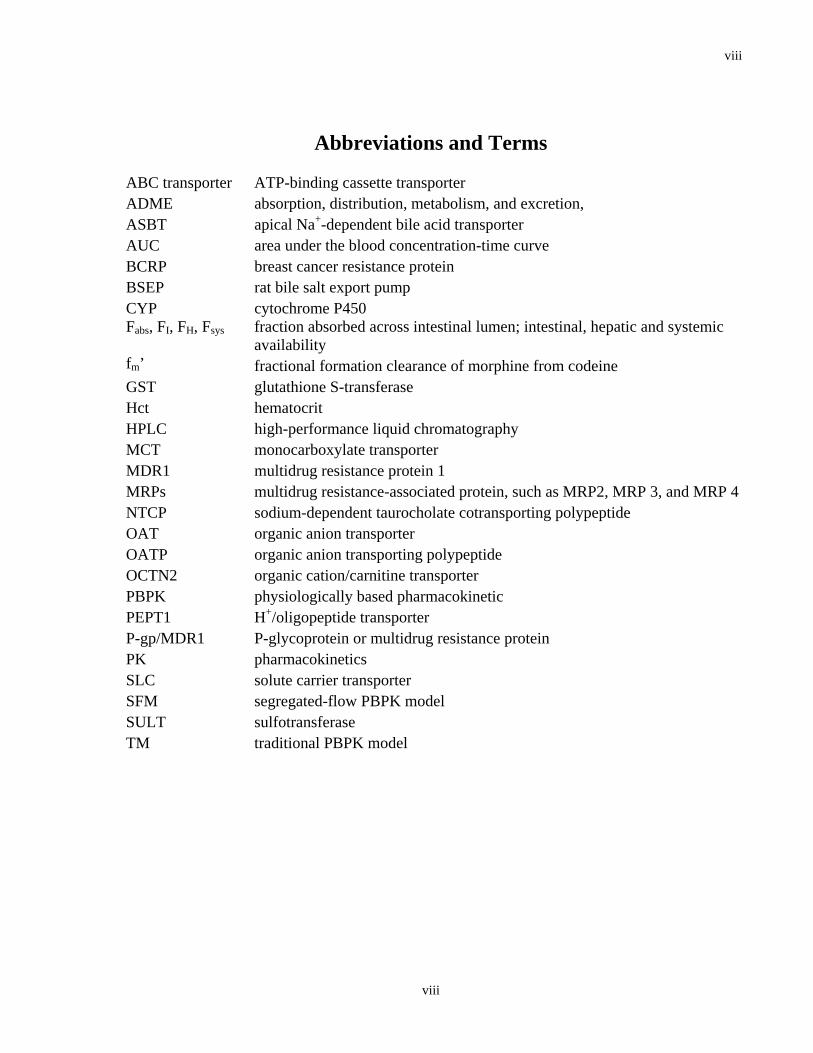
Abbreviations and Terms
ABC transporter ATP-binding cassette transporter ADME absorption, distribution, metabolism, and excretion, ASBT apical Na+-dependent bile acid transporter AUC area under the blood concentration-time curve BCRP breast cancer resistance protein BSEP rat bile salt export pump CYP cytochrome P450 Fabs, FI, FH, Fsys fraction absorbed across intestinal lumen; intestinal, hepatic and systemic
availability fm’ fractional formation clearance of morphine from codeine GST glutathione S-transferase Hct hematocrit HPLC high-performance liquid chromatography MCT monocarboxylate transporter MDR1 multidrug resistance protein 1 MRPs multidrug resistance-associated protein, such as MRP2, MRP 3, and MRP 4 NTCP sodium-dependent taurocholate cotransporting polypeptide OAT organic anion transporter OATP organic anion transporting polypeptide OCTN2 organic cation/carnitine transporter PBPK physiologically based pharmacokinetic PEPT1 H+/oligopeptide transporter P-gp/MDR1 P-glycoprotein or multidrug resistance protein PK pharmacokinetics SLC solute carrier transporter SFM segregated-flow PBPK model SULT sulfotransferase TM traditional PBPK model
ix
ix
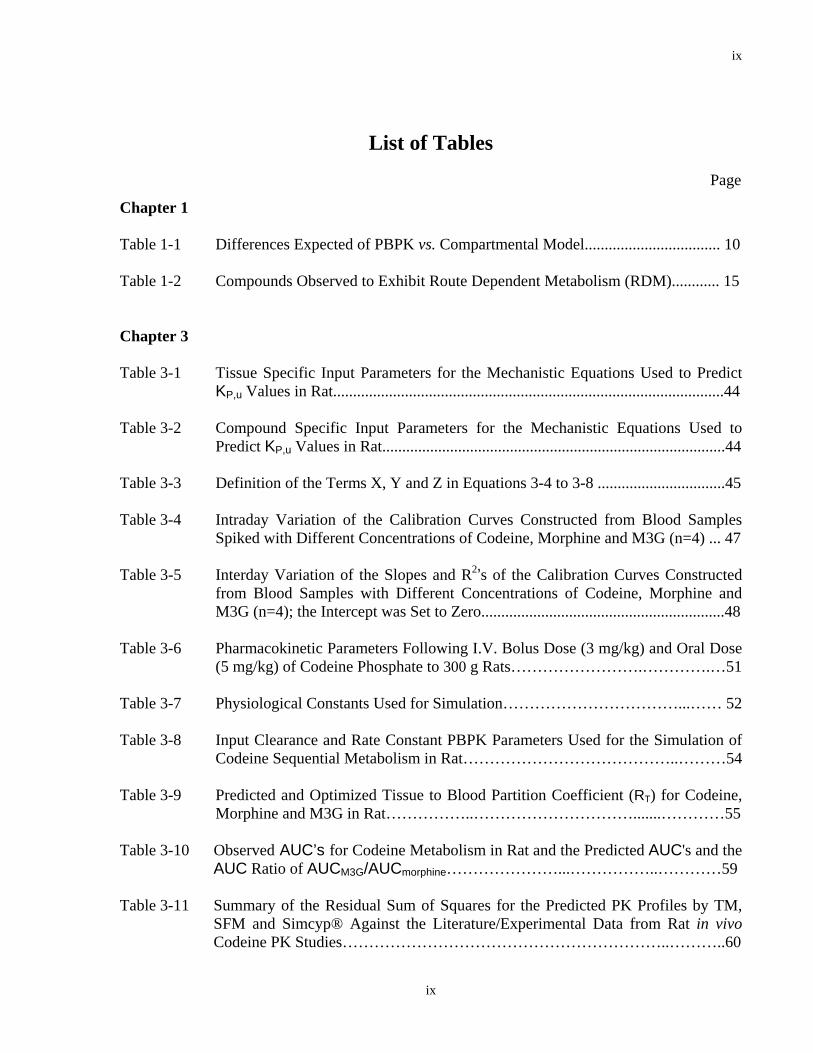
List of Tables
Page
Chapter 1 Table 1-1 Differences Expected of PBPK vs. Compartmental Model.................................. 10 Table 1-2 Compounds Observed to Exhibit Route Dependent Metabolism (RDM)............ 15 Chapter 3 Table 3-1 Tissue Specific Input Parameters for the Mechanistic Equations Used to Predict
KP,u Values in Rat..................................................................................................44 Table 3-2 Compound Specific Input Parameters for the Mechanistic Equations Used to
Predict KP,u Values in Rat......................................................................................44 Table 3-3 Definition of the Terms X, Y and Z in Equations 3-4 to 3-8 ................................45 Table 3-4 Intraday Variation of the Calibration Curves Constructed from Blood Samples
Spiked with Different Concentrations of Codeine, Morphine and M3G (n=4) ... 47 Table 3-5 Interday Variation of the Slopes and R2’s of the Calibration Curves Constructed
from Blood Samples with Different Concentrations of Codeine, Morphine and M3G (n=4); the Intercept was Set to Zero.............................................................48
Table 3-6 Pharmacokinetic Parameters Following I.V. Bolus Dose (3 mg/kg) and Oral Dose
(5 mg/kg) of Codeine Phosphate to 300 g Rats…………………….………….…51 Table 3-7 Physiological Constants Used for Simulation……………………………...…… 52 Table 3-8 Input Clearance and Rate Constant PBPK Parameters Used for the Simulation of
Codeine Sequential Metabolism in Rat…………………………………..………54 Table 3-9 Predicted and Optimized Tissue to Blood Partition Coefficient (RT) for Codeine,
Morphine and M3G in Rat……………..………………………….......…………55 Table 3-10 Observed AUC’s for Codeine Metabolism in Rat and the Predicted AUC's and the
AUC Ratio of AUCM3G/AUCmorphine…………………...……………..…………59 Table 3-11 Summary of the Residual Sum of Squares for the Predicted PK Profiles by TM,
SFM and Simcyp® Against the Literature/Experimental Data from Rat in vivo Codeine PK Studies……………………………………………………..………..60
x
x
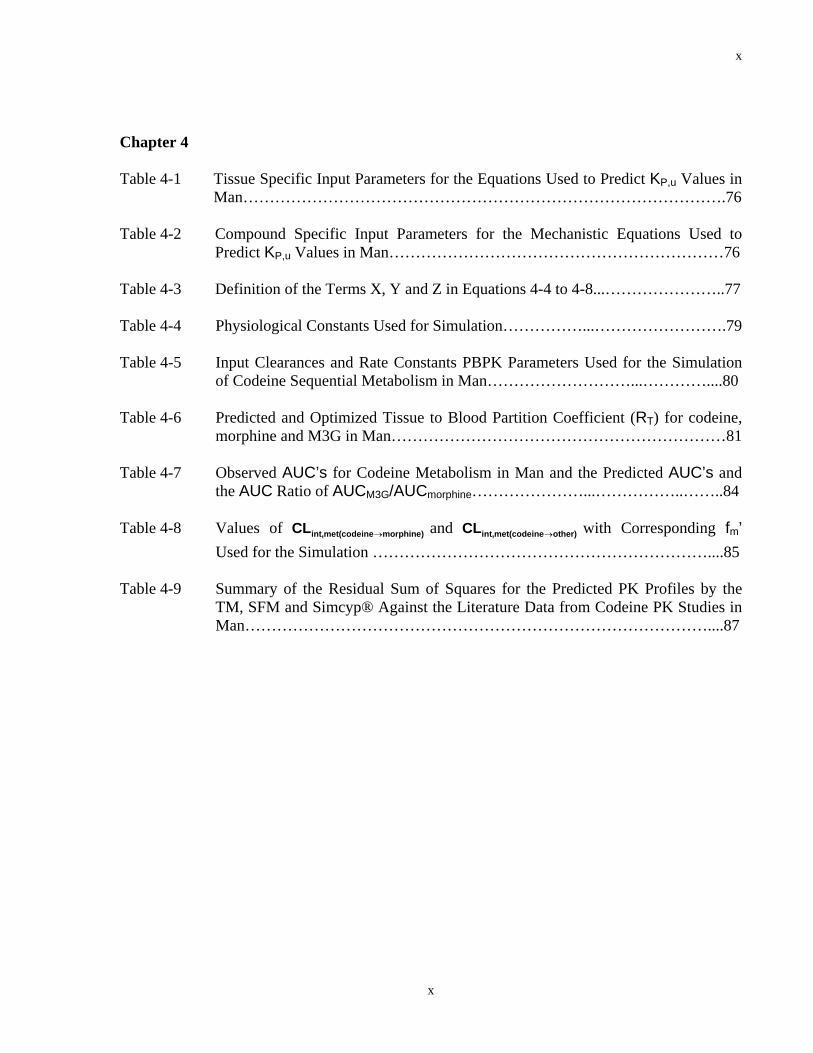
Chapter 4 Table 4-1 Tissue Specific Input Parameters for the Equations Used to Predict KP,u Values in
Man……………………………………………………………………………….76 Table 4-2 Compound Specific Input Parameters for the Mechanistic Equations Used to
Predict KP,u Values in Man………………………………………………………76 Table 4-3 Definition of the Terms X, Y and Z in Equations 4-4 to 4-8...…………………..77 Table 4-4 Physiological Constants Used for Simulation……………...…………………….79 Table 4-5 Input Clearances and Rate Constants PBPK Parameters Used for the Simulation
of Codeine Sequential Metabolism in Man………………………...…………....80 Table 4-6 Predicted and Optimized Tissue to Blood Partition Coefficient (RT) for codeine,
morphine and M3G in Man………………………………………………………81 Table 4-7 Observed AUC’s for Codeine Metabolism in Man and the Predicted AUC’s and
the AUC Ratio of AUCM3G/AUCmorphine…………………...……………..……..84 Table 4-8 Values of int,met(codeine morphine)CL → and int,met(codeine other)CL → with Corresponding fm’
Used for the Simulation ………………………………………………………....85 Table 4-9 Summary of the Residual Sum of Squares for the Predicted PK Profiles by the
TM, SFM and Simcyp® Against the Literature Data from Codeine PK Studies in Man……………………………………………………………………………....87
xi
xi
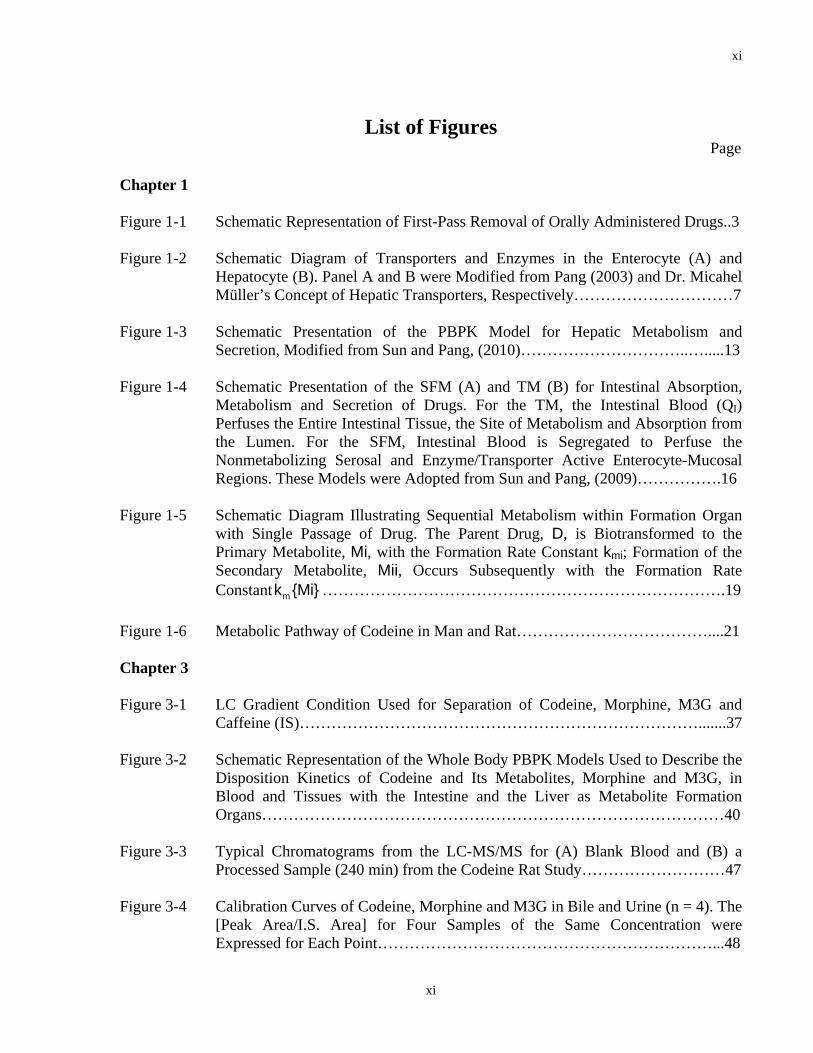
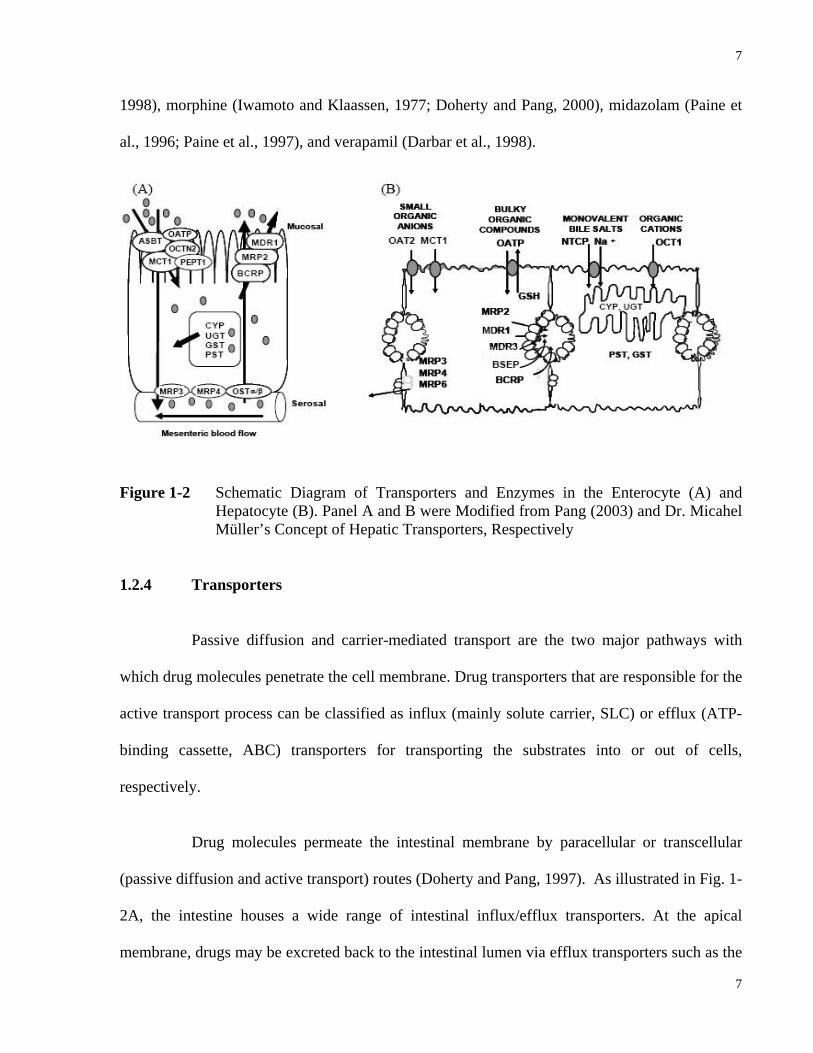
List of Figures Page Chapter 1 Figure 1-1 Schematic Representation of First-Pass Removal of Orally Administered Drugs..3 Figure 1-2 Schematic Diagram of Transporters and Enzymes in the Enterocyte (A) and
Hepatocyte (B). Panel A and B were Modified from Pang (2003) and Dr. Micahel Müller’s Concept of Hepatic Transporters, Respectively…………………………7
Figure 1-3 Schematic Presentation of the PBPK Model for Hepatic Metabolism and
Secretion, Modified from Sun and Pang, (2010)…………………………..….....13 Figure 1-4 Schematic Presentation of the SFM (A) and TM (B) for Intestinal Absorption,
Metabolism and Secretion of Drugs. For the TM, the Intestinal Blood (QI) Perfuses the Entire Intestinal Tissue, the Site of Metabolism and Absorption from the Lumen. For the SFM, Intestinal Blood is Segregated to Perfuse the Nonmetabolizing Serosal and Enzyme/Transporter Active Enterocyte-Mucosal Regions. These Models were Adopted from Sun and Pang, (2009)…………….16
Figure 1-5 Schematic Diagram Illustrating Sequential Metabolism within Formation Organ
with Single Passage of Drug. The Parent Drug, D, is Biotransformed to the Primary Metabolite, Mi, with the Formation Rate Constant kmi; Formation of the Secondary Metabolite, Mii, Occurs Subsequently with the Formation Rate Constant mk {Mi} ………………………………………………………………….19
Figure 1-6 Metabolic Pathway of Codeine in Man and Rat………………………………....21 Chapter 3 Figure 3-1 LC Gradient Condition Used for Separation of Codeine, Morphine, M3G and
Caffeine (IS)………………………………………………………………….......37 Figure 3-2 Schematic Representation of the Whole Body PBPK Models Used to Describe the
Disposition Kinetics of Codeine and Its Metabolites, Morphine and M3G, in Blood and Tissues with the Intestine and the Liver as Metabolite Formation Organs……………………………………………………………………………40
Figure 3-3 Typical Chromatograms from the LC-MS/MS for (A) Blank Blood and (B) a
Processed Sample (240 min) from the Codeine Rat Study………………………47 Figure 3-4 Calibration Curves of Codeine, Morphine and M3G in Bile and Urine (n = 4). The
[Peak Area/I.S. Area] for Four Samples of the Same Concentration were Expressed for Each Point………………………………………………………...48
xii
xii
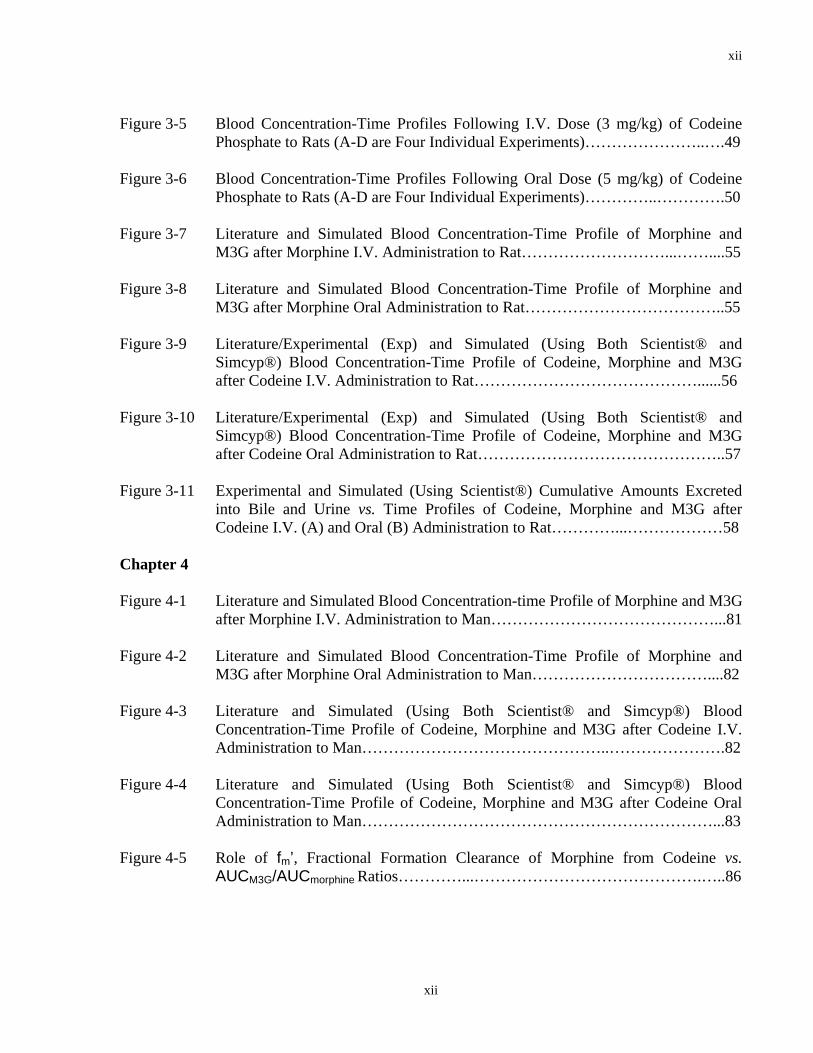
Figure 3-5 Blood Concentration-Time Profiles Following I.V. Dose (3 mg/kg) of Codeine Phosphate to Rats (A-D are Four Individual Experiments)…………………..….49
Figure 3-6 Blood Concentration-Time Profiles Following Oral Dose (5 mg/kg) of Codeine
Phosphate to Rats (A-D are Four Individual Experiments)…………..………….50 Figure 3-7 Literature and Simulated Blood Concentration-Time Profile of Morphine and
M3G after Morphine I.V. Administration to Rat………………………...……....55 Figure 3-8 Literature and Simulated Blood Concentration-Time Profile of Morphine and
M3G after Morphine Oral Administration to Rat………………………………..55 Figure 3-9 Literature/Experimental (Exp) and Simulated (Using Both Scientist® and
Simcyp®) Blood Concentration-Time Profile of Codeine, Morphine and M3G after Codeine I.V. Administration to Rat……………………………………......56
Figure 3-10 Literature/Experimental (Exp) and Simulated (Using Both Scientist® and
Simcyp®) Blood Concentration-Time Profile of Codeine, Morphine and M3G after Codeine Oral Administration to Rat………………………………………..57
Figure 3-11 Experimental and Simulated (Using Scientist®) Cumulative Amounts Excreted
into Bile and Urine vs. Time Profiles of Codeine, Morphine and M3G after Codeine I.V. (A) and Oral (B) Administration to Rat…………...………………58
Chapter 4 Figure 4-1 Literature and Simulated Blood Concentration-time Profile of Morphine and M3G
after Morphine I.V. Administration to Man……………………………………...81 Figure 4-2 Literature and Simulated Blood Concentration-Time Profile of Morphine and
M3G after Morphine Oral Administration to Man……………………………....82 Figure 4-3 Literature and Simulated (Using Both Scientist® and Simcyp®) Blood
Concentration-Time Profile of Codeine, Morphine and M3G after Codeine I.V. Administration to Man………………………………………..………………….82
Figure 4-4 Literature and Simulated (Using Both Scientist® and Simcyp®) Blood
Concentration-Time Profile of Codeine, Morphine and M3G after Codeine Oral Administration to Man…………………………………………………………...83
Figure 4-5 Role of fm’, Fractional Formation Clearance of Morphine from Codeine vs.
AUCM3G/AUCmorphine Ratios…………...…………………………………….…..86
1
1
1 INTRODUCTION
2
2
1.1 The Intestine and Liver in First-Pass Absorption and Elimination
Oral administration is the most common and convenient route for drug intake. The
portion of the oral dose that reaches the target site to exert its pharmacological effect is
determined not only by the amount absorbed across gastrointestinal (GI) tract (Fabs), but also by
the fraction available to the intestine (FI) and the liver (FH) (and possibly the lung) (Back and
Rogers, 1987) (Fig. 1-1). The extent of metabolism and excretion of the drug in these organs
prior to reaching systemic circulation is defined as pre-systemic elimination or “first-pass” effect
(Gibaldi et al., 1971). Due to “first-pass” removal, only a fraction of the oral dose reaches the
systemic circulation intact. This fraction is known as systemic bioavailability (Fsys), which is the
product of Fabs, FI, and FH (Mistry and Houston, 1981; Doherty and Pang, 1997).
The absorption of orally administered drugs involves the passage of the drug molecule
through the intestinal luminal membrane into the gastric and intestinal mucosa and subsequently
into the systemic circulation. The intestine is divided into three segments, namely the duodenum,
jejunum and ileum. Due to its large surface area of the villi and microvilli, the intestine is more
important than the stomach for the absorption of drugs administered via the oral route. The
intestine possesses a wide variety of influx and efflux transporters as well as Phase I and Phase II
enzymes (Dubey and Singh, 1988; Tsuji and Tamai, 1996; Lin et al., 1999; Pang, 2003). Hence,
systemic bioavailability is greatly affected by intestinal transporters and enzymes (Kwan, 1997).
The drug that escapes intestinal removal sequentially enters the liver, which is
anatomically posterior. Upon entry, the compound undergoes metabolism and/or secretion
through biliary clearance. Due to enterohepatic circulation, both parent drug and metabolite(s)
3
3
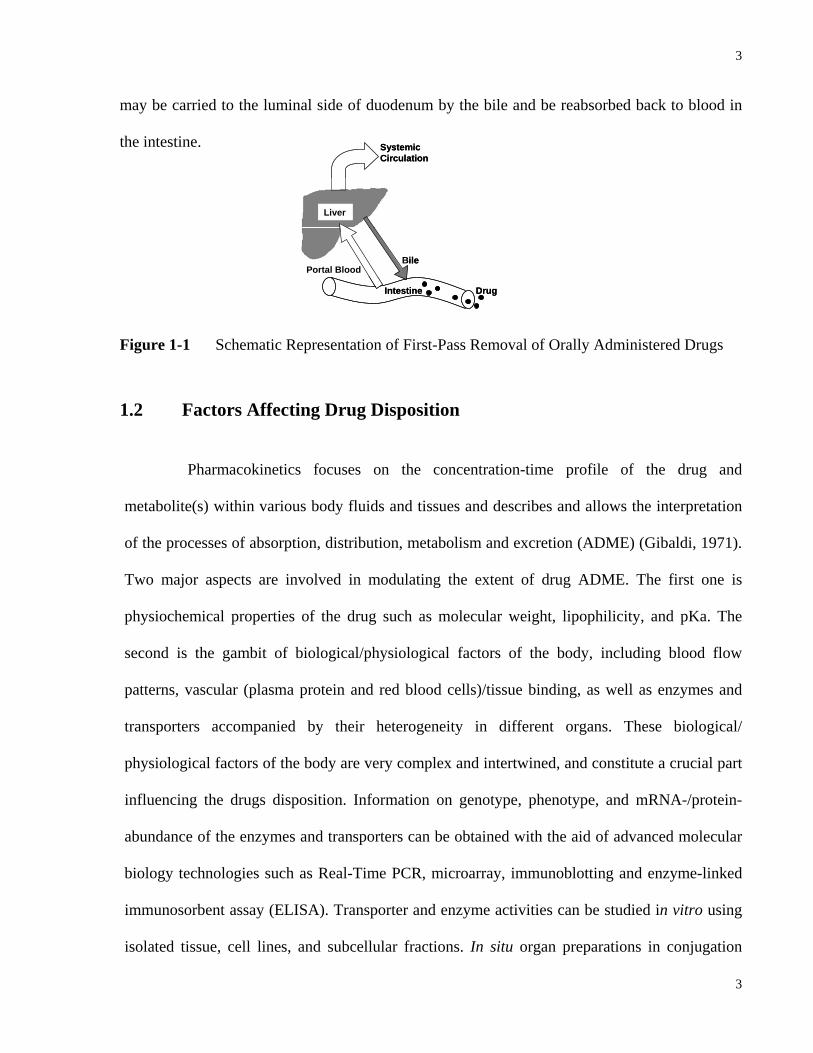
may be carried to the luminal side of duodenum by the bile and be reabsorbed back to blood in
the intestine.
Figure 1-1 Schematic Representation of First-Pass Removal of Orally Administered Drugs
1.2 Factors Affecting Drug Disposition
Pharmacokinetics focuses on the concentration-time profile of the drug and
metabolite(s) within various body fluids and tissues and describes and allows the interpretation
of the processes of absorption, distribution, metabolism and excretion (ADME) (Gibaldi, 1971).
Two major aspects are involved in modulating the extent of drug ADME. The first one is
physiochemical properties of the drug such as molecular weight, lipophilicity, and pKa. The
second is the gambit of biological/physiological factors of the body, including blood flow
patterns, vascular (plasma protein and red blood cells)/tissue binding, as well as enzymes and
transporters accompanied by their heterogeneity in different organs. These biological/
physiological factors of the body are very complex and intertwined, and constitute a crucial part
influencing the drugs disposition. Information on genotype, phenotype, and mRNA-/protein-
abundance of the enzymes and transporters can be obtained with the aid of advanced molecular
biology technologies such as Real-Time PCR, microarray, immunoblotting and enzyme-linked
immunosorbent assay (ELISA). Transporter and enzyme activities can be studied in vitro using
isolated tissue, cell lines, and subcellular fractions. In situ organ preparations in conjugation
Systemic Circulation
Liver
Intestine
BilePortal Blood
Drug
Systemic Circulation
Liver
Intestine
BilePortal Blood
Drug
4
4
with in vivo pharmacokinetic studies not only allow interpretation of biological factors,
including blood flow and binding information, but also provide a more precise estimates of
overall transporter and enzyme activities. The above-mentioned information will be used as the
building blocks for the development of physiologically-based pharmacokinetic (PBPK) models
to predict drug ADME.
1.2.1 Blood Flow
The blood vessel is the channel interconnecting different organs and tissues of the
body. Blood flow delivers the drug molecules to tissue/organs for absorption, distribution,
metabolism and excretion. The orally administered drug in the lumen needs to traverse the gut
wall, enter into enterocytes, diffuse into intestinal portal blood, and reach the liver. A distinct
intestinal blood flow pattern has been observed for various tissue layers of the intestine: the
mucosa, submucosa and muscularis versus the serosa which lies inferior to the muscularis
(Granger et al., 1980; Cong et al., 2000). The majority (approximately 70% to 90%) of the
intestinal blood flow perfuses the non-absorptive, non-metabolic serosal region whereas only
10% to 30% of the blood flow reaches the enzyme- and transporter-rich enterocyte region at the
mucosal layer (Mailman, 1978; Granger et al., 1980; Schurgers et al., 1984; Cong et al., 2000).
As a result, orally administered drugs are more accessible to intestinal enzymes and transporters
compared to intravenously administered drugs. This blood flow pattern has been incorporated
into the “segregated-flow model” of the intestine in describing “route dependent metabolism”
(Cong et al., 2000).
The liver is a highly perfused organ. Approximately 25% of its blood supply comes
from the hepatic artery, which provides oxygenated blood, and 75% is provided by the portal
vein, which is enriched in nutrition and xenobiotics (Bernareggi and Rowland, 1991; Kawai et al.,
5
5
1994). The highly branched capillary vessels, together with the discontinuous (fenestrated)
endothelium, allow drug molecules within the blood space to come into contact with the
hepatocyte directly for drug metabolism and biliary excretion (Horn et al., 1986). By obtaining
drug concentrations from the hepatic inflow and outflow, the extraction ratio of the liver can be
calculated. Successively, total organ clearance as well as intrinsic clearance can be estimated
based on the designated model assumptions (Pang and Rowland, 1977).
1.2.2 Vascular/Tissue Binding
It is assumed that only unbound drug molecules are subject to drug absorption,
distribution, metabolism and excretion processes (Jusko and Gretch, 1976). Thus, vascular/tissue
binding would greatly influence disposition and clearance of drugs, especially the ones that are
poorly extracted (Wilkinson and Shand, 1975; Pang and Rowland, 1977). Vascular/tissue
binding of the drug molecule is considered as the protein binding of drug molecules to red blood
cells, albumin, lipoprotein, and α1-acid glycoprotein. In general, basic compounds show a higher
affinity towards acidic phospholipids (lipoprotein) and α1-acid glycoprotein while very weak
basic/acidic and neutrals compounds appear to bind more to extracellular albumins and
lipoproteins, respectively (Kwon, 2001; Rodgers et al., 2005; Rodgers and Rowland, 2006).
Although often dismissed in drug pharmacokinetics, red blood cell binding can play an important
role in delimiting organ clearance of the drug (Pang et al., 1995). It has been found that the red
blood cells tend to bind drug molecules with pKa values that are greater than 7 (Wilkinson,
1983). Examples are: doxorubicin (Lee and Chiou, 1989a), propranolol (Lee and Chiou, 1989b),
acetaminophen (Pang et al., 1995), codeine (Mohammed et al., 1993) and morphine (Doherty et
al., 2006). Knowledge on vascular/tissue binding of the drug molecule greatly facilitates the
prediction of drug distribution and excretion.
6
6
1.2.3 Enzymes
Drug molecules may be biotransformed into metabolite(s) by Phase I (oxidation,
reduction and hydrolysis) and Phase II (conjugation) enzymes. In some cases, the metabolite(s)
are pharmacologically active or even toxic. For instance, enalapril is a prodrug and is hydrolyzed
to the active form, enalaprilat (Paine et al., 1996; Paine et al., 1997). On the other hand, L-
754,394, a furanopyridine derivative, is oxidized into epoxide intermediates which can induce
liver toxicity (Sahali-Sahly et al., 1996; Lin et al., 2000).
As illustrated in Fig. 1-2A, intestinal metabolism is modulated by Phase I enzymes
such as cytochrome P450 3A (CYP3A) as well as Phase II enzymes including sulfotransferases
(SULTs), UDP-glucuronosyltransferases (UGTs) and glutathione S-transferases (GSTs) (Dubey
and Singh, 1988; Lin et al., 1999; Pang, 2003). Fig. 1-2B is a schematic presentation of the
hepatocytes in the liver which possess a considerable amount of Phase I (cytochrome P450,
flavin monooxygenases, monoamine oxidase, carbonyl reductase, sulfatase, glucuronidase and
carboxylesterases) and Phase II (SULTs, UGTs, GSTs, methyltransferase, N-acetyltransferase,
and amino acid N-acetyltransferase) enzymes (Wrighton et al., 1993; Parkinson, 2001). Although
the liver is often considered as a major site for drug removal and has higher enzyme abundance
compared to the intestine, orally administered drugs must first traverse the intestinal mucosal and
become exposed to intestinal enzymes before hepatic enzymes. Therefore, intestinal drug
metabolism could still be equal to or become more important in the first-pass removal of drugs
which are given orally. For example, various therapeutic compounds have been identified to
have substantial intestinal first-pass removal. These include lidocaine (Kawai et al., 1985; Le et
al., 1996), propranolol (Du Souich et al., 1995), cyclosporine (Luke et al., 1990; Lehle et al.,
7
7
1998), morphine (Iwamoto and Klaassen, 1977; Doherty and Pang, 2000), midazolam (Paine et
al., 1996; Paine et al., 1997), and verapamil (Darbar et al., 1998).
Figure 1-2 Schematic Diagram of Transporters and Enzymes in the Enterocyte (A) and Hepatocyte (B). Panel A and B were Modified from Pang (2003) and Dr. Micahel Müller’s Concept of Hepatic Transporters, Respectively
1.2.4 Transporters
Passive diffusion and carrier-mediated transport are the two major pathways with
which drug molecules penetrate the cell membrane. Drug transporters that are responsible for the
active transport process can be classified as influx (mainly solute carrier, SLC) or efflux (ATP-
binding cassette, ABC) transporters for transporting the substrates into or out of cells,
respectively.
Drug molecules permeate the intestinal membrane by paracellular or transcellular
(passive diffusion and active transport) routes (Doherty and Pang, 1997). As illustrated in Fig. 1-
2A, the intestine houses a wide range of intestinal influx/efflux transporters. At the apical
membrane, drugs may be excreted back to the intestinal lumen via efflux transporters such as the
8
8
P-glycoprotein (P-gp/MDR1), the multidrug resistance associated protein 2 (MRP2), and the
breast cancer resistance protein (BCRP); at the basolateral membrane, drugs may be effluxed
into mesenteric blood by MRP3 and MRP4 and the organic solute transporters (OSTα-OSTβ)
(for review, see Ito et al., 2005). Drugs that have poor permeability such as di- or tripeptides, bile
acids, antibiotics and lactate-like compounds require absorptive transporters such as the
oligopeptide transporter 1 (PEPT1), the apical Na+-dependent bile acid transporter (ASBT), the
monocarboxylic acid transporter 1 (MCT1), the organic anion transporting polypeptide
(OATP2B1) and the organic cation/carnitine transporter (OCTN2) (for review, see Ito et al.,
2005).
Hepatocytes represent the predominant cell type in the liver. They are polarized cells
with distinct canalicular and sinusoidal domains where a great variety of drug transporters reside.
As depicted in Fig, 1-2B, drug molecules are transported into the hepatocytes by sinusoidal
(basolateral) transporters such as the organic anion transporter 2 (OAT2), MCT1, OATPs,
sodium-dependent taurocholate cotransporting polypeptide (NTCP) and organic cation
transporter 1 (OCT1) (for review, see Ito et al., 2005). To exit the hepatocytes, drug molecules
can either be effluxed back to the sinusoid blood by the sinusoidal efflux transporters, including
MRP3, MRP4, and MRP6; or be secreted into the bile via canalicular transporters such as MRP2,
MDR1, bile salt export pump (BSEP) and BCRP (for review, see Ito et al., 2005).
1.2.5 Other Factors
Other factors affecting intestinal drug disposition include drug characteristics and
physiology of the GI tract (Pang, 2003; Doherty and Pang, 1997). The pKa of the drug molecule
determines the extent of ionization under various pH conditions in different parts of the intestine
9
9
(duodenum: 4.7-6.5, upper jejunum: 6.2-6.7, and lower jejunum: 6.2-7.3) (Crouthamel et al.,
1975). Other than carrier-mediated transport, passive diffusion is the major route of entry for
intestinal drug absorption. Lipophilicity of the molecule, which is assessed by the octanol:water
partition coefficient, determines the extent of transmembrane permeation of drug molecules.
When the compound shows high hydrophilicity and is highly ionized, the lipoidal membrane
becomes the rate limiting barrier for drug absorption. When the compound is of extremely high
lipophilicity (highly unionized or highly hydrogen-bonded), the unstirred water layer deters it
from entering the cells (Suzuki et al., 1970a; Suzuki et al., 1970b). Hence, only molecules that
exhibit a good lipophilicity and hydrophilicity balance are capable of traversing unstirred-water
and cell membrane barriers. In addition, delay in gastric emptying may decrease drug absorption
for drugs that are unstable in the stomach (Heading et al., 1973).
1.3 Early Modeling of Drug Disposition and Limitations
Pharmacokinetic models are mathematical schemes that represent processes of drug
absorption, distribution, metabolism and excretion (ADME) in vivo. Over the past few decades,
various modeling approaches with different complexity levels have been developed for
predicting and analyzing drug concentration-time profiles in body fluids/tissues for different
applications and purposes. A prevalent approach is the classic pharmacokinetic compartmental
modeling which regards the body as a series of interconnected compartments that drugs
distribute in (Perrier and Gibaldi, 1982; Fleishaker and Smith, 1987). These models assume that
within a compartment, the drug is homogenously distributed and the convective drug transport
between compartments is a first-order process that can be described by microconstants. In
general, elimination of the drug is assumed to occur in the central compartment which includes
the systemic circulation and highly-perfused organs/tissues. The central compartment is
10
10
connected in parallel to the peripheral compartments which consist of poorly-perfused
tissue/organs (muscle, fat, skin, etc.).
One major shortcoming of compartmental models originates from the assumption that
the drug concentration in plasma reflects that in tissue, which is the determinant for drug-
response and toxicological effects. However, since this is not a precise measurement for the real
physiological condition, there may not be a good correlation between plasma drug concentration
and efficiency. Moreover, another limitation of compartmental model is that the eliminating
organ/tissue is not separated from the central compartment. Consequently, compartmental
models are unable to describe physiological processes related to transporter/enzyme function and
the sequential metabolism of the parent drug within metabolite formation organs. These
disadvantages accelerate the emergence of physiologically based pharmacokinetic (PBPK)
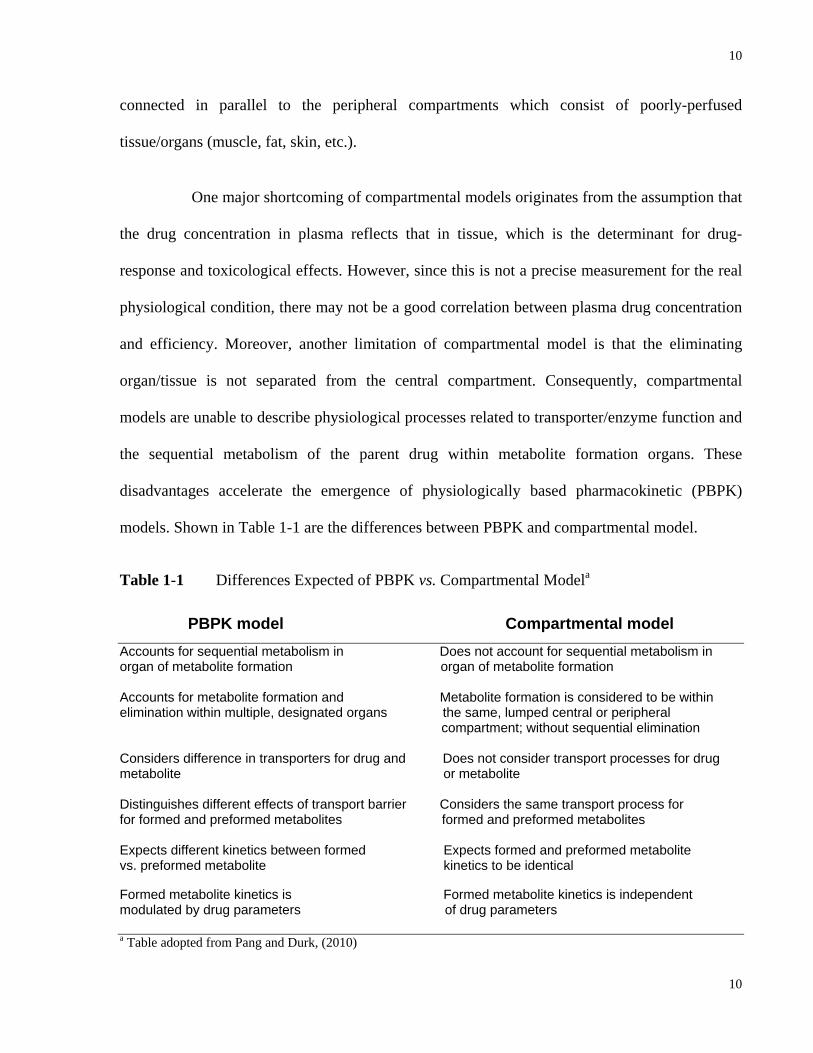
models. Shown in Table 1-1 are the differences between PBPK and compartmental model.
Table 1-1 Differences Expected of PBPK vs. Compartmental Modela
PBPK model Compartmental model Accounts for sequential metabolism in Does not account for sequential metabolism in organ of metabolite formation organ of metabolite formation Accounts for metabolite formation and Metabolite formation is considered to be within elimination within multiple, designated organs the same, lumped central or peripheral compartment; without sequential elimination Considers difference in transporters for drug and Does not consider transport processes for drug metabolite or metabolite Distinguishes different effects of transport barrier Considers the same transport process for for formed and preformed metabolites formed and preformed metabolites Expects different kinetics between formed Expects formed and preformed metabolite vs. preformed metabolite kinetics to be identical Formed metabolite kinetics is Formed metabolite kinetics is independent modulated by drug parameters of drug parameters a Table adopted from Pang and Durk, (2010)
11
11
1.4 Physiologically-Based Pharmacokinetic (PBPK) Modeling of Drug
Disposition
1.4.1 Traditional PBPK Models
Pharmacokinetic modeling and simulations using PBPK models are advanced and
powerful tools in exploring and studying drug transport and metabolism in cell systems, perfused
organs as well as in the whole body. Factors like the flow rate, vascular/tissue binding, and
enzymes/transporter functions on organ clearances are incorporated in PBPK modeling. The
PBPK model is composed of a series of compartments with discrete volumes representing
various tissues and organs for the body. Each compartment is homogeneous and interconnected
with each other by the blood circulation according to their anatomical pattern. One basic
assumption of PBPK models is venous equilibration: the unbound concentration in tissue blood
equals that in the emergent blood.
Mathematically based differential equations are used to depict pharmacokinetic
processes in terms of physiological, thermodynamic and biochemical parameters (Rowland,
1984). Physiological parameters include tissue volumes (V) and tissue blood flow rates (Q).
Thermodynamic parameters include protein binding (denoted as unbound fractions in blood,
plasma or tissue: fB, fP or fT) and the tissue to plasma/blood partition coefficient (Kp/RT) of the
drug. Biochemical parameters such as intrinsic clearances (CLint) are used to account for
transport and metabolic processes. Under first order conditions, CLint is expressed as the ratio
between the maximum velocity (Vmax) and the Michaelis-Menten constant (Km) of a particular
drug to an enzyme or a transporter. Specifically, the intrinsic metabolic clearance (CLint,met) is
used to depict metabolism of drug (and metabolite, if applicable) within the cell. The intrinsic
12
12
secretory clearance (CLint,sec) is responsible for the excretion (luminal or biliary) at the apical
membrane. The influx (CLin) and efflux (CLef) clearances represent the summative process of
active transport and passive diffusion at the basolateral membrane.
One remarkable advantage of PBPK modeling is that mathematical equations
describing flow, binding and transporter/enzymatic activities can be solved by matrix inversion
for the area under the curve (AUC) under linear conditions. This approach has been used to
investigate the drug kinetics for single eliminating organs such as the intestine, liver and kidney
(de Lannoy et al., 1990; de Lannoy et al., 1993; Pang et al., 2008) as well as for whole body
PBPK models (Sun and Pang, 2010).
1.4.1.1 Models for Hepatic Drug Clearance
Since the early 1970’s, various models of hepatic drug clearance have been
established, including the “well stirred” (venous equilibrium) model (Pang and Rowland, 1977),
the “parallel tube” (undistributed sinusoidal) model (Winkler et al., 1973) and the distributed
sinusoidal models (Bass et al., 1978; Forker and Luxon, 1978). The “well stirred” model is the
most popular among these models due to its simplicity. Over time, a “well stirred” PBPK model
has been developed with information on blood flow, vascular/tissue binding, enzymes and
transporters for hepatic drug clearance determination (de Lannoy et al., 1990; de Lannoy et al.,
1993; Pang et al., 2008). In this model (Fig. 1-3), the liver is divided into three subcompartments:
liver blood (LB), liver tissue (L) and bile compartment (bile). The reservoir (R) and liver
compartments are interconnected by the blood flow, QH. The exchange of substances between the
liver blood and tissue is represented as HinCL and H
efCL for influx and efflux, respectively. Within
the liver tissue, the parent drug (P) can be metabolized to the metabolite (Mi) by enzymes
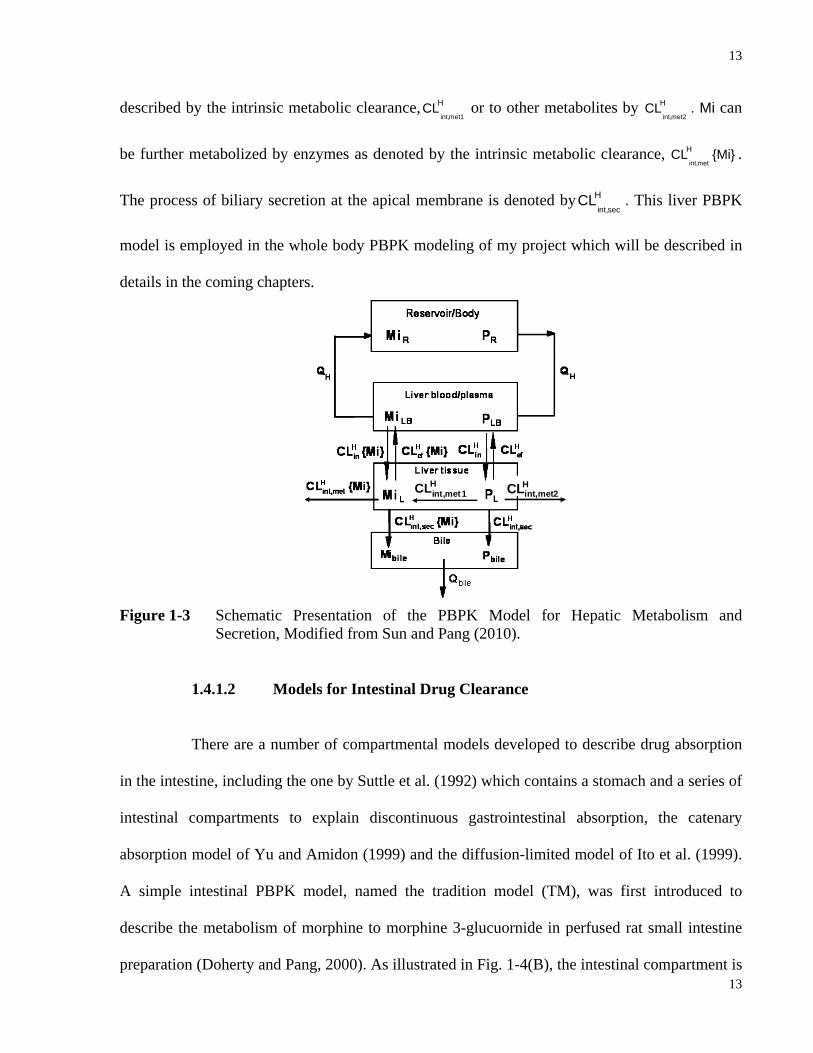
13
13
described by the intrinsic metabolic clearance,int,met1
HCL or to other metabolites by int,met2
HCL . Mi can
be further metabolized by enzymes as denoted by the intrinsic metabolic clearance, int,met
HCL {Mi} .
The process of biliary secretion at the apical membrane is denoted byint,sec
HCL . This liver PBPK
model is employed in the whole body PBPK modeling of my project which will be described in
details in the coming chapters.
Figure 1-3 Schematic Presentation of the PBPK Model for Hepatic Metabolism and
Secretion, Modified from Sun and Pang (2010).
1.4.1.2 Models for Intestinal Drug Clearance
There are a number of compartmental models developed to describe drug absorption
in the intestine, including the one by Suttle et al. (1992) which contains a stomach and a series of
intestinal compartments to explain discontinuous gastrointestinal absorption, the catenary
absorption model of Yu and Amidon (1999) and the diffusion-limited model of Ito et al. (1999).
A simple intestinal PBPK model, named the tradition model (TM), was first introduced to
describe the metabolism of morphine to morphine 3-glucuornide in perfused rat small intestine
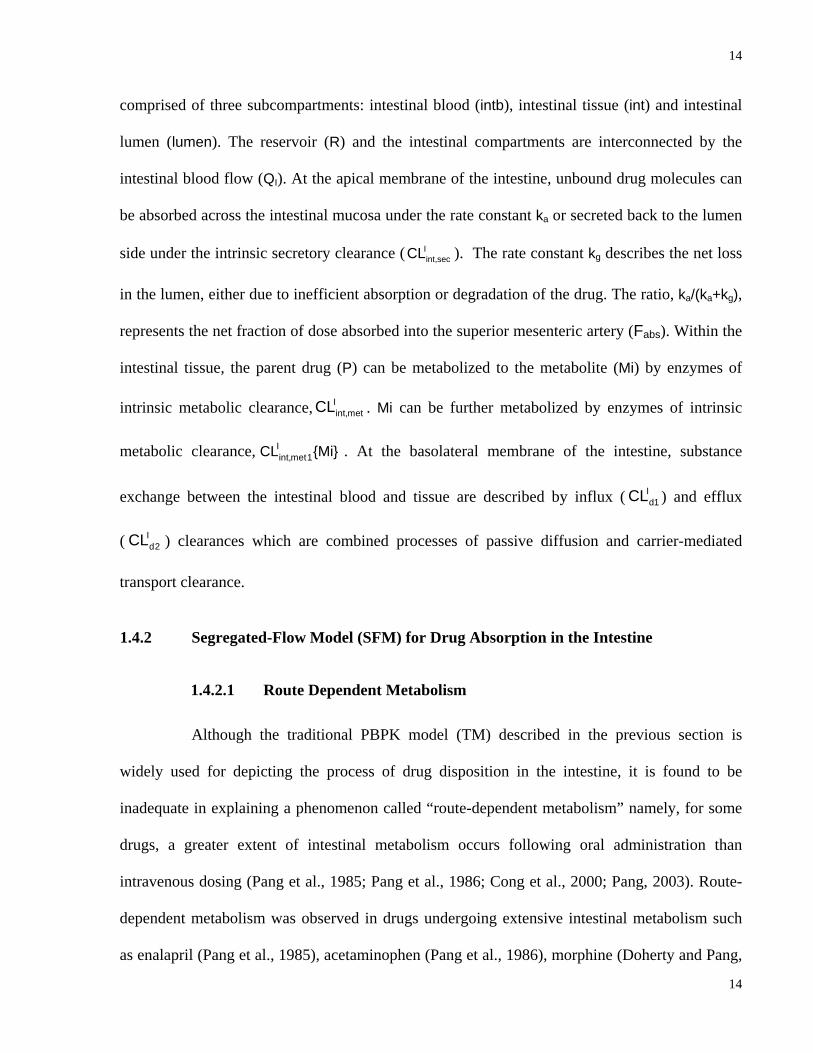
preparation (Doherty and Pang, 2000). As illustrated in Fig. 1-4(B), the intestinal compartment is
Hint,met1CL H
int,met2CLHint,met1CLHint,met1CL H
int,met2CL
14
14
comprised of three subcompartments: intestinal blood (intb), intestinal tissue (int) and intestinal
lumen (lumen). The reservoir (R) and the intestinal compartments are interconnected by the
intestinal blood flow (QI). At the apical membrane of the intestine, unbound drug molecules can
be absorbed across the intestinal mucosa under the rate constant ka or secreted back to the lumen
side under the intrinsic secretory clearance ( Iint,secCL ). The rate constant kg describes the net loss
in the lumen, either due to inefficient absorption or degradation of the drug. The ratio, ka/(ka+kg),
represents the net fraction of dose absorbed into the superior mesenteric artery (Fabs). Within the
intestinal tissue, the parent drug (P) can be metabolized to the metabolite (Mi) by enzymes of
intrinsic metabolic clearance, Iint,metCL . Mi can be further metabolized by enzymes of intrinsic
metabolic clearance, Iint,met1CL {Mi} . At the basolateral membrane of the intestine, substance
exchange between the intestinal blood and tissue are described by influx ( Id1CL ) and efflux
( Id2CL ) clearances which are combined processes of passive diffusion and carrier-mediated
transport clearance.
1.4.2 Segregated-Flow Model (SFM) for Drug Absorption in the Intestine
1.4.2.1 Route Dependent Metabolism
Although the traditional PBPK model (TM) described in the previous section is
widely used for depicting the process of drug disposition in the intestine, it is found to be
inadequate in explaining a phenomenon called “route-dependent metabolism” namely, for some
drugs, a greater extent of intestinal metabolism occurs following oral administration than
intravenous dosing (Pang et al., 1985; Pang et al., 1986; Cong et al., 2000; Pang, 2003). Route-
dependent metabolism was observed in drugs undergoing extensive intestinal metabolism such
as enalapril (Pang et al., 1985), acetaminophen (Pang et al., 1986), morphine (Doherty and Pang,
15
15
2000), (2)-6-aminocarbovir (Wen et al., 1999) and midazolam (Paine et al., 1996; Paine et al.,
1997) (Table 1-2). Modified from the TM, an intestinal PBPK model named Segregated-Flow
Model (SFM) was developed by Cong et al. (2000) in order to provide a more rational insight of
drug absorption via different dosing routes.
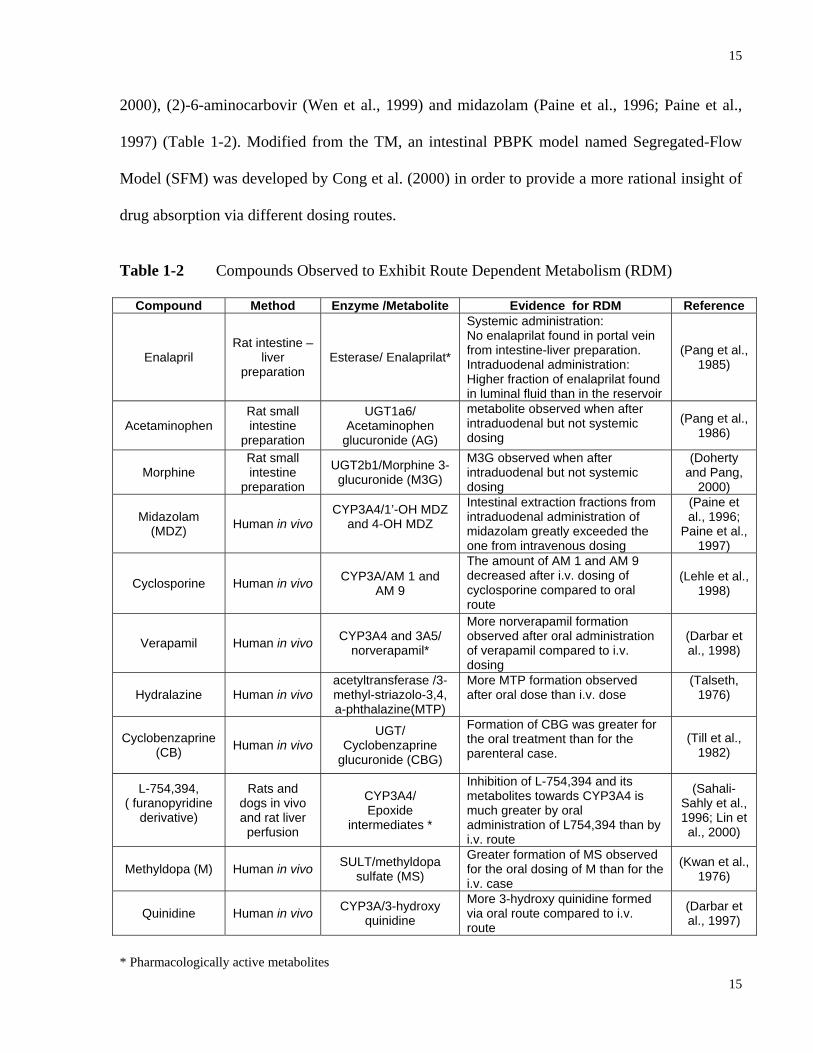
Table 1-2 Compounds Observed to Exhibit Route Dependent Metabolism (RDM)
Compound Method Enzyme /Metabolite Evidence for RDM Reference
Enalapril Rat intestine –
liver preparation
Esterase/ Enalaprilat*
Systemic administration: No enalaprilat found in portal vein from intestine-liver preparation. Intraduodenal administration: Higher fraction of enalaprilat found in luminal fluid than in the reservoir
(Pang et al., 1985)
Acetaminophen Rat small intestine
preparation
UGT1a6/ Acetaminophen
glucuronide (AG)
metabolite observed when after intraduodenal but not systemic dosing
(Pang et al., 1986)
Morphine Rat small intestine
preparation
UGT2b1/Morphine 3-glucuronide (M3G)
M3G observed when after intraduodenal but not systemic dosing
(Doherty and Pang,
2000)
Midazolam (MDZ) Human in vivo
CYP3A4/1’-OH MDZ and 4-OH MDZ
Intestinal extraction fractions from intraduodenal administration of midazolam greatly exceeded the one from intravenous dosing
(Paine et al., 1996;
Paine et al., 1997)
Cyclosporine Human in vivo CYP3A/AM 1 and AM 9
The amount of AM 1 and AM 9 decreased after i.v. dosing of cyclosporine compared to oral route
(Lehle et al., 1998)
Verapamil Human in vivo CYP3A4 and 3A5/ norverapamil*
More norverapamil formation observed after oral administration of verapamil compared to i.v. dosing
(Darbar et al., 1998)
Hydralazine Human in vivo acetyltransferase /3-methyl-striazolo-3,4, a-phthalazine(MTP)
More MTP formation observed after oral dose than i.v. dose
(Talseth, 1976)
Cyclobenzaprine (CB) Human in vivo
UGT/ Cyclobenzaprine
glucuronide (CBG)
Formation of CBG was greater for the oral treatment than for the parenteral case.
(Till et al., 1982)
L-754,394, ( furanopyridine
derivative)
Rats and dogs in vivo and rat liver
perfusion
CYP3A4/ Epoxide
intermediates *
Inhibition of L-754,394 and its metabolites towards CYP3A4 is much greater by oral administration of L754,394 than by i.v. route
(Sahali-Sahly et al., 1996; Lin et al., 2000)
Methyldopa (M) Human in vivo SULT/methyldopa sulfate (MS)
Greater formation of MS observed for the oral dosing of M than for the i.v. case
(Kwan et al., 1976)
Quinidine Human in vivo CYP3A/3-hydroxy quinidine
More 3-hydroxy quinidine formed via oral route compared to i.v. route
(Darbar et al., 1997)
* Pharmacologically active metabolites
16
16
1.4.2.2 Intestinal Segregated-Flow Model
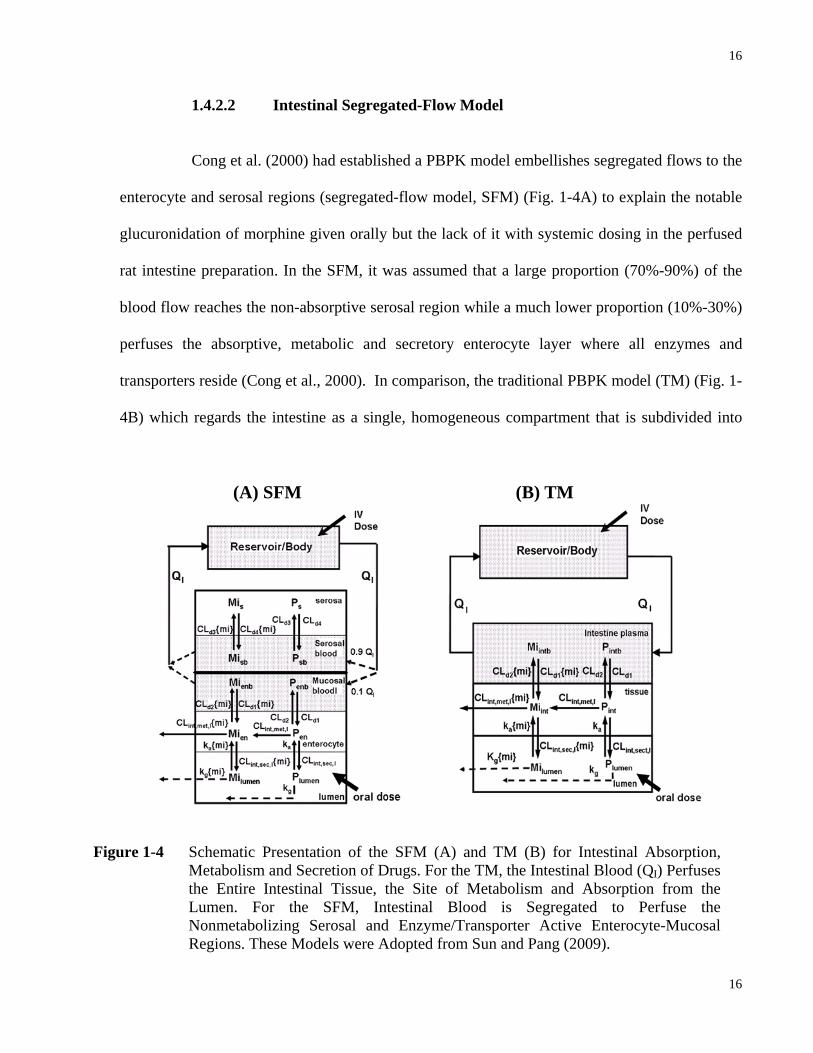
Cong et al. (2000) had established a PBPK model embellishes segregated flows to the
enterocyte and serosal regions (segregated-flow model, SFM) (Fig. 1-4A) to explain the notable
glucuronidation of morphine given orally but the lack of it with systemic dosing in the perfused
rat intestine preparation. In the SFM, it was assumed that a large proportion (70%-90%) of the
blood flow reaches the non-absorptive serosal region while a much lower proportion (10%-30%)
perfuses the absorptive, metabolic and secretory enterocyte layer where all enzymes and
transporters reside (Cong et al., 2000). In comparison, the traditional PBPK model (TM) (Fig. 1-
4B) which regards the intestine as a single, homogeneous compartment that is subdivided into
(A) SFM (B) TM
Figure 1-4 Schematic Presentation of the SFM (A) and TM (B) for Intestinal Absorption, Metabolism and Secretion of Drugs. For the TM, the Intestinal Blood (QI) Perfuses the Entire Intestinal Tissue, the Site of Metabolism and Absorption from the Lumen. For the SFM, Intestinal Blood is Segregated to Perfuse the Nonmetabolizing Serosal and Enzyme/Transporter Active Enterocyte-Mucosal Regions. These Models were Adopted from Sun and Pang (2009).
17
17
the vascular, cellular and luminal subcompartments, was found to be less adequate to explain the
morphine data. Because of the much lower blood flow entering the enterocyte region, less
metabolism would result for drugs given systemically than orally since, during oral absorption,
drugs need to traverse the enterocyte and would be metabolized at much greater extent. Many
other examples of route-dependent intestinal metabolism have been noted (Table 1-2). For this
reason, the virtual clinical simulator, Simcyp®, utilizes a much reduced flow rate to the intestine
(30-40%) to describe intestinal drug disposition (Yang et al., 2007)
1.4.3 Whole Body PBPK Model
Single organ PBPK models are essential in obtaining information on organ drug
clearance. However, the renal clearance terms are assigned to the reservoir (blood) compartment
for simplification while combining the effect of renal drug transporters and enzymes.
Furthermore, since systemic bioavailability (Fsys) is an outcome from multi-organ clearances, it
cannot be predicted by organ PBPK models. As a result, it would be prudent to investigate whole
body PBPK modeling with physiological determinants, enzymes and transporters. Sun and Pang
(2010) have established whole body PBPK models for renally excreted drugs that also undergo
sequential metabolism in the intestine and/or the liver. Mathematical solutions towards the area
under the curve (AUC) for drug and formed metabolite for 4 cases (different eliminating
organ/metabolite) were obtained using matrix inversion. Mechanistic expressions of Fsys, as well
as deconvolution of Fabs, FI and FH from Fsys were obtained in the form of AUC ratios for some
of the cases. This whole body PBPK modeling provided tremendous insight of the influence of
physiological determinants, enzymes and transporters on drug and metabolite exposure, as well
as on systemic bioavailability.
18
18
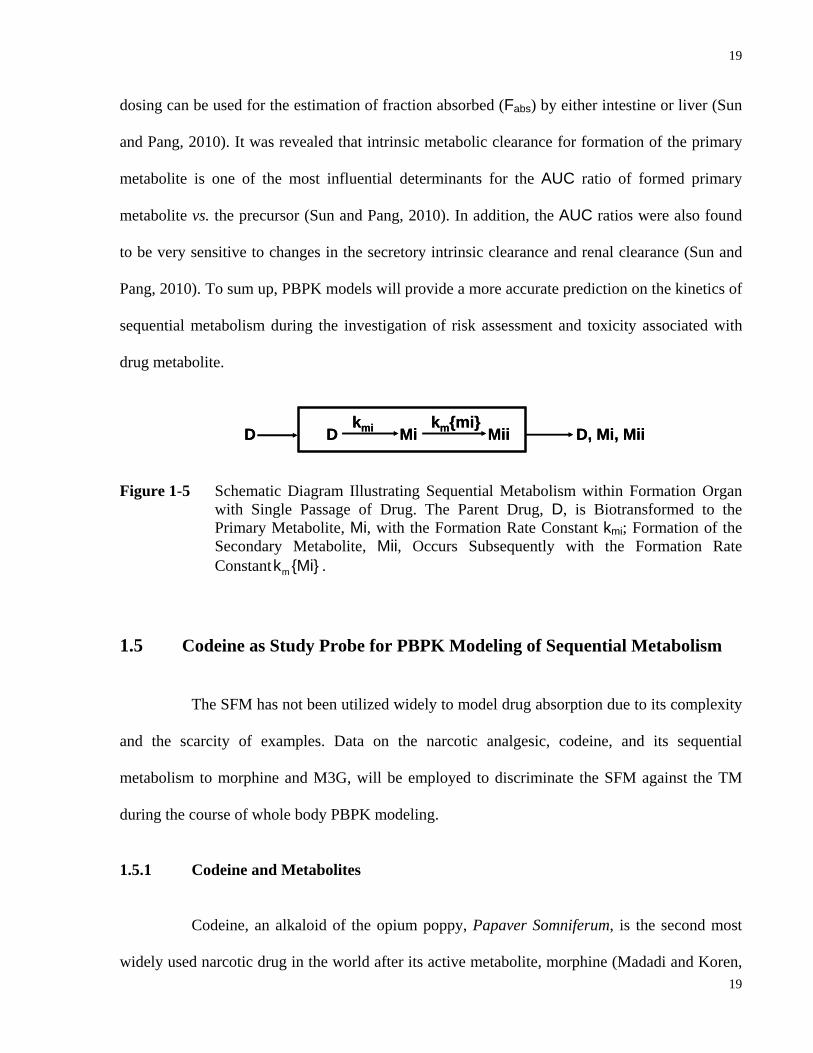
1.4.4 PBPK Models for Sequential Metabolism
As demonstrated in Fig. 1-5, PBPK model encompasses transporter/enzyme functions
in eliminating organ compartment(s) and is able to depict sequential metabolism of the parent
drug within organ of formation. If the pathway of sequential metabolism of the formed primary
metabolite (Mi) exists, the secondary metabolite Mii will be immediately formed (by the rate
constant for metabolite, mk {mi} ) from Mi within the organ of formation (Pang et al., 2008; Sun
and Pang, 2010). Known as the “sequential first-pass elimination of the formed metabolite”, this
immediate sequential removal of Mi during its time of formation within the organ will reduce the
availability of the formed metabolite (Pang and Gillette, 1979). Although administration of
preformed metabolite is often employed in metabolite-in-safety testing (MIST), it has been
demonstrated both theoretically and experimentally that the AUC and clearance of formed and
preformed Mi will differ when there is sequential handling of the formed Mi in other downstream
or parallel organs (Pang et al., 2008; Sun and Pang, 2009). This discrepancy is mainly due to the
difference of enzyme/transporter characteristics of the primary metabolite in each of the organs
involved in its formation or further metabolism (Xu and Pang, 1989; St-Pierre and Pang, 1993;
Chen and Pang, 1997; Pang et al., 2008; Sun and Pang, 2009; Sun and Pang, 2010). Specifically,
for the liver, the heterogeneity of enzymes, the distribution of transporters and the presence of
the membrane barrier would result in discrepancies in kinetic behaviors between formed and
preformed metabolites (Pang et al., 2008). For the intestine, segregated flows to the enterocyte
and serosal layers and route dependent metabolism accounted for the different fates of the
formed and preformed metabolites (Pang et al., 2008). For the kidney, glomerular filtration of the
preformed but not the formed metabolite is addressed (Pang et al., 2008). When intestine or liver
is the only eliminating organ, AUC ratio of formed metabolite after oral and intravenous drug
19
19
dosing can be used for the estimation of fraction absorbed (Fabs) by either intestine or liver (Sun
and Pang, 2010). It was revealed that intrinsic metabolic clearance for formation of the primary
metabolite is one of the most influential determinants for the AUC ratio of formed primary
metabolite vs. the precursor (Sun and Pang, 2010). In addition, the AUC ratios were also found
to be very sensitive to changes in the secretory intrinsic clearance and renal clearance (Sun and
Pang, 2010). To sum up, PBPK models will provide a more accurate prediction on the kinetics of
sequential metabolism during the investigation of risk assessment and toxicity associated with
drug metabolite.
Figure 1-5 Schematic Diagram Illustrating Sequential Metabolism within Formation Organ
with Single Passage of Drug. The Parent Drug, D, is Biotransformed to the Primary Metabolite, Mi, with the Formation Rate Constant kmi; Formation of the Secondary Metabolite, Mii, Occurs Subsequently with the Formation Rate Constant mk {Mi} .
1.5 Codeine as Study Probe for PBPK Modeling of Sequential Metabolism
The SFM has not been utilized widely to model drug absorption due to its complexity
and the scarcity of examples. Data on the narcotic analgesic, codeine, and its sequential
metabolism to morphine and M3G, will be employed to discriminate the SFM against the TM
during the course of whole body PBPK modeling.
1.5.1 Codeine and Metabolites
Codeine, an alkaloid of the opium poppy, Papaver Somniferum, is the second most
widely used narcotic drug in the world after its active metabolite, morphine (Madadi and Koren,
D D Mi Mii D, Mi, Miikmi km{mi}
D D Mi Mii D, Mi, Miikmi km{mi}
20
20
2008). Both codeine and morphine act on µ-opiate receptor to exert their analgesic effect on the
central nervous system (CNS) (Kirchheiner et al., 2007). The potency of morphine is much
greater than that of codeine both in man and rats due to its higher affinity towards the µ-opiate
receptor compared to codeine (Collins and Weeks, 1965; Gilman et al., 1990).
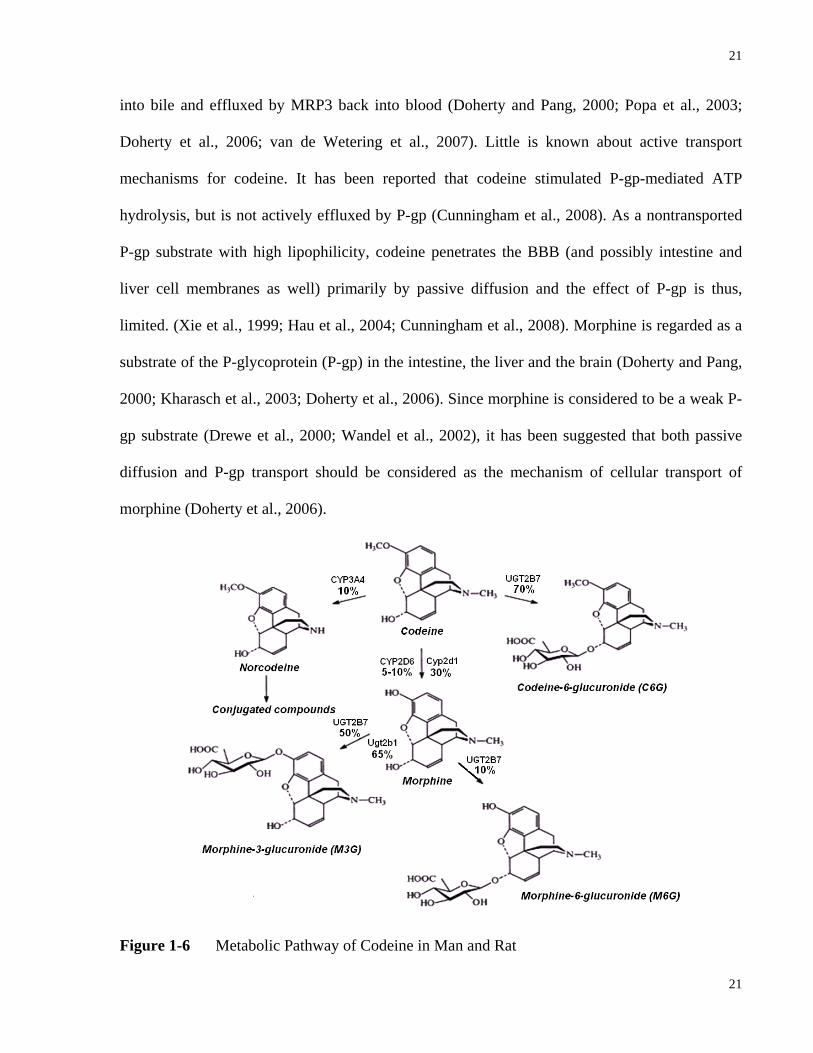
Both codeine and morphine are subject to extensive first-pass removal following oral
administration. The metabolism of codeine to morphine occurs primarily in the liver by rat
Cyp2d1 (CYP2D6 in human), with subsequent glucuronidation of morphine by rat Ugt2b1
(UGT2B7 in human) to morphine glucuronide in both liver and intestine (Caraco et al., 1999;
Doherty and Pang, 2000; Popa et al., 2003; Doherty et al., 2006; van de Wetering et al., 2007;
Mitschke et al., 2008). Codeine may also be metabolized by CYP3A4 to norcodeine or by
UGT2B7 to codeine-6-glucuronide (Gasche et al., 2004; Madadi and Koren, 2008). Other minor
metabolic pathways for morphine include formation of normorphine by CYP3A4 and morphine-
3-ethereal sulfate by SULT1A1 (Boerner et al., 1974; Boerner, 1975; Projean et al., 2003). As
illustrated in Fig 1-6, morphine 3-glucuronide (M3G) is the dominating glucuronide metabolite
in rat whereas both M3G and morphine 6-glucuronide (M6G) are formed in man. M3G has a low
affinity towards the µ-opiate receptor and is regarded as an inactive metabolite (Madadi and
Koren, 2008). On the contrary, M6G is pharmacologically active and exhibits comparable
potency to morphine (Madadi and Koren, 2008). However, due to the low concentration in
systemic circulation as well as high hydrophilicity which retards entry into the blood-brain
barrier (BBB), the effect of M6G on the CNS is negligible (Madadi and Koren, 2008).
Due to their high lipophilicity, both codeine and morphine will enter the cell into the
organ rapidly (Xie et al., 1999; Doherty and Pang, 2000; Kharasch et al., 2003). Morphine
glucuronide is too polar to enter cells, but once formed in the cell, is rapidly excreted by MRP2
21
21
into bile and effluxed by MRP3 back into blood (Doherty and Pang, 2000; Popa et al., 2003;
Doherty et al., 2006; van de Wetering et al., 2007). Little is known about active transport
mechanisms for codeine. It has been reported that codeine stimulated P-gp-mediated ATP
hydrolysis, but is not actively effluxed by P-gp (Cunningham et al., 2008). As a nontransported
P-gp substrate with high lipophilicity, codeine penetrates the BBB (and possibly intestine and
liver cell membranes as well) primarily by passive diffusion and the effect of P-gp is thus,
limited. (Xie et al., 1999; Hau et al., 2004; Cunningham et al., 2008). Morphine is regarded as a
substrate of the P-glycoprotein (P-gp) in the intestine, the liver and the brain (Doherty and Pang,
2000; Kharasch et al., 2003; Doherty et al., 2006). Since morphine is considered to be a weak P-
gp substrate (Drewe et al., 2000; Wandel et al., 2002), it has been suggested that both passive
diffusion and P-gp transport should be considered as the mechanism of cellular transport of
morphine (Doherty et al., 2006).
Figure 1-6 Metabolic Pathway of Codeine in Man and Rat
22
22
1.5.2 Codeine Sequential Metabolism for Validation of the SFM
Our laboratory has shown that morphine forms morphine glucuronide in the rat liver
and the rat intestine when morphine was given orally but only in the rat liver when given
systemically (Doherty and Pang, 2000; Doherty et al., 2006). Since CYP2D6/Cyp2d1 exist at
relatively low levels in the intestine compared to the liver (Madani et al., 1999; Mitschke et al.,
2008), formation of morphine is expected to occur mainly in the liver. Due to segregated blood
flow, the hepatically-derived morphine arising from codeine (given i.v. or p.o.) will be
sequentially metabolized to morphine glucuronide primarily in the liver even though
UGT2B7/Ugt2b1 exist in the intestine. Hence, after codeine i.v. or oral administration, the SFM
predicts that morphine glucuronide arises mainly from the liver and not the liver and intestine
whereas the TM predicts that morphine is metabolized in both the intestine and liver to form
higher amounts of M3G.
1.6 Statement of Research
This thesis proposed to establish PBPK models for sequential metabolism of codeine
to morphine and M3G in man and rat. Published data from man and rat as well as experimental
data in vivo in the rat were utilized for model discrimination between the SFM and the TM. The
goals are further explained in Chapter 2.
1.6.1 Goals to Achieve in the Studies
In spite of the established observations from various in vivo and in vitro studies (Cong
et al., 2000; 2001; Liu et al., 2006), the SFM has not been utilized widely to model drug
absorption due to the complexity and scarcity of examples. In this project, the sequential
23
23
metabolism of codeine to morphine was utilized as an example for validating the SFM. With the
aid of literature and experimental PK data from humans and rats, whole body PBPK models
embedded with either intestinal SFM or TM were constructed and examined to demonstrate the
superiority of the SFM over the TM.
1.6.1.1 Theoretical
Whole body PBPK models (with either intestinal TM or SFM) that were specific for
codeine sequential metabolism to morphine and then to M3G were constructed based on
physiological constants (blood flow rate, tissue/organ volumes etc.) obtained and averaged from
literature values. Mass balanced differential rate equations for the tailor-made whole body PBPK
model were developed. Literature data on studies of codeine/morphine PK in man and rat were
harvested. Based on the literature data, simulations were performed using the tailor-made PBPK
models with Scientist® simulator as well as using a commercially available virtual clinical study
simulator, Simcyp® for comparison purposes.
1.6.1.2 Experimental
In order to analyze biological samples from the planned codeine PK studies on rats,
protein precipitation method, solid phase extraction method and LC-MS/MS assay were first
developed and optimized. Reproducible calibration curves were obtained for quantitative
analysis. PK studies with codeine in the rat in vivo with both oral and i.v. administration were
performed to provide more in vivo data for simulation and model validation.
1.6.1.3 Combining Theoretical and Experimental
Literature and experimental data were employed to show the appropriateness of the
SFM over the TM, using tailored made PBPK modeling with Scientist® vs. Simcyp®.
24
24
1.6.2 Hypothesis to be Tested
Due to segregated blood flows to the enterocyte and serosal regions of the small
intestine, morphine glucuronidation upon codeine administration occurs primarily in the liver,
even though Ugt2b1/UGT2B7 is present in the intestine. Thus, the formation of M3G from
morphine following codeine administration p.o. or i.v. predicted by the SFM is less than that
predicted by the TM, especially for the i.v. case.
1.7 Significance
Drug metabolites may be inactive moieties which terminate drug action or are
contributors to therapeutic effect and/or mediators of drug toxicity. In the latter case, metabolite
administration may be required during the process of risk assessment. Although administration
of preformed metabolite is often employed in metabolite-in-safety testing (MIST) (Baillie et al.,
2002), it has been demonstrated both theoretically and experimentally that there are
discrepancies in the kinetic behaviours of formed and preformed metabolite when there is
sequential handling of the formed primary metabolite in other downstream or parallel organs (Xu
and Pang, 1989; St-Pierre and Pang, 1993; Chen and Pang, 1997; Pang et al., 2008; Sun and
Pang, 2009). This discrepancy is mainly due to the difference of enzyme/transporter
characteristics of the primary metabolite in each of the organs involved in its formation or further
metabolism (Xu and Pang, 1989; St-Pierre and Pang, 1993; Chen and Pang, 1997; Pang et al.,
2008; Sun and Pang, 2009; Sun and Pang, 2010)
Since the fates of formed and preformed metabolites in the body are often not
identical, inaccurate and unrealistic predictions of metabolite kinetics can be anticipated from
administration of the preformed metabolite in MIST. The demand for theoretical examination of
25
25
metabolite disposition using an advanced and tailor-made whole body PBPK model is urgent. To
date, little information is at hand to reveal the better model for investigating the disposition of
drug and its metabolite. The present study intends to show that the SFM is superior over the TM
in describing drug absorption. Moreover, the segmental segregated-flow model (SSFM) is an
improved model when heterogeneity in transporters and enzymes are to be considered (Tam et
al., 2003). Drug and metabolite kinetics need to be properly described with respect to the
organ(s) for metabolite formation and the organ(s) for sequential metabolism of the metabolite in
first-pass organs. This present finding will add significant information to the intestinal and liver
handling of drugs and metabolites, namely, the SFM should be considered in inter-organ
processing of drugs within the intestine and liver and for drug absorption. In addition, advanced
PBPK modeling and simulation of first–pass removal should include the SFM and not the TM
for intestinal modeling. The present study will further show the appropriateness of PBPK
simulations in predicting drug and drug metabolite(s) behaviours in drug discovery and
development.
26
26
2 STATEMENT OF PURPOSE OF INVESTIGATION
27
27
Our laboratory had shown that morphine forms morphine glucuronide in the perfused
rat liver and intestine preparations when morphine was given orally but not systemically
(Doherty and Pang, 2000; Doherty et al., 2006). Since CYP2D6/Cyp2d1 exists at relatively low
levels in the intestine compared to the liver (Madani et al., 1999; Mitschke et al., 2008), the
formation of morphine is expected to occur mainly in the liver. Although morphine
glucuronidation can still occur in the intestine, the hepatically-derived morphine (formed from
codeine given i.v. or p.o.) will be sequentially metabolized to morphine glucuronide primarily in
the liver even though UGT2B7/Ugt2b1 exist in the intestine due to the segregated flows to the
enterocyte, diverting morphine mainly to the serosal and not the enterocyte region. Hence, after
codeine i.v. or oral administration, the segregated-flow model (SFM) predicts that morphine
glucuronide arises mainly from the liver and not the liver and intestine as predicted by the
traditional, physiologically-based model (TM).
2.1 Hypothesis
Due to segregated flows to the enterocyte and serosal regions of the small intestine,
morphine glucuronidation occurs primarily in the liver, even though Ugt2b1/UGT2B7 is present
in the intestine. Thus, the following predictions are expected to be observed from the study:
(1) The sequential metabolism of codeine primarily occurs in the liver and not the
intestine due to the segregated blood flow pattern to the intestine.
(2) For p.o. codeine administration, the AUCM3G/AUCmorphine ratio will exceed that for
i.v. codeine administration, observations that are consistent with the SFM than the
TM
28
28
2.2 Thesis Outline
The major goals of this thesis include:
1) Develop a PBPK model encompassing absorption, metabolism and excretion to
describe the absorption and metabolism of codeine and disposition of its
metabolites in man and rat. (Chapters 3 and 4)
2) Examine the metabolism of codeine following i.v. / p.o. dosing to rats in vivo.
Upon obtaining the rat codeine PK data, we will demonstrate the superiority of the
SFM over the TM. (Chapter 3)
3) Employ literature and experimental data to show the appropriateness of the SFM
over the TM in describing codeine sequential metabolism, using tailor-made
PBPK modeling. (Chapters 3 and 4)
4) Compare the predictive power of tailor-made PBPK modeling with Scientist® vs.
Simcyp®. (Chapters 3 and 4)
29
29
3 PBPK MODELS FOR SEQUENTIAL
METABOLISM OF CODEINE TO MORPHINE AND M3G IN RAT: THEORETICAL AND
EXPERIMENTAL STUDY
30
30
3.1 Abstract
Whole-body PBPK models encompassing absorption, metabolism and secretion were developed
based on both the intestinal traditional model (TM) and segregated-flow model (SFM) to
describe the sequential metabolism of codeine to morphine and morphine 3β-glucuronide (M3G)
in the rat. Model compartments included the intestine, liver and kidney as well as highly
perfused, poorly perfused and adipose tissues. The tissue to blood partition coefficient was
calculated according to the methods of Rodgers and Rowland (2007). The model parameters for
the permeability, metabolism, transport and apical secretion were optimized against existing rat
codeine, morphine, and M3G data retrieved from the literature (both oral and i.v.) and data
obtained in house. PK studies with codeine (oral, 5 mg/kg and i.v., 3 mg/kg) in rats in vivo were
performed. Blood, bile and urine samples, processed by solid phase extraction, were analyzed by
high performance liquid chromatography-mass spectrometry. The derived in vivo parent drug
and metabolite data (both oral and i.v.) were used to discriminate between the TM and SFM.
Simulations were performed using Scientist® with TM or SFM and Simcyp®, a virtual clinical
simulator, to describe codeine sequential metabolism. The observed dose-corrected
AUCM3G/AUCmorphine ratio for the p.o. dose exceeded that for the i.v. dose, and agreed more to
those predicted for the SFM rather than for the TM. The total residual sum of squares for the
SFM prediction for codeine, morphine and M3G, were smaller than that for the TM for both the
oral and i.v. data. In conclusion, the AUCM3G/AUCmorphine ratios after both i.v. and p.o. codeine
administration are useful to distinguish between the TM and SFM; the SFM was found to be
superior over the TM in predicting codeine sequential metabolism in the rat. It was also
concluded that our tailor-made PBPK models with Scientist® were superior to those from
31
31
Simcyp® for the description of codeine sequential metabolism due to inherent limitations of
Simcyp®.
3.2 Introduction
The absorption of orally administered drugs involves the passage of the drug
molecule through intestinal luminal membrane into the gastric and intestinal mucosa and
subsequently into the systemic circulation (Rowland, 1972; Pang, 2003). Due to its large surface
area as a result of the villi and microvilli, the intestine is more important than the stomach for the
oral absorption of drugs. The intestine possesses a wide range of intestinal efflux transporters
such as the P-glycoprotein (P-gp), the multidrug resistance associated protein 2 (MRP2), and the
breast cancer resistance protein (BCRP) and absorptive transporters including the oligopeptide
transporter 1 (PEPT1) and organic anion transporting polypeptide (OATP2B1), as well as
enzymes such as cytochrome P450 3A (CYP3A), sulfotransferases (SULT) and UDP-
glucuronosyltransferases (UGT) (Dubey and Singh, 1988; Tsuji and Tamai, 1996; Lin et al.,
1999; Pang, 2003). Hence, the systemic bioavailability, or fraction of the oral dose that reaches
systemic circulation intact, is greatly affected by intestinal transporters and enzymes (Kwan,
1997).
Early modeling efforts on drug absorption comprise of compartmental models and the
physiologically-based pharmacokinetic (PBPK) model developed by Doherty and Pang (2000).
Since intestinal metabolism was noted to be “route-dependent”, namely, a greater extent of
metabolism occurs following oral administration than intravenous dosing (Pang et al., 1985;
Pang et al., 1986; Doherty and Pang, 2000), a PBPK model that includes segregated blood flows
to the enterocyte and serosal regions (segregated-flow model, SFM) (Fig. 1-4A) was established
to explain the notable glucuronidation of morphine when given orally but the lack of it with
32
32
systemic dosing in the perfused rat intestine preparation (Cong et al., 2000). In the SFM, it was
assumed that a large proportion (90%) of the blood flow reaches the non-absorptive serosal
region while a much lower proportion (10%) perfuses the absorptive, metabolic and secretory
enterocyte layer where all the enzymes and active transporters reside (Cong et al., 2000). In
comparison, the traditional PBPK model (TM) (Fig. 1-4B) which regards the intestine as a
single, homogeneous compartment that is subdivided into the vascular, cellular and luminal
subcompartments, was found to be less adequate to explain the morphine data. Because of the
much lower blood flow entering the enterocyte region, less metabolism would result for drugs
given systemically than orally whereas for oral absorption, the drugs would need to traverse the
enterocyte region and be metabolized to much greater extents. Many other examples of route-
dependent intestinal metabolism have been noted (for review, see Pang, 2003). For this reason,
the virtual clinical simulator, Simcyp® utilizes a much reduced flow rate to the enterocyte (30-
40%) to describe intestinal drug clearance (Yang et al., 2007). Simcyp® is a population-based
simulator for mechanistic modeling and simulation of drug ADME in healthy and disease
subjects (categorized by race, age and disease), and for predicting metabolically-based drug-drug
interactions (Jamei et al., 2009). One unique feature of Simcyp® is that it can generate PK
profiles across populations, enabling the prediction of the outcomes from individuals at the
extremes of risk (Jamei et al., 2009). The program incorporates experimental data obtained from
preclinical studies based on in vitro enzyme and cellular systems as well as physiochemical
properties of drug molecules and dosage forms as the building blocks of the simulation platform.
The models have been implemented in a Windows-based application. At present, Simcyp®
allows the user to combine a variety of models including the first-order absorption model, the
compartmental absorption and transit (CAT) model or the advanced dissolution, absorption and
metabolism (ADAM) model for drug absorption; together with minimal PBPK (simulation based
33
33
on volume of distribution at steady state) or whole PBPK (simulation based on individual
organ/tissue to plasma partition coefficient) models for drug distribution. For elimination,
information on in vivo clearance, whole organ clearance or in vitro enzyme kinetics can be
included for simulation. Substrate interactions with enzymes and transporters are also considered
in the simulation platform.
The SFM has not been utilized widely to model drug absorption due to its complexity
and limited examples available. Data on the narcotic analgesic, codeine, and its sequential
metabolism to morphine and M3G, will be employed to discriminate the SFM against the TM.
Codeine is a prodrug that forms morphine which acts on the µ-opiate receptor to exert its
analgesic effect (Kirchheiner et al., 2007). The metabolism of codeine to morphine occurs
mainly in the liver by Cyp2d1 in the rat, and subsequent glucuronidation of morphine by rat
Ugt2b1 to morphine glucuronide takes place in both the liver and intestine (Hiroi et al., 1998;
Doherty and Pang, 2000; Popa et al., 2003; Doherty et al., 2006; Mitschke et al., 2008) (Fig. 1-
6). Both codeine and morphine are lipophilic and will enter the organs rapidly (Xie et al., 1999;
Doherty and Pang, 2000; Kharasch et al., 2003). Morphine glucuronide is too polar to enter cells,
but is rapidly excreted by MRP2 and effluxed by MRP3 when formed in the liver (Doherty and
Pang, 2000; Doherty et al., 2006; van de Wetering et al., 2007). As a nontransported P-gp
substrate with high lipophilicity, codeine penetrates the blood brain barrier or BBB (and possibly
intestinal and liver cell membranes) primarily by passive diffusion and the effect of P-gp is thus,
limited. (Xie et al., 1999; Hau et al., 2004; Cunningham et al., 2008). Morphine is regarded as a
substrate of the P-glycoprotein (P-gp) in the intestine, across the BBB and possibly in the liver
(Doherty et al., 2006).
34
34
Our laboratory had shown that morphine forms morphine glucuronide in the perfused
rat liver preparation (Doherty et al., 2006), and from the perfused rat intestine preparation when
morphine was given orally but not systemically (Doherty and Pang, 2000). Since Cyp2d1 exists
at relatively low level in the intestine compared to the liver (Hiroi et al., 1998; Mitschke et al.,
2008), the formation of morphine is expected to occur primarily in the liver. The SFM further
predicts that hepatically formed morphine (from codeine given i.v. or p.o.) reaching the
enterocyte systemically will be lower than that predicted from the TM since less morphine is
glucuronidated in enterocytes, where Ugt2b1 exists, due to segregated flows. Thus, the formation
of M3G from morphine following codeine administration p.o. or i.v. predicted by the SFM is less
than that predicted by the TM, especially for the i.v. case.
3.3 Materials and Methods
3.3.1 Literature Data Collecting and Processing
The strategy for developing a specific PBPK model for codeine/morphine metabolism
was to first obtain pertinent PBPK parameters from the literature. This required calculation based
on literature data for each of the studies. Literature data were collected from a number of rat
pharmacokinetic studies on codeine and morphine metabolism via i.v. and oral routes with
graphical plasma profiles. The program, PDF Measure It® from Traction Software Inc. that
correlates the height of each time point to the actual plasma concentration, was used. After
correction for the molecular weight differences among codeine, morphine and M3G, the plasma
concentration data were all converted to blood concentrations [blood/plasma concentration ratio
x plasma concentration for codeine and morphine, and (1-hematocrit) x plasma concentration for
35
35
M3G] to the unit of nM. Lastly, these re-expressed blood data were normalized per unit dose
(nM/nmol of dose) for the expression of all data sets from different studies wherein difference
doses given. Data processing was then based on the assumption that the kinetics of codeine and
its metabolites, morphine and M3G, were linear with respect to the route and dose.
3.3.2 Codeine PK Study in Rat In Vivo
3.3.2.1 Chemicals
Codeine phosphate, morphine base and M3G were provided by the National Institutes
on Drug Abuse (NIDA, Rockville, MD, USA); caffeine (internal standard) was purchased from
Sigma-Aldrich Co. (St. Louis, MO, USA). HPLC grade acetonitrile, methanol and formic acid
were obtained from Fisher Scientific Canada (Ottawa, Ontario, Canada).
3.3.2.2 Animal Studies
Male Sprague-Dawley rats, weighing 300 ± 20 g, were used throughout the study.
Special care was taken to maintain constant environmental conditions (temperature, diet, diurnal
rhythm). The animals were fasted with 5% w/v glucose water ad libitum overnight before the
study. Canulation of bile duct and the carotid artery of the animal with PE50 tubing under
pentobarbital anesthesia were performed before dosing. For i.v. administration, codeine
phosphate in saline solution (0.2 – 0.3 ml) was administered intravenously at a dose of 3 mg/kg,
into the right jugular vein. This was followed by flushing the tubing with saline. For
intraduodenal (oral) administration, codeine phosphate in saline solution (0.3 – 0.4 ml) was
administered into the proximal duodenal lumen at a dose of 5 mg/kg. The i.v. dose chosen were
reported to exhibit linear kinetics in studies by Shah and Mason (1991). The oral dose used was
the same as those from the studies by Shah and Mason (1990) and Gintzler et al. (1976). Blood
36
36
(0. 1 ml) was collected via the carotid artery cannulae at 0, 1, 5, 10, 15, 30, 45, 60, 90, 120, 180,
and 240 min after dosing. Bile was collected via the bile duct cannula at 0, 5, 10, 15, 20, 30, 40,
45, 50, 60, 70, 90, 110, 130, 180 and 240 min after dosing. At the end of the study (240 min), the
urine was collected from the bladder. All samples were kept frozen at -20ºC until analyzed using
established assay method.
3.3.2.3 Assay Procedure
Protein Precipitation and Solid Phase Extraction (SPE). An aliquot of the internal
standard (caffeine) solution (10 μl of 3 μg/ml) was added to 100 μl of blood followed by protein
precipitation with 400 μl of an equal mixture of methanol and acetonitrile. After vortex-mixing
for 60 s and centrifuging at 13,000×g for 10 min, the supernatant was then transferred into Sep-
Pak Vac C18 3 cc cartridges (200 mg; Waters, Milford, MA, USA). For bile samples, 10 μl (for
M3G quantification) and 40 μl (for codeine/morphine quantification) were spiked with the
internal standard (IS) solution (5 μl and 10 μl, respectively ) and diluted with saline to a volume
of 100 μl, then mixed with 400 μl of methanol and acetonitrile (1:1 v/v) for SPE loading. Also,
10 μl of the urine sample was spiked with 10 μl of the IS solution and diluted with saline to a
volume of 100 μl, then mixed with 400 μl of methanol and acetonitrile (1:1 v/v) for SPE loading.
Each cartridge was pre-conditioned with 2×1 ml of acetonitrile followed by 2×1 ml Millipore
water. After loading of the sample, the cartridge was added 0.5 ml of 5% acetonitrile in water.
Then, codeine, morphine, M3G and IS in the sample were eluted with 2×1 ml of acetonitrile. The
eluent was pooled and dried under a stream of nitrogen at room temperature. The residue was
reconstituted with 200 μl of the mobile phase (70% of water with 0.1%v/v formic acid and 30%
acetonitrile with 0.1%v/v formic acid), and 5 μl of the reconstituted sample was injected into the
LC–MS/MS system for analysis.
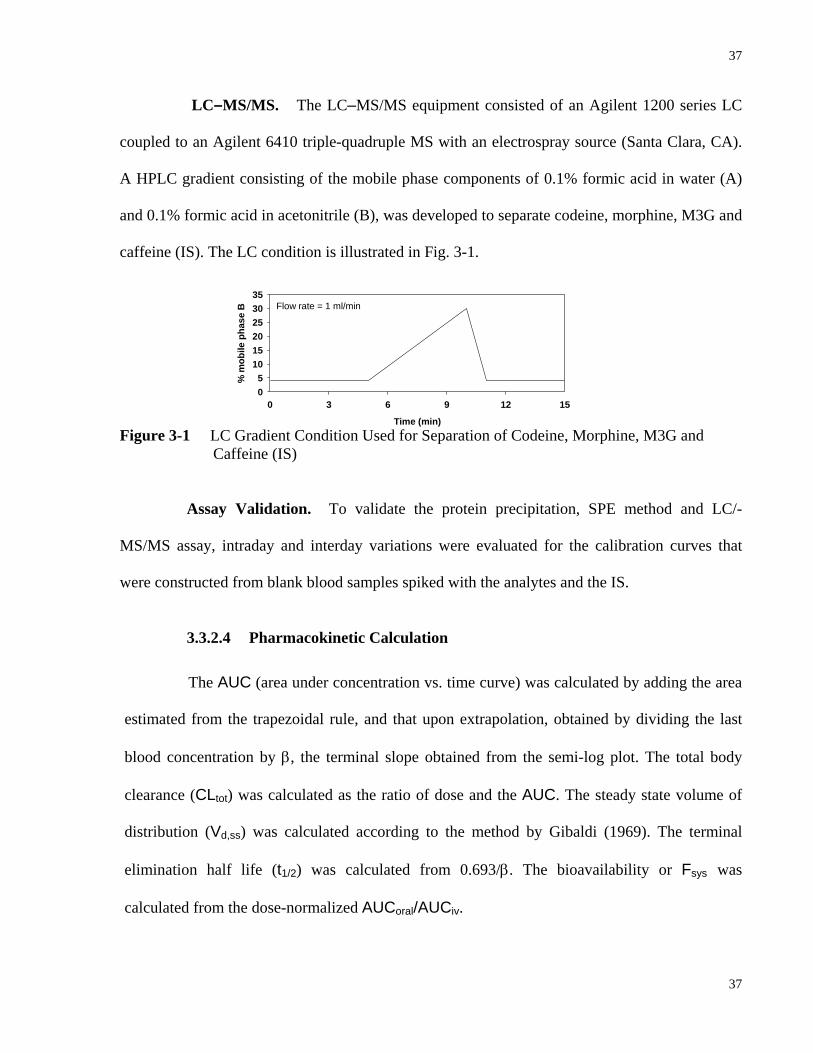
37
37
Flow rate = 1 ml/min
Time (min)
0 3 6 9 12 15
% m
obile
pha
se B
05
101520253035
LC–MS/MS. The LC–MS/MS equipment consisted of an Agilent 1200 series LC
coupled to an Agilent 6410 triple-quadruple MS with an electrospray source (Santa Clara, CA).
A HPLC gradient consisting of the mobile phase components of 0.1% formic acid in water (A)
and 0.1% formic acid in acetonitrile (B), was developed to separate codeine, morphine, M3G and
caffeine (IS). The LC condition is illustrated in Fig. 3-1.
Figure 3-1 LC Gradient Condition Used for Separation of Codeine, Morphine, M3G and Caffeine (IS)
Assay Validation. To validate the protein precipitation, SPE method and LC/-
MS/MS assay, intraday and interday variations were evaluated for the calibration curves that
were constructed from blank blood samples spiked with the analytes and the IS.
3.3.2.4 Pharmacokinetic Calculation
The AUC (area under concentration vs. time curve) was calculated by adding the area
estimated from the trapezoidal rule, and that upon extrapolation, obtained by dividing the last
blood concentration by β, the terminal slope obtained from the semi-log plot. The total body
clearance (CLtot) was calculated as the ratio of dose and the AUC. The steady state volume of
distribution (Vd,ss) was calculated according to the method by Gibaldi (1969). The terminal
elimination half life (t1/2) was calculated from 0.693/β. The bioavailability or Fsys was
calculated from the dose-normalized AUCoral/AUCiv.
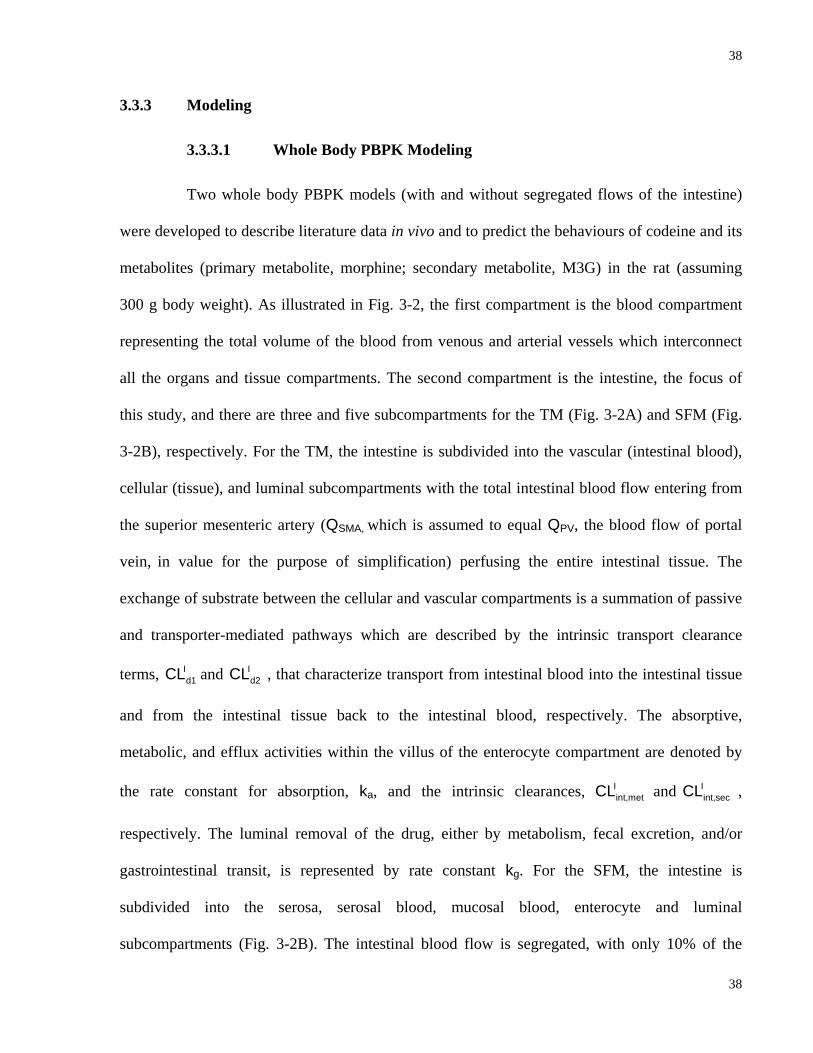
38
38
3.3.3 Modeling
3.3.3.1 Whole Body PBPK Modeling
Two whole body PBPK models (with and without segregated flows of the intestine)
were developed to describe literature data in vivo and to predict the behaviours of codeine and its
metabolites (primary metabolite, morphine; secondary metabolite, M3G) in the rat (assuming
300 g body weight). As illustrated in Fig. 3-2, the first compartment is the blood compartment
representing the total volume of the blood from venous and arterial vessels which interconnect
all the organs and tissue compartments. The second compartment is the intestine, the focus of
this study, and there are three and five subcompartments for the TM (Fig. 3-2A) and SFM (Fig.
3-2B), respectively. For the TM, the intestine is subdivided into the vascular (intestinal blood),
cellular (tissue), and luminal subcompartments with the total intestinal blood flow entering from
the superior mesenteric artery (QSMA, which is assumed to equal QPV, the blood flow of portal
vein, in value for the purpose of simplification) perfusing the entire intestinal tissue. The
exchange of substrate between the cellular and vascular compartments is a summation of passive
and transporter-mediated pathways which are described by the intrinsic transport clearance
terms, Id1CL and I
d2CL , that characterize transport from intestinal blood into the intestinal tissue
and from the intestinal tissue back to the intestinal blood, respectively. The absorptive,
metabolic, and efflux activities within the villus of the enterocyte compartment are denoted by
the rate constant for absorption, ka, and the intrinsic clearances, Iint,metCL and I
int,secCL ,
respectively. The luminal removal of the drug, either by metabolism, fecal excretion, and/or
gastrointestinal transit, is represented by rate constant kg. For the SFM, the intestine is
subdivided into the serosa, serosal blood, mucosal blood, enterocyte and luminal
subcompartments (Fig. 3-2B). The intestinal blood flow is segregated, with only 10% of the
39
39
QSMA (named as QENB) perfusing the enterocyte region that is rich in enzymes and transporters.
The remaining 90% of QSMA (QSB) flows through the nonmetabolizing or inert serosa layer of
the intestine. Drug in the serosal blood compartment equilibrates with serosal with the transfer
clearances, Id3CL and I
d4CL , whereas drug in the mucosal blood compartment equilibrates with
tissue by the transfer clearances, Id1CL and I
d2CL (see Fig.3-2B) (Cong et al., 2000; Pang, 2003).
The liver is the third compartment and is the primary organ for codeine metabolism.
The exchange of substrate between the liver tissue and liver blood is described by the intrinsic
transport clearance terms, Hd1CL and H
d2CL , respectively (Fig.3-2). The metabolic and biliary
secretion activities within the liver tissue compartment are denoted by the intrinsic clearances,
Hint,metCL and H
int,secCL , respectively.
There are two lumped compartments constructed according to the flow rate and
partition coefficient of each organ/tissue: the first one represents highly perfused tissue/organs
including the brain and the heart and the second one is the “poorly perfused tissue” consisting of
the skin, the bone, and the muscle. In addition, an adipose tissue compartment is also present.
The adipose tissue is considered as an individual compartment that is closely aligned to but
different from other poorly perfused tissue due to the significant difference of its tissue to blood
partition coefficient from those of other poorly perfused tissues (Table 3-9). Mass balance
relations (differential rate equations) are developed to describe events occurring during the
traverse of drug/metabolites across each compartment (see Appendix).
3.3.3.2 Parameter Estimation
Constant physiological parameters (V, Q and fB). The values of rat tissue/organ
volumes and blood flows as well as fraction of drug unbound in blood (fB) were based on various
40
40
literature sources (please refer to Table 3-7). For lumped compartments, the volumes and the
blood flow were given as the summation of individual tissue/organ.
Absorption rate constant (ka). The absorption rate constant ka (min-1) for both
codeine and morphine were approximated by curve stripping or the Loo-Riegelman loop (Loo
and Riegelman, 1968) using the blood concentration-time curve for codeine/morphine
intravenous administration from the literature.
Figure 3-2A Schematic Representation of the Whole Body PBPK TM Used to Describe the
Disposition Kinetics of Codeine and Its Metabolites, Morphine and M3G, in Blood and Tissues with the Intestine and the Liver as Metabolite Formation Organs
BloodMSYSMGSYS CSYS
CLR
Intestine bloodMIBMGIB CIB
CLId1{MG}
QHAQPV = QI
Qbile
Liver bloodMLBMGLB
MIMGI CI
MLUMMGLUM CLUM
kg{MG}
MLMGL CL
MBILEMGBILE CBILE
Oral Dosekg{M} kglumen
tissue
IV Dose
CLId2{MG}
CLId1{M}
CLId2{M} CLI
d2
CLIint,met {M}
CLId1
CLIint,met1 CLI
int,met2
CLIint,sec{MG} CLI
int,sec{M} CLIint,sec
ka{MG} ka{M} ka
CLHd1{MG}
CLHd2{MG}
tissue
bile
CLHd1{M}
CLHd2{M}
CLHd1
CLHd2
CLHint,met {M} CLH
int,met1 CLHint,met2
CLB
CLHint,sec {M}CLH
int,sec {MG} CLHint,sec
Highly perfused tissue
Poorly perfused tissue-adipose
QHP
QPPF
MGHP MHP
MGPPF MPPF
CHP
CPPF
CLR{MG} CLR{M}
MKMGK
Kidney
QKCK
Poorly perfused tissue-otherMGPP MPP CPP
QPP
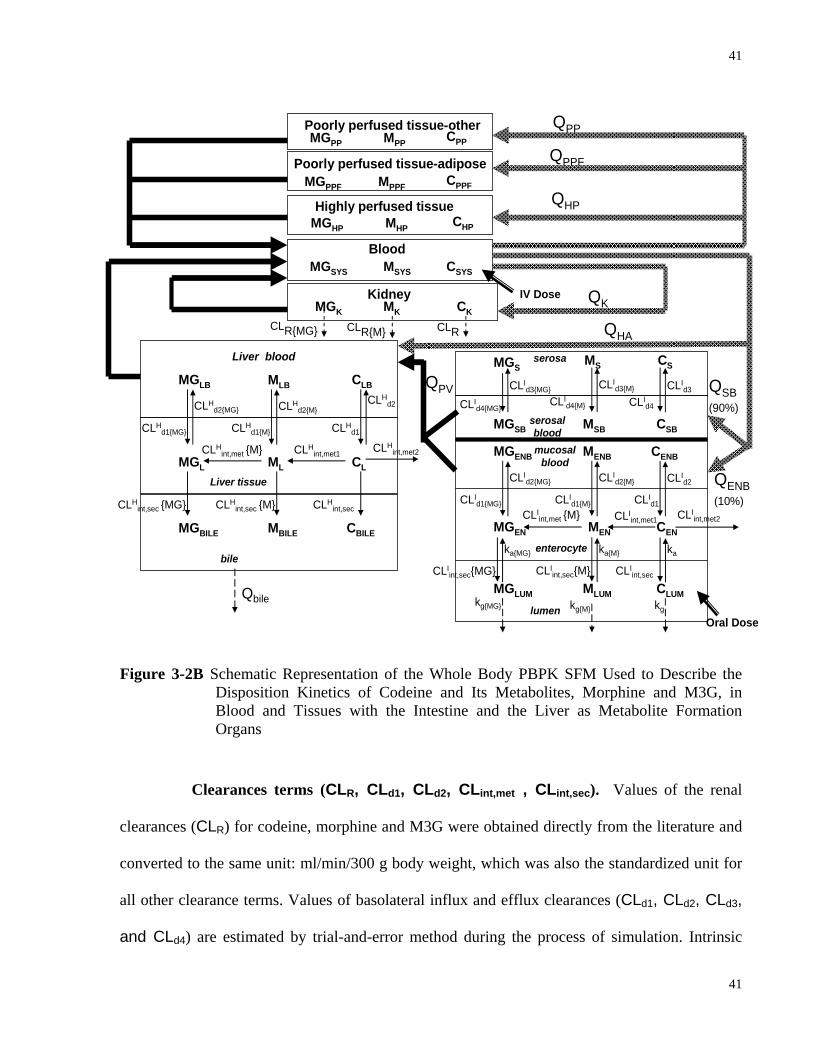
41
41
Figure 3-2B Schematic Representation of the Whole Body PBPK SFM Used to Describe the
Disposition Kinetics of Codeine and Its Metabolites, Morphine and M3G, in Blood and Tissues with the Intestine and the Liver as Metabolite Formation Organs
Clearances terms (CLR, CLd1, CLd2, CLint,met , CLint,sec). Values of the renal
clearances (CLR) for codeine, morphine and M3G were obtained directly from the literature and
converted to the same unit: ml/min/300 g body weight, which was also the standardized unit for
all other clearance terms. Values of basolateral influx and efflux clearances (CLd1, CLd2, CLd3,
and CLd4) are estimated by trial-and-error method during the process of simulation. Intrinsic
QHA
Qbile
Liver blood
MLBMGLB
MLMGL CL
MBILEMGBILE CBILE
IV Dose
CLHd1{MG}
CLHd2{MG}
Liver tissue
bile
CLHd1{M}
CLHd2{M}
CLHd1
CLHd2
CLHint,met {M} CLH
int,met1 CLHint,met2
CLB
CLHint,sec {M}CLH
int,sec {MG} CLHint,sec
serosa
MENBMGENB CENB
CLId1{MG}
MENMGEN CEN
MGLUM MLUM CLUMkg{MG}
Oral Dosekg{M} kglumen
enterocyte
CLId2{MG}
CLId1{M}
CLId2{M} CLI
d2
CLId1
CLIint,met {M} CLI
int,met1 CLIint,met2
CLIint,sec{MG} CLI
int,sec{M} CLIint,sec
ka{MG} ka{M} ka
mucosal blood
serosal blood
MSBMGSB CSB
MSMGS CS
CLId4{MG}
CLId3{MG}
CLId4{M}
CLId3{M} CLI
d3
CLId4
QSB(90%)
QENB (10%)
QPV
Highly perfused tissue
Poorly perfused tissue-other
QHP
QPP
MGHP MHP CHP
MGPP MPP CPP
CLRCLR{MG} CLR{M}
MKMGK
Kidney QKCK
Blood
Poorly perfused tissue-adipose QPPF
MGPPF MPPF CPPF
MSYSMGSYS CSYS
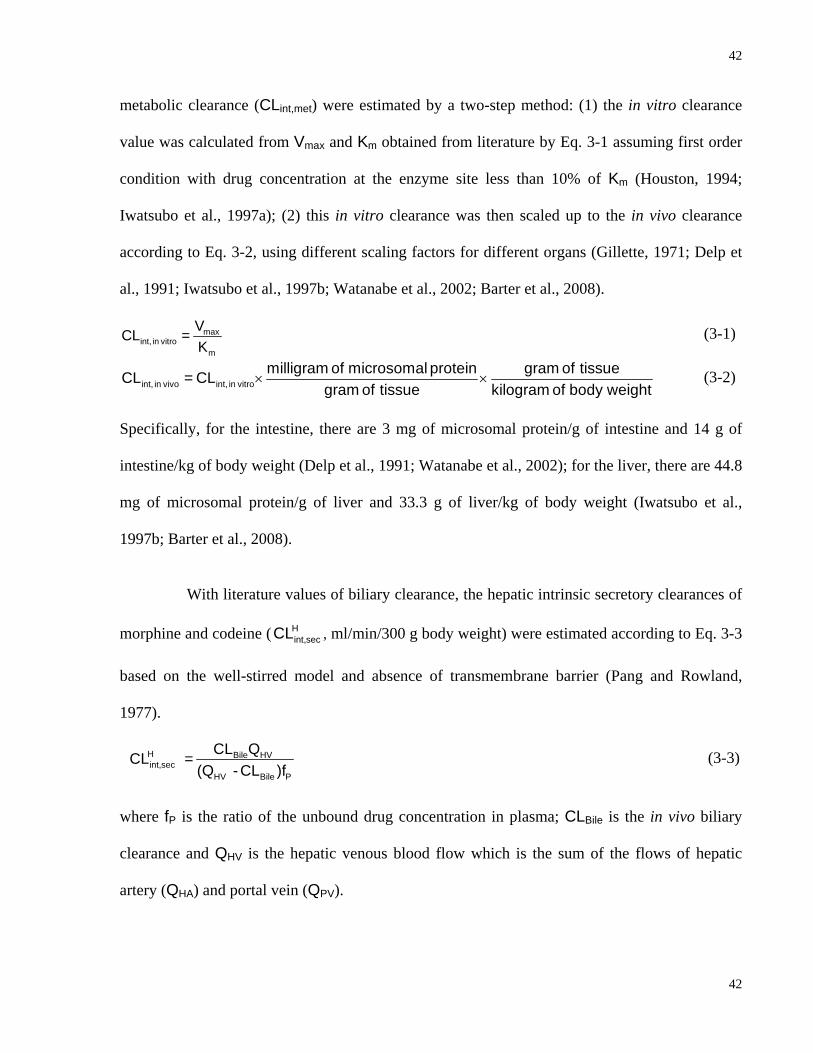
42
42
metabolic clearance (CLint,met) were estimated by a two-step method: (1) the in vitro clearance
value was calculated from Vmax and Km obtained from literature by Eq. 3-1 assuming first order
condition with drug concentration at the enzyme site less than 10% of Km (Houston, 1994;
Iwatsubo et al., 1997a); (2) this in vitro clearance was then scaled up to the in vivo clearance
according to Eq. 3-2, using different scaling factors for different organs (Gillette, 1971; Delp et
al., 1991; Iwatsubo et al., 1997b; Watanabe et al., 2002; Barter et al., 2008).
maxint, in vitro
m
VCL =K
(3-1)
int, in vivo int, in vitromilligram of microsomal protein gram of tissueCL = CL
gram of tissue kilogram of body weight× × (3-2)
Specifically, for the intestine, there are 3 mg of microsomal protein/g of intestine and 14 g of
intestine/kg of body weight (Delp et al., 1991; Watanabe et al., 2002); for the liver, there are 44.8
mg of microsomal protein/g of liver and 33.3 g of liver/kg of body weight (Iwatsubo et al.,
1997b; Barter et al., 2008).
With literature values of biliary clearance, the hepatic intrinsic secretory clearances of
morphine and codeine ( Hint,secCL , ml/min/300 g body weight) were estimated according to Eq. 3-3
based on the well-stirred model and absence of transmembrane barrier (Pang and Rowland,
1977).
H Bile HV int,sec
HV Bile P
CL QCL = (Q - CL )f
(3-3)
where fP is the ratio of the unbound drug concentration in plasma; CLBile is the in vivo biliary
clearance and QHV is the hepatic venous blood flow which is the sum of the flows of hepatic
artery (QHA) and portal vein (QPV).
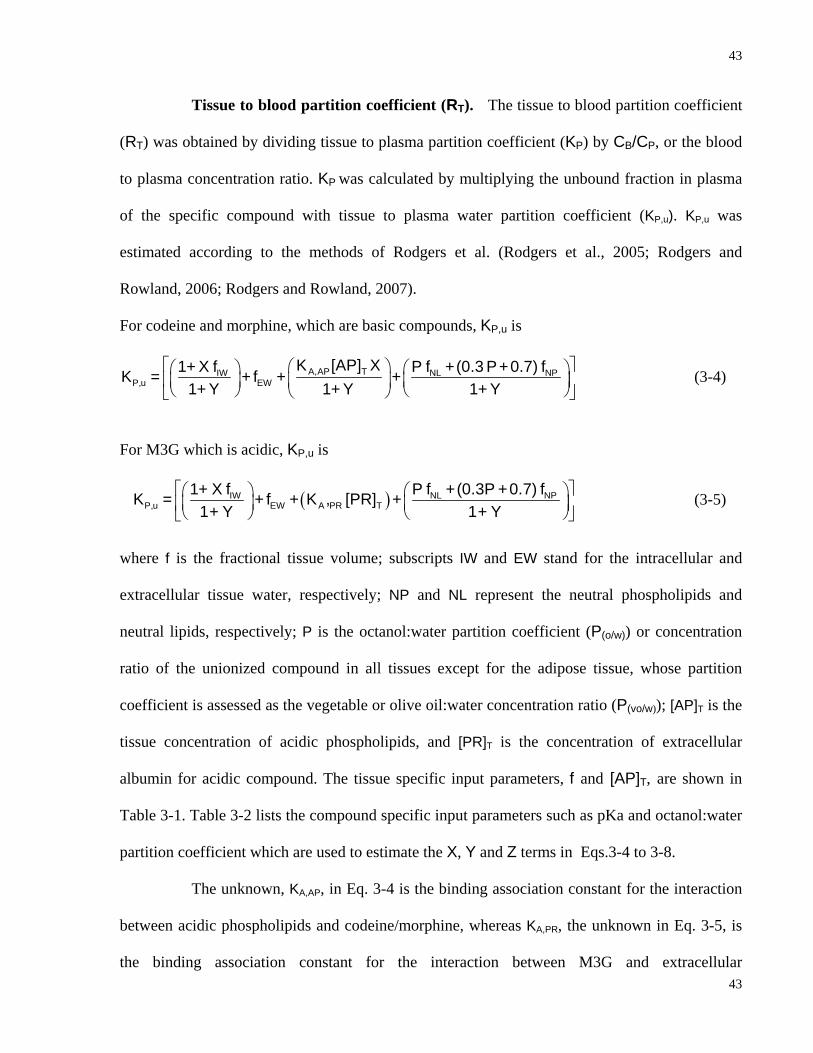
43
43
Tissue to blood partition coefficient (RT). The tissue to blood partition coefficient
(RT) was obtained by dividing tissue to plasma partition coefficient (KP) by CB/CP, or the blood
to plasma concentration ratio. KP was calculated by multiplying the unbound fraction in plasma
of the specific compound with tissue to plasma water partition coefficient (KP,u). KP,u was
estimated according to the methods of Rodgers et al. (Rodgers et al., 2005; Rodgers and
Rowland, 2006; Rodgers and Rowland, 2007).
For codeine and morphine, which are basic compounds, KP,u is
⎡ ⎤⎛ ⎞⎛ ⎞ ⎛ ⎞⎢ ⎥⎜ ⎟ ⎜ ⎟⎜ ⎟⎝ ⎠ ⎝ ⎠⎝ ⎠⎣ ⎦
A,AP TIW NL NPP,u EW
K [AP] X1+ X f P f +(0.3 P+0.7) fK = + f + +1+ Y 1+ Y 1+ Y
(3-4)
For M3G which is acidic, KP,u is
( )⎡ ⎤⎛ ⎞ ⎛ ⎞⎜ ⎟ ⎜ ⎟⎢ ⎥⎝ ⎠ ⎝ ⎠⎣ ⎦
IW NL NPP,u EW A PR T
1+ X f P f +(0.3P +0.7) fK = + f + K , [PR] +1 + Y 1 + Y
(3-5)
where f is the fractional tissue volume; subscripts IW and EW stand for the intracellular and
extracellular tissue water, respectively; NP and NL represent the neutral phospholipids and
neutral lipids, respectively; P is the octanol:water partition coefficient (P(o/w)) or concentration
ratio of the unionized compound in all tissues except for the adipose tissue, whose partition
coefficient is assessed as the vegetable or olive oil:water concentration ratio (P(vo/w)); [AP]T is the
tissue concentration of acidic phospholipids, and [PR]T is the concentration of extracellular
albumin for acidic compound. The tissue specific input parameters, f and [AP]T, are shown in
Table 3-1. Table 3-2 lists the compound specific input parameters such as pKa and octanol:water
partition coefficient which are used to estimate the X, Y and Z terms in Eqs.3-4 to 3-8.
The unknown, KA,AP, in Eq. 3-4 is the binding association constant for the interaction
between acidic phospholipids and codeine/morphine, whereas KA,PR, the unknown in Eq. 3-5, is
the binding association constant for the interaction between M3G and extracellular
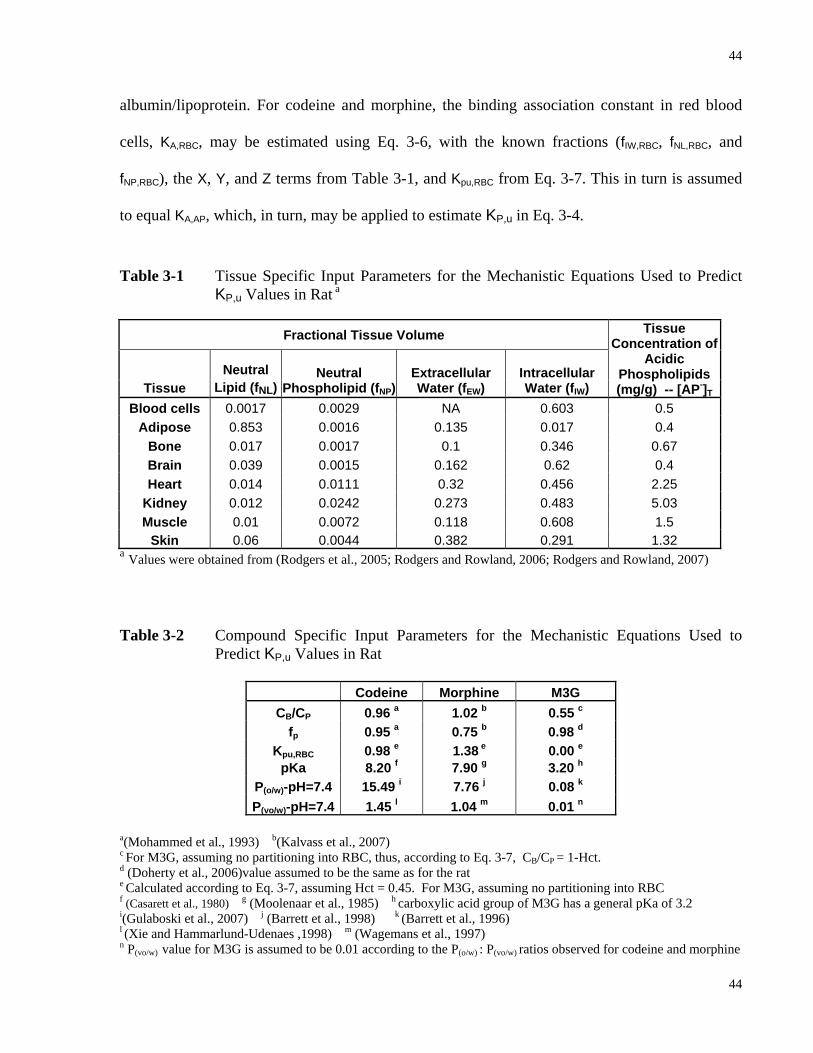
44
44
albumin/lipoprotein. For codeine and morphine, the binding association constant in red blood
cells, KA,RBC, may be estimated using Eq. 3-6, with the known fractions (fIW,RBC, fNL,RBC, and
fNP,RBC), the X, Y, and Z terms from Table 3-1, and Kpu,RBC from Eq. 3-7. This in turn is assumed
to equal KA,AP, which, in turn, may be applied to estimate KP,u in Eq. 3-4.
Table 3-1 Tissue Specific Input Parameters for the Mechanistic Equations Used to Predict KP,u Values in Rat a
Fractional Tissue Volume
Tissue Neutral
Lipid (fNL) Neutral
Phospholipid (fNP)Extracellular Water (fEW)
Intracellular Water (fIW)
Tissue Concentration of
Acidic Phospholipids (mg/g) -- [AP-]T
Blood cells 0.0017 0.0029 NA 0.603 0.5 Adipose 0.853 0.0016 0.135 0.017 0.4
Bone 0.017 0.0017 0.1 0.346 0.67 Brain 0.039 0.0015 0.162 0.62 0.4 Heart 0.014 0.0111 0.32 0.456 2.25
Kidney 0.012 0.0242 0.273 0.483 5.03 Muscle 0.01 0.0072 0.118 0.608 1.5
Skin 0.06 0.0044 0.382 0.291 1.32 a Values were obtained from (Rodgers et al., 2005; Rodgers and Rowland, 2006; Rodgers and Rowland, 2007)
Table 3-2 Compound Specific Input Parameters for the Mechanistic Equations Used to Predict KP,u Values in Rat
Codeine Morphine M3G
CB/CP 0.96 a 1.02 b 0.55 c fp 0.95 a 0.75 b 0.98 d
Kpu,RBC 0.98 e 1.38 e 0.00 e pKa 8.20 f 7.90 g 3.20 h
P(o/w)-pH=7.4 15.49 i 7.76 j 0.08 k P(vo/w)-pH=7.4 1.45 l 1.04 m 0.01 n
a(Mohammed et al., 1993) b(Kalvass et al., 2007) c For M3G, assuming no partitioning into RBC, thus, according to Eq. 3-7, CB/CP = 1-Hct. d (Doherty et al., 2006)value assumed to be the same as for the rat e Calculated according to Eq. 3-7, assuming Hct = 0.45. For M3G, assuming no partitioning into RBC f (Casarett et al., 1980) g (Moolenaar et al., 1985) h carboxylic acid group of M3G has a general pKa of 3.2
i(Gulaboski et al., 2007) j (Barrett et al., 1998) k (Barrett et al., 1996) l (Xie and Hammarlund-Udenaes ,1998) m (Wagemans et al., 1997) n P(vo/w) value for M3G is assumed to be 0.01 according to the P(o/w) : P(vo/w) ratios observed for codeine and morphine
45
45
⎡ ⎤ ⎛ ⎞⎛ ⎞⎛ ⎞⎜ ⎟⎢ ⎥⎜ ⎟ ⎜ ⎟
⎝ ⎠ ⎝ ⎠ ⎝ ⎠⎣ ⎦NL,RBC NP,RBC
A,RBC pu,RBC IW,RBCRBC
P f +(0.3 P + 0.7) f1 + Z 1 + YK = K - f -1 + Y 1 + Y Z [AP]
(3-6)
B P
pu,RBCP
Hct -1+(C /C )K =f Hct
(3-7)
Specifically, Kpu,RBC is the ratio of drug concentration in red blood cells to that unbound in plasma
and represents the binding of drug molecules to red blood cells. CB/CP is the blood:plasma
concentration ratio and Hct is the hematocrit; fP is the fraction of drug unbound in plasma, and
subscripts RBC and P denotes the red blood cells and plasma, respectively.
For M3G, the binding association constant KA,PR is given by Eq. 3-8.
⎡ ⎤ ⎛ ⎞⎛ ⎞⎜ ⎟⎢ ⎥⎜ ⎟
⎝ ⎠ ⎝ ⎠⎣ ⎦NL,P NP,P
A,PRP P
P f +(0.3 P+0.7) f1 1K = -1-f 1 + Y [PR]
(3-8)
Table 3-3 Definition of the Terms X, Y and Z in Equations 3-4 to 3-8.a
X Y ZCodeine/Morphine (Monoprotic base) IWpka-pH10 Ppka-pH10 RBCpka-pH10
M3G (Monoprotic acid) IWpH -pka10 -PpH pka10 NA
a Summarized from Rodgers and Rowland, 2007.
3.3.4 Simulations and Kinetic Analysis
With the use of the simulating/fitting program, Scientist® and the Simcyp® Rat 2009
simulator (program for virtual clinical studies), model parameters for permeability, metabolism,
transport and apical secretion were optimized against existing (literature) rat codeine, morphine,
and M3G data (oral & i.v.). The two methods were compared for their adequacies in predicting
codeine/morphine PK profiles. The observed and published in vivo parent drug and metabolite
data (oral & i.v.) were matched against the predictions from the TM and the SFM.
46
46
To facilitate the simulation of codeine sequential metabolism, the optimization of
morphine and M3G parameters upon morphine oral & i.v. administration was conducted first.
The set of PK parameters for morphine PK profile was then applied to the optimization of
parameters for the simulation of codeine sequential metabolism. With the simulated PK profiles,
the extrapolated area under the curve ( 0-infAUC ) of the parent drug as well as metabolites were
calculated and compared with the literature data. Moreover, for the discrimination between the
SFM and TM, the AUC ratio between M3G and morphine after oral/i.v. codeine administration
was also calculated for both TM and SFM, based on simulated data. These simulated ratios were
in turn compared to the observed ratios.
3.3.5 Statistical Comparisons
For the codeine PK study, the data were presented as the mean ± SEM. The two-tailed
Student’s t test was used to compare the means, and a P value of < 0.05 was viewed as
significant. The residual sum of squares (RSS) between the simulated data predicted by
TM/SFM/Simcyp® Rat 2009 and literature/experimental values of codeine/morphine/M3G were
calculated. These RSS values were then applied to F test to examine the difference between the
models where the P value was set as < 0.05 for significance.
3.4 Results
3.4.1 LC-MS/MS Assay for In Vivo PK Studies
A typical LC-MS/MS chromatogram of sample separation for codeine and its
metabolites and internal standard is shown in Fig. 3-3. Good separation was obtained from the
LC-MS/MS assay. The retention times for M3G, morphine, codeine, and caffeine (IS) were 2.6,
4.3, 9.8 and 10.9 min, respectively. The area of each peak, obtained by MassHunter workstation
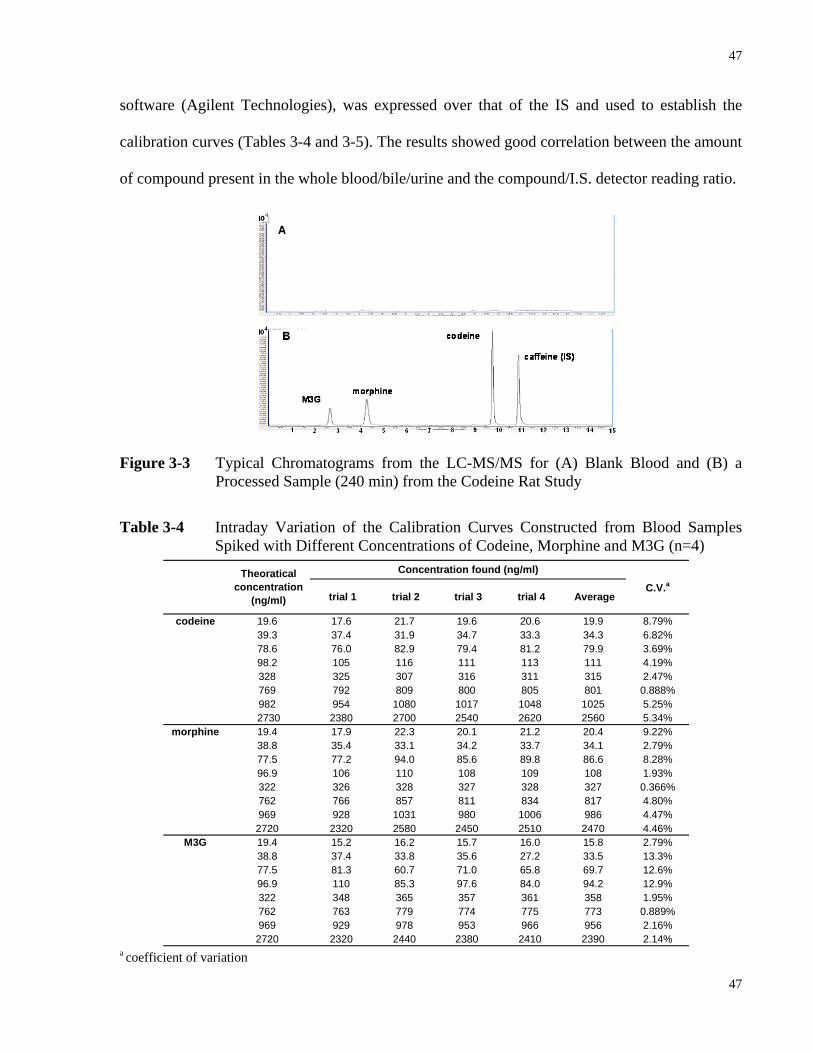
47
47
software (Agilent Technologies), was expressed over that of the IS and used to establish the
calibration curves (Tables 3-4 and 3-5). The results showed good correlation between the amount
of compound present in the whole blood/bile/urine and the compound/I.S. detector reading ratio.
Figure 3-3 Typical Chromatograms from the LC-MS/MS for (A) Blank Blood and (B) a Processed Sample (240 min) from the Codeine Rat Study
Table 3-4 Intraday Variation of the Calibration Curves Constructed from Blood Samples Spiked with Different Concentrations of Codeine, Morphine and M3G (n=4)
a coefficient of variation
trial 1 trial 2 trial 3 trial 4 Average
codeine 19.6 17.6 21.7 19.6 20.6 19.9 8.79%39.3 37.4 31.9 34.7 33.3 34.3 6.82%78.6 76.0 82.9 79.4 81.2 79.9 3.69%98.2 105 116 111 113 111 4.19%328 325 307 316 311 315 2.47%769 792 809 800 805 801 0.888%982 954 1080 1017 1048 1025 5.25%2730 2380 2700 2540 2620 2560 5.34%
morphine 19.4 17.9 22.3 20.1 21.2 20.4 9.22%38.8 35.4 33.1 34.2 33.7 34.1 2.79%77.5 77.2 94.0 85.6 89.8 86.6 8.28%96.9 106 110 108 109 108 1.93%322 326 328 327 328 327 0.366%762 766 857 811 834 817 4.80%969 928 1031 980 1006 986 4.47%2720 2320 2580 2450 2510 2470 4.46%
M3G 19.4 15.2 16.2 15.7 16.0 15.8 2.79%38.8 37.4 33.8 35.6 27.2 33.5 13.3%77.5 81.3 60.7 71.0 65.8 69.7 12.6%96.9 110 85.3 97.6 84.0 94.2 12.9%322 348 365 357 361 358 1.95%762 763 779 774 775 773 0.889%969 929 978 953 966 956 2.16%2720 2320 2440 2380 2410 2390 2.14%
Theoratical concentration
(ng/ml)
Concentration found (ng/ml)
C.V.a
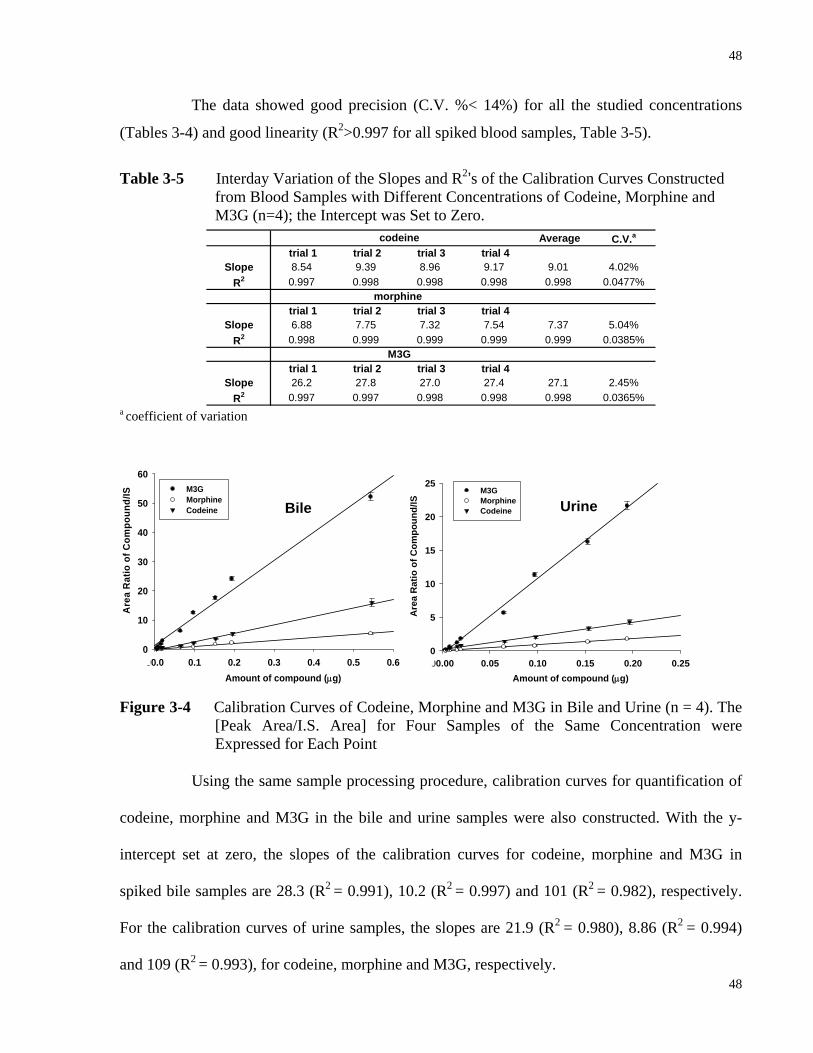
48
48
The data showed good precision (C.V. %< 14%) for all the studied concentrations
(Tables 3-4) and good linearity (R2>0.997 for all spiked blood samples, Table 3-5).
Table 3-5 Interday Variation of the Slopes and R2’s of the Calibration Curves Constructed
from Blood Samples with Different Concentrations of Codeine, Morphine and M3G (n=4); the Intercept was Set to Zero.
a coefficient of variation
00.0 0.1 0.2 0.3 0.4 0.5 0.60
10
20
30
40
50
60M3GMorphine Codeine
Are
a R
atio
of C
ompo
und/
IS
Amount of compound (μg)00.00 0.05 0.10 0.15 0.20 0.250
5
10
15
20
25M3GMorphineCodeine
Are
a R
atio
of C
ompo
und/
IS
Amount of compound (μg)
Figure 3-4 Calibration Curves of Codeine, Morphine and M3G in Bile and Urine (n = 4). The [Peak Area/I.S. Area] for Four Samples of the Same Concentration were Expressed for Each Point
Using the same sample processing procedure, calibration curves for quantification of
codeine, morphine and M3G in the bile and urine samples were also constructed. With the y-
intercept set at zero, the slopes of the calibration curves for codeine, morphine and M3G in
spiked bile samples are 28.3 (R2 = 0.991), 10.2 (R2 = 0.997) and 101 (R2 = 0.982), respectively.
For the calibration curves of urine samples, the slopes are 21.9 (R2 = 0.980), 8.86 (R2 = 0.994)
and 109 (R2 = 0.993), for codeine, morphine and M3G, respectively.
Bile Urine
Average C.V.a
trial 1 trial 2 trial 3 trial 4Slope 8.54 9.39 8.96 9.17 9.01 4.02%
R2 0.997 0.998 0.998 0.998 0.998 0.0477%
trial 1 trial 2 trial 3 trial 4Slope 6.88 7.75 7.32 7.54 7.37 5.04%
R2 0.998 0.999 0.999 0.999 0.999 0.0385%
trial 1 trial 2 trial 3 trial 4Slope 26.2 27.8 27.0 27.4 27.1 2.45%
R2 0.997 0.997 0.998 0.998 0.998 0.0365%
codeine
morphine
M3G
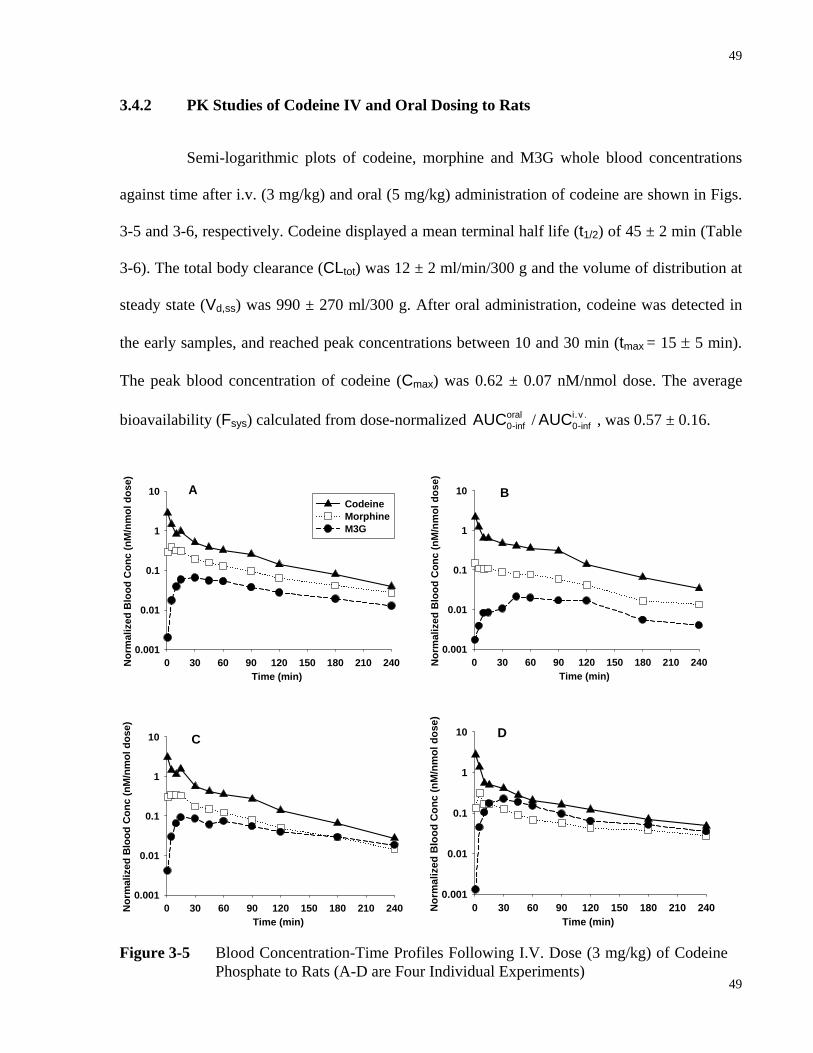
49
49
3.4.2 PK Studies of Codeine IV and Oral Dosing to Rats
Semi-logarithmic plots of codeine, morphine and M3G whole blood concentrations
against time after i.v. (3 mg/kg) and oral (5 mg/kg) administration of codeine are shown in Figs.
3-5 and 3-6, respectively. Codeine displayed a mean terminal half life (t1/2) of 45 ± 2 min (Table
3-6). The total body clearance (CLtot) was 12 ± 2 ml/min/300 g and the volume of distribution at
steady state (Vd,ss) was 990 ± 270 ml/300 g. After oral administration, codeine was detected in
the early samples, and reached peak concentrations between 10 and 30 min (tmax = 15 ± 5 min).
The peak blood concentration of codeine (Cmax) was 0.62 ± 0.07 nM/nmol dose. The average
bioavailability (Fsys) calculated from dose-normalized oral0-inf AUC / i.v .
0-inf AUC , was 0.57 ± 0.16.
Time (min)0 30 60 90 120 150 180 210 240N
orm
aliz
ed B
lood
Con
c (n
M/n
mol
dos
e)
0.001
0.01
0.1
1
10 B
Time (min)0 30 60 90 120 150 180 210 240N
orm
aliz
ed B
lood
Con
c (n
M/n
mol
dos
e)
0.001
0.01
0.1
1
10 C
Time (min)0 30 60 90 120 150 180 210 240N
orm
aliz
ed B
lood
Con
c (n
M/n
mol
dos
e)
0.001
0.01
0.1
1
10 D
Time (min)0 30 60 90 120 150 180 210 240N
orm
aliz
ed B
lood
Con
c (n
M/n
mol
dos
e)
0.001
0.01
0.1
1
10CodeineMorphineM3G
A
Figure 3-5 Blood Concentration-Time Profiles Following I.V. Dose (3 mg/kg) of Codeine Phosphate to Rats (A-D are Four Individual Experiments)
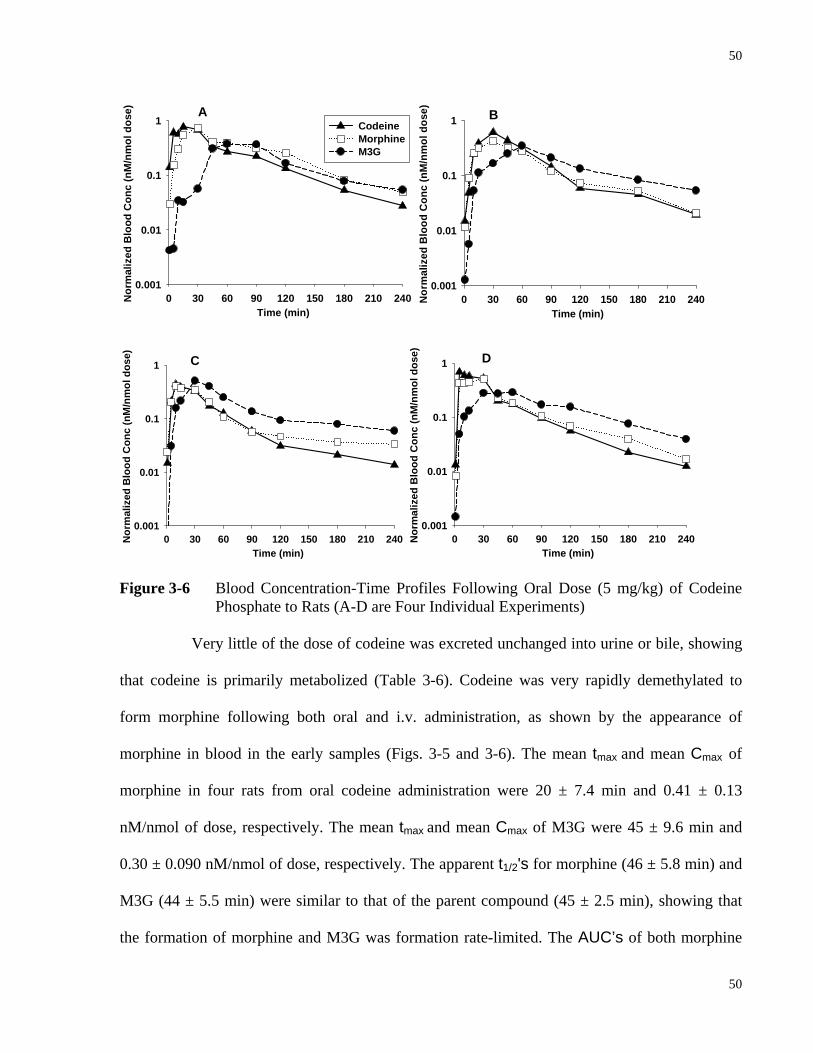
50
50
Time (min)0 30 60 90 120 150 180 210 240N
orm
aliz
ed B
lood
Con
c (n
M/n
mol
dos
e)
0.001
0.01
0.1
1 CodeineMorphineM3G
A
Time (min)0 30 60 90 120 150 180 210 240N
orm
aliz
ed B
lood
Con
c (n
M/n
mol
dos
e)
0.001
0.01
0.1
1 B
Time (min)0 30 60 90 120 150 180 210 240N
orm
aliz
ed B
lood
Con
c (n
M/n
mol
dos
e)
0.001
0.01
0.1
1 C
Time (min)0 30 60 90 120 150 180 210 240N
orm
aliz
ed B
lood
Con
c (n
M/n
mol
dos
e)
0.001
0.01
0.1
1 D
Figure 3-6 Blood Concentration-Time Profiles Following Oral Dose (5 mg/kg) of Codeine Phosphate to Rats (A-D are Four Individual Experiments)
Very little of the dose of codeine was excreted unchanged into urine or bile, showing
that codeine is primarily metabolized (Table 3-6). Codeine was very rapidly demethylated to
form morphine following both oral and i.v. administration, as shown by the appearance of
morphine in blood in the early samples (Figs. 3-5 and 3-6). The mean tmax and mean Cmax of
morphine in four rats from oral codeine administration were 20 ± 7.4 min and 0.41 ± 0.13
nM/nmol of dose, respectively. The mean tmax and mean Cmax of M3G were 45 ± 9.6 min and
0.30 ± 0.090 nM/nmol of dose, respectively. The apparent t1/2's for morphine (46 ± 5.8 min) and
M3G (44 ± 5.5 min) were similar to that of the parent compound (45 ± 2.5 min), showing that
the formation of morphine and M3G was formation rate-limited. The AUC’s of both morphine
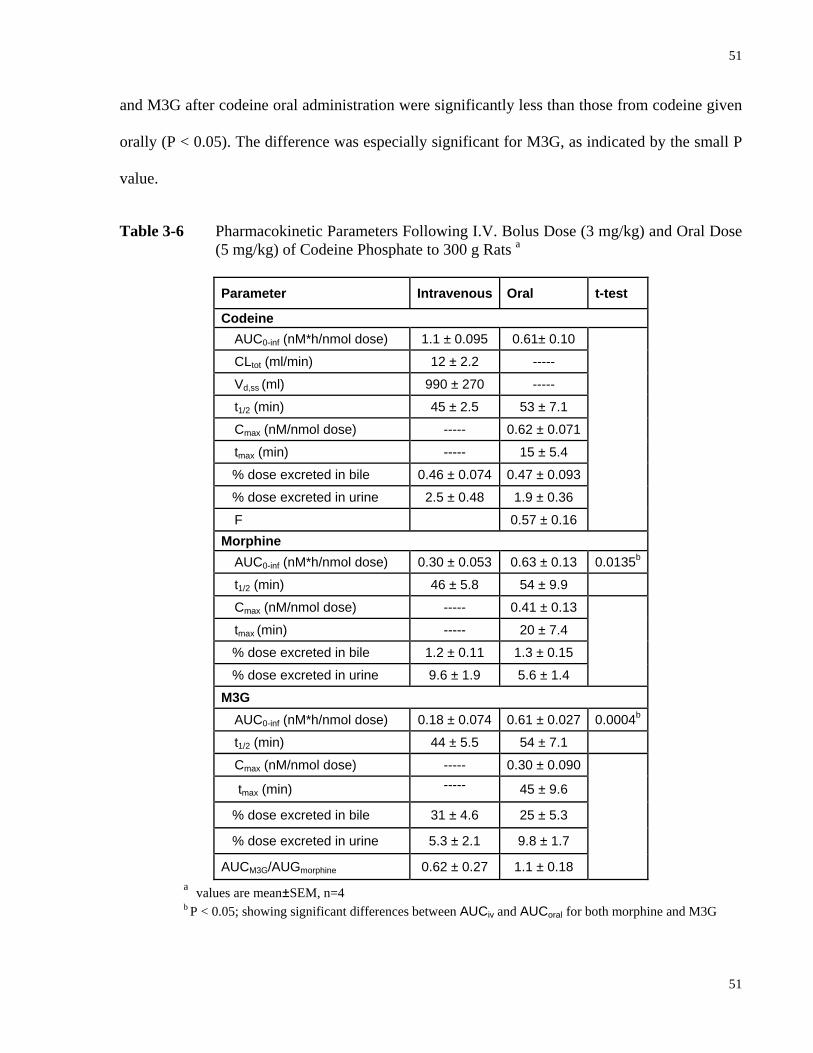
51
51
and M3G after codeine oral administration were significantly less than those from codeine given
orally (P < 0.05). The difference was especially significant for M3G, as indicated by the small P
value.
Table 3-6 Pharmacokinetic Parameters Following I.V. Bolus Dose (3 mg/kg) and Oral Dose (5 mg/kg) of Codeine Phosphate to 300 g Rats a
Parameter Intravenous Oral t-test
Codeine AUC0-inf (nM*h/nmol dose) 1.1 ± 0.095 0.61± 0.10
CLtot (ml/min) 12 ± 2.2 -----
Vd,ss (ml) 990 ± 270 -----
t1/2 (min) 45 ± 2.5 53 ± 7.1
Cmax (nM/nmol dose) ----- 0.62 ± 0.071
tmax (min) ----- 15 ± 5.4
% dose excreted in bile 0.46 ± 0.074 0.47 ± 0.093
% dose excreted in urine 2.5 ± 0.48 1.9 ± 0.36
F 0.57 ± 0.16
Morphine AUC0-inf (nM*h/nmol dose) 0.30 ± 0.053 0.63 ± 0.13 0.0135b
t1/2 (min) 46 ± 5.8 54 ± 9.9
Cmax (nM/nmol dose) ----- 0.41 ± 0.13
tmax (min) ----- 20 ± 7.4
% dose excreted in bile 1.2 ± 0.11 1.3 ± 0.15
% dose excreted in urine 9.6 ± 1.9 5.6 ± 1.4
M3G AUC0-inf (nM*h/nmol dose) 0.18 ± 0.074 0.61 ± 0.027 0.0004b
t1/2 (min) 44 ± 5.5 54 ± 7.1
Cmax (nM/nmol dose) ----- 0.30 ± 0.090
tmax (min) ----- 45 ± 9.6
% dose excreted in bile 31 ± 4.6 25 ± 5.3
% dose excreted in urine 5.3 ± 2.1 9.8 ± 1.7
AUCM3G/AUGmorphine 0.62 ± 0.27 1.1 ± 0.18
a values are mean±SEM, n=4 b P < 0.05; showing significant differences between AUCiv and AUCoral for both morphine and M3G
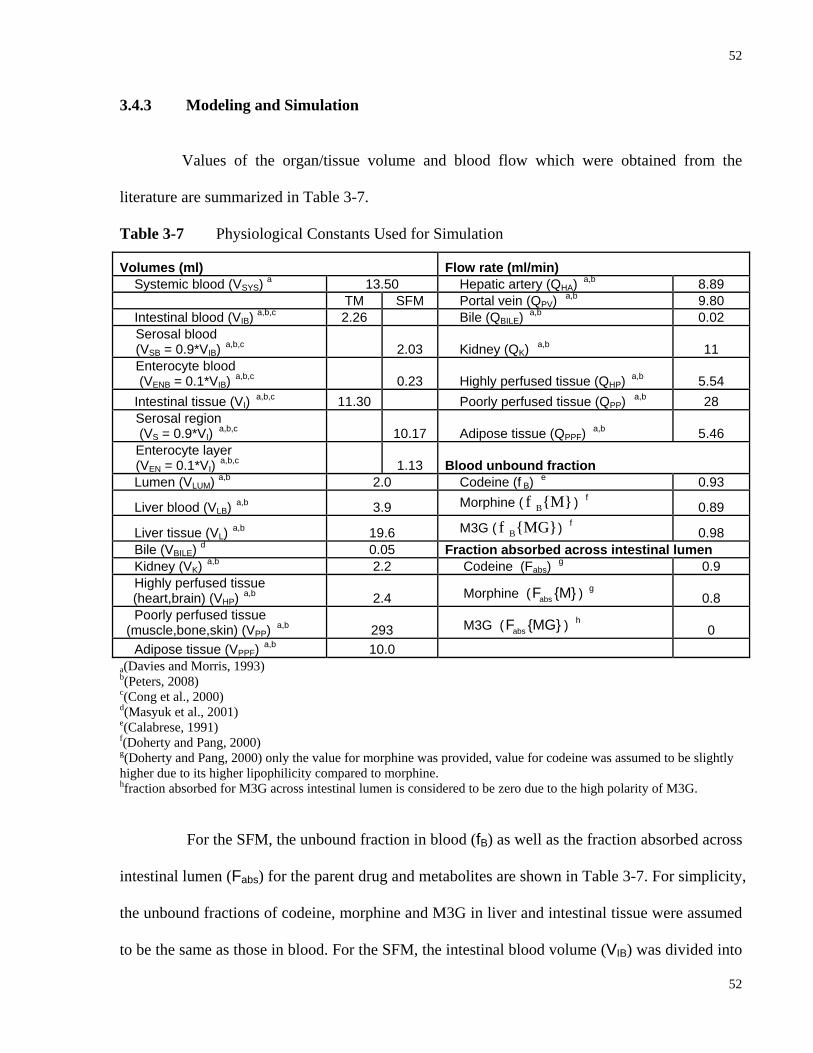
52
52
3.4.3 Modeling and Simulation
Values of the organ/tissue volume and blood flow which were obtained from the
literature are summarized in Table 3-7.
Table 3-7 Physiological Constants Used for Simulation
Volumes (ml) Flow rate (ml/min) Systemic blood (VSYS) a 13.50 Hepatic artery (QHA) a,b 8.89 TM SFM Portal vein (QPV) a,b 9.80 Intestinal blood (VIB) a,b,c 2.26 Bile (QBILE) a,b 0.02
Serosal blood (VSB = 0.9*VIB) a,b,c 2.03 Kidney (QK) a,b 11 Enterocyte blood (VENB = 0.1*VIB) a,b,c 0.23 Highly perfused tissue (QHP) a,b 5.54
Intestinal tissue (VI) a,b,c 11.30 Poorly perfused tissue (QPP) a,b 28 Serosal region (VS = 0.9*VI) a,b,c 10.17 Adipose tissue (QPPF) a,b 5.46 Enterocyte layer (VEN = 0.1*VI) a,b,c 1.13 Blood unbound fraction
Lumen (VLUM) a,b 2.0 Codeine (f B) e 0.93
Liver blood (VLB) a,b 3.9 Morphine ( Bf {M} ) f 0.89
Liver tissue (VL) a,b 19.6 M3G ( Bf {MG}) f 0.98 Bile (VBILE) d 0.05 Fraction absorbed across intestinal lumen Kidney (VK) a,b 2.2 Codeine (Fabs) g 0.9 Highly perfused tissue
(heart,brain) (VHP) a,b 2.4 Morphine ( absF {M} ) g 0.8 Poorly perfused tissue (muscle,bone,skin) (VPP) a,b 293 M3G ( absF {MG} ) h 0
Adipose tissue (VPPF) a,b 10.0 a(Davies and Morris, 1993) b(Peters, 2008) c(Cong et al., 2000) d(Masyuk et al., 2001) e(Calabrese, 1991) f(Doherty and Pang, 2000) g(Doherty and Pang, 2000) only the value for morphine was provided, value for codeine was assumed to be slightly higher due to its higher lipophilicity compared to morphine. hfraction absorbed for M3G across intestinal lumen is considered to be zero due to the high polarity of M3G.
For the SFM, the unbound fraction in blood (fB) as well as the fraction absorbed across
intestinal lumen (Fabs) for the parent drug and metabolites are shown in Table 3-7. For simplicity,
the unbound fractions of codeine, morphine and M3G in liver and intestinal tissue were assumed
to be the same as those in blood. For the SFM, the intestinal blood volume (VIB) was divided into
53
53
serosal blood (assumed to be 90% of VIB) and enterocyte (mucosal) blood (assumed to be 10% of
VIB). Similarly, the intestinal tissue volume (VI) was also proportionated in the same fashion. For
non-metabolizing/eliminating compartments, the poorly perfused tissue compartment represented
a great portion in both total volume (293/(293+2.4+10) = 96%) and total blood flow
(28/(28+5.54+5.46)= 72%). For both the parent drug and the metabolites, the blood unbound
fractions were > 85% suggesting that the majority of the substances were mostly free to traverse
cell membranes.
3.4.3.1 Intrinsic Clearances and Rate Constants for Codeine in Rat
Literature and optimized values of the renal, basolateral influx/efflux, metabolic
intrinsic and secretory intrinsic clearances were summarized in Table 3-8. The numbers were
first obtained from literature, and have been adjusted during simulation. Terms for which
literature values were absent were assigned to 1 initially and adjusted during the simulation for
optimization.
For codeine and morphine, the intestinal influx transport clearances ( Id1CL ) from the
TM were similar to the ones from the SFM since passive diffusion was the only recognized
uptake process. The influx of M3G was assumed minimal due to the high polarity of M3G. The
efflux of M3G was significantly greater than the influx due to the presence of basolateral MRP3
(van de Wetering et al., 2007). In general, the hepatic influx/efflux clearances values were
assumed to be greater than those of the intestine due to the greater size of the liver. The secretory
intrinsic clearances for codeine in both the intestine and liver were assumed to be relatively small
compared to those for morphine and M3G. Morphine is excreted by MDR1 (P-gp) into the
intestinal lumen and into the bile. M3G is excreted back to the lumen and in the bile apically via
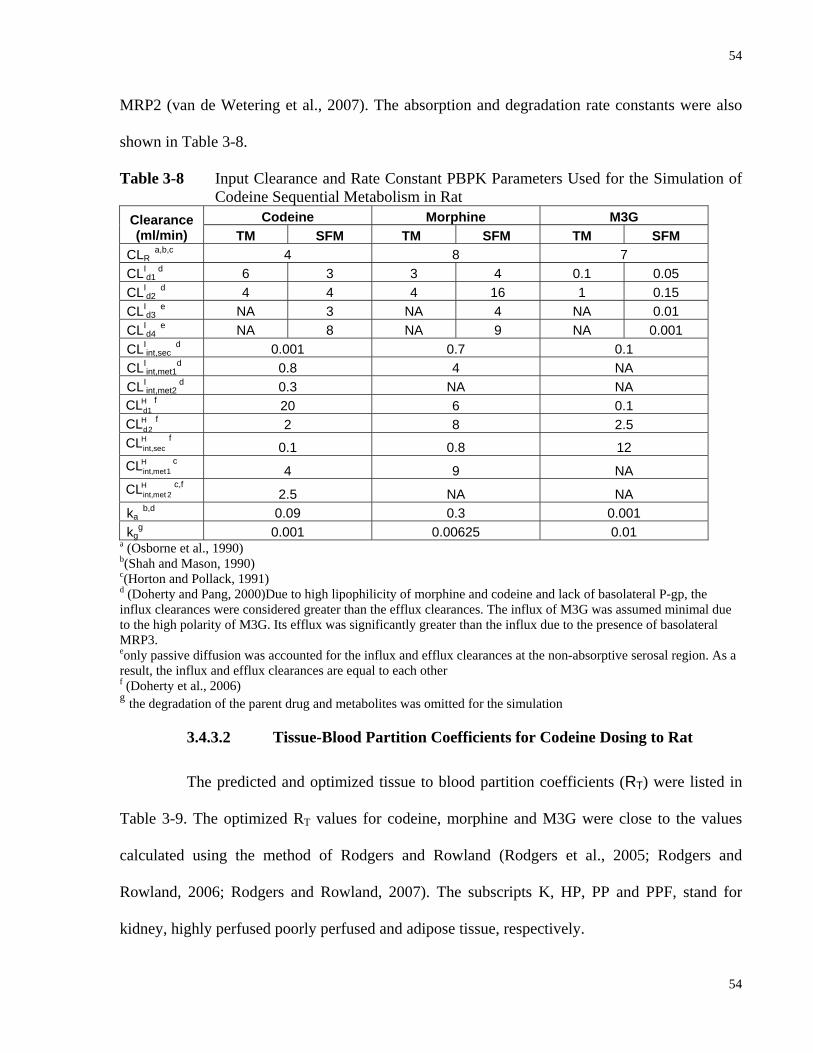
54
54
MRP2 (van de Wetering et al., 2007). The absorption and degradation rate constants were also
shown in Table 3-8.
Table 3-8 Input Clearance and Rate Constant PBPK Parameters Used for the Simulation of Codeine Sequential Metabolism in Rat
Codeine Morphine M3G Clearance (ml/min) TM SFM TM SFM TM SFM
CLR a,b,c 4 8 7
CLId1
d 6 3 3 4 0.1 0.05 CLI
d2 d 4 4 4 16 1 0.15
CLId3
e NA 3 NA 4 NA 0.01 CLI
d4 e NA 8 NA 9 NA 0.001
CLIint,sec
d 0.001 0.7 0.1 CLI
int,met1d 0.8 4 NA
CLIint,met2
d 0.3 NA NA H
d1CL f 20 6 0.1 H
d2CL f 2 8 2.5 H
int,secCL f 0.1 0.8 12
Hint,met1CL c
4 9 NA H
int,met 2CL c,f 2.5 NA NA
ka b,d 0.09 0.3 0.001
kgg 0.001 0.00625 0.01
a (Osborne et al., 1990) b(Shah and Mason, 1990) c(Horton and Pollack, 1991) d (Doherty and Pang, 2000)Due to high lipophilicity of morphine and codeine and lack of basolateral P-gp, the influx clearances were considered greater than the efflux clearances. The influx of M3G was assumed minimal due to the high polarity of M3G. Its efflux was significantly greater than the influx due to the presence of basolateral MRP3. eonly passive diffusion was accounted for the influx and efflux clearances at the non-absorptive serosal region. As a result, the influx and efflux clearances are equal to each other f (Doherty et al., 2006) g the degradation of the parent drug and metabolites was omitted for the simulation
3.4.3.2 Tissue-Blood Partition Coefficients for Codeine Dosing to Rat
The predicted and optimized tissue to blood partition coefficients (RT) were listed in
Table 3-9. The optimized RT values for codeine, morphine and M3G were close to the values
calculated using the method of Rodgers and Rowland (Rodgers et al., 2005; Rodgers and
Rowland, 2006; Rodgers and Rowland, 2007). The subscripts K, HP, PP and PPF, stand for
kidney, highly perfused poorly perfused and adipose tissue, respectively.
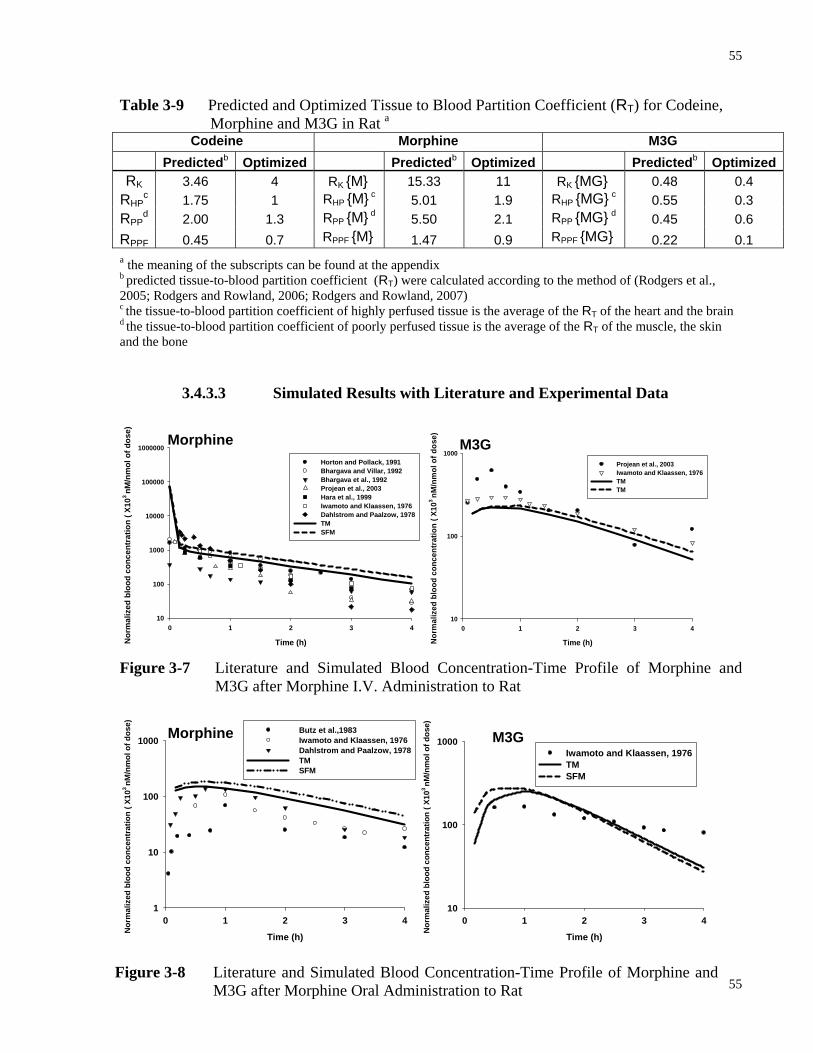
55
55
Table 3-9 Predicted and Optimized Tissue to Blood Partition Coefficient (RT) for Codeine, Morphine and M3G in Rat a
Codeine Morphine M3G Predictedb Optimized Predictedb Optimized Predictedb OptimizedRK 3.46 4 RK {M} 15.33 11 RK {MG} 0.48 0.4
RHPc 1.75 1 RHP {M} c 5.01 1.9 RHP {MG} c 0.55 0.3
RPPd 2.00 1.3 RPP {M} d 5.50 2.1 RPP {MG} d 0.45 0.6
RPPF 0.45 0.7 RPPF {M} 1.47 0.9 RPPF {MG} 0.22 0.1 a the meaning of the subscripts can be found at the appendix b predicted tissue-to-blood partition coefficient (RT) were calculated according to the method of (Rodgers et al., 2005; Rodgers and Rowland, 2006; Rodgers and Rowland, 2007) c the tissue-to-blood partition coefficient of highly perfused tissue is the average of the RT of the heart and the brain d the tissue-to-blood partition coefficient of poorly perfused tissue is the average of the RT of the muscle, the skin and the bone
3.4.3.3 Simulated Results with Literature and Experimental Data
Time (h)
0 1 2 3 4
Nor
mal
ized
blo
od c
once
ntra
tion
( X10
3 nM
/nm
ol o
f dos
e)
10
100
1000
10000
100000
1000000
Horton and Pollack, 1991Bhargava and Villar, 1992Bhargava et al., 1992Projean et al., 2003Hara et al., 1999Iwamoto and Klaassen, 1976Dahlstrom and Paalzow, 1978TMSFM
Time (h)
0 1 2 3 4
Nor
mal
ized
blo
od c
once
ntra
tion
( X10
3 nM
/nm
ol o
f dos
e)
10
100
1000Projean et al., 2003Iwamoto and Klaassen, 1976TMTM
Figure 3-7 Literature and Simulated Blood Concentration-Time Profile of Morphine and
M3G after Morphine I.V. Administration to Rat
Time (h)
0 1 2 3 4
Nor
mal
ized
blo
od c
once
ntra
tion
( X10
3 nM
/nm
ol o
f dos
e)
1
10
100
1000Butz et al.,1983Iwamoto and Klaassen, 1976Dahlstrom and Paalzow, 1978TMSFM
Time (h)
0 1 2 3 4
Nor
mal
ized
blo
od c
once
ntra
tion
( X10
3 nM
/nm
ol o
f dos
e)
10
100
1000Iwamoto and Klaassen, 1976TMSFM
Morphine
M3G
M3G
Morphine
Figure 3-8 Literature and Simulated Blood Concentration-Time Profile of Morphine and M3G after Morphine Oral Administration to Rat
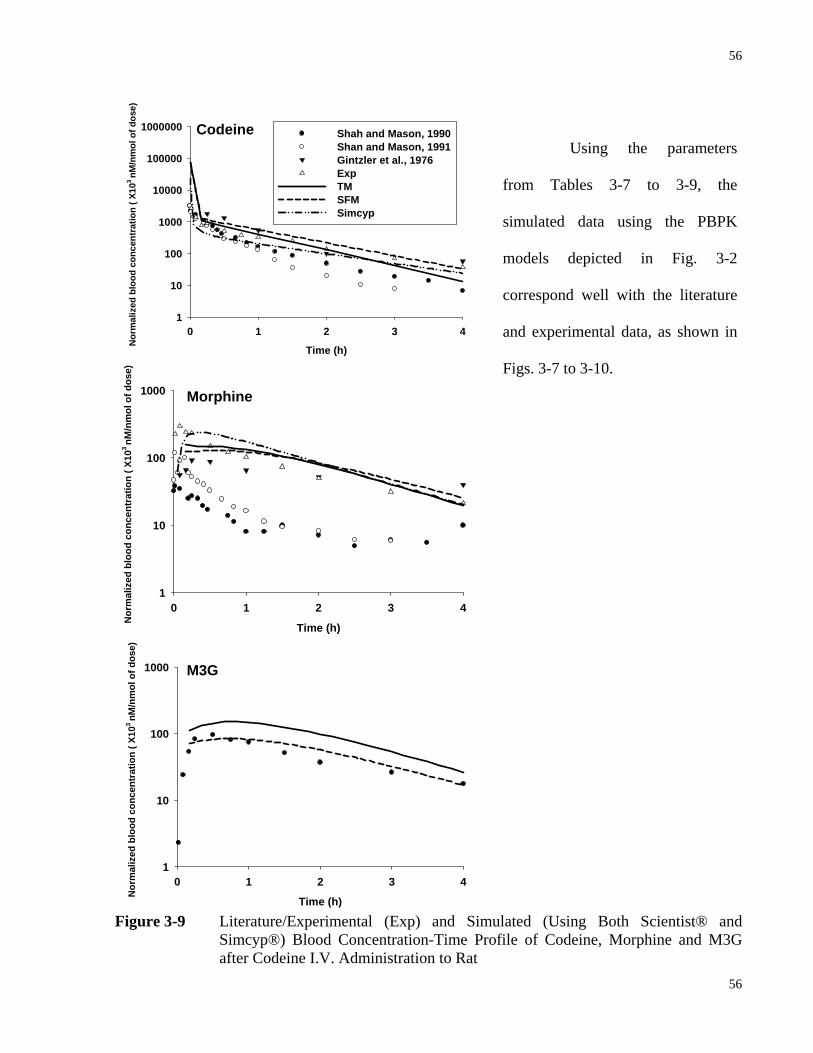
56
56
Time (h)
0 1 2 3 4
Nor
mal
ized
blo
od c
once
ntra
tion
( X10
3 nM
/nm
ol o
f dos
e)
1
10
100
1000
10000
100000
1000000 Shah and Mason, 1990Shan and Mason, 1991Gintzler et al., 1976ExpTMSFMSimcyp
Time (h)
0 1 2 3 4
Nor
mal
ized
blo
od c
once
ntra
tion
( X10
3 nM
/nm
ol o
f dos
e)
1
10
100
1000
Time (h)
0 1 2 3 4
Nor
mal
ized
blo
od c
once
ntra
tion
( X10
3 nM
/nm
ol o
f dos
e)
1
10
100
1000
Figure 3-9 Literature/Experimental (Exp) and Simulated (Using Both Scientist® and
Simcyp®) Blood Concentration-Time Profile of Codeine, Morphine and M3G after Codeine I.V. Administration to Rat
Using the parameters
from Tables 3-7 to 3-9, the
simulated data using the PBPK
models depicted in Fig. 3-2
correspond well with the literature
and experimental data, as shown in
Figs. 3-7 to 3-10.
Morphine
Codeine
M3G
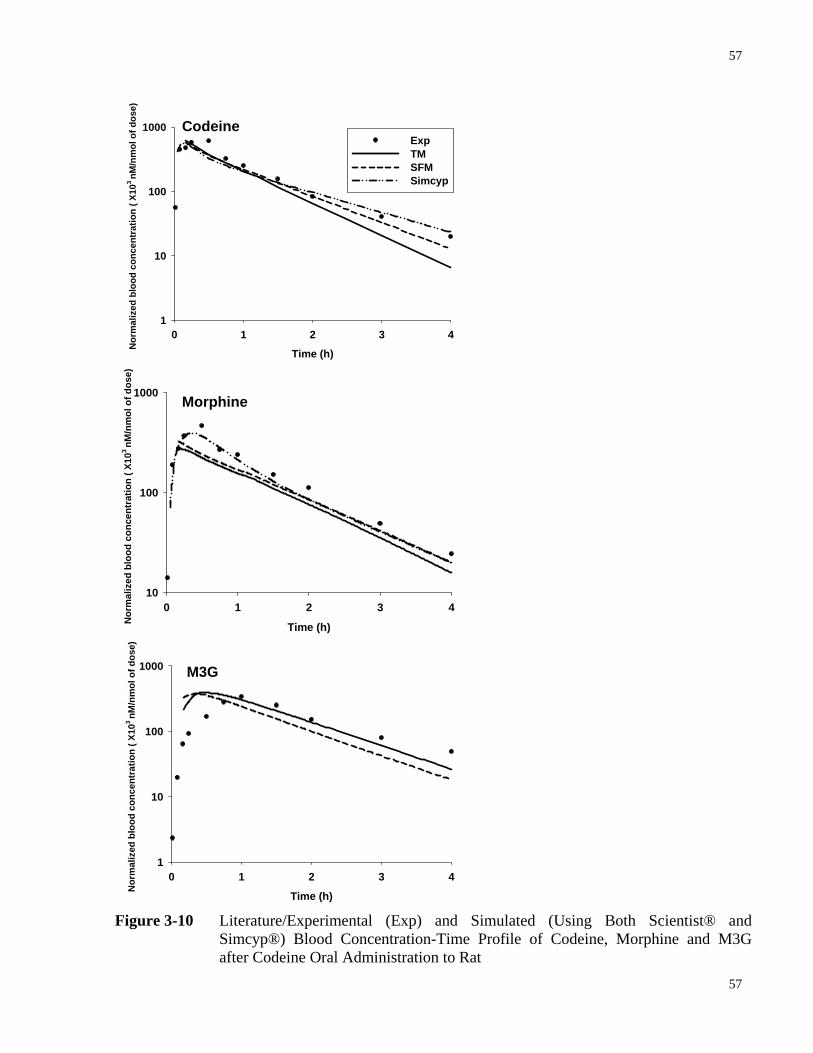
57
57
Time (h)
0 1 2 3 4
Nor
mal
ized
blo
od c
once
ntra
tion
( X10
3 nM
/nm
ol o
f dos
e)
1
10
100
1000ExpTMSFMSimcyp
Time (h)
0 1 2 3 4
Nor
mal
ized
blo
od c
once
ntra
tion
( X10
3 nM
/nm
ol o
f dos
e)
10
100
1000
Time (h)
0 1 2 3 4
Nor
mal
ized
blo
od c
once
ntra
tion
( X10
3 nM
/nm
ol o
f dos
e)
1
10
100
1000
Figure 3-10 Literature/Experimental (Exp) and Simulated (Using Both Scientist® and Simcyp®) Blood Concentration-Time Profile of Codeine, Morphine and M3G after Codeine Oral Administration to Rat
Morphine
Codeine
M3G
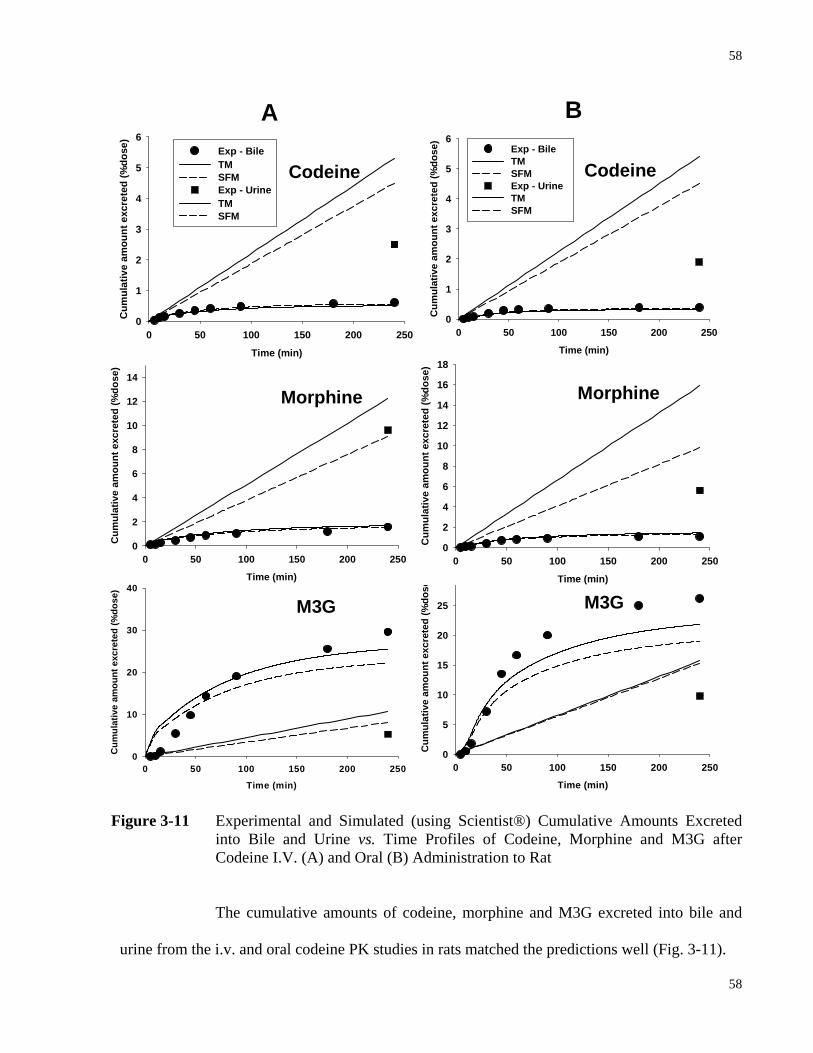
58
58
Figure 3-11 Experimental and Simulated (using Scientist®) Cumulative Amounts Excreted
into Bile and Urine vs. Time Profiles of Codeine, Morphine and M3G after Codeine I.V. (A) and Oral (B) Administration to Rat
The cumulative amounts of codeine, morphine and M3G excreted into bile and
urine from the i.v. and oral codeine PK studies in rats matched the predictions well (Fig. 3-11).
Time (min)
0 50 100 150 200 250
Cum
ulat
ive
amou
nt e
xcre
ted
(%do
se)
0
5
10
15
20
25
30 Time (min)
0 50 100 150 200 250
Cum
ulat
ive
amou
nt e
xcre
ted
(%do
se)
0
2
4
6
8
10
12
14
16
18Time (min)
0 50 100 150 200 250
Cum
ulat
ive
amou
nt e
xcre
ted
(%do
se)
0
1
2
3
4
5
6Exp - BileTMSFM Exp - Urine TM SFM
Codeine
Morphine
M3G
Time (min)
0 50 100 150 200 250
Cum
ulat
ive
amou
nt e
xcre
ted
(%do
se)
0
10
20
30
40Time (min)
0 50 100 150 200 250
Cum
ulat
ive
amou
nt e
xcre
ted
(%do
se)
0
2
4
6
8
10
12
14
Morphine
M3G
Time (min)
0 50 100 150 200 250
Cum
ulat
ive
amou
nt e
xcre
ted
(%do
se)
0
1
2
3
4
5
6Exp - Bile TMSFM Exp - UrineTMSFM
Codeine
A B
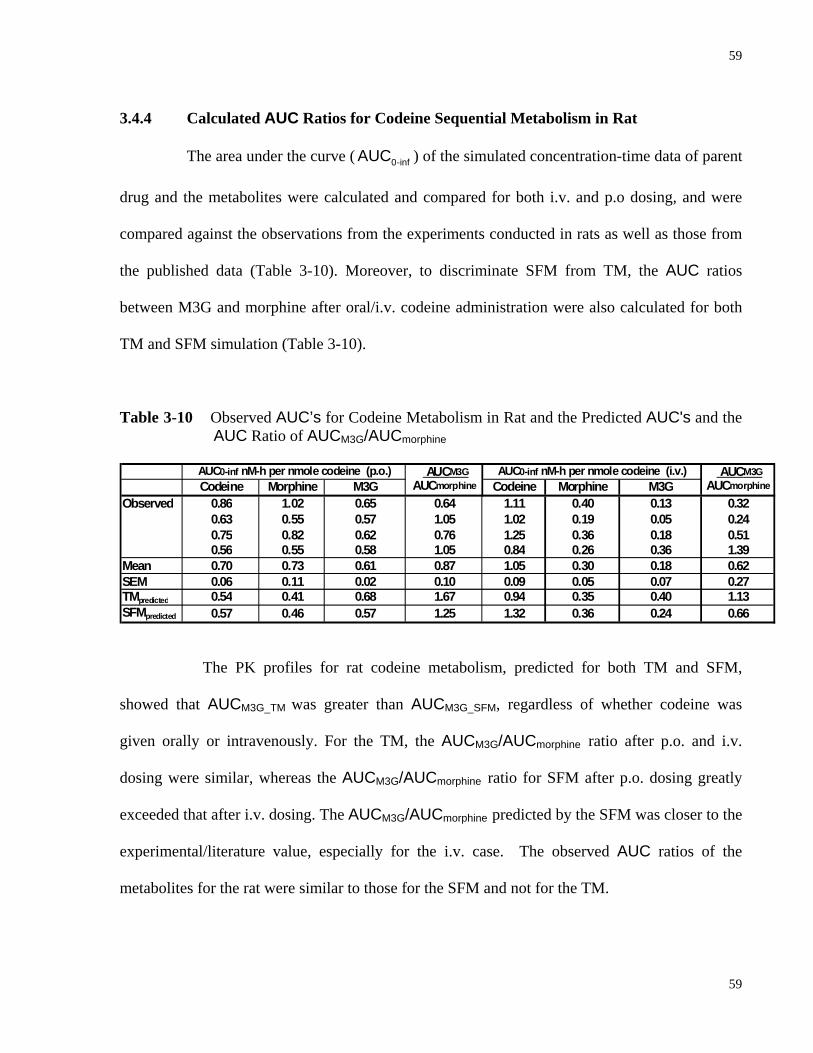
59
59
3.4.4 Calculated AUC Ratios for Codeine Sequential Metabolism in Rat
The area under the curve ( 0-infAUC ) of the simulated concentration-time data of parent
drug and the metabolites were calculated and compared for both i.v. and p.o dosing, and were
compared against the observations from the experiments conducted in rats as well as those from
the published data (Table 3-10). Moreover, to discriminate SFM from TM, the AUC ratios
between M3G and morphine after oral/i.v. codeine administration were also calculated for both
TM and SFM simulation (Table 3-10).
Table 3-10 Observed AUC’s for Codeine Metabolism in Rat and the Predicted AUC's and the AUC Ratio of AUCM3G/AUCmorphine
AUCM3G AUCM3G
Codeine Morphine M3G AUCmorphine Codeine Morphine M3G AUCmorphine
Observed 0.86 1.02 0.65 0.64 1.11 0.40 0.13 0.320.63 0.55 0.57 1.05 1.02 0.19 0.05 0.240.75 0.82 0.62 0.76 1.25 0.36 0.18 0.510.56 0.55 0.58 1.05 0.84 0.26 0.36 1.39
Mean 0.70 0.73 0.61 0.87 1.05 0.30 0.18 0.62SEM 0.06 0.11 0.02 0.10 0.09 0.05 0.07 0.27TMpredicted 0.54 0.41 0.68 1.67 0.94 0.35 0.40 1.13SFMpredicted 0.57 0.46 0.57 1.25 1.32 0.36 0.24 0.66
AUC0-inf nM-h per nmole codeine (p.o.) AUC0-inf nM-h per nmole codeine (i.v.)
The PK profiles for rat codeine metabolism, predicted for both TM and SFM,
showed that AUCM3G_TM was greater than AUCM3G_SFM, regardless of whether codeine was
given orally or intravenously. For the TM, the AUCM3G/AUCmorphine ratio after p.o. and i.v.
dosing were similar, whereas the AUCM3G/AUCmorphine ratio for SFM after p.o. dosing greatly
exceeded that after i.v. dosing. The AUCM3G/AUCmorphine predicted by the SFM was closer to the
experimental/literature value, especially for the i.v. case. The observed AUC ratios of the
metabolites for the rat were similar to those for the SFM and not for the TM.
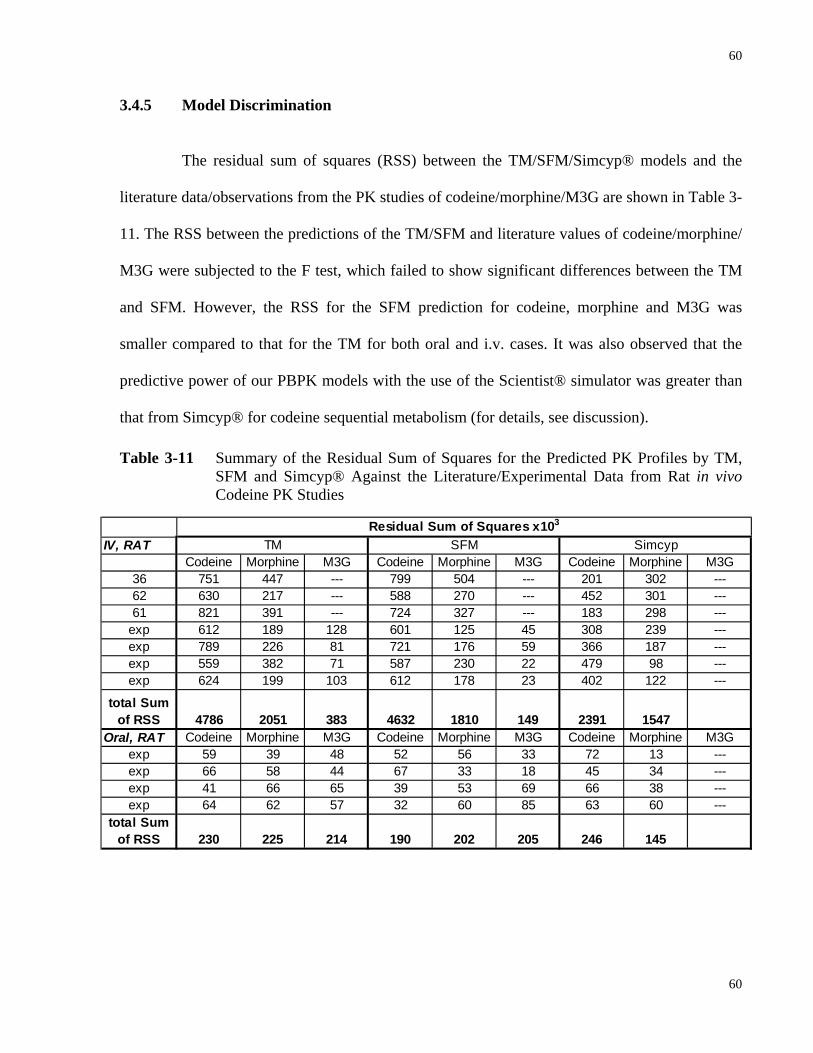
60
60
IV, RAT
Codeine Morphine M3G Codeine Morphine M3G Codeine Morphine M3G36 751 447 --- 799 504 --- 201 302 ---62 630 217 --- 588 270 --- 452 301 ---61 821 391 --- 724 327 --- 183 298 ---
exp 612 189 128 601 125 45 308 239 ---exp 789 226 81 721 176 59 366 187 ---exp 559 382 71 587 230 22 479 98 ---exp 624 199 103 612 178 23 402 122 ---
total Sumof RSS 4786 2051 383 4632 1810 149 2391 1547
Oral, RAT Codeine Morphine M3G Codeine Morphine M3G Codeine Morphine M3Gexp 59 39 48 52 56 33 72 13 ---exp 66 58 44 67 33 18 45 34 ---exp 41 66 65 39 53 69 66 38 ---exp 64 62 57 32 60 85 63 60 ---
total Sumof RSS 230 225 214 190 202 205 246 145
Residual Sum of Squares x103
TM SFM Simcyp
3.4.5 Model Discrimination
The residual sum of squares (RSS) between the TM/SFM/Simcyp® models and the
literature data/observations from the PK studies of codeine/morphine/M3G are shown in Table 3-
11. The RSS between the predictions of the TM/SFM and literature values of codeine/morphine/
M3G were subjected to the F test, which failed to show significant differences between the TM
and SFM. However, the RSS for the SFM prediction for codeine, morphine and M3G was
smaller compared to that for the TM for both oral and i.v. cases. It was also observed that the
predictive power of our PBPK models with the use of the Scientist® simulator was greater than
that from Simcyp® for codeine sequential metabolism (for details, see discussion).
Table 3-11 Summary of the Residual Sum of Squares for the Predicted PK Profiles by TM, SFM and Simcyp® Against the Literature/Experimental Data from Rat in vivo Codeine PK Studies
61
61
3.5 Discussion
Codeine undergoes O-demethylation primarily by hepatic Cyp2d1 in the rat to form
morphine. Subsequently, both intestinal and hepatic Ugt2b1 metabolize morphine to M3G. Due
to segregated flow of the intestinal blood, a lower proportion of the blood flow (10%-30%)
perfuses the enterocyte region. Our laboratory had shown that morphine forms morphine
glucuronide in the rat liver and intestine when morphine was given orally but only in the rat liver
when given systemically (Doherty and Pang, 2000; Doherty et al., 2006). Enzymes, for the O-
demethylation of codeine to morphine or Cyp2d1, exist mostly in the rat liver, whereas the
conversion of morphine to occurs in both the liver and intestine by Ugt2b1. Since Cyp2d1 is
present at relatively lower level in the intestine compared to the liver (Hiroi et al., 1998;
Mitschke et al., 2008), the formation of morphine is expected to occur primarily in the liver.
Although morphine glucuronidation can occur in both the intestine and the liver, due to
segregated flow, the hepatically-derived morphine (from codeine given i.v. or p.o.) will be
sequentially metabolized to morphine glucuronide primarily in the liver even though Ugt2b1 is
also present in the intestine. In other words, the SFM predicts that the amounts of hepatically
formed morphine from oral or i.v. codeine reaching the enterocyte systemically are lower than
those according to the TM, and that little of the hepatically formed morphine is glucuronidated
within the intestine due to segregated flow. Thus, the formation of M3G from morphine
following codeine oral and i.v. administration predicted by the SFM is much lower than that
predicted from the TM, especially for the i.v. case.
Although the SFM has been utilized for fitting and simulation in exploring intestinal
metabolism of benzoic acid (Cong et al., 2001) and digoxin (Liu et al., 2006), model
discrimination/validation of the superiority of the SFM over the TM has not been evaluated in
62
62
these studies. One major reason was the lack of intestinal metabolite formation and absence of
metabolite data, which is essential in model discrimination (Cong et al., 2001; Liu et al., 2006).
Because the collated literature data tended to vary from study to study and sometimes lacked
data on M3G due to poor assay procedures, we developed a LC-MS/MS assay to accurately
quantify the concentrations of codeine, morphine, and M3G. Thereafter, a complete
pharmacokinetic study was performed with i.v. and p.o. administration of codeine under linear
kinetic conditions. It was observed that the semilogarithmic blood concentration vs. time curves
of morphine and M3G declined in parallel with that of codeine during terminal phases with
similar slopes and half-lives (Figs. 3-5 and 3-6). This suggested that the formation of the
metabolites from the parent drug was much slower than the elimination of the metabolites, and
the removal of the metabolites is thereby formation rate-limited. As highlighted in Table 3-6, the
AUCmorphine and AUCM3G after i.v. administration of codeine were significantly smaller than the
corresponding AUC’s after oral codeine dosing. The oralmorphineAUC is two-fold the i.v .
morphineAUC , and
the observation can be regarded as an outcome from first-pass removal of orally administered
codeine. Although it is known that the hepatic Cyp2d1 abundance is about 10 times that in the
intestine (Madani et al., 1999), orally administered codeine is exposed to intestinal Cyp2d1 first
before hepatic Cyp2d1. Therefore, intestinal codeine metabolism plays a crucial role in the first-
pass elimination of orally administered codeine. The importance of intestinal first-pass removal,
as well as the existence of intestinal segregated flow is confirmed by the four-fold increase of
AUCM3G following oral codeine administration compared to the i.v. administration (Table 3-6).
Without segregated flows to the intestine, the formed morphine after codeine oral and i.v.
administration should have an equal chance to be exposed to both the intestinal and hepatic
Ugt2b1 for glucuronidation, and should theoretically yield the similar proportions of M3G
( oralM3GAUC : i.v .
M3GAUC = 2.1:1). However, this is not true according to the observed AUC values
63
63
( oralM3GAUC : i.v .
M3GAUC = 3.4:1). The excess amount of M3G formed from codeine oral
administration was likely to originate from the formed morphine in the intestine. Due to
intestinal segregated blood flow, only the morphine formed in the intestine (after oral codeine
dosing) had exclusive access to intestinal Ugt2b1 whereas the hepatically derived morphine was
shunted away from these enzymes in the intestine due to segregated flow. Furthermore, the
excess amount of M3G formed in the intestine from codeine oral administration can only be
subject to urinary or luminal excretion but not biliary excretion due to the membrane barrier
present for M3G arriving the liver systemically. This was reflected by the observed and
simulated (by the TM and SFM) greater amount of M3G excreted in the urine after oral
administration of codeine compared to the i.v case (Table 3-6 and Fig. 3-11). On the other hand,
since hepatically formed M3G is excreted into the bile, the amounts of M3G excreted into the
bile after oral and i.v. dosing of codeine were similar (Table 3-6).
In this study, two mechanistic whole body PBPK models were developed for the
sequential metabolism of codeine to morphine then to M3G to validate the SFM and discriminate
it from the TM. To construct the model, different compartments for various organs and tissues
were incorporated and interconnected with designated blood flows (Table 3-7). Within the
metabolizing organs, absorption/degradation rate constants as well as influx/efflux, intrinsic
metabolic and secretory clearances were included to describe the ADME of the parent drug and
its metabolites (Table 3-8). For the nonmetabolizing organs/tissues, tissue-to-blood partition
coefficients (RT) were applied to account for drug/metabolites disposition (Table 3-9). Two
approaches were used to secure data to test the established PBPK models for codeine sequential
metabolism. First, the PK parameters involved in the disposition of morphine and its metabolite
M3G after oral and i.v. morphine dosing were obtained from the literature and optimized based
on morphine/M3G blood concentration-time profiles from the literature (Figs. 3-7 and 3-8).
64
64
Second, using the established morphine/M3G PK parameters combined with the codeine PK
parameters estimated from the published studies, simulations describing codeine sequential
metabolism were performed (Figs. 3-9 and 3-10). Eventually, the model parameters for codeine
sequential metabolism were finalized.
Our rat data, together with those from the literature, were used for the development of
the PBPK model and for optimization of the various parameters. Our rat PK study on codeine
sequential metabolism successfully furnished the primary (morphine) and secondary (M3G)
metabolites data following codeine i.v./oral dosing. The AUCM3G/AUCmorphine ratio appears to be
a good indicator for model discrimination. From the codeine PK studies on the rat in vivo for
both oral and i.v. administration, it was observed that the AUC’s of morphine and M3G, as well
as the AUCM3G/AUCmorphine ratio following codeine i.v. administration were significantly less
than that from the oral case (Table 3-10). The AUCM3G/AUCmorphine ratios predicted by the SFM
exhibited similar oral vs. i.v. difference as the observations in the rat in vivo studies. On the
contrary, the TM predicted that the AUCM3G/AUCmorphine ratios were similar for both oral and
i.v. administration and failed to correlate with the observed data. With the aforementioned
explanation that only the morphine formed in the intestine undergo intestinal glucuronidation to
form M3G due to segregated intestinal blood flow, it is not difficult to comprehend and
anticipate the difference between [AUCM3G/AUCmorphine]oral and [AUCM3G/AUCmorphine]i.v. .
Another aspect for model discrimination is the residual sum of squares (RSS)
between the predicted and the observed data. It was shown that the SFM yielded a smaller RSS
compared to the TM in describing benzoic acid metabolism in the recirculating, vascularly
perfused, rat small intestine preparation (Cong et al., 2001). This trend was again noted for the
present rat codeine PK studies with whole body PBPK models. These observations strongly
65
65
suggest that the SFM is more appropriate in describing codeine sequential metabolism compared
to the TM in the rat in vivo.
It was also observed that the predictive power of our PBPK models for codeine
sequential metabolism using the Scientist® simulator was greater than that from Simcyp®
because Simcyp® was unable to predict PK profiles of secondary metabolites in sequential
metabolism since the simulation platform does not include/allow for the designation of
physicochemical properties of the secondary metabolite. Also, Simcyp® may not be as precise to
predict metabolite formation from phase II enzymes since it lacks information (i.e. abundance,
activity, etc.) for UGT2B7, SULTs, or GSTs.
To sum up, our PBPK models that were tailored to sequential metabolism is superior
to the Simcyp® models and the SFM was better than the TM in predicting codeine sequential
metabolism in the rat. The AUCM3G/AUCmoprhine ratios after both i.v. and p.o. codeine
administration are useful to distinguish between the TM and SFM of data obtained from the rat.
3.6 Statement of Significance of Chapter 3
This chapter has illustrated, in details, the theories and strategies behind building a
tailor-made whole body PBPK model to describe drug and metabolites disposition. The
harvested literature data on codeine/morphine PK studies on rat, the calculations of the various
RT values, together with the data obtained from rat codeine PK studies in vivo, served as a solid
platform for investigating and validating the SFM and showing its superiority over the TM. The
evidence attests that the SFM is the improved model for predicting drug and metabolites
disposition. This is especially important if active or reactive metabolites are formed and when
metabolite kinetics is required in metabolite-in-safety testing. In addition, the established rat
66
66
whole body PBPK model for codeine sequential metabolism and relevant predictions generated
during the model validation process can provide tremendous information to facilitate the
prediction of sequential metabolism in man, especially when data from the human PK studies are
incomplete (Chapter 4).
Although codeine/morphine were chosen as probe drugs for this investigation because
of existing data on morphine metabolism in perfused rat intestine/liver preparation from our
laboratory, the resulting, developed whole body PBPK model is not restricted to
codeine/morphine only. With sufficient information from the literature, another set of PBPK
parameters can be harvested and used as the input for simulation for other drugs. The evidence
mounted from this study showed that the SFM is more suitable for predicting the intestinal
absorption of drugs.
67
67
4
MODELING AND SIMULATION OF
SEQUENTIAL METABOLISM OF CODEINE TO
MORPHINE AND M3G IN MAN
68
68
4.1 Abstract
The PBPK model encompassing absorption, metabolism and transport developed to
describe the sequential metabolism of codeine to morphine and morphine 3β-glucuronide (M3G)
in the rat (Chapter 3) was modified to describe similar data in man. As shown in Chapter 3 for
the rat whole body PBPK modeling, the traditional intestinal model (TM) and segregated-flow
model (SFM) for absorption were fortified with the liver and kidney compartment as well as the
highly and poorly perfused and adipose tissues for construction of whole body PBPK models,
with tissue to blood partition coefficients calculated according to Rodgers and Rowland, 2007.
Parameters for transmembrane permeability and intrinsic clearances for metabolism and
transport/secretion for morphine and M3G were optimized with the Scientist® simulator to
predict literature data after oral (p.o.) and intravenous (i.v.) morphine then codeine
administration in man. The parameters for morphine were optimized then assigned to optimize
the codeine parameters to predict the literature data after codeine p.o. and i.v. dosing. The
Simcyp® simulator was also used to perform the same optimization processes. We also
investigated the effect of fm’ (fractional formation clearance of morphine from codeine) on the
AUCM3G/AUCmorphine ratio as an index for discrimination between the TM and SFM. The
predicted AUCM3G/AUCmorphine ratios for the TM after p.o. and i.v. codeine dosing were similar,
whereas that for the SFM after p.o. dosing greatly exceeded the ratio after i.v. dosing. The
observed AUCM3G/AUCmorphine ratios from human codeine oral administration were closer to the
SFM prediction and were significantly different from the TM prediction. Moreover, a greater
difference between the [AUCM3G/AUCmorphine]p.o and [AUCM3G/AUCmorphine]i.v ratio existed for
the SFM, especially when the fm’ was low. To sum up, SFM was found to be superior to TM in
predicting codeine sequential metabolism in man. It was also concluded that our tailored PBPK
69
69
models based on Scientist® were superior over those from Simcyp® for the description of
codeine sequential metabolism due to inherent limitations of Simcyp®.
4.2 Introduction
The absorption of orally administered drug requires diffusion of the drug molecule
through the intestinal cell such as enterocytes before reaching the systemic circulation (Rowland,
1972; Pang, 2003). However, these cells contain a number of transporters and enzymes that may
affect drug disposition. These include the intestinal efflux transporters such as the P-glycoprotein
(P-gp), the multidrug resistance associated protein 2 (MRP2) and the breast cancer resistance
protein (BCRP), and absorptive transporters such as the oligopeptide transporter 1 (PEPT1) and
organic anion transporting polypeptide (OATP2B1), as well as enzymes including cytochrome
P450 3A (CYP3A), sulfotransferases (SULT) and UDP-glucuronosyltransferases (UGT) (Dubey
and Singh, 1988; Tsuji and Tamai, 1996; Lin et al., 1999; Pang, 2003). Hence, systemic
bioavailability, or fraction of the oral dose that reaches systemic circulation intact, is greatly
affected by intestinal transporters and enzymes (Kwan, 1997).
Route-dependent intestinal metabolism occurs with a greater extent of metabolism for
orally administrated drug as compared to the drug administrated intravenously (Pang et al., 1985;
Pang et al., 1986; Doherty and Pang, 2000). The traditional intestinal PBPK model (TM) (Fig. 1-
4B) which regards the intestine as a single, homogeneous compartment that is subdivided into
the vascular, cellular and luminal subcompartments, was found to be inadequate to explain the
notable glucuronidation of morphine given orally but the lack of it with systemic dosing in the
perfused rat intestine preparation (Cong et al., 2000). On the contrary, the “route-dependent”
metabolism of morphine was well depicted by the PBPK model that includes segregated blood
70
70
flows to the enterocyte and serosal regions (segregated-flow model, SFM) (Fig. 1-4A). Because
of the much lower blood flow entering the enterocyte region, less metabolism would result for
drugs given systemically than orally. Many other examples of route-dependent intestinal
metabolism have been noted (for review, see Pang, 2003). For this reason, the virtual clinical
simulator, Simcyp® utilizes a much reduced blood flow rate to the intestine (30-40%) to describe
intestinal drug clearance (Yang et al., 2007).
The SFM has not been extensively used to model drug kinetics due to its complexity
and limited drug examples. The narcotic analgesic, codeine, is one of the few examples available
that yields sequential metabolites, morphine and M3G, which can be modeled to discriminate
between the SFM and TM. Codeine is a prodrug that forms morphine, which acts on the µ-
opiate receptor to exert the analgesic effect (Kirchheiner et al., 2007). The metabolism of
codeine to morphine occurs mainly in the liver by CYP2D6 in human, and subsequent
glucuronidation of morphine by human UGT2B7 to morphine glucuronide occurs in both the
liver and intestine (Sawe et al., 1985; Yue et al., 1991a; Yue and Sawe, 1997; Caraco et al.,
1999; Ammon et al., 2000; Kim et al., 2002; Lotsch et al., 2006). Both codeine and morphine are
lipophilic and can penetrate into cells in the organ easily (Xie et al., 1999; Doherty and Pang,
2000; Kharasch et al., 2003). Morphine is regarded as a substrate of P-gp in the intestine, across
BBB and possibly in the liver (Letrent et al., 1999a; Letrent et al., 1999b; Crowe, 2002;
Kharasch et al., 2003). On the other hand, codeine is not transported by P-gp and passively
diffuses through the blood brain barrier or BBB to exert its pharmacological effects (Xie et al.,
1999; Hau et al., 2004; Cunningham et al., 2008). Morphine glucuronide is far too hydrophilic to
enter cells, but can be rapidly excreted into bile by MRP2 or effluxed into blood by MRP3 when
formed in the liver (Doherty and Pang, 2000; Doherty et al., 2006; van de Wetering et al., 2007).
71
71
In the previous chapter, model discrimination between the SFM and the TM was
conducted by whole body PBPK modeling on the rat. It has been observed from the literature
and experimental data that the extent of morphine glucuronidation was affected by different
route of administration (i.v. vs. oral) due to the segregated intestinal blood flow. The SFM was
more accurate than the TM in describing codeine sequential metabolism in the rat. In this chapter,
the superiority of the SFM over TM will be appraised for codeine sequential metabolism using
human whole body PBPK modeling. Since CYP2D6 exists at relatively low levels in the
intestine compared to the liver (Madani et al., 1999), formation of morphine is expected to occur
primarily in the liver. Although morphine glucuronidation can occur in both the intestine and the
liver, the existence of segregated intestinal blood flow tend to divert the hepatically-derived
morphine (from codeine given i.v. or p.o.) away from the intestine, and any morphine that has re-
entered the circulation will be sequentially metabolized to morphine glucuronide primarily in the
liver, even though UGT2B7 exists in the intestine. Hence, after codeine i.v. or oral
administration, the SFM predicts that the formation of M3G from morphine is less than that
predicted by the TM, especially for codeine intravenous administration.
4.3 Methods
4.3.1 Literature Data Collecting and Processing
The strategy for developing a specific PBPK model for codeine/morphine metabolism
was to first obtain values of pertinent PBPK parameters from the literature. This required
calculation based on literature data for each of the studies. Literature data were collected from a
number of human pharmacokinetic studies on codeine and morphine metabolism after i.v. and
oral dosing with graphical plasma profiles. We used the software, PDF Measure It® (Traction
Software Inc.), to help obtained plasma concentration values from graphical figures of plasma
72
72
concentration time profile from previous studies. After correction for the molecular weight
differences among codeine, morphine and M3G, the plasma concentration data were all
converted to blood concentrations [blood/plasma concentration ratio x plasma concentration for
codeine and morphine, and (1-hematocrit) x plasma concentration for M3G] to the unit of nM.
Lastly, these re-expressed blood data were normalized to per unit dose (nM/nmol of dose) for the
expression of all data sets from different studies wherein difference doses were given.
4.3.2 Modeling
Two whole body PBPK models (with intestinal TM or SFM) were developed to
describe the kinetics of codeine and metabolites from previous in vivo studies (primary
metabolite morphine; secondary metabolite M3G) in man (assuming 70 kg body weight). Similar
to the models (Fig. 3-2) used in Chapter 3, the blood compartment represents the total volume of
the blood from venous and arterial vessels which interconnect all the organs and tissue
compartments. The intestinal compartment, the focus of this study, includes three and five
subcompartments for the TM (Fig. 3-2A) and the SFM (Fig. 3-2B), respectively. For the TM, the
intestine is subdivided into the vascular (intestinal blood), cellular (tissue), and luminal
subcompartments with the total intestinal blood flow from superior mesenteric artery (QSMA,
which is assumed to equal QPV, the blood flow of portal vein, in value for the purpose of
simplification) perfusing the entire intestinal tissue. For the SFM, the intestine is subdivided into
the serosa, serosal blood, mucosal blood, enterocyte and luminal subcompartments (Fig. 3-2B).
The intestinal blood flow is segregated, with only 10% of the QSMA (named as QENB) perfusing
the enterocyte region that is rich in enzymes and transporters while the remaining 90% of the
QSMA (QSB) flows through the nonmetabolizing or inert serosa layer of the intestine. The liver
compartment is important for codeine metabolism (Fig.3-2). The exchange of substrate between
73
73
the liver tissue and liver blood is described by the intrinsic transport clearance terms, Hd1CL
and Hd2CL , respectively. The metabolic and biliary secretion activities within the liver tissue
compartment are denoted by the intrinsic clearances, Hint,metCL and H
int,secCL , respectively. There
are two lumped compartments built according to the blood flow rate and partition coefficient of
each organ/tissue: the first one represents highly perfused tissue/organs including the brain and
the heart and the second is the “poorly perfused tissue” consisting of the skin, the bone, and the
muscle. In addition, an adipose tissue compartment is present as an individual compartment that
is closely aligned but different from other poorly perfused tissue due to its distinctive tissue to
blood partition coefficient (Table 4-4). Mass balance equations were developed to describe
events occurring during the traverse of drug/metabolites across each compartment (Appendix).
4.3.2.1 Parameter Estimation
Constant physiological parameters (V, Q and fB). The values of human
tissue/organ volumes and blood flows as well as fraction of drug unbound in blood (fB) were
based on various literature sources (Table 4-2). For lumped compartments, the volumes and the
blood flow were taken as the summation of individual tissue/organ.
Absorption rate constant (ka). The absorption rate constant ka (min-1) for both
codeine and morphine were approximated by curve stripping or the Loo-Riegelman loop (Loo
and Riegelman, 1968) using the blood concentration-time curve for codeine/morphine
intravenous administration from the literature.
Clearances terms (CLR, CLd1, CLd2, CLint,met , CLint,sec). The values of renal
clearance (CLR) for codeine, morphine and M3G were obtained directly from the literature and
converted to the same unit: ml/min/70 kg body weight, which is also the unit for all other
clearance terms. Intrinsic clearances terms are denoted with superscript I for the intestine and H
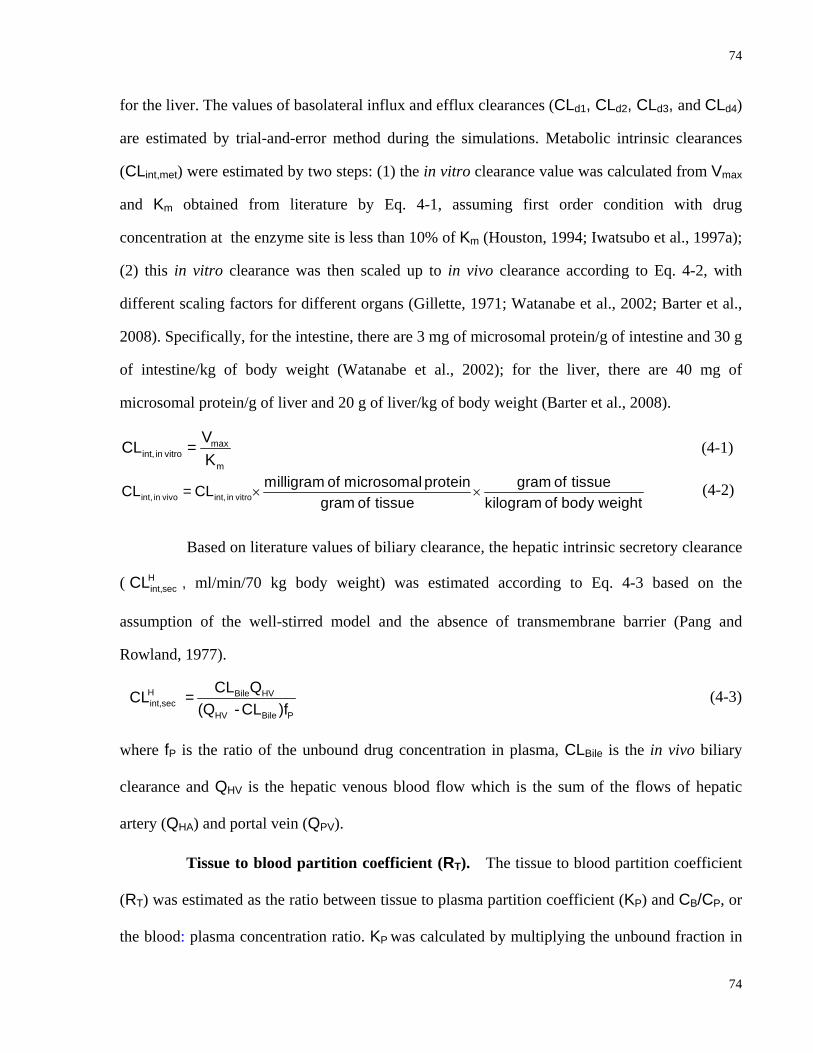
74
74
for the liver. The values of basolateral influx and efflux clearances (CLd1, CLd2, CLd3, and CLd4)
are estimated by trial-and-error method during the simulations. Metabolic intrinsic clearances
(CLint,met) were estimated by two steps: (1) the in vitro clearance value was calculated from Vmax
and Km obtained from literature by Eq. 4-1, assuming first order condition with drug
concentration at the enzyme site is less than 10% of Km (Houston, 1994; Iwatsubo et al., 1997a);
(2) this in vitro clearance was then scaled up to in vivo clearance according to Eq. 4-2, with
different scaling factors for different organs (Gillette, 1971; Watanabe et al., 2002; Barter et al.,
2008). Specifically, for the intestine, there are 3 mg of microsomal protein/g of intestine and 30 g
of intestine/kg of body weight (Watanabe et al., 2002); for the liver, there are 40 mg of
microsomal protein/g of liver and 20 g of liver/kg of body weight (Barter et al., 2008).
maxint, in vitro
m
VCL =K
(4-1)
int, in vivo int, in vitromilligram of microsomal protein gram of tissueCL = CL
gram of tissue kilogram of body weight× × (4-2)
Based on literature values of biliary clearance, the hepatic intrinsic secretory clearance
( Hint,secCL , ml/min/70 kg body weight) was estimated according to Eq. 4-3 based on the
assumption of the well-stirred model and the absence of transmembrane barrier (Pang and
Rowland, 1977).
H Bile HV int,sec
HV Bile P
CL QCL = (Q -CL )f
(4-3)
where fP is the ratio of the unbound drug concentration in plasma, CLBile is the in vivo biliary
clearance and QHV is the hepatic venous blood flow which is the sum of the flows of hepatic
artery (QHA) and portal vein (QPV).
Tissue to blood partition coefficient (RT). The tissue to blood partition coefficient
(RT) was estimated as the ratio between tissue to plasma partition coefficient (KP) and CB/CP, or
the blood: plasma concentration ratio. KP was calculated by multiplying the unbound fraction in
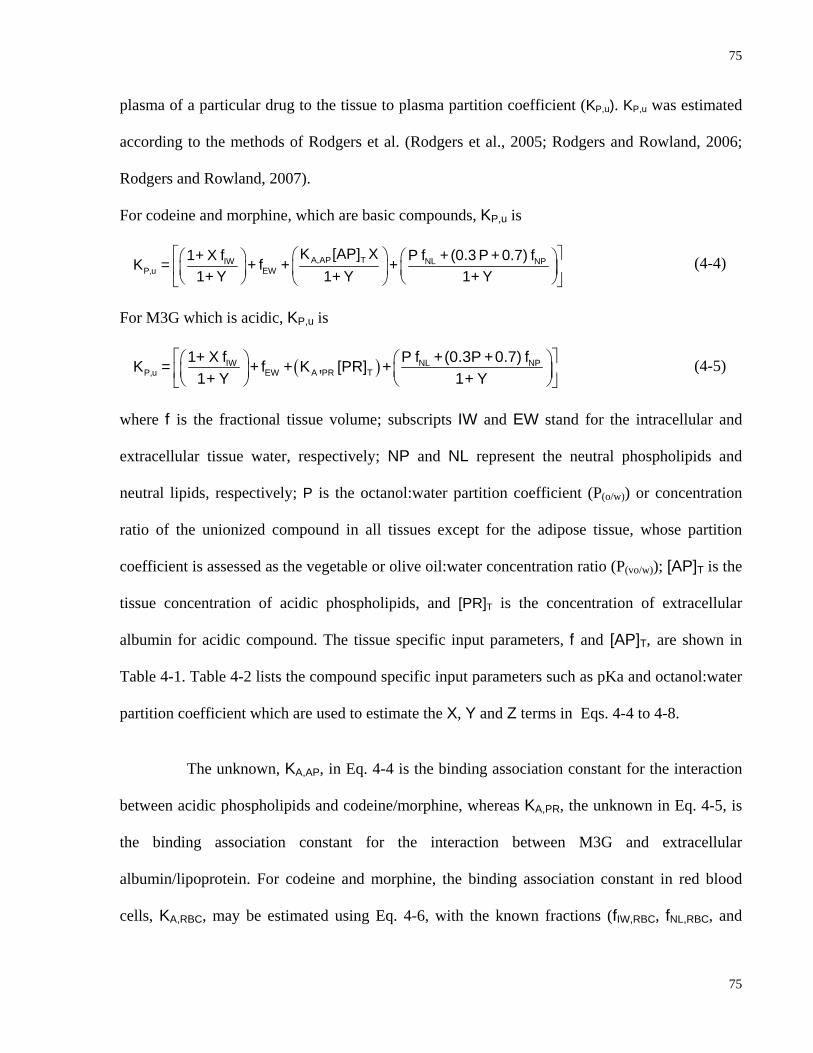
75
75
plasma of a particular drug to the tissue to plasma partition coefficient (KP,u). KP,u was estimated
according to the methods of Rodgers et al. (Rodgers et al., 2005; Rodgers and Rowland, 2006;
Rodgers and Rowland, 2007).
For codeine and morphine, which are basic compounds, KP,u is
⎡ ⎤⎛ ⎞⎛ ⎞ ⎛ ⎞⎢ ⎥⎜ ⎟⎜ ⎟ ⎜ ⎟⎝ ⎠ ⎝ ⎠⎝ ⎠⎣ ⎦
A,AP TIW NL NPP,u EW
K [AP] X1+ X f P f + (0.3 P + 0.7) fK = + f + +1+ Y 1+ Y 1+ Y
(4-4)
For M3G which is acidic, KP,u is
( )⎡ ⎤⎛ ⎞ ⎛ ⎞⎜ ⎟ ⎜ ⎟⎢ ⎥⎝ ⎠ ⎝ ⎠⎣ ⎦
IW NL NPP,u EW A PR T
1+ X f P f +(0.3P +0.7) fK = + f + K , [PR] +1 + Y 1 + Y
(4-5)
where f is the fractional tissue volume; subscripts IW and EW stand for the intracellular and
extracellular tissue water, respectively; NP and NL represent the neutral phospholipids and
neutral lipids, respectively; P is the octanol:water partition coefficient (P(o/w)) or concentration
ratio of the unionized compound in all tissues except for the adipose tissue, whose partition
coefficient is assessed as the vegetable or olive oil:water concentration ratio (P(vo/w)); [AP]T is the
tissue concentration of acidic phospholipids, and [PR]T is the concentration of extracellular
albumin for acidic compound. The tissue specific input parameters, f and [AP]T, are shown in
Table 4-1. Table 4-2 lists the compound specific input parameters such as pKa and octanol:water
partition coefficient which are used to estimate the X, Y and Z terms in Eqs. 4-4 to 4-8.
The unknown, KA,AP, in Eq. 4-4 is the binding association constant for the interaction
between acidic phospholipids and codeine/morphine, whereas KA,PR, the unknown in Eq. 4-5, is
the binding association constant for the interaction between M3G and extracellular
albumin/lipoprotein. For codeine and morphine, the binding association constant in red blood
cells, KA,RBC, may be estimated using Eq. 4-6, with the known fractions (fIW,RBC, fNL,RBC, and
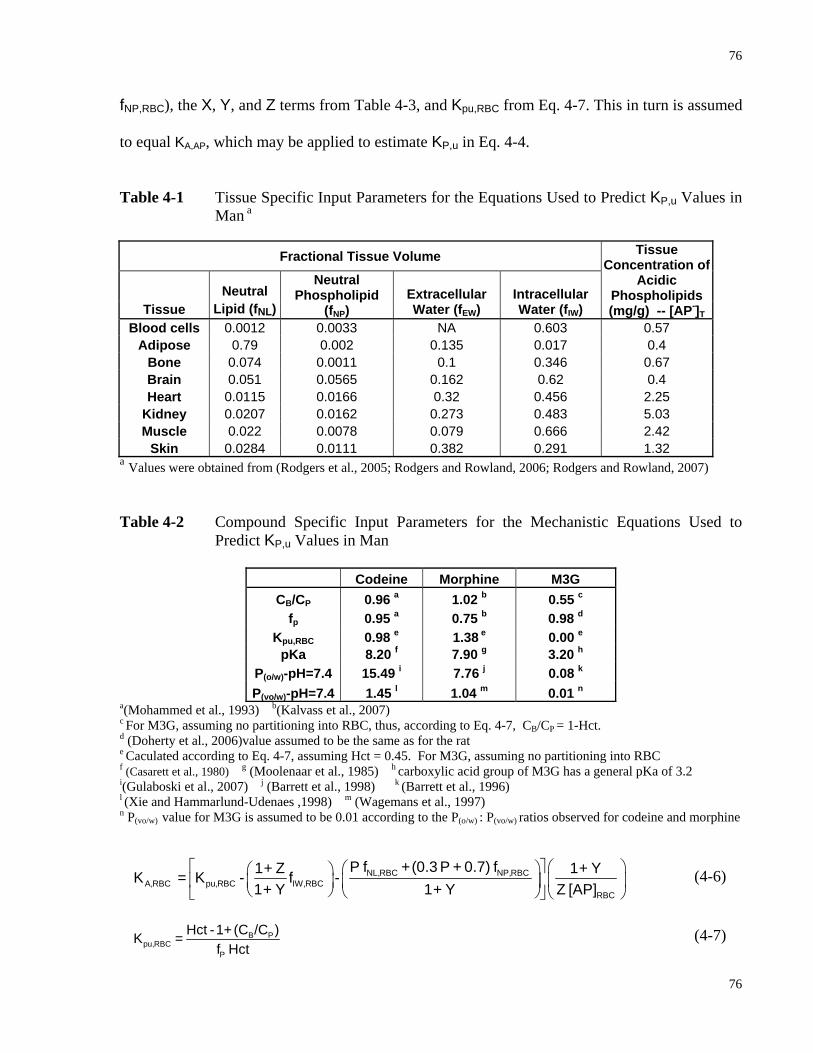
76
76
fNP,RBC), the X, Y, and Z terms from Table 4-3, and Kpu,RBC from Eq. 4-7. This in turn is assumed
to equal KA,AP, which may be applied to estimate KP,u in Eq. 4-4.
Table 4-1 Tissue Specific Input Parameters for the Equations Used to Predict KP,u Values in Man a
Fractional Tissue Volume
Tissue Neutral
Lipid (fNL)
Neutral Phospholipid
(fNP) Extracellular Water (fEW)
Intracellular Water (fIW)
Tissue Concentration of
Acidic Phospholipids (mg/g) -- [AP-]T
Blood cells 0.0012 0.0033 NA 0.603 0.57 Adipose 0.79 0.002 0.135 0.017 0.4
Bone 0.074 0.0011 0.1 0.346 0.67 Brain 0.051 0.0565 0.162 0.62 0.4 Heart 0.0115 0.0166 0.32 0.456 2.25
Kidney 0.0207 0.0162 0.273 0.483 5.03 Muscle 0.022 0.0078 0.079 0.666 2.42
Skin 0.0284 0.0111 0.382 0.291 1.32 a Values were obtained from (Rodgers et al., 2005; Rodgers and Rowland, 2006; Rodgers and Rowland, 2007) Table 4-2 Compound Specific Input Parameters for the Mechanistic Equations Used to
Predict KP,u Values in Man
Codeine Morphine M3G CB/CP 0.96 a 1.02 b 0.55 c
fp 0.95 a 0.75 b 0.98 d Kpu,RBC 0.98 e 1.38 e 0.00 e
pKa 8.20 f 7.90 g 3.20 h P(o/w)-pH=7.4 15.49 i 7.76 j 0.08 k P(vo/w)-pH=7.4 1.45 l 1.04 m 0.01 n
a(Mohammed et al., 1993) b(Kalvass et al., 2007) c For M3G, assuming no partitioning into RBC, thus, according to Eq. 4-7, CB/CP = 1-Hct. d (Doherty et al., 2006)value assumed to be the same as for the rat e Caculated according to Eq. 4-7, assuming Hct = 0.45. For M3G, assuming no partitioning into RBC f (Casarett et al., 1980) g (Moolenaar et al., 1985) h carboxylic acid group of M3G has a general pKa of 3.2
i(Gulaboski et al., 2007) j (Barrett et al., 1998) k (Barrett et al., 1996) l (Xie and Hammarlund-Udenaes ,1998) m (Wagemans et al., 1997) n P(vo/w) value for M3G is assumed to be 0.01 according to the P(o/w) : P(vo/w) ratios observed for codeine and morphine
⎡ ⎤ ⎛ ⎞⎛ ⎞⎛ ⎞⎜ ⎟⎢ ⎥⎜ ⎟ ⎜ ⎟
⎝ ⎠ ⎝ ⎠ ⎝ ⎠⎣ ⎦NL,RBC NP,RBC
A,RBC pu,RBC IW,RBCRBC
P f +(0.3 P + 0.7) f1 + Z 1 + YK = K - f -1 + Y 1 + Y Z [AP]
(4-6)
B P
pu,RBCP
Hct -1+ (C /C )K =f Hct
(4-7)
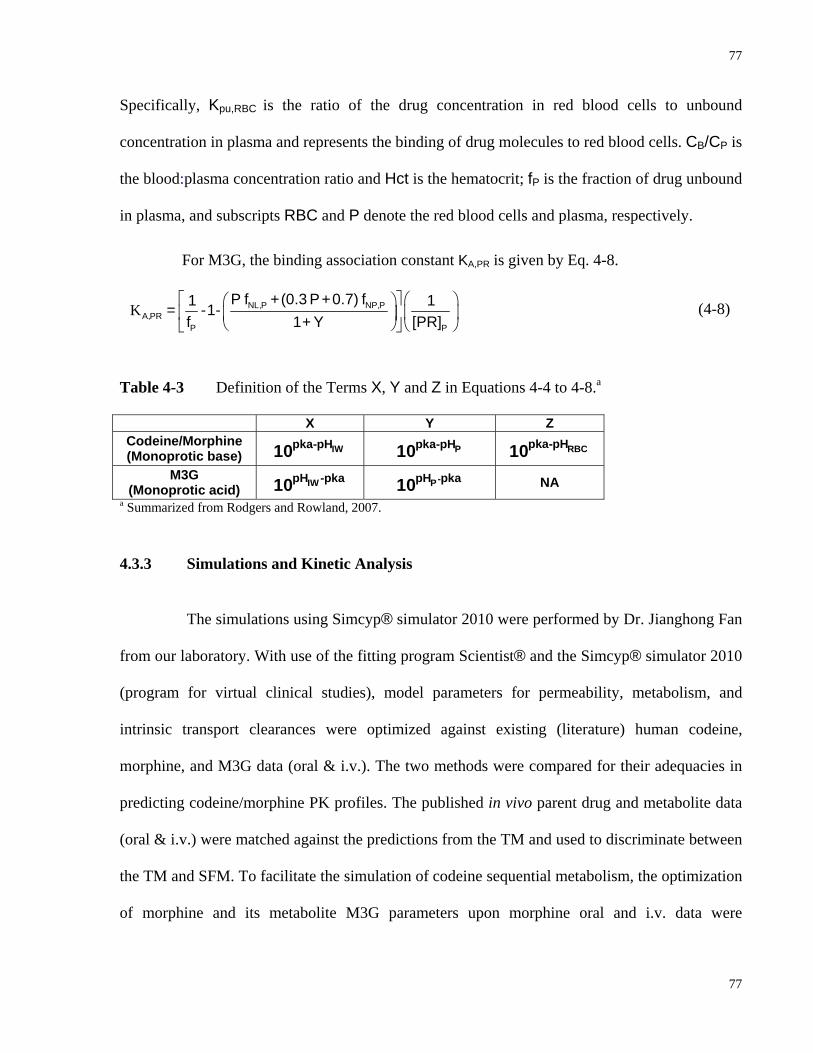
77
77
Specifically, Kpu,RBC is the ratio of the drug concentration in red blood cells to unbound
concentration in plasma and represents the binding of drug molecules to red blood cells. CB/CP is
the blood:plasma concentration ratio and Hct is the hematocrit; fP is the fraction of drug unbound
in plasma, and subscripts RBC and P denote the red blood cells and plasma, respectively.
For M3G, the binding association constant KA,PR is given by Eq. 4-8.
K⎡ ⎤ ⎛ ⎞⎛ ⎞
⎜ ⎟⎢ ⎥⎜ ⎟⎝ ⎠ ⎝ ⎠⎣ ⎦
NL,P NP,PA,PR
P P
P f +(0.3 P+0.7) f1 1= -1-f 1 + Y [PR]
(4-8)
Table 4-3 Definition of the Terms X, Y and Z in Equations 4-4 to 4-8.a
X Y Z Codeine/Morphine (Monoprotic base) IWpka-pH10 Ppka-pH10 RBCpka-pH10
M3G (Monoprotic acid) IWpH -pka10 -PpH pka10 NA
a Summarized from Rodgers and Rowland, 2007.
4.3.3 Simulations and Kinetic Analysis
The simulations using Simcyp® simulator 2010 were performed by Dr. Jianghong Fan
from our laboratory. With use of the fitting program Scientist® and the Simcyp® simulator 2010
(program for virtual clinical studies), model parameters for permeability, metabolism, and
intrinsic transport clearances were optimized against existing (literature) human codeine,
morphine, and M3G data (oral & i.v.). The two methods were compared for their adequacies in
predicting codeine/morphine PK profiles. The published in vivo parent drug and metabolite data
(oral & i.v.) were matched against the predictions from the TM and used to discriminate between
the TM and SFM. To facilitate the simulation of codeine sequential metabolism, the optimization
of morphine and its metabolite M3G parameters upon morphine oral and i.v. data were
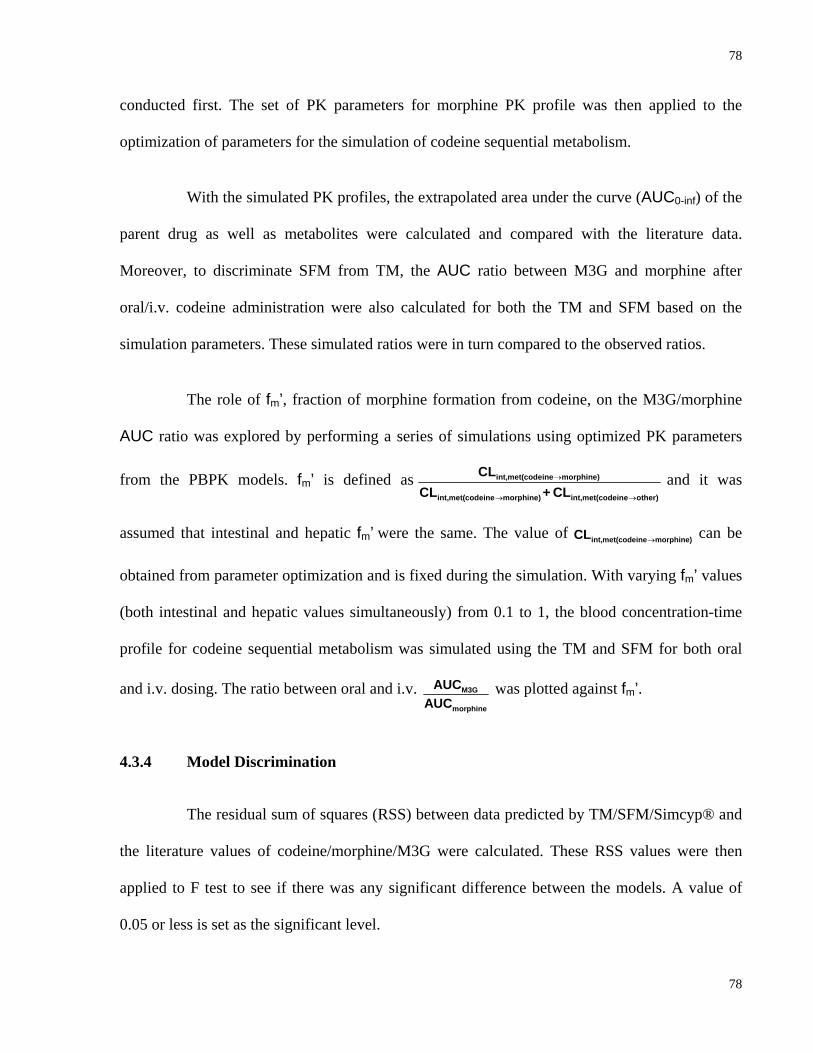
78
78
conducted first. The set of PK parameters for morphine PK profile was then applied to the
optimization of parameters for the simulation of codeine sequential metabolism.
With the simulated PK profiles, the extrapolated area under the curve (AUC0-inf) of the
parent drug as well as metabolites were calculated and compared with the literature data.
Moreover, to discriminate SFM from TM, the AUC ratio between M3G and morphine after
oral/i.v. codeine administration were also calculated for both the TM and SFM based on the
simulation parameters. These simulated ratios were in turn compared to the observed ratios.
The role of fm’, fraction of morphine formation from codeine, on the M3G/morphine
AUC ratio was explored by performing a series of simulations using optimized PK parameters
from the PBPK models. fm’ is defined as int,met(codeine morphine)
int,met(codeine morphine) int,met(codeine other)
CLCL + CL
→
→ →
and it was
assumed that intestinal and hepatic fm’ were the same. The value of int,met(codeine morphine)CL → can be
obtained from parameter optimization and is fixed during the simulation. With varying fm’ values
(both intestinal and hepatic values simultaneously) from 0.1 to 1, the blood concentration-time
profile for codeine sequential metabolism was simulated using the TM and SFM for both oral
and i.v. dosing. The ratio between oral and i.v. M3G
morphine
AUCAUC
was plotted against fm’.
4.3.4 Model Discrimination
The residual sum of squares (RSS) between data predicted by TM/SFM/Simcyp® and
the literature values of codeine/morphine/M3G were calculated. These RSS values were then
applied to F test to see if there was any significant difference between the models. A value of
0.05 or less is set as the significant level.
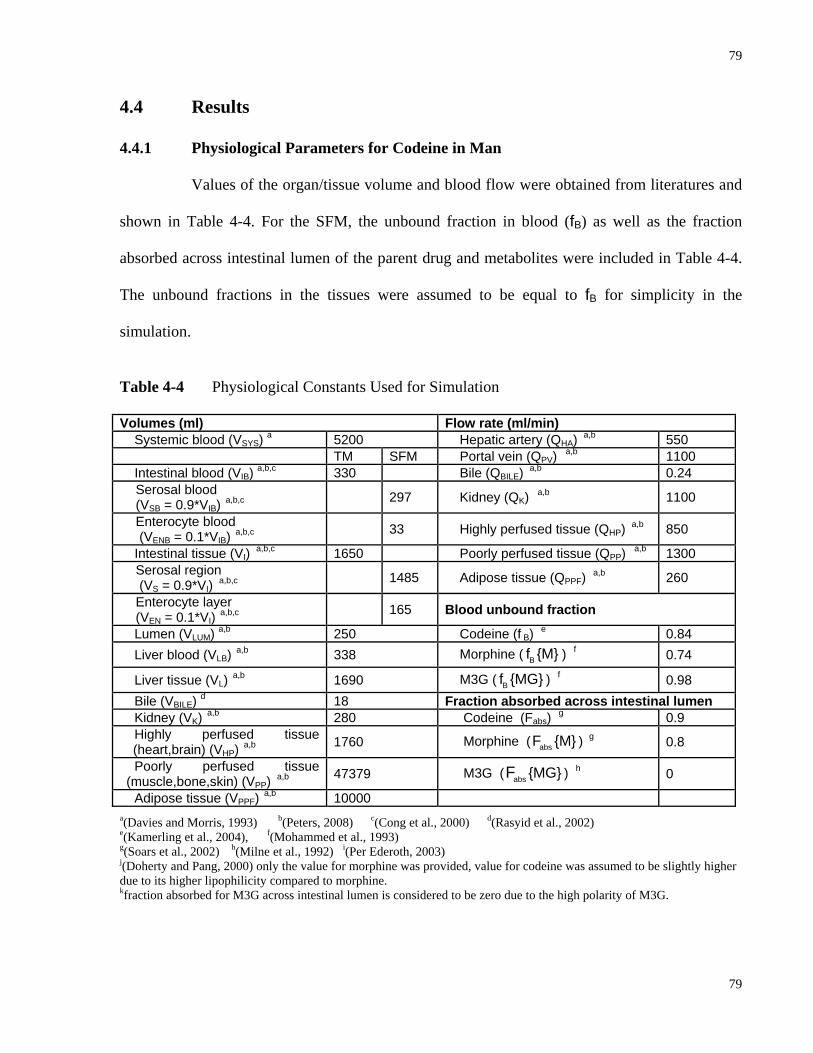
79
79
4.4 Results
4.4.1 Physiological Parameters for Codeine in Man
Values of the organ/tissue volume and blood flow were obtained from literatures and
shown in Table 4-4. For the SFM, the unbound fraction in blood (fB) as well as the fraction
absorbed across intestinal lumen of the parent drug and metabolites were included in Table 4-4.
The unbound fractions in the tissues were assumed to be equal to fB for simplicity in the
simulation.
Table 4-4 Physiological Constants Used for Simulation
Volumes (ml) Flow rate (ml/min) Systemic blood (VSYS) a 5200 Hepatic artery (QHA) a,b 550 TM SFM Portal vein (QPV) a,b 1100 Intestinal blood (VIB) a,b,c 330 Bile (QBILE) a,b 0.24
Serosal blood (VSB = 0.9*VIB) a,b,c 297 Kidney (QK) a,b 1100
Enterocyte blood (VENB = 0.1*VIB) a,b,c 33 Highly perfused tissue (QHP) a,b 850
Intestinal tissue (VI) a,b,c 1650 Poorly perfused tissue (QPP) a,b 1300 Serosal region (VS = 0.9*VI) a,b,c 1485 Adipose tissue (QPPF) a,b 260
Enterocyte layer (VEN = 0.1*VI) a,b,c 165 Blood unbound fraction
Lumen (VLUM) a,b 250 Codeine (f B) e 0.84 Liver blood (VLB) a,b 338 Morphine ( Bf {M} ) f 0.74
Liver tissue (VL) a,b 1690 M3G ( Bf {MG} ) f 0.98 Bile (VBILE) d 18 Fraction absorbed across intestinal lumen Kidney (VK) a,b 280 Codeine (Fabs) g 0.9 Highly perfused tissue
(heart,brain) (VHP) a,b 1760 Morphine ( absF {M} ) g 0.8
Poorly perfused tissue (muscle,bone,skin) (VPP) a,b 47379 M3G ( abs {MG}F ) h 0
Adipose tissue (VPPF) a,b 10000 a(Davies and Morris, 1993) b(Peters, 2008) c(Cong et al., 2000) d(Rasyid et al., 2002)
e(Kamerling et al., 2004), f(Mohammed et al., 1993)
g(Soars et al., 2002) h(Milne et al., 1992) i(Per Ederoth, 2003) j(Doherty and Pang, 2000) only the value for morphine was provided, value for codeine was assumed to be slightly higher due to its higher lipophilicity compared to morphine. kfraction absorbed for M3G across intestinal lumen is considered to be zero due to the high polarity of M3G.
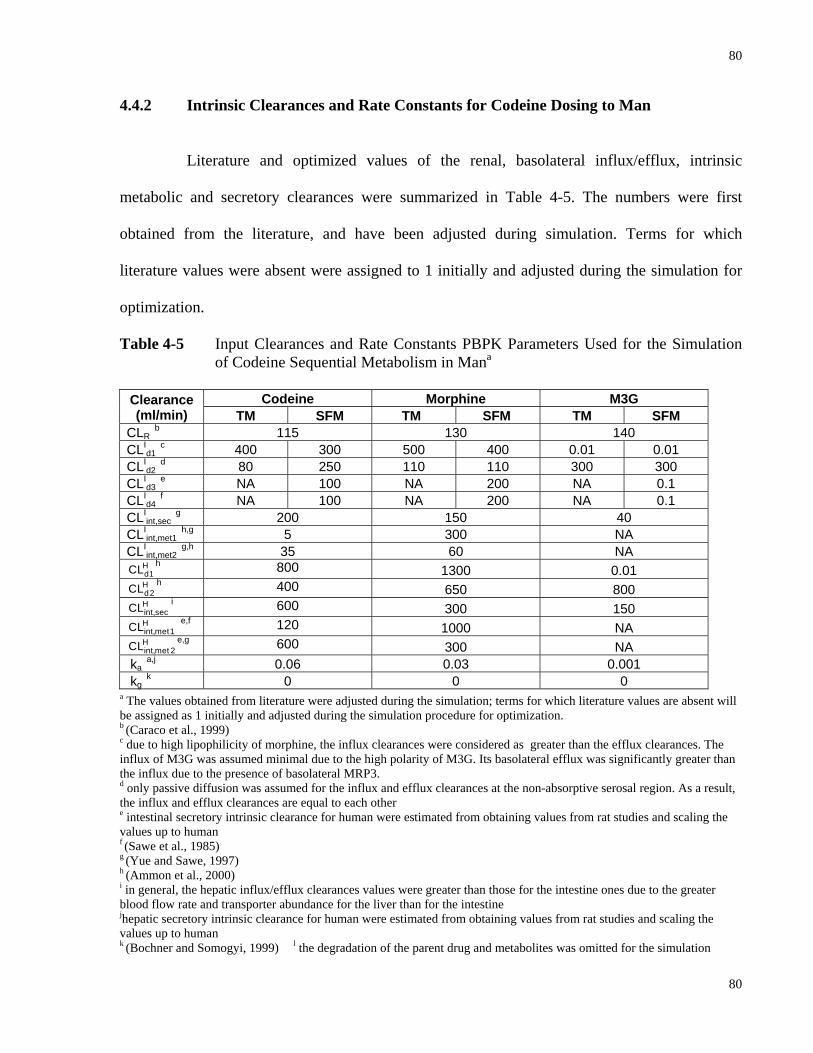
80
80
4.4.2 Intrinsic Clearances and Rate Constants for Codeine Dosing to Man
Literature and optimized values of the renal, basolateral influx/efflux, intrinsic
metabolic and secretory clearances were summarized in Table 4-5. The numbers were first
obtained from the literature, and have been adjusted during simulation. Terms for which
literature values were absent were assigned to 1 initially and adjusted during the simulation for
optimization.
Table 4-5 Input Clearances and Rate Constants PBPK Parameters Used for the Simulation of Codeine Sequential Metabolism in Mana
Codeine Morphine M3G Clearance
(ml/min) TM SFM TM SFM TM SFM CLR
b 115 130 140 CLI
d1 c 400 300 500 400 0.01 0.01
CLId2
d 80 250 110 110 300 300 CLI
d3 e NA 100 NA 200 NA 0.1
CLId4
f NA 100 NA 200 NA 0.1 CLI
int,sec g 200 150 40
CLIint,met1
h,g 5 300 NA CLI
int,met2 g,h 35 60 NA
Hd1CL h 800 1300 0.01 Hd2CL h 400 650 800 Hint,secCL i 600 300 150 Hint,met1CL e,f 120 1000 NA Hint,met 2CL e,g 600 300 NA
ka a,j 0.06 0.03 0.001
kg k 0 0 0
a The values obtained from literature were adjusted during the simulation; terms for which literature values are absent will be assigned as 1 initially and adjusted during the simulation procedure for optimization. b (Caraco et al., 1999) c due to high lipophilicity of morphine, the influx clearances were considered as greater than the efflux clearances. The influx of M3G was assumed minimal due to the high polarity of M3G. Its basolateral efflux was significantly greater than the influx due to the presence of basolateral MRP3. d only passive diffusion was assumed for the influx and efflux clearances at the non-absorptive serosal region. As a result, the influx and efflux clearances are equal to each other e intestinal secretory intrinsic clearance for human were estimated from obtaining values from rat studies and scaling the values up to human f (Sawe et al., 1985) g (Yue and Sawe, 1997) h (Ammon et al., 2000) i in general, the hepatic influx/efflux clearances values were greater than those for the intestine ones due to the greater blood flow rate and transporter abundance for the liver than for the intestine jhepatic secretory intrinsic clearance for human were estimated from obtaining values from rat studies and scaling the values up to human k (Bochner and Somogyi, 1999) l the degradation of the parent drug and metabolites was omitted for the simulation
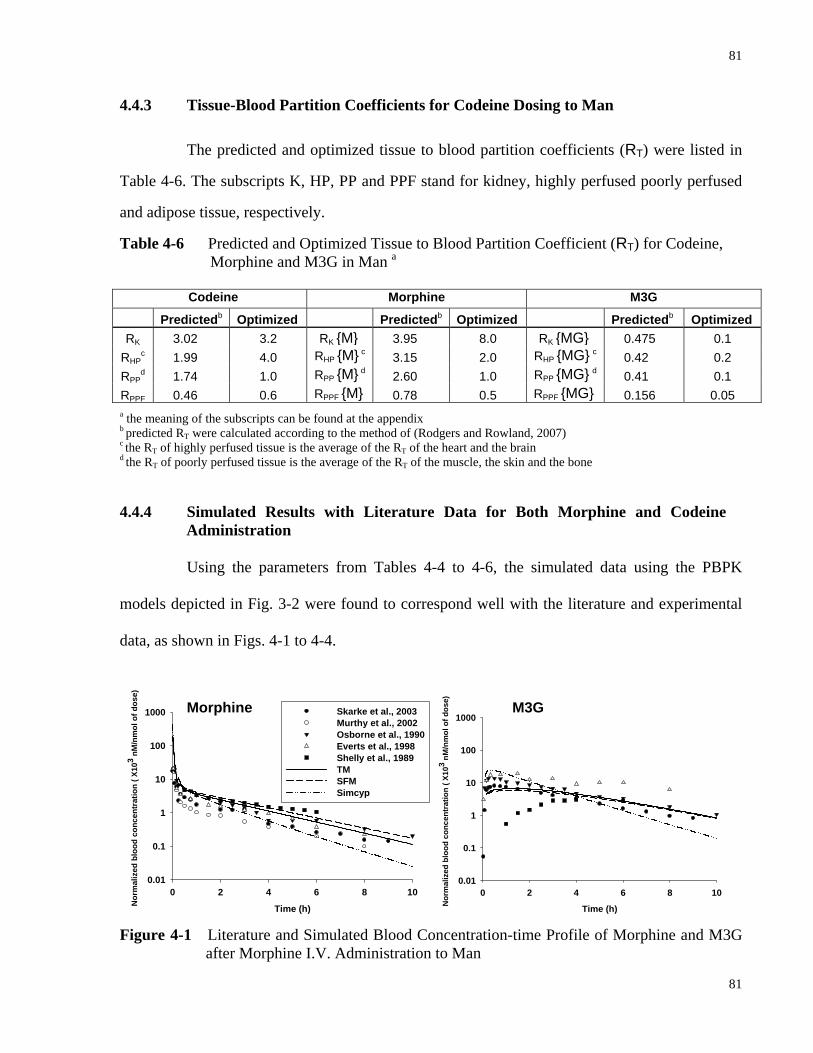
81
81
4.4.3 Tissue-Blood Partition Coefficients for Codeine Dosing to Man
The predicted and optimized tissue to blood partition coefficients (RT) were listed in
Table 4-6. The subscripts K, HP, PP and PPF stand for kidney, highly perfused poorly perfused
and adipose tissue, respectively.
Table 4-6 Predicted and Optimized Tissue to Blood Partition Coefficient (RT) for Codeine, Morphine and M3G in Man a
Codeine Morphine M3G
Predictedb Optimized Predictedb Optimized Predictedb Optimized RK 3.02 3.2 RK {M} 3.95 8.0 RK {MG} 0.475 0.1
RHPc 1.99 4.0 RHP {M} c 3.15 2.0 RHP {MG} c 0.42 0.2
RPPd 1.74 1.0 RPP {M} d 2.60 1.0 RPP {MG} d 0.41 0.1
RPPF 0.46 0.6 RPPF {M} 0.78 0.5 RPPF {MG} 0.156 0.05 a the meaning of the subscripts can be found at the appendix b predicted RT were calculated according to the method of (Rodgers and Rowland, 2007) c the RT of highly perfused tissue is the average of the RT of the heart and the brain d the RT of poorly perfused tissue is the average of the RT of the muscle, the skin and the bone
4.4.4 Simulated Results with Literature Data for Both Morphine and Codeine Administration
Using the parameters from Tables 4-4 to 4-6, the simulated data using the PBPK
models depicted in Fig. 3-2 were found to correspond well with the literature and experimental
data, as shown in Figs. 4-1 to 4-4.
Time (h)
0 2 4 6 8 10
Nor
mal
ized
blo
od c
once
ntra
tion
( X10
3 nM
/nm
ol o
f dos
e)
0.01
0.1
1
10
100
1000 Skarke et al., 2003Murthy et al., 2002Osborne et al., 1990Everts et al., 1998Shelly et al., 1989TMSFMSimcyp
Time (h)
0 2 4 6 8 10
Nor
mal
ized
blo
od c
once
ntra
tion
( X10
3 nM
/nm
ol o
f dos
e)
0.01
0.1
1
10
100
1000
Figure 4-1 Literature and Simulated Blood Concentration-time Profile of Morphine and M3G
after Morphine I.V. Administration to Man
Morphine M3G
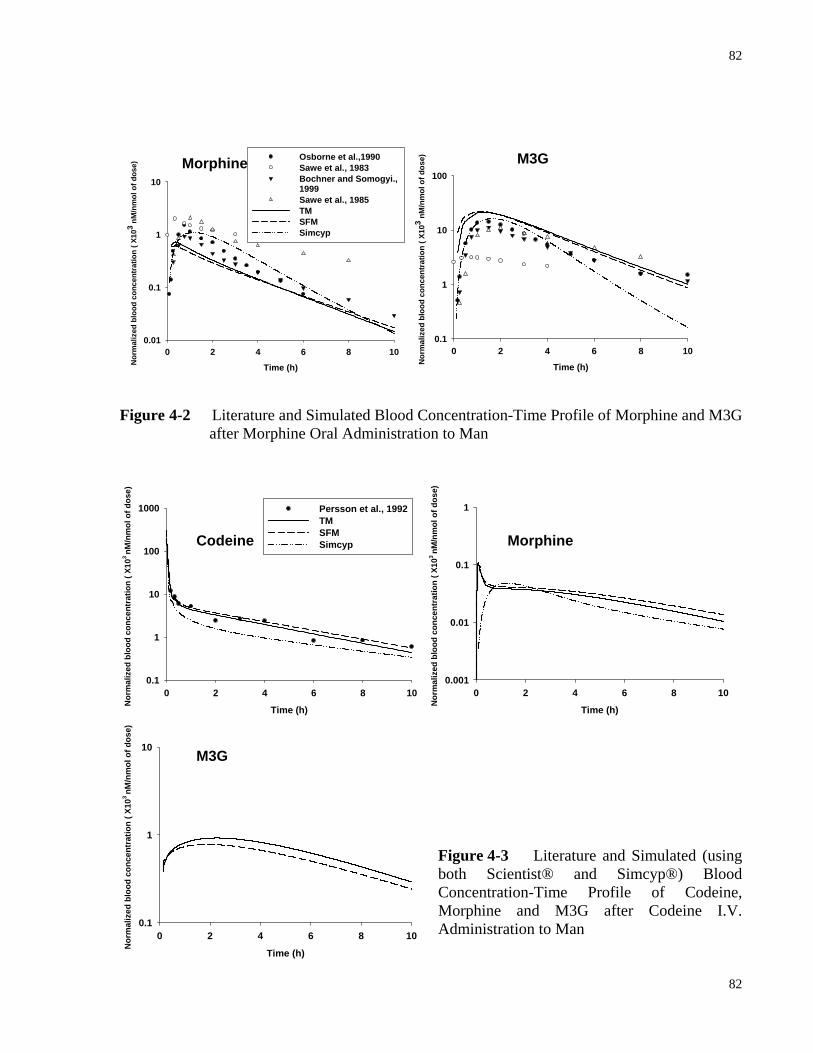
82
82
Time (h)
0 2 4 6 8 10
Nor
mal
ized
blo
od c
once
ntra
tion
( X10
3 nM
/nm
ol o
f dos
e)
0.01
0.1
1
10
Osborne et al.,1990Sawe et al., 1983Bochner and Somogyi., 1999Sawe et al., 1985TMSFMSimcyp
Time (h)
0 2 4 6 8 10
Nor
mal
ized
blo
od c
once
ntra
tion
( X10
3 nM
/nm
ol o
f dos
e)
0.1
1
10
100
Figure 4-2 Literature and Simulated Blood Concentration-Time Profile of Morphine and M3G
after Morphine Oral Administration to Man
Time (h)
0 2 4 6 8 10
Nor
mal
ized
blo
od c
once
ntra
tion
( X10
3 nM
/nm
ol o
f dos
e)
0.1
1
10
100
1000 Persson et al., 1992TMSFM Simcyp
Time (h)
0 2 4 6 8 10
Nor
mal
ized
blo
od c
once
ntra
tion
( X10
3 nM
/nm
ol o
f dos
e)
0.001
0.01
0.1
1
Figure 4-3 Literature and Simulated (using both Scientist® and Simcyp®) Blood Concentration-Time Profile of Codeine, Morphine and M3G after Codeine I.V. Administration to Man Time (h)
0 2 4 6 8 10
Nor
mal
ized
blo
od c
once
ntra
tion
( X10
3 nM
/nm
ol o
f dos
e)
0.1
1
10
Morphine M3G
Codeine Morphine
M3G
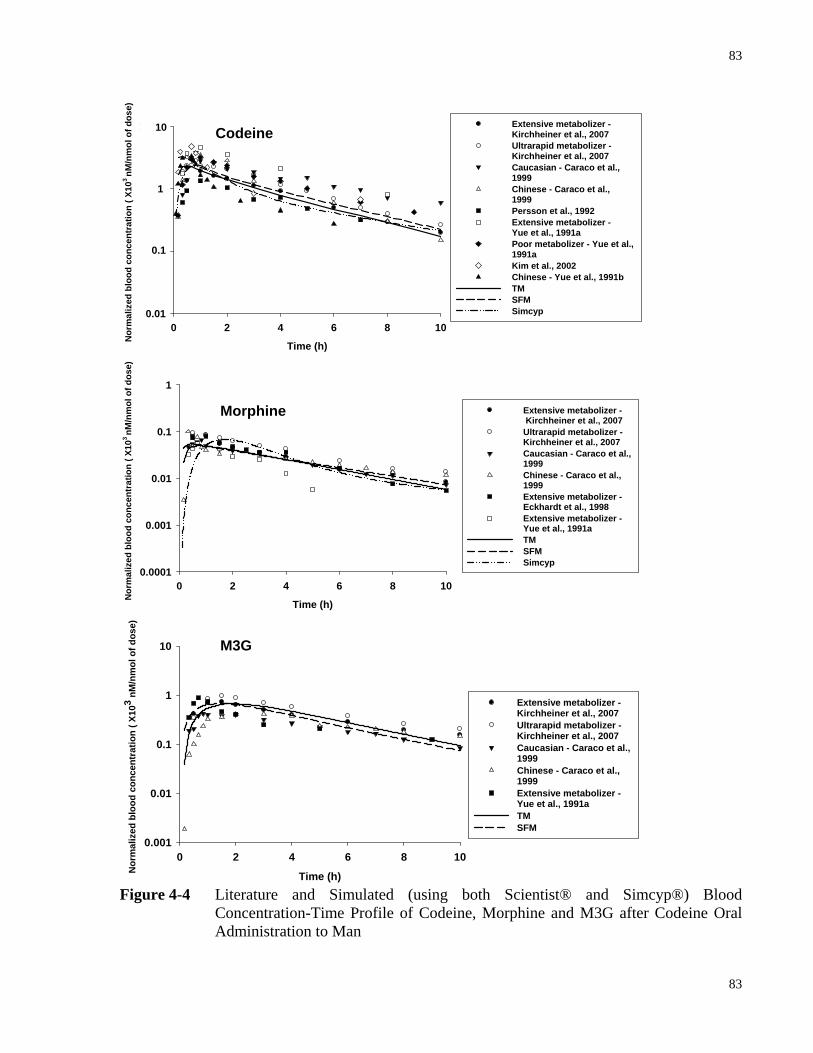
83
83
Time (h)
0 2 4 6 8 10
Nor
mal
ized
blo
od c
once
ntra
tion
( X10
3 nM
/nm
ol o
f dos
e)
0.01
0.10
1.00
10.00 Extensive metabolizer - Kirchheiner et al., 2007Ultrarapid metabolizer - Kirchheiner et al., 2007Caucasian - Caraco et al., 1999Chinese - Caraco et al., 1999Persson et al., 1992Extensive metabolizer - Yue et al., 1991aPoor metabolizer - Yue et al., 1991aKim et al., 2002Chinese - Yue et al., 1991bTMSFMSimcyp
10
1
0.1
Time (h)
0 2 4 6 8 10
Nor
mal
ized
blo
od c
once
ntra
tion
( X10
3 nM
/nm
ol o
f dos
e)
0.0001
0.001
0.01
0.1
1
Extensive metabolizer - Kirchheiner et al., 2007Ultrarapid metabolizer - Kirchheiner et al., 2007Caucasian - Caraco et al., 1999Chinese - Caraco et al., 1999Extensive metabolizer - Eckhardt et al., 1998Extensive metabolizer - Yue et al., 1991aTMSFMSimcyp
Time (h)
0 2 4 6 8 10
Nor
mal
ized
blo
od c
once
ntra
tion
( X10
3 nM
/nm
ol o
f dos
e)
0.001
0.01
0.1
1
10
Extensive metabolizer - Kirchheiner et al., 2007Ultrarapid metabolizer - Kirchheiner et al., 2007Caucasian - Caraco et al., 1999Chinese - Caraco et al., 1999Extensive metabolizer - Yue et al., 1991aTMSFM
Figure 4-4 Literature and Simulated (using both Scientist® and Simcyp®) Blood
Concentration-Time Profile of Codeine, Morphine and M3G after Codeine Oral Administration to Man
Codeine
Morphine
M3G
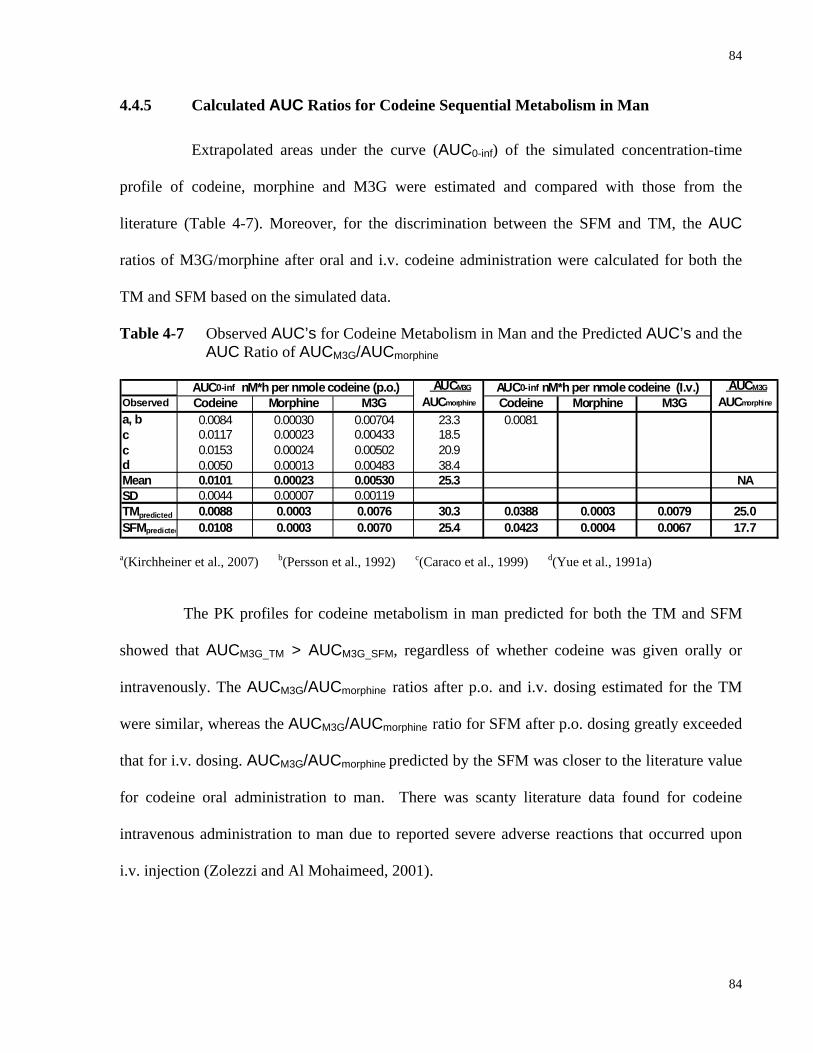
84
84
4.4.5 Calculated AUC Ratios for Codeine Sequential Metabolism in Man
Extrapolated areas under the curve (AUC0-inf) of the simulated concentration-time
profile of codeine, morphine and M3G were estimated and compared with those from the
literature (Table 4-7). Moreover, for the discrimination between the SFM and TM, the AUC
ratios of M3G/morphine after oral and i.v. codeine administration were calculated for both the
TM and SFM based on the simulated data.
Table 4-7 Observed AUC’s for Codeine Metabolism in Man and the Predicted AUC’s and the AUC Ratio of AUCM3G/AUCmorphine
AUCM3G AUCM3G
Observed Codeine Morphine M3G AUCmorphine Codeine Morphine M3G AUCmorphine
a, b 0.0084 0.00030 0.00704 23.3 0.0081c 0.0117 0.00023 0.00433 18.5c 0.0153 0.00024 0.00502 20.9d 0.0050 0.00013 0.00483 38.4Mean 0.0101 0.00023 0.00530 25.3 NASD 0.0044 0.00007 0.00119TMpredicted 0.0088 0.0003 0.0076 30.3 0.0388 0.0003 0.0079 25.0SFMpredicted 0.0108 0.0003 0.0070 25.4 0.0423 0.0004 0.0067 17.7
AUC0-inf nM*h per nmole codeine (p.o.) AUC0-inf nM*h per nmole codeine (I.v.)
a(Kirchheiner et al., 2007) b(Persson et al., 1992) c(Caraco et al., 1999) d(Yue et al., 1991a)
The PK profiles for codeine metabolism in man predicted for both the TM and SFM
showed that AUCM3G_TM > AUCM3G_SFM, regardless of whether codeine was given orally or
intravenously. The AUCM3G/AUCmorphine ratios after p.o. and i.v. dosing estimated for the TM
were similar, whereas the AUCM3G/AUCmorphine ratio for SFM after p.o. dosing greatly exceeded
that for i.v. dosing. AUCM3G/AUCmorphine predicted by the SFM was closer to the literature value
for codeine oral administration to man. There was scanty literature data found for codeine
intravenous administration to man due to reported severe adverse reactions that occurred upon
i.v. injection (Zolezzi and Al Mohaimeed, 2001).
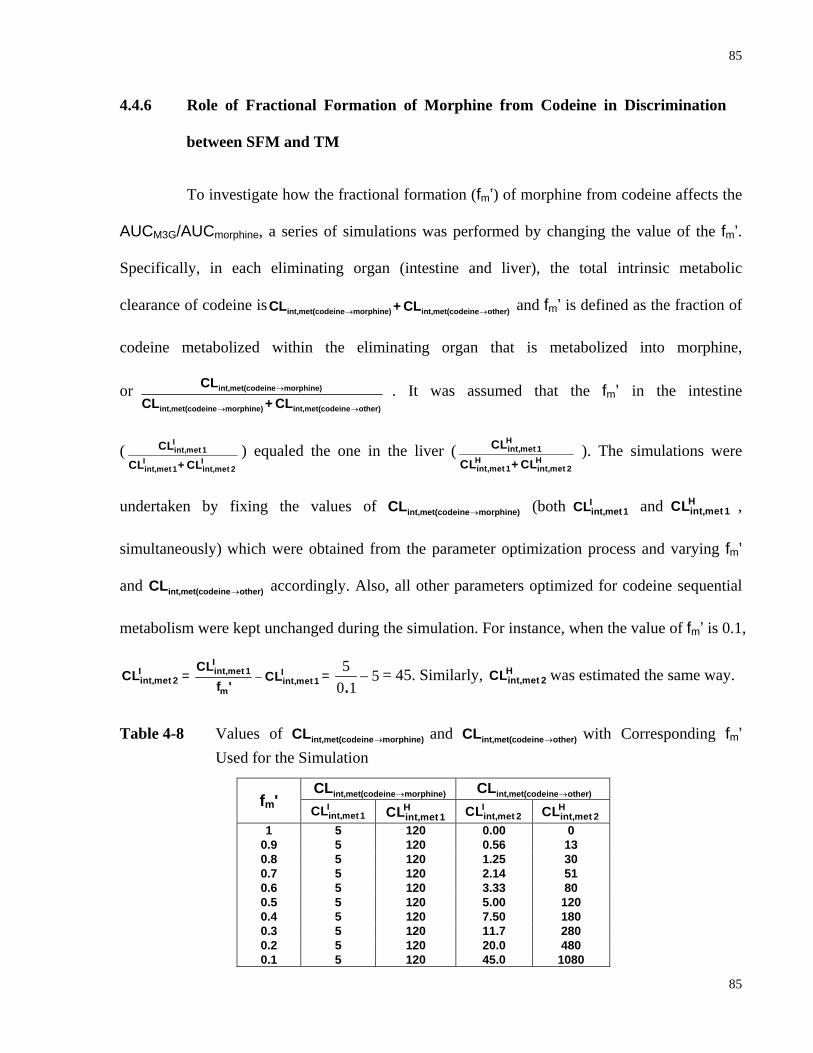
85
85
4.4.6 Role of Fractional Formation of Morphine from Codeine in Discrimination
between SFM and TM
To investigate how the fractional formation (fm’) of morphine from codeine affects the
AUCM3G/AUCmorphine, a series of simulations was performed by changing the value of the fm’.
Specifically, in each eliminating organ (intestine and liver), the total intrinsic metabolic
clearance of codeine is int,met(codeine morphine) int,met(codeine other)CL + CL→ → and fm’ is defined as the fraction of
codeine metabolized within the eliminating organ that is metabolized into morphine,
or int,met(codeine morphine)
int,met(codeine morphine) int,met(codeine other)
CLCL + CL
→
→ →
. It was assumed that the fm’ in the intestine
(Iint,met 1
I Iint,met 1 int,met 2
CLCL + CL
) equaled the one in the liver (Hint,met 1
H Hint,met 1 int,met 2
CLCL + CL
). The simulations were
undertaken by fixing the values of int,met(codeine morphine)CL → (both Iint,met1CL and H
int,met 1CL ,
simultaneously) which were obtained from the parameter optimization process and varying fm’
and int,met(codeine other)CL → accordingly. Also, all other parameters optimized for codeine sequential
metabolism were kept unchanged during the simulation. For instance, when the value of fm’ is 0.1,
Iint,met 2CL =
Iint,met 1 I
int,met 1m
CLCL
f '− =
5 50 1.
− = 45. Similarly, Hint,met 2CL was estimated the same way.
Table 4-8 Values of int,met(codeine morphine)CL → and int,met(codeine other)CL → with Corresponding fm’ Used for the Simulation
int,met(codeine morphine)CL → int,met(codeine other)CL → fm' I
int,met 1CL Hint,met 1CL I
int,met 2CL Hint,met 2CL
1 5 120 0.00 0 0.9 5 120 0.56 13 0.8 5 120 1.25 30 0.7 5 120 2.14 51 0.6 5 120 3.33 80 0.5 5 120 5.00 120 0.4 5 120 7.50 180 0.3 5 120 11.7 280 0.2 5 120 20.0 480 0.1 5 120 45.0 1080
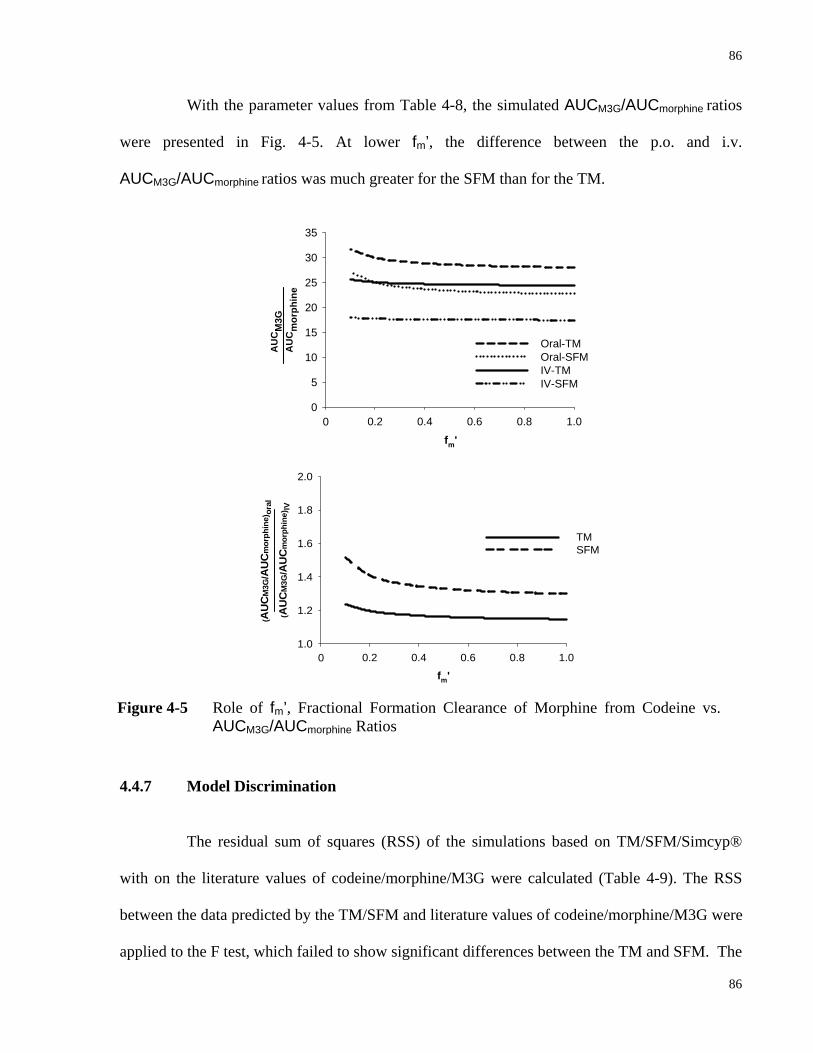
86
86
Figure 4-5 Role of fm’, Fractional Formation Clearance of Morphine from Codeine vs. AUCM3G/AUCmorphine Ratios
With the parameter values from Table 4-8, the simulated AUCM3G/AUCmorphine ratios
were presented in Fig. 4-5. At lower fm’, the difference between the p.o. and i.v.
AUCM3G/AUCmorphine ratios was much greater for the SFM than for the TM.
0.0 0.2 0.4 0.6 0.8 1.0
AU
CM
3GA
UC
mor
phin
e
0
5
10
15
20
25
30
35
Oral-TMOral-SFMIV-TMIV-SFM
0fm'
fm'0.0 0.2 0.4 0.6 0.8 1.0
(AU
CM
3G/A
UC
mor
phin
e)or
al
(AU
CM
3G/A
UC
mor
phin
e)IV
1.0
1.2
1.4
1.6
1.8
2.0
TMSFM
0
4.4.7 Model Discrimination
The residual sum of squares (RSS) of the simulations based on TM/SFM/Simcyp®
with on the literature values of codeine/morphine/M3G were calculated (Table 4-9). The RSS
between the data predicted by the TM/SFM and literature values of codeine/morphine/M3G were
applied to the F test, which failed to show significant differences between the TM and SFM. The
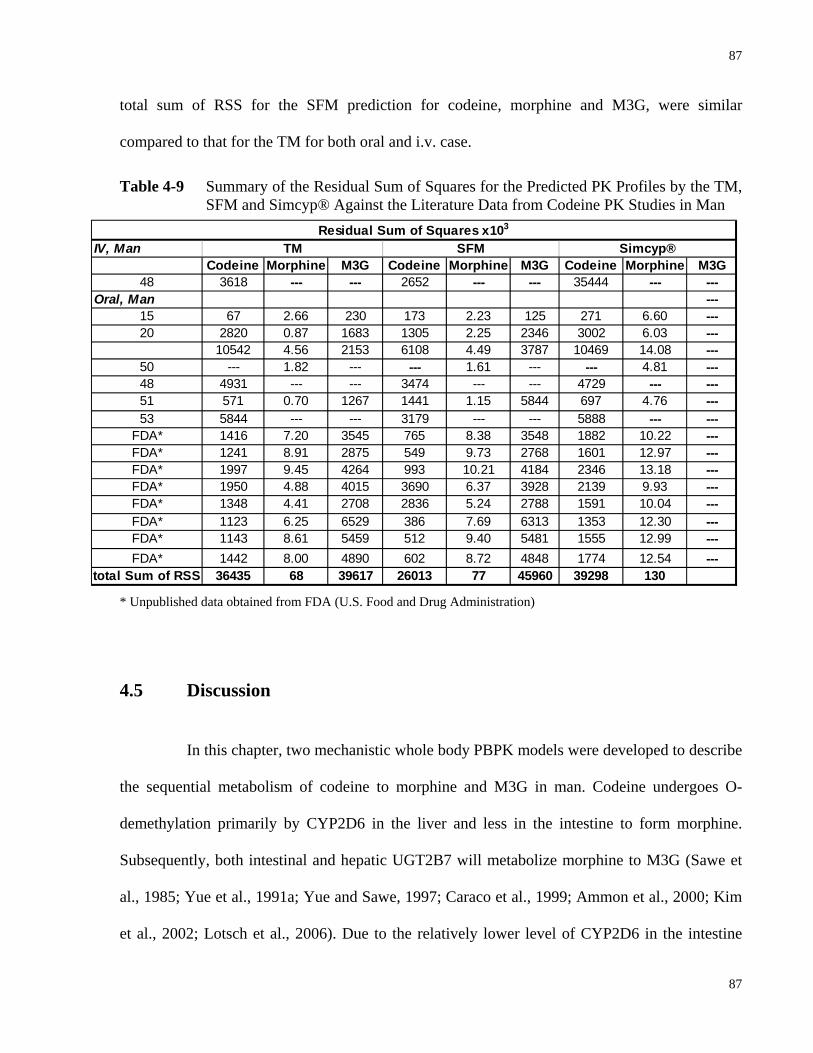
87
87
IV, ManCodeine Morphine M3G Codeine Morphine M3G Codeine Morphine M3G
48 3618 --- --- 2652 --- --- 35444 --- ---Oral, Man ---
15 67 2.66 230 173 2.23 125 271 6.60 ---20 2820 0.87 1683 1305 2.25 2346 3002 6.03 ---
10542 4.56 2153 6108 4.49 3787 10469 14.08 ---50 --- 1.82 --- --- 1.61 --- --- 4.81 ---48 4931 --- --- 3474 --- --- 4729 --- ---51 571 0.70 1267 1441 1.15 5844 697 4.76 ---53 5844 --- --- 3179 --- --- 5888 --- ---
FDA* 1416 7.20 3545 765 8.38 3548 1882 10.22 ---FDA* 1241 8.91 2875 549 9.73 2768 1601 12.97 ---FDA* 1997 9.45 4264 993 10.21 4184 2346 13.18 ---FDA* 1950 4.88 4015 3690 6.37 3928 2139 9.93 ---FDA* 1348 4.41 2708 2836 5.24 2788 1591 10.04 ---FDA* 1123 6.25 6529 386 7.69 6313 1353 12.30 ---FDA* 1143 8.61 5459 512 9.40 5481 1555 12.99 ---FDA* 1442 8.00 4890 602 8.72 4848 1774 12.54 ---
total Sum of RSS 36435 68 39617 26013 77 45960 39298 130
TM SFM Simcyp®Residual Sum of Squares x103
total sum of RSS for the SFM prediction for codeine, morphine and M3G, were similar
compared to that for the TM for both oral and i.v. case.
Table 4-9 Summary of the Residual Sum of Squares for the Predicted PK Profiles by the TM, SFM and Simcyp® Against the Literature Data from Codeine PK Studies in Man
* Unpublished data obtained from FDA (U.S. Food and Drug Administration)
4.5 Discussion
In this chapter, two mechanistic whole body PBPK models were developed to describe
the sequential metabolism of codeine to morphine and M3G in man. Codeine undergoes O-
demethylation primarily by CYP2D6 in the liver and less in the intestine to form morphine.
Subsequently, both intestinal and hepatic UGT2B7 will metabolize morphine to M3G (Sawe et
al., 1985; Yue et al., 1991a; Yue and Sawe, 1997; Caraco et al., 1999; Ammon et al., 2000; Kim
et al., 2002; Lotsch et al., 2006). Due to the relatively lower level of CYP2D6 in the intestine
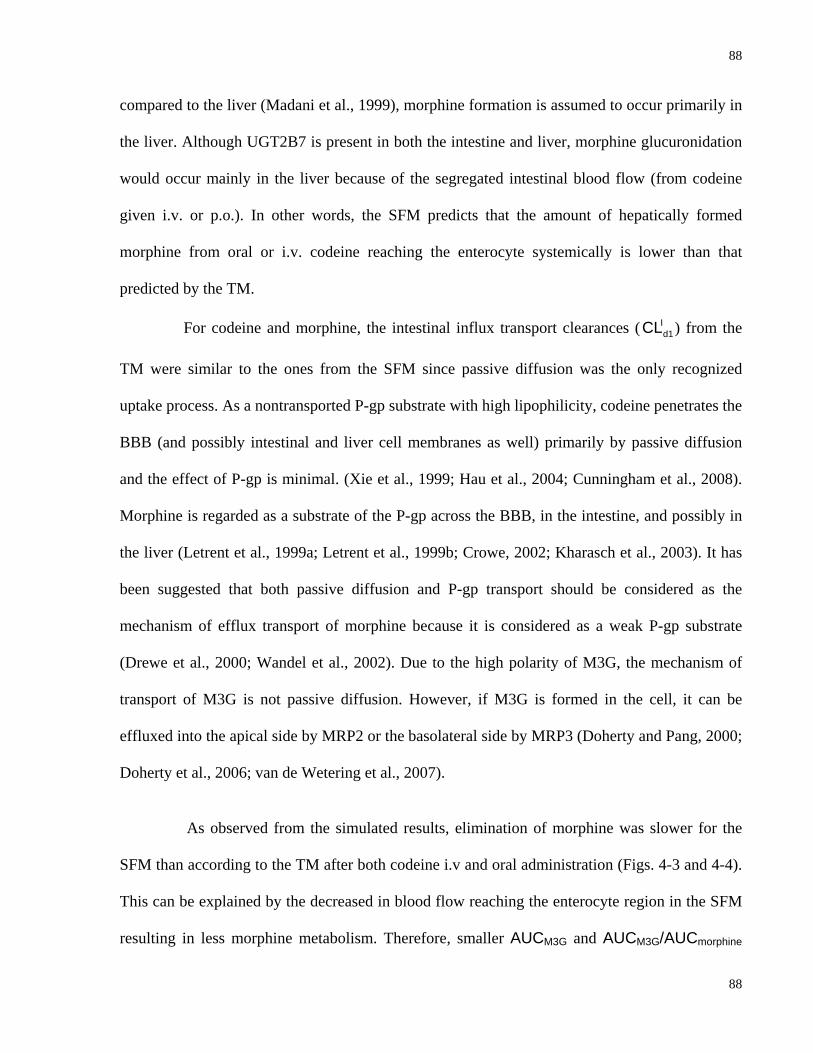
88
88
compared to the liver (Madani et al., 1999), morphine formation is assumed to occur primarily in
the liver. Although UGT2B7 is present in both the intestine and liver, morphine glucuronidation
would occur mainly in the liver because of the segregated intestinal blood flow (from codeine
given i.v. or p.o.). In other words, the SFM predicts that the amount of hepatically formed
morphine from oral or i.v. codeine reaching the enterocyte systemically is lower than that
predicted by the TM.
For codeine and morphine, the intestinal influx transport clearances ( Id1CL ) from the
TM were similar to the ones from the SFM since passive diffusion was the only recognized
uptake process. As a nontransported P-gp substrate with high lipophilicity, codeine penetrates the
BBB (and possibly intestinal and liver cell membranes as well) primarily by passive diffusion
and the effect of P-gp is minimal. (Xie et al., 1999; Hau et al., 2004; Cunningham et al., 2008).
Morphine is regarded as a substrate of the P-gp across the BBB, in the intestine, and possibly in
the liver (Letrent et al., 1999a; Letrent et al., 1999b; Crowe, 2002; Kharasch et al., 2003). It has
been suggested that both passive diffusion and P-gp transport should be considered as the
mechanism of efflux transport of morphine because it is considered as a weak P-gp substrate
(Drewe et al., 2000; Wandel et al., 2002). Due to the high polarity of M3G, the mechanism of
transport of M3G is not passive diffusion. However, if M3G is formed in the cell, it can be
effluxed into the apical side by MRP2 or the basolateral side by MRP3 (Doherty and Pang, 2000;
Doherty et al., 2006; van de Wetering et al., 2007).
As observed from the simulated results, elimination of morphine was slower for the
SFM than according to the TM after both codeine i.v and oral administration (Figs. 4-3 and 4-4).
This can be explained by the decreased in blood flow reaching the enterocyte region in the SFM
resulting in less morphine metabolism. Therefore, smaller AUCM3G and AUCM3G/AUCmorphine
89
89
ratios were predicted by the SFM compared to the TM for both oral and i.v. administration of
codeine.
It was revealed by Sun and Pang that the AUC ratio of formed primary metabolite vs.
the precursor is sensitive to the changes of intrinsic metabolic clearance of primary metabolite
formation (Sun and Pang, 2010). In order to investigate the effect of metabolic intrinsic clearance
for the formation of morphine upon codeine dosing, a series of simulations were performed by
varying the fm’, fractional formation clearance of morphine from codeine. Within each
eliminating organ (the intestine or the liver), fm’ is defined as ratio between the intrinsic
metabolic clearance of codeine to form morphine and the total intrinsic metabolic clearance of
codeine to form all the metabolites. Although this is a complicated factor since the intestine and
liver are tissues arranged serially, and their clearances cannot be summed, the simulated results
can still reveal the general trend of the AUCM3G/AUCmorphine ratio changes by varying the fm’. It
was found that at lower fm’, the difference between the AUCM3G/AUCmorphine ratios following
codeine oral and i.v. administration predicted by the SFM was more dramatic compared to those
predicted by the TM, suggesting the model discrimination power of oral and i.v.
AUCM3G/AUCmorphine ratio is greater at lower fm’.
Although the F test failed to show significant differences between the TM and SFM,
and the residual sum of squares (RSS) between the data predicted by the TM and literature
values of codeine/morphine/M3G were similar to those for the SFM. It has to be noted that only
the data from codeine oral administration was analyzed since data for i.v. dosing was not existent
(Zolezzi and Al Mohaimeed, 2001). As stated in the general hypothesis (Chapter 1), the result
from i.v. codeine administration can yield more significant discrimination between the TM and
SFM than the oral case. Nevertheless, the metabolite data (M3G data) obtained from literatures
90
90
and simulations with codeine oral administration can also be useful for model discrimination.
From Table 4-7, the average AUC ratios between M3G and morphine observed from literature
studies on codeine oral administration to man was closer to values predicted by the SFM and
different from those predicted by the TM. This correspondence suggests the superiority of the
SFM over the TM in predicting codeine sequential metabolism in man.
The predictive power of our tailor-made whole body PBPK models using the
Scientist® simulator was greater than that from Simcyp® for codeine sequential metabolism
because Simcyp® was unable to predict PK profiles of secondary metabolites in sequential
metabolism since the program does not include/allow the designation of physicochemical
properties of the secondary metabolite. In addition, Simcyp® was not as precise to predict
secondary metabolite formation from phase II enzymes since the program lacks the necessary
information on abundance and activity for SULTs, UGTs, or GSTs.
To sum up, our PBPK models that were tailored to sequential metabolism are more
useful compared to the Simcyp® models. The SFM was comparatively slightly more superior to
the TM in predicting codeine sequential metabolism in man. The AUCM3G/AUCmoprhine ratios
after both i.v. and p.o. codeine administration are useful to distinguish between the TM and SFM
with data obtained from humans. More importantly, the smaller the fm’, the better the
discrimination between the predictions of TM and SFM was observed.
4.6 Statement of Significance of Chapter 4
The whole model PBPK modeling developed in this chapter exemplifies how a
mechanistic-based PBPK models may be utilized to precisely describe drug disposition in
91
91
clinical settings. Although codeine/morphine are chosen as probe drugs for the present
investigation, this whole body PBPK model is not restricted to codeine/morphine. Together with
the discoveries from Chapter 3, it is concluded that the SFM integrated with the whole body
PBPK model is more suitable than the TM for predicting ADME of sequentially formed
metabolite(s).
92
92
5
GENERAL DISCUSSION AND CONCLUSION
93
93
It is widely accepted that first-pass removal of orally administered drugs is
profoundly influenced by intestinal transport and metabolism (Kwan, 1997; Pang, 2003). It has
been reported that some orally administered drugs exhibit route-dependent metabolism, with
greater extents of intestinal metabolism occurring following oral administration than after
intravenous dosing (for review, see Pang, 2003). One likely explanation of this “route-dependent
metabolism” phenomenon is that a segregated intestinal blood flow pattern exists with only a
small portion (10%-30%) of the blood flow reaching the enzyme- and transporter-rich enterocyte
region at the mucosal layer, whereas the rest of the blood flow perfuses the non-absorptive, non-
metabolic serosal region (Mailman, 1978; Granger et al., 1980; Schurgers et al., 1984; Cong et
al., 2000). Based on this theory, the physiologically-based SFM was established to depict the
drug disposition in the intestine (Cong et al., 2000). Compared to the traditional PBPK model
(TM), the SFM bears notable differences since its effective perfusion of the
absorptive/metabolic/secretory layer is different compared to that of the TM.
In order to interpret the effect of the mechanistic kinetic in the intestine and liver on
Fsys for orally administered drugs, it is necessary to deconvolute the fraction for intestinal
absorption (Fabs), and the intestinal available (FI) and hepatic available (FH) fractions from the
systemic bioavailability (Fsys). One approach to assess these fractions is by simultaneously
administering isotopically-labeled drug intravenously and unlabeled drug orally to estimate drug
exposure (AUC’s) to obtain Fsys from different routes of administration within the same subject
(Darbar et al., 1997; Darbar et al., 1998). Another method is to compare the AUC following
intraduodenal dosing with the AUC yielded from i.v. injection into the superior mesenteric
artery, portal vein, and peripheral vein (Kwan, 1997). To estimate the AUC’s, blood samples
need to be taken from the peripheral vein, artery and portal vein (Kwan, 1997). However, these
94
94
approaches require complex experimental design and are not suitable in clinical trials. Hence, the
solution to this is to develop whole body PBPK models to simulate data and investigate the
intestinal and hepatic drug kinetics. Moreover, the PBPK models are suitable for describing
sequential metabolism within the formation organs/tissues and possess a remarkable advantage
over compartmental models. Theoretical examinations performed on drug and metabolite
exposure (AUC’s) and systemic bioavailability (Fsys) from whole body PBPK models did reveal
the interrelation of the physiological constants, enzymes and transporters (Sun and Pang, 2010).
Nevertheless, when the intestine and liver are both involved in metabolite formation and
sequential metabolism, the AUC’s are too complex to be presented and analyzed.
In this thesis report, tailor-made whole body PBPK models (with either intestinal TM
or SFM) encompassing ADME were developed to describe the absorption and sequential
metabolism of codeine and the disposition of its metabolites in rat and man. The idea was to
utilize literature data from in vivo PK studies on rat and man to perform PBPK-based simulations
of codeine sequential metabolism considering both the intestine and liver as metabolite formation
and eliminating organs. The collated data were normalized by dose and molecular weight and
transformed to blood concentration-time profiles for the estimation of AUC’s of the drug and its
metabolites. These data were then matched against the predicted PK profiles and AUC’s from
the TM and SFM to verify that the SFM was better than the TM in describing intestinal and
hepatic clearances in sequential metabolism.
Although the SFM has been utilized for fitting and simulation in exploring intestinal
metabolism of benzoic acid (Cong et al., 2001) and digoxin (Liu et al., 2006), model
discrimination/validation of the superiority of the SFM over the TM was not evaluated in the
studies. One major reason was the lack of intestinal metabolite formation and absence of
95
95
metabolite data, which is essential in model discrimination (Cong et al., 2001; Liu et al., 2006).
Because the collated literature results tended to vary from study to study and sometimes lack
data on M3G due to poor assay procedures, we developed a LC-MS/MS assay to measure the
concentrations of codeine, morphine, and M3G. Thereafter, a complete pharmacokinetic study
was performed with i.v. and oral administration of codeine under linear kinetic conditions. The
rat data, together with those from the literature, were used for development of the PBPK model
and for optimization of the various parameters. The same modeling and simulation strategies
were used for the literature data obtained for man. The rat PK study on codeine sequential
metabolism successfully acquired primary (morphine) and secondary (M3G) metabolites data
following codeine i.v./oral dosing. The AUCM3G/AUCmorphine ratios act as powerful indicators
for model discrimination. From the codeine PK studies on the rat in vivo for both oral and i.v.
administration, we observed that the AUCM3G/AUCmorphine ratios predicted by the SFM exhibited
the same oral vs. i.v. difference revealed from the rat in vivo studies. On the contrary, the TM
predicted that the AUCM3G/AUCmorphine ratios were similar for codeine oral and i.v.
administration which failed to correspond with the observed data. With the aforementioned
explanation that only the morphine formed in the intestine would undergo intestinal
glucuronidation to form M3G due to reduced intestinal blood flow to enterocyte region, it is not
difficult to comprehend and anticipate the observed difference between
[AUCM3G/AUCmorphine]oral and [AUCM3G/AUCmorphine]i.v. .
Furthermore, in the theoretical studies performed by Sun and Pang (2010), it was
revealed that intrinsic metabolic clearance for the formation of the primary metabolite is the most
influential determinant for the AUC ratio of formed primary metabolite vs. the precursor. In
order to explore the effect of intrinsic metabolic clearance for the formation of morphine upon
96
96
codeine dosing, a series of simulations by varying the fm’, the fractional formation clearance of
morphine from codeine, were performed. It was shown that the difference between the
AUCM3G/AUCmorphine ratios following codeine oral and i.v. administration predicted by the SFM
was most dramatic at the lower fm’ whereas this difference in AUC ratio predicted by the TM
showed only slight increase at the lower fm’. This implied that the model discrimination power of
oral vs. i.v. AUCM3G/AUCmorphine ratio is more conspicuous when fm’ is low and not high.
Another aspect for model discrimination is the residual sum of squares (RSS)
between the predicted and the observed data. It has been shown that the SFM yielded a smaller
RSS compared to the TM in describing benzoic acid metabolism in the recirculating, vascularly
perfused, rat small intestine preparation (Cong et al., 2001). This trend was again noted for the
present study with whole body PBPK models, especially for the rat studies (see Chapter 3).
These observations strongly suggest that the SFM is more appropriate in describing codeine
sequential metabolism in the rat in vivo compared to the TM.
It was also observed that the predictive power of our PBPK models for codeine
sequential metabolism using the Scientist® simulator was greater than that from Simcyp®
because Simcyp® was unable to predict PK profiles of secondary metabolites of sequential
metabolism since the program does not include/allow for the designation of physicochemical
properties of the secondary metabolite. Also, Simcyp® was not as precise to predict metabolite
formation from phase II enzymes since it lacks information (i.e. abundance, activity, etc.) for
UGT2B7, SULTs, or GSTs.
Drug metabolites may possess significant therapeutic activity or toxicity in some
cases. Hence, preformed metabolite administration may be required during the process of
metabolite-in-safety testing (MIST). However, it has been reported from both theoretical and
97
97
experimental studies that there are discrepancies in the fates of formed and preformed metabolite
when there is sequential handling of the formed primary metabolite within the metabolite
formation organ and other downstream organs (Xu and Pang, 1989; St-Pierre and Pang, 1993;
Chen and Pang, 1997; Pang et al., 2008; Sun and Pang, 2009). The discrepancies in their kinetic
behaviours can be attributed partially to the difference of enzyme/transporter characteristics of
the primary metabolite in each of the organs involved in its formation or further metabolism (Xu
and Pang, 1989; St-Pierre and Pang, 1993; Chen and Pang, 1997; Pang et al., 2008; Sun and
Pang, 2009; Sun and Pang, 2010). Thus, it is very important to investigate metabolite disposition
using advanced and tailor-made whole body PBPK models. To date, little information is at hand
to reveal the best model for examining the disposition of drug and its metabolite. The current
study further showed the appropriateness of PBPK simulations in predicting drug and drug
metabolite(s) behaviours in drug discovery and development. Moreover, the segmental
segregated-flow model (SSFM) is an improved model if the heterogeneity in transporters and
enzymes are to be considered (Tam et al., 2003). Drug and metabolite kinetics need to be
properly described with respect to the organ(s) for metabolite formation and the organ(s) for
sequential metabolism of the metabolite in first-pass organs. The present findings will add
significant information to the intestinal and liver handling of drugs and metabolites, especially
the SFM due to its improved anatomical arrangement of intestinal blood flows to different
intestinal regions. In addition, advanced PBPK modeling and simulation of first–pass removal
should include the SFM and not the TM for better intestinal modeling.
Fig. 4 (Osborne et al., 1990) (Sawe et al., 1983) (Bochner and Somogyi, 1999) (Sawe et al., 1985) (Skarke et al., 2003) (Murthy et al., 2002) (Osborne et al., 1990) (Everts et al., 1998) (Shelly et al., 1989) (Kirchheiner et al., 2007) (Caraco et al., 1999) (Persson et al., 1992) (Yue et al., 1991a) (Kim et al., 2002) (Yue et al., 1991b) (Eckhardt et al., 1998) (Gintzler et al., 1976; Dahlstrom and Paalzow, 1978; Iwamoto et al., 1978; Shah and Mason, 1991; Bhargava and Villar, 1992; Bhargava et al., 1992; Hara et al., 1999) (Persson et al., 1992)
98
98
References Ammon S, von Richter O, Hofmann U, Thon KP, Eichelbaum M and Mikus G (2000) In vitro
interaction of codeine and diclofenac. Drug Metab Dispos 28:1149-1152.
Back DJ and Rogers SM (1987) Review: first-pass metabolism by the gastrointestinal mucosa. Aliment Pharmacol Ther 1:339-357.
Baillie TA, Cayen MN, Fouda H, Gerson RJ, Green JD, Grossman SJ, Klunk LJ, LeBlanc B, Perkins DG and Shipley LA (2002) Drug metabolites in safety testing. Toxicol Appl Pharmacol 182:188-196.
Barter ZE, Chowdry JE, Harlow JR, Snawder JE, Lipscomb JC and Rostami-Hodjegan A (2008) Covariation of human microsomal protein per gram of liver with age: absence of influence of operator and sample storage may justify interlaboratory data pooling. Drug Metab Dispos 36:2405-2409.
Bass L, Robinson P and Bracken AJ (1978) Hepatic elimination of flowing substrates: the distributed model. J Theor Biol 72:161-184.
Bernareggi A and Rowland M (1991) Physiologic modeling of cyclosporin kinetics in rat and man. J Pharmacokinet Biopharm 19:21-50.
Bhargava HN and Villar VM (1992) Pharmacodynamics and pharmacokinetics of intravenously administered morphine in spontaneously hypertensive and normotensive Wistar-Kyoto rats. J Pharmacol Exp Ther 261:290-296.
Bhargava HN, Villar VM, Rahmani NH and Larsen AK (1992) Studies on the possible role of pharmacokinetics in the development of tolerance to morphine in the rat. Gen Pharmacol 23:1199-1204.
Bochner F and Somogyi AA (1999) Comparative pharmacokinetics of two modified-release oral morphine formulations (Reliadol® and Kapanol®) and an immediate-release morphine tablet (Morfin ‘DAK’) in healthy volunteers. Clin Drug Invest 17:59-66.
Boerner U (1975) The metabolism of morphine and heroin in man. Drug Metab Rev 4:39-73.
Boerner U, Roe RL and Becker CE (1974) Detection, isolation and characterization of normorphine and norcodeine as morphine metabolites in man. J Pharm Pharmacol 26:393-398.
Calabrese EJ (1991) Principles of animal extrapolation, pp 142, Lewis Publishers Inc, New York.
Caraco Y, Sheller J and Wood AJ (1999) Impact of ethnic origin and quinidine coadministration on codeine's disposition and pharmacodynamic effects. J Pharmacol Exp Ther 290:413-422.
Chen J and Pang KS (1997) Effect of flow on first-pass metabolism of drugs: single pass studies on 4-methylumbelliferone conjugation in the serially perfused rat intestine and liver preparations. J Pharmacol Exp Ther 280:24-31.
Collins RJ and Weeks JR (1965) Relative potency of codeine, methadone and dihydromorphinone to morphine in self-maintained addict rats. Naunyn Schmiedebergs Arch Exp Pathol Pharmakol 249:509-514.
99
99
Cong D, Doherty M and Pang KS (2000) A new physiologically based, segregated-flow model to explain route-dependent intestinal metabolism. Drug Metab Dispos 28:224-235.
Cong D, Fong AK, Lee R and Pang KS (2001) Absorption of benzoic acid in segmental regions of the vascularly perfused rat small intestine preparation. Drug Metab Dispos 29:1539-1547.
Crouthamel WG, Abolin CR, Hsieh J and Lim JK (1975) Intestinal pH as a factor in selection of animal models for bioavailability testing. J Pharm Sci 64:1726-1727.
Crowe A (2002) The influence of P-glycoprotein on morphine transport in Caco-2 cells. Comparison with paclitaxel. Eur J Pharmacol 440:7-16.
Cunningham CW, Mercer SL, Hassan HE, Traynor JR, Eddington ND and Coop A (2008) Opioids and efflux transporters. Part 2: P-glycoprotein substrate activity of 3- and 6-substituted morphine analogs. J Med Chem 51:2316-2320.
Dahlstrom BE and Paalzow LK (1978) Pharmacokinetic interpretation of the enterohepatic recirculation and first-pass elimination of morphine in the rat. J Pharmacokinet Biopharm 6:505-519.
Darbar D, Dell'Orto S, Morike K, Wilkinson GR and Roden DM (1997) Dietary salt increases first-pass elimination of oral quinidine. Clin Pharmacol Ther 61:292-300.
Darbar D, Fromm MF, Dell'Orto S, Kim RB, Kroemer HK, Eichelbaum M and Roden DM (1998) Modulation by dietary salt of verapamil disposition in humans. Circulation 98:2702-2708.
Davies B and Morris T (1993) Physiological parameters in laboratory animals and humans. Pharm Res 10:1093-1095.
de Lannoy IA, Barker F, 3rd and Pang KS (1993) Formed and preformed metabolite excretion clearances in liver, a metabolite formation organ: studies on enalapril and enalaprilat in the single-pass and recirculating perfused rat liver. J Pharmacokinet Biopharm 21:395-422.
de Lannoy IA, Hirayama H and Pang KS (1990) A physiological model for renal drug metabolism: enalapril esterolysis to enalaprilat in the isolated perfused rat kidney. J Pharmacokinet Biopharm 18:561-587.
Delp MD, Manning RO, Bruckner JV and Armstrong RB (1991) Distribution of cardiac output during diurnal changes of activity in rats. Am J Physiol 261:H1487-1493.
Doherty MM and Pang KS (1997) First-pass effect: significance of the intestine for absorption and metabolism. Drug Chem Toxicol 20:329-344.
Doherty MM and Pang KS (2000) Route-dependent metabolism of morphine in the vascularly perfused rat small intestine preparation. Pharm Res 17:291-298.
Doherty MM, Poon K, Tsang C and Pang KS (2006) Transport is not rate-limiting in morphine glucuronidation in the single-pass perfused rat liver preparation. J Pharmacol Exp Ther 317:890-900.
Drewe J, Ball HA, Beglinger C, Peng B, Kemmler A, Schachinger H and Haefeli WE (2000) Effect of P-glycoprotein modulation on the clinical pharmacokinetics and adverse effects of morphine. Br J Clin Pharmacol 50:237-246.
100
100
Du Souich P, Maurice H and Heroux L (1995) Contribution of the small intestine to the first-pass uptake and systemic clearance of propranolol in rabbits. Drug Metab Dispos 23:279-284.
Dubey RK and Singh J (1988) Localization and characterization of drug-metabolizing enzymes along the villus-crypt surface of the rat small intestine--II. Conjugases. Biochem Pharmacol 37:177-184.
Eckhardt K, Li S, Ammon S, Schanzle G, Mikus G and Eichelbaum M (1998) Same incidence of adverse drug events after codeine administration irrespective of the genetically determined differences in morphine formation. Pain 76:27-33.
Everts B, Karlson BW, Herlitz J and Hedner T (1998) Morphine use and pharmacokinetics in patients with chest pain due to suspected or definite acute myocardial infarction. Eur J Pain 2:115-125.
Fleishaker JC and Smith RB (1987) Compartmental model analysis in pharmacokinetics. J Clin Pharmacol 27:922-926.
Forker EL and Luxon B (1978) Hepatic transport kinetics and plasma disappearance curves: distributed modeling versus conventional approach. Am J Physiol 235:E648-660.
Gasche Y, Daali Y, Fathi M, Chiappe A, Cottini S, Dayer P and Desmeules J (2004) Codeine intoxication associated with ultrarapid CYP2D6 metabolism. N Engl J Med 351:2827-2831.
Gibaldi M (1969) Effect of mode of administration on drug distribution in a two-compartment open system. J Pharm Sci 58:327-331.
Gibaldi M (1971) Pharmacokinetic aspects of drug metabolism. Ann N Y Acad Sci 179:19-31.
Gibaldi M, Boyes RN and Feldman S (1971) Influence of first-pass effect on availability of drugs on oral administration. J Pharm Sci 60:1338-1340.
Gillette JR (1971) Factors affecting drug metabolism. Ann N Y Acad Sci 179:43-66.
Gilman A, Rall T, Nies A and Taylor P (1990), in: Goodman and Gilman's the pharmacological basis of therapeutics (Gilman A, Rall T, Nies A and Taylor P eds), pp 497-500, Pergamon Press, New York.
Gintzler AR, Mohacsi E and Spector S (1976) Radioimmunoassay for the simultaneous determination of morphine and codeine. Eur J Pharmacol 38:149-156.
Granger DN, Richardson PD, Kvietys PR and Mortillaro NA (1980) Intestinal blood flow. Gastroenterology 78:837-863.
Hara K, Saito Y, Kirihara Y, Yamada Y, Sakura S and Kosaka Y (1999) The interaction of antinociceptive effects of morphine and GABA receptor agonists within the rat spinal cord. Anesth Analg 89:422-427.
Hau VS, Huber JD, Campos CR, Davis RT and Davis TP (2004) Effect of lambda-carrageenan-induced inflammatory pain on brain uptake of codeine and antinociception. Brain Res 1018:257-264.
Heading RC, Nimmo J, Prescott LF and Tothill P (1973) The dependence of paracetamol absorption on the rate of gastric emptying. Br J Pharmacol 47:415-421.
101
101
Hiroi T, Imaoka S, Chow T and Funae Y (1998) Tissue distributions of CYP2D1, 2D2, 2D3 and 2D4 mRNA in rats detected by RT-PCR. Biochim Biophys Acta 1380:305-312.
Horn T, Henriksen JH and Christoffersen P (1986) The sinusoidal lining cells in "normal" human liver. A scanning electron microscopic investigation. Liver 6:98-110.
Horton TL and Pollack GM (1991) Enterohepatic recirculation and renal metabolism of morphine in the rat. J Pharm Sci 80:1147-1152.
Houston JB (1994) Utility of in vitro drug metabolism data in predicting in vivo metabolic clearance. Biochem Pharmacol 47:1469-1479.
Ito K, Kusuhara H and Sugiyama Y (1999) Effects of intestinal CYP3A4 and P-glycoprotein on oral drug absorption--theoretical approach. Pharm Res 16:225-231.
Ito K, Suzuki H, Horie T and Sugiyama Y (2005) Apical/basolateral surface expression of drug transporters and its role in vectorial drug transport. Pharm Res 22:1559-1577.
Iwamoto K, Eaton DL and Klaassen CD (1978) Uptake of morphine and nalorphine by isolated rat hepatocytes. J Pharmacol Exp Ther 206:181-189.
Iwamoto K and Klaassen CD (1977) First-pass effect of morphine in rats. J Pharmacol Exp Ther 200:236-244.
Iwatsubo T, Hirota N, Ooie T, Suzuki H, Shimada N, Chiba K, Ishizaki T, Green CE, Tyson CA and Sugiyama Y (1997a) Prediction of in vivo drug metabolism in the human liver from in vitro metabolism data. Pharmacol Ther 73:147-171.
Iwatsubo T, Suzuki H and Sugiyama Y (1997b) Prediction of species differences (rats, dogs, humans) in the in vivo metabolic clearance of YM796 by the liver from in vitro data. J Pharmacol Exp Ther 283:462-469.
Jamei M, Marciniak S, Feng K, Barnett A, Tucker G and Rostami-Hodjegan A (2009) The Simcyp population-based ADME simulator. Expert Opin Drug Metab Toxicol 5:211-223.
Jusko WJ and Gretch M (1976) Plasma and tissue protein binding of drugs in pharmacokinetics. Drug Metab Rev 5:43-140.
Kalvass JC, Maurer TS and Pollack GM (2007) Use of plasma and brain unbound fractions to assess the extent of brain distribution of 34 drugs: comparison of unbound concentration ratios to in vivo p-glycoprotein efflux ratios. Drug Metab Dispos 35:660-666.
Kamerling IM, Van Haarst AD, De Kam ML, Cohen AF, Masclee AA and Burggraaf J (2004) Gallbladder volume as a biomarker for the motilin effect in healthy volunteers and patients with functional dyspepsia. Aliment Pharmacol Ther 19:797-804.
Kawai R, Fujita S and Suzuki T (1985) Simultaneous quantitation of lidocaine and its four metabolites by high-performance liquid chromatography: application to studies on in vitro and in vivo metabolism of lidocaine in rats. J Pharm Sci 74:1219-1224.
Kawai R, Lemaire M, Steimer JL, Bruelisauer A, Niederberger W and Rowland M (1994) Physiologically based pharmacokinetic study on a cyclosporin derivative, SDZ IMM 125. J Pharmacokinet Biopharm 22:327-365.
Kharasch ED, Hoffer C, Whittington D and Sheffels P (2003) Role of P-glycoprotein in the intestinal absorption and clinical effects of morphine. Clin Pharmacol Ther 74:543-554.
102
102
Kim I, Barnes AJ, Oyler JM, Schepers R, Joseph RE, Jr., Cone EJ, Lafko D, Moolchan ET and Huestis MA (2002) Plasma and oral fluid pharmacokinetics and pharmacodynamics after oral codeine administration. Clin Chem 48:1486-1496.
Kirchheiner J, Schmidt H, Tzvetkov M, Keulen JT, Lotsch J, Roots I and Brockmoller J (2007) Pharmacokinetics of codeine and its metabolite morphine in ultra-rapid metabolizers due to CYP2D6 duplication. Pharmacogenomics J 7:257-265.
Kwan KC (1997) Oral bioavailability and first-pass effects. Drug Metab Dispos 25:1329-1336.
Kwan KC, Foltz EL, Breault GO, Baer JE and Totaro JA (1976) Pharmacokinetics of methyldopa in man. J Pharmacol Exp Ther 198:264-277.
Kwon Y (2001) Clearance, in: Handbook of Essential Pharmacokinetics, Pharmacodynamics, and Drug Metabolism for Industrial Scientists (Kwon Y ed), pp 89 -119, Kluwer Academic/Plenum Publishers, New York.
Le KT, Maurice H and du Souich P (1996) First-pass metabolism of lidocaine in the anesthetized rabbit. Contribution of the small intestine. Drug Metab Dispos 24:711-716.
Lee HJ and Chiou WL (1989a) Erythrocytes as barriers for drug elimination in the isolated rat liver. I. Doxorubicin. Pharm Res 6:833-839.
Lee HJ and Chiou WL (1989b) Erythrocytes as barriers for drug elimination in the isolated rat liver. II. Propranolol. Pharm Res 6:840-843.
Lehle K, Kirchner G, Sewing KF, Rupprecht L, Merk J and Preuner JG (1998) Intestinal metabolism of cyclosporine A in human heart transplant recipients. Transplant Proc 30:4044.
Letrent SP, Pollack GM, Brouwer KR and Brouwer KL (1999a) Effects of a potent and specific P-glycoprotein inhibitor on the blood-brain barrier distribution and antinociceptive effect of morphine in the rat. Drug Metab Dispos 27:827-834.
Letrent SP, Polli JW, Humphreys JE, Pollack GM, Brouwer KR and Brouwer KL (1999b) P-glycoprotein-mediated transport of morphine in brain capillary endothelial cells. Biochem Pharmacol 58:951-957.
Lin JH, Chen IW, Chiba M, Nishime JA and Deluna FA (2000) Route-dependent nonlinear pharmacokinetics of a novel HIV protease inhibitor: involvement of enzyme inactivation. Drug Metab Dispos 28:460-466.
Lin JH, Chiba M and Baillie TA (1999) Is the role of the small intestine in first-pass metabolism overemphasized? Pharmacol Rev 51:135-158.
Liu S, Tam D, Chen X and Pang KS (2006) P-glycoprotein and an unstirred water layer barring digoxin absorption in the vascularly perfused rat small intestine preparation: induction studies with pregnenolone-16alpha-carbonitrile. Drug Metab Dispos 34:1468-1479.
Loo JC and Riegelman S (1968) New method for calculating the intrinsic absorption rate of drugs. J Pharm Sci 57:918-928.
Lotsch J, Skarke C, Schmidt H, Rohrbacher M, Hofmann U, Schwab M and Geisslinger G (2006) Evidence for morphine-independent central nervous opioid effects after administration of codeine: contribution of other codeine metabolites. Clin Pharmacol Ther 79:35-48.
103
103
Luke DR, Brunner LJ and Vadiei K (1990) Bioavailability assessment of cyclosporine in the rat. Influence of route of administration. Drug Metab Dispos 18:158-162.
Madadi P and Koren G (2008) Pharmacogenetic insights into codeine analgesia: implications to pediatric codeine use. Pharmacogenomics 9:1267-1284.
Madani S, Paine MF, Lewis L, Thummel KE and Shen DD (1999) Comparison of CYP2D6 content and metoprolol oxidation between microsomes isolated from human livers and small intestines. Pharm Res 16:1199-1205.
Mailman D (1978) Effects of vasoactive intestinal polypeptide on intestinal absorption and blood flow. J Physiol 279:121-132.
Masyuk TV, Ritman EL and LaRusso NF (2001) Quantitative assessment of the rat intrahepatic biliary system by three-dimensional reconstruction. Am J Pathol 158:2079-2088.
Milne RW, Nation RL, Somogyi AA, Bochner F and Griggs WM (1992) The influence of renal function on the renal clearance of morphine and its glucuronide metabolites in intensive-care patients. Br J Clin Pharmacol 34:53-59.
Mistry M and Houston JB (1981) Determinants of systemic availability of morphine and buprenorphine in the rat J Pharm Pharmacol 33:38p.
Mitschke D, Reichel A, Fricker G and Moenning U (2008) Characterization of cytochrome P450 protein expression along the entire length of the intestine of male and female rats. Drug Metab Dispos 36:1039-1045.
Mohammed SS, Christopher MM, Mehta P, Kedar A, Gross S and Derendorf H (1993) Increased erythrocyte and protein binding of codeine in patients with sickle cell disease. J Pharm Sci 82:1112-1117.
Murthy BR, Pollack GM and Brouwer KL (2002) Contribution of morphine-6-glucuronide to antinociception following intravenous administration of morphine to healthy volunteers. J Clin Pharmacol 42:569-576.
Osborne R, Joel S, Trew D and Slevin M (1990) Morphine and metabolite behavior after different routes of morphine administration: demonstration of the importance of the active metabolite morphine-6-glucuronide. Clin Pharmacol Ther 47:12-19.
Paine MF, Khalighi M, Fisher JM, Shen DD, Kunze KL, Marsh CL, Perkins JD and Thummel KE (1997) Characterization of interintestinal and intraintestinal variations in human CYP3A-dependent metabolism. J Pharmacol Exp Ther 283:1552-1562.
Paine MF, Shen DD, Kunze KL, Perkins JD, Marsh CL, McVicar JP, Barr DM, Gillies BS and Thummel KE (1996) First-pass metabolism of midazolam by the human intestine. Clin Pharmacol Ther 60:14-24.
Pang KS (2003) Modeling of intestinal drug absorption: roles of transporters and metabolic enzymes (for the Gillette Review Series). Drug Metab Dispos 31:1507-1519.
Pang KS (2009) Safety testing of metabolites: Expectations and outcomes. Chem Biol Interact 179:45-59.
Pang KS, Barker F, Simard A, Schwab AJ and Goresky CA (1995) Sulfation of acetaminophen by the perfused rat liver: the effect of red blood cell carriage. Hepatology 22:267-282.
104
104
Pang KS, Cherry WF and Ulm EH (1985) Disposition of enalapril in the perfused rat intestine-liver preparation: absorption, metabolism and first-pass effect. J Pharmacol Exp Ther 233:788-795.
Pang KS and Durk MR (2010) Physiologically-based pharmacokinetic (PBPK) modeling of metabolites. J Pharmacokinet Pharmacodyn:Under revision.
Pang KS and Gillette JR (1979) Sequential first-pass elimination of a metabolite derived from a precursor. J Pharmacokinet Biopharm 7:275-290.
Pang KS, Morris ME and Sun H (2008) Formed and preformed metabolites: facts and comparisons. J Pharm Pharmacol 60:1247-1275.
Pang KS and Rowland M (1977) Hepatic clearance of drugs. I. Theoretical considerations of a "well-stirred" model and a "parallel tube" model. Influence of hepatic blood flow, plasma and blood cell binding, and the hepatocellular enzymatic activity on hepatic drug clearance. J Pharmacokinet Biopharm 5:625-653.
Pang KS, Yuen V, Fayz S, te Koppele JM and Mulder GJ (1986) Absorption and metabolism of acetaminophen by the in situ perfused rat small intestine preparation. Drug Metab Dispos 14:102-111.
Parkinson A (2001) Biotransformation of xenobiotics, in: Casarett and Doull's Toxicology (Klaassen CD ed), pp 133-224, McGraw-Hill, Columbus.
Per Ederoth KT, René Bouw,C. Johan F. Lundberg, Urban Ungerstedt,Carl-Henrik Nordström and Margareta Hammarlund-Udenaes (2003) Blood–brain barrier transport of morphine in patients with severe brain trauma. Br J Clin Pharmacol 57:427-435.
Perrier D and Gibaldi M (1982) General derivation of the equation for time to reach a certain fraction of steady state. J Pharm Sci 71:474-475.
Persson K, Hammarlund-Udenaes M, Mortimer O and Rane A (1992) The postoperative pharmacokinetics of codeine. Eur J Clin Pharmacol 42:663-666.
Peters SA (2008) Evaluation of a generic physiologically based pharmacokinetic model for lineshape analysis. Clin Pharmacokinet 47:261-275.
Popa D, Loghin F, Imre S and Curea E (2003) The study of codeine-gluthetimide pharmacokinetic interaction in rats. J Pharm Biomed Anal 32:867-877.
Projean D, Morin PE, Tu TM and Ducharme J (2003) Identification of CYP3A4 and CYP2C8 as the major cytochrome P450 s responsible for morphine N-demethylation in human liver microsomes. Xenobiotica 33:841-854.
Rasyid A, Rahman AR, Jaalam K and Lelo A (2002) Effect of different curcumin dosages on human gall bladder. Asia Pac J Clin Nutr 11:314-318.
Rodgers T, Leahy D and Rowland M (2005) Physiologically based pharmacokinetic modeling 1: predicting the tissue distribution of moderate-to-strong bases. J Pharm Sci 94:1259-1276.
Rodgers T and Rowland M (2006) Physiologically based pharmacokinetic modelling 2: predicting the tissue distribution of acids, very weak bases, neutrals and zwitterions. J Pharm Sci 95:1238-1257.
Rodgers T and Rowland M (2007) Mechanistic approaches to volume of distribution predictions: understanding the processes. Pharm Res 24:918-933.
105
105
Rowland M (1972) Influence of route of administration on drug availability. J Pharm Sci 61:70-74.
Rowland M (1984) Physiologic pharmacokinetic models: relevance, experience, and future trends. Drug Metab Rev 15:55-74.
Sahali-Sahly Y, Balani SK, Lin JH and Baillie TA (1996) In vitro studies on the metabolic activation of the furanopyridine L-754,394, a highly potent and selective mechanism-based inhibitor of cytochrome P450 3A4. Chem Res Toxicol 9:1007-1012.
Sawe J, Kager L, Svensson Eng JO and Rane A (1985) Oral morphine in cancer patients: in vivo kinetics and in vitro hepatic glucuronidation. Br J Clin Pharmacol 19:495-501.
Sawe J, Svensson JO and Rane A (1983) Morphine metabolism in cancer patients on increasing oral doses--no evidence for autoinduction or dose-dependence. Br J Clin Pharmacol 16:85-93.
Schurgers N, de Blaey CJ and Tomlinson E (1984) Non-enhancement of sodium cromoglycate intestinal absorption by quaternary ammonium ions. An effect of salt on ion-pair formation? J Pharm Pharmacol 36:45.
Shah J and Mason WD (1990) Pharmacokinetics of codeine after parenteral and oral dosing in the rat. Drug Metab Dispos 18:670-673.
Shah J and Mason WD (1991) A dose-ranging study of the pharmacokinetics of codeine phosphate following intravenous administration to rats. J Pharm Sci 80:229-231.
Shelly MP, Quinn KG and Park GR (1989) Pharmacokinetics of morphine in patients following orthotopic liver transplantation. Br J Anaesth 63:375-379.
Skarke C, Schmidt H, Geisslinger G, Darimont J and Lotsch J (2003) Pharmacokinetics of morphine are not altered in subjects with Gilbert's syndrome. Br J Clin Pharmacol 56:228-231.
Soars MG, Burchell B and Riley RJ (2002) In vitro analysis of human drug glucuronidation and prediction of in vivo metabolic clearance. J Pharmacol Exp Ther 301:382-390.
St-Pierre MV and Pang KS (1993) Kinetics of sequential metabolism. I. Formation and metabolism of oxazepam from nordiazepam and temazepam in the perfused murine liver. J Pharmacol Exp Ther 265:1429-1436.
Sun H and Pang KS (2009) Disparity in intestine disposition between formed and preformed metabolites and implications: a theoretical study. Drug Metab Dispos 37:187-202.
Sun H and Pang KS (2010) Physiological modeling to understand the impact of enzymes and transporters on drug and metabolite data and bioavailability estimates. Pharmaceutical Research 27:1237.
Suttle AB, Pollack GM and Brouwer KL (1992) Use of a pharmacokinetic model incorporating discontinuous gastrointestinal absorption to examine the occurrence of double peaks in oral concentration-time profiles. Pharm Res 9:350-356.
Suzuki A, Higuchi WI and Ho NF (1970a) Theoretical model studies of drug absorption and transport in the gastrointestinal tract. II. J Pharm Sci 59:651-659.
Suzuki A, Higuchi WI and Ho NF (1970b) Theoretical model studies of drug absorption and transport in the gastrointestinal tract. I. J Pharm Sci 59:644-651.
106
106
Talseth T (1976) Studies on hydralazine. III. Bioavailability of hydralazine in man. Eur J Clin Pharmacol 10:395-401.
Tam D, Tirona RG and Pang KS (2003) Segmental intestinal transporters and metabolic enzymes on intestinal drug absorption. Drug Metab Dispos 31:373-383.
Till AE, Constanzer ML, Demetriades J, Irvin JD, Lee RB and Ferguson RK (1982) Evidence for route dependent biotransformation of cyclobenzaprine hydrochloride. Biopharm Drug Dispos 3:19-28.
Tsuji A and Tamai I (1996) Carrier-mediated intestinal transport of drugs. Pharm Res 13:963-977.
van de Wetering K, Zelcer N, Kuil A, Feddema W, Hillebrand M, Vlaming ML, Schinkel AH, Beijnen JH and Borst P (2007) Multidrug resistance proteins 2 and 3 provide alternative routes for hepatic excretion of morphine-glucuronides. Mol Pharmacol 72:387-394.
Wandel C, Kim R, Wood M and Wood A (2002) Interaction of morphine, fentanyl, sufentanil, alfentanil, and loperamide with the efflux drug transporter P-glycoprotein. Anesthesiology 96:913-920.
Watanabe Y, Nakajima M and Yokoi T (2002) Troglitazone glucuronidation in human liver and intestine microsomes: high catalytic activity of UGT1A8 and UGT1A10. Drug Metab Dispos 30:1462-1469.
Wen Y, Remmel RP and Zimmerman CL (1999) First-pass disposition of (-)-6-aminocarbovir in rats. I. Prodrug activation may be limited by access to enzyme. Drug Metab Dispos 27:113-121.
Wilkinson GR (1983) Plasma and tissue binding considerations in drug disposition. Drug Metab Rev 14:427-465.
Wilkinson GR and Shand DG (1975) Commentary: a physiological approach to hepatic drug clearance. Clin Pharmacol Ther 18:377-390.
Winkler K, Keiding S and Tygstrup N (1973) Clearance as a quantitative measurement of liver function., in: The Liver: quantitative aspects of structure and function (Paumgartner G and Prekig R eds), pp 144-155.
Wrighton SA, Vandenbranden M, Stevens JC, Shipley LA, Ring BJ, Rettie AE and Cashman JR (1993) In vitro methods for assessing human hepatic drug metabolism: their use in drug development. Drug Metab Rev 25:453-484.
Xie R, Hammarlund-Udenaes M, de Boer AG and de Lange EC (1999) The role of P-glycoprotein in blood-brain barrier transport of morphine: transcortical microdialysis studies in mdr1a (-/-) and mdr1a (+/+) mice. Br J Pharmacol 128:563-568.
Xu X and Pang KS (1989) Hepatic modeling of metabolite kinetics in sequential and parallel pathways: salicylamide and gentisamide metabolism in perfused rat liver. J Pharmacokinet Biopharm 17:645-671.
Yang J, Jamei M, Yeo KR, Tucker GT and Rostami-Hodjegan A (2007) Prediction of intestinal first-pass drug metabolism. Curr Drug Metab 8:676-684.
Yu LX and Amidon GL (1999) A compartmental absorption and transit model for estimating oral drug absorption. Int J Pharm 186:119-125.
107
107
Yue QY, Hasselstrom J, Svensson JO and Sawe J (1991a) Pharmacokinetics of codeine and its metabolites in Caucasian healthy volunteers: comparisons between extensive and poor hydroxylators of debrisoquine. Br J Clin Pharmacol 31:635-642.
Yue QY and Sawe J (1997) Different effects of inhibitors on the O- and N-demethylation of codeine in human liver microsomes. Eur J Clin Pharmacol 52:41-47.
Yue QY, Svensson JO, Sjoqvist F and Sawe J (1991b) A comparison of the pharmacokinetics of codeine and its metabolites in healthy Chinese and Caucasian extensive hydroxylators of debrisoquine. Br J Clin Pharmacol 31:643-647.
Zolezzi M and Al Mohaimeed SA (2001) Seizures with intravenous codeine phosphate. Ann Pharmacother 35:1211-1213.
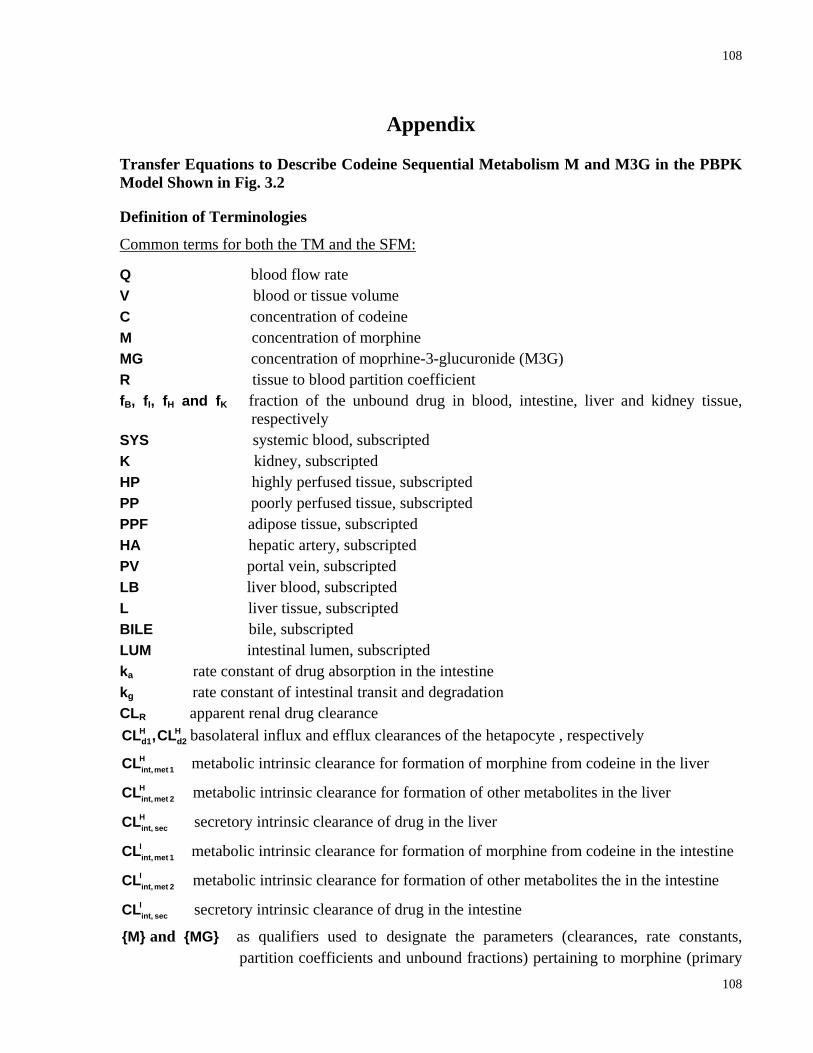
108
108
Appendix
Transfer Equations to Describe Codeine Sequential Metabolism M and M3G in the PBPK Model Shown in Fig. 3.2
Definition of Terminologies
Common terms for both the TM and the SFM:
Q blood flow rate V blood or tissue volume C concentration of codeine M concentration of morphine MG concentration of moprhine-3-glucuronide (M3G) R tissue to blood partition coefficient fB, fI, fH and fK fraction of the unbound drug in blood, intestine, liver and kidney tissue,
respectively SYS systemic blood, subscripted K kidney, subscripted HP highly perfused tissue, subscripted PP poorly perfused tissue, subscripted PPF adipose tissue, subscripted HA hepatic artery, subscripted PV portal vein, subscripted LB liver blood, subscripted L liver tissue, subscripted BILE bile, subscripted LUM intestinal lumen, subscripted ka rate constant of drug absorption in the intestine kg rate constant of intestinal transit and degradation CLR apparent renal drug clearance
H Hd1 d2CL ,CL basolateral influx and efflux clearances of the hetapocyte , respectively Hint, met 1CL metabolic intrinsic clearance for formation of morphine from codeine in the liver Hint, met 2CL metabolic intrinsic clearance for formation of other metabolites in the liver Hint, secCL secretory intrinsic clearance of drug in the liver Iint, met 1CL metabolic intrinsic clearance for formation of morphine from codeine in the intestine Iint, met 2CL metabolic intrinsic clearance for formation of other metabolites the in the intestine Iint, secCL secretory intrinsic clearance of drug in the intestine
{M} and {MG} as qualifiers used to designate the parameters (clearances, rate constants, partition coefficients and unbound fractions) pertaining to morphine (primary
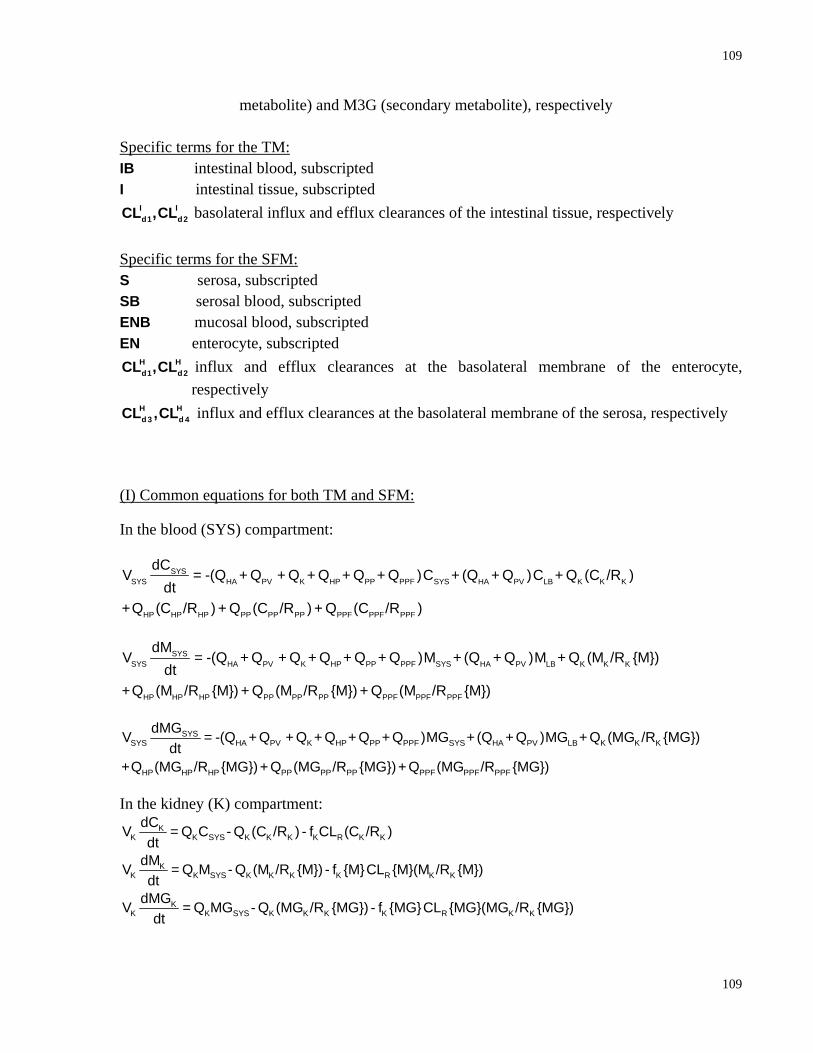
109
109
metabolite) and M3G (secondary metabolite), respectively Specific terms for the TM: IB intestinal blood, subscripted I intestinal tissue, subscripted
I Id1 d2CL ,CL basolateral influx and efflux clearances of the intestinal tissue, respectively
Specific terms for the SFM: S serosa, subscripted SB serosal blood, subscripted ENB mucosal blood, subscripted EN enterocyte, subscripted
H Hd1 d2CL ,CL influx and efflux clearances at the basolateral membrane of the enterocyte,
respectively H Hd 3 d 4CL ,CL influx and efflux clearances at the basolateral membrane of the serosa, respectively
(I) Common equations for both TM and SFM:
In the blood (SYS) compartment:
SYSSYS HA PV K HP PP PPF SYS HA PV LB K K K
HP HP HP PP PP PP PPF PPF PPF
dCV = -(Q + Q + Q + Q + Q + Q )C + (Q + Q )C + Q (C /R )
dt+Q (C /R ) + Q (C /R ) + Q (C /R )
SYSSYS HA PV K HP PP PPF SYS HA PV LB K K K
HP HP HP PP PP PP PPF PPF PPF
dMV = -(Q + Q + Q + Q + Q + Q )M + (Q + Q )M + Q (M /R {M})
dt+Q (M /R {M}) + Q (M /R {M}) + Q (M /R {M})
SYSSYS HA PV K HP PP PPF SYS HA PV LB K K K
HP HP HP PP PP PP PPF PPF PPF
dMGV = -(Q + Q + Q + Q + Q + Q )MG +(Q + Q )MG + Q (MG /R {MG})dt
+Q (MG /R {MG})+ Q (MG /R {MG})+ Q (MG /R {MG})
In the kidney (K) compartment: K
K K SYS K K K K R K KdCV = Q C - Q (C /R ) - f CL (C /R )dt
KK K SYS K K K K R K K
dMV = Q M - Q (M /R {M}) - f {M}CL {M}(M /R {M})dt
KK K SYS K K K K R K K
dMGV = Q MG - Q (MG /R {MG}) - f {MG}CL {MG}(MG /R {MG})dt
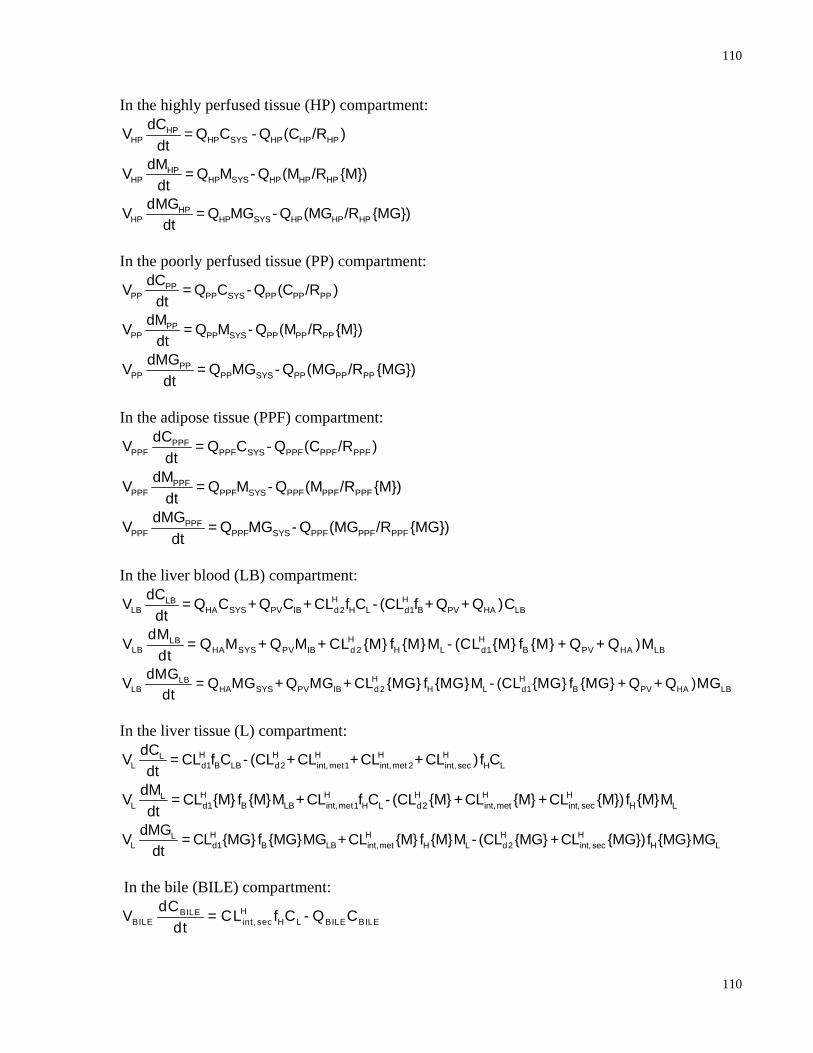
110
110
In the highly perfused tissue (HP) compartment: HP
HP HP SYS HP HP HPdCV = Q C - Q (C /R )
dt
HPHP HP SYS HP HP HP
dMV = Q M - Q (M /R {M})dt
HPHP HP SYS HP HP HP
dMGV = Q MG - Q (MG /R {MG})dt
In the poorly perfused tissue (PP) compartment:
PPPP PP SYS PP PP PP
dCV = Q C - Q (C /R )dt
PPPP PP SYS PP PP PP
dMV = Q M - Q (M /R {M})dt
PPPP PP SYS PP PP PP
dMGV = Q MG - Q (MG /R {MG})dt
In the adipose tissue (PPF) compartment:
PPFPPF PPF SYS PPF PPF PPF
dCV = Q C - Q (C /R )dt
PPFPPF PPF SYS PPF PPF PPF
dMV = Q M - Q (M /R {M})dt
PPFPPF PPF SYS PPF PPF PPF
dMGV = Q MG - Q (MG /R {MG})dt
In the liver blood (LB) compartment:
H HLBLB HA SYS PV IB d2 H L d1 B PV HA LB
dCV = Q C + Q C + CL f C - (CL f + Q + Q )Cdt
H HLBLB HA SYS PV IB d 2 H L d1 B PV HA LB
dMV = Q M + Q M + CL {M} f {M}M - (CL {M} f {M} + Q + Q )Mdt
H HLBLB HA SYS PV IB d 2 H L d1 B PV HA LB
dMGV = Q MG + Q MG + CL {MG} f {MG}M - (CL {MG} f {MG} + Q + Q )MGdt
In the liver tissue (L) compartment:
H H H H HLL d1 B LB d2 int, met1 int, met 2 int, sec H L
dCV = CL f C - (CL + CL + CL + CL )f Cdt
H H H H HLL d1 B LB int, met1 H L d2 int, met int, sec H L
dMV = CL {M} f {M}M +CL f C - (CL {M} +CL {M} +CL {M})f {M}Mdt
H H H HLL d1 B LB int, met H L d2 int, sec H L
dMGV = CL {MG} f {MG}MG +CL {M} f {M}M - (CL {MG} +CL {MG})f {MG}MGdt
In the bile (BILE) compartment:
HBILEBILE int, sec H L BILE BILE
dCV = CL f C - Q Cdt
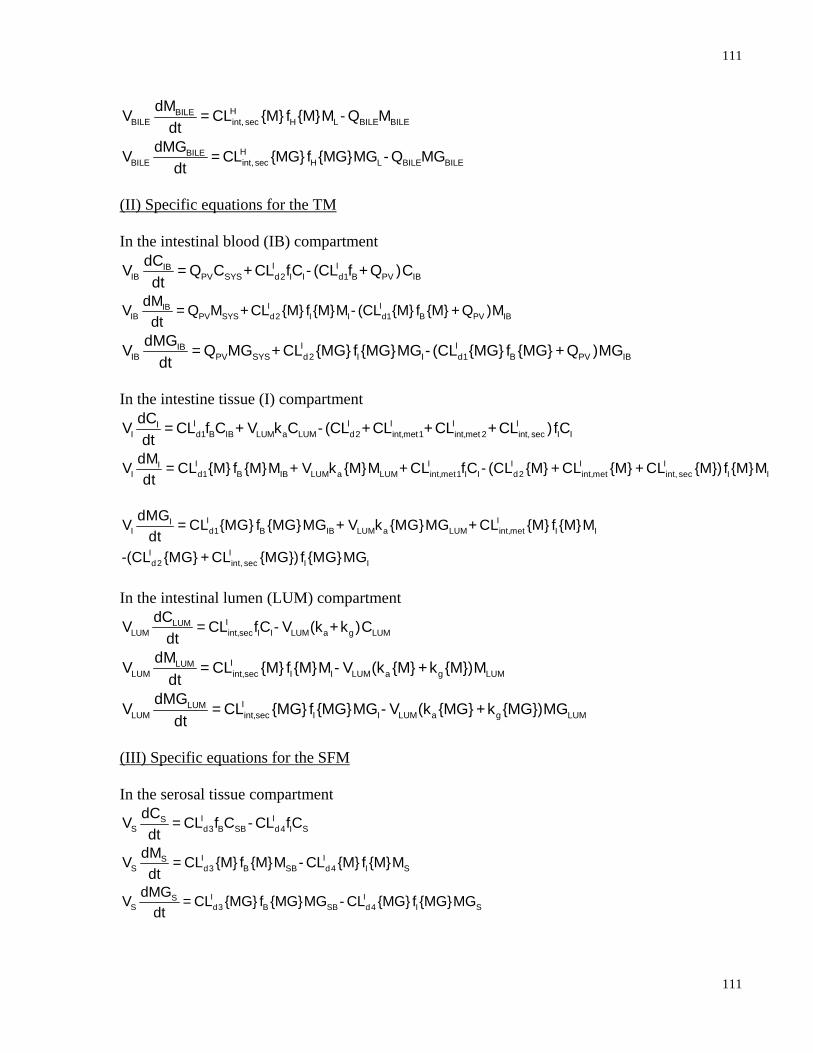
111
111
HBILEBILE int, sec H L BILE BILE
dMV = CL {M} f {M}M - Q Mdt
HBILEBILE int, sec H L BILE BILE
dMGV = CL {MG} f {MG}MG - Q MGdt
(II) Specific equations for the TM In the intestinal blood (IB) compartment
I IIBIB PV SYS d2 I I d1 B PV IB
dCV = Q C + CL fC - (CL f + Q )Cdt
I IIBIB PV SYS d2 I I d1 B PV IB
dMV = Q M + CL {M} f {M}M - (CL {M} f {M} + Q )Mdt
I IIBIB PV SYS d2 I I d1 B PV IB
dMGV = Q MG + CL {MG} f {MG}MG - (CL {MG} f {MG} + Q )MGdt
In the intestine tissue (I) compartment
I I I I III d1 B IB LUM a LUM d2 int,met1 int,met 2 int, sec I IdCV = CL f C + V k C - (CL + CL + CL + CL )fCdt
I I I I III d1 B IB LUM a LUM int,met1 I I d2 int,met int, sec I IdMV = CL {M} f {M}M + V k {M}M + CL fC - (CL {M} + CL {M} + CL {M}) f {M}Mdt
I II
I d1 B IB LUM a LUM int,met I I
I Id2 int, sec I I
dMGV = CL {MG} f {MG}MG + V k {MG}MG + CL {M} f {M}Mdt
-(CL {MG} + CL {MG}) f {MG}MG
In the intestinal lumen (LUM) compartment
ILUMLUM int,sec I I LUM a g LUM
dCV = CL fC - V (k +k )Cdt
ILUMLUM int,sec I I LUM a g LUM
dMV = CL {M} f {M}M - V (k {M} +k {M})Mdt
ILUMLUM int,sec I I LUM a g LUM
dMGV = CL {MG} f {MG}MG - V (k {MG} +k {MG})MGdt
(III) Specific equations for the SFM In the serosal tissue compartment
I ISS d3 B SB d4 I S
dCV = CL f C - CL fCdt
I ISS d3 B SB d4 I S
dMV = CL {M} f {M}M - CL {M} f {M}Mdt
I ISS d3 B SB d4 I S
dMGV = CL {MG} f {MG}MG - CL {MG} f {MG}MGdt
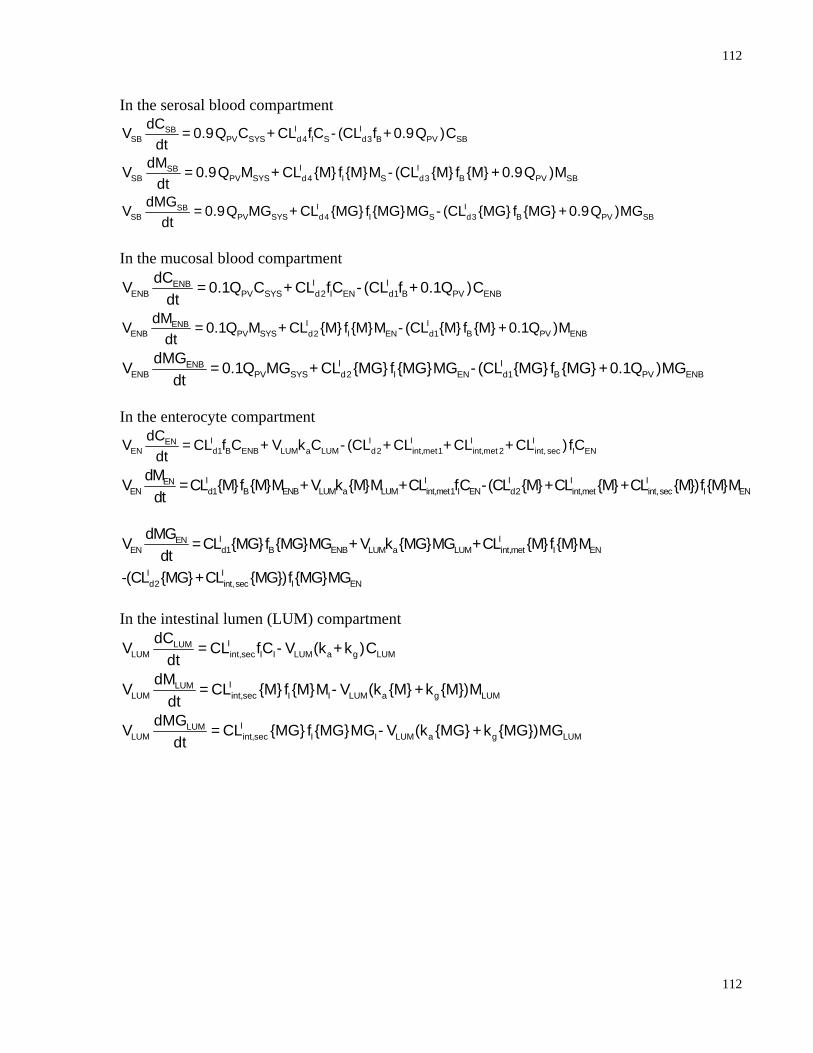
112
112
In the serosal blood compartment I ISB
SB PV SYS d4 I S d3 B PV SBdCV = 0.9Q C + CL fC - (CL f + 0.9Q )C
dt
I ISBSB PV SYS d4 I S d3 B PV SB
dMV = 0.9Q M + CL {M} f {M}M - (CL {M} f {M} + 0.9Q )Mdt
I ISBSB PV SYS d4 I S d3 B PV SB
dMGV = 0.9Q MG + CL {MG} f {MG}MG - (CL {MG} f {MG} + 0.9Q )MGdt
In the mucosal blood compartment
I IENBENB PV SYS d2 I EN d1 B PV ENB
dCV = 0.1Q C + CL fC - (CL f + 0.1Q )Cdt
I IENBENB PV SYS d2 I EN d1 B PV ENB
dMV = 0.1Q M + CL {M} f {M}M - (CL {M} f {M} +0.1Q )Mdt
I IENBENB PV SYS d2 I EN d1 B PV ENB
dMGV = 0.1Q MG + CL {MG} f {MG}MG - (CL {MG} f {MG} +0.1Q )MGdt
In the enterocyte compartment
I I I I IENEN d1 B ENB LUM a LUM d2 int,met1 int,met 2 int, sec I EN
dCV = CL f C + V k C - (CL + CL + CL + CL )fCdt
I I I I IENEN d1 B ENB LUM a LUM int,met1 I EN d2 int,met int, sec I EN
dMV =CL {M}f {M}M + V k {M}M +CL fC -(CL {M}+CL {M}+CL {M})f {M}Mdt
I IEN
EN d1 B ENB LUM a LUM int,met I EN
I Id2 int, sec I EN
dMGV =CL {MG}f {MG}MG + V k {MG}MG +CL {M}f {M}Mdt
-(CL {MG}+CL {MG})f {MG}MG
In the intestinal lumen (LUM) compartment
ILUMLUM int,sec I I LUM a g LUM
dCV = CL fC - V (k +k )Cdt
ILUMLUM int,sec I I LUM a g LUM
dMV = CL {M} f {M}M - V (k {M} +k {M})Mdt
ILUMLUM int,sec I I LUM a g LUM
dMGV = CL {MG} f {MG}MG - V (k {MG} +k {MG})MGdt