physiology - cvs
TRANSCRIPT

Physiology - CVSDone By
Dana Tarawneh, Dana Obeidat, Heba Al Tahat
Corrected By
Dana Tarawneh

Electrocardiography – Normal 6Faisal I. Mohammed, MD, PhD
2

Objectives• Recognize the normal ECG tracing• Calculate the heart rate• Determine the rhythm (Regular or irregular)
• Calculate the length of intervals and determine the segments deflections (upward or downward deflections, elevated or depressed segments)
• Draw the Hexagonal axis of the ECG (trigonal axis is for lead1, lead2, lead3. Hexagonal refers to the 3 unipolar & 3 bipolar limb leads).
• Find the mean electrical axis of QRS (Ventricular depolarization)
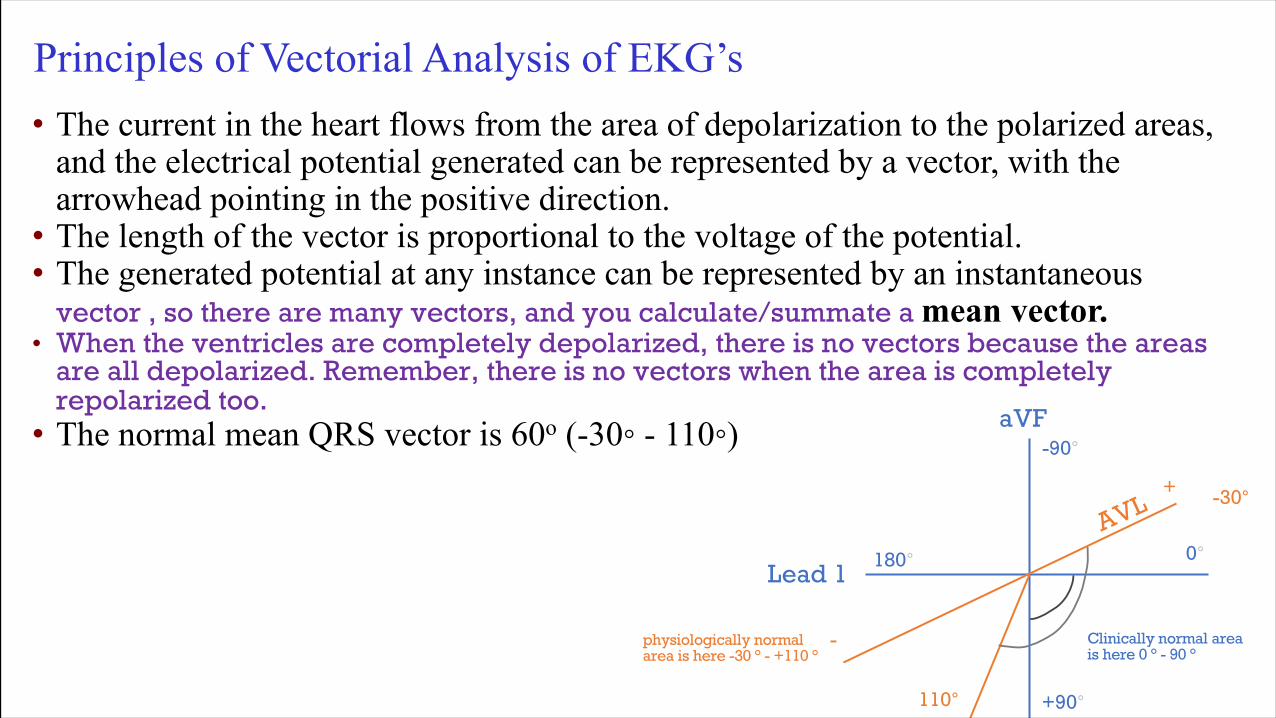
Principles of Vectorial Analysis of EKG’s• The current in the heart flows from the area of depolarization to the polarized areas,
and the electrical potential generated can be represented by a vector, with the arrowhead pointing in the positive direction.• The length of the vector is proportional to the voltage of the potential.• The generated potential at any instance can be represented by an instantaneous
vector , so there are many vectors, and you calculate/summate a mean vector. • When the ventricles are completely depolarized, there is no vectors because the areas
are all depolarized. Remember, there is no vectors when the area is completely repolarized too.• The normal mean QRS vector is 60o (-30◦ - 110◦)
Lead 1
aVF
0°180°
-90°
+90°
Clinically normal area is here 0 ° - 90 °
-30°AVL
+
-physiologically normal area is here -30 ° - +110 °
110°

____
_
__ _
_____
_____
_______
_______
__________
+++++++++
++
+
+++++ ++
+
++
+++ +++
+++
+++ +++ +
++
+
++
++++
+++++
+++++ +
++++
Mean Vector Through the Partially Depolarized Heart
+
The area of interventricular septum is the first area that gets depolarized so there are many vectors going in all directions.
You can calculate the mean electrical vector for all these vectors.
Since the depolarization spreads to the right and left areas, we can have a different vector at every instance & the value of this vector on Lead1, Lead2 & Lead3 is changing. At the end, when the area is completely depolarized, you record QRS.

Einthoven’striangleandlaw
6
+
+ +
We mentioned before that :
1. Lead1 right arm is negative and left arm is positive.
2. Lead2 right arm is negative and left foot is positive.
3. Lead 3 left arm is negative and left foot is positive .
This equilateral triangle (60 ° angles)represents the trigonal axis.
QRS in Lead1 + QRS in Lead3 = QRS in Lead2
-
-- 60 °180 °

-150
If you add the other unipolar limb leads, you will get the hexagonal
axis.

Principles of Vectorial Analysis of EKG’s (cont’d)
Axes of the Three Bipolar and Augmented Leads
+
_
__
+
+
60o120o
0oI I
IIIII
IIIII
+
_
-30o
aVL
aVL+
_
210o
aVR
aVR
+
_ aVF
aVF
90o
Trigonal axis is in yellow
Unipolar limb leads are in pink, red & green
aVR is negative counterclockwise& positive clockwise
aVF is perpendicular to Lead1
The 2 perpendicular leads are either :1. Lead1 & aVF2. Lead2 & aVL3. Lead3 & aVR
Knowing the perpendicular leads helps you to determine the mean electrical axis at the end.

AxesoftheUnipolarLimbLeads
+
+
+I
aVLaVR
aVF
-- Lead I
Lead IILead III
With the added green lines, we can see a hexagonal axis clearly.

PrinciplesofVectorialAnalysisofEKG’s(cont’d)
• The axis of lead I is zero degrees because the electrodes lie in the horizontal direction on each of the arms.
• The axis of lead II is +60 degrees because the right arm connects to the torso in the top right corner, and left leg connects to the torso in the bottom left corner.
• The axis of lead III is 120 degrees.

PrinciplesofVectorialAnalysisofEKG’s(cont’d)Picture (instance) A: Represents a depolarization of the septum. To calculate the mean electrical axis for the vector, you draw a perpendicular line from each limb lead. (All 3 leads values are positive)
Picture (instance) B: Here the depolarization continues from the septum and the value of the vector increases subsequently.
Picture (instance) C: even though there's more depolarization there is a decrease in the value of the mean vector.
Picture (instance) D: the last part of the heart that gets depolarized (posterior aspect of the left ventricle), here you can see that leads 2 & 3 will record negative values. Represents the recording of (S Wave)
Picture (instance) E: Represents the heart when it is completely depolarized, so here there's no potential difference >> it's back to Iso electrical line. And this is the recording of QRS.
In conclusion, QRS is the recording of the mean electrical axis on the plane of Leads 1,2, 3 Or on the transverse plane of chest leads V1-V6.

12
Principles of Vectorial Analysis of EKG’s (cont’d)
l In figure B, the depolarization vector is large because half of the ventricle is depolarized.
l Lead II should be largest voltage when compared to I and III when the mean vector is 60o.
l In figure C, left side is slower to depolarize.l In figure D, the last part to depolarize is near the left base of the heart
which gives a negative vector (S wave).l Q wave is present if the left side of the septum depolarizes first. (we don't
record it most of the times and if it's recorded it may refer to some sort of ischemia)

TheTWave(VentricularRepolarization)
• First area to repolarize is near the apex of the heart.• Last areas, in general, to depolarize
are the first to repolarize.• Repolarized areas will have a + charge
first; therefore, a + net vector occurs and a positive T wave.
This recording is from the repolarization wave (T Wave)

Atrial Depolarization (P-Wave) and Atrial Repolarization (Atrial T Wave)
• Atrial depolarization begins at sinus node and spreads toward A-V node.• This should give a + vector in leads I, II, and III.• Atrial repolarization can’t be seen because it is masked by QRS
complex.• Atrial depolarization is slower than in ventricles, so first area to
depolarize is also the first to repolarize >> This gives a negative atrial repolarization wave in leads I, II, and III.

Vectorcardiogram
• This traces vectors throughout cardiac cycle.• When half of the ventricle is depolarized, the
vector is largest.• Note zero reference point, number 5, is the
point of full depolarization.
Remember that vector 4 records the S wave. (the last area that gets depolarized in
the ventricle)

Determining Mean Electrical Axis
• To Determine Mean Electrical Axis, you must take or Use 2 different leads.• Measure the (algebric) sum of the height and the negative depth of the QRS complex• Measure that value in mm onto the axis of the lead and draw perpendicular lines• The intersection is at the angle of the mean axis.
Youmustwatchthisvideofrom1:27:00,sothetopicwillbeapieceofcake!!https://youtu.be/qJ6xYbRjsLoITISAMAZING!!

• So, if you to determine the Mean Electrical Axis for a patient, you must take any 2 leads. ( it doesn't matter if they are both unipolar or bipolar or a mix >> it should be the same). Here we chose lead 1 and lead 3.
• Then you draw these two leads in their correct positions, >> then you draw a perpendicular line from each lead, at some point those two perpendicular lines will intersect * >> then you draw a line from the intersection point to the center of the hexagonal reference system >> the angle will be the direction & value of the mean electrical axis for the patient. In this case it's 58°
17
Lead 3
58°Lead 1
If you didn't understand the procces you can refer to the video [26-30].

I
II
III
_ I
_
+
+ 120o
0oI
III
III
Plot of the Mean Electrical Axis of the Heart from Two Electrocardiographic Leads
60o
-60o
180o


If the mean electrical axis is btween 0 & +90 that's normal QRS
If the mean electrical axis is here à that's right axis deviationof QRS
If the mean electrical axis is here à that'sleft axis deviation of QRS
If the mean electrical axis is here à that’sExtreme left or right axis deviation of QRS
So, most of the times we use the lead 1 and the
aVF because they are perpendicular to each other. If the QRS summation of both is positive, the angle of the mean electrical axis will
appear in the 0° - 90° area.
Right axis deviation of QRS
Left axis deviation of QRS
Extreme left or right deviation
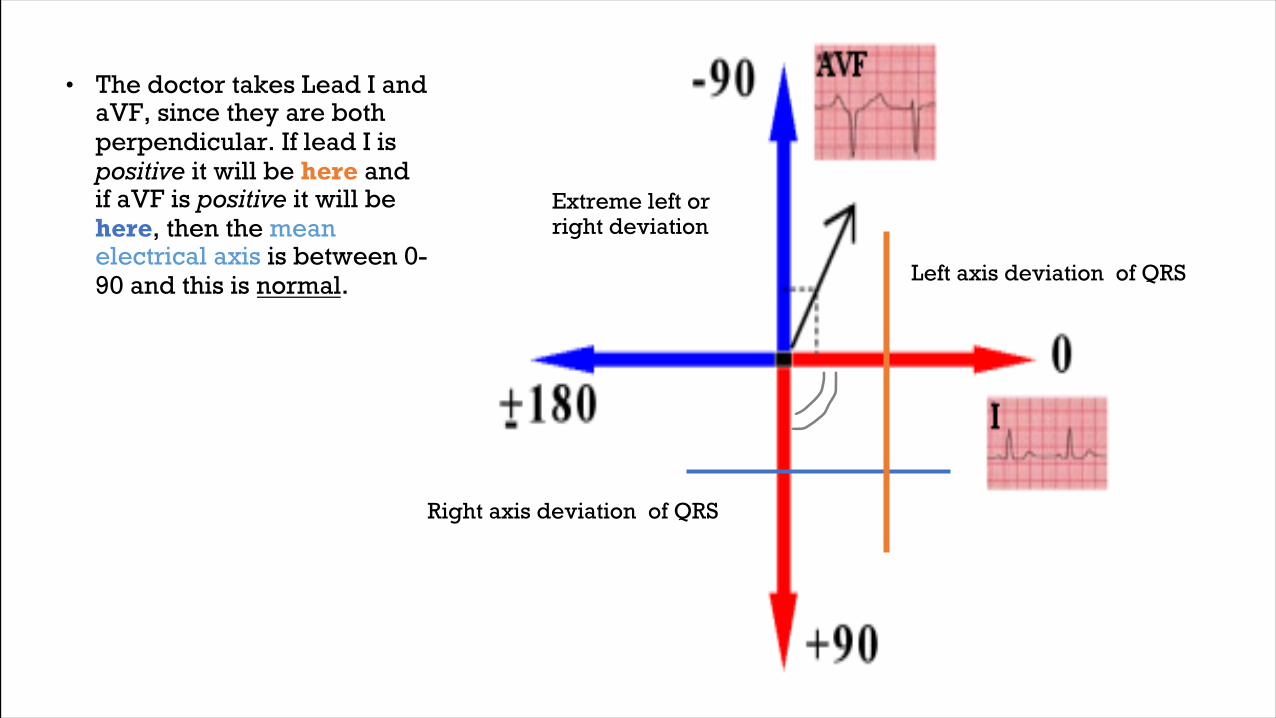
• The doctor takes Lead I and aVF, since they are both perpendicular. If lead I is positive it will be here and if aVF is positive it will be here, then the mean electrical axis is between 0-90 and this is normal.

Right axis deviation of QRS
• If lead I is negativeit will be here and if aVF is positive it will be here, then the mean electrical axis is between 90-180 and this means right axis deviation.

Left axis deviation of QRS
• If lead I is positiveit will be here and if aVF is negative it will be here, then the mean electrical axis is between 0 --90 and this is left axis deviation.

Extreme left or right deviation
• If lead I is negativeit will be here and if aVF is negative it will be here, then the mean electrical axis is in extreme left or right deviation.
Lead I- 180◦
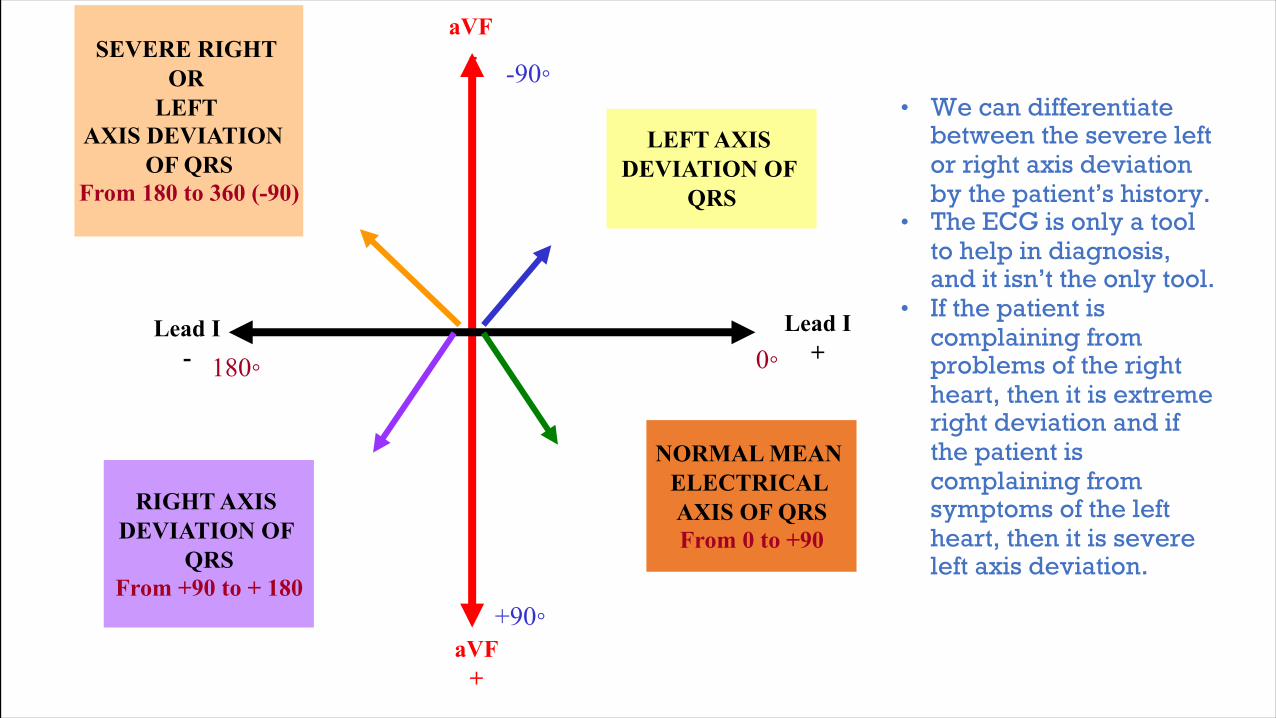
• We can differentiate between the severe left or right axis deviation by the patient’s history.
• The ECG is only a tool to help in diagnosis, and it isn’t the only tool.
• If the patient is complaining from problems of the right heart, then it is extreme right deviation and if the patient is complaining from symptoms of the left heart, then it is severe left axis deviation.
Lead I+
aVF-
aVF+
0◦
+90◦
-90◦
NORMAL MEAN ELECTRICAL AXIS OF QRSFrom 0 to +90
RIGHT AXIS DEVIATION OF
QRSFrom +90 to + 180
SEVERE RIGHT OR
LEFT AXIS DEVIATION
OF QRSFrom 180 to 360 (-90)
LEFT AXIS DEVIATION OF
QRS
Heart Rate Calculation
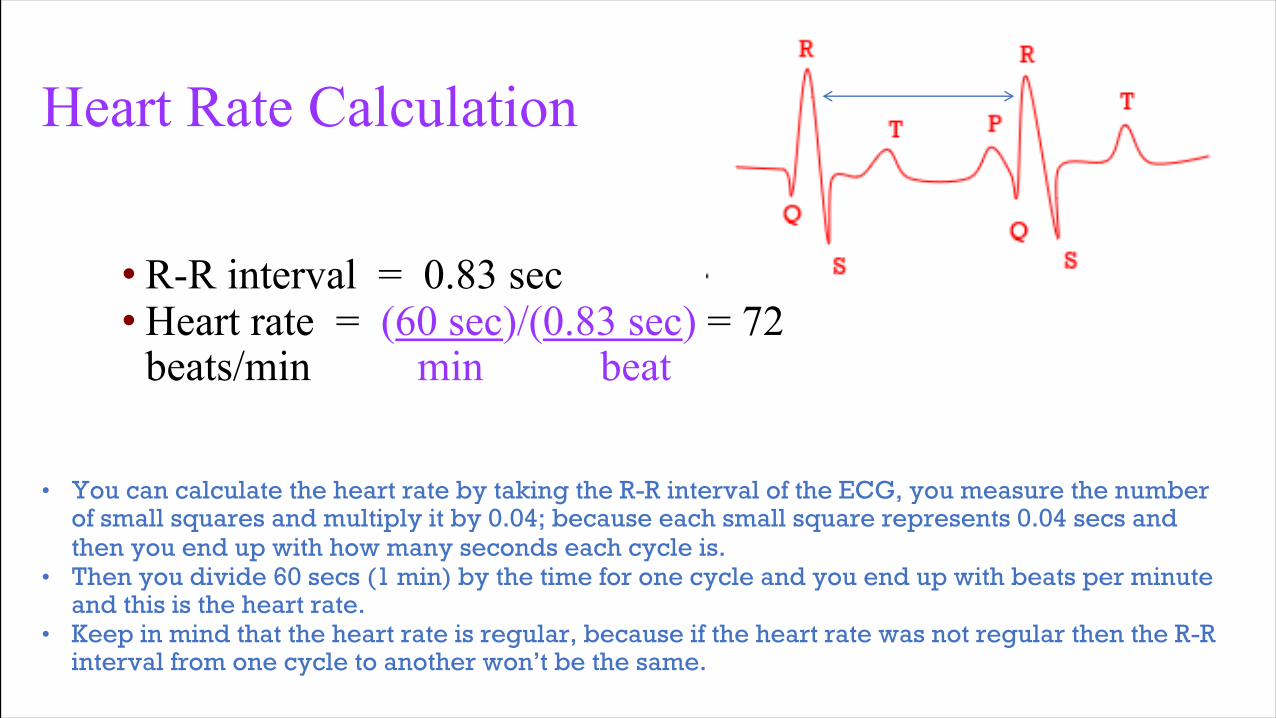
• R-R interval = 0.83 sec•Heart rate = (60 sec)/(0.83 sec) = 72
beats/min min beat
26
• You can calculate the heart rate by taking the R-R interval of the ECG, you measure the number of small squares and multiply it by 0.04; because each small square represents 0.04 secs and then you end up with how many seconds each cycle is.
• Then you divide 60 secs (1 min) by the time for one cycle and you end up with beats per minute and this is the heart rate.
• Keep in mind that the heart rate is regular, because if the heart rate was not regular then the R-R interval from one cycle to another won’t be the same.

ECG Calculations
270.04 x 20 = 0.860/0.8 = 75 beats/min
• The PR interval is from the beginning of P to the beginning of Q, or the beginning of R if Q doesn’t show up and it should be less than or equal to 0.2, if it is more than 0.2 then it denotes something abnormal.
• QRS is from the beginning of Q to the end of S, and it should be less than 0.12 seconds.
• QT interval is around 0.35-0.45 secs.• We look to the segments, such as the ST
segment ,if they are deflected, it should be an isoelectric line (whether it was deflected upwards or downwards).
• Other segments like the PR segment (from the end of P to the beginning of Q or R, and the TP segment, which is our reference line for the isoelectric line.
19-20squares

ECG Calculations
28
• According to the calibration, each small square is 0.04 secs and each big one is 0.2 secs, if the speed of the machine is 25 mm/sec. (X axis)
• And regarding the voltage, each small square is 0.1 mv, so every 10 squares is 1 mv. (Y axis)

Determine regularity
• See the distance between the first RR interval then put this distance on the next RR interval and if they overlap then that means they are an equal distance away from each other, and that they are regular.
• Look at the R-R distances (using a caliper or markings on a pen or paper).• Regular (are they equidistant apart)? Occasionally irregular? Regularly
irregular (if the irregularity repeats itself)? Irregularly irregular? Interpretation?
29
Regular
R R
R R
• Something to know , that we give the patient with atrial fibrillation an anticoagulant because of stasis of the blood flow

ThankYou