phytoplankton community distribution in relation to ... · mar ecol prog ser 446: 73–89, 2012 ex...
TRANSCRIPT

MARINE ECOLOGY PROGRESS SERIESMar Ecol Prog Ser
Vol. 446: 73–89, 2012doi: 10.3354/meps09499
Published February 2
INTRODUCTION
The mariculture of China has been steadily grow-ing since the 1980s, when the transformation of tra-ditional fishing began. This transformation has beenbrought about by the decline in fishery resourcesand capture in coastal areas. China currently hasthe lar gest aquaculture industry in the world,accounting for 67% of global production in terms of
quantity and 49% of global value in 2006 (FAO2009). In 2008, the annual production estimates ofshellfish, fish, crustaceans, and seaweed were 10.08,0.75, 0.94, and 1.39 million t, respectively, with atotal yield of 13.40 million t (COYBEC 2009). Such arapid development of mariculture provides abun-dant protein and contributes to the alleviation offood pressure in China caused by population in -crease. However, the disordered development and
© Inter-Research 2012 · www.int-res.com*Corresponding author. Email: [email protected]
Phytoplankton community distribution in relationto environmental parameters in three aquaculture
systems in a Chinese subtropical eutrophic bay
Zhi-Bing Jiang1, Quan-Zhen Chen1, Jiang-Ning Zeng1,*, Yi-Bo Liao1, Lu Shou1,2, Jingjing Liu1
1Laboratory of Marine Ecosystem Biogeochemistry, Second Institute of Oceanography, SOA, Hangzhou 310012, PR China2College of Life Sciences, Nanjing Normal University, Nanjing 210097, PR China
ABSTRACT: There is concern about the impact of expanding coastal aquaculture activity, particu-larly in China, with the biggest aquaculture industry in the world. We conducted 3 cruises to theoyster, kelp and fish farms of the Xiangshan Bay during the winter−spring transition (02/2009), winter (01/2010) and spring (04/2010). Our aim was to explore the spatial heterogeneity of thephytoplankton community in different culture habitats and evaluate the effects of mariculture onphytoplankton. Different culture types formed unique small-scale habitats that exhibited variousen vironmental gradients and forms of phytoplankton community patchiness. Both environmental(i.e. temperature, salinity, transparency, suspended solids, dissolved oxygen, pH, dissolved inor-ganic nitrogen, PO4-P, SiO3-Si, N/P, and total organic carbon) and phytoplankton (i.e. cell density,chlorophyll a, species richness, main dominant species, and community structure) parameters weresignificantly different among the 3 culture habitats. Canonical correspondence analysis showed thatphytoplankton distribution was mainly influenced by temperature, nutrition, salinity and suspendedsolids. Oyster and kelp farming effectively alleviated coastal eutrophication and also increased species richness and diversity; fish farming did not. Temperature elevation caused by the thermaldischarge from a power plant induced phytoplankton blooms during the winter and winter−springtransition. Nevertheless, the filtering effect of suspended oysters dramatically reduced microalgalbiomass. The kelp and oyster farms were much better than the fish farm in terms of water quality,phytoplankton composition, and habitat restoration function. These results provide guidelines forfuture policy-making in aquaculture as well as eutrophication control and management.
KEY WORDS: Xiangshan Bay · Aquaculture · Phytoplankton abundance · Community composition ·Environmental parameters · Coastal eutrophication
Resale or republication not permitted without written consent of the publisher

Mar Ecol Prog Ser 446: 73–89, 2012
ex cessive ex ploitation of aquaculture also have ne -gative environmental effects. In particular, fish andshrimp cultures require large energy inputs (Yanget al. 2004, Dong et al. 2008). The huge terrestrialnu trient input as well as the nitrogen (N) andphospho rus (P) discharges from intensive maricul-ture activities lead to eutrophication in major Chi-nese coastal systems (Xiao et al. 2007), which cancause a succession of serious losses in the ecologi-cal, economic, and social benefits of coastal waters(see Bricker et al. 2008).
Marine phytoplankton play a key role in thefood web. These organisms are crucial in the cyclingof substances and energy in marine ecosystems.Once phytoplankton composition and production arealtered by aquaculture effects (e.g. increased nutri-ents and variations in nutrient ratios), the biodiver-sity, ecological functions and biogeochemical cyclingof culture areas also change (Souchu et al. 2001,Alongi et al. 2003). Fish cages and shrimp ponds re -lease abundant organic and inorganic matter (i.e. Nand P from unconsumed feed and fecal material thataccumulate in water and sediments) resulting in eu -tro phication and phytoplankton blooms (Dong et al.2008, Lauer et al. 2009). In contrast, macroalgal (sea-weed) cultivation, as an environment-friendly aqua-culture mode, can efficiently remove and assimilateN and P, thereby alleviating the coastal eutrophica-tion symptoms (Fei 2004, Neori et al. 2004, He et al.2008). Consequently, macroalgae may compete withphytoplankton for inorganic nutrients and reduce therisk of algal bloom. Similarly, shellfish cultures (e.g.oyster, mussel and clam) exhibit strong top- downcontrol of primary production by filtering large volumes of phytoplankton from the water column(Dupuy et al. 2000, Souchu et al. 2001, Huang et al.2008, Lefebvre et al. 2009, Grangeré et al. 2010).
Given the significance of phytoplankton in cultureregions, many researchers have recently paid atten-tion to the effects of different culture types on marinephytoplankton. The types include fish cages (Alongiet al. 2003, Wang et al. 2006, Navarro et al. 2008,San Diego-McGlone et al. 2008, Sidik et al. 2008), sus pended mussels (Trottet et al. 2008a,b, Huang etal. 2008), and shrimp ponds (Casé et al. 2008). How-ever, the effects of macroalgal cultivation on phyto-plankton have not yet been reported. The responsesof phytoplankton assemblages to the various culturesystems have also not been compared. The phyto-plankton community structure and its re lationshipwith environmental parameters under mariculturestress has not been explored either (Wang et al. 2006).All these phenomena need to be given attention.
Based on China’s mariculture status, 3 typicallycultured species (i.e. the Chinese oyster Ostrea pli-catula, the kelp Laminaria japonica, and the Japan-ese seaperch Lateolabrax japonicus) were chosen torepresent culture of suspended bivalves, macroalgaeand fishes, respectively. The distribution pattern ofthe phytoplankton community and its relationshipwith environmental factors in the 3 above-mentionedculture systems in a subtropical eutrophical bay(Xiangshan Bay) in China were studied. The physi-cal, chemical and biological parameters of the watercolumn were investigated during different seasons.Aquaculture in this bay has expanded in the past 3decades, evidence of the tremendously increasedscale of mariculture in China (Ning & Hu 2002,Nobre et al. 2010). The objectives of the presentstudy were (1) to explore the spatial distribution pattern of the phytoplankton community and exam-ine its relationship with environmental parameters indifferent culture habitats of small scale, (2) to evalu-ate the effects of mariculture on phytoplankton andappraise superiority among them based on biologicaland chemical factors, and (3) to provide constructiveguidelines for future aquaculture policymaking aswell as eutrophication control and management.
MATERIALS AND METHODS
Study area and sampling stations
The Xiangshan Bay (121° 25’ to 122° 30’ E, 29° 25’to 29° 47’ N; see Fig. 1) is a large bay (tidal flat area:198 km2; waters area: 365 km2) located in the Northern Zhejiang Province, China. This bay is long(ca. 60 km), narrow, and connected to the EastChina Sea, with long residence times in the innerand middle sections (about 80 and 60 d, respec-tively) for 90% water exchanges (Ning & Hu 2002).The tidal current is dominated by a reciprocatingflow with a range of 2.31 m in the study area. Resid-ual circulation is mainly controlled by the gravita-tional circulation that arises from surface waterflowing to the sea and bottom water flowing to theend of the fiord (Dong & Su 2000a). Around the cul-tivated areas, the residual currents of the surfacewater during winter neap and spring tide are 2.86and 5.82 cm s−1, respectively (Ning & Hu 2002). Esti-mates of aquaculture production in the bay in 2005to 2006 were 45 000 t shellfish yr−1 (93% of whichconsists of the Chinese oyster produced either onropes or in intertidal areas), 9400 t finfish yr−1
(Nobre et al. 2010) and little kelp.
74

Jiang et al.: Environmental effects on phytoplankton in aquaculture systems
Three cruises were conducted to the oyster (OP),kelp (LC) and fish (FC) farms in different seasons(Fig. 1, Table 1); the culture acreages of these farmswere about 920, 20, and 18.7 ha, respectively (You &Jiao 2011). Kelp is a cold water species cultivated onlyduring the winter and spring seasons in XiangshanBay. Therefore, the surveys for the 3 culture systemswere performed only during these 2 seasons. In eachcul ture area, 3 or 4 sampling stations were set at the center (0) and edge (1), as well as at 100 m (2) and1000 m (3) m away from the edge. Generally, most ofthe 2 to 3 yr old oysters are harvested in winter andspring. The young and juvenile animals are cultivatedthe following year. Kelp is usually harvested in lateApril, and our investigation date (25 April 2010) forthe kelp farm was coincidentally within the harvestingperiod. The cultured fish were usually fed on masstrash fishes and some compound feeds in the morning.The samples were collected at noon.
Environmental parameters
Surface (0.5 m depth) and bottom (0.5 m from the bot-tom) waters were collected at each station using a 10 lplastic bucket. Water depth, transparency, pH, tem-perature and salinity were monitored in situ. Watertemperature and salinity were measured using a YSImodel 30 salinity meter, and transparency was de -termined using a Secchi disc. Dissolved oxygen (DO)was measured by Winkler titrations, and pH was mea-sured using an Orion 868 pH meter (Thermo Electron).For analysis of dissolved inorganic nitrogen (DIN:NO3- N + NO2-N + NH3-N), PO4-P, SiO4-Si, chlorophylla (chl a), total organic carbon (TOC), and suspendedsolids (SS), 5 l water samples were kept in the darkand deep frozen before the laboratory procedures.The water samples were immediately filtered throughpre-combusted (at 450°C for 4 h) 0.45 µm pore-sizeWhatman GF/F filters for nutrients and chl a. The nutrients were measured according to previously de-scribed colorimetric methods (Yin et al. 2001). Chl a
was fluorescently determined using a Turner Designs10-AU fluorometer. TOC was estimated by elementalanalysis (Vario MICRO Cube, elemental analyzer).For SS analysis, after the samples were filteredthrough preweighed filters (Whatman GF/C), the filters were dried at 105°C to a constant mass andweighed. The dry mass of the particulate materialscaptured on each filter was calculated by subtractingthe filter mass from the dried mass.
Phytoplankton community
Surface and bottom waters (400 to 500 ml for eachof the 3 samples) were poured into 500 ml bottles ateach station. All samples collected were stored with4% formalin. After sedimentation (at least 48 h),phyto plankton taxa were identified and counted on ascaled slide (0.1 ml) under 200× or 400× magnifica-tion using a light microscope (Leica DM2500). Atleast 300 units (individual cells or colonies) werecounted for each sample. The phytoplankton abun-dance was expressed as ×104 cells l−1. Dominance(D and Y for certain stations and investigation re -gions, respectively) was calculated according to thefollowing equations: D = ni/N; Y = nifi/N, where ni
is the number (cells) of individuals of species i and Nis the total number of individuals, and fi is the fre-quency of species i occurring in a sample. Only thosespecies at certain stations that had a minimum of 2%contribution to the total abundance were consideredto be dominants.
75
121.5° 121.6°
29.4°
29.5°
OutletInlet
Ninghai Power Plant
OPFC
LC
Fig. 1. The 3 sampled mariculture areas in the XiangshanBay. OP: oyster farm; FC: fish farm; LC: kelp farm
Season Farm Oyster Kelp Fish
Winter–spring 25/02/2009 27/02/2009 28/02/2009transition
Winter 29/01/2010 30/01/2010 31/01/2010Spring 23/04/2010 25/04/2010 23/04/2010
Table 1. Dates of sampling at 3 culture areas of Xiangshan Bay during different seasons. Dates are dd/mm/yy
Mar Ecol Prog Ser 446: 73–89, 2012
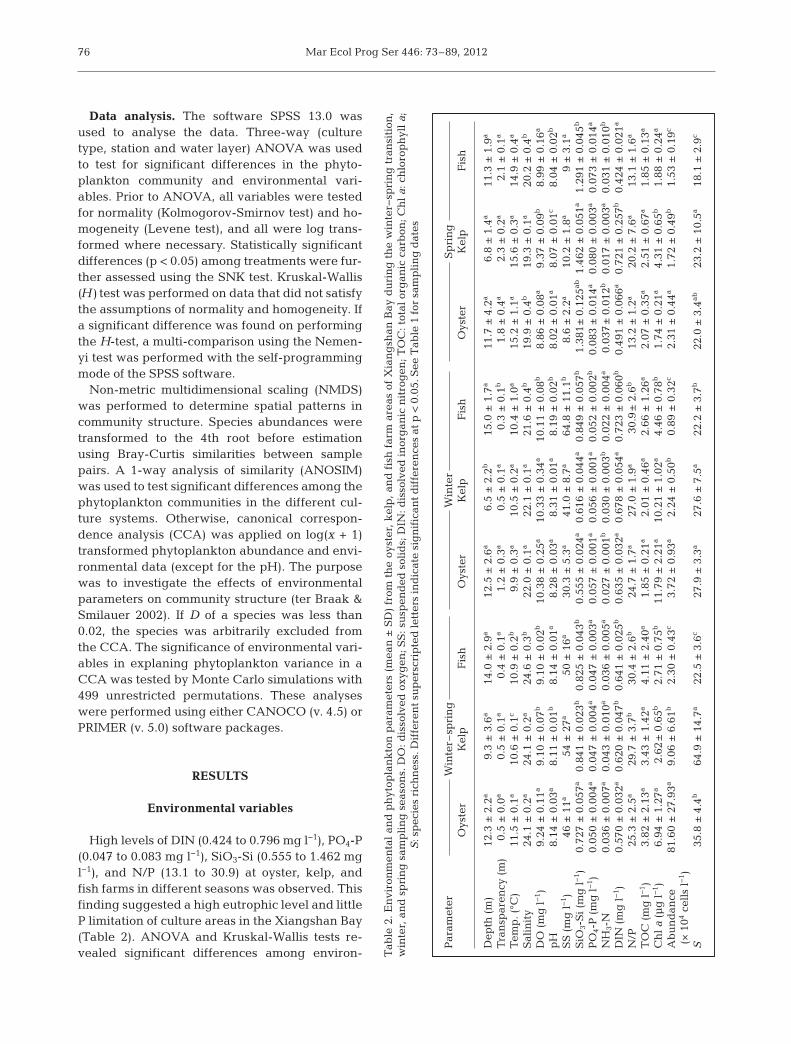
Data analysis. The software SPSS 13.0 wasused to analyse the data. Three-way (culturetype, station and water layer) ANOVA was usedto test for significant differences in the phyto-plankton community and environmental vari-ables. Prior to ANOVA, all vari ables were testedfor normality (Kolmogorov-Smirnov test) and ho-mogeneity (Levene test), and all were log trans-formed where necessary. Statistically significantdifferences (p < 0.05) among treatments were fur-ther assessed using the SNK test. Kruskal-Wallis(H) test was performed on data that did not satisfythe assumptions of normality and homogeneity. Ifa significant difference was found on performingthe H-test, a multi-comparison using the Ne men -yi test was performed with the self-programmingmode of the SPSS software.
Non-metric multidimensional scaling (NMDS)was performed to determine spatial patterns incommunity structure. Species abundances weretransformed to the 4th root before estimationusing Bray-Curtis similarities between samplepairs. A 1-way analysis of similarity (ANOSIM)was used to test significant differences among thephytoplankton communities in the different cul-ture systems. Otherwise, canonical correspon-dence analysis (CCA) was applied on log(x + 1)transformed phytoplankton abundance and envi-ronmental data (except for the pH). The purposewas to investigate the effects of environmentalparameters on community structure (ter Braak &Smilauer 2002). If D of a species was less than0.02, the species was arbitrarily excluded fromthe CCA. The significance of environmental vari-ables in explaning phytoplankton variance in aCCA was tested by Monte Carlo simulations with499 unrestricted permutations. These analyseswere performed using either CANOCO (v. 4.5) orPRIMER (v. 5.0) software packages.
RESULTS
Environmental variables
High levels of DIN (0.424 to 0.796 mg l−1), PO4-P(0.047 to 0.083 mg l−1), SiO3-Si (0.555 to 1.462 mgl−1), and N/P (13.1 to 30.9) at oyster, kelp, andfish farms in different seasons was ob served. Thisfinding suggested a high eutro phic level and littleP limitation of culture areas in the Xiangshan Bay(Table 2). ANOVA and Kruskal-Wallis tests re -vealed significant differences among environ-
76
Par
amet
er
W
inte
r–sp
rin
g
Win
ter
S
pri
ng
Oys
ter
K
elp
Fis
h
O
yste
r
Kel
p
F
ish
Oys
ter
K
elp
Fis
h
Dep
th (
m)
12
.3 ±
2.2
a
9.3
± 3
.6a
14.0
± 2
.9a
1
2.5
± 2
.6a
6.
5 ±
2.2
b
1
5.0
± 1
.7a
1
1.7
± 4
.2a
6.
8 ±
1.4
a
1
1.3
± 1
.9a
Tra
nsp
aren
cy (
m)
0.
5 ±
0.0
a
0.5
± 0
.1a
0.4
± 0
.1a
1.2
± 0
.3a
0.
5 ±
0.1
a
0.3
± 0
.1b
1.8
± 0
.4a
2.
3 ±
0.2
a
2.1
± 0
.1a
Tem
p. (
°C)
11.
5 ±
0.1
a
1
0.6
± 0
.1c
10.9
± 0
.2b
9.9
± 0
.3a
10.
5 ±
0.2
a
1
0.4
± 1
.0a
1
5.2
± 1
.1a
15.
6 ±
0.3
a
1
4.9
± 0
.4a
Sal
init
y
2
4.1
± 0
.2a
24.
1 ±
0.2
a
24.6
± 0
.3b
2
2.0
± 0
.1a
22.
1 ±
0.1
a
2
1.6
± 0
.4b
1
9.9
± 0
.4b
19.
3 ±
0.1
a
2
0.2
± 0
.4b
DO
(m
g l
−1 )
9.24
± 0
.11a
9.10
± 0
.07b
9.10
± 0
.02b
10.3
8 ±
0.2
5a
10.
33 ±
0.3
4a
10.
11 ±
0.0
8b
8.
86 ±
0.0
8a
9.
37 ±
0.0
9b
8.
99 ±
0.1
6a
pH
8.
14 ±
0.0
3a
8.
11 ±
0.0
1b
8.
14 ±
0.0
1a
8.
28 ±
0.0
3a
8.
31 ±
0.0
1a
8.
19 ±
0.0
2b
8.
02 ±
0.0
1a
8.
07 ±
0.0
1c
8.
04 ±
0.0
2b
SS
(m
g l
−1 )
46 ±
11a
54 ±
27a
50 ±
16a
30.3
± 5
.3a
41.
0 ±
8.7
a
64
.8 ±
11.
1b
8.6
± 2
.2a
10.
2 ±
1.8
a
9 ±
3.1
a
SiO
3-S
i (m
g l
−1 )
0.
727
± 0
.057
a0.
841
± 0
.023
b
0.82
5 ±
0.0
43b
0.
555
± 0
.024
a0.
616
± 0
.044
a0.
849
± 0
.057
b1.
381
± 0
.125
ab1.
462
± 0
.051
a1.
291
± 0
.045
b
PO
4-P
(m
g l
−1 )
0.05
0 ±
0.0
04a
0.04
7 ±
0.0
04a
0.04
7 ±
0.0
03a
0.
057
± 0
.001
a0.
056
± 0
.001
a0.
052
± 0
.002
b
0.08
3 ±
0.0
14a
0.08
0 ±
0.0
03a
0.07
3 ±
0.0
14a
NH
3-N
0.03
6 ±
0.0
07a
0.04
3 ±
0.0
10a
0.03
6 ±
0.0
05a
0.
027
± 0
.001
b0.
030
± 0
.003
b0.
022
± 0
.004
a
0.03
7±
0.0
12b
0.01
7 ±
0.0
03a
0.03
1 ±
0.0
10b
DIN
(m
g l
−1 )
0.
570
± 0
.032
a0.
620
± 0
.047
b
0.64
1 ±
0.0
25b
0.
635
± 0
.032
a0.
678
± 0
.054
a0.
723
± 0
.060
b
0.49
1 ±
0.0
66a
0.72
1 ±
0.2
57b
0.42
4 ±
0.0
21a
N/P
25.
3 ±
2.5
a
2
9.7
± 3
.7b
30.4
± 2
.6b
2
4.7
± 1
.7a
27.
0 ±
1.9
a
30.9
± 2
.6b
1
3.2
± 1
.2a
20.
2 ±
7.6
a
1
3.1
± 1
.6a
TO
C (
mg
l−
1 )
3.82
± 2
.13a
3.43
± 1
.42a
4.11
± 2
.40a
1.85
± 0
.21a
2.01
± 0
.46a
2.66
± 1
.26a
2.07
± 0
.35a
2.51
± 0
.67a
1.85
± 0
.13a
Ch
l a
(µg
l−
1 )
6.94
± 1
.27a
2.62
± 0
.65b
2.71
± 0
.75b
11.7
9 ±
2.2
1a
10.
21 ±
1.0
2a
4.
46 ±
0.7
8b
1.
74 ±
0.2
1a
4.
31 ±
0.6
5b
1.
88 ±
0.2
4a
Ab
un
dan
ce
81
.60
± 2
7.93
a
9.06
± 6
.61b
2.30
± 0
.43c
3.72
± 0
.93a
2.24
± 0
.50b
0.89
± 0
.32c
2.31
± 0
.44a
1.72
± 0
.49b
1.53
± 0
.19c
(× 1
04ce
lls
l−1 )
S
35
.8 ±
4.4
b
64
.9 ±
14.
7a
2
2.5
± 3
.6c
2
7.9
± 3
.3a
27.
6 ±
7.5
a
2
2.2
± 3
.7b
22
.0 ±
3.4
ab
23
.2 ±
10.
5a
18
.1 ±
2.9
c
Tab
le 2
. E
nvi
ron
men
tal
and
ph
ytop
lan
kto
n p
aram
eter
s (m
ean
± S
D)
from
th
e oy
ster
, k
elp
, an
d f
ish
far
m a
reas
of
Xia
ng
shan
Bay
du
rin
g t
he
win
ter−
spri
ng
tra
nsi
tion
,w
inte
r, a
nd
sp
rin
g s
amp
lin
g s
easo
ns.
DO
: dis
solv
ed o
xyg
en; S
S: s
usp
end
ed s
olid
s; D
IN: d
isso
lved
in
org
anic
nit
rog
en; T
OC
: tot
al o
rgan
ic c
arb
on; C
hl
a: c
hlo
rop
hyl
l a;
S
:sp
ecie
s ri
chn
ess.
Dif
fere
nt
sup
ersc
rip
ted
lett
ers
ind
icat
e si
gn
ific
ant
dif
fere
nce
s at
p <
0.0
5. S
ee T
able
1 f
or s
amp
lin
g d
ates

Jiang et al.: Environmental effects on phytoplankton in aquaculture systems
mental parameters (i.e. salinity, DO,pH, SiO3-Si, PO4-P, DIN, and N/P) inthe cult ure systems during all seasons.The levels of SiO3-Si, DIN, and N/P atthe fish farm were higher than those atthe oyster and kelp farms in winterand the winter− spring transition, butlower in spring. For the oyster farm(Fig. 2), the levels of surface DIN,TOC, and SS were higher outside thaninside the farm; the bottom DIN valueswere higher than the surface ones; thelevels of PO4-P and NH3-N at differentstations had no specific trends. For thekelp farm (Fig. 2), both the surface andbottom levels of DIN, PO4-P, and SSwere generally lower inside than out-side; surface NH3-N and TOC werehigher inside than outside. For the fishfarm in winter and winter− spring tran-sition (Fig. 2), both surface and bottomlevels of DIN, NH3-N, PO4-P, and TOCwere a little higher inside than out-side; in spring, the values were muchhigher inside than outside.
Abundance and chl a
The phytoplankton abundance atthe kelp farm (9.06, 2.24, and 1.72 ×10⁴ cells l−1) was lower than at the oys-ter farm (81.60, 3.72, and 2.31 × 10⁴
cells l−1) but higher than at the fishfarm (2.30, 0.89, and 1.53 × 10⁴
cells l−1) in winter–spring, winter, andspring, re spectively, (Table 2). Thecult ure type had a highly significant(p < 0.001) influence on phytoplanktonab undance in all seasons. The sta-tion and water layer had significant(p < 0.05) in fluences in winter andspring, but no impact in winter–spring(Table 3). There were highly signifi-cant differences between samplingstations at both oyster and kelp farms.Both the surface and bottom phyto-plankton cell numbers inside (OP0 andOP1) the oyster farm were signifi-cantly (p < 0.05) lower than outside(OP3) during all survey seasons(Fig. 3). Similar results were found forchl a (Fig. 2). The surface and bottom
77
Fig. 2. Seasonal variation in environmental parameters and chlorophyll a(chl a) concentration in surface (S) and bottom (B) waters at sampling stationslocated at the centre of culture areas (0), inside and at the edge (1), 100 m out-side (2), and 1000 m outside (3). SS: suspended solids; DIN: dissolved inor-ganic nitrogen; TOC: total organic carbon; winter− spring transition: 02/2009;
winter: 01/2010; spring: 04/2010

Mar Ecol Prog Ser 446: 73–89, 2012
abundances at LC0 were significantly (p < 0.05)higher than LC3 in winter and spring. Never theless,the sur face cell density results in winter−spring werecontradictory, and chl a inside the kelp farm washigher than outside. The surface and bottom phyto-plankton cell numbers inside (FC0 and FC1) the fishfarm were significantly (p < 0.05) lower than outside(FC3) in winter, but samples taken during other sea-sons showed no remarkable differences. Chl a atother stations also showed no difference.
Species richness (S)
Phytoplankton S was significantly (p < 0.05)affected by the culture type and station in all surveyseasons, but not by the water layer in winter andspring (Table 3). Phytoplankton S at the oyster (35.8,27.9, and 22.0) and kelp (64.9, 27.6, and 23.2) farmswas significantly higher than at the fish farm (22.5,22.2, and 18.1) in winter− spring, winter and spring,respectively. Both the surface and bottom S inside
the oyster and kelp farms were muchhigher than that outside during allsurvey seasons (Fig. 4). S inside andoutside the fish farm showed no obvi-ous difference.
Dominant species
Table 4 reveals an obvious discrep-ancy among the phytoplankton domi-nant species compositions (or domi-nances) of the 3 culture areas in allsurvey seasons. For instance, duringthe winter−spring transition, Skele -tonema costatum (0.540) was clearlythe dominant species at the oysterfarm, followed by Rhizo so lenia deli-catula (0.128). The kelp farm wasdominated by S. costatum (0.165) fol-lowed by Thalassiosira sp. 1 (0.146).Prorocentrum minimum (0.340) wasclearly the dominant species at thefish farm, followed by R. delicatula(0.158) and Thalassio sira sp. 1 (0.135).
Fig. 5 shows little difference amongthe dominant phytoplankton at thestations and in water layers. The do -minance of Skeletonema cost a tum(45.6 to 60.1%) inside the culture areawas a little lower than outside. Theopposite was true for Pro ro centrumminimum and Thalassiosira sp. 1. Inwinter, the dominance of P. minimumwas higher outside than inside theoyster farm; the opposite was true forNavi cula co rym bosa. In spring, thedominance of Me lo sira sp. outside thefarm was higher than inside; the op-posite was true for Thalassiosira sp. 1.There were significant domi nant gra-dation differences am ong the differentstations and water layers at the kelp
78
Season Parameters Cultural type Station Water layer
Winter– Abundance H(2,72) = 59.6*** H(3,72) = 1.4NS H(1,72) = 1.1NS
spring S F(2,65) = 169.5*** F(3,65) = 3.0* F(1,65) = 11.5**
Winter Abundance F(2,48) = 135.3*** F(2,48) = 3.9* F(1,48) = 22.3*** S F(2,48) = 7.7*** F(2,48) = 3.9* F(1,48) = 1.0NS
Spring Abundance F(2,48) = 43.9*** F(2,48) = 6.2** F(1,48) = 8.7** S F(2,48) = 4.9* F(2,48) = 16.1*** F(1,48) = 3.1NS
Table 3. Three-way ANOVA (F) and Kruskal-Wallis (H) test results of abun-dance and species richness (S) in culture areas of Xiangshan Bay during
different seasons. NS : not significant, * p < 0.05, ** p < 0.01, *** p < 0.001
Bottom (Winter)
OysterKelpFish
Surface (Winter)
0
1
2
3
4
5
6
Cel
l num
ber
(104
cells
l–1) 0
20
6080
100120140
Surface (Winter–spring) Bottom (Winter–spring)
Bottom (Spring)
0 1 2 3
a
aa
a
a
aa
a
a
aa aa
b
c
b ab
b
b
b
cc
a
a
b
c
c ba
a a
b
a bb
ab
c
a a b
Surface (Spring)
Station0 1 2 3
0.00.5
1.0
1.5
2.0
2.5
3.03.5
a ab
a
b
c
aa
a a aa
a
bc
aa
a
b
Fig. 3. Phytoplankton abundance at different sampling stations in 3 culturesystems during the winter−spring transition, winter, and spring. Differentlower- case letters show significant (p < 0.05) differences among stations (atthe same farm and in the same water layer). See Fig. 2 for further details of
stations and seasons

Jiang et al.: Environmental effects on phytoplankton in aquaculture systems
farm (Fig. 6). For example, during thewinter− spring transition, the domi-nances of S. costatum in surface waterat Stns LC0 (35.9 ± 5.4%, mean ± SD)and LC1 (28.9 ± 4.4%) were signifi-cantly (p < 0.001) higher than at StnsLC2 (11.1 ± 5.0%) and LC3 (10.3 ±4.0%). In contrast, the dominances ofThalassiosira sp. 1 shown in Fig. 7 re -vealed no conspicuous variance am ongthe different stations and water layers.
Cluster analysis
Both NMDS and cluster analysisshowed that the phytoplankton com-munity in culture areas could be gen-erally classified into 3 groups accord-ing to culture systems (Figs. 8 & 9).The 3 culture systems were relativelydifferent from each other (see the re -sults of ANOSIM in Table 5).
Canonical correspondence analysis
The CCA showed higher p-valuesfor axis 1 and all canonical axes in all
79
Surface (Spring)
Station0 1 2 3
0
10
20
30
40
Surface (Winter–spring)
0
20
40
60
80
100
Oyster Kelp Fish
Bottom (Winter–spring)
Surface (Winter)
Sp
ecie
s ric
hnes
s
0
10
20
30
40Bottom (Winter)
Bottom (Spring)
0 1 2 3
aab b
ab
c c
aaaa aab ab
b
a aa
b
ab b c
aa
b
aa
b
aab
ba
a a
a
b
ca
b b
ab b
aa
b
a a a
aa
b
a
b
c
aa
a
Fig. 4. Species richness (S) of phytoplankton at different sampling stations in 3culture systems during the winter−spring transition, winter, and spring. See
Figs. 2 & 3 for details
Species Winter–spring Winter Spring Oyster Kelp Fish Oyster Kelp Fish Oyster Kelp Fish
Chaetoceros abnormis 0.043 0.045 – – – – – – 0.044Coscinodiscus curvatulus – – 0.033 – – 0.058 – – –Coscinodiscus jonesianus – – – 0.043 0.085 0.185 0.037 0.278 0.083Cyclotella sp. 0.069 0.094 – – – – – – –Ditylum brightwelli 0.025 0.072 – 0.092 0.063 0.060 – – –Melosira sp. – – – – – – 0.214 – 0.168Navicula corymbosa – 0.034 0.026 0.037 0.021 0.026 – 0.024 –Nitzschia hungarica – – 0.024 – 0.026 – – – –Nitzschia subtilis – – – – – 0.027 – – –Paralia sulcata – 0.025 0.027 – 0.045 – – – –Pleurosigma aestuarii – – – – 0.023 0.056 – – –Rhizosolenia delicatula 0.128 0.075 0.158 – – – – – –Skeletonema costatum 0.540 0.165 – 0.070 0.082 – 0.057 – 0.048Thalassiosira sp. 1 0.049 0.146 0.135 0.302 0.322 0.133 0.432 0.191 0.373Thalassiosira pacifica – – 0.035 0.024 – – 0.042 0.078 0.047Prorocentrum minimum 0.037 0.090 0.340 0.208 0.182 0.111 – 0.031 0.022Prorocentrum sigmoides – – – – – – 0.029 0.106 0.054Protoperidinium spp. – – – – – 0.031 – – –
Table 4. Dominant (≥0.02) phytoplankton species at the oyster, kelp, and fish farms of Xiangshan Bay in different seasons

Mar Ecol Prog Ser 446: 73–89, 2012
the seasons, based on the Monte Carlo test (Table 6).Hence, the ordination results were credible. The 9environmental variables in the CCA explained 62.5,64.1 and 64.9% of total variation in the phytoplank-ton community during the winter–spring transition,winter and spring, respectively. All species−environ-ment correlations were >0.83 for Axes 1 and 2, indi-cating a significant (p < 0.05) relationship betweeneach of the environmental variable and the dominantphytoplankton. Temperature, nutrients (DIN, SiO3-Si, PO4-P, and N/P), salinity, and SS were the mainvariables that affected phytoplankton communitydistribution as a whole (Fig. 9), although small differ-ences exist ed in different sampling periods.
Five main groups of species were distinguishedaccording to the ordination result (Fig. 10). Group I:ben thic or epiphytic species (e.g. Acti nocyclus ehren - bergii, Actinoptychus undulates, Diploneis smithii,Melosira mo ni liformis, Pleurosigma aestuarii, andthe genera Navicula and Nitzschia) with high SS.Group II: estuarine or brackish planktonic species(e.g. Caloneis silicula, C. ab normis, Synedra gailloni,and the genus Cyclotella) with low salinity, such asCaloneis silicula, C. abnormis, Cyclotella spp. andSynedra gaillonii. Group III: plank tonic species (e.g.Leptocylindrus minimus and Ast ero planus karianus)sensitive to the temperature. Group IV: coastal inner-bay diatoms (e.g. Thalassio nema nitzschioides and
80
Winter–spring
Station0S 1S 2S3S 0B1B 2B 3B
Station0S 1S 3S 0B1B 3B
Station0S 1S 3S 0B1B 3B
Dom
inan
ce (%
)
0
20
40
60
80
100C. abnormis Cyclotella sp. R. delicatula S. costatum Thalassiosira sp. 1 P. minimum Other species
Winter
C. jonesianus D. brightwelliN. corymbosaS. costatumThalassiosira sp. 1 P. minimum Other species
Spring
C. jonesianus Melosira sp. S. costatum Thalassiosira sp. 1T. pacifica P. sigmoides Other species
Fig. 5. Main dominant phytoplankton species at different sampling stations at the oyster farm during the winter−spring transition, winter, and spring. See Figs. 2 & 3 for details. Full species names in Table 4
Winter–spring
Station0S 1S 2S3S 0B1B 2B 3B
Station0S 1S 3S 0B1B 3B
Station0S 1S 3S 0B1B 3B
Dom
inan
ce (%
)
0
20
40
60
80
100
Winter Spring
Cyclotella sp. N. corymbosa R. delicatula S. costatum
P. minimum Other species
C. jonesianus D. brightwelli P. sulcata S. costatum Thalassiosira sp. 1 Thalassiosira sp. 1 P. minimum Other species
C. jonesianus N. corymbosa Thalassiosira sp. 1 T. pacifica P. minimum P. sigmoidesOther species
Fig. 6. Main dominant phytoplankton species at different sampling stations at the kelp farm during the winter−spring transition, winter, and spring. See Figs. 2 & 3 for details. Full species names in Table 4
C. curvatulusP. sulcata R. delicatulaS. costatum Thalassiosira sp. 1 P. minimum Other species
C. jonesianus C. curvatulus D. brightwelli N. corymbosaThalassiosira sp. 1 P. minimum Other species
C. abnormis C. jonesianusMelosira sp. S. costatum Thalassiosira sp. 1 P. sigmoides Other species
Winter–spring
Station0S 1S 2S3S 0B1B 2B 3B
Station0S 1S 3S 0B1B 3B
Station0S 1S 3S 0B1B 3B
Dom
inan
ce (%
)
0
20
40
60
80
100
Winter Spring
Fig. 7. Main dominant phytoplankton species at different sampling stations at the fish farm during the winter−spring transi-tion, winter, and spring. See Figs. 2 & 3 for details. Full species names in Table 4

Jiang et al.: Environmental effects on phytoplankton in aquaculture systems
the genus Coscinodiscus), dinoflagel-lates (e.g. Scrippsiella trochoidea andthe genus Prorocentrum), and Chloro-phyceae (Pyra mi do monas sp.) whichprefer high DIN, SiO3-Si, and N/P;Group V: relative eurythermal andeuryhaline planktonic species (nearthe centre of the ordination) that weremore tolerant to environmental stress,such as Ditylum bright wellii, Nitzschialongissima, and the genus Thalas-siosira.
DISCUSSION
Phytoplankton and environmentalparameters at the oyster farm
The oyster farm was located nearthe outfall of the Ninghai PowerPlant (operating since December 2005,Fig. 1). This farm was surrounded bywater with 1°C temperature ele vationcaused by the large thermal dis-charges (82.5 m3 s−1). Given the longresidence time (80 d) in the innerbay for 90% water exchange, ther-mal effluents re mained in the oysterfarm for a relatively long time. Thefield temperature in winter (9.9°C) andwinter− spring transition (11.5°C) wereclose to the optimal growth tempe -rature of dominant species Skeleto -nema costatum (17 to 25°C; Yan et al.2002) and Prorocentrum minimum (18to 26.5°C; Grzebyk & Berland 1996).Hence, there were relatively high cellnumbers in winter (3.72 × 10⁴ cells l−1)
81
Winter–spring Winter Spring
0P3S0P3S0P2B0P0S0P1S0P2S0P0B0P1B
LC3SLC1SLC0S
LC2S
LC0BLC1BLC3BLC2B
FC1S
FC0SFC0B
FC3SFC2S
FC1BFC2B
FC3B
0P3S 0P3BFC3S
0P0B0P1S0P1B
0P0S
LC1SLC3SLC1BLC0S
LC0BFC3BLC3B
FC1B
FC0S0P0S
0P1S
0P1B0P0B0P3SFC0BFC1B0P3B
FC3BFC3SFC0S
FC1S
FC1S
FC0B
Stress: 0.07 Stress: 0.14 Stress: 0.09
LC1BLC0B
LC1SLC0S
LC3B
LC3S
LC0B
Fig. 8. Non-metric multidimensional scaling (NMDS) of species abundance data collected from surface (S) and bottom (B) waters at the oyster (OP), kelp (LC), and fish (FC) farm stations during the winter−spring transition, winter, and spring. See
Fig. 2 for further details of seasons and stations
Fig. 9. Clusters analysis based on Bray-Curtis similarity matrix of oyster (OP),kelp (LC), and fish (FC) farm stations sampled during the winter−spring transi-tion, winter, and spring. See Fig. 2 for further details of seasons and stations

Mar Ecol Prog Ser 446: 73–89, 2012
and spring (2.31 × 10⁴ cells l−1) of 2010 at this farm(Table 2). These values were much higher than thoseof the same seasons in 2000 (0.22 and 0.77 × 10⁴ cellsl−1, respectively; Ning & Hu 2002). Overall, P waslimiting in the inner Xiangshan Bay, but the PO4-Pconcentration at the oyster farm was relatively higherthan in the other culture areas. This area had favor-able conditions of temperature elevation, good lightpermeation, and flow velocity reduction (due to oys-ters attaching to racks and ropes). Hence, phyto-plankton species (e.g. S. costatum, Thalassiosira spp.,Rhizosolenia delicatula, and P. minimum) consumedmass nutrients to promptly reproduce and formedblooms in winter and the winter− spring transition(81.60 × 10⁴ cells l−1). Consequently, DIN and SiO3-Sidecreased and DO in creased (Table 2).
Phytoplankton S was remarkably higher inside thefarm than outside (Fig. 4), whereas the cell numberand chl a inside were lower than outside (Figs. 2 & 3).
These results revealed that oyster farming reducedcell numbers by filtering microalgae (top-down con-trol), which is supported by many previous reports(Dupuy et al. 2000, Souchu et al. 2001, Huang et al.2008, Grangeré et al. 2010). Large numbers of epibi-otic microalgal taxa were found. These taxa elevatedthe species richness and diversity, although theirabundances were very low. The water temperature(9.9 to 15.2°C) from winter to spring was also too lowfor oyster growth, resulting in a lower energy budgetfor oysters (Mao et al. 2006) and decreased phyto-plankton consumption. In the summer, the culturedoysters and biofouling assemblages that attach to therafts and longlines filter large volumes of microalgaefrom the water column, due to their highest levels ofmetabolism and growth rates (Mazouni et al. 2001,Mao et al. 2006).
Phytoplankton and environmental parametersat the kelp farm
The levels of DIN and PO4-P inside the kelp areawere slightly lower than those outside. This findingmay be related to the small size of the farm and thehigh level of nutrients in background waters. Exceptfor surface abundance in the winter− spring transi-tion, the cell number inside the kelp farm was sig-nificantly higher than outside (Fig. 3). The nitrogenstorage and nitrogen-dependent growth rates ofmicro- and macro algae indicate that microalgae
would be superior under high nutri-ent availability, whereas the slow-growing macroalgae would be supe-rior under low nutrient availability(Pedersen & Borum 1996). In the pre-sent study, under high nutrient avail-ability (Table 2), phytoplanktongrowth was not suppressed bymacroalgae in winter and spring, inaccordance with the above-men-tioned deduction. Tro phic competi-tion and allelopathic effects betweenmicroalgae and kelp were also notsevere. An et al. (2008) have re -ported the possible existence of alle -lo pathic effects between kelp andmicro algae, given that phytoplank-ton growth is inhibited during thewinter−spring transition. Kelp andother macroalgae can release allelo-pathic substances to inhibit micro -algal growth and even cause mortal-
82
Winter–spring Winter Spring R p R p R p
Oyster vs. Kelp 0.87 0.001 0.70 0.002 0.55 0.002Oyster vs. Fish 1.00 0.001 0.64 0.002 0.20 0.41Kelp vs. Fish 0.99 0.001 0.42 0.002 0.55 0.002Global test 0.84 0.001 0.51 0.001 0.45 0.001
Table 5. One-way ANOSIM results of phytoplankton com-munity among oyster, kelp,and fish farms of Xiangshan Bayin different seasons. R is the statistic coefficient which indi-cates the magnitude of difference among groups of samples
Winter–spring Winter Spring Axis 1 Axis 2 Axis 1 Axis 2 Axis 1 Axis 2
Eigenvalues 0.153 0.031 0.087 0.056 0.199 0.043Species-environment 0.855 0.831 0.966 0.945 0.978 0.901correlations
Cumulative 38.3 46.0 24.1 39.5 39.2 47.7percentage variance of species data
Species-environment 61.2 73.6 37.6 61.7 60.4 73.5relation
Sum of all eigenvalues 0.400 0.362 0.507Sum of all canonical 0.250 0.232 0.329eigenvalues
Variance explained 62.5% 64.1% 64.9%Significance of first 0.016 0.006 0.002canonical axis
Significance of all 0.006 0.016 0.022canonical axes
Table 6. Summary of the canonical correspondence analysis on phytoplanktoncommunities and environmental variables in culture areas of Xiangshan Bay
in different seasons

Jiang et al.: Environmental effects on phytoplankton in aquaculture systems
ity, although macro algae have dif ferent in hibitingeffects on different microalgae (Wang et al. 2007).Therefore, the allelopathic effects between micro-and macro-algae require further scrutiny.
There were many epiphytic microalgal taxa (e.g.the genera Diploners, Gyrosigma, Licmophora, Nav-icula, Nitzschia, Pleurosigma, and Synedra) attachedto kelp thalli, which accounted for increased S inside
the kelpfarm (Fig. 4). There were significant differ-ences among dominances at different stations. Forexample, the dominance of Skeletonema costatuminside the kelp farm was significantly higher thanthat outside during the winter−spring transition.There are 2 possible reasons for this. First, there weremicroalgal species differences in the allelopathiceffects of kelp, and S. costatum may be more tolerantto this stress than other species. Second, under flowvelocity reduction caused by cultured kelp, the chainlength of S. costatum inside the farm becomes longerthan that outside. Therefore, decreased sinking rateslikely help the diatom to remain suspended in theupper part of the water column (Takabayashi et al.2006), although this requires further confirmation.
Phytoplankton and environmental parametersat the fish farm
Little feeding and low excretion rates have beenobserved in a Japanese seaperch farm during winterand the winter−spring transition (Ning & Hu 2002),because the low temperature negatively affects fishgrowth. In the present study, with the relativelyquick dilution and extremely high concentration ofnutrients in background waters, the nutrient concen-trations (DIN, NH3-N, PO4-P and TOC) inside thefarm were a little higher than outside at these times(Fig. 2). However, with increased temperature inspring, feeding and excretion increased. Conse-quently, the levels of nutrients and organic matter
83
–0.8 1.0–0.8
0.6
Aeh Aka
Csi
Cab
Ccu
CjoCstr
Csty
Cyc
Lmi
Dbr
Msu
NcoNpa
NhuRde
Sco Tec
ThaPmi
ProTemp
Salinity
pH
SS SiO3
PO4DIN
N/P
TOC
Winter–spring
–1.0 1.0–0.8
1.0
Aun
Aka
Cjo
CcuCsty
Dsm
Dbr
Mmo
Psu
Nco
Nhu
NsuPau
Pac
Rde
Sco
Tpa
Tha
Dip
Pmi
ProStr
Temp
SalinitypH
SS
SiO3
PO4
TOC
DINN/P
Winter
–0.8 1.0–0.6
0.4
BpaCab
Cjo
Ccu
Psu
Mel
Nco
Nlo
Pae
Sco
Sga
Tni
Tha
TpaTha2
PmiPsi
Str
PyrTemp
SalinitypH
SS
SiO3
PO4
TOC
DINN/P
Spring
Fig. 10. Canonical correspondence analysis ordination ofphytoplankton communities with environmental variables,based on data collected from the 3 culture areas of Xiang-shan Bay during the winter−spring transition (02/2009), winter (01/2010), and spring (04/2010). Aeh: Act ino cyclusehrenbergii; Aka: Asteroplanus karianus; Aun: Actinop - tychus undulates; Bpa: Bacillaria paxillifera; Csi: Calo neissilicula; Cab: Chaetoceros abnormis; Ccu: Cos cinodiscuscurvatulus; Cjo: Coscinodiscus jonesianus; Cstr: Cyclotellastriata; Csty: Cyclotella stylorum; Cyc: Cyclotella sp.; Dbr:Ditylum brightwellii; Dsm: Diploneis smithii; Lmi: Lepto-cylindrus minimus; Mmo: Melosira moniliformis; Mel: Melo -sira sp.; Nco: Navicula corymbosa; Npa: Navicula parva;Nhu: Nitz schia hungarica; Nlo: Nitzschia longissima; Nsu:Nitzschia subtilis; Pac: Pleurosigma acutum; Pae: Pleuro -sigma aestuarii; Psu: Paralia sulcata; Rde: Rhizosolenia deli-catula; Sco: Skeletonema costatum; Sga: Synedra gaillonii;Tin: Thalassionema nitzschioides; Tha: Thalassiosira sp. 1;Tpa: T. pacifica; Tha2: Thalassiosira sp. 2; Dip: Diplopsalissp.; Pmi: Prorocentrum minimum; Psi: P. sigmoides; Pro: Pro-toperidinium spp.; Str: Scrippsiella trochoidea; Pyr: Pyra mi -do monas sp. SS: suspended solids; DIN: dissolved inorganic
nitrogen; TOC: total organic carbon

Mar Ecol Prog Ser 446: 73–89, 2012
inside the farm became much higher than outside. Inthe central cultivating area, NH3-N was twice as highas at the station 1000 m away from the edge. Thenutrients that were discharged from feeding andremained as organic particles (mostly from uncon-sumed feed and fecal material) accumulated in thesediments (Dong et al. 2008, Lauer et al. 2009), asevidenced by the high concentrations of sedimentTN, TP and TOC at sampling stations (authorsunpubl. data). With the increased temperature inspring, more nitrogen was discharged from sedi-ments, causing the levels of NH3-N and DIN in bot-tom water inside the farm to become significantlyhigher than outside. These data indicate that (as wellas terrestrial load) the fish farm was a source of N, P,and organic carbon. Nobre et al. (2010) estimatednutrient loads from catchments to be about 4015 tyr−1 of DIN and 730 t yr−1 of P. About 2534 t yr−1 ofDIN and 1039 t yr−1 of P came from fish cages. There-fore, the high level of eutrophication mainly resultedfrom catchment input and excessive aquaculture ac -tivities. However, the levels of DIN (0.596 mg l−1) andNH3-N (0.030 mg l−1), and the ratio N/P (24.8) in thefish farm in 2010 were lower than in 2000 (Ye et al.2002). The annual averages were 0.766 mg l−1 forDIN, 0.081 mg l−1for NH3-N, and 45.2 for the N/Pratio. The PO4-P concentration in 2000 (0.057 mg l−1)was higher than in 2010 (0.031 mg l−1). The decreasein the farm scale may be the reason for these differ-ences between 2000 and 2010.
The phytoplankton cell number inside the fish farmwas significantly lower than outside in winter, butsamples from other seasons showed no remarkabledifferences. This result supports those of previousstudies that have failed to establish a clear relation-ship between fish farm inputs and phyto planktonbio mass (Alongi et al. 2003, Navarro et al. 2008, Sidiket al. 2008). Microalgal (especially dia toms) growthin the fish farm was inhibited by the extreme P limi-tation in winter (N/P = 30.9) and in the winter−springtransition (N/P = 30.4), resulting in the low phyto-plankton abundance and high dominances (0.111and 0.340, respectively) of Prorocentrum minimum.Dinoflagellate species have been re ported to cause aharmful bloom and low diatom/ dinoflagellate ratio ina fish farm in Cape Bolinao, Philippines (San Diego-McGlone et al. 2008). There were negligible differ-ences in abundances, dominant species and S at dif-ferent stations in the fish farm in the present study,possibly due to the negligible spatial heterogeneityof environmental parameters (Fig. 2). Red tide out-breaks of several species (mostly diatoms), such asSkeletonema costatum, Chaetoceros socialis, Paralia
sulcata and Pro ro centrum donghaiense, have previ-ously occurred in the study area (You & Jiao 2011).No report of a P. minimum red tide has been re -corded so far, but its possibility should not be ignoredbecause it is toxic to fish and other animals.
Relationship between phytoplankton communitiesand environmental factors
Samples were collected from 3 culture systems ondifferent days during the cruise. Nevertheless, theresults of our investigation of culture types are credi-ble and comparable because the influence of sam-pling time differences can be ignored. The waterexchange rate is low in the bay, with a long residencetime in the inner and middle sections of about 80 and60 d, respectively, for 90% water ex changes. Thehydrologic regime is dominated by reciprocatingfluid. Hence, water mixing is not apparent (Dong &Su 2000b) and the water body is stable within a rela-tively short sampling period.
In the present study, different culture types formeddifferent small-scale habitats, exhibiting various en -vironmental gradients and forms of phytoplanktoncommunity patchiness. Despite the ANOSIM show-ing significant differences among the culture systems(Table 5), the phytoplankton communities at the oys-ter and kelp farms were relatively similar duringwinter and the winter−spring transition (Figs. 8 & 9).The similarity can be attributed to the co-dominantspecies and homologous epibiotic microalgal speciesat both farms. The dominant phytoplankton specieswere divided into 5 main groups along with environ-mental gradations by CCA ordination (Fig. 10). TheCCA perfectly exhibited the spatial distribution ofdominant phytoplankton taxa and the environmentalvariables.
Temperature and nutrition were the most impor-tant variables that affected the phytoplankton com-munities, according to the CCA results (Fig. 9). Thetemperature elevation caused by thermal dischargesfrom the power plant apparently triggered theblooms of Thalassiosira sp. 1 and Prorocentrum min-imum in winter and Skeletonema costatum in thewinter−spring transition. In fact, before the powerplant was constructed, microalgal blooms usuallyoccurred during late spring (May) or early summer(June) in the Xiangshan Bay. However, since thepower plant became operational in December 2005,red tide outbreaks have occurred in January 2006and 2009. This change indicates that a moderatetemperature increase distinctly promotes phyto-
84

Jiang et al.: Environmental effects on phytoplankton in aquaculture systems
plankton growth, based on the results of laboratoryexperiments (Liao et al. 2008) and field surveys in thepresent study. Compared with historical data, nutri-ent levels and proportions in (or near) the culturearea of Xiangshan Bay have changed remarkably(Table 7). This change has also led to a variation inmicroalgal community composition under the above-mentioned thermal stress, as evidenced by phyto-plankton taxa being co-dominated by diatoms anddinoflagellates from winter to spring. These resultsare not consistent with earlier ones (prior to operationof the power plant), wherein only diatoms dominated(Table 8).
Evaluation and suggestions for the 3 cultivation types
Oyster cultures have been proposed as ecologicalrestoration tools for the top-down control of phyto-plankton blooms and for reversing eutrophication incoastal waters (Newell 2004, Coen et al. 2007, Huang
et al. 2008), although their ecosystem service func-tions are currently controversial (Pome roy et al. 2006,Fulford et al. 2007, Newell et al. 2007, Brigolin et al.2009). Oysters and their biofouling assemblages (e.g.ascidians, bryozoans, sponges, poly chaetes andmacroalgae; Mazouni et al. 2001) indirectly ordirectly remove nutrients by filtering phytoplanktonand other microbial particles. Cumulated faeces andpseudo-faeces on the sea-bed are released into thewater column under suitable conditions, even thoughthe harvest represents a net removal of N and P fromthe ecosystem (Brigolin et al. 2009). Nevertheless, asan important habitat rest oration technique, oysterfarms and created oyster reefs have been widelyadopted (Rodney & Paynter 2006, Taylor & Bushek2008, Quan et al. 2009). These structures are recog-nized as key marine habitats that have numerouseconomic and ecological benefits. Such benefitsinclude commercial fisheries (Peterson et al. 2003),water quality purification (Newell 2004), biodiversityconservation (Thomsen et al. 2007), benthic faunaand reef fish habitat provision (Rodney & Paynter2006, Tallman & Forrester 2007, Quan et al. 2009),as well as the functions of benthic-pelagic couplingand biogeochemistry circulation (Dupuy et al. 2000,Newell 2004, Zhou et al. 2006). Oyster carapacegrowth by mass organic carbon consumption fromthe seawater via calcification is also considered asone method of carbon sink formation (Hung & Kuo2002, Tang et al. 2011). Therefore, we support oysterculture in coastal waters. However, the culture loca-tion must be adjusted temporally according to thebiota and de posited organic matter to maximise theecological and economic benefits. Nobre et al. (2010)have predicted that shellfish (93% oyster) productionin the inner section of the Xiangshan Bay will gener-
85
Year Season DIN PO4-P N/P Source
1981 Winter 0.252 0.020 27.9 ECBCC (1992)2010 Winter 0.679 0.055 27.3 This study1982 Spring 0.299 0.0222 29.8 ECBCC (1992)1992 Spring 0.291 0.0055 88.2 2006 Spring 0.644 0.0512 27.9 Lü et al. (2009)2007 Spring 0.730 0.0488 33.1 2010 Spring 0.535 0.079 15.2 This study
Table 7. Comparison of nutrient concentration (mg l−1) andstructure in (or near) the present study survey areas in win-ter and spring during different years. DIN: dissolved inor-
ganic nitrogen
Year Season Dominant species Source
1981 Winter Nitzschia, Skeletonema, Leptocylindrus, Coscinodiscus and Chaetoceros ECBCC (1992)2000 Winter Chaetoceros, Cyclotella, Leptocylindrus and Melosira Ning & Hu (2002)2007 Winter Cerataulina, Chroococlus and Skeletonema You & Jiao (2011)2008 Winter Skeletonema, Melosira, Pleurosigma, Biddulphia and Bacillaria You & Jiao (2011)2009 Winter Skeletonema You & Jiao (2011)2010 Winter Skeletonema, Coscinodiscus, Ditylum, Thalassiosira and Prorocentrum This study1982 Spring Coscinodiscus, Nitzschia, Rhizosolenia and Melosira ECBCC (1992)2000 Spring Skeletonema, Navicula and Paralia Ning & Hu (2002)2007 Spring Skeletonema, Licmophora and Coscinodiscus You & Jiao (2011)2008 Spring Skeletonema and Coscinodiscus You & Jiao (2011)2009 Spring Coscinodiscus and Skeletonema You & Jiao (2011)2010 Spring Coscinodiscus, Thalassiosira, Melosira, Skeletonema and Prorocentrum This study
Table 8. Comparison of phytoplankton dominant species at (or near) the present study survey areas in winter and spring during different years
�

Mar Ecol Prog Ser 446: 73–89, 2012
ally decrease by 10 to 28%. This prediction is basedon the fact that shellfish growth is sustained by thesubstances to be reduced for the improvement ofwater quality. Therefore, it is advisable to reallocatepart of the oyster culture towards the mouth of theembayment.
Many researchers believe that large-scale sea-weed cultivation, which is economically and ecologi-cally sustainability, is a good solution to the eutroph-ication problem in coastal waters (Fei 2004, Neori etal. 2004, Yang et al. 2004, He et al. 2008). Macro algalremediation not only plays a key role in the sustain-able expansion of aquacluture, but also alleviatespollution and takes up a significant volume of coastalcarbon. These processes effectively eliminate the nu -trient load and perennially control coastal eutro phi -cation. As sources of human food, medicaments, lightindustrial products and marine faunal feed, sea-weeds usually have high economic value. Seaweedsalso fully consume dissolved nutrients in culturewaste water and yield a high value product. The unitculture system output, culture animal quality andproduction, as well as cost reduction improved (Neoriet al. 2004). In addition, seaweeds are importantcom p onents of habitats of marine biota because theyincrease the spatial heterogeneity and biodiversityby altering local hydrodynamic regimes (e.g. turbid-ity, flow velocity, sediment transmission, and resus-pension reduction). Therefore, the cultivation of sea-weeds (such as Gracilaria lemaneiformis, which ismore tolerant to high temperature) in warm seasons,and kelp (or Porphyra haitanensis) in cold seasonsshould be strongly recommended in eutrophic areas.
The negative effects of the fish farm on the envi-ronment are the highest among the culture systems,but its economic benefit may also be the highest. Lowfeeding efficiency caused by high culture densityand feeding quantity (intensive cage farming) usu -ally leads to the mass loss of nutrients (Islam 2005).The level of nutrient loadings would be severalorders of magnitude higher in the areas where livefeed (e.g. trash fish) is used. N and P from fish cages(61% of food waste) are the major contributors of eu-trophication (nutrients) in Xiangshan Bay, based onmultilayered ecosystem models (Nobre et al. 2010).These discharged nutrients lead to oxygen de pletion,water deterioration, and eutrophication ag gravationof aquacultural regions as well as their adjacent wa-ters (Alongi et al. 2003). This fact is especially true inweak water-exchange semi-closed fiords with highculture density, wherein net culture is prone to in-ducing red tides (David et al. 2009). Unfortunately,fish cages in China are mostly located in semi-closed
bays, and the fish are usually fed with excessiveamounts of fresh trash fish and formulated diets forhigh yield. Such a practice results in high accumula-tion of organic matter in the sediment, including un-consumed feedstuff, dejecta and faeces. The de-posited N, P, and organic matter are also re leasedinto the bottom and surface water under certain con-ditions (Dong et al. 2008, Lauer et al. 2009), therebycausing re-pollution and eutrophic process aggrava-tion. In the present study, the enrichment of organicmatter in the sediment was found to be accompaniedby a strong feculent odour and deep anoxic layer atthe fish cage, as has also been previously reported(Hu et al. 2001, Ning & Hu 2002, Holmer & Heilskov2008). From the perspective of eutrophication con -trol, nutrient loads from cages, which remain in highproportion and long-term lag phase in the XiangshanBay, need to be managed and reduced. However, ifthe fish farm is settled on the open, deep sea areawith a strong hydrodynamic regime, the negative ef-fects on the environment are negligible (Vezzulli etal. 2008). Therefore, we suggest that an offshore siteis a better location for cages. Alternatively, a macro -algal polyculture can be adopted at the fish farm toassimilate excessive N and P.
CONCLUSIONS
Different culture types formed different small-scalehabitats, exhibiting various environmental gradientsand forms of phytoplankton community patchiness.The environmental and phytoplankton variableswere found to be significantly different among 3 cul-ture habitats. The distribution of the phytoplanktoncommunity was mainly influenced by temperature,nutrients (DIN, SiO3-Si, PO4-P, and N/P), salinity, andSS. The oyster and kelp farms effectively alleviatedcoastal eutrophication and increased phytoplanktonspecies richness and diversity. The fish farm did not.Microalgal abundance drastically decreased in allsurvey seasons at the oyster farm, but not at the kelpand fish farms. Although the temperature elevationcaused by thermal discharge from a power plantinduced blooms in winter and the winter−springtransition, suspended oysters effectively filtered andreduced phytoplankton biomass under the disadvan-tageous conditions of low-level metabolism andgrowth rate. Thermal effects should not be ignored orunderestimated. Considering the recent constructionof more power plants in Chinese bays where maricul-ture is established, great efforts should be investedinto the study of the phytoplankton responses to cul-
86

Jiang et al.: Environmental effects on phytoplankton in aquaculture systems
ture eutrophication under thermal stress. In terms ofwater quality, phytoplankton variables and habitatrestoration functions, the kelp and oyster farms weremuch better than the fish farm. The kelp and oysterfarms also had no extrinsic energy input or infliction,but exhibited a large net export of nutrients andorganic matter. Through the mariculture of shellfishand seaweeds, about 3.79 ± 0.37 Mt C yr−1 are con-sumed, and 1.20 ± 0.11 Mt C yr−1 are removed fromcoastal waters by harvesting (1999 to 2008) (Tang etal. 2011). Therefore, we propose the development ofthese 2 low-carbon and environmentally friendly cul-ture systems in coastal eutrophic waters. However,due to the huge demand for food supplies, fish farm-ing should not be totally rejected in spite of its nega-tive effects on the coastal environment (especially insheltered bays). Fish must be farmed offshore wherethe water is deep and hydrodynamics are strong. Amacroalgal polyculture could also be adopted at fishfarms to absorb excessive N and P.
Acknowledgements. We thank Xiao-Ya Liu, Long-Kui Yao,Mei Yao, Zheng-Lai Gao, Hai-Na Zhang, Jun-Chao Mo fortheir cooperation in sample and environmental parametersanalysis. We also thank 3 anonymous reviewers and theresponsible editor Katherine Richardson for their insightfulsuggestions. This project was supported by the NationalBasic Research Program of China (2010CB428903), NationalMarine Public Welfare Research Project of China(200805069, 2012418013), Natural Science Foundation ofZhejiang Province (Y5110131, Y5100401), Innovative Teamof Key Science and Technology on Marine Aquaculture ofZhejiang Province (2010R50025), and the Youth ScienceFoundation of SOA (2011106).
LITERATURE CITED
Alongi DM, Chong VC, Dixon P, Sasekumar A, Tirendi F(2003) The influence of fish cage aquaculture on pelagiccarbon flow and water chemistry in tidally dominatedmangrove estuaries of peninsular Malaysia. Mar EnvironRes 55: 313−333
An Z, Wang ZY, Li FM, Tian ZJ, Hu HY (2008) Allelopathicinhibition on red tide microalgae Skeletonema costatumby five macroalgal extracts. Front Environ Sci Eng China2: 297−305
Bricker SB, Longstaff B, Dennison W, Jones A, Boicourt K,Wicks C, Woerner J (2008) Effects of nutrient enrichmentin the nation’s estuaries: a decade of change. HarmfulAlgae 8: 21−32
Brigolin D, Maschio GD, Rampazzo F, Giani M, Pastres R(2009) An individual-based population dynamic modelfor estimating biomass yield and nutrient fluxes throughan off-shore mussel (Mytilus galloprovincialis) farm.Estuar Coast Shelf Sci 82: 365−376
Casé M, Leca EE, Leitão SN, Anna EES, Schwamborn R,Junior ATM (2008) Plankton community as an indicatorof water quality in tropical shrimp culture ponds. Mar
Pollut Bull 56: 1343−1352Coen LD, Brumbaugh RD, Bushek D, Grizzle R and others
(2007) Ecosystem services related to oyster restoration.Mar Ecol Prog Ser 341: 303−307
COYBEC (China Ocean Yearbook Editoring Committee)(2009) China ocean yearbook. China Ocean Press, Bei-jing
David CPC, Maria YYS, Siringan FP, Reotita JM and others(2009) Coastal pollution due to increasing nutrient flux inaquaculture sites. Environ Geol 58: 447−454
Dong LX, Su JL (2000a) Salinity distribution and mixing inXinagshanggang Bay I. Salinity distribution and circula-tion pattern. Oceanol Limnol Sin 31: 151−158 (in Chinese)
Dong LX, Su JL (2000b) Salinity distribution and mixing inXinagshanggang Bay II. Mixing analysis. Oceanol Lim-nol Sin 31: 322−326 (in Chinese)
Dong QX, Lin JD, Shang X, Li J, Huang CJ (2008) Water,organic matter, nitrogen and phosphorus contents in se -di ment of a large-scale mariculture area in the ZhelinBay of eastern Guangdong Province, China. Acta Ocean -ol Sin 27: 133−148
Dupuy C, Vaquer A, Lam-Höai T, Rougier C and others(2000) Feeding rate of the oyster Crassostrea gigas in anatural planktonic community of the MediterraneanThau Lagoon. Mar Ecol Prog Ser 205: 171−184
ECBCC (Editorial Committee of the Bay Chorography inChina) (1992) The Bay Chorography in China, Part 5.Ocean Press, Beijing
FAO (2009) The state of world fisheries and aquaculture(SOFIA) 2008. FAO Fisheries Department, Rome
Fei XG (2004) Solving the coastal eutrophication problem bylarge scale seaweed cultivation. Hydrobiologia 512: 145−151
Fulford RS, Breitburg DL, Newell RIE, Kemp WM, Lucken-bach M (2007) Effects of oyster population restorationstrategies on phytoplankton biomass in Chesapeake Bay: a flexible modeling approach. Mar Ecol Prog Ser 336: 43−61
Grangeré K, Lefebvre S, Bacher C, Cugier P, Ménesguen A(2010) Modelling the spatial heterogeneity of ecologicalprocesses in an intertidal estuarine bay: dynamic interac-tions between bivalves and phytoplankton. Mar EcolProg Ser 415: 141−158
Grzebyk D, Berland B (1996) Influences of temperature,salinity and irradiance on growth of Prorocentrum mini-mum (Dinophyceae) from the Mediterranean Sea. JPlankton Res 18: 1837−1849
He PM, Xu SN, Zhang HY, Wen SS, Dai YJ, Lin SJ, Yarish C(2008) Bioremediation efficiency in the removal of dis-solved inorganic nutrients by the red seaweed, Porphyrayezoensis, cultivated in the open sea. Water Res 42: 1281−1289
Holmer M, Heilskov AC (2008) Distribution and bioturba-tion effects of the tropical alpheid shrimp Alpheus macel-larius in sediments impacted by milkfish farming. EstuarCoast Shelf Sci 76: 657−667
Hu WF, Lo W, Chua H, Sin SN, Yu PHF (2001) Nutrient re -lease and sediment oxygen demand in a eutrophic land-locked embayment in Hong Kong. Environ Int 26: 369−375
Huang CH, Lin HJ, Huang TC, Su HM, Hung JJ (2008)Responses of phytoplankton and periphyton to system-scale removal of oyster-culture racks from a eutrophictropical lagoon. Mar Ecol Prog Ser 358: 1−12
Hung JJ, Kuo F (2002) Temporal variability of carbon and
87
Mar Ecol Prog Ser 446: 73–89, 2012
nutrient budgets from a tropical lagoon in Chiku, south-western Taiwan. Estuar Coast Shelf Sci 54: 887−900
Islam MS (2005) Nitrogen and phosphorus budget in coastaland marine cage aquaculture and impacts of effluentloading on ecosystem: review and analysis towardsmodel development. Mar Pollut Bull 50: 48−61
Lauer PR, Fernandes M, Fairweather PG, Tanner J,Cheshire A (2009) Benthic fluxes of nitrogen and phos-phorus at southern bluefin tuna Thunnus maccoyii sea-cages. Mar Ecol Prog Ser 390: 251−263
Lefebvre S, Leal JCM, Dubois S, Orvain F, Blin J, Bataillé M,Ourry A, Galois R (2009) Seasonal dynamics of trophicrelationships among co-occurring suspension-feeders intwo shellfish culture dominated ecosystems. EstuarCoast Shelf Res 82: 415−425
Liao YB, Chen QZ, Zeng JN, Gao AG, Liu JJ, Jiang ZB(2008) Thermal effect on the marine phytoplankton inXiangshan Bay. Acta Ecol Sin 28: 4203−4212 (in Chinese)
Lü HQ, Chang KM, Shi GD (2009) Circulation and distribu-tion of nitrogen and phosphorus in Xiangshan Bay,China. Oceanol Limnol Sin 40: 138−144 (in Chinese)
Mao YZ, Zhou Y, Yang HS, Wang RC (2006) Seasonal varia-tion in metabolism of cultured Pacific oyster, Crassostreagigas, in Sanggou Bay, China. Aquaculture 253: 322−333
Mazouni N, Gaertner JC, Deslous-Paoli JM (2001) Composi-tion of biofouling communities on suspended oyster cul-tures: an in situ study of their interactions with the watercolumn. Mar Ecol Prog Ser 214: 93−102
Navarro N, Leakey RJG, Black KD (2008) Effect of salmoncage aquaculture on the pelagic environment of temper-ate coastal waters: seasonal changes in nutrients andmicrobial community. Mar Ecol Prog Ser 361: 47−58
Neori A, Chopin T, Troell M, Buschmann AH and others(2004) Integrated aquaculture: rationale, evolution andstate of the art emphasizing seaweed biofiltration inmodern mariculture. Aquaculture 231: 361−391
Newell RIE (2004) Ecosystem influences of natural and cul-tivated populations of suspension-feeding bivalve mol-luscs: a review. J Shellfish Res 23: 51−61
Newell RIE, Kemp WM, Hagy JD, Cerco CF, Testa JM,Boynton WR (2007) Top-down control of phytoplanktonby oysters in Chesapeake Bay, USA: comment on Pome -roy et al. (2006). Mar Ecol Prog Ser 341: 293−298
Ning XR, Hu XG (2002) Aquacultural ecology and carryingcapacity assessment of fish cage in Xiangshan Bay.China Ocean Press, Beijing
Nobre AM, Ferreira JG, Nunes JP, Yan XJ and others (2010)Assessment of coastal management options by means ofmultilayered ecosystem models. Estuar Coast Shelf Sci87: 43−62
Pedersen MF, Borum J (1996) Nutrient control of algalgrowth in estuarine waters: nutrient limitation and theimportance of nitrogen requirements and nitrogen stor-age among phytoplankton and species of macroalgae.Mar Ecol Prog Ser 142: 261−272
Peterson CH, Grabowski JH, Powers SP (2003) Estimatedenhancement of fish production resulting from restoringoyster reef habitat: quantitative valuation. Mar Ecol ProgSer 264: 249−264
Pomeroy LR, D’Elia CF, Schaffner LC (2006) Limits to top-down control of phytoplankton by oysters in Cheasa-peake Bay. Mar Ecol Prog Ser 325: 301−309
Quan WM, Zhu JX, Ni Y, Shi LY, Chen YQ (2009) Faunal uti-lization of constructed intertidal oyster (Crassostrea rivu-laris) reef in the Yangtze River estuary, China. Ecol Eng
35: 1466−1475Rodney WS, Paynter KT (2006) Comparisons of macrofaunal
assemblages on restored and non-restored oyster reefs inmesohaline regions of Chesapeake Bay in Maryland. JExp Mar Biol Ecol 335: 39−51
San Diego–McGlone ML, Azanza RV, Villanoy CL, JacintoGS (2008) Eutrophic waters, algal bloom and fish kill infish farming areas in Bolinao, Pangasinan, Philippines.Mar Pollut Bull 57: 295−301
Sidik MJ, Rashed-Un-Nabi M, Hoque MA (2008) Distribu-tion of phytoplankton community in relation to environ-mental parameters in cage culture area of Sepang -gar Bay, Sabah, Malaysia. Estuar Coast Shelf Sci 80: 251−260
Souchu P, Vaquer A, Collos Y, Landrein S, Deslous-PaoliJM, Bibent B (2001) Influence of shellfish farming activi-ties on the biogeochemical composition of the water col-umn in Thau lagoon. Mar Ecol Prog Ser 218: 141−152
Takabayashi M, Lew K, Johnson A, Marchi AL, Dugdale R,Wilkerson FP (2006) The effect of nutrient availabilityand temperature on chain length of the diatom, Skele-tonema costatum. J Plankton Res 28: 831−840
Tallman JC, Forrester GE (2007) Oyster grow-out cagesfunction as artificial reefs for temperate fishes. Trans AmFish Soc 136: 790−799
Tang Q, Zhang J, Fang J (2011) Shellfish and seaweed mar-iculture increase atmospheric CO2 absorption by coastalecosystems. Mar Ecol Prog Ser 424: 97−104
Taylor J, Bushek D (2008) Intertidal oyster reefs can persistand function in a temperate North American Atlanticestuary. Mar Ecol Prog Ser 361: 301−306
ter Braak CJF, Smilauer P (2002) CANOCO reference man-ual and CanoDraw for Windows user’s guide: softwarefor canonical community ordination (version 4.5). Micro-computer Power, Ithaca, NY
Thomsen MS, Silliman BR, Mcglathery KJ (2007) Spatialvariation in recruitment of native and invasive sessilespecies onto oyster reefs in a temperate soft-bottomlagoon. Estuar Coast Shelf Sci 72: 89−101
Trottet A, Roy S, Tamigneaux E, Lovejoy C, Tremblay R(2008a) Impact of suspended mussels (Mytilus edulis L.)on plankton communities in a Magdalen Islands lagoon(Québec, Canada): a mesocosm approach. J Exp MarBiol Ecol 365: 103−115
Trottet A, Roy S, Tamigneaux E, Lovejoy C, Tremblay R(2008b) Influence of suspended mussel farming onplank tonic communities in Grande-Entrée Lagoon, Mag-dalen Islands (Québec, Canada). Aquaculture 276: 91−102
Vezzulli L, Moreno M, Marin V, Pezzati E, Bartoli M, Fabi-ano M (2008) Organic waste impact of capture-basedAtlantic bluefin tuna aquaculture at an exposed site inthe Mediterranean Sea. Estuar Coast Shelf Sci 78: 369−384
Wang ZH, Qi YZ, Chen JF, Xu N, Yang YF (2006) Phyto-plankton abundance, community structure and nutrientsin cultural areas of Daya Bay, South China Sea. J MarSyst 62: 85−94
Wang Y, Yu ZM, Song XX, Tang XX, Zhang SD (2007)Effects of macroalgae Ulva pertusa (Chlorophyta) andGracilaria lemaneiformis (Rhodophyta) on growth of fourspecies of bloom-forming dinoflagellates. Aquat Bot 86: 139−147
Xiao YJ, Ferreira JG, Bricker SB, Nunes JP, Zhu MY, ZhangXL (2007) Trophic assessment in Chinese coastal sys-
88

Jiang et al.: Environmental effects on phytoplankton in aquaculture systems
tems-review of methods and application to the Chang -jiang (Yangtze) Estuary and Jiaozhou Bay. Estuar Coast60: 901−908
Yan T, Zhou MJ, Qian PY (2002) Combined effects of tem-perature, irradiance and salinity on growth of diatomSkeletonema costatum. Chin J Oceanology Limnol 20: 237−243
Yang YF, Li CH, Nie XP, Tang DL, Chung IK (2004) Devel-opment of mariculture and its impacts in Chinese coastalwaters. Rev Fish Biol Fish 14: 1−10
Ye Y, Xu JL, Ying QL, Wei DY, Chen QZ, Ning XR (2002)Changes of nutrient in net aquaculture area of Xiang-
shan Harbor. Mar Environ Sci 21: 39−41 (in Chinese)Yin K, Qian PY, Wu MCS, Chen JC, Huang L, Song X, Jian
W (2001) Shift from P to N limitation of phytoplanktongrowth across the Pearl River estuarine plume duringsummer. Mar Ecol Prog Ser 221: 17−28
You ZJ, Jiao HF (2011) Study on the ecology and environ-mental protect and restored technology of XiangshanBay. China Ocean Press, Beijing
Zhou Y, Yang H, Zhang T, Liu S and others (2006) Influenceof filtering and biodeposition by the cultured scallopChlamys farreri on benthic-pelagic coupling in a eutro -phic bay in China. Mar Ecol Prog Ser 317: 127−141
89
Editorial responsibility: Katherine Richardson, Copenhagen, Denmark
Submitted: June 15, 2011; Accepted: November 11, 2011Proofs received from author(s): January 21, 2012