phytotechnology technical and regulatory guidance and
TRANSCRIPT

Technical/Regulatory Guidance
Phytotechnology Technical and Regulatory Guidance and Decision Trees, Revised
February 2009
Prepared byThe Interstate Technology & Regulatory Council
Phytotechnologies Team
Tech Reg Update

ABOUT ITRC
Established in 1995, the Interstate Technology & Regulatory Council (ITRC) is a state-led, national
coalition of personnel from the environmental regulatory agencies of all 50 states and the District of
Columbia, three federal agencies, tribes, and public and industry stakeholders. The organization is
devoted to reducing barriers to, and speeding interstate deployment of, better, more cost-effective,
innovative environmental techniques. ITRC operates as a committee of the Environmental Research
Institute of the States (ERIS), a Section 501(c)(3) public charity that supports the Environmental Council
of the States (ECOS) through its educational and research activities aimed at improving the environment
in the United States and providing a forum for state environmental policy makers. More information
about ITRC and its available products and services can be found on the Internet at www.itrcweb.org.
DISCLAIMER
ITRC documents and training are products designed to help regulators and others develop a consistent
approach to their evaluation, regulatory approval, and deployment of specific technologies at specific
sites. Although the information in all ITRC products is believed to be reliable and accurate, the product
and all material set forth within are provided without warranties of any kind, either express or implied,
including but not limited to warranties of the accuracy or completeness of information contained in the
product or the suitability of the information contained in the product for any particular purpose. The
technical implications of any information or guidance contained in ITRC products may vary widely based
on the specific facts involved and should not be used as a substitute for consultation with professional
and competent advisors. Although ITRC products attempt to address what the authors believe to be all
relevant points, they are not intended to be an exhaustive treatise on the subject. Interested parties should
do their own research, and a list of references may be provided as a starting point. ITRC products do not
necessarily address all applicable health and safety risks and precautions with respect to particular
materials, conditions, or procedures in specific applications of any technology. Consequently, ITRC
recommends also consulting applicable standards, laws, regulations, suppliers of materials, and material
safety data sheets for information concerning safety and health risks and precautions and compliance
with then-applicable laws and regulations. The use of ITRC products and the materials set forth herein is
at the user’s own risk. ECOS, ERIS, and ITRC shall not be liable for any direct, indirect, incidental,
special, consequential, or punitive damages arising out of the use of any information, apparatus, method,
or process discussed in ITRC products. ITRC product content may be revised or withdrawn at any time
without prior notice.
ECOS, ERIS, and ITRC do not endorse or recommend the use of, nor do they attempt to determine the
merits of, any specific technology or technology provider through ITRC training or publication of
guidance documents or any other ITRC document. The type of work described in any ITRC training or
document should be performed by trained professionals, and federal, state, and municipal laws should be
consulted. ECOS, ERIS, and ITRC shall not be liable in the event of any conflict between ITRC training
or guidance documents and such laws, regulations, and/or ordinances. Mention of trade names or
commercial products does not constitute endorsement or recommendation of use by ECOS, ERIS, or
ITRC. The names, trademarks, and logos of ECOS, ERIS, and ITRC appearing in ITRC products may not
be used in any advertising or publicity, or otherwise indicate the sponsorship or affiliation of ECOS,
ERIS, and ITRC with any product or service, without the express written permission of ECOS, ERIS, and
ITRC.

PHYTO-3
Phytotechnology Technical and Regulatory Guidance
and Decision Trees, Revised
February 2009
Prepared by
The Interstate Technology & Regulatory Council
Phytotechnologies Team
Tech Reg Update
Copyright 2009 Interstate Technology & Regulatory Council
50 F Street NW, Suite 350, Washington, DC 20001

Permission is granted to refer to or quote from this publication with the customary
acknowledgment of the source. The suggested citation for this document is as follows:
ITRC (Interstate Technology & Regulatory Council). 2009. Phytotechnology Technical and
Regulatory Guidance and Decision Trees, Revised. PHYTO-3. Washington, D.C.: Interstate
Technology & Regulatory Council, Phytotechnologies Team, Tech Reg Update.
www.itrcweb.org

i
ACKNOWLEDGEMENTS
The members of the Interstate Technology & Regulatory Council (ITRC) Phytotechnologies
Team Tech Reg Update Work Group wish to acknowledge the individuals, organizations, and
agencies that contributed to this technical and regulatory guidance update.
As part of the broader ITRC effort, the Phytotechnologies Team update effort was funded
primarily by the U.S. Environmental Protection Agency. ITRC operates as a committee of the
Environmental Research Institute of the States, a Section 501(c)(3) public charity that supports
the Environmental Council of the States through its educational and research activities aimed at
improving the environment in the United States and providing a forum for state environmental
policy makers.
The Phytotechnologies Team specifically acknowledges the efforts of the following individuals:
Kris Geller, New Jersey Department of Environmental Protection, Team Leader
Dibikar Goswami, Washington Department of Ecology
Ramesh Belani and Ken Beard, Pennsylvania Department of Environmental Protection
Eleanor Wehner, Texas Commission of Environmental Quality
Special thanks go to David Tsao with BP North America, Inc. This update is certainly based on
the latest in practice since Dr. Tsao has been involved with more phytotechnology projects
around the world than anyone else. We would also like to thank Steven Rock, EPA Cincinnati
and Ellen Rubin, EPA HQ; Stephen Geiger, ENSR; Peter Strauss and John Chambliss,
community stakeholders; and Steve Hill of RegTech, Inc.
We appreciate the patience of the team members, EPA, and ITRC during this process and will
pass on our lessons learned for updating ITRC guidance documents.

ii
This page intentionally left blank.

iii
EXECUTIVE SUMMARY
Phytotechnologies are a set of technologies using plants to remediate or contain contaminants in
soil, groundwater, surface water, or sediments. These technologies have become attractive
alternatives to conventional cleanup technologies due to relatively low capital costs and the
inherently aesthetic nature of planted sites.
This document provides guidance for regulators, who evaluate and make informed decisions on
phytotechnology work plans, and for practitioners, who have to evaluate any number of remedial
alternatives at a given site. This document is an update to Phytoremediation Decision Tree
(PHYTO-1, 1999) and Phytotechnology Technical and Regulatory Guidance Document
(PHYTO-2, 2001) and replaces the previous documents entirely. It merges the concepts of both
previous documents and includes new and, more importantly, practical information on the
process and protocol for selecting and applying various phytotechnologies as remedial
alternatives.
The technical descriptions of phytotechnologies in this document concentrate on the functioning
mechanisms: phytosequestration, rhizodgradation, phytohydraulics, phytoextraction,
phytodegradation, and phytovolatilization. For example, the application of phytotechnologies as a
hydraulic control for groundwater is described as phytohydraulics (transpiration). This approach
was selected to provide both scientific accuracy and a basic understanding of these mechanisms
to the reader. Decision trees (Remedy Selection, Groundwater, Soil/Sediment, and Riparian
Zone) help guide the user through the application of phytotechnologies to a remediation project.
Frequently Asked Questions and Rules of Thumb ( )
Often, the best response that can be provided to some of the most common questions encountered
about phytotechnologies is, “It depends….” Many factors influence phytotechnologies, such as
soil conditions, climate, suitable plant species, and associated rhizosphere microbes. Therefore,
every project is unique and must be custom designed,
installed, and operated. The following answers to frequently
asked questions provide a brief, generalized understanding
and direct the reader to the relevant sections of the document
for further information.
Mechanisms
Q: What is the difference between the terms “phytoremediation” and “phytotechnologies”?
From the regulatory perspective, cleanup goals can be remediation, containment, or both.
Phytotechnologies include containment strategies in addition to (phyto-)remediation strategies.
Other remedial goals also include prevention, polishing, and restoration/end use (Section 2.2.1).
During the implementation/ growth stage of a remediation project using phytotechnologies, the project should clearly focus on managing potential exposure.

iv
Q: How do phytotechnologies work?
They use vegetation to sequester, extract, or degrade toxic chemicals located in soils, sediments,
groundwater, surface water, and air. There are six major mechanisms associated with
phytotechnologies: phytosequestration, rhizodegradation, phytohydraulics, phytoextraction,
phytodegradation, and phytovolatilization (Section 1.2).
Q: What contaminants can be treated with phytotechnologies?
Typical organic contaminants (“organics”) such as petroleum hydrocarbons, gas condensates,
crude oil, chlorinated compounds, pesticides, and explosive compounds can be remediated using
phytotechnologies. Typical inorganic contaminants (“inorganics”) that can be addressed include
salts (salinity), heavy metals, metalloids, and radioactive materials. Extensive databases are
available covering a wide range of contaminants treated using phytotechnologies (Section 2.3.1).
Q: Do the plants become contaminated in this process?
For organic contaminants, the octanol-water partition coefficient (log Kow) typically needs to be
between 1 and 3.5 for uptake by plants to occur (Section 1.2.4). For inorganic contaminants,
including essential plant nutrients, uptake is specific to the element and plant species (Sections
1.1.1 and 1.2.3). According to the current research, there is little or no accumulation of volatile
contaminants in plant roots, wood, stems, leaves, or fruit. Plants may accumulate metals or other
toxic materials that reach contaminated levels, but several mechanisms exist that often limit the
uptake and/or persistence of nonessential compounds in the plant (Sections 1.2 and 2.5.1.3).
Q: Do plants release contaminants into the air? If so, how much and how often?
Possibly; there is an established mechanism known as phytovolatilization (Section 1.2.6)
whereby volatile chemicals are taken up by a plant and released through leaf surfaces. However,
extensive samplings in the field show that minimal amounts of volatile contaminants are emitted
from plants (Section 2.5.3.3).
Q: If fruit and nuts are produced, are they safe for humans and animals?
Probably, but test them to be sure (Section 2.5.3.3).
Efficacy
Q: Will phytotechnologies work on my site?
It depends; however, decision tees have been developed which will help to determine whether a
phytotechnology would be applicable at a site (Section 2.3.2)
Q: How deep do plant roots grow?
Typical rooting depths for herbaceous, upland species such as grasses and forbs are 1–2 feet;
however, depths down to 5 feet have been reported as within the range of influence under some
situations (Section 1.3). Furthermore, prairie grasses have root systems that can reach 10–15 feet
below ground surface (bgs). Regardless, in general, 70%–80% of the root structure will be within
the top 1–2 feet of soil (including tap-rooted species) with exploratory roots sent deeper and
laterally. However, local soil conditions (nutrient content, moisture, compaction, etc.) will dictate
the ultimate depth to which any plant will reach. Furthermore, the depth of penetration may

v
progress as the plants grow year over year (Section 2.3.2.3). For wetland species, typical depths
are less than 1 foot due to oxygen limitations (Section 1.3). For trees, typical depths are 10–15
feet but often require special culturing practices (Section 2.4.3.2). Typical penetrations can be 3–
5 feet per year when planted into a borehole or trench. The maximum practical depth is generally
down to 25 feet bgs using these practices, although deeper depths can be reached under certain
circumstances. The deepest influence of a phytotechnology system was measured at 40 feet bgs.
A general rule of thumb, however, is that trees will not access deeper than 5 feet into the
saturated zone (Section 2.3.2.2).
Q: How fast do plants grow? How long do they live?
Plant growth rate and longevity depend on species, soil, and climate. “Annual” species grow and
die within a single season. Others, such as trees and other herbaceous perennials, continue to
grow over years. Fast-growing species such as hybrid poplars can grow 5–10 feet (2–3 m) per
year in the first few years. However, in general, those species that grow rapidly tend to be shorter
lived (Section 2.5.2.1).
Q: How long does it take for the system to become effective?
In some cases, the application of phytotechnologies can have an immediate effect on contaminant
concentrations upon planting. In other cases, it may require several seasons before the plant can
interact with a contaminated zone at depth. Furthermore, it may depend on whether the plant
itself is directly or indirectly involved with remediating the contaminant (i.e., phytodegradation
or simply stimulating biodegradation in the rhizosphere—rhizodegradation; Section 1.2).
Q: What happens in winter when the plants are dormant?
Water consumption and contaminant uptake essentially stop when plants are dormant.
Degradation by microbes and the rhizosphere effect continue but at a reduced rate. Efforts to
estimate the rate of remediation should account for the dormant conditions (Section 2.4.1).
Q: How long until cleanup is achieved?
It depends on the criteria set forth in defining the cleanup objectives for the site. Furthermore, it
depends on the type, extent, and concentration of contamination, continuing sources,
obstructions, soil conditions, hydrologic/groundwater conditions, and other site characteristics,
the plant species, growth rate, and climate conditions (Section 2.2). Complete restoration will
depend on the type of phytotechnology applied at the site (Section 1.3).
Design and Implementation
Q: Which plant species should be used? How are plants selected for a remediation?
All plant selections must be made based on site-specific conditions. Climate, altitude, soil
salinity, nutrient content, fertility, location, depth, concentration of contaminant, commercial
availability, plantability, and plant hardiness are some of the determining elements (Sections
2.3.1 and 2.4.3). A variety of approaches and information resources can be used, including
databases, site-specific vegetation surveys, and specifically designed tests to evaluate species
(Section 2.3.1 and Figure 2-1). In addition to selecting species for the remediation, end-use

vi
considerations can be included in the initial plant selection (Section 2.3.4). Typically, 10%–15%
climax species might be included in the initial design.
Q: When should planting be done?
Planting season is generally in the early spring (after the last frost), the most desirable period to
establish a phytotechnology system (Section 2.2.3.2). Seeding should be done whenever is most
appropriate for the species, also typically in the early spring (Section 2.4.3.1). Tree cuttings for
propagation should be taken while the source tree is still in winter dormancy and should be
maintained dormant (stored under refrigerated conditions) until planted into the ground. In many
cases, survivability hinges on the timing of the planting, which should be planned appropriately
in the design.
Q: How much or how much area should be planted?
It depends on the extent of contamination and the characteristics of the site (Section 2.2.2). A
general rule of thumb for a very preliminary design during the remedy selection phase of a
project is a planting density of 75 ft2 per tree (Section 2.3.2.2). Seeding rates for common grass
species (ryegrass, fescue, etc.) are typically higher than prairie species. For example, 400 pounds
of a fescue/perennial ryegrass seed mix is needed to cover one acre, while only 10 pounds of a
prairie grass seed mix is needed to cover the same acre. The spacing between potted plants
depends on the size of the specimens, but for plants that come in palettes, typically 1–2 feet,
greater for larger specimens (Section 2.4.3.1). A standard landscaping rule of thumb is that 10%
of recently planted trees or potted plants will not survive the first year (Section 2.5.4).
Q: How much does it cost?
It depends. Various cost items will need to be considered, such as earthwork, labor, planting
stock, planting method, field equipment, heavy machinery (typically farming or forestry
equipment), soil amendments, permits, water control infrastructure, utility infrastructure, fencing,
security, etc. (Section 2.4).
Operation, Maintenance, and Monitoring
Q: Isn’t this just a “Do something quick and cheap in the field and then walk away” approach?
No. Like any remediation system, phytotechnologies require significant operation, maintenance,
and monitoring for several years after planting. Costs can include labor, sampling, analytical,
materials, field equipment, utilities, waste handling, and disposal. Once the plantation becomes
established, however, the operation and maintenance (O&M) costs tend to diminish (Section
2.5). Furthermore, additional sampling and monitoring will typically be required during the
initial phases compared to subsequent years. Phytotechnologies are generally long-term remedial
solutions.
Q: What do you have to do for operations and maintenance?
Phytotechnology plantations may require irrigation, fertilization, weed control (mowing,
mulching, or spraying), and pest control. At the onset of a planting, which too may be a
reoccurring O&M event, some percentage of replanting may be required due to the lack of

vii
establishment. As a general rule of thumb, 10%–15% of the initial capital costs should be added
as a contingency for replanting.
Q: In general how much water is required?
A general rule of thumb is that during establishment (i.e., before trees have reached a
groundwater source) and perhaps throughout the growth of the vegetation (i.e., groundcover
systems), plants should receive a total of 1–2 inches of water per week, including both
precipitation and supplemental irrigation (Section 2.4.2.2). Another rule of thumb for a very
preliminary design during the remedy selection phase of a project is that a tree plantation uses
10 gal per day per tree, annualized over the year (Section 2.3.2.2).
Q: When should fertilization be done? What fertilizers should be used?
Typically, regular fertilizations can be done in early spring to help the new growth and in late fall
to prepare the vegetation for winterization. The formulation of the fertilizer depends on the site-
specific soil conditions (Tables 2-9 to 2-11). Soil fertility can be analyzed by a local agriculture
extension service using established methods (Table 2-12).
Q: What happens if the plants die as a result of a natural catastrophe or infestation?
If the plants die or are damaged, the beneficial effects are lost or greatly diminished. However,
the effect can be temporary, depending on the ability of the vegetation to regrow. Contingency
plans should be established for different degrees of loss (Section 2.5.3.4).
Q: If plants have to be harvested, how can one tell whether or not a plant is safe?
Analysis of plant and core tissue sampling (leaves and stems) can determine whether the plant is
safe (Section 2.5.3.3).
Q: What is the easiest tissue to sample?
The aboveground tissues such as leaves, needles, stems, branches, and fruits/seeds/nuts are
easiest. These are collected simply by pulling or cutting sufficient material from the plant and
storing it in sealed plastic bags. For most analyses, samples of 20 g dry weight (10–15 average
leaves) should be sufficient. As general rules of thumb, to estimate the wet-to-dry weight ratio
for field sample collection, green stems typically contain 95% water weight, leaves 90%, fruits
85%, hardwood stems 50%, and nuts and seeds 5%. Once collected, the tissues should be stored
on ice for transport to the laboratory (Section 2.5.3.3).
Q: Is the harvested material usable for commercial payback?
Yes, but it may depend on the use, harvested material, and contaminant. The material may need
to be tested (Section 2.5.3.3).
Q: How do you know it is working?
Phytotechnology systems should be monitored using the same primary lines of evidence as any
other alternative (i.e., concentration trends, hydrology, soil effects, etc.). That information may
need to be supported by secondary lines of evidence, which generally entail analyzing the plants
in some manner (Sections 2.5.2 and 2.5.3).

viii
This page intentionally left blank.

ix
TABLE OF CONTENTS
ACKNOWLEDGEMENTS ............................................................................................................. i
EXECUTIVE SUMMARY............................................................................................................ iii
1. DESCRIPTION OF PHYTOTECHNOLOGIES .......................................................................1
1.1 Basic Plant Physiology ......................................................................................................1
1.2 Mechanisms ....................................................................................................................10
1.3 Applications ....................................................................................................................20
1.4 Advantages and Limitations ............................................................................................29
2. PHYTOTECHNOLOGIES PROJECT MANAGEMENT REQUIREMENTS ......................32
2.1 Project Structure and Organization .................................................................................32
2.2 Site Assessment ..............................................................................................................34
2.3 Remedy Selection ...........................................................................................................45
2.4 Design and Implementation ............................................................................................72
2.5 Operation, Maintenance, and Monitoring .......................................................................90
2.6 Closure ..........................................................................................................................113
3. CHALLENGES .....................................................................................................................113
4. BIBLIOGRAPHY AND REFERENCES ..............................................................................114
Appendix A. Internet Resources for Phytoremediation
Appendix B. Database of Contaminant Remediation by Plants
Appendix C. Case Study Information Collected during the International Phytoremediation
Conference 2007 in Denver Colorado
Appendix D. Phytotechnologies Update Team Contacts
Appendix E. Glossary
Appendix F. Acronyms
LIST OF FIGURES
Figure 1-1 Plant physiological processes ...................................................................................2
Figure 1-2 Rhizosphere..............................................................................................................5
Figure 1-3 Evapotranspiration and phytostabilization cover for infiltration control
application ................................................................................................................6
Figure 1-4a Rates of transpiration of various grasses and herbaceous species ...........................7
Figure 1-4b Rates of transpiration of various herbaceous wetland species .................................8
Figure 1-4c Rates of transpiration of various woody species ......................................................9
Figure 1-5 Phytosequestration mechanisms ............................................................................11
Figure 1-6 Rhizodegradation mechanisms ..............................................................................13
Figure 1-7 Phytohydraulics and groundwater hydraulic depression ........................................14
Figure 1-8 Phytoextraction mechanisms..................................................................................15
Figure 1-9 Phytodegradation mechanisms ...............................................................................18

x
Figure 1-10 Phytovolatilization mechanism ..............................................................................19
Figure 1-11 Tree hydraulic barrier application ..........................................................................26
Figure 1-12 Riparian buffer application ....................................................................................28
Figure 2-1 Plant species screening process ..............................................................................43
Figure 2-2 Remedy Selection Decision Tree ...........................................................................50
Figure 2-3 Groundwater Decision Tree ...................................................................................52
Figure 2-4 Soil/Sediment Decision Tree .................................................................................56
Figure 2-5 Riparian Zone Decision Tree .................................................................................58
Figure 2-6 Empirical correlation of annualized transpiration rate to basal trunk area ............73
Figure 2-7 Effects of soil compaction on root penetration ......................................................79
Figure 2-8 Example concepts and estimates of leaf area index and area coverage .................93
Figure 2-9 Types of thermal dissipation probes used to measure transpiration rates ............100
Figure 2-10 Typical results from thermal dissipation probes measuring transpiration over
several days ..........................................................................................................101
Figure 2-11 Increment corer used to collect hardwood tissue samples ...................................105
LIST OF TABLES
Table 1-1 Typical plant tissue concentrations and available forms of essential nutrient
elements ...................................................................................................................3
Table 1-2 Typical water interception capacities .......................................................................6
Table 1-3 Summary of phytotechnology mechanisms ...........................................................10
Table 1-4 Chemical properties for typical contaminants........................................................16
Table 1-5a Summary of phytotechnology applications and potential mechanisms for
containment treatment goals ..................................................................................20
Table 1-5b Summary of phytotechnology applications and potential mechanisms for
remediation treatment goals ...................................................................................21
Table 1-6 Summary of case studies ........................................................................................22
Table 2-1 Required skills for project phases ..........................................................................31
Table 2-2 Checklist of deliverables by project phase .............................................................33
Table 2-3 General assessment information ............................................................................35
Table 2-4 Assessment information specific for phytotechnologies ........................................40
Table 2-5 Optional cost items specific to phytotechnologies .................................................66
Table 2-6 Value elements for cost-benefit analyses ...............................................................67
Table 2-7 Potential health and safety issues specific to phytotechnologies ...........................69
Table 2-8 Range of basal trunk areas and corresponding trunk diameters for trees of
different ages ..........................................................................................................74
Table 2-9 Potential amendment remedies for various soil conditions/growth needs .............80
Table 2-10 Target nutrient ratios based on total carbon content ..............................................80
Table 2-11 Carbon and nitrogen ratios from different sources of compost/mulch ..................81
Table 2-12 Analytical methods for soil agronomic parameters ...............................................88

PHYTOTECHNOLOGY TECHNICAL AND REGULATORY GUIDANCE
AND DECISION TREES, REVISED
1. DESCRIPTION OF PHYTOTECHNOLOGIES
Phytotechnologies use plants to remediate various media impacted with different types of
contaminants. While phytotechnologies are typically applied in situ, hydroponics allows for ex
situ application. Typical organic contaminants (“organics”) such as petroleum hydrocarbons, gas
condensates, crude oil, chlorinated compounds, pesticides, and explosive compounds can be
remediated using phytotechnologies. Typical inorganic contaminants (“inorganics”) that can be
addressed include salts (salinity), heavy metals, metalloids, and radioactive materials.
Phytotechnologies can potentially treat soils, sludge, sediments, groundwater, surface water,
wastewater, and storm water. This document includes guidance for remediating soils, sludge,
sediments, groundwater, and storm water. The reader is also referred to other Interstate
Technology & Regulatory Council (ITRC) guidance for wastewater, surface water, and storm
water control (ITRC 2003b, 2005a). Likewise, the reader is referred to similar ITRC guidance on
alternative waste containment and management strategies (ITRC 2003c, 2003d, 2006a, 2006b).
The particular phytotechnology mechanisms used to address contaminants depend not only on
the type of contaminant and the media affected, but also on the cleanup goals. Typical goals
include containment through stabilization or sequestration, remediation through assimilation,
reduction, detoxification, degradation, metabolization or mineralization, or both. To achieve
these goals, the proper phytotechnology system must be selected, designed, developed,
implemented, and operated using detailed knowledge of the site layout, soil characteristics,
hydrology, climate conditions, analytical needs, operation and maintenance (O&M)
requirements, economics, public perspective, and regulatory protection of the environment.
Many phytotechnologies apply fundamental information gained from agriculture, forestry, and
horticulture to environmental problems. Therefore, the best starting place for someone relatively
new or unfamiliar with the technology is a simple review of the plant physiological processes
that are exploited through phytotechnologies.
1.1 Basic Plant Physiology
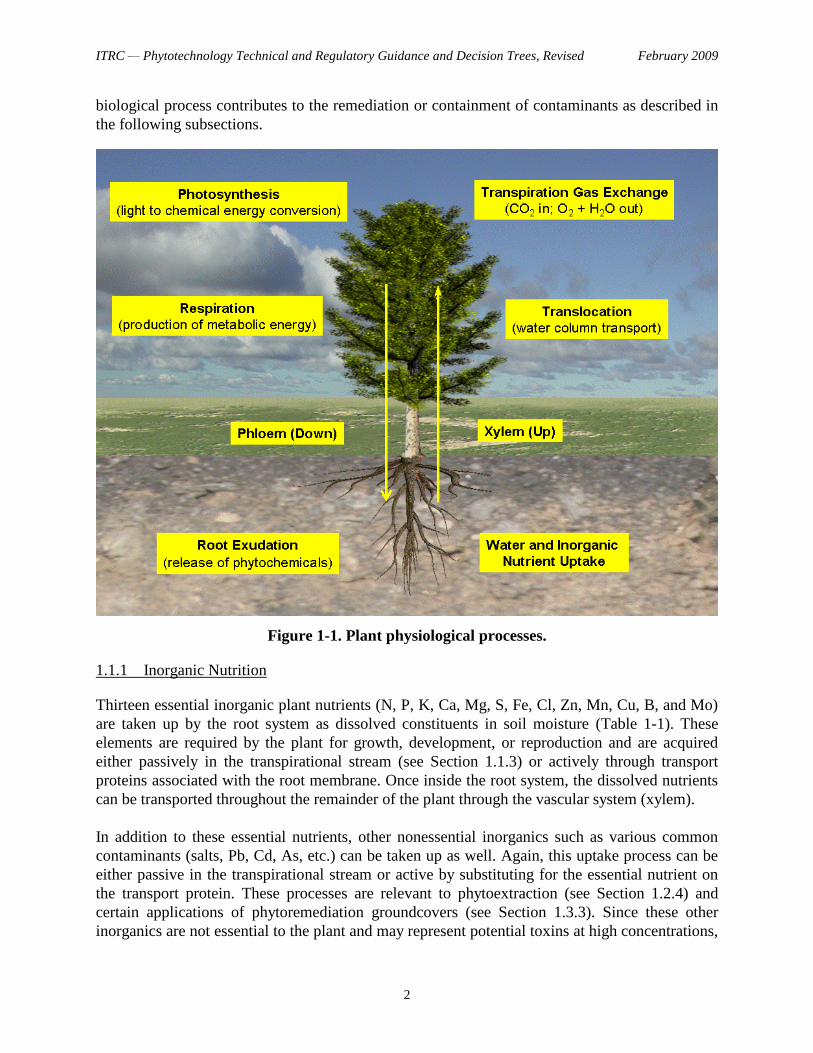
Plants typically grow by sending their roots into the soil and producing leaf and woody material
(Figure 1-1). To accomplish these basic growth habits (Taiz and Zeiger 1991), plants use carbon
dioxide to harvest light energy, convert it into chemical energy, and produce carbon biomass
through the processes of photosynthesis in the leaves and cellular respiration. Plants also take up
liquid water and dissolved inorganic nutrients through the root system, transport them throughout
the plant in the xylem, and transpire the water through the leaves as vapor. While carbon dioxide
and water vapor are being exchanged, oxygen is also being released to the environment.
Likewise, photosynthetic chemicals (photosynthates or phytochemicals) are transported
throughout the plant in the phloem, even into the root to be exuded into the surrounding soil. The
upward transport in the xylem and downward transport in the phloem, collectively termed
“translocation,” depend on the continuous water column that exists throughout the plant. Each
ITRC — Phytotechnology Technical and Regulatory Guidance and Decision Trees, Revised February 2009
2
biological process contributes to the remediation or containment of contaminants as described in
the following subsections.
Figure 1-1. Plant physiological processes.
1.1.1 Inorganic Nutrition
Thirteen essential inorganic plant nutrients (N, P, K, Ca, Mg, S, Fe, Cl, Zn, Mn, Cu, B, and Mo)
are taken up by the root system as dissolved constituents in soil moisture (Table 1-1). These
elements are required by the plant for growth, development, or reproduction and are acquired
either passively in the transpirational stream (see Section 1.1.3) or actively through transport
proteins associated with the root membrane. Once inside the root system, the dissolved nutrients
can be transported throughout the remainder of the plant through the vascular system (xylem).
In addition to these essential nutrients, other nonessential inorganics such as various common
contaminants (salts, Pb, Cd, As, etc.) can be taken up as well. Again, this uptake process can be
either passive in the transpirational stream or active by substituting for the essential nutrient on
the transport protein. These processes are relevant to phytoextraction (see Section 1.2.4) and
certain applications of phytoremediation groundcovers (see Section 1.3.3). Since these other
inorganics are not essential to the plant and may represent potential toxins at high concentrations,

ITRC — Phytotechnology Technical and Regulatory Guidance and Decision Trees, Revised February 2009
3
the plant also contains various mechanisms to sequester or stabilize these extraneous inorganics
and prevent transport into the more sensitive tissues of the plant. These processes are relevant to
phytosequestration mechanisms (see Section 1.2.1) and certain phytostabilization covers (see
Section 1.3.1).
Table 1-1. Typical plant tissue concentrations and available forms of essential nutrient
elements
Nutrient
element Symbol
Tissue concentration
(ppm)
Available
forms
Organic
biomass
Carbon C 450,000 CO2
Oxygen O 450,000 CO2, H2O
Hydrogen H 60,000 H2O
Inorganic
macronutrients
Nitrogen N 15,000 NO32–
, NH4+
Potassium K 10,000 K+
Calcium Ca 5,000 Ca2+
Phosphorus P 2,000 HPO42–
, H2PO4–
Magnesium Mg 2,000 Mg2+
Sulfur S 1,000 SO42–
Inorganic
micronutrients
Iron Fe 100 Fe2+
, Fe-chelate
Chlorine Cl 100 Cl–
Manganese Mn 50 Mn2+
1.1.2 Photosynthetic Production of Plant Materials
Photosynthesis is the conversion of light energy into chemical energy and consists of two light-
induced reaction centers, photosystem I and II (PSI, PSII). These centers operate at 700 and
680 nm (far red and red light), respectively, by harvesting light energy through chlorophyll and
other carotenoids. During the reactions of PSI, a strong reductant (P700*, Eh –1.3V) and a weak
oxidant (P700, Eh +0.48V) are produced, while PSII produces a strong oxidant (P680, Eh +1.1V)
and a weak reductant (P680*, Eh –0.78V). These processes are relevant to phytodegradation
mechanisms (see Section 1.2.5) and both phytoremediation groundcover (Section 1.3.3) and tree
stand (Section 1.3.5) applications. Furthermore, there is a chain of intermediate electron
acceptor/donor compounds with varying redox potentials that facilitate the photosynthetic
reactions. The ultimate electron donor in the photosynthetic process is water taken up through the
process of transpiration (see Section 1.1.3).
Atmospheric carbon dioxide enters plants through stomata (microscopic openings in the leaves)
and is incorporated into plant chemicals (phytochemicals) using the reductants generated during
photosynthesis. The carbohydrate (CHO) skeleton and energy needed to produce these
phytochemicals are generated during respiration when plant sugars and starches (also
phytochemicals generated in photosynthesis) are oxidized to liberate the stored energy. While
respiration is often thought of as the opposite of photosynthesis, the net gain in phytochemicals
between production in photosynthesis and consumption in respiration is approximately 25%–
75% of the original carbon from CO2, depending on the species and environmental conditions.
This net carbon gain, plus the metabolic energy from respiration, is used to produce biomass,

ITRC — Phytotechnology Technical and Regulatory Guidance and Decision Trees, Revised February 2009
4
transport nutrients (see Section 1.1.1), and reproduce. The excess oxygen is released through the
leaf stomata (countercurrent to the carbon dioxide influx). The interrelation between
photosynthesis, respiration, and metabolism is shown in Equations (1-1) to (1-3), respectively.
Photosynthesis:
Light energy + CO2 + H2O + CHO skeleton chemical energy (as a phytochemical) + O2 (1-1)
Respiration:
Phytochemical (stored chemical energy) + O2 CHO skeleton + metabolic energy + CO2 (1-2)
Growth and metabolism:
Metabolic energy + cell biomass biomass production and metabolism (1-3)
Once produced, phytochemicals such as amino acids, enzymes, proteins, organic acids,
carbohydrates, and other cellular materials can be transported throughout the plant through
another vascular system, the phloem. This distribution system can send these phytochemicals
down into the root system, where they can be exuded into the root zone. The exudation of carbon
into the soil can account for as much as 20% of the total photosynthetic products produced by a
plant (Campbell and Greaves 1990). Soil organisms including bacteria and fungi tend to thrive in
the immediate vicinity surrounding the roots because of this enriched carbon source.
Furthermore, the root system typically resides in an oxygenated environment either by creating
channels where atmospheric oxygen can diffuse or by exuding oxygen through the plant tissues
(e.g., aerenchyma in wetland species). This region of soil, roots, and organisms is known as the
“rhizosphere” (Figure 1-2) and extends approximately 1–3 mm from the root surface (Shimp et
al. 1993, Schnoor 1997). The proliferation of soil organisms in the rhizosphere can be 3 or 4
orders of magnitude greater than the population of soil organisms in comparison to nonvegetated
soils. They have formed a symbiotic relationship with the plant roots where the soil organisms
are supplied with various nutrients, including sources of carbon, oxygen, and other inorganic
elements necessary for growth. In return for this enhanced soil environment, these organisms
provide a protective barrier around the plant roots that can break down potential pathogens prior
to encountering the plant root. These processes are relevant to rhizodegradation (see Section
1.2.2) and phytoremediation applications for soil and groundwater (Sections 1.3.3 and 1.3.5,
respectively). Furthermore, the soil organisms can also enhance the uptake of essential plant
nutrients (see Section 1.1.1) and extend the effective root system for enhanced water uptake into
the plants (see Section 1.1.3).
1.1.3 Evapotranspiration
“Evapotranspiration” (ET) is the term for combined evaporation and transpiration of water from
plant systems. These processes are relevant to phytohydraulic mechanisms (see Section 1.2.3)
and tree hydraulic barrier (see Section 1.3.4) and certain phytostabilization cover (see Section
1.3.2) applications.

ITRC — Phytotechnology Technical and Regulatory Guidance and Decision Trees, Revised February 2009
5
Figure 1-2. Rhizosphere.
For evaporation, plants have the ability to intercept a significant portion of rain (and irrigation)
on their leaf surfaces, as depicted in Figure 1-3. This intercepted water is evaporated directly
back into the atmosphere, preventing the water from reaching the ground surface (Viessman,
Lewis, and Knapp 1989). This discharge effectively reduces the amount of infiltration and can be
used to limit groundwater recharge. The differences in water interception capacities are due to
morphological factors of the aboveground plant portions such as structure (vertical vs. horizontal
profile), leaf cuticle (hairy vs. waxy), and density (number of branches and leaves). Key factors
in determining the amount of canopy coverage provided by specific plants are the leaf area index
(LAI) and area coverage (see Section 2.5.2.1). Table 1-2 shows typical water interception
capacities.
If falling water is not intercepted by the plant and manages to infiltrate into the soil, it is then
subject to the transpirational uptake by the plant root system, also depicted in Figure 1-3 (C). If
the water is able to percolate below the root zone, it is available to recharge the groundwater. The
transpirational “stream” begins with soil moisture being drawn from the soil into the root system
and ends when the water evaporates into the atmosphere through the leaf stomata (countercurrent
to the carbon dioxide influx, see Section 1.1.2). This whole process occurs primarily by the
equilibrium driving force between liquid water in the leaves and the gaseous water (humidity) in
the atmosphere. Other climate conditions, as well as the health and condition of the plant, greatly
impact the transpiration capacity (see Sections 2.4.1.2 and 2.5.3.1). Typical plant transpiration
rates are provided in Figures 1-4a to 1-4c. The rates in grasses and herbaceous species are
estimated on a per area basis and in trees, on a per tree basis.
Root or Root Fragment
Rhizosphere
O2
O2
O2
O2
O2 O2
O2
Oxygen
E
E
E
E
E
E Exudates (Nutrients)
Typically 1–3 mm Surrounding
Roots
Soil Microbes
+3 to 4 orders – Specific
H2O
H2O
H2O

ITRC — Phytotechnology Technical and Regulatory Guidance and Decision Trees, Revised February 2009
6
Figure 1-3. Evapotranspiration and phytostabilization cover for infiltration control
application.
Table 1-2. Typical water interception capacities
Plant name Plant type Magnitude and duration
of rain
Interception capacity
(%)
Natural pasture Mixed grasses 389 mm in 5 months 14–19
Alfalfa Agricultural crop Unspecified 36
Tall panic grass Prairie species 12.7 mm in 30 minutes 57
Little blue stem Prairie species 12.7 mm in 30 minutes 50–60
Birch Tree species 350 mm in 5 months 10
Ash Tree species 38 mm rain (no time given) 24
Spruce-fir Tree species 272 mm in 5 months 30

ITRC — Phytotechnology Technical and Regulatory Guidance and Decision Trees, Revised February 2009
7
Figure 1-4a. Rates of transpiration of various grasses and herbaceous species.
0 5 10 15 20 25 30
Grass/Clover Mix
Agropyron desertorum, Crested Wheatgrass
Agropyron smithiii, Western Wheatgrass
Andropogon gerardii, Big Bluestem
Andropogon scoparius, Little Bluestem
Bouteloua curtipendula, Side Oats Grama
Bouteloua gracilis, Blue Grama
Brassica rapa, Field Mustard
Buchloe dactyloides, Buffalo
Grass Coronilla varia, Crown Vetch
Cynodon dactylon, Bermuda Grass
Echinacea purpurea, Purple Coneflower
Elymus canadensis, Canada Wild Rye
Festuca arundinacea, Tall Fescue
Festuca rubra, Red Fescue
Helianthus annuus, Common
Sunflower Lolium multiflorum, Annual Ryegrass
Lolium perenne, Perennial Ryegrass
Lotus corniculatus, Birdsfoot
Trefoil Medicago sativa, Alfalfa
Panicum virgatum,
Switchgrass Pennisetum americanum, Pearl Millet
Secale cereale, Winter Rye
Solidago sp.,
Goldenrods Sorghastrum nutans, Indian Grass
Sorghum bicolor, Sudan Grass
Trifolium sp., Clovers
Transpiration (mm/day)
High Rate Reported
Low Rate Reported
3.0 – 7.7
0.8 – 4.2
1.1 – 5.1
1.7 – 7.8
1.7 – 6.4
0.8 – 3.5
1.1 – 3.1
4.9 – 7.8
1.0 – 3.4
3.4 – 9.2
4.5 – 14.1
2.0 – 5.6
2.8 – 6.4
4.5 – 8.5
4.2 – 8.5
0.8 – 8.5
2.5 – 9.2
4.1 – 9.2
3.4 – 9.2
1.7 – 10.5
1.7 – 8.5
0.5 – 1.4
2.1 – 7.1
1.7 – 4.9
1.6 – 6.4
2.0 – 9.8
4.5 – 9.9

ITRC — Phytotechnology Technical and Regulatory Guidance and Decision Trees, Revised February 2009
8
Figure 1-4b. Rates of transpiration of various herbaceous wetland species.
0 5 10 15 20 25 30
Carex bebbii, Bebb's
Sedge Carex comosa, Longhair Sedge
Carex vulpinoides, Fox Sedge
Peltandra virginica, Green Arrow Arum
Phalaris arundinacea, Reed Canarygrass
Phragmites sp., Reeds
Scirpus sp., Bulrushes
Scirpus acutus, Hardstem
Bulrush Scirpus atrovirens, Green Bulrush
Scirpus fluviatus, River
Bulrush Scirpus validus, Softstem
Bulrush Spartina sp., Cordgrasses
Spartina pectinata, Saltwater Cordgrass
Typha sp.,
Cattails Typha glauca, Broadleaf Cattail
Transpiration (mm/day)
High Rate Reported
Low Rate Reported
6.0 – 7.9
5.3 – 9.0
6.2 – 10.5
1.0
4.2 – 9.2
1.4 – 8.5
2.5 – 7.8
3.3 – 6.0
1.1
5.2
2.8 – 8.7
8.0 – 21.9
1.6 – 4.9
8.5 – 28.2
2.0 – 3.2

ITRC — Phytotechnology Technical and Regulatory Guidance and Decision Trees, Revised February 2009
9
Figure 1-4c. Rates of transpiration of various woody species.
20
0
Eucalyptus camadulensis, River Redgum (mature)
Populus trichocarpa, Black Cottonwood (mature)
P.trichocarpa x P.deltoides, Hybrid Poplar (4 yrs)
Betula nigra, River Birch (mature)
Dicorynia guianensis (mature)
Epurea falcata (mature)
Morus rubra, Red Mulberry (mature)
Pinus taeda, Loblolly Pine (mature)
Populus sp., Poplars (1-2 yrs)
Populus sp., Poplars (5 yrs)
Populus sp., Poplars (30 yrs)
Populus deltoides, Cottonwood (1-2 yrs)
Populus deltoides, Cottonwood (19 yrs)
Populus tremuloides, Quaking Aspen (mature)
P.deltoides x P.nigra, Carolina Poplar (mature)
Populus/Salix sp., Poplar/Willow Stand (1 yr)
Populus/Salix sp., Poplar/Willow Stand (2 yrs)
Populus/Salix sp., Poplar/Willow Stand (3 yrs)
Populus/Salix sp., Poplar/Willow Stand (4+ yrs)
Prosopis grandulosa, Honey Mesquite (10 yrs)
Prosopis grandulosa, Honey Mesquite (>30 yrs)
Pseudotsuga menziesii, Douglas Fir (age NR)
Quercus virginiana, Live Oak (1.5 yrs)
Quercus virginiana, Live Oak (>40 yrs)
Salix alba, Weeping Willow (mature)
Taxodium distichum, Bald Cypress (1-2 yrs)
Taxodium distichum, Bald Cypress (mature)
0 5
0
10
0
15
0
9.1 - 15
66 - 79
66 - 79
4.4 -
22 14 - 24
6.5 -
12 1.6 -
10
13 - 200
5.5 -
34 2.6 - 3.8
13 - 95
4.0 - 8.1
5.5 -
15 5.3 -
13 2.0 -
13 5.0 -
25 7.0 -
38 10 - 50
2.8 - 3.5
28
13
1.0
10 - 100
10 - 45
0.3
11 - 18
7.0 -
53
Transpiration (gpd per tree)
High Rate
Reported
Low Rate Reported

ITRC — Phytotechnology Technical and Regulatory Guidance and Decision Trees, Revised February 2009
10
1.2 Mechanisms
The basic physiological processes described in the previous section are the bases for the various
phytotechnology mechanisms that can be used to clean up contaminated sites. Table 1-3
summarizes the specific mechanisms along with the applicable cleanup goals. The mechanisms
are listed in the same order as the sequence of how contaminants come into contact with the
transpiration stream, rhizosphere, and plant system. These mechanisms are interrelated and
dependent upon the precursors. Therefore, in any given phytotechnology application, multiple
mechanisms may be involved and can be exploited depending on the designed application (see
Section 1.3).
Table 1-3. Summary of phytotechnology mechanisms
Mechanism Description Cleanup goal
1. Phytosequestration The ability of plants to sequester certain
contaminants in the rhizosphere through exudation
of phytochemicals and on the root through transport
proteins and cellular processes
Containment
2. Rhizodegradation Exuded phytochemicals can enhance microbial
biodegradation of contaminants in the rhizosphere
Remediation by
destruction
3. Phytohydraulics The ability of plants to capture and evaporate water
off the plant and take up and transpire water through
the plant
Containment by
controlling
hydrology
4. Phytoextraction The ability of plants to take up contaminants into the
plant with the transpiration stream
Remediation by
removal of plants
5. Phytodegradation The ability of plants to take up and break down
contaminants in the transpiration stream through
internal enzymatic activity and photosynthetic
oxidation/reduction
Remediation by
destruction
6. Phytovolatilization The ability of plants to take up, translocate, and
subsequently transpire volatile contaminants in the
transpiration stream
Remediation by
removal through
plants
1.2.1 Phytosequestration
As shown in Figure 1-5, the three mechanisms of phytosequestration that reduce the mobility of
the contaminant and prevent migration to soil, water, and air are as follows:
Phytochemical complexation in the root zone: Phytochemicals can be exuded into the
rhizosphere, leading to the precipitation or immobilization of target contaminants in the root
zone. This mechanism of phytosequestration may reduce the fraction of the contaminant that
is bioavailable.
Transport protein inhibition on the root membrane: Transport proteins associated with the
exterior root membrane (see Section 1.1.1) can irreversibly bind and stabilize contaminants
on the root surfaces, preventing contaminants from entering the plant.

ITRC — Phytotechnology Technical and Regulatory Guidance and Decision Trees, Revised February 2009
11
Vacuolar storage in the root cells: Transport proteins are also present that facilitate transfer of
contaminants between cells. However, plant cells contain a compartment (the “vacuole”) that
acts, in part, as a storage and waste receptacle for the plant. Contaminants can be sequestered
into the vacuoles of root cells, preventing further translocation to the xylem.
Figure 1-5. Phytosequestration mechanisms. A: phytochemical complexation, B: transport
protein inhibition, C: vacuolar storage.
E + C E-C complex
Root or Root Fragment
O2
O2
O2
O2
O2 O2
O2
Oxygen
E
E
E
E
E
E Exudates (Nutrients)
Soil Microbes
H2O
H2O
H2O
C
E-C
A

ITRC — Phytotechnology Technical and Regulatory Guidance and Decision Trees, Revised February 2009
12
1.2.2 Rhizodegradation
The presence of a contaminant in a soil tends to naturally select organisms such as bacteria,
yeast, and fungi that prefer that chemical as a source of food and energy. Microbial populations
of specific organisms selected by using the contaminant as a primary food source can be several
orders of magnitude higher than other organisms that do not metabolize the contaminant. The
rate of degradation, metabolization, or mineralization of the contaminant in the soil depends on
the bioactivity in the soil that is derived primarily from the proteins and enzymes from the soil
organisms. However, contaminant breakdown is often limited by the availability of electron
acceptors or donors, cometabolites, inorganic nutrients, plant vitamins and hormones, pH, and/or
water.
In general, a symbiotic relationship evolves between plants and soil microbes in the rhizosphere.
Plants provide nutrients necessary for the microbes to thrive, while the microbes provide a
healthier soil environment where plant roots can grow. Specifically, plants loosen soil and
transport oxygen and water into the rhizosphere. Furthermore, plants exude specific
phytochemicals (sugars, alcohols, carbohydrates, etc.) that are primary sources of food (carbon)
for the specific soil organisms that aid in providing the healthier soil environment. Alternatively,
the exuded phytochemical may be an allelopathic agent meant to suppress other plants from
growing in the same soil. In return for exporting these phytochemicals, plants are protected from
competition, soil pathogens, toxins, and other chemicals that are naturally present or would
otherwise be growing in the soil environment. Microbial populations can be several of orders of
magnitude higher in a vegetated soil compared to an unvegetated soil.
Rhizodegradation, sometimes called phytostimulation, rhizosphere biodegradation, or plant-
assisted bioremediation/degradation, is the enhanced breakdown of a contaminant by increasing
the bioactivity using the plant rhizosphere environment (see Figure 1-2) to stimulate the
microbial populations. This enhanced bioactivity represents the primary means through which
organic contaminants can be remediated, including into harmless products that can be converted
into a source of food and energy for the plants or soil organisms (Donnelly and Fletcher 1994).
Specifically, the contaminants themselves may be analogs to the phytochemical naturally exuded
by the plant and fortuitously metabolized as a substitute to the primary carbon source.
Alternatively, the exuded phytochemicals may be cometabolites to organisms that are able to
breakdown the contaminants as the primary metabolite. In this case, the contaminant is still
metabolized (i.e., biodegraded) but at a slower rate or through a less efficient metabolic pathway
than when the cometabolite is present. Similarly, the specific proteins and enzymes, or analogs to
those produced by the soil organism needed to breakdown the contaminant, may be produced and
exuded by the plant itself. Figure 1-6 depicts these mechanisms.

ITRC — Phytotechnology Technical and Regulatory Guidance and Decision Trees, Revised February 2009
13
Figure 1-6. Rhizodegradation mechanisms.
1.2.3 Phytohydraulics
Plants significantly affect local hydrology. Phytohydraulics is the ability of vegetation to
evapotranspire (see Section 1.1.3) sources of surface water and groundwater. The vertical
migration of water from the surface downward can be limited by the water interception capacity
of the aboveground canopy and subsequent evapotranspiration through the root system. This
process was depicted in Figure 1-3. If water infiltrating from the surface is able to percolate
below the root zone, it can recharge groundwater. However, the rate of recharge depends not only
on the rooting depth of the species, but on the soil characteristics as well (see Section 2.2.3.1).
The horizontal migration of groundwater can be contained or controlled (USEPA 2000) using
deep-rooted species such as prairie plants and trees to intercept, take up, and transpire the water,
as depicted in Figure 1-7. One class of trees that has been widely studied in phytotechnologies is
phreatophytes, which are deep-rooted, high-transpiring, water-loving trees that send their roots
into regions of high moisture and that can survive in conditions of temporary saturation (Gatliff
1994). Typical phreatophytes include species within the Salicaceae family such as cottonwoods,
poplars, and willows.
Root or Root Fragment
O2
O2
O2
O2
O2 O2
O2
Oxygen
E
E
E
E
E
E Exudates (Nutrients)
Soil Microbes
H2O
H2O
H2O
C
C = Contaminant
C C1 C2 CO2 +
H2O
+ C1
E + O2 + H2O = Happy “Bugs”

ITRC — Phytotechnology Technical and Regulatory Guidance and Decision Trees, Revised February 2009
14
Figure 1-7. Phytohydraulics and groundwater hydraulic depression.
1.2.4 Phytoextraction
Phytoextraction refers to the ability of plants to take up contaminants into the roots and
translocate them to the aboveground shoots or leaves. For contaminants to be extracted by plants,
the constituent must be dissolved in the soil water and come into contact with the plant roots
through the transpiration stream. Alternatively, the uptake may occur through vapor adsorption
onto the organic root membrane in the vadose zone. Once adsorbed, the contaminant may
dissolve into the transpiration water or be actively taken up through plant transport mechanisms.
Figure 1-8 depicts both of these uptake pathways.
Once a chemical is taken up, the plant may store the chemical and/or its by-products in the plant
biomass via lignification (covalent bonding of the chemical or its by-products into the lignin of
the plant), sequester it into the cell vacuoles of aboveground tissues (as opposed to in root cells
as part of phytosequestration, see Section 1.2.1). Alternatively, the contaminant may be
metabolized through phytodegradation mechanisms (see Section 1.2.5) and/or phytovolatilized in
the transpiration stream exiting the plant (see Section 1.2.6).

ITRC — Phytotechnology Technical and Regulatory Guidance and Decision Trees, Revised February 2009
15
Figure 1-8. Phytoextraction mechanisms.
For organic chemicals, factors that affect the potential uptake into plants through the
transpiration stream include hydrophobicity, polarity, sorption properties, and solubility. One
characteristic that has been shown to correlate to uptake into a plant is the octanol-water partition
coefficient, log Kow. Specifically, organic chemicals having log Kow values between 1 and 3.5
have been shown to enter into plants (Burken and Schnoor 1997a). The plant root is an organic
membrane consisting of a lipid bilayer (see Figure 1-5). The organic characteristics of the lipids
make the root partially hydrophobic while the bilayering aspects make it also nonpolar.
Therefore, hydrophobic chemicals (log Kow >3.5) are generally not sufficiently soluble in the
transpiration stream or are bound so strongly to the surface of the roots that they cannot be easily
translocated into the plant xylem. On the other hand, chemicals that are highly polar and very
water soluble (log Kow <1.0) are not sufficiently sorbed by the roots, nor are they actively
transported through plant membranes due to their high polarity (Briggs, Bromilow, and Evans
1982). Most benzene, toluene, ethylbenzene, and xylene (BTEX) chemicals; chlorinated solvents;
and short-chain aliphatic chemicals fall within the log Kow range that allow them to be
susceptible to phytoextraction. Table 1-4 shows several examples.
The vapor uptake pathway into plants was specifically identified for chlorinated solvents such as
perchloroethene (PCE, also known as “tetrachloroethene”), where partitioning coefficients
between plant tissue and air and between plant tissue and water were measured to be 0.0081 L/g
and 0.049 L/g, respectively (Struckhoff, Burken, and Schumacher 2005). Volatile hydrocarbons

ITRC — Phytotechnology Technical and Regulatory Guidance and Decision Trees, Revised February 2009
16
such as BTEX constituents are often rhizodegraded to an extent that limits measurable
phytoextraction (Fiorenza et al. 2005).

ITRC — Phytotechnology Technical and Regulatory Guidance and Decision Trees, Revised February 2009
17
Table 1-4. Chemical properties for typical contaminants
Chemical Log Kow
a
(unitless)
Solubilitya
(mol/L)
Henry’s
constanta
(unitless)
Vapor
pressurea
(atm)
TSCFb
(unitless)
RCFc
(L/kg)
Benzene 2.13 1.64 0.2250 0.90 0.71 3.6
Toluene 2.69 2.25 0.2760 1.42 0.74 4.5
Ethylbenzene 3.15 2.80 0.3240 1.90 0.63 6.0
m-Xylene 3.20 2.77 0.2520 1.98 0.61 6.2
Trichloroethene 2.33 2.04 0.4370 1.01 0.74 3.9
Aniline 0.90 0.41 2.2 105 2.89 0.26 3.1
Nitrobenzene 1.83 1.77 0.0025 3.68 0.62 3.4
Phenol 1.45 0.20 >1.0 105 3.59 0.47 3.2
Pentachlorophenol 5.04 4.27 1.5 104 (d)
6.75d 0.07 54
Atrazine 2.69 3.81 1.0 107 (d)
9.40d
0.74 4.5
1,2,4-Trichlorobenzene 4.25 3.65 0.1130 3.21 0.21 19
RDXe 0.87 4.57 - - 0.25 3.1
a Physical chemical properties (Schwarzenbach, Gschwend, and Imkboden 1993) at 25°C unless otherwise noted.
b Transpiration stream concentration factor (TSCF) = 0.75 exp{–[log Kow (–2.50)]
2/2.4}.
c Root concentration factor (RCF) = 3.0 + exp(1.497 log Kow – 3.615).
d From Schnoor 1997.
e 1,3,5-trinitroperhydro-1,3,5-triazine, an explosive.
Source: Burken and Schnoor 1997a.
The relative ability of a plant to take up a chemical from the soil or groundwater into their roots
is described by the root concentration factor (RCF), measured as the ratio of the concentration in
the root (mg/kg) to the concentration in the external solution (mg/L). Furthermore, translocating
the chemical to its shoots is described by the transpiration stream concentration factor (TSCF),
measured as the ratio of the concentration in the xylem sap (mg/L) to the concentration in
external solution (mg/L). These are also presented in Table 1-4 for the various chemicals
although field values will typically depend on soil properties, chemical partitioning, and the plant
species. Higher RCF and TSCF values are an indication of enhanced contaminant uptake by
plants and vary directly with the log Kow of the chemical. Contaminants in solution with the
highest TSCF contained a log Kow in the range of 1–3.5 (Briggs, Brimilow, and Evans 1982;
Schnoor 1997). Equations describing the potential uptake are provided in Section 2.4.1.1 (see
Equations 2-3 and 2-4).
For inorganic constituents such as salts, metals, and radionuclides, the uptake into plants and
translocation into the aboveground tissues depends on the redox state, chemical speciation in the
soil, sediment or groundwater, and the plant species. As a general rule, readily bioavailable
inorganics for plant uptake include As, Cd, Cu, Ni, Se, and Zn. Moderately bioavailable metals
are Co, Fe, and Mn, whereas Cr, Pb, and U are not very bioavailable (Bañuelos et al. 1998;
Cipollini and Pickering 1986; Hinchman, Negri, and Gatliff 1997; Keiffer 1996; Keiffer and
Ungar 1996; Kumer et al. 1995; Martin et al. 1996; Salt et al. 1995; Spier, August, and Feltham
1992). Several of these constituents, often considered as environmental contaminants in
sufficient concentration, are also essential plant nutrients (see Section 1.1.1). Furthermore,

ITRC — Phytotechnology Technical and Regulatory Guidance and Decision Trees, Revised February 2009
18
inorganic nutrients that make up various salts such as Ca, Cl, Mg, N, P, and K are readily taken
up in available forms as well (see Table 1-1).
Certain plants called “hyperaccumulators” (McIntyre 2001) absorb unusually large amounts of
metals in comparison to other plants and the ambient metal concentration. For a plant to be
classified as a hyperaccumulator, it must be able to accumulate at least 1,000 mg/kg (dry weight)
of a specific metal or metalloid (for some metals or metalloids, the concentration must be 10,000
mg/kg) (Baker, Brooks, and Reeves 1998). Similarly, “halophytes” are plants that can tolerate
and, in many cases, accumulate large quantities of salt (typically, NaCl but also Ca and Mg
chlorides). Hyperaccumulators and halophytes are often discovered as being selected to grow at a
site based on the metals or salts naturally present, forming their own niche through evolution.
Some halophytes in tropical and near tropical environments such as salt cedars take up saline
water and exude the excess salt through the stomata back onto the ground as a means to create
the niche. Furthermore, some plants may produce and exude specific phytochemicals directly
into the soil environment that alter the chemistry and speciation of constituents to promote the
mobilization and uptake into the plant, particularly for enhancing the uptake of essential nutrients
through the release of acidic phytochemicals.
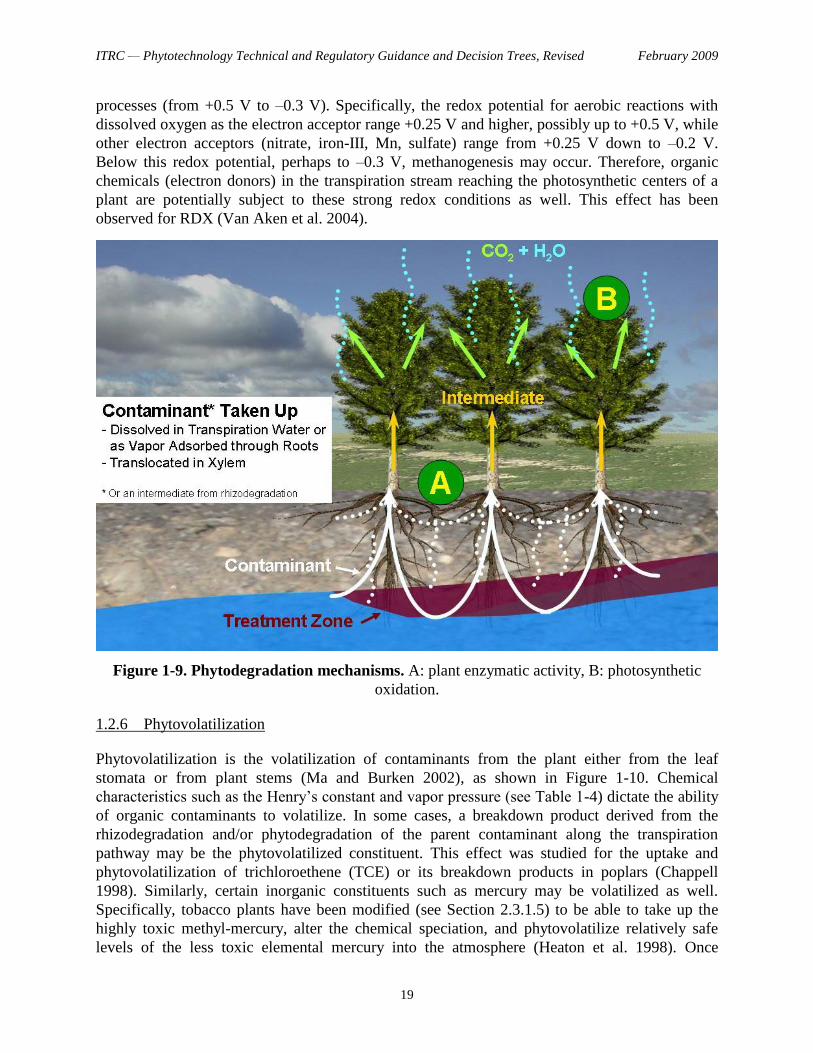
1.2.5 Phytodegradation
Depending on factors such as the concentration and composition, plant species, and soil
conditions, contaminants may be able to pass through the rhizosphere only partially or negligibly
impeded by phytosequestration (see Section 1.2.1) and/or rhizodegradation (see Section 1.2.2). In
this case, the contaminant may then be subject to biological processes occurring within the plant
itself, assuming it is dissolved in the transpiration stream and can be phytoextracted (see Section
1.2.4). Specifically, phytodegradation, also called “phytotransformation,” refers to the uptake of
contaminants with the subsequent breakdown, mineralization, or metabolization by the plant
itself through various internal enzymatic reactions and metabolic processes. Figure 1-9 depicts
these mechanisms.
Plants catalyze several internal reactions by producing enzymes with various activities and
functions (Newman 1995, Schnoor et al. 1995). Specifically, oxygenases have been identified in
plants that are able to address hydrocarbons such as aliphatic and aromatic compounds.
Similarly, nitroreductases are produced in some plants that can reduce and breakdown energetic
compounds such as the explosives trinitrotoluene (TNT), 1,3,5-trinitroperhydro-1,3,5-triazine
(RDX), and 1,3,5,7-tetranitro-1,3,5,7-tetrazocane (HMX). Although not known to be naturally
produced in plants, dehalogenase-like activity has also been identified and isolated (Dhankher et
al. 1999) that can remove halogen subgroups from compounds such as chlorinated solvents.
Many of these plant enzymes may even be able to metabolize or mineralize these chemicals
completely to carbon dioxide and water (Schnoor 1997). In addition, research has shown that the
endophytic symbiotic bacteria Methylobacterium populum that lives within poplar can mineralize
RDX and HMX (Van Aken et al. 2004).
In addition, the oxidation and reduction cycle operating during photosynthesis (see Section 1.1.2)
offer additional contaminant breakdown potential. Stronger oxidants and reductants are produced
in the plant system (from +1.1 V to –1.3 V) than are commonly available in biodegradation
ITRC — Phytotechnology Technical and Regulatory Guidance and Decision Trees, Revised February 2009
19
processes (from +0.5 V to –0.3 V). Specifically, the redox potential for aerobic reactions with
dissolved oxygen as the electron acceptor range +0.25 V and higher, possibly up to +0.5 V, while
other electron acceptors (nitrate, iron-III, Mn, sulfate) range from +0.25 V down to –0.2 V.
Below this redox potential, perhaps to –0.3 V, methanogenesis may occur. Therefore, organic
chemicals (electron donors) in the transpiration stream reaching the photosynthetic centers of a
plant are potentially subject to these strong redox conditions as well. This effect has been
observed for RDX (Van Aken et al. 2004).
Figure 1-9. Phytodegradation mechanisms. A: plant enzymatic activity, B: photosynthetic
oxidation.
1.2.6 Phytovolatilization
Phytovolatilization is the volatilization of contaminants from the plant either from the leaf
stomata or from plant stems (Ma and Burken 2002), as shown in Figure 1-10. Chemical
characteristics such as the Henry’s constant and vapor pressure (see Table 1-4) dictate the ability
of organic contaminants to volatilize. In some cases, a breakdown product derived from the
rhizodegradation and/or phytodegradation of the parent contaminant along the transpiration
pathway may be the phytovolatilized constituent. This effect was studied for the uptake and
phytovolatilization of trichloroethene (TCE) or its breakdown products in poplars (Chappell
1998). Similarly, certain inorganic constituents such as mercury may be volatilized as well.
Specifically, tobacco plants have been modified (see Section 2.3.1.5) to be able to take up the
highly toxic methyl-mercury, alter the chemical speciation, and phytovolatilize relatively safe
levels of the less toxic elemental mercury into the atmosphere (Heaton et al. 1998). Once

ITRC — Phytotechnology Technical and Regulatory Guidance and Decision Trees, Revised February 2009
20
volatilized, many chemicals that are recalcitrant in the subsurface environment react rapidly in
the atmosphere with hydroxyl radicals, an oxidant formed during the photochemical cycle.
Figure 1-10. Phytovolatilization mechanism.
1.3 Applications
Applying phytotechnologies to environmentally impacted sites entails selecting, designing,
installing, operating, maintaining, and monitoring planted systems that use the various
mechanisms described in the previous section. The goal of the system can be broadly based on
the remedial objectives of containment, remediation, or both. Furthermore, the target media can
be soil/sediment, surface water, or groundwater, and these can be either clean or impacted. In
some cases, groundwater transitioning to surface water (daylighting seep) can be addressed as a
riparian situation where target media are combined. The possible combinations of treatment goal,
target media, and applicable mechanisms are summarized in Tables 1-5a and 1-5b for each
application. However, specific applications can be designed such that a particular mechanism is
emphasized as the primary means of treatment either through plant selection, engineering and
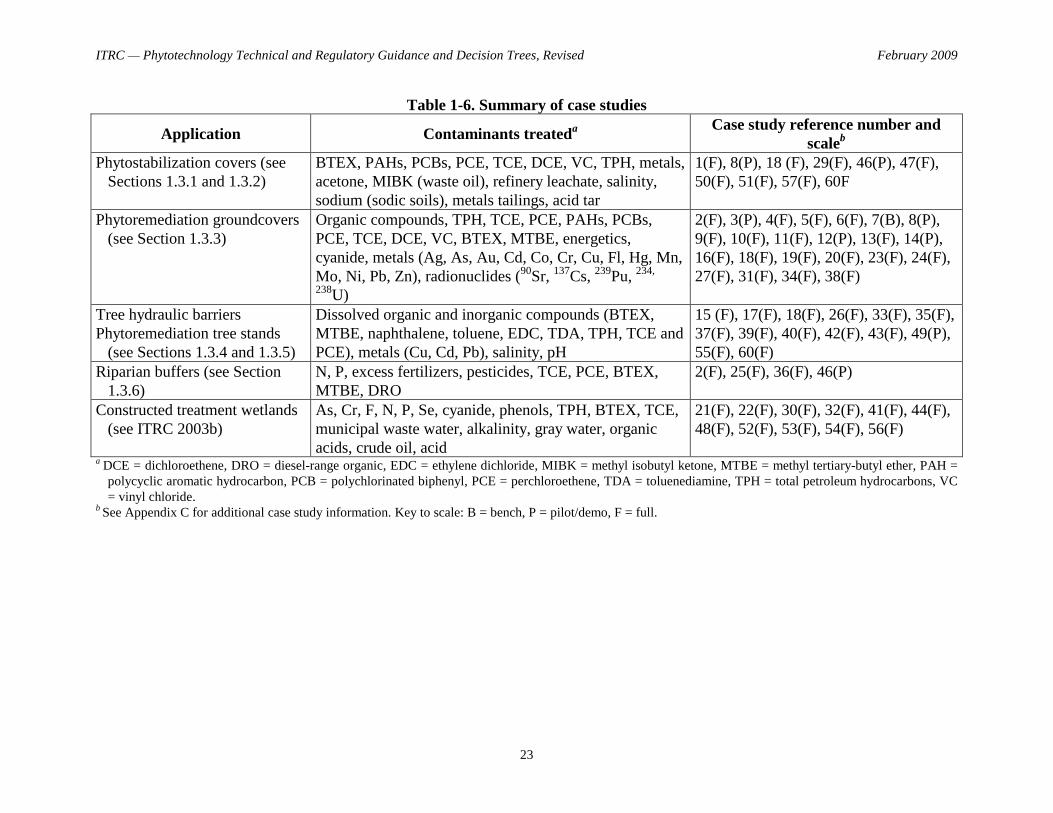
design, or method of installation or construction. Specific case study applications are
summarized in Table 1-6, with additional information provided in Appendix C.

ITRC — Phytotechnology Technical and Regulatory Guidance and Decision Trees, Revised February 2009
21
Table 1-5a. Summary of phytotechnology applications and potential mechanisms for containment treatment goals
Media Application Potential mechanisms Comments
Soil/sediment
(impacted)
Phytostabilization covera
(soil/sediment stabilization)
Phytosequestration
Phytoextraction (no harvesting)
Adsorption (abiotic)
Precipitation (abiotic)
Settling/sedimentation (abiotic)
Also controls soil erosion by wind/water
See ITRC 2003b for sediment aspects.
Surface water
(clean)
Phytostabilization cover
(infiltration control)
Phytohydraulics (evapotranspiration)
Runoff (abiotic)
Vertical infiltration control
See ITRC 2003c, 2003d, 2006a, 2006b for
alternative (evapotranspiration) covers.
Surface water
(impacted)
Pond/lagoon/basin
Riparian buffer
Phytosequestration
Phytohydraulics (evapotranspiration)
Phytoextraction (no harvesting)
Evaporation (abiotic)
Infiltration (abiotic)
See ITRC 2003b.
Includes wastewater
Also controls soil erosion by water runoff
Groundwater
(clean)
Tree hydraulic barrier
Riparian buffer
Phytohydraulics (evapotranspiration) Lateral migration control
Groundwater
(impacted)
Tree hydraulic barrier
Riparian buffer
Phytosequestration
Phytohydraulics (evapotranspiration)
Phytoextraction (no harvesting)
Lateral migration control
a Applications in bold are covered in this document:
Phytostabilization cover (for soil/sediment stabilization), see Section 1.3.1.
Phytostabilization cover (for infiltration control), see Section 1.3.2.
Tree hydraulic barrier, see Section 1.3.4.
Riparian buffer, see Section 1.3.6.

ITRC — Phytotechnology Technical and Regulatory Guidance and Decision Trees, Revised February 2009
22
Table 1-5b. Summary of phytotechnology applications and potential mechanisms for remediation treatment goals
Media Application Potential mechanisms Comments
Soil/sediment
(impacted)
Phytoremediation
groundcovera
Rhizodegradation
Phytoextraction (with harvesting)
Phytodegradation
Phytovolatilization
Biodegradation (microbial)
Oxidation/reduction (abiotic)
Volatilization (abiotic)
Phytohydraulics (evapotranspiration) assumed
for phytoextraction, phytodegradation, and
phytovolatilization
Surface water
(impacted)
Pond/lagoon/basin
Riparian buffer
Constructed treatment wetland
Rhizodegradation
Phytoextraction (with harvesting)
Phytodegradation
Phytovolatilization
Biodegradation (microbial)
Oxidation/reduction (abiotic)
Volatilization (abiotic)
See ITRC 2003b.
Includes wastewater and extracted groundwater
Phytohydraulics (evapotranspiration) assumed
for phytoextraction, phytodegradation, and
phytovolatilization
Groundwater
(impacted)
Phytoremediation tree stand
Riparian buffer
Rhizodegradation
Phytoextraction (with harvesting)
Phytodegradation
Phytovolatilization
Oxidation/reduction (abiotic)
Biodegradation (microbial)
Phytohydraulics (evapotranspiration) assumed
for phytoextraction, phytodegradation, and
phytovolatilization
a Applications in bold are covered in this document:
Phytoremediation groundcover, see Section 1.3.3.
Phytoremediation tree stand, see Section 1.3.5.
Riparian buffer, see Section 1.3.6
ITRC — Phytotechnology Technical and Regulatory Guidance and Decision Trees, Revised February 2009
23
Table 1-6. Summary of case studies
Application Contaminants treateda
Case study reference number and
scaleb
Phytostabilization covers (see
Sections 1.3.1 and 1.3.2)
BTEX, PAHs, PCBs, PCE, TCE, DCE, VC, TPH, metals,
acetone, MIBK (waste oil), refinery leachate, salinity,
sodium (sodic soils), metals tailings, acid tar
1(F), 8(P), 18 (F), 29(F), 46(P), 47(F),
50(F), 51(F), 57(F), 60F
Phytoremediation groundcovers
(see Section 1.3.3)
Organic compounds, TPH, TCE, PCE, PAHs, PCBs,
PCE, TCE, DCE, VC, BTEX, MTBE, energetics,
cyanide, metals (Ag, As, Au, Cd, Co, Cr, Cu, Fl, Hg, Mn,
Mo, Ni, Pb, Zn), radionuclides (90
Sr, 137
Cs, 239
Pu, 234,
238U)
2(F), 3(P), 4(F), 5(F), 6(F), 7(B), 8(P),
9(F), 10(F), 11(F), 12(P), 13(F), 14(P),
16(F), 18(F), 19(F), 20(F), 23(F), 24(F),
27(F), 31(F), 34(F), 38(F)
Tree hydraulic barriers
Phytoremediation tree stands
(see Sections 1.3.4 and 1.3.5)
Dissolved organic and inorganic compounds (BTEX,
MTBE, naphthalene, toluene, EDC, TDA, TPH, TCE and
PCE), metals (Cu, Cd, Pb), salinity, pH
15 (F), 17(F), 18(F), 26(F), 33(F), 35(F),
37(F), 39(F), 40(F), 42(F), 43(F), 49(P),
55(F), 60(F)
Riparian buffers (see Section
1.3.6)
N, P, excess fertilizers, pesticides, TCE, PCE, BTEX,
MTBE, DRO
2(F), 25(F), 36(F), 46(P)
Constructed treatment wetlands
(see ITRC 2003b)
As, Cr, F, N, P, Se, cyanide, phenols, TPH, BTEX, TCE,
municipal waste water, alkalinity, gray water, organic
acids, crude oil, acid
21(F), 22(F), 30(F), 32(F), 41(F), 44(F),
48(F), 52(F), 53(F), 54(F), 56(F)
a DCE = dichloroethene, DRO = diesel-range organic, EDC = ethylene dichloride, MIBK = methyl isobutyl ketone, MTBE = methyl tertiary-butyl ether, PAH =
polycyclic aromatic hydrocarbon, PCB = polychlorinated biphenyl, PCE = perchloroethene, TDA = toluenediamine, TPH = total petroleum hydrocarbons, VC
= vinyl chloride. b See Appendix C for additional case study information. Key to scale: B = bench, P = pilot/demo, F = full.

ITRC — Phytotechnology Technical and Regulatory Guidance and Decision Trees, Revised February 2009
24
1.3.1 Phytostabilization Covers for Soil/Sediment Stabilization
Soil and sediment can mobilize (vertically and laterally) when exposed to uncontrolled water
flows. Furthermore, soil can also mobilize (as airborne contamination) by blowing wind. Both of
these modes of soil/sediment migration are known as “erosion” or “leaching.” If the soil or
sediment is impacted, the migration of the contaminants through these modes is generally
considered nonpoint source (NPS) pollution. Phytostabilization covers provide a natural barrier
and resistance to erosion and leaching and can be further used to minimize NPS pollution if the
soil or sediment is impacted.
The main mechanism contributing to stabilizing erosion is the infusion of plant roots into the soil
or sediment. Typically, plants with fibrous root systems are used, such as many grasses,
herbaceous species, and wetland species. Typical rooting depths for these species are 1–2 feet for
upland species and <1 foot for wetland species (see ITRC 2003b for upland to wetland
characteristics). Common upland seed mixes are available through local Department of
Transportation offices formulated for stabilizing roadsides.
When the soil or sediment is impacted, the contaminants can also be phytosequestered (see
Section 1.2.1) by vegetation. Specifically, phytostabilization covers for soil or sediment control
erosion to minimize bulk migration of the contaminated media, while phytosequestration
mechanisms address the mobility of the contaminant itself. Therefore, phytostabilization covers
are simply soil or sediment that are planted with vegetation selected specifically to control bulk
soil migration (via infusion with fibrous root systems) and/or prevent contaminant migration
through phytosequestration. In some instances, the same species can serve both purposes.
In addition to phytosequestering contaminants in the rhizosphere, other plants, such as halophytes
and hyperaccumulators, can be selected based on their ability to phytoextract (see Section 1.2.4)
and accumulate contaminants into the aboveground tissues. Obviously, additional risks are
involved with moving contaminants into the plant; however, this aspect of a phytostabilization
cover application for soil/sediments may still be acceptable, depending on the overall human
health and ecological risks associated with the site. This is a decision factor to consider when
selecting this phytotechnology application as the site remedy (see Section 2.3). If a harvesting
and removal plan is implemented for the application to mitigate the additional risks, then the
application is classified as a phytoremediation groundcover (see Section 1.3.3).
1.3.2 Phytostabilization Covers for Infiltration Control
Another method to stabilize contaminants in the subsurface is to prevent water from interacting
with the waste, possibly leading to its migration. This is a common approach for landfill covers
but can also be applied to minimize surface water recharge of groundwater plumes.
Phytostabilization covers for infiltration control, also known as evapotranspiration, water-
balance, or vegetative covers, use the ability of plants to intercept rain to prevent infiltration and
take up and remove significant volumes of water after it has entered the subsurface to minimize
the percolation into the contained waste (Veissman, Lewis, and Knapp 1989). This effect is
illustrated in Figure 1-3, with typical water interception capacities listed in Table 1-2 and

ITRC — Phytotechnology Technical and Regulatory Guidance and Decision Trees, Revised February 2009
25
transpiration capacities for various types of species presented in Figures 1-4a to 1-4c. The main
phytotechnology mechanism for these applications is phytohydraulics (see Section 1.2.3).
Phytostabilization covers for infiltration control are composed of soil and plants that maximize
evaporation from the soil and plant evapotranspiration processes (see Section 1.1.3) from the
system. To allow these time-dependent (and climate-dependent) processes to occur and
successfully remove water from the system, the soil component of the cover is specifically
designed and installed such that the available water storage capacity in the soil is maximized.
The vegetation component of the cover usually entails specially formulated seed mixes or mixed
communities of plants/trees that can access the stored water as well as create the intercepting
canopy. Furthermore, the entire cover is often contoured to promote runoff as another significant
loss mechanism for the overall water balance. Different water balance models are available (see
Equation 2-5) with additional information available in ITRC 2003c.
When minimizing infiltration, one of the potential outcomes is to create an anaerobic zone
underneath the phytostabilization cover. In some cases, the subsurface conditions will be driven
into methanogenic (methane-producing) conditions. These covers may not be appropriate for
sites that can lead to the production of chronic, large, or uncontrolled amounts of this landfill gas.
While the methane itself may or may not be toxic to the plants, the presence of the gas in the
vadose zone may restrict the oxygen transport needed for cell respiration in the root system (see
Section 1.1.2). Furthermore, these covers have not been shown to be able to prevent the diffusion
of landfill gases to the surface. Therefore, these gases must be controlled through other means.
1.3.3 Phytoremediation Groundcovers
In addition to the ability of cover systems to stabilize soil/sediment and control hydraulics,
densely rooted groundcover plants and grasses can also be used to phytoremediate contaminants.
Phytoremediation groundcovers are one of the more widely used applications and have been
applied at various bench- to full-scale remediation projects. It is the “classic” application often
referred to as “phytoremediation” (distinguishing it from the nonremediation aspects of
phytotechnologies such as phytostabilization covers, see Sections 1.3.1 and 1.3.2, and hydraulic
tree stands, see Section 1.3.4). Furthermore, in the context of this document, phytoremediation
groundcovers are vegetated systems typically applied to surface soils as opposed to
phytoremediation tree stands (see Section 1.3.5), which refers to phytoremediation systems for
deep soils and/or groundwater. The typical range of effectiveness for phytoremediation
groundcovers is 1–2 feet below ground surface (bgs); however, depths down to 5 feet have been
reported as within the range of influence under some situations (Olsen and Fletcher 1999).
Phytoremediation encompasses rhizodegradation, phytodegradation, and/or phytovolatilization
mechanisms (see Sections 1.2.2, 1.2.5, and 1.2.6, respectively) to reduce contaminant
concentrations at the site. Furthermore, phytoremediation also includes phytoextraction (see
Section 1.2.4) as long as harvesting and contaminant removal is included in the application. The
specific mechanisms that are emphasized in an application depend on the mobility, solubility,
degradability, and bioavailability of the contaminant(s) of concern (COC). Phytoremediation
groundcovers have been widely applied to soils impacted with recalcitrant compounds such as
PAHs, PCBs, and other persistent organic pollutants that are typically less mobile, soluble,

ITRC — Phytotechnology Technical and Regulatory Guidance and Decision Trees, Revised February 2009
26
biodegradable, and bioavailable. Reviews of these works can be found in the literature (Flathman
and Lanza 1998; Frick, Farrell, and Germida 1999; Zeeb et al. 2006; Russell 2005). Furthermore,
these groundcover systems can also be used as certain types of landfill covers that also promote
the degradation of the underlying waste (USEPA 2000). These have been referred to as
bioreactor landfills (see ITRC 2006a). Finally, phytoremediation groundcovers have been used to
extract specific inorganic contaminants such as metals, salts, and radionuclides in concentrations
higher than what existed in the soil. Typical concentration ratios of many such elements have
been compiled by many scientists (Wang, Biwer, and Yu 1993). The remediation aspects for
these constituents occur when the aboveground portions of the plant where the inorganic
contaminant accumulates are harvested with conventional agricultural methods and removed
from the site.
To enhance the phytoextraction capabilities, several strategies have been attempted. Lead can be
made much more bioavailable with the addition of chelating agents such as ethylene diamine
tetra-acetic acid (EDTA) to soils (Schnoor 1997). Similarly, a considerable body of information
exists on the uptake of radionuclides into plants, including laboratory and field studies where
radionuclides from nuclear weapons complexes or test sites have been transferred into plants.
Specifically, the availability of uranium and radio-cesium 137 has been enhanced using citric
acid and ammonium nitrate, respectively (Dodge and Francis 1997, Riesen and Bruner 1996).
However, adding these enhancing agents also increases the inherent risks associated with the
application since they can also mobilize target contaminants and other constituents deeper into
the soil or into groundwater. This is a decision factor to consider when selecting this
phytotechnology application as the site remedy (see Section 2.3). Furthermore, the timing of the
application should be thoroughly designed, planned, and managed during implementation (see
Section 2.4).
1.3.4 Tree Hydraulic Barriers
Groundwater naturally migrates from higher to lower elevations in the subsurface, typically along
the path of least resistance (i.e., higher permeable zones or aquifers). Contaminants present in the
groundwater can likewise migrate in the subsurface, potentially impacting downgradient
receptors. However, many contaminants can interact with the subsurface environment through
adsorption and electrostatic forces to retard the contaminant plume compared to the bulk
groundwater. To contain the hydraulic flow, groundwater extraction can be used to further limit
the migration of groundwater plumes. When groundwater is extracted downgradient of the
plume, the hydraulic gradient is reversed in a cone (or zone) of depression creating a capture
zone. When groundwater is extracted upgradient of the plume, the hydraulic gradient within the
plume is reduced, causing slower plume migration. Figure 1-11 illustrates both of these
alternatives using trees to extract the groundwater and create the hydraulic containment barrier.
Most tree hydraulic barrier applications concentrate the plantings above and at the downgradient
edge of the plume (Matso 1995). All applications use the phytohydraulic mechanisms (see
Section 1.2.3).

ITRC — Phytotechnology Technical and Regulatory Guidance and Decision Trees, Revised February 2009
27
Figure 1-11. Tree hydraulic barrier application (plan view). A: downgradient plume,
B: upgradient groundwater control.
In general, the deep-rooted, high-transpiring trees must be actively tapping into the groundwater
to create the barrier. Furthermore, a relatively large number of trees (and associated area) are
generally required to extract the volumes necessary to achieve containment. Typical transpiration
rates were shown previously in Figure 1-4c for woody species (trees) of various ages. Although
this type of phytotechnology application has generally focused on the use of trees, other species
such as prairie grasses have root systems that can reach 10–15 feet bgs, given optimal soil and

ITRC — Phytotechnology Technical and Regulatory Guidance and Decision Trees, Revised February 2009
28
moisture conditions (USEPA 1998). Furthermore, many of these species have high transpiration
rates, as shown in Figure 1-4a. The range of values presented depends on many other factors,
including the depth of groundwater, soil conditions, and climate in the region where the site is
located. These factors must be considered when selecting and designing the technology (see
Sections 2.3 and 2.4, respectively). Similar to other extraction systems, the influence of tree
hydraulic barriers on groundwater plumes can be modeled (see Section 2.4.1.2).
1.3.5 Phytoremediation Tree Stands
In addition to the ability of deeper rooted plants and trees to take up and transpire groundwater,
they can also be used to phytoremediate deeper soils and contaminated plumes that are located
near the top of the water table. While phytohydraulics can be used to bring the contaminants into
the root zone, rhizodegradation, phytodegradation, and/or phytovolatilization mechanisms (see
Sections 1.2.2, 1.2.5, and 1.2.6, respectively) can reduce contaminant concentrations at depth.
Furthermore, phytoremediation also includes phytoextraction (see Section 1.2.4) as long as
harvesting and contaminant removal is included in the application. These mechanisms further
reduce the migration of contaminated groundwater plumes through destruction.
Phytoremediation tree stands have been widely applied to soluble contaminants that commonly
impact groundwater such as petroleum products (BTEX, MTBE, aliphatics, gasoline-range
organics [GRO], DRO, and TPH) and chlorinated hydrocarbons (PCE, TCE, DCE, VC, etc.). The
lighter fractions of these constituents are generally mobile, soluble, and bioavailable with log Kow
values in the range where uptake into plants is expected. However, the bioactivity in the
rhizosphere (see Section 1.1.2) may limit or eliminate plant uptake since these constituents are
also relatively biodegradable. Several reviews of these applications have been published
(Chappell 1998, Van Den Bos 2002). Furthermore, some phytoremediation tree stand
applications have been successful when planted into free-phase product, showing dramatic
reductions in concentrations as the plume flowed through the root zone (Fiorenza et al. 2005).
1.3.6. Riparian Buffers
As agriculture and urbanization encroach upon downgradient surface water bodies, NPS
pollution is often generated in the runoff. This can contain fertilizers, pesticides, and animal
waste from agriculture; sediment from cleared, urbanized lands; and road salts, automotive
fluids, and other urban chemicals from roadways and infrastructure. Riparian buffers are
vegetated areas that protect adjacent water resources from NPS pollution. In addition, these
buffers provide bank stabilization and habitat for aquatic and other wildlife. Figure 1-12 shows a
cross-section of a typical riparian buffer, along with the types of vegetation according to the
wetland indicator status (see ITRC 2003b for further definitions).
Similar situations that threaten surface water bodies are groundwater seeps that contain
environmental pollutants. Typically, where these seeps daylight is just upgradient of a surface
water body (i.e., a gaining water body) that then flows directly into the receptor. In some cases,
including seasonal variations, the groundwater may not always daylight and may simply feed the
surface water body through a subsurface hydrologic connection. Placement of a riparian buffer
would be along and upgradient of the groundwater-surface water interface.

ITRC — Phytotechnology Technical and Regulatory Guidance and Decision Trees, Revised February 2009
29
Figure 1-12. Riparian buffer application.
It has long been recognized that riparian buffers (also known as or similar to riparian corridors,
riparian zones, vegetated swales, retention/detention basins, etc.) are vital to controlling the
hydrology and cleansing the runoff and near-surface groundwater. Specifically, the surface runoff
or seep requires that the flow of water be sufficiently slow or contained to allow sediments and
other particulate matter to settle out. The rate of flow is often measured as the hydraulic retention
time (HRT) and can be designed using the width, grade (vertical drop over horizontal distance),
and contouring of the system as well as soil characteristics. Furthermore, runoff water must flow
evenly across the buffer to be effective. If channels develop due to erosion, the effectiveness of
the buffer is greatly reduced due to the water “short-circuiting” the system and reducing the HRT.
For the contaminants in the runoff to be adequately remediated, the HRT must be sufficient to
match the rates of attenuation from various mechanisms. Many of these can be abiotic, such as
those mentioned in Tables 1-5a and 1-5b. Furthermore, the hydrology is affected by the
vegetation in the riparian buffer with the same mechanisms driving phytohydraulics while their
root systems promote phytosequestration, rhizodegradation, phytoextraction, phytodegradation,
and/or phytovolatilization (see Section 1.2).
1.4 Advantages and Limitations
Phytotechnologies is a broad set of technologies that can be applied to a wide range of
environmental conditions. In comparison to alternative cleanup technologies, it is one of the few
that can be applied to both organic and inorganic contaminants and to soil/sediment, surface
water, and groundwater. Furthermore, in some cases, it can be applied to various combinations of
contaminant types and impacted media simultaneously. In most other remedial approaches, these

ITRC — Phytotechnology Technical and Regulatory Guidance and Decision Trees, Revised February 2009
30
combinations would have to be
addressed using a treatment train. This
fact represents one of the main
advantages of phytotechnologies. Other
advantages are listed below:
considered a green technology and
sustainable
solar-powered (The system itself does
not require supplemental energy,
although monitoring equipment may.
See Section 2.5.)
improves air quality and sequesters
greenhouse gases
minimal air emissions, water
discharge, and secondary waste
generation
inherently controls erosion, runoff,
infiltration, and fugitive dust
emissions
passive and in situ
favorable public perception, including
as an educational opportunity
improves aesthetics, including
reduced noise
applicable to remote locations,
potentially without utility access
(critical utility is a supplemental
source of irrigation)
can be used to supplement other
remediation approaches or as a
polishing step
can be used to identify and map
contamination
can be installed as a preventative
measure, possibly as a leak detection
system
lower maintenance, resilient, and self-
repairing
creates habitat (can be a
disadvantage—attractive nuisance)
provides restoration and land
reclamation during cleanup and upon
completion
Example of Phytotechnologies’ Broad Utility
Consider wood-treating facilities where creosote (organic contaminant) and copper-chromium-arsenic (inorganic contaminants) wood preservations were used. Often, surface releases directly impact the soil while leaching of the soluble components of both organic and inorganic contaminants can create commingled groundwater impacts. Assume the groundwater is relatively shallow but spread across a large area of the site. Different treatment options are possible:
Option 1. Conventional Treatment Train—To address soil impacts, excavation and off-site disposal can prevent further leaching. Once completed, the groundwater impacts might be addressed using extraction (groundwater pumping network) to remove contaminants and control plume migration. Once extracted, the organic constituents in groundwater might be treated through granulated activated carbon (GAC). For the dissolved inorganic constituents, a reverse osmosis (RO) system might be used as treatment. Once cleansed, the groundwater would be discharged through a permitted outfall. This scenario uses three steps (excavation, extraction, treatment) with two treatment technologies (GAC and RO).
Option 2. Phytotechnology Application—Deep-rooted trees planted over the impacted area can send roots through the impacted soil to access the groundwater. Phytohydraulics can be used to control plume migration (tree hydraulic barrier application). Phytosequestration of the inorganics and rhizodegradation of the organics can be used to treat the surface soils (phytostabilization cover and phytoremediation groundcover applications). The dissolved inorganic constituents can be phytoextracted or phytosequestered in the trees (phytostabilization cover application) while the organic groundwater constituents can be rhizodegraded and/or phytodegraded (would likely not be phytovolatilized given the chemical properties of heavier hydrocarbon typical of creosote) (phytoremediation tree stand application). No water is discharged. This scenario uses one step (planting) but with four phytotechnology applications.
Option 3. Hybrid Approach—Excavation and extraction as in Option 1, but treatment in a constructed treatment wetland that can address both the organic and inorganic constituents (see ITRC 2003c). This scenario uses three steps (excavation, extraction, treatment) with one treatment technology.
Of course, the final selection of the remedial approach depends on many other factors besides remedial technologies, including technical issues, economics, regulatory acceptance, community stakeholders, etc.

ITRC — Phytotechnology Technical and Regulatory Guidance and Decision Trees, Revised February 2009
31
can be cost-competitive

ITRC — Phytotechnology Technical and Regulatory Guidance and Decision Trees, Revised February 2009
32
However, like all remediation technologies, phytotechnologies are appropriate only under certain
conditions. The major limitations are depth, area, and time. The physical constraints of depth and
area depend on the plant species suitable to the site (i.e., root penetration) as well as the site
layout and soil characteristics. Phytotechnologies typically require larger tracts of land than many
alternatives. Time can be a constraint since phytotechnologies generally take longer than other
alternatives and are susceptible to seasonal and diurnal changes. These limitations should be
considered along with several other decision factors when evaluating a phytotechnology as a
potential remedy (see Section 2.3). Furthermore, these potential limitations should be considered
when assessing the site (see Section 2.2) to determine immediate “No-Go” situations.
2. PHYTOTECHNOLOGIES PROJECT MANAGEMENT REQUIREMENTS
Developing and managing phytotechnology systems are similar to any in situ remediation system.
To successfully remediate a particular site, six general phases exist which require specific skills
necessary to understand the particular site conditions, treatment mechanism, design layout, and
evaluation parameters:
assessment
remedy selection
design
implementation
operation, maintenance, and monitoring (OM&M)
closure
Though discrete, these phases form a continuum and sometimes an iterative process to design an
optimal phytotechnology system for a contaminated site. The following sections describe unique
characteristics and functions required for each of these phases to reliably apply phytotechnologies
to address impacted soils, sediments, and/or groundwater.
2.1 Project Structure and Organization
2.1.1 Project Team
For any phytotechnology system, project team skills and roles should be established up front and
should consist of the following disciplines (or have personnel on the team capable of completing
these tasks). Table 2-1 identifies, in general, the required skills for each member of the project
team for each phase of the project.
Project Manager. Coordinate all of the information being gathered. Evaluate the
phytotechnology system to meet cleanup objectives, including containment zones,
contaminant remediation mechanisms, sampling and analysis plan, operation and
maintenance plan, health and safety plans, schedules, compliance, and cleanup time.
Soil Scientist/Agronomist. Evaluate the ability of the soil conditions to support plants.
Develop a soil amendment plan to prepare and maintain the growth of plants throughout the
duration of the phytotechnology application.

ITRC — Phytotechnology Technical and Regulatory Guidance and Decision Trees, Revised February 2009
33
Hydrologist/Geologist. Complete groundwater or surface water modeling, including runoff
control from irrigation systems. Conduct a site-wide water balance and model the fate and
transport of the COC(s).
Plant Biologist/Botanist. Evaluate a range of plant species suitable for the site soil,
groundwater, and climatic conditions. Knowledge of species capable of remediating the
COCs is desirable. Determine planting requirements, including density, patterns, field
preparation, and equipment needs. Develop plans for planting.
Environmental Scientist. Conduct greenhouse screening tests using water and/or soil
samples from the site to ensure that the plants can survive the contaminated conditions.
Conduct feasibility field studies to determine whether the plants will remediate the COCs.
Risk Assessor/Toxicologist. Formulate exposure pathways and risk scenarios. Evaluate the
ecological and human health risks of using phytotechnologies and compare them to the risks
associated with implementing one of the alternatives. Conduct toxicity evaluations using
relevant receptors.
Regulatory Specialist. Determine the regulatory requirements, final cleanup limits, sampling
and analysis requirements, data quality requirements, O&M requirements, and handling and
disposal of any generated wastes. Review and report any regulations pertinent to the project
(i.e., solid, water, and air emissions).
Environmental Engineer. Evaluate engineered implementability of a phytotechnology
system at the site (earthmoving, constructability, materials, etc). Design field systems:
irrigation, pumping, water control, rooting, security, automated sensors, etc. Assemble
relevant computer-aided design and drafting (CADD) drawings.
Field Manager/Health, Safety, and Environmental Officer. Review and make practical
adjustments to the plans for actual implementation in the field. Secure or construct all
necessary equipment, supplies, and machinery. Ensure that health and safety requirements are
in place and adhered to during field activities.
Cost Engineer/Analyst. Review the projected cost of the system as well as compare to any
alternatives. Ensure that all costs for the project are captured. Maintain budgets and
expenditures throughout the project.
Table 2-1. Required skills for project phases
Discipline Assessment Selection Design Implementation OM&M Closure
Project management X X X X X X
Soil sciences/agronomy X X X X X
Hydrology/geology X X X X
Plant biology/botany X X X X X
Environmental sciences X X
Risk assessment/
toxicology
X X
Regulatory interpretation X X X
Environmental
engineering
X X X X
Field and health, safety,
and environmental
management
X X X X X
Economic analysis X X

ITRC — Phytotechnology Technical and Regulatory Guidance and Decision Trees, Revised February 2009
34
2.1.2 Project Checklists and Planning
Each project phase has a unique set of deliverables with each subsequent phase dependent on
decisions of the previous phases. To ensure adequate information is available for the subsequent
decisions, the project team should establish a series of checklists outlining data requirements, site
needs, timetables, and expectations for each phase of the project. When transitioning from one
phase to the next, the project team should meet to discuss the completeness of the current phase
deliverables and prepare the checklist for the next phase. As the project progresses, these
checklists become more detailed and site specific. These checklists can be used to align site
owners, system designers, technology vendors, regulators, stakeholders, and the public on the
plan, evaluation, and effectiveness of the phytotechnology system to achieve the cleanup goals
for the site.
The checklists for all phases should, at a minimum, identify the composition, roles, and
responsibilities of the phytotechnology team (who), outline a project level timetable (when), and
outline the schedule and objectives (what) of site visits (where). Supplemental documentation
may also be necessary such as work plans, health and safety plans, site security protocols, etc.
(how). Specific phases may also require unique elements as summarized in Table 2-2.
2.2 Site Assessment
A complete site assessment is critical for the design and installation of a phytotechnology
treatment system. But like any other assessment, it should provide answers to the following basic
questions:
What type and quantity of contamination exists at the site?
Where and how is the contamination migrating?
What hazards exist to public health or the environment?
Once these basic site assessment questions are answered, such as using the Triad approach (see
ITRC 2007b), a risk assessment can be done, which then allows the phytotechnology project
objectives to be defined should the technology be selected as part of the remedy. Selection of a
phytotechnology as a potential remedy is described in Section 2.3 and incorporates much of the
information gained during the assessment. However, other factors such as economics;
wants/needs; and viewpoints from stakeholders, regulators, site owners, and community
members are also included.
2.2.1 Project Objectives
Remediation objectives for phytotechnologies can be control and containment, contaminant
removal and destruction, or both. When designed specifically for control and containment, there
is the potential to remediate as well. Furthermore, other objectives such as preventative
“phytoscaping,” polishing in a treatment train, and long-term end use or closure care
requirements may need to be considered, depending on the type or phase of the project.

ITRC — Phytotechnology Technical and Regulatory Guidance and Decision Trees, Revised February 2009
35
Table 2-2. Checklist of deliverables by project phase
Italics indicate phyto-specific information Deliverable
Assessment
Baseline concentration data
Risk assessment (receptor survey, exposure pathways, toxicology, etc.)
Statement of the remedial objectives, governing regulatory framework, cleanup targets
Site characterization data (topography, hydrogeology, obstructions, utilities, etc.)
Agronomic assessment data
Existing vegetation survey, climate data
Selection
Description of expectations of the site owner, regulators, stakeholders, and the public
Description of the stakeholder/public concerns with phytotechnologies
Closure criteria for the site
Environmental impact assessment (if needed)
List of candidate species successfully screened in greenhouse/laboratory studies (if needed)
Feasibility, fate and transport, or plant toxicity study results (if needed)
Mechanistic description of how phytotechnologies will achieve the remedial goals
Preliminary time estimates for phytotechnologies to complete cleanup
Preliminary design of the phytotechnology system
Economic comparison of the phytotechnology remedy to other alternatives
Design
Final proposed design of a phytotechnology system (layout, types and number of species, installation methods,
construction time, irrigation system, etc.)
Mass balance study results (if needed)
Plan to deal with waste generation and disposal during construction
Site health and safety plan; security plan; environmental impact/spill prevention, control, and countermeasure
plan
Operations and maintenance plan; plan to deal with secondary waste from the phytotechnology remedy (i.e.,
contaminated plants, plant parts)
Parameter list to evaluate effectiveness, monitoring schedule, milestones, data management plan
Contingency plan if the phytotechnology remedy does not achieve the monitoring milestones
Work plan for implementing the final design of the phytotechnology system
Implementation
Map/drawings of the final planted layout
Manifest of total materials used (seed/plant stock, fertilizer, mulch, amendments, backfill, etc.)
As-built drawings of engineered systems (i.e., irrigation system, storm water control systems, monitoring
devices/wells, security system, etc.)
Breakdown of final capital costs of installation
OM&M
System maintenance records, replanting records, pest (insect/herbivore) control measures
Monitoring records, concentration trend data, growth data
Transpiration rate and composition data (if needed)
Plant tissue data (contaminant uptake) (if needed)
List of volunteer growth species; associated invasive species control measures
Revised/updated site-wide water balance (if applicable)
Breakdown of annual operation, maintenance, and monitoring costs
Where required, periodic harvesting, transportation and disposal of plant wastes
Closure
Post-closure monitoring and care plan
Equipment decommissioning plan, plan to plug and abandon wells

ITRC — Phytotechnology Technical and Regulatory Guidance and Decision Trees, Revised February 2009
36
If reducing contaminant mobility is the primary objective, the main focus should be on rain
interception and/or groundwater uptake and the subsequent evapotranspiration from both
processes. The contaminant physical state (solubility and availability) should be considered as
well. The effects of the plants on contaminant fate and transport should be modeled, including,
potentially, plume migration, plume stability, and/or surface flow or vadose zone models. Several
models for these applications are available in the literature. See ITRC 2003c, 2008. Applications
for control and containment include vegetated caps, vegetated soil stabilization covers, and
hydraulic barriers (usually placed downgradient of a plume, but can be upgradient as well).
Phytotechnologies that remove contaminants from the media include phytoextraction and
phytovolatilization. These typically require the development of mass flux equations or rates of
extraction to model their effectiveness. Destruction of contaminants can be accomplished using
rhizodegradation and phytodegradation and can be modeled using degradation rate constants.
These remediation mechanisms can be combined with containment. Applications for removal or
destruction include phytoremediation groundcovers, tree stands for remediating deeper soil and
groundwater, constructed treatment wetlands, and riparian buffers. Closure criteria specifying the
target contaminant concentrations should be identified. The target concentration for each
contaminant may be driven by environmental regulations such as Resource Conservation and
Recovery Act (RCRA); Comprehensive Environmental Response, Compensation, and Liability
Act (CERCLA); and the Clean Water Act; or state-specific cleanup requirements. Surface water
discharges from the site, if any, may be required to meet National Pollutant Discharge and
Elimination System (NPDES) limitations. If water is removed from the site and treated or
disposed off site, RCRA standards are applicable. The closure criteria are the objectives that
must be fully achieved before closure can be granted.
The applications of phytotechnologies that combine containment with remediation include covers
that stabilize soils and phytoremediate contaminants, tree stands that create a hydraulic barrier
while remediating impacted soil and groundwater, constructed wetland treatment systems, and
riparian buffers.
2.2.2 General Information Relevant to Phytotechnologies
During any general site assessment, much of the information normally collected is useful in
determining whether phytotechnologies are applicable to the site in much the same way other
technologies are assessed. Site visits should be conducted to assess specific information.
Furthermore, photographic records of relevant areas provide documentation for future reference
as designs and plans are developed. Table 2-3 lists several categories of assessment information
that are normally collected, indicates which discipline of the phytotechnology team uses the
information, and describes why the information is relevant specifically for phytotechnologies.
This list is not exhaustive and includes no descriptions of general purpose use for selecting any
remedy but attempts to focus on the relevancy to phytotechnologies only.

ITRC — Phytotechnology Technical and Regulatory Guidance and Decision Trees, Revised February 2009
37
Table 2-3. General assessment information
Information
category Discipline Relevance to phytotechnologies
Site description
and history
Soil sciences/agronomy Surface features and obstructions to design the implementation and select planting equipment
Historic use of pesticides at the site or on adjacent sites (spray drift) to evaluate plant establishment
issues
Hydrology/geology Surface topography for determining runoff characteristics for irrigation
Plant biology/botany Location of water bodies, standing water, or inundation for plant selection
Environmental engineering Surface features, grade, and obstructions to determine area available for planting and constructability
Infrastructure and utilities that can support the phytotechnology system
Field and health, safety and
environmental management
Utilities and surface grade to evaluate implementability (health and safety), utility clearance,
slips/trips/fall potential, and personal protective equipment (PPE) requirements
Contaminant
assessment
Hydrology/geology Contaminant concentrations and composition to model fate and transport and determine contaminant
mobility driven by transpiration water usage
Plant biology/botany Vertical and horizontal extent of contamination to evaluate the ability of plants to affect the entire
contaminant mass
Environmental sciences Contaminant concentrations and composition for plant screening and testing
Regulatory interpretation Impacted media and contaminants to determine handling requirements of waste generated during
construction and long-term OM&M
Field and health, safety and
environmental management
Impacted media and contaminants to determine PPE requirements
Hydrogeological
conditions
Hydrology/geology Groundwater flow direction, hydraulic conductivity, and soil types to design and model the effects of
hydraulic phytotechnology systems
Plant biology/botany Depth to groundwater accessible by plants, soil classifications, and geological stratification affecting
root growth and penetration
Groundwater salinity and pH for plant selection
Wetland indicators (surface water/groundwater interface) for plant selection
Redox potential to determine degradability of contaminants within and outside of the rhizosphere of the
plant species
Environmental engineering Soil classifications and geological stratification to determine competence for tree boreholes
Depths of all clean and impacted water-bearing zones to determine target depths for hydraulic capture
and exclusion
Exposure
assessment
Hydrology/geology Receptor survey for waterway and wetland characteristics to determine storm water management and
runoff control
Risk assessment/toxicology Local/regional herbivores and migratory animals to determine potential attractive nuisance issues
Field and health, safety and
environmental management
Local community demographics to determine potential interaction and security issues

ITRC — Phytotechnology Technical and Regulatory Guidance and Decision Trees, Revised February 2009
38
2.2.2.1 Site Description and History
A site description should include detailed maps of the location, including property boundaries,
surrounding features, residential or public areas, water bodies, roadways or other accessways, and
descriptive or historical names for all relevant features. Furthermore, a site description should
include maps illustrating the scale of the infrastructure, surface features, structures, buried
services, easements, and other obstacles that will need to be removed and/or accounted for in the
phytotechnology design. These include buildings, structures, foundations, concrete pads, paved
surfaces, tanks, pipes, drains, underground utility lines, monitoring/compliance wells, overhead
power lines, and natural barriers. The current and suspected use of the various features should be
included in a discussion by the project team such as active traffic areas, line-of-sight issues, and
the effects of vegetation throughout the life cycle of the plants. Other useful information includes
historical uses of the site, surrounding industrial or commercial sites, previous site investigations,
previous remediation efforts, and records from the responsible regulatory agencies.
2.2.2.2 Contaminant Assessment
The location, extent, and concentrations of the COCs must be accurately determined and should
include characterizing soil, sediment, surface water, groundwater, and air emissions from the site.
Site owners and their consultants should work with the responsible regulatory agency to
determine the methods and distribution of sampling to characterize the COCs. Information about
the contaminant distribution in specific media is needed to properly design a phytotechnology
system. Phytotechnologies may not remove all contaminants and may not work if the
contaminant concentration is too high. Therefore, hot spots of contaminated soil may have to be
removed prior to application of phytotechnologies. Likewise, the source of a groundwater plume
may have to be remediated using another treatment system prior to addressing the residual and/or
dissolved plume with phytotechnologies. Furthermore, the distribution of a plume dictates the
location of plantings used to control hydraulics or remediate the impacted subsurface. Similarly,
the location and flow of surface runoff drive the location of the plantings.
Phytotechnologies also offer some information on identifying contaminated zones. In some cases,
the existing vegetation, patterns of growth, and overall health of the plants often provide an
initial indication where contamination might exist. Furthermore, simple plant tissue sampling
methods can be used to help refine those locations prior to conducting exploratory drillings and
other more conventional investigative techniques. Specifically, certain plant species have evolved
to grow on certain soils containing specific metals (McIntyre 2003). Similarly, leaf tissue
sampling, transpiration gas sampling, or trunk core sampling can be employed to detect soluble
contaminants in the transpiration stream such as TCE or MTBE (Schumacher, Struckhoff, and
Burken 2004; Newman et al. 1999a; Arnold, Parfitt, and Kaltreider 2007).
The benefits of using the phytotechnology-based techniques are the relative lower costs, labor
requirements, and safer operations compared to the more intensive and invasive conventional
techniques. For example, drilling an exploratory boring to collect a sample for analysis may
require more than an hour, while coring the trunk of a tree to collect a sample may take only 10

ITRC — Phytotechnology Technical and Regulatory Guidance and Decision Trees, Revised February 2009
39
minutes. Furthermore, the sampling of plants simply provides a direction and refinement to
future exploratory borings making the latter more efficient.
2.2.2.3 Hydrogeological Conditions
Control and/or treatment of groundwater using phytotechnologies is limited to the extent of the
root zone. Root penetration is dictated by the nutrient content, moisture, and relative ease of or
resistance to grow into the matrix. Tight formations (e.g., clayey, bedrock strata, or aquitards
with smaller porosity and lower water transmissivity) are often more resistant to root penetration
than permeable formations (e.g., sandy, silty, gravel strata or aquifers with higher porosity and
water transmissivity). Regardless of the ability of roots to penetrate the subsurface, plants will
grow root systems extensive enough only to supply the necessary nutrients and moisture to
sustain itself. If this is achieved prior to accessing the target groundwater, then the performance
of the system may be limited. If contaminated groundwater is deeper than the root zone, then the
groundwater could be pumped to the surface and induced towards the root zone of the plant.
Plant roots generally follow the path of least resistance with the most optimal nutrient and water
conditions for growth, including water available at the surface from infiltrating precipitation.
Therefore, to target specific water-bearing zones or preferential flow paths, either clean for
hydraulic control or impacted for remediation and control, special culturing and installation
methods are usually employed (see Section 2.4.3). Similarly, methods are available to bring plant
roots into contact with a targeted impacted groundwater located below clean water–bearing zones
or perched groundwater.
Although some plant species can tolerate some fluctuations in the water table, others species are
less tolerant. Therefore, in addition to static groundwater conditions, adequate characterization is
needed of dynamic changes both vertically and laterally from seasonal and tidal fluctuations,
infiltration and recharge, and production wells (particularly backup wells that are used
periodically). While the most desirable condition to model and predict the performance of a
phytotechnology system is a stable water supply, these dynamic changes can be mitigated using
supplemental and, often targeted, irrigation. These irrigation systems can be specifically
engineered from the onset (see Section 2.4.2.1) but may not be required throughout the life of the
phytotechnology system as the plants mature.
In addition to the depth and location of the groundwater relative to the root zone, the
geochemistry should be evaluated for the potential to affect the function and performance of the
phytotechnology system. Groundwater salinity and pH can limit plant selection or require
modifications to properly implement a phytotechnology system. Redox potential and soil gases
(oxygen, carbon dioxide, methane, etc.) can also indicate the likelihood to rhizodegrade
groundwater contaminants. Similarly, the inorganic composition of the groundwater may contain
elements that do not pose an environmental risk (not a COC, but naturally occurring), but may
limit plant growth. To address these potentials, greenhouse or laboratory feasibility studies are
often recommended using site-specific materials (see Section 2.3.3.1).

ITRC — Phytotechnology Technical and Regulatory Guidance and Decision Trees, Revised February 2009
40
2.2.2.4 Exposure Assessment
Because phytotechnology systems use plants at a contaminated site, the potential ecological
exposures posed by the species planted need to be considered. The level of detail required is site
specific and varies with the application. Factors that should be incorporated into the risk
assessment may include species-specific considerations of bioavailability (see USEPA 2008),
ecological exposures, and the transformation of the chemical composition or physical state.
Bioavailability is the proportion of a chemical present in a form accessible to organisms. For
example, organic mercury is highly bioavailable and is a significant environmental concern.
Conversely, reduction of mercury to the ionic or elemental forms will render the metal less
bioavailable and, therefore, less harmful. Similarly, barium is absorbed more by animals as
barium chloride than as barium sulfate (the later form more prevalent in soils). There is generally
limited information to assess the bioavailability of many contaminants. However, there is
ongoing work, including through ITRC, to quantify bioavailability as affected by pH, soil
moisture, organic matter content, and the presence (or absence) of other compounds in the soil. In
addition, the stability of the bioavailable form can vary depending on the site conditions. Some
chemicals can change form readily, while other chemical forms are stable/recalcitrant.
Bioavailability is controversial in both regulation and remediation. Site owners and system
designers must address bioavailability on a site-specific basis since it depends on the contaminant
composition, type of phytotechnology application, and site conditions. The effort could include
educating concerned parties regarding bioavailability and issues specific to the site. The routine
assumption of 100% bioavailability of contaminants to plants often overestimates the impacts of the
contaminant. Actually, the solubility of the contaminant or by-product plays a major role. Research
has shown that many organic contaminants do not accumulate in plant tissue since they are
minimally water soluble. However, some organics can be taken up, particularly those that are
phytovolatilized. For inorganics, increasing the bioavailability to plants using amendments or soil
conditioning may be the designed approach. This increases the uptake into plants (i.e.,
phytoextraction), which can subsequently be harvested for recovery or disposal. However, adding
chelating agents, surfactants, or pH adjustments, for example, to solubilize a contaminant could
result in contamination of underlying soils and groundwater.
Furthermore, the phytotechnology mechanism being used (rhizodegradation, phytoextraction,
phytovolatilization, etc.) affects the risk assessment. For example, a risk assessment for
phytosequestration or rhizodegradation should address the roots and soilborne receptors (i.e.,
insects, worms, burrowing animals, etc.) that may ingest or contact them. If a contaminant enters
into the terrestrial portion of the plant (leaves, stems, branches, etc.) during phytoextraction,
phytodegradation, or phytovolatilization, then pathways through those plant structures will need
to be assessed as well. However, the ecological exposure may not be directly from the
consumption of the plant. Specifically, the U.S. Environmental Protection Agency (EPA)
estimated that 2%–10% of the total mass ingested by animals might be soil (USEPA 1993). This
percentage corresponds to 1–40 g/kg body weight per day. Therefore, enhancing the
bioavailability of chemicals can potentially impact wildlife that resides at or nearby even if the
animals do not consume the vegetation.

ITRC — Phytotechnology Technical and Regulatory Guidance and Decision Trees, Revised February 2009
41
Contaminants may also be moved from soil and groundwater to air through plant transpiration.
Plants have been noted to transpire volatile contaminants such as PCE, TCE, and MTBE
(Compton et al. 1998; Newman et al. 1997b; Arnold, Parfitt, and Kaltreider 2007). This
occurrence may raise health concerns even though most of these organics rapidly phytodegrade
or the vapor concentrations from transpired gases are extremely low. Other contaminants may be
volatilized, given the proper plants and conditions. For example, some plants can take up highly
toxic methyl mercury and transform it to the less toxic elemental mercury and volatilize it to the
atmosphere (Meagher and Rugh 1996). This application of phytovolatilization may be viewed as
transferring a contaminant from the subsurface to the air, even though the toxicity of the
chemical has been reduced. Data must be provided demonstrating that the transfer of
contaminants to the air poses a lesser risk for exposure than other remedial options. In some
cases, it may be acceptable to allow a phase transfer to occur provided that this mechanism
results in a higher level of protection to human health and the environment. Each of these
mechanisms provides different potential routes of exposures either through the plant, in the soil,
or as gaseous emissions. The length of time to complete remediation also affects the outcome of
the risk assessment. Situations with immediate or acute risks are not suitable for
phytotechnologies. Finally, risk mitigation measures such as security fencing or other
institutional controls should be evaluated and incorporated into the risk assessment.
EPA guidance for the preparation of ecological risk assessments (USEPA 1999b) should be used
to evaluate any potential exposure pathways created or enhanced by using phytotechnologies.
The bioconcentration factors used in this document are based on limited studies so may not be
completely representative to the phytotechnology application being proposed. However, the data
generated in the phytotechnology project may contribute to expanding that base of information.
The EPA approach to ecological risk can be very useful when developing phytotechnology
proposals. Estimating the levels in the plants prior to beginning the project could assist in
determining the time scale needed to complete the project and the potential changes in the levels
of contaminants in plants during the course of the project. Estimating the exposure to wildlife
that could be incurred by ingesting the plants can reassure regulators and the public that the
project itself will not represent a conduit to further environmental exposures (see USEPA 2007a).
These calculations can also be used to target which species may be exposed to potential risk so
that institutional controls for the site can be targeted toward those species. For example,
calculations may show a possible risk to grazing mammals but not to insectivorous or
carnivorous birds; therefore, fencing alone may be adequate protection for such a site. Ecological
risk calculations for some sites may show no risk to wildlife that trespasses onto the site;
therefore, this information could be used to reduce costs for the project by demonstrating that
institutional controls are unnecessary (see EPA 2007a).
2.2.3 Information Specifically Collected for Phytotechnologies
In site visits to conduct a general assessment, additional information specific to evaluating the
applicability of phytotechnologies should also be collected. The general categories of information
are provided in Table 2-4 along with which member of the phytotechnology project team would

ITRC — Phytotechnology Technical and Regulatory Guidance and Decision Trees, Revised February 2009
42
use the information and why the information is relevant. This list is not exhaustive, but focuses
on the relevancy to phytotechnologies only.

ITRC — Phytotechnology Technical and Regulatory Guidance and Decision Trees, Revised February 2009
43
Table 2-4. Assessment information specific for phytotechnologies
Information
category Team member Relevance
Soil conditions Soil sciences/agronomy Soil structure, compaction, and fertility to determine ability to support plants and
develop fertilization and soil amendment plans
Presence of fill material to determine implementability with field equipment
Hydrology/geology Soil structure to determine erosion and infiltration potentials
Plant biology/botany Nutrient content (see Table 1-1), pH, salinity/conductivity, moisture capacity and
retention, and organic matter content to determine sustainable growth
Compaction to determine rooting penetration and patterns
Wetland indicators (i.e., hydric soil type) for plant selection
Environmental sciences Soil characteristics to replicate conditions for plant screening and testing
Environmental engineering Presence of fill material to determine implementability
Climate
conditions
Hydrology/geology Precipitation patterns, relative humidity, and pan evaporation rates for water
management
Plant biology/botany Temperature ranges, frost dates, precipitation patterns and forms for plant selection
Environmental sciences Climate characteristics to replicate conditions for plant screening and testing
Environmental engineering Adverse weather conditions (i.e., 25-, 50-, 100-year flood, drought, storm events, etc.)
to design and develop contingency plans and systems
Field and health, safety and
environmental management
Climate characteristics and planting season to schedule implementation
Existing
vegetation
Plant biology/botany Scientific and common names for plant selection, herbicide management, and
controlling invasive or noxious species
Wetland indicator status for plant selection
Risk assessment/toxicology Habitat form (prairie, arboreal, deciduous/evergreen forest, etc.), relative abundance,
and locations to determine potential ecological receptors
Regulatory interpretation Scientific and common names to determine protected or species of interest
Field and health, safety and
environmental management
Type of vegetation (herbaceous, shrub, woody, vine, etc.), abundance, and locations to
determine clearing and grubbing

ITRC — Phytotechnology Technical and Regulatory Guidance and Decision Trees, Revised February 2009
44
2.2.3.1 Soil Conditions
The immediate condition of the surface soils may have a large impact on the entire
phytotechnology system, particularly soil systems but also deeper, groundwater systems to some
extent. Typically contaminated industrial sites are built on fill material and/or soil with low to
nonexistent fertility, which needs to be considered during implementation. Furthermore, the soils
are usually highly compacted, representing limitations to root penetration. In these cases,
significant effort are required to condition (e.g., till, disk, plow, etc.) and amend the soils (e.g.,
add fertilizer, organic matter, fertile soil, etc.) to sustain plant growth. The level of effort and
materials involved affect the time and cost of the overall project.
Special considerations often found at contaminated sites include high salinity measured as
chloride content, electrical conductivity (EC), and/or total dissolved solids (TDS) in the soil pore
water, acidic or alkaline soil pH, poor structure, elevated sodium content measured as sodium
adsorption ratio (SAR), adverse cation exchange capacity (CEC), and the presence of residual
herbicides from historic use. Many of these conditions may not favor the use of
phytotechnologies due to the limitations on plant selection and the ability to cultivate and grow
the vegetation. Again, many of these conditions can be evaluated using greenhouse or laboratory
feasibility experiments (see Section 2.3.3.1).
If soil covers for phytoremediation are being considered, additional characterization of the
microbial community may be needed. This information is generally not conducted during
standard site assessments. These can include measurements of most probable numbers, specific
degrader counts, and/or more sophisticated characterization techniques. Additional information
on specific techniques is discussed in other documents, including ITRC 1998, 1999, 2007a, and
2008.
2.2.3.2 Climatic Conditions
All information related to climate conditions, including temperature, humidity, precipitation (rain
and snow), wind (speed and prevailing direction), altitude, and the probabilities of flood or
drought (25-, 50-, 100-year events, etc.) should be obtained from local weather stations (nearby
cities, airports, major operating facilities). These site characteristics affect the design (planting
density, modeling evapotranspiration, etc.), plant selection (tolerances to extreme temperatures,
flood/drought, altitude, etc.), and maintenance (irrigation, mowing, debris, etc.) of the system.
In general, average seasonal lengths are dictated by the first and last frost dates for the region
(check with the local agricultural extension service). The early spring is generally planting season
and the most desirable period to establish a phytotechnology system. Therefore, planning to
implement a system is often scheduled based on growing season in addition to other timing
considerations such as regulatory process, permitting, gaining approvals, etc. In addition, changes
in climate based on seasons also affect the performance of phytotechnologies. For example,
during winter months, plants generally slow metabolic processes or go dormant altogether.
Depending on the phytotechnology mechanism being used in the remedy, some or all of the
performance may be seasonal as well.

ITRC — Phytotechnology Technical and Regulatory Guidance and Decision Trees, Revised February 2009
45
2.2.3.3 Existing Vegetation
Conducting an initial plant species survey should include an identification of the major plant
species (scientific and common names), their relative abundance, general locations at the site,
and whether the roots are in contact with the contaminated media. In many cases, these species
represent the starting point for determining potential applicable species for the phytotechnology
application (see Section 2.3.1). Additional relevant information to note in the species survey
includes habitat form, type of vegetation, and wetland indicator status. All of these may
contribute to developing the type of phytotechnology application by matching the plant
information to the location and extent of the contamination. Furthermore, habitat form considers
potential ecological receptors that might be attracted to the area and is supplemented by
determining the wetland indicator status. These include obligate wetland (OBL), facultative
wetland (FACW), facultative (FAC), facultative upland (FACU), and upland (UPL) categories
(for further definitions, see ITRC 2003b). The indicator status also aides in identifying species to
be further screened or considered in the phytotechnology application. The type of vegetation
(herbaceous, woody, vines, etc.) can also help develop the design, implementation, and O&M
plans (see Sections 2.4 and 2.5).
2.3 Remedy Selection
Phytotechnologies should simply be added to the broader list of options project teams need to
consider to address the risks associated with a contaminated site. In general, remedies are often
selected based on the media that is impacted, the COCs, and the behavior of the contaminants in
the impacted media. To aid in the decision process, a decision tree for identifying potential
phytotechnology applications based on these general criteria is provided in this section.
Furthermore, decision trees for groundwater, soil/sediments, and riparian zones are also provided
should these applications be identified as potential remedies. At sites where multiple media are
impacted, additional decision trees contained in this document as well as other ITRC or similar
decision documents should be consulted. Other impacted media or contaminated situations such
as surface water and landfills are covered in other references, including ITRC 2003b and 2003c.
Using these decision trees, in conjunction with the remainder of the document, will assist
regulators, site owners, technology vendors, and the public in determining whether
phytotechnologies are applicable to a contaminated site. However, these decision trees are
primarily for making technical decisions; the ultimate remedy selected for the site will also
depend on other factors, including remedial objectives; cleanup targets; expected outcomes;
stakeholder, site owner, regulator, and community acceptance; economics; and other applicable
or relevant and appropriate requirement (ARARs). Furthermore, adding a phytotechnology to a
site with an existing system can also be considered as either a supplement or eventual
replacement. In these cases, the effects of both systems need to be considered in combination
with each other and over time as the phytotechnology system matures at the site.
2.3.1 Plant Species Screening Process
Prior to running through the decision trees, a basic question that needs to be answered is simply
whether any species exist that can survive the contaminated site conditions. To answer this basic

ITRC — Phytotechnology Technical and Regulatory Guidance and Decision Trees, Revised February 2009
46
question, a plant screening exercise needs to be conducted. Figure 2-1 shows the process for
screening plant species. The output of this screening process is simply a list of candidate species,
if any, that may be applicable; it does not lead to a final list for the site. Generating a final list is
done once a phytotechnology remedy is selected for the site and when the design is being
conducted (see Section 2.4). If the output of the screening process does not generate any
candidate species, then phytotechnologies is not appropriate for the site and another remedy
should be sought.
Figure 2-1. Plant species screening process.
The plant screening process assumes that the existing species at the site have been characterized
and begins by examining:
1. species found in phytotechnology databases and currently growing at the site
2. species found in phytotechnology databases and suitable to the region but not currently
growing on the site
3. hybrid or species related to a species identified as a candidate in either #1 or #2
4. species NOT found in the databases (or test conditions that are too dissimilar) but currently
growing at the site or in the region

ITRC — Phytotechnology Technical and Regulatory Guidance and Decision Trees, Revised February 2009
47
5. genetically modified organism (GMO) species designed specifically to conduct the desired
phytotechnology
These categories are discussed in detail below. The suitability of a species, which is considered
in the first three categories, is determined based on the ability of a species to grow and survive
the site conditions (soil, contamination, climate, U.S. Department of Agriculture [USDA]
hardiness zone, altitude, etc.). Furthermore, the ecological soundness should also be considered
to prevent introducing nonnative and/or aggressive species that may disrupt the local ecology.
Finally, general operability factors such as growth rate, habit (perennial, annual, biennial,
deciduous, evergreen), form (grass, herbaceous, shrub, tree, etc.), ability to reach desired depths,
water usage, disease/pest resistances, and tolerances can be considered at this stage as well. This
information can be gathered from local, state, or federal agencies and offices or from universities.
Several Internet resources are also available that provide this type of information, including the
Plant Materials Program of the USDA Natural Resources Conservation Service (http://Plant-
Materials.nrcs.usda.gov) and the USDA PLANTS national database (http://plants.usda.gov).
Furthermore, these categories and the entire screening process rely on access to and knowledge
contained within existing phytotechnology databases. Although the number of species that have
actually been evaluated for phytotechnologies is very small, several extensive phytotechnology
databases have been published (Tsao 1998; Frick, Farrell, and Germida 1999, 2000
[www.phytopet.usask.ca/mainpg.php]; McIntyre 2001). A periodically updated database of plant
species according to contaminant can be accessed on the ITRC website at
http://www.itrcweb.org/Team/Public?teamID=40. These databases include species to address
metals, radionuclides, petroleum hydrocarbons, halogenated compounds, explosives, surfactants,
and pesticides and generally include information on climate conditions, contaminant composition
and concentrations, type of application, scale of the test, performance, etc. Some recent
contaminants studied include MTBE, tertiary butyl alcohol (TBA), arsenic, cyanide, perchlorate,
tritium, PCBs, and explosives (TNT, RDX, HMX). Other contaminants and species may be found
in more recent phytotechnology research (as of this publication), extrapolated from unrelated
research, or other site-specific knowledge. International Journal of Phytoremediation is a dedicated
journal on phytotechnologies. EPA hosts a web page exclusive to phytotechnologies: www.clu-
in.org/techfocus/default.focus/sec/Phytoremediation/cat/Overview.
Database information on evapotranspiration rates is less common; although data on the
transpiration portion (separating it from interception and evaporation) of common
phytotechnology species are being continually generated by phytotechnology projects. Even less
common are the interception and evaporation rates that various plant canopies create. Some
evapotranspiration estimates are reported in this document (see Table 1-2 and Figures 1-4a to
1-4c). However, when reviewing the literature, the basis for the reported values should be noted
since shorter-duration measurements are highly dependent on the conditions of the study.
Transpiration estimates can be reported as annualized rates (total gallons pumped in a season
divided by 365 days), seasonal rates (total volume pumped in a season divided by the length of
the season), or as a single event occurring within a single day. Typically, values for trees are
reported in units of volume per day per tree (i.e., gallons per day [gpd] per tree). Furthermore,
reported values should note the age, growth stage, or growth characteristic (such as basal trunk
ITRC — Phytotechnology Technical and Regulatory Guidance and Decision Trees, Revised February 2009
48
area) of the tree as reference to the maturity. Similarly, groundcover plants (grasses, herbaceous
species, crops, etc.) are typically reported in volume per unit area per unit time (i.e., gal/acre-day,
or gpd/acre), or if converted, in length per time (i.e., feet/day). Again, the duration, study
conditions, and plant age should be noted. Rain interception capacities for both tree and
groundcover systems are often reported as a percentage of the total precipitation event captured
by the canopy. Therefore, these values are highly dependent on the duration and magnitude of the
precipitation event.
If a species appears in a phytotechnology database or other reference, the conditions described in
the source reference should be compared to those of the site. If these are sufficiently similar to
the site conditions, then these species may be considered candidate species. If the conditions are
significantly dissimilar, then the efficacy of those plants may need to be confirmed through
additional screening studies (see Section 2.3.1.4). These results could also be added to the
growing database of phytotechnology species.
2.3.1.1 Database Species Currently at the Site
Species that are found in the phytotechnology databases or literature should be compared to the
list of species found at the site during the site assessment phase. If the species appears in both
lists, then species selection becomes relatively simple. Since the species is already growing at the
site, and in some cases, in the contaminated media, it already exhibits tolerance to the site
conditions (climatic and contamination). Since there is also confirmation in the literature that the
species is able to address the specific contaminants at the site, it becomes one of the most likely
candidates for future consideration.
2.3.1.2 Database Species Suitable to the Region
In some cases, species that are growing in the region may, for some reason or another, not be
growing at the site. These can include native, crop, forage, and other types of plants that grow
under the regional conditions. A list of these plants can be obtained from a local agricultural
extension agent. Since these species also appear in the phytotechnology databases or other
references, their inclusion for future evaluation is highly recommended. These species already
exhibit tolerance to the climate conditions necessary for a successful phytotechnology
application. In most applications, plants that are adapted to local conditions have more chance of
success than nonadapted plants. While the species may simply be naturally selected based on the
current contaminated conditions, other reasons may exist unrelated to the contamination
altogether. These could include adverse soil conditions, inappropriate hydrology, selective
predation, or exclusion by more aggressive plant species. Given the proper management and
cultivation during implementation and operation of the phytotechnology system, these species
may proliferate at the site and conduct the desired remediation once these conditions are
alleviated. However, it may be recommended to conduct screening experiments (see Section
2.3.1.4) to determine whether a species in this category is truly a candidate.
Species identified as native (not just existing) in the region deserve special consideration.
Specifically, an Executive Order signed on April 12, 1994, requires all federal agencies to use
regionally native species whenever federal funds are expended for landscaping. It promotes

ITRC — Phytotechnology Technical and Regulatory Guidance and Decision Trees, Revised February 2009
49
recycling of green wastes and reducing fertilizers and pesticides and directs agencies to create
outdoor demonstration projects using native plants. Secondly, native, nonagricultural plants are
desirable for ecosystem restoration in critical habitat areas such as wetlands, riparian corridors,
and other disturbed lands. Furthermore, the cleanup of Superfund (CERCLA) sites provides
opportunities to use native plants during restoration or in phytotechnology applications. As part
of the Superfund Redevelopment Initiative, more than 100 Superfund sites (totaling more than
13,000 acres) have been recycled and are now in beneficial ecological or recreational use. Native
species are highly recommended for consideration on phytotechnology projects.
2.3.1.3 Hybrid or Related Species
Hybrids are plant species that have been developed either naturally or artificially by combining
tissues together from related varieties of a particular genus or species. These are also referred to
as “crossed” species. Hybrids should not be mistaken for genetically modified or engineered
species (see Section 2.3.1.5). Hybridization (particularly cross-pollination) occurs in nature itself.
Artificially induced methods of hybridization include grafting tissues and cross-pollination from
one variety to another.
Plant hybrids, including many of the forage, crops, and horticulture species, have been used for
decades in landscaping, agriculture, horticulture, and forestry. One advantage is that the seed and
planting stock of this group is readily available and typically less expensive than native species.
Furthermore, through years of selection, growers have found varieties that contain natural
resistances to diseases, various climate conditions, pests, and other potential growth deterrents.
Similarly, fast-growing varieties can be selected and subsequently combined with other desirable
characteristics. Because of these advantages, hybrids such as from poplars and willows have been
extensively and successfully used in phytotechnologies.
However, because of these resistant and/or fast-growing characteristics, care should be taken to
avoid introducing plant species that are noxious, invasive, or considered a nuisance. Designating
species into these classifications varies among states. A second Executive Order specifically
addressing invasive species was signed on February 3, 1999. It requires federal agencies to
prevent the introduction of invasive species and to detect and respond rapidly to control
established populations of invasive nonnative species. In cases where the spread of the plant is
undesirable, sterile varieties, if available, should be chosen to prevent reproduction.
2.3.1.4 Species Screened in Experiments
Screening experiments are generally carried out in a greenhouse or laboratory setting, designed to
mimic the site conditions as much as possible. This usually entails small-scale, replicated
plantings using soils and/or water from the site grown under climate conditions typical for the
region. In some cases, particularly for larger or older test stock, the screening experiments may
be conducted at the site under field conditions (outdoors, natural climate conditions). However,
the effects of other uncontrolled adverse conditions may result in confounding results. In general,
screening experiments are needed to evaluate species already growing at the site but currently not
appearing in the phytotechnology databases, species that do appear in the databases but under test
conditions too dissimilar to the site conditions, or when other mitigating site conditions are

ITRC — Phytotechnology Technical and Regulatory Guidance and Decision Trees, Revised February 2009
50
preventing the growth of species that under normal circumstances would be present (i.e.,
regionally present, but not at the site).
The objective of these screening experiments is simply to evaluate and demonstrate survivability,
although combining these experiments with other, more quantitative objectives such as feasibility
(see Section 2.3.3.1) or even treatability studies (see Section 2.3.3.3) can be done. The criteria for
survivability should be clearly identified prior to conducting the experiments. Survivability is a
qualitative result and generally encompasses a broad range of outcomes in a plant. High
concentrations of contaminants may completely inhibit plant growth and eliminate
phytotechnologies as remedial options for site cleanup. On one extreme, a plant can be severely
stunted in growth, visually stressed (yellowing leaves, curling leaves, wilting stems/branches,
etc.), and necrotic (tissue necrosis, cellular death) and still be considered to be surviving. In fact,
the highly stressed condition may make the species more conducive to achieve the remedial
cleanup objectives because the plant may initiate its secondary metabolic processes that provide
protection and detoxification to the plant. It is this protection and detoxification that may also
remediate environmental contaminants.
In most cases, plants grown under optimal control conditions should also be considered to
compare the results. In some instances, plants have been shown to have enhanced growth
compared to these controls (ARRIBPP 2004). Furthermore, plants may respond differently at
different stages of their growth. Patterns include immediate or delayed stressed growth symptoms
followed by recovery or normal growth followed by stress symptoms appearing later, possibly
resulting in death (Tsao and Tsao 2003). To address these variable outcomes, the length of the
plant screening experiment should be discussed and may need to be based on the annual life
cycle of the species being tested.
2.3.1.5 Genetically Modified Organism Species
GMOs are species manipulated at the cellular level by transferring DNA, typically from a
completely unrelated species into another. For example, GMO plants, also known as GM,
genetically engineered, or transgenic plants, may have genes from a reptile, mammal, or insect
inserted into the DNA of plant cells and then expressed within the host plant. These should not
be confused with hybrids, which are manipulated at the genus or species level only (see Section
2.3.1.3).
This technology has been used to successfully incorporate disease resistance into crop species.
Experiments to use genes to create plants that manufacture their own insecticide have been
developed. The genes, which produce enzymes that break down, detoxify, or sequester
contaminants, are incorporated into plants used for phytotechnologies. There has been ongoing
research to determine the feasibility of inserting genes for the production of cytochrome P450s into
the hybrid poplars and tobacco plants used in phytotechnologies to enhance the breakdown of
chlorinated compounds such as TCE and ethylene dibromide (Gordon, Strand, and Newman 1998).
Other researchers are investigating the plants that may already contain genes that code for peptides,
such as phytochelatins, which naturally bind and detoxify metals, so that these properties can be
enhanced in the plants to increase their ability to remediate contamination. Similarly, the expression
of genes which enhance the phytodegradation of energetic compounds such as TNT, RDX, and

ITRC — Phytotechnology Technical and Regulatory Guidance and Decision Trees, Revised February 2009
51
HMX is being researched, with the goal of enhancing this genetic expression in plants which are
suitable to active military ranges (Rylott et al. 2006). It should be noted that in cases where
transgenic plants have been developed to remove/degrade pollutants, their capabilities increase
about tenfold over those found in naturally occurring plants (Doty et al 2007).
However, the current regulatory status of GMO plants is somewhat unclear. A number of aspects
of the use of these plants could be regulated under various existing USDA plant regulations such
as the Federal Plant Pest Act (7 United States Code [U.S.C.] 150 et seq.), the Plant Quarantine
Act (7 U.S.C. 2801 et seq.), and the Federal Noxious Weed Act (7 U.S.C. 2801 et seq.). While
EPA does not currently regulate plants used for commercial bioremediation, it may have the
authority to do so under the Toxic Substances Control Act (TSCA). This authority could be
invoked to regulate these plants if EPA believed such regulation necessary to prevent
unreasonable risk to human health and the environment. EPA does currently regulate
microorganisms under TSCA Section 5. The Animal and Plant Health Inspections Service
oversees the development and introduction through importation, interstate movement, and
environmental release of genetically engineered organisms. This arm of the USDA, responsible
for regulating transgenic plants, reviews about 1000 applications each year from biotechnology
companies wishing to field test new transgenic plants or petitioning to have a plant deregulated
altogether (Lazaroff 2002). These statutes are the Federal Insecticide, Fungicide, and Rodenticide
Act and the Federal Food, Drug, and Cosmetic Act (Rock and Sayre, 1999). A field trial in
Oregon halted the use of genetically engineered creeping bentgrass (USDA 2007).
In Europe, the coexistence of GMO plants with conventional and organic crops has raised many
concerns. One concern is the public perception that they may interbreed with wild plants to create
undesirable variants or that the altered plants themselves may be harmful. Since there is separate
legislation for GMO crops and a high demand from consumers for the freedom of choice
between GMO and non-GMO foods, measures are required to separate GMO, conventional, and
organic plants and the food and feed derived from those plants. At the field level, biological
containment methods, isolation distances, and pollen barriers can be employed.
In a survey conducted in Great Britain, transgenic plants were more readily accepted for
controlling contamination compared to food production (Gaskell 2000). Further surveys might
prove worthwhile to generate, address, and educate the public on concerns and truths associated
with GMO species used to benefit of society outside of food production. Regardless, regulators
should confirm whether extensive testing prior to use has been conducted in the context of
ecological compatibility in compliance with all applicable state, federal, and local regulations.
Therefore, it is recommended that GMO plants should be considered in phytotechnologies only
after all reasonable public and stakeholder concerns have been addressed.
2.3.2 Phytotechnology Decision Trees
The majority of the information necessary to run through the groundwater and soil/sediment
decision trees should have been collected during the assessment phase of the project (see Section
2.2). Therefore, proposals to apply a phytotechnology at a site should include all information
necessary to demonstrate a successful outcome when run through the decision trees. The initial
decision tree attempts to generate phytotechnology options based on the candidate plant species

ITRC — Phytotechnology Technical and Regulatory Guidance and Decision Trees, Revised February 2009
52
(as determined in Section 2.3.1), COC(s), impacted media, and the chemical behavior in the soil-
plant-atmosphere continuum. Two additional decisions are also provided that are specific to
groundwater and soil/sediment applications, should these be identified as potential remedies
through the initial decision tree. Furthermore, the user is reminded that some applications can be
used to address multiple media and multiple contaminants.
Each of these decision trees is meant as a general screening of phytotechnologies to arrive at simple
“Yes” (solid lines) or “No” (dotted lines) type of evaluation. In some cases, the answer to a specific
question may be “Maybe” or “I Don’t Know.” In those situations, the user is advised to consider
those results as “Yes” until additional information can be collected that would provide clearer
answers to those questions. In some cases, bench- or pilot-scale feasibility studies may need to be
conducted to answer these questions (see Section 2.3.3.1). Some results lead to a “Yield” which
provides additional instructions to the user prior to proceeding (dashed lines).
2.3.2.1 Remedy Selection Decision Tree
The following information from the assessment phase (see Section 2.2) is needed to run through
the Remedy Selection Decision Tree (Figure 2-2):
COC(s) and its/their general chemical properties
impacted media and location and extent of impact(s)
exposure assessment results and acceptable risks
Additional knowledge of the behavior of the COC(s) with the candidate plant species identified
through the plant screening process is also needed. This information may be available in the
phytotechnology databases used during the plant species screening process (see Section 3.3.1).
Discussions of specific questions within the decision tree are provided as well.
Will the plant take up the contaminant or by-product? For organic contaminants, the octanol-
water partition coefficient (log Kow) typically needs to be between 1 and 3.5 for uptake by plants
to occur (see Section 1.2.4). For inorganic contaminants, including essential plant nutrients,
uptake is element- and plant species–specific (see Sections 1.1.1 and 1.2.3).
Will the contaminant or by-product accumulate in the plant? This is mainly a concern with
inorganic contaminants since these do not degrade. However, uptake of inorganic constituents is
highly regulated by the plant in the root system, typically limiting the amounts that can
accumulate. On the other hand, after organic contaminants are taken up, they are also susceptible
to the phytodegradation processes (see Section 1.2.4) or even phytovolatilization (see Section
1.2.5) and generally do not accumulate.
Is the level of accumulation acceptable throughout the life of the plant? Some plants live and
die within a season while others grow and continue to mature year after year. The acceptability of
contaminants that accumulate may be dictated by the growth habit of the plant species.
Consideration should be given for the entire life cycle of the phytotechnology project, which may
include all or part of the growing life of the plant species. How to deal with plants that

ITRC — Phytotechnology Technical and Regulatory Guidance and Decision Trees, Revised February 2009
53
accumulate contaminants to unacceptable levels depends on the type of application and the
corresponding growth habit of the species employed in the application. Therefore, this situation
may need to be readdressed after the type of application is determined.

ITRC — Phytotechnology Technical and Regulatory Guidance and Decision Trees, Revised February 2009
54
Figure 2-2. Remedy Selection Decision Tree.

ITRC — Phytotechnology Technical and Regulatory Guidance and Decision Trees, Revised February 2009
55
Will the contaminant or by-product transpire from the plant? If highly volatile organic
contaminants can pass through the rhizosphere (rhizodegradation) and through the plant itself
(phytodegradation), traces may be present in the transpiration gas stream (see Section 1.1.1).
Similarly, certain metals such as mercury may be able to translocate completely through a plant;
however, the total amount transpired is again regulated by the root system. The acceptability of
transpired contaminants depends on the associated risks and regulatory requirements.
2.3.2.2 Groundwater Decision Tree
If the Remedy Selection Decision Tree (Figure 2-2) recommends either a hydraulic barrier and/or
phytoremediation tree stand, the Groundwater Decision Tree (Figure 2-3) should be consulted.
The following information from the assessment phase (see Section 2.2) and plant species
screening process (see Section 2.3.1) is needed to run through this decision tree. Furthermore,
preliminary design and implementation considerations are required to complete the evaluation.
Specific discussions of questions within the decision tree are provided as well.
site description, layout, sources of irrigation, and available planting area
hydrogeology and groundwater geochemistry
concentration of COC(s) and location and extent of impact
climate conditions
growth habit of candidate plant species, tolerances to the COC(s), tolerances to groundwater
geochemical conditions
Is the target groundwater within 15 feet of surface or 15–25 feet bgs? Depending on the
stratigraphy of the subsurface, the target groundwater may not be the uppermost water-bearing
zone. Special installation methods may allow access to groundwater at depths below the
uppermost level (see Section 2.4.3.2). Depths within 15 feet of the surface are generally
accessible by most deep-planted applications. In some cases, plant stock (in the Salicaceae
family) can be directly installed to this depth and produce a viable tree. The maximum practical
depth is generally 25 feet bgs; deeper depths can be reached under certain circumstances.
Can the target depth be easily/rapidly accessed by boring or trenching? Will the boreholes or
trenches collapse upon themselves? Two common methods for installing large plantations of
trees to produce deep root systems are either through boreholes or trenches (see Section 2.4.3.2).
Because many trees typically need to be installed for phytotechnology applications, the sheer
number of boreholes or trenches may impact the decision to continue with a phytotechnology
application. Furthermore, the relative ease of creating the excavations, labor requirements, and
installation time are common criteria for selecting the installation method. If conditions are too
difficult or unsafe due to obstructions, limited access, or inappropriate or difficult geologies, they
may limit whether phytotechnologies are appropriate.
Is time a constraint? Phytotechnologies may take longer than traditional methods to reach final
cleanup levels. Time of treatment must include time to establish the plant community, which can
take months and in some cases more than a year to reach optimal operational conditions. This
period should be thoroughly understood and included in the treatment time frame.

ITRC — Phytotechnology Technical and Regulatory Guidance and Decision Trees, Revised February 2009
56
Figure 2-3. Groundwater Decision Tree.

ITRC — Phytotechnology Technical and Regulatory Guidance and Decision Trees, Revised February 2009
57
Can the target groundwater be pumped and used as irrigation? In many ways, this process is
similar to using a constructed wetland to receive and treat extracted groundwater. However, if
groundwater is pumped to the surface, a permit may be required (see Section 3). Using
groundwater in an irrigation system (see Section 2.4.2.1) on a phytotechnology plantation may
satisfy reinjection exemptions. Subsurface irrigation systems are available and may be acceptable
if the extracted groundwater is plumbed directly into it and never reaches surface. Furthermore,
spray irrigation methods may result in significant volatilization where the potential air emissions
and permit requirements should be considered as well.
Is there sufficient area to plant (use 75 square feet per tree) that can be cleared of obstructions
and support planting equipment? A general rule of thumb for a very preliminary design during
the remedy selection phase of a project is a planting density of 75 square feet per tree, based on
planting trees on an average 10-foot centers using staggered rows. Trees planted at this density
will fill the area with a radius of 5 feet and will essentially create a full canopy with adjacent
trees. To determine whether sufficient trees can be planted, another rule of thumb at this phase of
a project is to use 10 gpd per tree, annualized over the year. This value has been achieved in
many field applications but may take several years to reach depending on many site-specific
conditions. This pumping rate, along with the planting density, can be used (Equation 2-1) to
calculate a total rate of removal for a planted area.
Removal rate (gpd) = area planted (ft2) (2-1)
More detailed designs (see Section 2.4.1.2) should use tree pumping rates that are based on the
annual tree growth rather than a single value. Furthermore, other sources of water such as
rainwater and irrigation need to be considered when determining the total number of trees
needed. At this stage, simply using percentages of the total volume to estimate factors such as the
contribution of rain, irrigation, and runoff is generally sufficient.
Typical planting equipment for installing tree systems includes medium to heavy machinery
(bobcat to drill rig). The ground surface should be able to support the equipment and the area free
of obstructions such that it can be operated safely.
Is supplemental irrigation available? When groundwater conditions (geochemical and/or
contaminant concentrations) are toxic to plants, controlled irrigation systems (see Section
2.4.2.1) can be used to provide dilution water to the plants to reduce the toxicity. Similarly, when
establishing the vegetation, supplemental irrigation may be needed, particularly if the area or
climate just after planting is arid. Furthermore, in many cases, the supplemental irrigation may
not be needed once the trees are established or have reached the desired depths or maturity to
withstand the toxic conditions. Decisions to use supplemental irrigation are usually based on the
economics involved with plumbing in the system, O&M requirements, benefits to survivability,
and potentially reducing replanting.
If unacceptable levels of contaminant or by-product accumulate, can harvesting be conducted
as needed throughout the life of the tree stand? Can controls be put in place to prevent the
10 gpd/tree
75 ft2/tree

ITRC — Phytotechnology Technical and Regulatory Guidance and Decision Trees, Revised February 2009
58
transfer of or exposure to the contaminant or by-
products? For tree systems, the need to harvest plant
materials may depend on the species selected. Leaves may
be harvested from deciduous trees prior to autumn leaf drop
without significant damage or reduction in growth.
Evergreen species may or may not shed needles naturally,
but they too can be collected without significant long-term
effects on the plant. Furthermore, only portions of the plantation or on each tree may be
harvested. Harvesting whole branches is more detrimental to the tree and is generally not
recommended but may be necessary depending on where the contaminant accumulates in the
plant. Harvesting whole trees is also not recommended unless using species able to be coppiced.
These trees, typically in the Salicaceae family, are able to regrow from cut stumps and can be
harvested, typically in a rotation over several years. Harvesting, collecting, and handling woody
material may entail chipping.
If natural leaf or needle drop is a concern in terms of potential exposures or media transfer,
collection protocols may need to be implemented as part of the operation and maintenance (see
Section 2.5.1.3). Alternatively, fencing or netting can be used to capture the plant material and
would be incorporated within the design (see Section 2.4.2.2). Whether these methods are
acceptable depends on many factors, including the economics, safety, regulatory requirements,
and potential exposure of workers conducting the harvesting or collection.
Is the thickness of impacted groundwater greater than 5 feet? Some deep-rooted trees, known
as “phreatophytes,” can take up water from the capillary zone within the water table. Fluctuations
in the water table due to seasonal and diurnal changes can allow access to deeper depths within
the saturated zone. In many cases, trees produce roots through this fluctuating zone to maintain a
constant supply of water. These characteristics are often used when selecting species for
phytotechnologies (see Section 2.4.3). A general rule of thumb, however, is that trees do not
access deeper than 5 feet into the saturated zone. Only under special circumstances or tidally
influenced conditions where fluctuations greater than 5 feet occur on a daily basis are depths
greater than 5 feet accessed. If the contamination resides below these depths, those impacted
zones may not be affected by the vegetation. Depending on the method and design of installation
(see Section 2.4) such as overplanting the area or cased boreholes at specific depths, this situation
may be acceptable as a standalone remedy or as a supplement to an alternative groundwater
capture system.
Will the tree stand use groundwater after accounting for infiltration (minimized through
engineering) and irrigation? The ultimate target for groundwater phytotechnology systems is to
access and take up groundwater. However, water available at the surface from infiltrating
precipitation (other surface water sources) or irrigation may be more readily accessible to the
trees and will reduce the volume of groundwater that is needed. If sufficient surface water is
available, groundwater uptake may not occur, and/or roots may not need to penetrate to the
desired depths. To address this possibility, different designs and methods of installation (see
Section 2.4.2.1) such as grading or use of low-permeability surface materials can be used to
minimize these surface water sources. If these can be reasonably applied at the site, then the
NOTE: The triangular symbol in the decision tree is a reminder that this is a follow-on question from the Remedy Selection Decision Tree (Figure 2-2). If the question is not applicable (N/A), then it should be answered as a “Yes” response.

ITRC — Phytotechnology Technical and Regulatory Guidance and Decision Trees, Revised February 2009
59
phytotechnology application may be acceptable as a standalone remedy. If not, then the
phytotechnology may be acceptable but only as a supplement to an alternative groundwater
capture system. Surface water management also needs to be considered in modeling the effects of
tree installations on groundwater systems.
2.3.2.3 Soil/Sediment Decision Tree
If the Remedy Selection Decision Tree (Figure 2-2) recommends either a phytostabilization cover
or phytoremediation groundcover, then the Soil/Sediment Decision Tree (Figure 2-4) should be
consulted. The following information from the assessment phase (see Section 2.2) and plant
species screening process (see Section 2.3.1) is needed to run through this decision tree:
site description, layout, sources of irrigation, and available planting area
hydrology
soil/sediment agronomic conditions and fertility
COC(s) and location and extent of impact
climate conditions
growth habit of candidate plant species, tolerances to the COC(s), tolerances to soil/sediment
conditions
Preliminary implementation considerations are also required to complete the evaluation. Specific
discussions of questions within the decision tree are provided as well.
Is the entire area able to be cleared of obstructions and support planting equipment? Typical
planting equipment for installing groundcover systems may include heavy machinery (tractor,
tiller, seed spreader, seed driller, etc.). The ground surface should be able to support the
equipment, and the area should be free of obstructions for safe operations.
Can amending the soil or sediment enable the plant to survive? Can amending the soil or
sediment immobilize the contaminant or by-product? Typical soil amendments are generally
similar to what is commonly used in agricultural applications and may include lime, gypsum,
fertilizers, organic matter, etc. (see Section 2.4.2.3). These changes in the soil conditions can
alter the contaminant mobility and the ability of the soil to sustain plant growth. In some cases,
plant survival may have been evaluated during the screening process where the addition of
amendments was considered (see Section 2.3.1.4). Recommendations for soil amendments may
often be obtained from a local agricultural extension service, which can evaluate the soil fertility.
For the effects of amendments on contaminant behavior, feasibility studies may be needed (see
Section 2.3.3.1 and USEPA 2007b).

ITRC — Phytotechnology Technical and Regulatory Guidance and Decision Trees, Revised February 2009
60
Figure 2-4. Soil/Sediment Decision Tree.

ITRC — Phytotechnology Technical and Regulatory Guidance and Decision Trees, Revised February 2009
61
Will the plant penetrate to the target depth? Is the restriction due to excessive soil compaction?
Will this occur in the first growing season? The effective range for plants to influence
contaminants depends on the rooting depth of the plant system. In general, the roots must come
into contact with the contaminated media for the remediation to occur. Conversely, containment
strategies may consider the opposite, where roots should not come into contact with the
contaminated media. A general rule of thumb for the rooting depth of herbaceous species such as
grasses and forbs is 2 feet. However, some species, such as the native prairie species illustrated in
Figure 1.8 and tap-rooted species such as alfalfa, are able to penetrate deeper (Shimp et al. 1993,
Nyer and Gatliff 1996). However, local soil conditions (nutrient content, moisture, compaction,
etc.) dictate the ultimate depth to which any plant will reach. Furthermore, the depth of
penetration may progress as the plants grow year over year. In contaminated soil, the term
“phytoremediation front” has been used (Olsen and Fletcher 1999) to describe the interface
between clean soil at the surface and impacted soil underneath. The bulk of the root mass resides
in the clean soil while exploratory roots are sent into the impacted soil. Over time this front
moves downward.
It is recognized that these questions are difficult to answer conclusively since the ability of roots
to penetrate over time is site-, soil-, and climate-specific under the actual, immediate conditions
experienced by the vegetation. The user is reminded that answers “Maybe” and “I Don’t Know”
should be considered as “Yes” until additional information can be collected, perhaps through a
field feasibility study (see Section 2.3.3.1).
Is time a constraint? Phytotechnologies may take longer than traditional methods to reach final
cleanup levels. Time of treatment must include time to establish the plant community, which can
take months and in some cases more than a year to reach optimal operational conditions. This
period of plant establishment should be thoroughly understood and included in the treatment time
frame.
Is the contaminant soluble? This question is repeated and should result in the same answer as
was given in the Remedy Selection Decision Tree.
If unacceptable levels of contaminant or by-product accumulate, can harvesting be conducted
as needed throughout the life of the tree stand? Can controls be put in place to prevent the
transfer of or exposure to the contaminant or by-products? For groundcover systems,
harvesting plants is generally relatively easy and entails the
use of mowers or threshers (see Section 2.5.1.3). Once cut
down, collection may be conducted using balers or even
manually. Some equipment, such as a harvester, combines
combine the cutting and collection. For woody species such
as shrubs, see the Groundwater Decision Tree discussion
(Section 2.3.2.2). Whether these methods are acceptable
depends on many factors, including the economics, safety, regulatory requirements, and potential
exposure of workers conducting the harvesting or collection.
NOTE: The triangular symbol in the decision tree is a reminder that this is a follow-on question from the Remedy Selection Decision Tree (Figure 2-2). If the question is not applicable (N/A), then it should be answered as a “Yes” response.

ITRC — Phytotechnology Technical and Regulatory Guidance and Decision Trees, Revised February 2009
62
Will a groundcover system control or contain ALL of the precipitation and irrigation? Does
the excess water pose a risk or create additional exposure pathways? Water that cannot be
captured and controlled by ET may pose additional site risks or exposure pathways, particularly
if the soil or sediment contain contaminants that are soluble in water. A reasonable estimate for
the rate of ET from a groundcover system is the local pan evaporation rate. Estimates of this rate
are available from the local agricultural extension service. If other control measures are available
or the site can be enhanced during design and construction (see Section 2.4.2.1), these should be
considered as well in answering these questions.
2.3.2.4 Riparian Zone Decision Tree
If the Remedy Selection Decision Tree (Figure 2-2) recommends a Riparian Buffer, then the
Riparian Zone Decision Tree (Figure 2-5) should be consulted. The following information from
the assessment phase (see Section 2.2) is needed to run through this decision tree:
site description and layout
hydrology and hydrogeology
location and extent of impact
climate conditions
The output of this decision tree directs the user to the Groundwater and/or Soil/Sediment
Decision Tree for further consideration. These may already have been used, depending on the
extent of the impact. Specific discussions of questions within the decision tree are provided as
well.
Figure 2-5. Riparian Zone Decision Tree.

ITRC — Phytotechnology Technical and Regulatory Guidance and Decision Trees, Revised February 2009
63
Can the area be graded and contoured to eliminate runoff and promote infiltration?
Promoting infiltration will enhance the treatment of the contaminants by increasing the contact
time with the riparian plant system. Plants should be selected based on the final hydrologic
conditions created at the site. Surface grading may entail substantial earthmoving activities,
which may or may not be able to be conducted at the site. Constructability is covered in the
Groundwater and Soil/Sediment Decision Trees. Furthermore, soil conditions may dictate the
success of promoting infiltration over runoff and/or the evaporation of ponded water. Hydrologic
modeling may be needed to answer this question (see Section 2.4.1.1).
2.3.3 Regulatory Decision Factors
When selecting a phytotechnology as the remedy for the site, additional regulatory factors must
be considered that are directly linked to the technical factors evaluated in the decision trees.
These are in addition or complementary to all ARARs for the site that must be met or exceeded
for the technology to be considered an alternative. Phytotechnologies do not and will not work on
all contaminants. One of the absolute requirements is to demonstrate to regulators that the
COC(s) can be contained and/or remediated using the phytotechnology. This is often
demonstrated in feasibility studies conducted specifically for the site or extrapolated from
literature results that are sufficiently similar to the site conditions. Furthermore, the proposed
remedy must ensure that the fate and transport of the contaminant(s) and/or by-products are
acceptable through all potential exposure pathways.
Once feasibility is demonstrated, the ability of the phytotechnology system to reasonably and in
high confidence achieve cleanup goals in a satisfactory time frame must also be demonstrated for
regulatory acceptance to be granted. This is often demonstrated in treatability studies, which can
often be planned and conducted in concert with feasibility studies, including using the same
experimental setup (scale, materials, duration, techniques, etc.). The primary difference between
treatability and feasibility is the level of quantitative evaluation included in the study. For
example, a feasibility study examines whether a specific plant species is capable of treating the
contaminant regardless of the time or rate of concentration or mass reduction, whereas a
treatability study compares the effectiveness of the treatment in relation to the remedial
objectives and ARARs set forth for the site. Treatability results are often compared to other
remedial alternatives to ultimately select the technology that can best meet the site remedial
objectives. In many cases, contingency conditions must be established that either trigger a
continuation of the phytotechnology solution or initiate one of these other alternative remedies.
Furthermore, these contingencies can be addressed if there is an existing system in place that the
phytotechnology solution is meant to supplement or eventually supplant at the site.
2.3.3.1 Demonstrating Feasibility
Demonstrating the feasibility of a phytotechnology remedy to address a contaminated site
condition initially depends on whether vegetation can influence the behavior of the COC(s). The
initial clues as to whether the vegetation can influence the contaminant behavior may come from
the initial evaluation conducted to screen plant species (see Section 2.3.1). During this process,
the phytotechnology literature may have produced sufficient information allowing feasibility to
be demonstrated. In general, the five categories of species identified in Figure 2-1 serve as an

ITRC — Phytotechnology Technical and Regulatory Guidance and Decision Trees, Revised February 2009
64
initial ranking system for whether additional laboratory or greenhouse feasibility studies need to
be conducted. Database species found at the site (see Section 2.3.1.1) represent one extreme
where these have sufficient literature information available indicating that further studies may not
be needed. On the other extreme, genetically modified plants (see Section 2.3.1.5) generally
require additional study. The intermediate categories may or may not require further
demonstration with their acceptance based on the amount of supporting evidence that can be
provided to the regulatory authority. Many factors in addition to the proposed species—such as
the COC, contaminated media, size of the site or study, and type of phytotechnology employed—
are factors in determining the type and amount of supporting information needed to be
summarized and provided to the regulator.
If additional feasibility studies are required, the goal should be to demonstrate the ability of the
proposed plant species to alter the contaminant behavior in ways that are aligned to the remedial
objectives of the site. These would be conducted while other alternatives are likewise being
evaluated. Feasibility studies can be conducted in the laboratory, greenhouse, or in the field and
involve hydroponics, potted plants, or test plots established on site. Typically, these tests should
be carried out for at least one growth cycle, including dormancy. These experiments should use
site-specific data previously obtained during the initial characterization, including duplicating
field conditions (climate, sunlight, and soil moisture) as much as possible since these factors
significantly affect the rate of remediation and plant growth. When conducting tests away from
the actual site, it is important to grow the plants in the contaminated media collected from the
site. If the site has several soil types, samples of each type should be collected and assessed. If
there are uncontaminated areas within the site, then soils from these areas should also be
collected for use as experimental controls. Furthermore, unimpacted soils can be artificially
contaminated with a representative, properly weathered or aged sample of the contaminants to
assess the maximum concentrations that can be tolerated by the plants before health and growth
rate are adversely impacted. If the contaminated media is surface water or groundwater, the
candidate species can be planted in the soil from the site and irrigated with this water.
A feasibility study may include evaluating agronomic inputs such as fertilization, carbon
addition, and other soil conditioners to learn whether the site soil conditions can be sufficiently
altered to allow the phytotechnology to be a possible remedy. Another objective of a feasibility
study might be to evaluate the potential fate and transport of the parent or by-products that might
develop in relation to the growth of the plant. These could include evaluating the composition of
the transformation by-products, bioavailability, toxicity, food web accumulations, ecological
exposures, and/or transfer to other media. As long as these factors remain acceptable, the
proposed phytotechnology remedy remains feasible as a remedy for the site.
Most published phytotechnology studies use a randomized block design. However, because the
number of factors examined causes the number of trials to expand exponentially, a series of tests
can be proposed that focus on a few factors first, which are optimized during the subsequent
tests. Each subsequent test should build on the results obtained from the previous set with
refinements made to the subsequent test conditions. Conducting these studies may be seen as
time-intensive, but the valuable information gained may directly affect the success or failure of
the project. The time spent on testing is generally a few months to a year and does not

ITRC — Phytotechnology Technical and Regulatory Guidance and Decision Trees, Revised February 2009
65
significantly impact the overall restoration time frame of the project. Furthermore, these studies
can be performed outside the growing season, and adequate results can be obtained prior to the
next available planting season. Also, this type of sequential experimental design allows for an
efficient use of funds by assessing broader factors first and in a simultaneous manner while
minimizing unnecessary experiments that are not aligned to the remedial objectives for the site.
In general, data need to be generated that support the ability of the vegetation to control the
infiltration of precipitation, flow of surface or groundwater, and/or reduce contaminant
concentration or mass. The techniques to measure these characteristics are similar to those
required to monitor a full-scale system (see Section 2.5.3). Monitoring requirements are also
likely to contain elements specific to phytotechnologies that would not be necessary for
feasibility studies for other alternatives, including plant growth assessments, plant tissue
sampling for COCs, and measurements of transpiration and root penetration.
2.3.3.2 Fate and Transport Studies
Since phytotechnologies are remediation systems that use natural systems, ecosystems that
develop as a result are subject to fate and transport issues. Specifically, fate and transport studies
may be needed that evaluate whether the contaminant becomes more mobile, can transfer to other
media, becomes more bioavailable to the plant and/or animals, or accumulates in specific plant
tissues that represent likely exposure pathways (e.g., edible fruits, seeds, leaves). Furthermore, if
the contaminant is transformed by the vegetation itself or during the phytotechnology application,
the transformation by-products may need to be evaluated as well, particularly if they are more
toxic, soluble, bioavailable, or mobile compounds.
However, a distinction should be made between these types of fate and transport feasibility
studies and ecotoxicity studies, which would include chemically dosing representative receptors
(laboratory animals). For example, increasing bioavailability of a chemical into a plant can also
increase the potential for ecological exposure to animals that may consume that plant. If animals
known to inhabit the site might normally consume the vegetation, a fate and transport feasibility
study might focus on whether the contaminant or transformation by-product accumulates in the
edible portions of the plant such as the fruits, seeds, and leaves, or just in the roots or stems,
where the potential for consumption is reduced. A fate and transport feasibility study would not
examine the toxicity (dose-response conditions, epidemiology, etc.) of the contaminant or by-
products to the animal receptor. These ecotoxicity studies are outside the scope of this document
but may be required when ultimately selecting the remedy for the site.
Many phytotechnology applications use plant transformation mechanisms (rhizodegradation,
phytodegradation, natural chelation/solubilization in phytoextraction, etc.) to conduct
remediation. Unfortunately, conflicting results have been obtained in several studies where
certain contaminants are transformed in the rhizosphere prior to removal from the soil, taken up
and transformed in the plant, or phytovolatilized by the plant as the parent compound. In general,
researchers have not clearly identified complete contaminant transformation pathways that lead
to innocuous compounds that incorporate into organic matter (McCutcheon et al. 1995),
sequester into the soil matrix, get metabolized into plant matter, or no longer represent an
environmental or human health risk. However, an additional level of complexity can be added to
the fate and transport studies to help clarify the mechanisms and daughter products, if deemed
ITRC — Phytotechnology Technical and Regulatory Guidance and Decision Trees, Revised February 2009
66
necessary. Specifically, a more rigorous mass balance can be performed on the system. However,
this will typically need to be conducted in sealed plant chambers where all media (air, water, and
soil) are controlled and subject to radioactively labeled contaminants. In this case, the intensity as
well as the distribution of the radiolabel throughout the plant system is assessed to evaluate the
mass distribution. Gas chromatography/mass spectrometry (GC/MS) analyses of the radiolabeled
tissues can also be conducted to determine the speciation of the contaminant. Furthermore,
calculations can also be made during these studies to predict the amount and type of material
transpired by the plants. However, strong caution is recommended in making absolute decisions
based on the results of these mass balance studies. The test conditions are suboptimal, very
restrictive to plant growth and metabolism, and not representative of how the plants will respond
in a field-scale system. Therefore, when considering phytotechnologies in absence of this
information, it is recommended that equal consideration be given to transformation products as to
the original contaminant.
Furthermore, several other mechanisms may also contribute to changes in the fate and transport,
including many farming practices used during soil preparation and plant cultivation. For
example, soil amendments are designed to alter the general soil chemistry and change the
bioavailability of constituents. Tilling or disking soil can expose, aerate, and volatilize
contaminants or cause wind drift of soilborne contaminants. Similarly, excessive irrigation can
create or enhance off-site runoff and the potential leaching to groundwater. Because of all these
factors, the fate of the parent or by-product will remain an issue until more research is completed.
The overall site risk assessment should include these considerations when evaluating whether the
phytotechnology is feasible for the site. If the risk is greater and it cannot be reasonably
mitigated, the application would not be considered feasible for the particular site.
The feasibility studies that examine these fate and transport outcomes should be thoroughly
designed from the onset. In general, chemical analysis is required not only for the media (soils,
site water, irrigation water, and/or air), but also of the plants or even specific tissues. Standard
analytical methods should be employed for the media, while the plant matter may require
specialized techniques to sample and analyze. These would be similar to those required in a full-
scale system (see Section 2.5.3.3). A common method to assess the fate of organic compounds in
a phytotechnology system and to differentiate it from other natural processes is to use the 14
C-labeled organic compound. 14
C-labeled carbon can be easily measured in the plant tissues as
well as the media to assess the fate of organic chemicals in the phytotechnology system.
Harvesting the planted system may be conducted at several times throughout the experiment to
provide temporal trends. RCF and TSCF values can be calculated during the feasibility study to
provide an indication of the potential to accumulate the contaminant in the plant biomass, if
applicable. This information may also be used to determine whether the plant biomass must be
treated as a hazardous waste if harvested.
2.3.3.3 Demonstrating Treatability
Demonstrating treatability is quantifying the probability of success of an approach to achieve
cleanup targets that reduce risks to acceptable levels in a reasonable time frame. Treatability
studies are performed to present technical evidence validating the proposed treatment scenario,
optimize the design data, and assure concerned parties that the phytotechnology will achieve the

ITRC — Phytotechnology Technical and Regulatory Guidance and Decision Trees, Revised February 2009
67
desired results under existing site conditions. These are typically demonstrated using
performance data that show that the approach can meet predefined criteria identified as success.
Establishing performance criteria is generally independent of the remedial approach undertaken
at the site. Therefore, phytotechnologies do not really warrant any special considerations.
However, a consensus will need to be reached on how much and what kind of data are required
and how, when, and where they will be collected, analyzed, documented, and reported. Typically,
demonstrating treatability relies mainly on conventional data such as concentration trends,
groundwater conditions, hydrologic modeling, etc. These will often, although not necessarily,
require sampling and analytical techniques unique to phytotechnologies (see Section 2.5.3).
Similar to feasibility studies, the literature review undertaken as part of the plant screening
process (see Section 2.3.1) may contain sufficient information to meet the objectives of
treatability studies. Typically, a rate of remediation must be established either from the literature
or from the treatability study results. This rate of remediation is then incorporated into some form
of predictive modeling to estimate the time necessary for the phytotechnology to reach the
predefined criteria of success. Part of the definition of success is a consensus on the length of
time considered reasonable to complete the cleanup. Furthermore, the seasonal nature of
phytotechnologies also needs to be considered when estimating the amount of time required to
accomplish cleanup objectives. Sufficient data must be provided to regulators and stakeholders
that describe how the contaminant will be contained or treated during the dormant period.
Therefore, the treatability study should be designed such that it incorporates the full impact of
plant growth and maturity, including dormancy and other seasonal changes. In many cases, it
may be suitable to include the treatability test in the field as the first year or more of the remedial
application and eventually incorporated into the final design. Typically, additional sampling and
monitoring are required during this initial pilot phase compared to subsequent years.
Based on an ongoing treatability study, the probability of success of the proposed remedy needs
to be continually evaluated. Furthermore, the expected outcomes and potential pitfalls should be
discussed and presented along with the contingencies for failed outcomes. Again, criteria should
be defined in advance that indicate what a successful outcome is and what a failed outcome is,
particularly the triggers that would initiate a contingency alternative.
2.3.3.4 Supplementing or Supplanting Existing Remediation Systems
One of the best and common applications of phytotechnologies is when a conventional (typically
mechanical, but even natural attenuation) remedy needs to be supplemented or eventually
replaced. The reasons for this change could be inefficient operation, high long-term costs,
frequent system down-time, reaching the operational life of a system, or incomplete remediation.
Under these conditions, the reasons why the proposed phytotechnology will increase the
likelihood of meeting remedial objectives for the site must also be documented. Examples of
how phytotechnologies may be proposed as a supplement or replacement include the following:
vegetative covers for infiltration control as a replacement or supplement to conventional
landfill covers, particularly those with a net accumulation of liquid (see ITRC 2003c)

ITRC — Phytotechnology Technical and Regulatory Guidance and Decision Trees, Revised February 2009
68
vegetative covers for surface soil remediation as a replacement for land farming while
maintaining biodegradation rates
tree stands for groundwater hydraulic barriers as well as a supplement to natural attenuation
for added plume migration control
tree stands for soil and groundwater remediation as a supplement or replacement to pump and
treat, air sparging, or vapor extraction systems that are inefficiently capturing or remediating
residual contaminants, including in the off-gas
constructed wetlands for surface/wastewater remediation as a supplement (secondary or
tertiary treatment) to traditional (primary) wastewater treatment systems (see ITRC 2003b)
riparian buffers for runoff control and treatment as a replacement for drain tiles used simply
to redirect runoff (see ITRC 2003b)
For the phytotechnology system, this approach often offers an automatic backup for when
contingency conditions are triggered during the evaluation of the phytotechnology in the field.
Regulators will more easily accept a supplemental or replacement remedy if an existing
conventional system is either still operating or can be switched back on should the
phytotechnology system not meet performance criteria. Furthermore, the conventional system
may be needed during specific times of the year based on the growing season or when adverse
climate conditions impact overall plant growth and performance.
2.3.4 Stakeholder Decision Factors
In addition to the technical and regulatory factors that are considered when selecting a remedy for
a site, other concerns of stakeholders such as the public, community members, adjacent property
members, nongovernment organizations (NGOs), and site owners may need to be considered as
well. These concerns include aesthetics, operability, future property reuse options, timing, long-
term stewardship, sustainability, and the final disposition of the site. Involvement of other
stakeholders early in the process is crucial to the final selection of a phytotechnology remedy.
The general perception is that “green” technologies are natural, environmentally friendly, and
less intrusive. Phytotechnologies create sustainable greenspace and can also provide visual
screening, reduce noise, and require less intense human interaction to install and operate in the
long term. Furthermore, phytotechnologies also create a barrier to odors, noise, and dust
generated from other site activities as well. Therefore, the public perception of phytotechnologies
can be quite favorable. However, a perception could be that phytotechnologies are merely
beautification and not cleanup, particularly since phytotechnologies can take longer than other
alternatives to meet objectives. In some cases, community members may also express opinions
on certain species based on personal preferences or medical conditions including allergies,
asthma, perceived nuisances (i.e., cotton-like seeds from cottonwoods, excessive leaf, branch, or
seed drop), wildlife use, type of wildlife attracted, etc.
Furthermore, it is also important to consider how phytotechnologies fit into the designs of future
land uses and stewardship of the property to be remediated, as well as the areas surrounding the
site. Future land uses are largely determined by zoning where changes will need to be proposed
and accepted by a community board or city council before the phytotechnology remedy can be

ITRC — Phytotechnology Technical and Regulatory Guidance and Decision Trees, Revised February 2009
69
ultimately selected. Similarly, many communities have restrictions or ordinances on the type,
form, and sometimes species that can be used in any landscaped area. In some cases, these
restrictions or ordinances may be based on the commercial use, including those on neighboring
properties, where creating a fire hazard may be controlled by the local fire department, or visual
contact with field workers must be maintained at all times for safety reasons, as examples. Some
communities may also have restrictions on species they consider noxious or invasive even if not
listed at the state or national level.
In some cases, commercial redevelopment may not have a future occupant lined up yet, which
makes planning the future layout difficult. City planners and architects are often reluctant to
finalize plans until the future property use itself has been defined, including the layout of
greenspace, storm water control areas, and other vegetated areas that might also serve as
phytotechnology plantations. In general, the decision on the final property disposition often
outweighs the decision to select and implement a phytotechnology application. Therefore,
selecting the final remedy for the site is often delayed until the disposition is solidified.
Related to the final disposition of the site is the long-term stewardship and sustainability of the
remediation system. In some cases, the new property owner or occupant may be willing to take
on or negotiate the care and maintenance of the planted areas since this function typically impacts
its public image. In other cases, the current liability owner may retain all care and maintenance
activities if significant monitoring requirements are also to be conducted along with other O&M
activities. Furthermore, long-term stewardship may be negotiated with third parties such as state
departments of natural resources, the Bureau of Land Management, U.S. Department of Interior,
NGOs, nature conservancies, etc. Similarly, easements may be placed on the property to prevent
future land changes and/or trust funds set up to ensure the solvency of the long-term management
plan.
Before proceeding with designing the phytotechnology application, these concerns and issues
must be addressed. Addressing these may include an education program that provides
information on how phytotechnologies work in general, what specific mechanisms would be used
at the site, what applications of phytotechnologies can be designed, and the reasons why the
proposed design will work. Just as in the process of gaining regulatory approval, scientific
information supporting the effectiveness of phytotechnologies must be provided to gain public
understanding and acceptance. Furthermore, phytotechnology projects often offer educational
opportunities in areas such as botany, ecology, horticulture, and biological sciences for local
schools and boys/girls clubs that can increase the appeal and utility of the application.
2.3.5 Economic Decision Factors
While not always a consideration of regulators or stakeholders, an economic comparison of the
phytotechnology option to other alternatives generally needs to be conducted to satisfy the
liability owner(s) who must ultimately fund the remediation. This economic evaluation should be
based on the life cycle of the various options and use the net present costs of each remedy.
During the remedy selection phase, typically only a rough (±50%) cost estimate is needed, which
should include capital, engineering and design, labor, and long-term OM&M costs. A more
detailed cost estimate is conducted during the design phase (see Section 2.4). In addition to costs

ITRC — Phytotechnology Technical and Regulatory Guidance and Decision Trees, Revised February 2009
70
incurred for any remediation project, such as report writing, permitting, travel, soil or
groundwater sampling and analytical, etc., there are cost items specific to phytotechnologies
summarized in Table 2-5 for groundcover and tree systems. Other than the sunk costs, all of
these items may be considered optional, depending on the local conditions, availability, and the
technical, regulatory, and stakeholder needs of the project. Reasonable experience with
phytotechnology systems is needed to accurately estimate the costs and ensure that all necessary
cost items are captured in the estimate. Otherwise, these costs may need to be confirmed.
Table 2-5. Optional cost items specific to phytotechnologies Groundcover systems Tree systems
Sunk costs Site assessment, literature review, feasibility/treatability studies
Capital Earthwork, land clearing/grubbing,
nonpersistent herbicide
Soil amendments, fertilizer
Equipment for applying amendments,
tilling/disking fields (typical farm
equipment)
Plant/seed stock, including cover crop
Seed drillers, spreaders
Surface irrigation system (pipes, hoses, rain
bird sprayers, etc.)
Weirs, gates, other surface flow control
devices
Earthwork, land clearing/grubbing, boring/
trenching equipment
Tree stock (whips/poles, potted, balled and
burlapped), storage fees, down payment
Soil amendments, fertilizer, backfill soil,
cover mulch, equipment to distribute
Tubes or collars for inducing deep root
growth, breather tubes
Trunk guards, fencing (perhaps electrical),
other animal-control devices
Surface irrigation system (pipes, hoses, rain
bird sprayers, etc.)
Subsurface irrigation system (pipes,
connectors, screens, etc.)
Engineering
and design
Irrigation system plumbing, connection to
water supply
CADD maps of tree layout (by species and
locations)
Labor Plant litter collection, mowing, harvesting,
and associated equipment
Irrigation management
Spot reseeding/replanting (rule of thumb
+5%–10% capital costs)
Botanist/horticulturist to assess
growth/health
Irrigation system plumbing, connection to
water supply, automated controls
Plant litter collection, tree maintenance,
pruning
Tree replanting (rule of thumb +10%–15%
capital costs)
Arborist/horticulturist to assess
growth/health
OM&M Irrigation water, electrical utility
Fertilizer, pesticides, equipment for
applying
Weed, noxious/invasive plant control
Lysimeter, soil moisture probes, datalogger,
solar panels/batteries (if remote)
Dedicated or local meteorological station
(temperatures, humidity, solar radiation,
wind, precipitation)
Soil agronomic sampling supplies, and
analyses
Soil microbial sampling supplies and
analyses
Plant tissue sampling supplies and analyses
Disposal of plant wastes, haulage, off-site
Irrigation water, electrical utility
Fertilizer, pesticides, equipment for applying
Weed, noxious/invasive plant control
Sap flow sensors, datalogger, solar
panels/batteries (if remote)
Dedicated or local meteorological station
(temperatures, humidity, solar radiation,
wind, precipitation)
Leaf area meter, stem gauges, dendrometers
Plant tissue sampling supplies and tissue
analyses
Transpiration gas sampling supplies and
analyses
Disposal of plant wastes, haulage, off-site
disposal fees

ITRC — Phytotechnology Technical and Regulatory Guidance and Decision Trees, Revised February 2009
71
disposal fees
In addition to a direct net present cost comparison, full cost-benefit analyses should also be
conducted on each of the remedial alternatives. ITRC established a comprehensive list of
economic elements affecting the cost and value of a site remediated using phytotechnologies
(ITRC 2006c). However, the concepts are applicable to any remedial approach. These cost
elements can be broken down into quantifiable, semiquantifiable, and nonquantifiable (or
qualitative) values. Table 2-6 categorizes the various elements impacting the cost-benefit
analyses. As mentioned in the stakeholder decision factors (see Section 2.3.4), phytotechnology
projects often generate community goodwill through their aesthetics, green approach, and
sustainability, which are often not available through other remedial alternatives. This goodwill,
while difficult to quantify, can translate into very real and tangible benefits for a business due to
the improved corporate reputation within the community. This increased reputation can facilitate
new ventures and business opportunities by continuing and open dialogue with the community
initiated through the phytotechnology project.
Table 2-6. Value elements for cost-benefit analyses
Quantifiable values Semiquantifiable Qualitative
Project design and
development
Meet remedial goals
Alternative end points
Cost recovery
Risk/site assessments
Permitting and contracting
Security
Attractive nuisance
Stakeholder
Community engagement
Social mores
NGO engagement
Regional needs/compatibility
Education opportunity
Recreational opportunity
Avoid property
condemnation
Corporate shareholder value
Livability
Aesthetic appearance
Noise, odor, visibility
Health, safety, security
Community character/
sense of place
Corporate values
Core values and policies
Company pride
Moral/ethical
responsibility
Cultural alignment
Enhanced reputation
Employee morale
Capital
Technology development
External funding
O&M
Monitoring
Reporting
Property tax payments
Project length
Regulatory
Innovative approach
Reimbursement solvency
Relationship status
Precedence Strategic planning
Public and government
relations
License to operate
Sustainable legacy
Ecological
Biodiversity benefits
Erosion control
Storm water management
Conservation or mitigation
Greenhouse gas effects
Environmental liabilities
Natural resource damage
offsets
Future use liabilities
Supplemental environmental
projects
Long-term cost liabilities Source: ITRC 2006c.

ITRC — Phytotechnology Technical and Regulatory Guidance and Decision Trees, Revised February 2009
72
2.4 Design and Implementation
Prior to major design and implementation activities being conducted, the design team should
walk the site and note any relevant landmarks, including boundaries, planting areas, areas to be
resurfaced/regraded, potential obstructions, infrastructure/utilities, and any additional sampling
locations. While these were likely noted during the site assessment phase, they should be clearly
delineated at the site (staking, flagging) as well as on CADD drawings for future design
development and refinements. Furthermore, the site health and safety plan should be developed
and revised based on information gathered during the initial site walks. Table 2-7 lists potential
health and safety issues to look for specifically associated with phytotechnology systems. Many
of these hazards can be reduced or eliminated by engineering them out in the design or through
proper management during implementation and subsequent O&M (see Section 2.5).
When designing a phytotechnology system, several options generally exist that depend on
whether the system is a soil/sediment groundcover system, groundwater tree system, or riparian
buffer system (see Section 2.3.2.1). Simplistic to highly complex models may be developed in
this phase to design the system as well as to reasonably predict the long-term performance.
Furthermore, each type of system will generally require infrastructure to support the long-term
functioning of the system, the proper plant selection and stock, and particular culturing and
installation methods to promote vigorous growth. Each of these components will need to be
incorporated into the final design and subsequent work plans. The final engineering design will
typically depend on a more detailed economic evaluation (±10%) than previously done during the
remedy selection phase. In addition to a refined capital cost estimate for installing the system, an
estimate of the life-cycle duration for the system should also be developed.
2.4.1 Modeling Phytotechnology Systems
Phytotechnology systems (excluding wetlands) can address soil/sediment, groundwater, or both.
While riparian systems often combine components of soil/sediment systems with groundwater
systems, there are also components of surface water systems (i.e., wetlands) that are beyond the
scope of this document (see ITRC 2003b). Furthermore, modeling the groundwater-surface water
interface in riparian systems requires complex hydrogeological models that can consider tidal
influences, salt water intrusion, mixing zones, changes in redox conditions, etc. These too are
beyond the scope of this document. Regardless of the type of system, however, the remedial
objective of the application may be containment, remediation, or both. Once the system and
objective are defined for the site, different models are needed that are based on both defining
factors and generally describe the hydraulics (i.e., water flow or water balance) and/or the
remediation (i.e. rate of degradation or attenuation).

ITRC — Phytotechnology Technical and Regulatory Guidance and Decision Trees, Revised February 2009
73
Table 2-7. Potential health and safety issues specific to phytotechnologies
Site condition or activity Potential health and safety issue Possible solutions
Prevailing wind direction, speed, and
patterns
Dermal contact or inhalation of soil
amendments, fertilizers, and pesticides
Dermal contact or inhalation of dust generated
from tilling, plowing, mowing, harvesting
Scheduling
PPE
Air sampling
Eyewash station
Biohazards—insects, small animals
attracted to the newly planted site
Stings, bites
Allergic reactions
Inventorying/surveying species
Fencing, traps, repellents
Precondition medical check, first aid kit, snake
bite kit, EpiPen/prescription medication
Mowing
Biohazards—large/game animals
attracted to the newly planted site
Maulings, attacks Fencing, traps, repellents
Avoidance, notification/evacuation
Biohazards—poisonous plants,
thorns, pollen
Puncture wounds, scrapes, cuts
Allergic reactions
Inventorying/surveying species
Precondition medical check, first aid kit, EpiPen/
prescription medication
Growth of plants on contaminated
soil/water
Plant tissue sampling, inventorying/
surveying species
Dermal contact with plants containing
contaminants or by-products
Inhalation of transpired contaminants or by-
products
Plant selection criteria for final design
PPE
Overgrowth of vegetation canopy Visual obstruction, line-of-sight issues Mowing, trimming, cutting, pruning, felling trees
Overgrowth of limbs, branches Puncture wounds, scrapes, cuts
Overhead plant litter drop
Trimming, cutting, pruning
PPE
Trimming, cutting, pruning Puncture wounds, scrapes, cuts PPE
Felling trees Falling objects, overhead plant litter drop Staging, exclusion areas
PPE
Buildup of dry plant matter Fire hazard Mowing
Shallow/surface root growth, low
branches, plant litter
Slips, trips, and falls PPE
Maintenance plan to remove/handle plant waste
Uneven ground surfaces from tilling,
plowing, mowing
Slips, trips, and falls Job site control
PPE
Tilling, plowing, mowing, felling
trees
Noise PPE
Irrigation hoses, tubing, sprinkler
heads
Slips, trips, and falls Job site control, avoid placement in walkways
PPE

ITRC — Phytotechnology Technical and Regulatory Guidance and Decision Trees, Revised February 2009
74
2.4.1.1 Soil/Sediment Systems
Soil/sediment systems can either be phytostabilization (containment) or phytoremediation
(remediation) covers. In general, phytostabilization systems are designed to prevent infiltration
and usually entail a water balance model that considers the hydraulic load into the contaminated
soil/sediment. Dedicated hydrologic models, including EPIC (Erosion/Productivity Impact
Calculator, www.wiz.uni-kassel.de/model_db/mdb/epic.html) and HELP (Hydrologic Evaluation
of Landfill Performance, www.scisoftware.com/products/help_interface/help_interface.html),
correlate to weather station data to model infiltration (P + I – R + q; defined in Section 2.4.1.2)
and runoff (R). This modeling is performed by the hydrologist/geologist. Generally, for systems
designed to prevent infiltration, there can be a reduced amount of infiltration during the winter
since the precipitation may be snow rather than rain. However, during the spring thaw, a large
influx of infiltration may result and should also be considered in the design. Specifically, there
should be a net reduction of infiltration during the primary growing season that compensates for
the heavy infiltration after the thaw.
In addition, phytostabilization covers can also include systems designed to control the chemical
stability of a contaminant by influencing the physical state, speciation, complexation, etc.
(phytosequestration). Therefore, it may include a model that demonstrates the permanency of the
attenuation. This would include estimates of partitioning coefficients, solubilities, and
contaminant availability as influenced by soil pH, organic matter content, cation exchange
capacity, alkalinity, etc. (Barnett and Hawkins 2007). This modeling would likely be done by the
soil scientist/agronomist. Much of the information needed to generate these models may have
been developed during fate and transport or treatability studies (see Sections 2.3.3.2 and 2.3.3.3).
Similarly for phytoremediation systems designed to remediate soils/sediments, results from
treatability studies should have generated reasonable estimates of contaminant mass transport,
uptake, accumulation, and/or degradation rates. The mass transport limitations can be estimated
using Darcy’s equation for transport in porous media while taking into account the retardation of
contaminants in the soil environment (Dragun 1998). Uptake and accumulation (during
phytoextraction, phytodegradation, and phytovolatilization) may be modeled based on the RCF
and TSCF (see Section 1.2.4), which incorporate other mass transfer limitations due to the
interaction of the contaminant with the plant tissues and cellular transport mechanisms. These
rates can also account for mass transfer effects in the soil environment. Calculating the rate of
contaminant uptake (Schnoor 1997) into aboveground tissues, Uabove (mg/day), entails
multiplying the TSCF (unitless) by the rate of transpiration, T (L/day), and the contaminant
concentration in the soil water or groundwater, CGW (mg/L).
Uabove = TSCF T CGW (2-1)
Alternatively, for contaminants that are phytosequestered or phytoextracted only in the roots, the
RCF (mg/kg root per mg/L) can be used to calculate the rate of contaminant uptake and sorption
onto the root, Uroot (mg/kg/day).

ITRC — Phytotechnology Technical and Regulatory Guidance and Decision Trees, Revised February 2009
75
Uroot = RCF T CGW (2-2)
Other uptake models exist that correlate the apparent permeability of plant root tissues to the
octanol-water partition coefficient (log Kow) of the compound (Trapp 2003). Degradation can
occur in the soil environment prior to uptake (i.e., rhizodegradation) or after uptake has occurred
(phytodegradation). Conservative biodegradation rates for many organic chemicals broken down
by microbial activity have been published in the literature from both bench-scale and field-scale
work (Dragun 1998). These are similar for modeling rhizodegradation. However, complexities
such as the annual dormant cycle may need to be considered since a large influx of available
carbon into the subsurface is provided to the soil microbes to feed upon and continue remediation
during winter. This carbon comes from the turnover of roots when plants go dormant (Olsen and
Fletcher 1999). For phytodegradation and phytovolatilization, attenuation occurring within or
through the plant is often developed empirically mainly because there is incomplete knowledge
of the active mechanisms causing the reduction in contaminant concentrations. Specifically,
Equations (2-1) and (2-2) do not explicitly account for the attenuation occurring within plant
tissues and simply rely on empirical tissue concentration data (see Section 2.5.3.3) used to
generate the TSCF or RCF. Similarly, the overall rates of attenuation, k, of the contaminant
throughout the entire soil-plant-atmosphere continuum are generally modeled using zero- or first-
order rate equations. In Equations (2-3) and (2-4), C(t) is the concentration at time, t, and C0 is
the initial concentration.
Zero order: C(t) = C0 – kt (2-3)
First order: C(t) = C0e–kt
(2-4)
Either of these equations may be appropriate to estimate the time to achieve cleanup by
substituting the action level for C(t) and solving the equations for t.
2.4.1.2 Groundwater Systems
Groundwater systems can be simple hydraulic control systems (tree hydraulic barriers) to
maintain containment, or they can be systems that also remediate contaminants
(phytoremediation tree stands). For hydraulic control systems, a site-wide water balance will be
needed that contains components quantifying the inputs and outputs of water associated with the
site. The general mass balance shown in Equation (2-5) consists of three components: net storage
in the aquifer = [aquifer flow characteristics] + [net recharge]. Note that recharge is defined as
the net surface infiltration (P + I – R + q) minus the amount removed through ET.
S (h/t) = [(Kbh)] + [P + I – R + q – ET] (2-5)
where
S = subsurface storage capacity Section 2.2.2
h = hydraulic gradient (3-dimensional) (input & output) Section 2.2.2
K = hydraulic conductivity (3-dimensional) (input & output) Section 2.2.2
b = aquifer boundary thickness (3-dimensional) Section 2.3.2.2

ITRC — Phytotechnology Technical and Regulatory Guidance and Decision Trees, Revised February 2009
76
t = time
P = precipitation (input) Section 2.5.2
I = irrigation (input) Sections 2.5.2 and 2.5.1.1
R = net surface runoff (output) Sections 2.4.1.1 and 2.5.2
q = other surface water sources or sinks (input or output) Section 2.2.2
ET = total canopy evapotranspiration* (output) Sections 2.5.2 and 2.5.3.1
= partial differential operator (/x + /y + /z)
* ET can be further divided into evaporation (E) and transpiration (T) components.
Quantifying the individual parameters in this general water balance relies on information and
data collected from various sources and methods. The subsurface storage capacity, S, is a
function of the soil characteristics collected during the site assessment phase (see Section 2.2.2).
Similarly, the hydrogeological parameters—h, K, and b—are likewise collected during this initial
phase. Other water sources or sinks, q, should also be part of the site characterization. Net
surface runoff, R, is usually a modeled parameter (see Section 2.4.1.1) using climate data (see
Section 2.5.2) but is based on site characterization information as well. Precipitation, P, and
supplemental irrigation, I, are typically measured or controlled through on-site monitoring and
control devices (see Sections 2.5.2 and 2.5.1.1) while quantifying evaporation, E, relies on both
monitoring climate conditions and the resulting rain interception capacity of the canopy planted
at the site (see Section 2.5.3.1). Similarly, climate conditions are used to determine the
theoretical transpiration rate, T, although direct measurements on individual specimens can also
be used and extrapolated to the entire stand (see Section 2.5.3.1).
For groundwater situations, Equation (2-5) is often simplified using several assumptions. First,
the groundwater characteristics, h and K, are assumed to be constant. Second, groundwater flow
is conserved such that input into the boundary area equals output. Third, the vertical (z) and
lateral (y) flows are negligible compared to the predominant groundwater flow direction
(arbitrarily defined in the x direction). Essentially, these assumptions reduce the [aquifer flow
characteristics] term to zero. Therefore, the resulting simplified water balance, shown in
Equation (2-6), is more often used, where S is the change in groundwater storage.
S = P + I – R + q – ET (2-6)
For groundwater to be consumed, S must be less than zero (groundwater storage must
decrease). Solving Equation (2-6) for ET quantifies the amount of evapotranspiration that must
be achieved by the plant canopy for groundwater to be consumed beyond the net amount supplied
from surface infiltration (P + I – R + q).
S = P + I – R + q – ET < 0 or ET > P + I – R + q (2-7)
To determine the total ET needed from the entire plantation, the number of trees for a final
engineering design can be calculated in a number of ways. Standard groundwater models such as
MODFLOW from the U.S. Geological Survey or others (Javandel and Tsang 1986, Domenico
and Schwartz 1997) can be used to estimate the total groundwater removal rate needed to provide

ITRC — Phytotechnology Technical and Regulatory Guidance and Decision Trees, Revised February 2009
77
plume capture. However, models used for phytotechnology systems should also account for
complexities such as seasonal variations of the trees, groundwater fluctuations, and the
preferential use of surface water (precipitation and/or irrigation) over groundwater. Specifically,
the model needs to account for variations in contaminant migration during the dormant season
versus when the trees are actively extracting water. The output of the model needs to demonstrate
that the leading edge of the plume will not travel beyond or below the influence of trees by the
end of the dormant season. Similarly, hydrologic model inputs may be required to estimate the
rate of percolation of rain or irrigation water as an additional source of water to the trees instead
of just groundwater. Similarly, the output from hydrologic models such as EPIC and HELP may
also be used to determine the water from the surface that will contribute to the total water
needing to be removed for a groundwater plume to be captured.
This total water removal rate (ET) can then be converted into the equivalent number of trees
using empirical water usage models that correlate annualized transpiration (sap flow) data
specific to the species to some measure of the growth such as height, girth, or basal trunk area
(see Sections 2.5.2.1 and 2.5.3.1). Figure 2-6 shows an example of this empirical correlation.
However, these empirical water usage models do not account for canopy closure since the
measurements are performed on individual trees rather than on an entire canopy. The concept of
canopy closure is when adjacent trees within a stand have branches that begin overlapping one
another and all of the solar energy (and wind) driving the ET from the system is captured by the
system. This represents a theoretical maximum in the pumping capacity of the system. At this
level, the FAO Penman-Monteith equation, available at www.fao.org/docrep/X0490E/
x0490e06.htm, can be used to calculate the ET rates given meteorological data (Allen et al.
1998).

ITRC — Phytotechnology Technical and Regulatory Guidance and Decision Trees, Revised February 2009
78
Figure 2-6. Empirical correlation of annualized transpiration rate (VT, L/day) to basal
trunk area (BA, cm2). For poplars (Populus L.) growing in USDA hardiness zones 5–6.
At this step in the calculation, multiple designs (number of trees) are possible as a higher number
of younger trees pumping less water each may be equivalent to fewer, older trees that pump more
on a per tree basis, particularly if their canopies are equivalent. Initial planting densities may be
greater than required and the trees may be thinned after reaching a specific height. With the total
removal rate and various numbers of trees based on relative age determined (see Table 2-8),
planting densities can be calculated for each design and compared to what is reasonable for the
species and the site. Recommended planting densities are available from sources such as the
USDA PLANTS national database (http://plants.usda.gov). However, stands planted at higher
densities than recommended either thin naturally or can be thinned to optimize the total pumping
capacity. Other factors should be considered when selecting the final design, including
installation costs, O&M requirements including thinning, timing to achieve the total required
removal rate, canopy closure, continued operation of an existing system (if present), etc.
Table 2-8. Range of basal trunk areas and corresponding trunk diameters for trees of
different ages. For poplars (Populus L.) growing in USDA hardiness zones 5–6.
Age
(years)
Basal trunk area
(cm2)
Trunk diameter
(cm) (inches)
0–3 1–50 1.0–7.5 <1–3
3–5 50–200 7.5–15 3–6
5–10 200–500 15–25 6–10
10+ 500+ 25+ 10+
Similar to soil/sediment phytoremediation cover systems, the rate of attenuation in groundwater
systems can be based on models describing the various relevant steps in the transport, uptake,
accumulation, and/or degradation of the contaminant. Some additional considerations in tree
groundwater systems versus soil/sediment groundcover systems include lateral diffusional losses
through the trunks of trees (Schumacher, Struckhoff, and Burken 2004), changing rates as the
tree develops year over year, and changes in redox conditions in the root zone during extended
periods of inundation or desiccation. In many cases, the issue is less about the specific details of
how and where the attenuation occurs in the soil-plant-atmosphere continuum and more about
the fact that it does and can be quantified. Therefore, much of these complexities can be
accounted for in a simple rate constant or empirical relationship rather than individual models
accounting for each complexity.
2.4.2 Infrastructure and Site Preparation
Phytotechnology systems have similar infrastructure and site preparation requirements to what
most remediation projects require, such as earthwork, clearing and grubbing, storm water
management, accessibility, fencing/security, etc. Furthermore, even though phytotechnology
systems are less energy-intensive than other alternatives, there is still a need for basic utilities to
run pumps, controllers, automated sprinkler systems, monitoring equipment, etc. Whether the
infrastructure already exists at the site or needs to be brought in for the phytotechnology system

ITRC — Phytotechnology Technical and Regulatory Guidance and Decision Trees, Revised February 2009
79
Example Calculation
Assume a site is located in a temperate climate in USDA hardiness zone 5–6 and has 1 acre available for planting. Furthermore, assume a standard groundwater model (e.g., MODFLOW) estimates that plume capture can be achieved as long as 5 gpm (7200 gpd, 365 days/year) of groundwater is extracted along the entire plume width perpendicular to the direction of flow. However, hydrologic models that account for rain and irrigation percolating into the root zone results in an additional 1 gpm that must be included in the total removal. Therefore, the total removal rate needed for plume capture is 6 gpm (8640 gpd) extracted continuously throughout the year. The total number of trees required to meet this pumping capacity depends on the individual annualized rate per tree.
Design Option 1: Within a year or two after planting, each tree may pump around 10 L/day (~2.5 gpd). This rate converts to approximately 3500 trees to capture the plume. Using Figure 2-6, this represents tree basal trunk areas around 50 cm
2, and according to
Table 2-8, these would be around 3 years old and 8 cm (~3 inches) diameter.
Design Option 2: As each tree matures, it may pump 60 L/day (~15 gpd). At this rate, approximately 600 trees would be required. Using Figure 2-6 and Table 2-8, this rate can be achieved by 5-year-old trees that are approximately 15 cm (6 inches) diameter with basal trunk areas of 200 cm
2.
Based on information from the USDA PLANTS national database for poplars (Populus L.), the typical planting density is 170–800 trees per acre. Therefore, 3500 trees on 1 acre would represent a very dense planting design (planted on 4-foot centers). Over time, this stand would become overcrowded and would need to be thinned. Alternatively, 600 trees planted at the site would be a reasonable design but at the expense of the additional time to achieve the total required removal rate.
to operate should have been developed during
the site assessment and remedy selection
phases (see Table 2-3 and Figures 2-2 through
2-5). However, how these infrastructure and
site preparation activities support the
phytotechnology system may be somewhat
different. For example, earthwork activities
would be described in a detailed work plan,
but would also include how to prepare and
plant soils to support the desired
phytotechnology plantings. Similarly, storm
water management must account for the
additional irrigation used in a phytotechnology
project. Because phytotechnology systems
change and grow over time, access onto parts
of the site may become restricted, visual
obstructions to traffic flow may develop, or
solar-powered systems may become shaded
due to overgrowth of the remediation system
itself. Therefore, either the system should be
designed and laid out so that these issues do
not develop, or an O&M plan should be
developed that addresses these issues as they
develop in the future (see Section 2.5).
2.4.2.1 Irrigation Systems, Infiltration
Control, and Storm Water Management
Irrigation systems may need to be installed or
modified to ensure a vigorous start to the
phytotechnology system. If existing
infrastructure is being considered to be used
for an irrigation supply system, it should be
checked to ensure it can supply adequate water
volumes and pressures. Irrigation water may
be clean water, treated effluent, or
contaminated groundwater, depending on the
need, availability, and regulatory restrictions.
Contaminated water from the site may actually
be preferred because it will allow the plant to
adapt to the contaminant concentrations in the groundwater. To use the contaminated
groundwater, it may be necessary to install wells with sufficient yields to supply irrigation.
Pumping groundwater contaminated with hazardous constituents may require special approval to
apply the contaminated groundwater to the soil. Such application could be defined as disposal
and subject to landfill requirements. However, as is the case for contaminated groundwater used
to mix and inject amendments for in situ bioremediation, when contaminated groundwater is

ITRC — Phytotechnology Technical and Regulatory Guidance and Decision Trees, Revised February 2009
80
extracted and injected as part of the remedial process, it does not constitute disposal and is
allowed (see RCRA 3020(b) as discussed in ITRC 2007a). However specific state requirements
should be consulted. For contaminants that may volatilize or transfer to the air, a drip irrigation
system may be preferred over sprinkler irrigation.
The main types of irrigation systems are rain bird or distribution sprayers, soaker hoses, and drip
irrigation. Spraying type systems are generally used for groundcover systems although they may
be needed for tree systems in highly humid and hot climates simply to cool the plants under these
conditions. These can be fixed plumbing or temporary hose systems depending on the need,
frequency, and distribution requirements. Soaker hoses can also be used if excessive
volatilization of contaminants is a concern; however, the use of these may be limited by the size
of the plantation. Soaker hoses need to be laid out in a fairly tight pattern such that the
distribution encompasses the entire area needing irrigation. Hoses in general can pose additional
slip/trip/fall hazards, which should be considered in the initial design. Furthermore, constantly
moving and redistributing the hoses can also pose additional risks (biohazards, contaminant
exposure, etc.) and potential ergonomic issues to workers. Drip irrigation systems also need a
fairly tight distribution pattern; however, the materials such as silicone rubber, fluoropolymer, or
polyvinyl chloride (PVC) tubing can be designed and semipermanently or permanently installed
at the site. Furthermore, these can be buried to avoid associated hazards, although secondary
containment issues may need to be addressed, particularly if impacted groundwater is used as the
irrigation source. Another advantage of drip irrigation systems is that multilevel (vertical)
distribution can also be designed into the system. Using multilevel drip irrigation systems in
association with borehole or trench plantings, tree root systems can be “trained” to grow deeper
by providing the irrigation at successively deeper depths over time. This irrigation design does
require additional plumbing and distribution control (including associated cost and O&M) but
can be combined with other methods to promote deeper root systems (see Section 2.4.3.2).
Furthermore, determining the depth of root systems can be difficult although several methods are
available and continually being developed (see Section 2.5.2.2).
A general rule of thumb is that during establishment (i.e., before trees have reached a
groundwater source) and perhaps throughout the growth of the vegetation (i.e., groundcover
systems), plants should receive a total of 1–2 inches of water per week, including both
precipitation and supplemental irrigation. Once vegetation is properly established, it may be
possible to remove the irrigation system. However, once an irrigation system has been installed,
it provides a backup in case of severe drought. Furthermore, future applications of a liquid
fertilizer may best be applied using the irrigation system (see Section 2.4.2.3). However, some
states are now requiring a nutrient management plan to be developed for loosely defined
“agricultural operations.” While remedial activities are not classic agricultural operations, the
loose definition has been applied to golf courses, parade/athletic fields, and other large grassed
areas. Phytotechnology operations or activities need to check with local regulations for
applicability.
One concern for phytotechnology systems is that excessive irrigation can mobilize contamination
from soil to ground- or surface water. Therefore, in these cases, ET estimates (see Figure 1-7 and
Tables 1-2 and 1-3) may be needed to estimate the amount of water necessary to sustain growth

ITRC — Phytotechnology Technical and Regulatory Guidance and Decision Trees, Revised February 2009
81
without infiltrating through the soil and root zone and recharging the groundwater. Automated
soil moisture monitoring systems are also available to control flow when irrigation is necessary
(see Section 2.5.3.2).
In terms of controlling hydraulics, different methods applied at the surface or in ground may be
employed. For controlling infiltration, soil mounding, contouring/grading, and impermeable or
semipermeable barriers can restrict or control total infiltration. Common barrier materials include
compacted clay, low- and high-density polyethylene liners and landscape tarp (polypropylene
mesh). For liners and tarps, holes need to be cut (a simple “X” cut) to accommodate desired
plants. The use of these should be included in any hydrologic modeling done in the design (see
Section 2.4.1). Other storm water (and irrigation) management control features such as
conveyance ditches and retention/detention basins may also be designed into the site but may
also include the storage capacity in the soils themselves (see ITRC 2003c). To minimize runoff,
higher-permeability materials such as sand, gravel, or cobble placed in layers or along boundaries
can be used to capture, store, and/or convey the storm water as desired based on management
requirements. These too may be lined with a low-permeability material. In some cases, if these
conveyances lead to a discharge point, they may be subject to NPDES permits. In some cases,
these management systems may be planted with species capable of remediating or transpiring the
runoff (see ITRC 2003b and also riparian systems in this document).
2.4.2.2 On-Site Access, Fencing, and Security
By definition, phytotechnology systems are growing and ever-changing systems. Thus, special
design considerations should be given to accommodate how the system will change the
appearance and accessibility throughout the site over time. Certain requirements may have to be
considered, such as easements approaching traffic intersections to prevent visual obstructions,
locating and accessing monitoring wells and other infrastructure located within the planted area,
and future mobilization of equipment and heavy machinery to various parts of the site. On a day-
to-day basis, visual contact with field workers conducting routine OM&M activities may need to
be maintained. This specific requirement may impact the final design by limiting the species
selected to those that do not grow over a certain height. Similarly, access for mowing may dictate
the spacing of trees to accommodate the equipment.
Entry into the site may need to be restricted either to minimize potential exposures to human and
ecological receptors or to protect the plantation from vandalism and damage caused by the
public. Fencing provides a minimum level of protection for these needs but can also serve other
purposes in addition to providing security for the site. Fencing or netting can also be used to
capture plant debris and leaves from blowing off site. Large animals such as deer and beavers can
be restricted from entry provided the fencing is tall enough and/or has small enough openings.
Alternatively, electrified fencing can also be used to deter these larger animals. Smaller fences or
wire mesh (“chicken wire”) can be used for smaller animals and rodents such as rabbits and
mice; however, complete control of these animals using fencing can be difficult. An alternative
or supplement to this approach includes maintaining an adequate mowing program around the
periphery in addition to establishing raptor perches. Burrowing animals such as moles and
groundhogs can be controlled by installing a trench around the perimeter of the plantation and
filled with larger material such as cobble that cannot be burrowed through. The depth of this

ITRC — Phytotechnology Technical and Regulatory Guidance and Decision Trees, Revised February 2009
82
trench need be only a couple of feet deep but below the normal burrowing depth of the animal. In
extreme cases, overhead netting can be used to restrict migratory birds from accessing the plants
although this can also cause entangling issues.
In addition to fencing around the site, individual plants, particularly trees, may need to be
protected through additional means such as trunk guards, guide lines, ties, and stakes. Grazing
animals (e.g., voles, beavers, rabbits) as well as various animals that rub up against trees (e.g.,
deer rubbing off antler felt) can do considerable (often irreversible) damage to a newly planted
stand. Plastic, expandable trunk guards may be placed around each tree until the stand matures to
a point where it can withstand these events. It is recommended to consult a local forestry,
arborist, or natural resources department for other alternatives. Trees planted into boreholes or
trenches, with or without casings (see Section 2.4.3.2), will not have the same stability as a
normal tree since lateral root growth, which provides much of the stability during high wind
events, can be restricted. Stakes, guide lines, and ties can be used to help provide the stability,
but care should be given such that the guide lines and ties do not restrict the growth of the tree.
Once a stand matures, particularly towards canopy closure, the innermost trees are often shielded
from these effects, and these aids may not be needed in the long term.
2.4.2.3 Soil Preparation, Amendments, Fertilizers
All systems will require some form of soil preparation, either the entire field for a groundcover
system or the soil that will be used as backfill into boreholes or trenches for trees. Soil
preparation for a phytotechnology plantation is similar to that undertaken in agriculture,
including tilling, fertilizing, planting, and irrigating, and should be done according to application
guidelines and rules. These are usually conducted in conjunction with or after major earthmoving
activities are conducted, such as surface contouring/grading, creating drainage control systems,
and removing obstructions. The specific requirements to prepare a soil are site-specific and
should rely on the soil characterization information collected during in the assessment phase (see
Section 2.2.3.1).
At many former industrial facilities, soil compaction tends to be an issue when installing a
phytotechnology system. Compact soils can restrict root penetration, as shown in Figure 2-7, and
need to be dealt with using tilling or harrowing. The depth and associated equipment of tilling/
harrowing depend on the compaction; the goal is to loosen the soil to be more conducive to
support vegetation. In general, the uppermost 18 inches of the soil profile need to be loose for
proper root development. For borehole or trench installations, the entire depth may need to be
loose within the excavation to optimize root penetration. The cuttings may be able to be used as
all or part of the backfill. If the soils were impacted, some regulatory authorities allow the
material to be used as long as it passes any required soil tests. In addition to building a better
environment to support plants, the tilling or harrowing also aerates the soil in a manner identical
to landfarming. For organic contaminants, this can be desirable to stimulate aerobic
biodegradation and should be considered as part of the remedy. However, possible volatilization
of contaminants may need to be monitored or addressed. Blowing dirt and dust generation may
need to be addressed during these activities.

ITRC — Phytotechnology Technical and Regulatory Guidance and Decision Trees, Revised February 2009
83
Figure 2-7. Effects of soil compaction on root penetration.
Another condition that often develops after major earthmoving or tilling is volunteer plant
growth due to the seed bank stored in the soils. While many of the plants that develop may
provide some remedial benefit, particularly for remediating soils/sediments, these are typically
annual varieties. In some cases, this effect can be designed into the entire remedial strategy;
however, the specific species that will develop are difficult to predict as are coverage and
potential fate and transport issues. Methods to address this prospect, if deemed necessary, include
a series of applications of nonpersistent herbicide, mowing (done before the annual species
produce seed), and covering with landscape tarp or liner material. Care should be given to spray
drift and/or dust generation during these activities. The best method also depends on the area to
be prepared.
Either during or after the soil is tilled, soil amendments and an initial fertilizer application can be
added into the matrix. Different compositions can be considered based on the soil condition or
affect desired to promote vigorous plant growth. Several of these are listed in Table 2-9. Although
this list is incomplete, a general recommendation is to use local materials whenever possible.
Fertilizers are commercially available in powder (or granular), liquid, or tablet forms. Powders are
generally mixed into the soil matrix; however, dust generation may have to be addressed. Liquids
are spray-broadcast over the entire planting area but may similarly require runoff to be addressed.
Alternatively, liquid fertilizers can be applied through the irrigation system (see Section 2.4.2.1) or
deep-injected into the soil at the base of the plant. Mist sprayers (powders, sprays), runoff control
(liquids), and scheduling can be used to properly manage these applications.
Another alternative often used for trees immediately prior to planting is the use of “root dips,”
which are also commercially available or can be custom-designed. These root dips usually
comprise specific nutrients and, oftentimes, mycorrhizal fungi inoculants, made into a slurry
using a hydrophilic gel (acrylamide-based polymer). Slow-release (2–3 year) fertilizer tablets of
various formulations of inorganic nutrients are also available commercially, with some also
containing plant growth hormones. These are can be added to an excavation prior to planting. For
trees, several of these may be placed at various depths throughout a borehole or trench.

ITRC — Phytotechnology Technical and Regulatory Guidance and Decision Trees, Revised February 2009
84
Table 2-9. Potential amendment remedies for various soil conditions/growth needs
Soil condition or effect Soil amendment
General fertility Balanced (10-10-10 NPK) fertilizer, biosolids, sewage sludge
Root development/growth Phosphate fertilizer, ectomycorrhizal fungi
Foliar growth Nitrogen fertilizer
Nutrient regulation Potassium fertilizer
Essential metals uptake Ectomycorrhizal fungi, chelating agents, weak acids
Acidity (pH <5) Lime
Alkalinity (pH >9) Gypsum, sulfur
Salinity (EC >2 or 4 mS/cma)
Sodicityb (SAR >12 meq/L)
Gypsum, calcium/magnesium fertilizer (+ irrigation)
Water-holding capacity Compost/mulch mixed in (see Table 2-11)
Moisture retention
Temperature regulation
Compost/mulch on surface (see Table 2-11)
Aeration Earthworms a USDA defines water with an EC >4.0 mS/cm as saline. The horticulture industry frequently uses a standard of
2 mS/cm to define saline water. b
SAR = Na / √ [(Ca + Mg) / 2]. (These values are in meq/L.)
SAR = (Na 0.043) / √ {[(Ca 0.05) + (Mg 0.083)] / 2}. (These values are in ppm or mg/L.)
When dealing with sites impacted with biodegradable organic contaminants, the inorganic nutrient
demand from the microbes also needs to be considered along with the demand from vegetation.
Different target ratios of nitrogen, phosphorus, and potassium (NPK) to the total carbon content (C)
in the soil, including both natural organic matter and contaminant, can be targeted. Relative high
and low ratios are shown in Table 2-10. However, there are no specific levels of NPK to carbon that
must be achieved or maintained since contaminants (e.g., concentration, breakdown products),
microbes (e.g., community diversity, populations), plants (e.g., species, maturity, growth
conditions), and time (e.g., season, climate) all constantly change.
Table 2-10. Target nutrient ratios based on total carbon content
Target Ratio Carbon Nitrogen Phosphorus Potassium
High 100 25 10 5
Low 100 5 2 1
Furthermore, excess fertilizers applied to achieve a certain nutrient ratio, particularly C:N ratios,
can have detrimental effects if not managed properly. Excess nitrogen fertilizers have been
shown to impact receiving water bodies located downgradient and can have a detrimental affect
if not managed carefully. Most chemical fertilizers should not be applied immediately before a
heavy rain event and/or before storm water management systems have been installed. Table 2-11
shows alternatives to chemical fertilization that slow the release of nitrogen nutrients. These
sources of compost or mulch may be mixed into the soil matrix, added as part of the backfill, or
applied on the surface (see Table 2-9) to slowly biodegrade over time, releasing both the carbon
and inorganic nutrients. Furthermore, several of these are known to degrade through specific
organisms also capable of affecting contaminants (e.g., white rot fungi for wood chips).
Likewise, some research has shown that the intracellular enzymes produced by some species that

ITRC — Phytotechnology Technical and Regulatory Guidance and Decision Trees, Revised February 2009
85
are effective in breaking down contaminants are also effective when added as organic matter to a
site (Medina et al. 2000). However, as these materials decompose, one should consider the
potential subsidence issues, particularly for trees planted into boreholes or trenches containing
these materials.
Table 2-11. Carbon and nitrogen (C:N) ratios from different sources of compost/mulch
Compost/mulch C:N ratio Compost/mulch C:N ratio
Manure (fresh) 15:1 Leaves (fresh) 40:1
Legumes (peas, etc.) 15:1 Weeds (dry) 90:1
Grass clippings 20:1 Straw, cornstalks 100:1
Manure (w/weeds) 23:1 Pine needles 110:1
Weeds (fresh) 25:1 Sawdust 500:1
Hay (dry) 40:1 Wood chips 700:1
2.4.3 Plant Selection, Plant Stock, and Planting Methods
Many of the plant selection options are identified during the assessment and remedy selection
phases (see Sections 2.2 and 2.3, respectively). The final selection of plants during the design
phase includes additional, more practical considerations, such as commercial availability and
plantability. Related to the commercial aspects, the type of stock that the species is typically sold
as dictates the planting method and the ultimate design of the phytotechnology system. For all
stock, cost is relatively proportional to the size of the specimen. Since price is dependent on
limited availability, it is highly recommended to order well in advance of the planting date (i.e.,
the winter before). Using locally available stock is highly recommended since it is acclimated to
local climate conditions. Growing seasons generally run from the average first to last frost dates
for the region (check local agricultural extension service). Planting is typically done in late winter
or early spring although exceptions and alternatives exist, as discussed for each of the different
types of stock.
In general, the use of a variety of vegetation leads to a greater chance of success and is preferred
over monocultures due to several advantages, including the following:
Mixed stands may lose only one or two species to a disease, while monocultures may be
entirely susceptible so that one event can destroy the entire phytotechnology system.
Mixed stands support more diverse microbial communities (promoting potentially more
complete rhizodegradation by further breaking down by-products.)
Synergistic effects such as nutrient cycling can occur in mixed stands.
Mixed stands contain a more natural appearance.
Mixed stands promote biodiversity and potential habitat restoration qualities.
Additionally, the planned future use of the site can be considered during the design phase. If a
vegetated stand with little or no maintenance is to be eventually established as part of a long-term
ecosystem restoration, it is likely that this will occur through a succession of species. This
succession could be planned by considering the types of vegetation established initially and the
timing of any future planting events. Similarly, slower growing, longer-lived climax species can

ITRC — Phytotechnology Technical and Regulatory Guidance and Decision Trees, Revised February 2009
86
be included in the initial design such that faster-growing, shorter-lived species conduct the
remediation until the climax species succeed. Typically, 10%–15% climax species might be
included in the initial design.
2.4.3.1 Groundcovers
For groundcover systems (typically for soils/sediments), the design should consider seasonal
variations, particularly between when the species are active versus when they are dormant. Cool
season species typically grow in the spring and fall when it is cool and typically moist, while
warm season species grow during the summer months when it is hot and dry. One can consider a
mixture of warm and cool season species in the initial design. Furthermore, native species are
important for long-term plantings, but in many cases, vigorous, locally adapted varieties of
mostly nonnative forage grasses, legumes, or other species may be the most appropriate choices.
These cultivated species can be considered initially with the eventual succession towards native
species over time.
Species for groundcover systems are commercially available either as pure seed, in a mix of
seeds, as bare-root plantlets, or as individually potted stock. If not commercially available,
harvesting seeds, root runners from existing plants, or whole plants at or nearby the site may be
done, although survivability of the plants, safety, potential contaminant exposure, and the
intensity of the labor should be considered whether to select this species for the final design. The
advantages and disadvantages of seeds are as follows:
Advantages:
Lower costs for the stock (number of
plants per unit cost)
Easy installation (spreaders, seeders) and
general labor
Simple storage and transport of the stock
Disadvantages:
Lower success of establishment and even
coverage of site
Higher predation and competition from
volunteer growth
Cover crop often required
In addition, some seeds require specific chemical, mechanical, or thermal conditions for
germination to occur. For example, some prairie species require a winter freeze to break open the
seed coat, which then allows water to enter for germination. Therefore, these may need to be
planted at the site during the winter before the next growing season. Similarly, some seeds
require an animal to digest the seed, break down the seed coat in the gut, and reintroduce the seed
to the soil through fecal deposition for eventual germination. Typically, these species should be
eliminated from contention. Species that fix nitrogen often need to have a rhizobial inoculum
added to the seeds (typically supplied separately in powder form) prior to spreading. Seeding
rates for common grass species (ryegrass, fescue, etc.) are typically higher than those of prairie
species; although the costs on a weight of seed per unit area are often relatively equal. For
example, 400 pounds of a fescue/perennial ryegrass seed mix is needed to cover 1 acre at a cost
of $3/pound, or $1200/acre. Alternatively, 10 pounds of a prairie grass seed mix is needed to
cover the same acre but at a cost of $100/pound, or $1000/acre. The method of seeding can
depend on the species. It generally entails the use of spreaders (common for lawn/turf grass seeds
but also usable for forbs such as clovers, vetches, trefoils, alfalfa, etc.) or seed drillers (common

ITRC — Phytotechnology Technical and Regulatory Guidance and Decision Trees, Revised February 2009
87
for seeds of prairie species). In some cases, manual spreading is also sufficient. Seeding should
be done whenever is most appropriate for the species, typically in the early spring. In many cases,
survivability hinges on this timing, which should be planned appropriately in the design.
When using seed, some sort of cover is usually required protect the seeds from predation, provide
moisture retention, and shade young plantlets as they emerge. The cover itself can be an annual
crop such as an annual grass species added to the mix. For common lawn and turf grasses,
overseeding is another common method. Other options include wetted sawdust (as a seed carrier
and cover), coconut or straw fiber mats (some times impregnated with the seed itself), or nylon
seed meshes. The advantages and disadvantages of bare-root or potted stock are as follows:
Advantages:
Higher survivability since there is significant
plant biomass available from which to grow
Visual and remedial effects shortly after
planting
Greater ability to compete against or reduce
volunteer growth
Disadvantages:
Higher installation cost, time, and labor
Proper storage and care required before
planting
Larger transport needs
The cost for bare-root stock is generally less than that of potted stock, perhaps by 25%, although
both are more than seed (on a number of plants per unit cost basis). The costs for either vary
widely depending on the species, size of the specimens, commercial origin, and size of the order.
In general, however, the cost of the stock itself is minimal compared to the remaining costs to
transport, store, maintain, install, and cultivate at the site. In some cases, the cost of the stock
may only be 1%–2% of the total capital installation costs. Potted stock typically can range from
small plugs in palettes of 32–128 individual plantlets to single plants of varying sizes in 1-, 2-, or
5-gal pots.
Methods of installation generally require extensive manual labor since each individual plant must
be handled to be planted. A common method for small and medium-sized plantations is to use a
crew of three field workers, one with a dibble bar or similar implement to create a hole sufficient
to accept the plant (and soil if potted), a second worker to place the plant into the hole, and third
following behind to replace the soil around the plant. The plants or palettes should be placed in
appropriate locations throughout the area to be planted beforehand (and adequately watered).
Optimal spacing between plants depends on the size of the specimens, but for plants that come in
palettes, typically 1–2 feet, greater for larger specimens. With proficiency, a site up to several
acres can be planted in a day using this method. Some equipment such as a shallow trencher can
be used to increase the rate of planting or work with tighter soils or larger sites. Survivability is
greater with potted stock since the potting soil is typically included when the plant is installed at
the site. This additional soil provides a clean soil from which the plant can send out exploratory
roots into a contaminated zone, similar to the concept of the “phytoremediation front” (see
Section 2.3.2.3).
When using plugs or potted plants, some initial protection is generally needed to aid the plants as
they establish. Volunteer growth and competition can be dealt with using landscape tarp placed

ITRC — Phytotechnology Technical and Regulatory Guidance and Decision Trees, Revised February 2009
88
down prior to planting where individual holes are cut (a simple “X” cut) to accommodate each
plant. Obviously, the size of the site may make this technique impractical. Moisture can be dealt
with by including a layer of mulch or using coconut or straw fiber “logs” that contain the plant or
plug.
2.4.3.2 Tree Stands
Trees are commercially available either as whips, poles, bare-root, potted, or balled and
burlapped (B&B) trees. The advantages and disadvantages of each type center on the cost of the
stock, storage, transport and handling requirements; the installation cost, time, and labor; and
survivability. In general, larger specimens have a greater chance of survival but are also more
costly in most aspects. In some cases, specimens can be collected from the site or nearby area
instead of purchased commercially. Whips or poles can be cut assuming the species has the
appropriate characteristic of being able to regrow from a cutting. These are typically, but not
exclusively, in the Salicaceae family (willows, poplars, cottonwoods, etc.). Cuttings should be
taken while the source tree is still in winter dormancy and should be maintained dormant (stored
under refrigerated conditions) until planted into the ground. Other species that are not able to
regrow from cuttings can be entirely removed (including the soil around the main root mass);
however, survivability can be low, depending on the ability of the species to withstand
transplantation shock. There are different methods of cutting, storing, preserving, and
transplanting the stock. Information on a species ability to regrow from cuttings or other methods
of propagation may be available on the USDA PLANTS national database
(http://plants.usda.gov). Furthermore, recommendations can also be discussed with a local
agricultural extension service or forestry department. Regardless of the stock, some initial
protection is generally needed to aid the trees as they establish (see Section 2.4.3.1).
Whips and poles generally appear simply as unbranched (or debranched) sticks of varying size
ranging from less than 1 foot (less than ½-inch diameter) to greater than 10 feet (½ to 2 inches in
diameter). Whips can cost less than $1, while poles 3–6 feet long can be $10–20 each. Larger
poles can cost even more and may entail special orders placed well in advance of the planting.
The advantages of this type of stock include easy storage, transport, and handling; smaller
diameter boreholes or smaller trenches needing to be excavated; and in most cases, the ability to
be planted to significant depths with the majority of the material placed into the subsurface. For
example, a 10-foot poplar pole can be planted 9 feet into the subsurface with only the remaining
1 foot above ground. A pole planted in this way can produce a viable tree because the growth
primordia (shoot buds) located along the length of the pole produce branches if aboveground but
can also produce roots if below ground. For this technique to be successful, at least one, but
typically several, growth primordia need to be aboveground after the planting. The pole should
be planted above the static water table to receive sufficient oxygen. In tighter geologies, breather
tubes (perforated PVC) can be installed into the borehole along with the pole to supplement the
oxygen diffusion from the surface. The benefit of this deep planting approach is that the portion
placed below ground produces a root system that starts at depth (9 feet bgs in this example)
instead of from the surface downward.
Note that most tree species cannot be planted using this approach and require other methods to
promote deeper root systems. These include several design features discussed previously, such as

ITRC — Phytotechnology Technical and Regulatory Guidance and Decision Trees, Revised February 2009
89
surface covers and grading, multilevel drip irrigation systems, and designed backfill materials
conducive to root penetration (see Sections 2.4.2.1 and 2.4.2.3). Additional measures to promote
deeper root systems include physical barriers installed into a borehole or along trench walls that
restrict lateral root growth and force/allow only vertical root penetration. These may be installed
the entire length down to the saturated zone or installed only at specific zones in the vertical
profile (i.e., to isolate a clean aquifer from being accessed above an impacted one). Different
casing materials have been tried: some persistent (corrugated pipe or plastic, concrete,
polyethylene sleeves, etc.), some biodegradable or semipermeable (cardboard, Sonotubes®, etc.).
Several of these methodologies have been patented. However, in some cases, soils compacted
during excavation or simply tight native soils may be sufficient to restrict lateral root growth,
particularly if a backfill or soil matrix can be designed that is more conducive to root growth and
penetration. Again, root penetration is restricted by the saturated conditions eventually
encountered in the subsurface; although breather tubes can likewise aid oxygen diffusion.
The speed and labor requirements for planting whips or poles depend on several design factors,
including depth to be reached, soil type and compaction, size of the stock, method of installation
(boreholes or trenches), and additional engineering designed into the installation such as
subirrigation systems, breather tubes, casings or other root growth barriers, backfill and other
amendments, etc. The diameter of the borehole or width of the trench also depends on the
additional engineering included in the design. In complex, highly engineered installations, an
experienced team can plant 50–100 trees per day. In relative simple, shallow installations where a
ripper or trencher is used without soil needing to be backfilled, an experienced team can plant
thousands of cuttings per day.
Whole tree specimens come in a variety of sizes and measures. Smaller trees with an intact root
system are available as bare-root specimens or potted in soil. The pot size generally correlates to
the size of the tree; therefore, a 2-gal (pot) tree will be larger (taller, additional branching, wider
trunk girth, bigger canopy, etc.) than a 1-gal tree of the same species. Similarly, larger trees are
often measured in terms of their trunk girth and can be either potted or B&B. The common
measure is the caliper (diameter) of the main trunk. A 3-inch-caliper tree is a larger specimen
than a 2-inch-caliper tree. However, the pot size or caliper of one species is not an equal measure
for another species. It is recommended to discuss the tree size with the supplier. Generally, the
cost of these trees also correlates with the size. Bare-rooted stock is relatively inexpensive
(around $10 or less each). Potted stock (up to 10 gal) ranges approximately $10–100, while
larger stock (potted or B&B up to 4-inch caliper) costs $100–500 per tree.
The advantage of these more expensive trees—increased survivability—needs to be compared to
the cost of replanting smaller stock such as whips or poles. Furthermore, installing a rooted tree
generally requires additional excavation, including larger boreholes or trenches for species able
to be deep-planted (see above). These also add to the installation cost in terms of additional
backfill material, time required to advance a larger borehole or cut a wider trench, and the
associated labor. Furthermore, transport, storage, and handling of the larger stock also incur
additional costs in the form of larger vehicles and facilities to accommodate the stock. If the trees
need to be maintained after they arrive at the site but before they can be put into the ground, the
larger stock also requires larger amounts of water.

ITRC — Phytotechnology Technical and Regulatory Guidance and Decision Trees, Revised February 2009
90
2.4.3.3 Riparian Transitions
In addition to the species and stock used in groundcover and tree systems, riparian systems may
also include aquatic (OBL) species and/or different transitional (FACW, FAC, FACU) species
based on the tolerance to flooded conditions in the riparian zone. Stock for these transitional
species depends on the form (tree, grass, herbaceous, etc.) and can likewise be available as seed,
plugs, bare-root plantlets, potted plants, cuttings, or B&B stock. For aquatic species, there are
three categories: floating, emergent, and submerged. Floating species are not rooted into a solid
matrix and acquire their nutrients from the liquid medium. Emergent and submerged species
generally are rooted in the sediment but differ in the wavelength of solar radiation where they
conduct photosynthesis (full spectrum for emergent species versus filtered below the water
surface for submerged species). Emergent species transpire water and are easier to harvest if
required, while submerged species do not transpire but provide more biomass for contaminant
uptake and sorption.
Most aquatic species used in a phytotechnology system are harvested from or nearby the site.
However, some species are commercially available from nurseries that specialize in aquatic
species, such as aquaculture, aquascaping, and aquarium supply vendors. Other than seed, stock
of these species typically come as bare-root specimens and require immediate attention since they
are not shipped with sufficient water to sustain them. Costs are comparable to similar
groundcover or tree species; however, shipping costs are likely to be higher due to overnight
delivery and additional water weight. Furthermore, transport and handling of the plant stock also
need to be addressed if the shipment cannot be sent directly to the site. The advantages and
disadvantages of seed over actual plant stock are similar to those discussed for groundcovers.
Furthermore, the design of the plantings may depend on the objective of the riparian system. If it
is to address NPS runoff, then surface contouring along with plantings perpendicular to the flow
may be able to reduce the rate of flow, minimize channeling, and increase the contact time
between the vegetation and the surface flow, depending on the magnitude and frequency of the
runoff flow. However, if the system is designed to address the riparian zone above a body of
water subject to flow itself, the flow conditions should also be considered. Flowing conditions
can be quiescent, intermittent, steadily continuous, or continuous but prone to surges. Depending
on the location of the plantings along the grade, all or part of the plantings may need to be
anchored to withstand the flow conditions. This measure is particularly important during
establishment since the plants will not have grown sufficient root systems to anchor themselves.
Installation methods include physically staking or securing the plants into place, using coconut or
straw fiber “logs” that contain the plant or plug, or controlling the level of flow until the
vegetation is established. If flow conditions can impact the riparian plantings in this type of
system, the design should also accommodate by angling any rows of plantings with, instead of
against, the flow.
2.5 Operation, Maintenance, and Monitoring
Phytotechnology systems are like any other operating remediation system in that they require
maintenance and upkeep. While the activities needing to be performed for phytotechnology
systems are generally quite different from conventional, mechanical treatment systems, the

ITRC — Phytotechnology Technical and Regulatory Guidance and Decision Trees, Revised February 2009
91
optimum operation often translates into an optimum remedial performance. This usually means
establishing and maintaining vigorous plant growth, development, and health by providing an
optimum growth environment, reducing competition and predation, and performing seasonal
activities that prepare the plantation for the next season. Growth conditions are monitored
through techniques not commonly used for other technologies and resemble techniques more
often used in agriculture or horticulture.
In general, it is more important to develop vigorous and deep
root systems than a healthy canopy, although the two cannot be
separated. Techniques to monitor how the plants interact with
the contaminated site conditions (soil and water) also need to
be conducted. In terms of the remedial performance of the
system, the same criteria to monitor any other technology are
used. However, supporting information may also need to be collected to address fate and transport
issues and hydraulic influence and to confirm whether the suspected phytotechnology mechanisms
(rhizodegradation, phytodegradation, etc.) are operating as designed.
2.5.1 Standard Plant Care and Site Upkeep
Standard agricultural methods for fertilizing, irrigating, pest management, and weed control are
used when caring for a phytotechnology plantation. The need to replant some portion of the
system may arise either in response to inadequate growth conditions or events or as part of the
remedial design itself. Similarly, the long-term nature of phytotechnologies implies annual
maintenance activities at the end and beginning of each season.
2.5.1.1 Fertilizing and Irrigating
To maintain vigorous plant growth, development, and health, optimum soil nutrients need to be
maintained and monitored periodically throughout the life of the remediation project. In some
situations, the soil conditions may need to be monitored frequently (several times per year), while
in other cases, soil agronomic samples may be needed only every few years. Typically, regular
fertilizations can be done in early spring to help the new growth and in late fall to prepare the
vegetation for winterization. Standard soil agronomy tests such as those performed at local
agricultural extension services may be sufficient. Sample preparation should follow SW-846
methods 3050B or 3051A, EPA 200.2, or equivalent methods deemed appropriate by the
regulatory authority. Table 2-12 lists standard methods for monitoring agronomic conditions (this
list is not exhaustive). Additional information is available at www.epa.gov/epaoswer/
hazwaste/test/main.htm and www.epa.gov/region1/info/testmethods/pdfs/testmeth.pdf. Many of
these methods are also applicable to common inorganic COC(s).
Tables 2-9 and 2-10 offer guidance on soil amendments and target levels for various field
conditions or optimal growth needs. Specialists such as botanists, horticulturist, and arborists
may also be consulted to help optimize plant nutrition. These individuals are able to assess
nutrient needs based on indicators obtained from the plants themselves, such as wilting,
yellowing, leaf curling, etc. (see Section 2.5.2.1). These growth responses can often be traced to
specific nutrient deficiencies and toxicities (Taiz and Zeiger 1991).
As a general reminder, the focus should always remain on the performance of the system as a remedial technology rather than just on the aesthetic quality of the surface appearance.

ITRC — Phytotechnology Technical and Regulatory Guidance and Decision Trees, Revised February 2009
92
Table 2-12. Analytical methods for soil agronomic parameters
Parameter Analytical method
pH SW-846 9045D, ASTM D4972-01
Alkalinity EPA 310.1
Conductivity SW-846 9050A
Organic matter ASTM D2974-07A
Cation exchange capacity SW-846 9080, 9081
Inorganic nutrients (B, Ca, Cu, Fe, Mg, Mn, Mo,
P, K, Na, Zn)
SW-846 6010C
Anions (Cl–, NO3
–, PO4
3–, SO4
2–) SW-846 9056A
Chloride (Cl) SW-846 9212, 9250, 9251
Nitrogen (N) – nitrate (NO3–) SW-846 9210A
Nitrogen (N) – ammonia (NH3+) EPA 350.1, 350.2, 350.3
Nitrogen (N) – total Kjeldahl EPA 351.1, 351.2, 351.3, 351.4
Ortho-phosphatea EPA 300.0, 365.5, 365.6
Phosphorus (P), total EPA 365.1, 365.2, 365.3, 365.4
Sulfate (SO42–
) SW-846 9035, 9036, 9038
Cations (Ca, Cu, Fe, Mg, Mn, Mo, K, Na, Zn) SW-846 7000B
Cations (Ca, Cu, Fe, Mg, Mn, K, Na, Zn) SW-846 6020A
Cations (Ca, Cu, Fe, Mn, Mo, K, Zn) SW-846 6200
Cations (Cu, Fe, Mn, Mo, Zn) SW-846 7010
Calcium (Ca) SW-846 7140
Copper (Cu) SW-846 7210, 7211
Iron (Fe) SW-846 7380, 7381
Magnesium (Mg) SW-846 7450
Manganese (Mn) SW-846 7460, 7461
Molybdenum (Mo) SW-846 7480, 7481
Potassium (K) SW-846 7610
Sodium (Na) SW-846 7770
Zinc (Zn) SW-846 7950, 7951 aThere are several different methods for determining available phosphorous in soil. Agricultural
laboratories often use the Bray P-1 method (also known as “phosphorous soluble in dilute acid-fluoride”).
For highly calcareous soils (>4% calcium carbonate), the Olsen P method (also known as “phosphorous
soluble in sodium bicarbonate”) is recommended. For additional information on test methods, see Methods
of Soil Analysis, Part 2. Chemical and Microbiological Properties, American Society of Agronomy and
Soil Science Society of America, 1982.
In addition to the soil nutrient content, water supply also needs to be at optimum conditions for
vigorous plant growth, development, and health to be achieved. Under most conditions, plant
stands should receive 1–2 inches of water per week as a general rule of thumb. However, the
total amount of supplemental irrigation (see Section 2.4.2.1) may be greater or less than this,
depending on many factors. First and foremost is the amount of natural rainfall that the site
receives. This can be measured using rain gauges deployed at the site as either standalone devices
(e.g., graduated cylinders, sight glass, weighing gauges) or connected to a larger meteorological

ITRC — Phytotechnology Technical and Regulatory Guidance and Decision Trees, Revised February 2009
93
station (e.g., tipping bucket recorder). Second, species-specific water demands may need to be
calculated using measurements of transpiration. These can be measured using sap flow sensors
(see Section 2.5.3.1). Third, the water-holding capacity of the soil should also be considered and
can be measured using soil moisture probes inserted into the root zone (see Section 2.5.3.2).
These moisture probes can be used to control an automated irrigation system such that a specific
soil moisture level is maintained.
2.5.1.2 Weed and Pest Control
Weeds should be controlled to reduce competition with the selected phytotechnology plants and
prevent the spread of nuisance plants. Weed control may be necessary throughout the life of the
project but is more important for the first few years before the desired canopy has fully formed
and can shade any undesired growth from out-competing. Weed control can be accomplished by
mechanical methods such as mowing, smothering, mulching, or
manual removal or through the use of herbicides. When using
herbicides, care should be taken to select an herbicide that is not
detrimental to the desired plant, and the application time and methods
should minimize spray drift.
Similarly, all plant communities should be monitored for signs of stress or damage from insects
so that the appropriate action can be taken. Certain pesticides containing Bacillus thuringiensis,
also known as BT spray, are widely used due to their specificity for target insects and larvae such
as caterpillars, moths, mosquitoes, flies, and beetles. Due to these specificities and their general
nonpersistence, BT insecticides are often considered more environmentally friendly.
Furthermore, many GMO plant species (see Section 2.3.1.5) have been developed that
incorporate BT insect resistances.
Larger pests such as mice, rats, rabbits, moles, groundhogs, beavers, deer, snakes, migratory
birds, and other vectors may also be attracted to phytotechnology systems. While ultimately these
may be target end users of the site, they can also pose significant risks to the success of the
phytotechnology system by damaging or consuming the vegetation. If these become a nuisance, a
suitable control plan will be needed if not initially designed into the system or the design proves
to be inadequate (see Section 2.4.2.2). Licensed trappers and hunters may be an option,
depending on the setting of the site and surroundings and the method of control.
Monitoring the site for diseases should also be part of standard O&M activities. Diseases in a
stand generally develop when some form of stress or damage to the vegetation creates
weaknesses where the disease can take effect. These conditions or events include water damage
from floods, chemical damage from road salt, and physical damage such as nicks or scrapes
during mowing or other weed control activities or from wind, animals, or other infestations.
Depending on the disease, different control and preventative measures can be employed, such as
additional fertilizer, other biological agents that attack the disease rather than the host, or sprays
containing plant antibiotics. Consultation with a botanist, horticulturist, or arborist is highly
recommended should a disease take hold in the phytotechnology plantation. Additional plant
disease control information is available at http://plant-disease.ippc.orst.edu.
Selected herbicides should be nonpersistent in the environment.

ITRC — Phytotechnology Technical and Regulatory Guidance and Decision Trees, Revised February 2009
94
In some cases, the contaminants that are to be addressed with the phytotechnology system may
cause the stress leading to a disease infestation. However, this effect may be desirable since the
secondary plant defense mechanisms used to combat the disease may also be the same
physiological mechanisms that address the contamination. If this is the case and complete
devastation results, the site will likely need to be replanted periodically.
2.5.1.3 Mowing, Pruning, Harvesting, Handling, and Removing Plant Waste
Mowing groundcovers (herbaceous species) and pruning/thinning tree (woody species) stands
may also be needed to maintain a healthy stand, control weeds, strengthen plant structure,
promote denser canopy, and minimize damage from storms. These activities are generally carried
out using standard equipment such as mowers, clippers, shears, rotary trimmers (weed
“whackers”), chainsaws, etc. as dictated by the type of vegetation. In addition, equipment
selection may depend on the layout of the plantation, such as the width of a mower that can fit
between adjacent rows of trees. Special care should be given when operating the equipment so as
to not damage or destroy the desired species, such as damaging the bark when using rotary
trimmers to cut weeds around trees.
Cutting down dead or dried grasses or plants should be done annually or as needed to maintain
any safety requirements (see Table 2-7). Cutting in the spring should be done prior to the
emergence of new leaf growth or before new seeds or annual plants are replanted at the site.
Branches on trees and woody shrubs can be pruned during the late winter, spring, or summer
months. Avoid pruning during the fall or early winter because, like fertilization, pruning in fall
encourages tender new growth that may not be sufficiently hardened to resist the winter cold.
Dead, damaged, or diseased branches can be removed as needed. Felling whole trees can also be
done as needed and when it can be done safely. Woody species that are to be propagated from
cuttings (see USDA PLANTS national database, http://plants.usda.gov) should be pruned in late
winter/early spring before buds have broken, with the cuttings stored in refrigeration until ready
to be planted. Similarly, coppicing trees that can regrow from a cut stump should be done while
the trees are still able to actively grow and sufficiently harden prior to winter.
The plant material generated may need to be collected and treated as if it is a hazardous waste
until appropriate testing for contaminant accumulation can be conducted. Even if the plant waste
is not classified as a hazardous waste, it may be sufficiently contaminated to require special
handling requirements according to some state rules. Test methods should be appropriate for the
contaminants (see Section 2.5.3.3). In most cases, however, cut plant material can be left in
place. It is recommended that testing be conducted beforehand to determine the need for
collection. If collection is needed, it should be done when the material is cut. For groundcovers,
threshers and bailers may be options to consider. If vegetation naturally produces plant litter
(leaves/needles, seed/seed pods/fruit/pine cones, small branches/twigs, etc.), these may need to
be tested and/or collected as well. Typically, the litter drop occurs at specific times throughout
the growing season, and collection, if required, should be scheduled accordingly. To prevent the
migration of plant litter prior to collection, fencing and netting may need to be considered (see
Section 2.4.2.2). For litter drop produced through storm or weather damage, a specific
assessment may need to be conducted, although historic information regarding the accumulation

ITRC — Phytotechnology Technical and Regulatory Guidance and Decision Trees, Revised February 2009
95
of contaminants should be considered first. Furthermore, plant litter buildup may need to be
removed simply to maintain storm water control systems.
Particular phytotechnology applications such as phytoextraction of metals or radionuclides may
include these sampling, cutting, and collection activities as means to remove from the site the
contaminants taken up into the aboveground tissues. When chelating agents or similar chemicals
are used to mobilize contaminants to promote or enhance the phytoextraction, several factors
must be considered beforehand, including method of application (usually through an irrigation
system as part of the normal O&M, see Sections 2.4.2.1 and 2.1.1), weather conditions, stage of
plant development, rate of application versus rate of water usage, and the potential to increase the
risk of exposure. It is highly recommended to schedule the harvesting activity immediately or
shortly after the application of the mobilizing chemical. If end targets have not yet been reached,
the site will need to be replanted and will typically call for similar or identical procedures to the
initial implementation (see Section 2.4).
In general, individual plants not specifically planted at the site as part of the designed
phytotechnology plantation (i.e., weeds) do not need to be tested and/or collected. Furthermore, a
weed control program should help minimize the growth of undesired and competitive species
(see Section 2.5.1.2). However, should an unplanned species become prolific at a site, a species
identification, growth assessment, and tissue sampling program (see Sections 2.5.2 and 2.5.3.3)
may be needed to determine whether the species is contributing to the remediation, should be
allowed to continue to grow or be managed, and constituents a hazardous waste if harvested.
Specific information that might be worth documenting include the species; contaminant(s);
impacted media; concentrations in the plant, in specific tissues (see Section 2.5.3.3), and in
impacted media; growth; development; health results (see Sections 2.5.3.1 and 2.5.3.2); and
information regarding the mechanism (see Section 1.2) of remediation or exclusion. This
information can be added to the existing body of phytotechnology species information.
If contaminant concentrations in plant tissues do exceed regulatory limits, the cut plant material
or litter will need to be treated as a hazardous waste. If disposal is necessary, a suitable waste
disposal facility should be identified with proper handling and disposal procedures established
beforehand including all safety precautions (see Table 2-7). In some cases, RCRA or state-
specific hazardous waste regulations may also apply. Under certain circumstances, such as with
inorganic contaminants, incineration or composting may be considered to help reduce the volume
and mass of material that ultimately needs to be disposed.
If the phytotechnology project does not result in contaminated biomass, the plant material may be
harvested and sold as a cash crop to offset some of the remedial costs (Bañuelos 2000 and
personal communication with Jason Smesrud, CH2M Hill, Portland, Ore., 2007). Several options
exist, including using the biomass as an energy source (direct-fired or as a biofuel feedstock),
recovering inorganic constituents (e.g., precious metals) from the plant tissues, or supplementing
animal feed supplies. Obviously, additional regulatory scrutiny, sampling, and analytical
requirements may need to be performed to have these end uses approved. The economic
feasibility of these options should be considered during the economic evaluation during the
remedy selection phase (see Section 2.3.5).

ITRC — Phytotechnology Technical and Regulatory Guidance and Decision Trees, Revised February 2009
96
2.5.2 Monitoring Growth Conditions
The growth, development, and health of the vegetation directly influence the ability of the system
to perform the desired remediation. Most applications of phytotechnologies are most efficient
when the plants are growing vigorously and rapidly. However, certain applications where
chelating agents or acidic chemicals are added to promote the uptake of contaminants rely on the
“last gasp” death response of vegetation for the remediation to occur (i.e., phytoextraction).
When monitoring growth conditions, several areas should be considered, including the canopy,
root system, and the community as a whole. Furthermore, monitoring should be conducted
throughout the year including dormant months, although frequencies may be adjusted
appropriately and reduced in frequency, particularly as the system matures.
One of the major factors affecting the growth of vegetation is the climate conditions, including
temperature, barometric pressure, relative humidity, precipitation, wind speed and direction, and
solar radiation. To monitor these conditions, local weather station data (e.g., from an airport or
other recording station) or an on-site meteorological station can be set up. These units can be
solar- and battery-powered for remote operation. Meteorological stations typically have
continuous dataloggers that record the information at set intervals (every minute and/or averaged
over the hour). The typical cost of a meteorological station is about $5,000. This information is
used for various purposes, including setting irrigation schedules (see Section 2.5.1.1); estimating
the maximum theoretical evapotranspiration, ET0 (see Section 2.4.1.2, Allen et al. 1998); and
comparing conditions to annual averages to gauge expected growth, rainfall, and groundwater
levels.
2.5.2.1 Canopy Growth, Development, and Health
In general, the aboveground portion of a plant and the overall canopy are easier to monitor and
measure for growth, development, and health than the subsurface root system. For tree systems,
common measurements include the height, trunk girth (circumference) or diameter, and LAI. For
herbaceous groundcover systems, common measurements include height and area coverage (or
LAI). For riparian systems, a combination is often conducted. The community abundance,
richness, and diversity are also often monitored to determine maturity and succession for each of
these general types of systems.
Physical measurements of height, girth, and diameter are usually performed using standard
measuring devices, including measuring tapes, poles, calipers, or dendrometers. A typical rule of
thumb for hybrid poplars is to achieve 5–10 feet (2–3 m) of growth per year in the first few years.
However, growth is highly dependent on the contaminant, climate, soil, and other environmental
conditions. The rate generally tapers off when the tree becomes large enough that most resources
are switched to maintaining the existing biomass rather than creating new matter. On the other
hand, most herbaceous species attain the full growth characteristics each year, although some
species such as clump grasses become broader each year as root runners are produced extending
outward.
When measuring girth or diameter, one should consider the shrinking and swelling of a stem
depending on amount of water and sap flowing through it during any given time of day. In

ITRC — Phytotechnology Technical and Regulatory Guidance and Decision Trees, Revised February 2009
97
forestry, the convention is to measure at a fixed height above the ground, called “breast height.”
The height is 1.3 m (4 feet, 3 inches) in Europe, Australia, Canada, and some former members of
the British Commonwealth. The convention in the United States and other countries is 1.4 m
(4 feet, 6 inches) above ground. If these are not practical or abnormal growth occurs at that
height, the actual height where the measurement is taken should be recorded. The trunk diameter
can be converted into the basal trunk area (BA) by assuming the trunk approximates a circle
(BA = D2/4). This approximation was used to generate the information in Table 2-8. BA is a
common measure used when measuring sap flow (see Section 2.5.3.1); however, in this case, the
measurement should be at the height where the sensor is installed.
LAI is a ratio of the total estimated one-
sided leaf (or needle) area divided by the
total ground area underneath the canopy.
Area coverage is the percent of the total
ground surface area covered (shaded) by a
specific specimen or by an entire canopy
growing directly above. Some species
contain multiple layers of branching and
leaves/needles and can therefore have LAIs
greater than 1 even through their area
coverage is less than 100%. This possibility
is illustrated in Figure 2-8. A typical stand at
100% area coverage (closed canopy) has an
average LAI of 3–4. Very dense canopies
can have LAIs up to 6–7. Theoretically,
when the area coverage approaches near
100% (complete shade), the stand also
reaches maximum pumping capacity since
all of the incident solar energy driving the
process of transpiration is captured.
Furthermore, the dense foliage creates a
windbreak that prevents wind energy from
driving additional transpiration through
mechanical means except through the most
exterior leaves/needles. For many
phytotechnology designs, canopy closure
can be attained in five or so years although
many controllable factors influence this rate,
including species selection, planting density,
maintenance programs, etc.
LAI and area coverage can be measured in numerous ways, ranging from direct physical
measurements to spectrographic techniques to indirect LAI measurement devices. Direct
measurement includes using a sample grid of known area (ground area) placed in random
locations throughout the planted area and estimating the area coverage within that area. Overhead
Figure 2-8. Example concepts and estimates of
leaf area index and area coverage. PAR =
photosynthetically active radiation, 400–700 nm.

ITRC — Phytotechnology Technical and Regulatory Guidance and Decision Trees, Revised February 2009
98
digital photographs are often useful in estimating both the area coverage of the canopy and
individual specimens within the grid area (see Figure 2-8). For larger tree systems, area coverage
can also be estimated from the shaded area within the grid. Individual specimens are then
sacrificed by denuding the vegetation of the leaf or needle matter to estimate the LAI. Either total
mass can be measured, or individual leaves or needles can be counted as they are removed. The
actual technique depends on the size of the specimen. When using total mass, individual samples
(subset of the whole) can then be weighed to give an average mass per leaf or needle that can
then be used to estimate the overall number of leaves or needles. These individual samples are
then electronically scanned (black and white image) and then overlaid with a grid to estimate the
area of the sample. Alternatively, most scanning software can count the number of black and
white pixels in the scanned image to provide an estimate from the total number of pixels in the
scanned area. This area per leaf multiplied by the estimated number of leaves provides the total
one-sided leaf area.
Alternatively, LAI meters that use a solar monitoring device specifically tuned to the
photosynthetically active radiation (PAR) frequencies of light (400–700 nm) can be used to
estimate the LAI and area coverage. These devices are placed (preferably on a cloudless day) in
an unvegetated and unshaded area or above the canopy itself to gain a reference, full-sun reading.
These devices are then either placed underneath the canopy to measure the shaded solar radiation
through the canopy and compare to the reference reading or connected to another PAR light-
measuring device placed outside or above the shaded area to obtain simultaneous measurements.
Based on the PAR light emanating through the canopy, even under complete shading (i.e., 100%
area coverage), the meter is able to estimate the LAI of the actual stand by comparing the
readings to the number of leaf layers of a reference crop needed to decrease (filter) the amount
that is passing through to the same level. This effect is also illustrated in Figure 2-8. These units
cost $5,000 or more.
In addition to measuring the area coverage using the grid approach, ecological factors such as
species richness (number of species, percentage of whole community), abundance (density,
percent coverage, number of individuals per species), and diversity (distribution, phylogenetic
relationships, and abundance relative to the community) can also be monitored. These usually
entail counting and identifying individual species that make up the community as a whole and
then entering the data into equations that generate various indices quantifying the overall plant
community health. Several areas are generally evaluated by randomly placing the grid throughout
the plantation. Another alternative includes the line-intersect method where straight lines
(marked with rope) through the plantation are traversed and any plant intersecting the line is
assessed and counted to generate the community characteristics. While these monitoring
techniques are generally not needed for phytotechnology applications, they can be used to
enumerate the competing growth of volunteer species. Some regulators may limit the percentage
of volunteer growth that is allowable as a means to ensure optimal remedial performance,
although primary lines of evidence (e.g., concentration reduction) should remain the primary
success indicator. Furthermore, the succession of species over time may be relevant to other
stakeholder decision factors in terms of the ultimate disposition of the site (see Section 2.3.4). In
some cases, these community characteristics may also be used to compare to background areas to
gauge site recovery.

ITRC — Phytotechnology Technical and Regulatory Guidance and Decision Trees, Revised February 2009
99
In addition to the physical structure of the canopy and community, the health and vigor of the
plants are often used to determine the general physical state of the plantation. Other than
complete mortality, other stress indicators can be used to determine the overall health of a
specimen. Common symptoms include wilting, stunted growth, malformed growth (curling,
crinkling, misshapen), chlorosis (leaf yellowing at the margins, tips, and/or between veins),
interveinal chlorosis (yellowing of the leaf veins), necrosis (spots of dead tissue), and dryness/
brittleness. Often, these symptoms can be directly linked to specific nutrient issues and can be
used to determine when additional fertilization is needed (see Section 2.5.1.1). Most plant
physiology textbooks can provide additional guidance (e.g., Taiz and Zeiger 1991). Alternatively,
samples can be collected and analyzed by a horticulturist, botanist, or arborist to determine
appropriate care measures.
However, since these plants are growing on contaminated soil and/or water, the stress indicators
may also be a sign of chemical toxicities associated with the contaminants. Other than spray
irrigation of contaminated water onto the phytotechnology plantation, most contaminant-induced
stresses as they are taken up through the root system show within the xylem vesicles of a trunk,
stem, or branch and extend outwards to the surrounding tissues, while other noncontaminant-
related stresses (nutrient deficiencies, diseases, etc.) are likely to be more systemic (affect all
similar tissues simultaneously). Furthermore, the chemically induced stress indicators may
appear towards the bottom of the plant first and extend upwards as the contaminant is
translocated upwards through the xylem. If the plant is unable to sufficiently combat the stress
conditions (e.g., through phytodegradation or phytosequestration of the contaminant), the stress
indicator may become systemic. Since these are gross simplifications in assessing plant health,
consultation with a plant specialist is highly recommended.
2.5.2.2 Root Growth, Development, and Health
While a healthy canopy generally indicates a healthy root system to support that canopy, another
important factor to consider for phytotechnologies is the ability to either grow roots into the
contaminated media or bring the contaminants into the root zone. Other than landfill covers, the
remediation is generally not successful if the roots do not interact with the contamination (see
decision trees, Figures 2-2, -3, -4, and -5). To assess root penetration, distribution, density, and
physical characteristics, a combination of intrusive and nonintrusive methods can be employed.
A highly destructive method (to the plant) is simply to excavate next to a tree or within the
groundcover area to find, trace, and measure roots. If hand-digging or using a backhoe or
trencher, an examination of the excavated material as well as the excavation walls can be done to
identify root structures. This process is usually done in perpendicular transects starting at the
base of a tree or in the groundcover area and then successively deeper within the previous
transects to generate a three-dimensional distribution. In general, 70%–80% of the root structure
is within the top 1–2 feet of surface (including tap-rooted species) with exploratory roots sent
deeper and laterally. The major bulk of the root mass contains thicker roots, while exploratory
roots are generally small and sometimes too fine to see after excavating. Therefore, initial lifts
should be done closer together with successive lifts spaced deeper apart as one proceeds into the
subsurface. If the contamination is stratified, roots also tend to proliferate in the clean zones
while exploring the intermittent contaminated zones. Typically, these are advanced until root

ITRC — Phytotechnology Technical and Regulatory Guidance and Decision Trees, Revised February 2009
100
structures can no longer be found, although practical limitations should be considered. If able to
excavate directly into the original borehole or trench into which a tree was planted and backfilled
with a medium conducive to root growth (see Section 2.4.3.2), typical penetrations can be 3–
5 feet per year in the borehole or trench. However, most root systems for any species other than
OBL species do not penetrate significantly into a saturated zone. Note that all sloping/shoring,
confined space requirements, and other safety factors should also be included in the health and
safety plan and followed as the excavation is advanced.
A slightly less destructive alternative is to use a hollow-core drill rig or Geoprobe® to advance a
boring at the base of a tree or within the groundcover area. For trees, multiple borings can be
done, moving away from the initial boring to approximate the distribution, assuming the rig can
safely access the entire area and properly raise its mast. Once the core is produced, it can be
brought to the surface and examined for root structures noting the depth, density, and diameters.
In many cases, the actual depth of penetration is less important than an indication that the plant
system has reached the zone of impact or, more likely, is interacting with the contaminant.
Several methods to monitor this interaction include sampling and analyzing tissues. A definitive
tracking compound is the contaminant itself or a known breakdown product. Since contaminant
uptake is a factor considered when selecting phytotechnologies as a potential remedy as well as a
technical factor for specific applications (see Section 2.3 and Figures 2-2 through 2-5), then
whether a compound can be found should be relatively known at this phase. Furthermore,
sampling tissues for the compound will likely be a requirement to monitor and/or confirm the
fate and transport in the plant system (see Section 2.5.3.3). However, the contaminant or
breakdown product would have to be able to enter into the plant (see Section 1.2.4) and be fairly
persistent (slow to rhizo- or phytodegrade). Certainly if the contaminants are known to persist in
aboveground tissues or transpire from them, they should be targeted in the sampling program.
Examples are MTBE and TBA, the breakdown product of MTBE, which have been found
transpiring from aboveground tissues of pine trees growing over a plume (Arnold, Parfitt, and
Kaltreider 2007). However, many other organic contaminants that are likely to enter into a plant
(i.e., with a log Kow between 1 and 3.5) are also fairly degradable in the rhizosphere and within
the plant. Therefore, using these compounds to determine whether interaction is occurring can
have limited, if any, success, particularly when sampling aboveground tissues.
Similarly, many inorganic contaminants are also able to enter into certain plants (see databases
referenced in Section 2.3.1). Since these do not degrade (although a few elements such as
mercury can volatilize under certain conditions), specific inorganic contaminants found in tissues
are also direct evidence of interaction of the root system with the impacted zone. For example,
tritium was found in sap of hybrid poplars grown into an impacted aquifer, indicating direct
influence on the groundwater (Negri et al. 2003). However, many inorganic contaminants are
essential plant nutrients, such as Cu, Zn, Mn, etc. (see Section 1.1.1), which means they are
found in above- and belowground tissues. Thus, the low levels present in uncontaminated soil
that are sufficient to sustain vegetation confound attempts to use this as a means to determine
interaction of a root system with a contaminated zone. Furthermore, the basis of
phytosequestration is that the root system acts as a protection system to the plant (see Section
1.2.1). This barrier may prevent inorganic contaminants from translocating into the leaves and

ITRC — Phytotechnology Technical and Regulatory Guidance and Decision Trees, Revised February 2009
101
stems. Therefore, it is recommended that, at a minimum, root tissues be sampled over leaves and
stems as a means of determining whether the plants have impacted a contaminated zone if the
contaminant can be used as a tracking compound.
Alternatively, other tracers known to be present in the contaminated media but not in the clean
zones in which a plant must grow may be used instead of the contaminant itself. Bromide is a
common conservative tracer used in hydrogeology. Recent studies have investigated whether this
can be taken up and found in plants (Kolhatkar et al. 2006). Specifically, bromide concentrations
in poplar leaves were found to correlate with the increasing levels supplied with the irrigation.
However, there was no significant correlation exhibited in eucalyptus leaves. Although these
initial results were highly variable, the technique warrants further investigation as a nonintrusive
means of determining whether plants systems are accessing groundwater.
Similarly, water containing stable oxygen isotope (18
O) or deuterated hydrogen (2H, or D), also
known as “heavy water” or D2O, naturally occurs in low quantities in regular water (H2O). The
molar ratio of isotopic water to regular water can vary depending on the source water (Ehleringer
and Dawson 1992). For deuterated hydrogen, the ratio of D2O to H2O is denoted as D.
Therefore, groundwater (DGW) can contain a different ratio than what would be found in
rainwater or more generally, in the vadose zone (DVZ). Furthermore, sampling the xylem sap
using trunk coring techniques (see Section 2.5.3.3) and analyzing for deuterated hydrogen can
also reveal a different ratio (Dxylem) than either source. Since water is the only source of
hydrogen available to a plant system, then conceptually, the fluid in the xylem should be a
combination of the two sources; therefore, Dxylem should be between DVZ and DGW.
Furthermore, this comparison of D values can be used to determine the relative percentage of
the total water taken up from groundwater versus what is taken up from surface-available water.
In a field study, eucalypts were shown to strictly use vadose zone water in the initial year after
planting, but up to 35% groundwater in the following year (Ferro et al. 2002). Although these
percentage values are site specific, they can be used in groundwater modeling and should be
considered in the design of a phytotechnology application (see Section 2.4.1.2). However, the
isotopic composition of water can vary with depth. Therefore, discrete samples by depth may
also be used to indicate when a specific depth has been reached by creating a vertical profile and
comparing the xylem isotopic signature to the profile. However, the overall technique requires
further development. A similar method also under development is the use of soil moisture
sensors installed at various depths beneath a tree planted into a borehole (see Section 2.4.3.2).
Using these sensors, poplars and willows were shown to use water from the saturated zone
located 20 feet below (Ferro et al. 2006). Furthermore, the successively deeper sensors were
monitored over time to control the depth at which a multilevel drip irrigation system (see Section
2.4.2.1) would provide supplemental water to the trees.
2.5.3 Monitoring Remediation Performance
As with any other remedial approach, monitoring the performance of phytotechnology systems
should rely on standard soil and water analytical results as the primary line of evidence.
Supplemental information such as the growth conditions (see Section 2.5.2) provides an
ITRC — Phytotechnology Technical and Regulatory Guidance and Decision Trees, Revised February 2009
102
indication whether the plantation is effectively influencing or interacting with the contamination
at the site. If that influence or interaction cannot be demonstrated, then the apparent remedial
performance may simply be due to natural attenuation rather than the phytotechnology.
Additional information may also be required to address hydrologic effects, soil changes, and/or
fate and transport issues associated with a phytotechnology system. These may be needed to
confirm or refine modeling results, develop site specific attenuation rates, optimize the system
performance, or assure regulators and stakeholders that the system is not presenting unforeseen
health and ecological impacts. Furthermore, these secondary lines of evidence may be able to
differentiate the effects of the phytotechnology from those of natural attenuation.
The frequency, duration, and types of tests and protocols; sampling locations (including plant
specimens); and reporting requirements are site specific. Typically, secondary lines of evidence
are monitored more frequently (e.g., quarterly) immediately after the installation of the system
and may be done less frequently (e.g., annually) as the plantation matures and the remedial
effectiveness can be demonstrated. However, the monitoring period should also take into account
seasonal variations. While sampling for primary lines of evidence may be conducted immediately
after planting, even before plants have emerged, sampling for secondary lines of evidence likely
needs to commence only after sufficient biomass has been produced. However, some secondary
lines of evidence require a baseline uninfluenced by the vegetation for comparisons.
2.5.3.1 Influence on Hydrology
Creating a plant canopy, by definition, results in rain being intercepted onto the surfaces of the
canopy. Table 1-2 presents example water interception capacities for various species. While
water interception capacities depend on the duration and intensity of each individual rain event,
information on the relative percentage of precipitation captured and prevented from infiltrating
into the subsurface can be used in modeling (see Section 2.4.1) and ongoing monitoring of the
effects of the phytotechnology system on the site hydrology. However, rain interception is
normally not the primary line of evidence for the success of a phytotechnology application while
soil moisture at specific depths below the contaminated zone may be (see also Section 2.5.3.2),
particularly for phytostabilization and alternative landfill covers. To calculate the rain
interception capacity, rain gauges (see Section 2.5.1.1) can be used to measure the amount of
precipitation outside (or above) and underneath a particular canopy structure. Similarly, this
setup can be used to estimate the amount of spray irrigation that soaks into the root zone
compared to the amount supplied as measured through a meter (see Section 2.4.2.1).
Typically, systems designed to address groundwater plumes should include monitoring wells or
piezometers located upgradient, downgradient, and within the plantation. While compliance
monitoring remains the primary performance requirement, supplemental criteria for these types
of systems often include reducing the overall groundwater levels across the planted area (aquifers
with low hydraulic conductivities) or creating a cone of depression towards the boundary of the
plantation (aquifers with high hydraulic conductivities). These are measured using standard
groundwater elevation measurements. Obtaining an adequate resolution (spacing between
monitoring points) depends on many factors but can be enhanced by gauging water table depths
within breather tubes installed into individual tree boreholes (see Section 2.4.3.2). For
groundwater reductions beneath an entire plantation, the apparent drop in elevations may simply

ITRC — Phytotechnology Technical and Regulatory Guidance and Decision Trees, Revised February 2009
103
be due to the surface water (precipitation and irrigation) being intercepted and prevented from
recharging groundwater rather than from any direct uptake of groundwater. Therefore,
performance measurements that track groundwater elevation changes should consider the
interception capacity of the canopy. Furthermore, root growth and development measurements,
including tracking compounds (see Section 2.5.2.2), can be used to determine whether roots have
penetrated to depths sufficient to access the target groundwater and can thus attribute water table
reductions accordingly.
For boundary situations, the lateral recharge rate may overshadow the rate of extraction,
preventing significant groundwater depressions from being measured through standard well
gauging. Therefore, the upgradient flow velocity may also need to be periodically measured using
standard hydrogeology techniques to determine whether the lateral recharge into the zone where
the depression is expected to form is increased due to water being extracted by the
phytotechnology system. Likewise, the downgradient velocity should decrease as a result of the
influence of the plantation on the hydrology. Because this changes each season as the stand
matures, these measurements should be done annually at least until canopy closure. Furthermore,
groundwater fluctuations vary seasonally and daily where the depression may be significant only
for portions within those periods. Therefore, monitoring schedules should be planned
appropriately. Similarly, these should also be supported by monitoring root penetration into the
target aquifer (see Section 2.5.2.2) to confirm groundwater is being accessed.
In addition to gauging water table elevations, the rate of transpiration occurring through the stand
should be used to supplement the groundwater depression results and develop a site-wide water
balance. Again, estimates of the ratios of surface water and/or groundwater use to the total water
uptake should be included (see Section 2.5.2.2). To estimate transpiration, representative plants
can be instrumented with either sap flow sensors or be planted above underground lysimeters.
Sap flow sensors operate using the rate of thermal dissipation created from a heating source
attached to the sensor. Two forms of sap flow sensors (shown in Figure 2-9, also known as
“thermal dissipation probes” or “heat-balance gauges”), are available: collar type and needle
type. Each is equipped with a series of thermocouples that measure the temperature both with
and without sap flowing past the heating source. The basic concept of these thermal dissipation
probes is that as the transpiration stream moves through the stem or trunk in which these
instruments are attached, the heat is dissipated at a rate proportional to the rate of convective
flow. The volumetric rate (or mass rate converted using the density of water) of transpiration is
calculated using the energy balance, also shown in Figure 2-9.
The collar type sensors come in various sizes and are limited in applicability to a small range of
stem diameters. Another disadvantage is that the collars can restrict stem growth if used for
extended periods of time. Their advantage is that they encompass the complete circumference of
the stem, thus providing a complete measure of the sap flow, whereas the needle type probes
measure the sap flowing only in a discrete section of the stem. Another disadvantage of the
needle type sensors is that their insertion into the plant through a drilled hole is invasive and can
lead to potential damage and disease (see Section 2.5.1.2), whereas the collar type sensors are
noninvasive. However, if left on too long, the collar type sensors can also cause moisture to build
up around the trunk, leading to tissue rotting. On the other hand, the needle probes are not as

ITRC — Phytotechnology Technical and Regulatory Guidance and Decision Trees, Revised February 2009
104
restricted in terms of the stem diameter and multiple probes can be instrumented on a single
specimen of sufficient diameter. In addition, the needle probes also come in various lengths to
accommodate larger specimens. When instrumenting large diameter trees, probes should be
placed on both the north-south and east-west coordinates at a minimum to estimate an average
sap flow rate through the trunk. It is interesting to note that the sun-facing side of the specimen
generally has a higher rate of sap flow.
Figure 2-9. Types of thermal dissipation probes used to measure transpiration rates.
Left, collar type, courtesy Dynamax, Inc.; right, needle type.
Energy Balance Equations:
Energy Balance: Pin = Qradial + Qvertical + Qflow [W] (1)
Ohm’s Law: Pin = V2 / R [W, fixed]
where V = voltage [mV]
R = resistance [ohm]
Vertical Conductivity Qvertical = Qup + Qdown (2)
Qup = KST A dT / dx
Qdown = KST A dT / dx
where KST = stem thermal conductivity [W/m°K]
A = stem area [m2]
dT / dx = temperature gradient [°K/m]
dx = thermocouple junction spacing [m]
Radial Conductivity: Qradial = CH x Ksh (3)
where CH = radial heat thermopile voltage [mV]
Ksh = sheath conductance [W/mV]
Ksh is determined by solving Eqn. (1) with Qflow = 0
Ksh = (Pin – Qvertical) / CH (4)
Sap Flow Rate: F = (Pin – Qvertical – Qradial) / Cp x dT [g/s] (5)
where Cp = specific heat of water [J/g°C]
dT = (TA + TB) / 2 = average temperature increase of sap [°C]
TA, TB = thermocouple temperatures [°C]

ITRC — Phytotechnology Technical and Regulatory Guidance and Decision Trees, Revised February 2009
105
Furthermore, each of these sensors can be connected to a continuous data logger to monitor the
transpiration over a series of day-night cycles and at different times throughout the growing
season. These units can be solar- and battery-powered for remote operation and can be
programmed to collect readings throughout each day. Figure 2-10 shows typical output, with the
total daily transpiration calculated by integration. To standardize the rate across an entire
plantation, the basal area of the instrumented trunk or stem is measured (see Section 2.5.2.1) to
generate a volumetric rate per unit basal trunk area. The basal trunk area can likewise be
measured and summed up for every tree to estimate the total transpiration from the stand.
Figure 2-10. Typical results from thermal dissipation probes measuring transpiration over
several days.
As a supplemental measurement of canopy development, the individual rates of sap flow can be
approximated as the total ET. This value can then be compared to the theoretical maximum rate,
ET0, calculated using the FAO Penman-Monteith equation (see Section 2.4.1.2). However, ET0 is
based on a theoretical reference grass crop of specified height and uniformity accessing water
within the top 2 feet of soil. Therefore, crop-specific coefficients, Kc, are often calculated as the
ratio of ET/ET0 and change as the canopy matures and fully develops. Since deeply planted trees
are able to access additional water deeper than the reference crop assumption of 2 feet, ET values
for phytotechnology applications can often be greater than the calculated ET0. Note that the
theoretical calculations also depend on measuring LAI (see Section 2.5.2.1).
The alternative method to measure the total plant water usage is through the use of weighing
lysimeters placed directly below the vegetation to be monitored. These instruments simply
measure the total change in weight of the vegetation, soil above the unit, and water within a

ITRC — Phytotechnology Technical and Regulatory Guidance and Decision Trees, Revised February 2009
106
known area. The basic assumption for a weighing lysimeter is that the amount (weight) of
precipitation and/or irrigation falling onto the area is known and the change in weight of the
biomass is negligible in the time frame when the measurement is taken. Therefore, the measured
weight change is compared to the weight change expected if no precipitation or irrigation water
were removed. By difference, the weight of water lost through evapotranspiration can be
calculated. The advantage of weighing lysimeters is they are generally more accurate and less
prone to interferences or power issues than sap flow sensors. However, they do require
forethought for installation before the site is planted, are fixed at the location once installed, and
can be more expensive, depending on the size. For groundcovers, the area coverage may need to
be taken into account, as well as the mix of species growing in the sampled area (see Section
2.5.2.1). Weighing lysimeters may not be practical for trees in true field situations, particularly as
they grow beyond the bounds of the lysimeter. Installing lysimeters with a large area needs to be
balanced with the practicality, and again, requires forethought.
On the other hand, for experimental purposes, whole specimens may be planted in a weighing
lysimeter (i.e., in an aboveground soil tank). In this situation, lysimeters dedicated to an
individual plant are extremely accurate and have even been used to show the accuracy of sap
flow sensors. Specifically, using lysimeters, the error from thermal dissipation probes was
estimated to be ±10% at high sap-flow rates and ±20% at medium rates (Rose and Rose 1998).
Furthermore, lysimeters have been used to develop correction factors that compensate for the
change in sap flow due to the wounding caused during insertion of the needles. These correction
factors account for the 50% or more underestimation directly measured by these probes (Green,
Clothier, and Jardine 2003).
Other types of lysimeters are also available and can be used for other monitoring purposes. The
common feature of these other types is that they contain a vessel or cup in which liquid can be
captured. Pan lysimeters are simply gravity fed, while suction lysimeters use a vacuum to draw
liquid into a porous ceramic or stainless steel cup. These lysimeters can be instrumented with a
sampling port to allow collection of liquid captured in the cup. If placed below the root zone,
they can also be used to gauge the amount of irrigation applied to the site (see Section 2.5.1.1).
Similarly, they can be used to monitor whether contaminants are migrating below the capture
zone of the vegetation. In some applications, this information may be for compliance monitoring.
In general however, these would not replace standard monitoring wells and are more applicable if
the phytotechnology system calls for building the system from ground level upwards (i.e. landfill
cover) rather than into the ground (i.e., below a deeply planted tree hydraulic barrier).
2.5.3.2 Influence on Soil Conditions
In some phytotechnology applications such as phytostabilization, riparian buffers, and alternative
landfill covers, soil moisture may be a primary line of evidence demonstrating system
performance since these often rely on controlling moisture at specific depths within the soil. In
other applications, such as phytoremediation of soil/sediments, hydraulic groundwater control,
phytoremediation of groundwater, or constructed treatment wetlands, soil moisture may be only a
secondary line of evidence since primary performance is contaminant concentration reduction or
migration control. Regardless, permanent in-ground soil moisture monitoring systems can be
connected to an irrigation system to control the amount of supplemental water that is applied to

ITRC — Phytotechnology Technical and Regulatory Guidance and Decision Trees, Revised February 2009
107
these plantations (see Sections 2.4.2.1 and 2.5.1.1). Therefore, soil moisture is generally a
parameter to be monitored for most phytotechnology applications, regardless of whether it is
used to monitor remedial performance.

ITRC — Phytotechnology Technical and Regulatory Guidance and Decision Trees, Revised February 2009
108
In addition to lysimeters, soil moisture can be monitored through other devices such as electrical
resistance blocks, tensiometers, capacitance probes, neutron probes, and time domain
reflectometry. These are fairly standard techniques and field instruments. Each has its advantages
and disadvantages, such as effective soil moisture ranges, accuracy, direct or indirect
measurement, in-ground components, portability, durability, and costs ranging from $200 to over
$10,000 in equipment to monitor an entire plantation. Selecting the appropriate technology
depends on the significance of the data to monitor system performance or control irrigation.
Plants also have a profound influence on the microbial characteristics within the soil. While
concentration reductions remain the primary line of evidence for system performance, microbial
characteristics and community structure can provide supplemental information showing efficacy.
Simple microbial counts of the number of colony-forming units of heterotrophic bacteria within
and outside of the vegetated soil can be monitored. In general, vegetation should significantly
enhance these microbial counts, providing an indication that the plants are impacting the overall
microbial activity (and thus, rates of remediation). These can be monitored over time to
demonstrate the proliferation of the community within the rhizosphere compared to the bulk,
nonvegetated soil. Once confirmed, these may not be needed in future monitoring events. These
generally cost around $100 per sample. Care should be given to ensure that the soil sample is not
contaminated with airborne microbes when collected and transported to the laboratory.
Additional characterization using contaminant-specific culturing techniques can also reveal
whether specific microbes such as alkane degraders (e.g., Acinetobacter sp.), toluene degraders
(e.g., Pseudomonas sp.), naphthalene degraders (e.g., Burkholderia sp.), dehalogenators (e.g.,
Dehalococoides sp.), etc. are present in the microbial community and also the levels at which
they are present. Several of these microbes are broad-spectrum degraders (address many
contaminant compounds) while others are more specific (only address individual compounds). In
most cases, these levels of detail are sufficient to demonstrate as supporting information to
concentration reduction data, that the microbial-level “machinery” is present to conduct the
desired remediation.
However, should those techniques not be able to demonstrate presence, additional detailed
characterization techniques are also available to consider the majority of microbes that are not
culturable using standard plate counting methods. Phospholipid fatty acid (PLFA) analysis
provides a GC/MS “fingerprint” of the PLFA membrane composition of the microbial
community. PLFA fingerprints differ between organisms and are influenced by nutritional status
and other stress factors (e.g., pollution) affecting the community. PLFA structural groups (i.e.,
degree of saturation and branching of the phospholipids) are unique to different classes of
bacteria. Therefore, the community structure with and without vegetation can be compared.
Monitoring shifts in PLFA from a stressed to an unstressed condition over time may be used to
confirm contaminant reduction. However, wide variability and biogenic interferences can
significantly confound results. PLFA analyses typically cost around $350 per sample and entail a
multistep solvent extraction of the lipids from a soil sample.
Similarly, denaturing gradient gel electrophoresis separation of gene sequences generated using
polymerase chain reactions provides a “fingerprint” of the genetic sequences unique to individual

ITRC — Phytotechnology Technical and Regulatory Guidance and Decision Trees, Revised February 2009
109
organisms. Specifically, all organisms from bacteria to higher organisms contain 16S rRNA
genes. These gene sequences can be compared to those in extensive databases such as GenBank
(www.ncbi.nlm.nih.gov/Genbank) to identify specific organisms or phylogenetic relationships.
These genetic tools can be used to determine whether specific genetic-level “machinery” is
present to conduct the desired remediation even if the specific microbes are not known or
culturable. Therefore, these may simply be done to provide confirmation rather than an ongoing
monitoring requirement. However, these genetic techniques may not confirm whether the
vegetation is enhancing the performance over natural attenuation/biodegradation. Whether these
additional levels of detail are warranted depends on the significance or conclusiveness of the
primary line of evidence of concentration reduction. Polymerase chain reaction generation and
denaturing gradient gel electrophoresis separation of genetic sequences typically costs around
$1,000 per sample and entails extracting the genetic material from a soil sample by incubation
with detergent, freeze thawing, homogenization in a bead mill, and other steps.
In addition to changes in the microbial characteristics, soil conditions such as redox potential,
temperature, oxygen and CO2 soil gases, and presence of daughter products provide additional
information that can help demonstrate degradation. However, these too are not specific to
phytotechnologies and may simply confirm biodegradation. Therefore, these are conducted using
conventional techniques not described here. Furthermore, many of the cultivation techniques
used to establish a phytotechnology plantation are also means of stimulating microbial activity,
including nutrient and water addition, tilling and manipulating soil, installing passive oxygen
diffusion tubes (breather tubes), etc. In many cases, confirming the beneficial enhancements
provided by the vegetation over the microbial activity alone requires comparative studies and
sampling inside and outside a vegetated area. However, these are more likely done during the
feasibility or treatability stages of the project rather than in a full-scale implementation (see
Section 2.3.3).
2.5.3.3 Fate and Transport in the Plant
Procedures for sampling and analyzing plant tissues for contaminant, by-products, and/or
inorganic nutrients depend on the tissue to be sampled. Most tissue samples need to be weighed;
however, wet weight measurements usually underestimate the true conditions, as desiccation
occurs almost immediately after the sample is excised from the main plant. Therefore dry
weights are more reliable. For inorganic constituents, reporting concentrations on a dry weight
basis is less of an issue. For organic contaminants, the constituents may rapidly volatilize as the
tissues begin drying out. Therefore, dry weight measurements may have to be taken on separate
samples from those tissues analyzed for constituents. Furthermore, cellular breakdown of the
tissues also begins almost immediately and can generate organic compounds that can interfere
with these analyses. Mowing lawns or cutting crops is known to produce distinct odors that
generally can be traced back to C2 to C6 compounds being released (de Gouw et al. 2000).
Samples to analyze for inorganic nutrients are best taken and considered more representative
when the tree is dormant. However, when analyzing for organic constituents, sampling is usually
best done when the tree is actively transpiring.
Once at the laboratory, subsequent preparation of the tissues for analysis entails grinding the
sample in a bead mill, grinding to pass different sized mesh sieves (typically 0.25–2 mm),

ITRC — Phytotechnology Technical and Regulatory Guidance and Decision Trees, Revised February 2009
110
digestion in a mild acid (nitric or hydrochloric), and/or extraction with a solvent. In some cases,
freezing in liquid nitrogen facilitates grinding tissues. These additional preparation steps simply
create a liquid sample from the plant tissues so that the constituents can be analyzed using
standard analytical methodologies. The specific protocols may depend on the sample preparation
requirements called for by the analysis (see text and Internet links in Section 2.5.1.1).
The easiest tissues to sample are the leaves/needles, stems, branches, and fruits/seeds/nuts. These
are collected simply by pulling or cutting sufficient material from the plant and storing them in
sealed plastic bags. For most analyses, samples of 20 g dry weight (10–15 average leaves) should
be sufficient. To estimate the wet to dry weight ratio for field sample collection, as general rules
of thumb, green stems typically contain 95% water weight, leaves 90%, fruits 85%, hardwood
stems 50%, and nuts and seeds 5%. Once collected, the tissues should be stored on ice for
transport to the laboratory.
Fine-root samples can be collected by excavating into soils containing the roots, excising the
roots from the bulk soil, and then washing off the rhizosphere soil using water and/or a mild
detergent. In some instances, it may be sufficient to collectively sample the roots together with
the rhizosphere soil that clings onto the roots simply because the even finer, microscopic root
hairs facilitate the binding of the soil onto the roots. However, one should recognize that the
significant disturbance created when isolating the root/rhizosphere soil sample likely alters the
activity of the microbial community (see Section 2.5.3.2), plus significant desiccation limits how
representative the sample is compared to original undisturbed conditions. Once collected, the
root samples are usually stored in plastic bags, stored on ice, and transported to the laboratory. In
some cases, depending on the parameter to be analyzed, the wash water also needs to be collected
and sampled. Once at the laboratory, a headspace sample from the bag should also be collected if
analyzing for organic constituents.
Sampling hard-wood roots and tree trunks can generally be done by taking a core of the tissues
(Vroblesky 2008). This is a common method in forestry that has been successful at detecting
TCE (Vroblesky, Nietch, and Morris 1999; Ma and Burken 2002), BTEX, and MTBE
(Landmeyer, Vroblesky, and Bradley 2000) in trees. Furthermore, the technique has been
considered for rapidly mapping contaminant plumes using existing trees, as a prelude to placing
permanent monitoring wells (Fiorenza et al. 2005). This is achieved using an increment corer
such as one shown in Figure 2-11. For roots, shallow excavation can be done to expose the
subsurface root structure prior to sampling. For trunk tissues, samples should be taken closer to
ground surface since concentration of contaminants have been found to decline exponentially
with height on the trunk (Ma and Burken 2002). Once excised, the core material (typically
¼-inch diameter by 1–2 inches long) is generally placed
immediately into a volatile organic analysis vial and
stored on ice for transport to the laboratory. Once there, a
headspace sample should be collected and analyzed as
the tissues in the vial immediately begin to degas. Some
protocols call for the sample to degas for 24–48 hours
prior to sampling for equilibrium to be reached.
Refinements to the analytical procedure have shown that Figure 2-11. Increment corer used
to collect hardwood tissue samples.

ITRC — Phytotechnology Technical and Regulatory Guidance and Decision Trees, Revised February 2009
111
a heated purge of the headspace sample improves reproducibility and recoverability from the
sample (Fiorenza et al. 2005).
Since coring is an invasive procedure, care may need to be provided to the sampled specimen if it
is not to be completely sacrificed. Historically, plant care professionals suggested using a tree
wound dressing (typically petroleum asphalt based) or paint to protect the wound from infections.
However, studies have shown that it is generally better to promote and allow the natural callusing
to occur as the best means of care (Shigo and Shortle 1983). Regardless, the practice of wound
dressing still continues.
Alternatively, recent work has investigated using replaceable sorbent inserts that can be used to
collect and sample sap from the core hole (Fiorenza et al. 2005). Specifically, Gore modules
were inserted into existing core holes, left in place for several days, and then replaced with
another module while the original one was analyzed. Initial results indicated that the hydrophobic
sorbent modules were able to accumulate organic contaminants used in the dosing experiment
and increased the overall method sensitivity. However, as the tree creates a callus around the
wound, the sap flow conditions will alter and likely not be representative over time. Sampling
sap in this manner of course requires the tree to be actively transpiring.
In addition to sampling tissues and plant sap, some phytotechnology applications may require
transpiration gases emanating from the plants to be sampled as well. Again, these are
confirmatory samples that demonstrate the overall fate and transport of volatile contaminants
through the plant system rather than primary lines of evidence of remedial performance. To
capture transpiration gases, Tedlar® bags or similar airtight plastic chambers have been used
with some success (Compton et al. 1998; Newman et al. 1999b; Arnold, Parfitt, and Kaltreider
2007). Specifically, this enclosed chamber method was used to confirm the transpiration of
MTBE at field sites. TCE could be detected only in laboratory studies, not in the field (Newman
et al. 1997a). One of the main issues with capturing transpiration gases with this method is that
the process ceases once humidity within the collection vessel reaches 100%, which generally
occurs rapidly as the plant continues to transpire water through the branches that are contained.
Therefore, very low sample volumes are created.
To address this issue, the volume of the vessel can be made large enough to capture a sufficient
amount of transpirate to be condensed for a liquid sample. However, one needs to account for the
equilibrium partitioning between vapor and liquid phases. For some compounds, such as MTBE,
96% ± 2.9% of the concentration was found to remain in the vapor phase, with the remaining
condensing at 24–33C (Arnold, Parfitt, and Kaltreider 2007). Alternatively, Tedlar sleeves can
be used with a constant airflow passing through to remove the humidity; however, the airflow
sweeps the volatile contaminant out as well. To sample the air stream, online gas samplers or
Summa canisters have been connected in series to the outlet, allowing for transpiration gases to
be captured and subsequently analyzed (Kolhatkar et al. 2007). One advantage of this technique
over the enclosed system is that the air used to maintain humidity can be conditioned (i.e.,
warmed and dried) to promote higher rates of transpiration from the specific branch than would
be produced through ambient air conditions.

ITRC — Phytotechnology Technical and Regulatory Guidance and Decision Trees, Revised February 2009
112
2.5.4 Contingency Planning
A contingency plan should define the actions to be taken if the phytotechnology system does not
meet remedial objectives within a specified timeline or milestones. These conditions should be
clearly spelled out in the contingency plan and rely heavily on the monitoring and performance
plan for the system. Options may include implementing an entirely different remedial solution,
supplementing the phytotechnology system with another alternative, expanding/altering the scope
of the phytotechnology (e.g., additional plantings, change O&M procedures to increase/ decrease
water usage or growth, etc.), or changing the timeline or milestones that need to be met. In some
cases, the expected performance of the system may have been altered due to unforeseen or
uncontrolled events such as floods, hurricanes, extended droughts, wildfires, etc. In many of
these situations, any remedial technology would have failed; thus, the phytotechnology remedy
may remain the best option even if the remedial objectives were not met according to the original
timeline.
Similarly, a contingency plan should be developed and may be implemented if there is permanent
large-scale failure of the plants (predation, disease, flood, drought, vandalism, etc.). In such cases
it is necessary to dispose of the destroyed plants and plant litter (see Section 2.5.1.3) as well as
implement necessary steps to replace the destroyed plants. Operational considerations that
applied to the initial implementation will also likely apply to any replanting activities (see
Section 2.4). However, the plan should also consider the resiliency of the phytotechnology
system since it is a living system. A detrimental event may result in only temporary loss of the
plant system. The time frame of the loss may be only a few days, the remainder of the season, or
a season or two after the event. The contingency plan should clearly define the conditions that are
acceptable and unacceptable for the site risks.
Furthermore, an event may impact only part of the system, such as one of several species planted
at the site or a small area of the larger plantation. Similarly, in the absence of a triggering event,
areas of the plantation that do not survive may be an indication of adverse subsurface conditions
specific to that location that were not identified during the initial site assessment (see Section
2.2). In this case, additional characterization may be warranted prior to implementing an
abbreviated or modified version of the original plan (see Section 2.4). In most cases, however,
individual specimens here and there throughout the plantation do not survive. These losses may
occur due to shading or other nutrient competition, localized soil issues, compaction, or fill
material, or simply weak stock. In these situations, it may be acceptable to not replace that
particular plant since over time the adjacent vegetation will likely fill in the canopy in that area
anyway.
When initially planting a site with whole plant stock (see Section 2.4.3), it is also common for
some mortality to occur. A standard landscaping rule of thumb is that 10% of recently planted
trees do not survive the first year, simply due to the transplantation shock that a plant specimen
undergoes when removed, transported, and then replanted at a foreign site. Landscape companies
typically provide warrantees to replace these. However, most warrantees will not be honored for
phytotechnology applications, given the adverse site conditions and unconventional planting
techniques employed. Therefore, replanting should be included in the initial cost estimates for the

ITRC — Phytotechnology Technical and Regulatory Guidance and Decision Trees, Revised February 2009
113
phytotechnology application. As a general rule of thumb, 10%–15% of the initial capital costs
should be added as a contingency for replanting (see Section 2.4 and Tables 2-5a and 2-5b).
2.6 Closure
Upon achieving the remedial objectives for the site and meeting all other closure requirements, a
final report can be prepared summarizing the information gained during the life of the entire
project. Reporting may include contributing to the growing database of phytotechnology
information. Two general options remains for the phytotechnology system itself. If during the
remedy selection phase (see Section 2.3) it was decided that the site is to be maintained as a
greenspace as the final disposition, then system decommissioning activities are relatively simple.
These include removal of monitoring equipment, plugging and abandoning wells, and securing a
long-term steward for the site to carry on plant upkeep and maintenance (see Section 2.5.1). This
relative simplicity is one of the main advantages in selecting phytotechnologies over other
alternatives in that restoration is accomplished or highly advanced towards a final state while the
remediation is occurring, leaving less to do at the conclusion of the project.
The other general option is if during the remedy selection phase it was decided that the site is to
be converted into a different end use where the vegetation will have to be removed. In this less
likely case, decommissioning activities also require plant removal and possibly the removal of
some infrastructure items such as the irrigation system, breather tubes, borehole casings,
fencing/netting, etc. If these are to be removed at the conclusion of the project, this process
should be considered in the design of the system (see Section 2.4), particularly for in-ground
components. Furthermore, when removing vegetation, sampling may be necessary to determine
plant disposal requirements or financial opportunities (see Sections 2.5.1.3 and 2.5.3.3). Other
activities such as stump removal, clearing and grubbing, and soil stockpiling will likely be
identical to any other construction project.
3. CHALLENGES
Challenge 1. If a phytotechnology project requires contaminated groundwater to be pumped to
the surface as irrigation for the plants, a RCRA permit may be necessary. Although EPA has
granted an exemption to allow “treated” groundwater to be reinjected, it should be clarified for a
site whether pumping contaminated groundwater to the surface as irrigation to plants constitutes
“treatment,” thereby satisfying the requirement of RCRA 3020(b). It is also not clear whether this
requirement would apply to non-CERCLA or non-RCRA sites such as state remedial and
voluntary cleanup sites. Even if a RCRA permit is not necessary, many states require a permit or
approval by the appropriate regulatory authority. For this reason, it is crucial that communication
be established with the appropriate regulatory authority while in the planning phases of a project.
Challenge 2. In addition, if a project requires excavation or removal of contaminated soil from
one area to another, it is considered land disposal (pursuant to Title 40 Code of Federal
Regulations [CFR], Part 268), and a RCRA permit is required. However, RCRA 3000(k) does
not consider movement of contaminated media within a defined area of contamination as land
disposal. Pursuant to 40 CFR 264 Subpart S, this exemption was extended to corrective action

ITRC — Phytotechnology Technical and Regulatory Guidance and Decision Trees, Revised February 2009
114
management units. It is not clear whether soil moved from one area to another within the disposal
site during a phytotechnology project is exempt from this requirement. However, ITRC 2003a
offers an example of a similar situation for soils berms at small arms firing ranges: “It is
USEPA’s position that ranges that reclaim and recycle lead bullets or lead shot may place the soil
that is generated during the reclamation process back onto an active range on the same property
or facility or a property adjacent to and under the same ownership as the property where the soils
originated, without testing the soil for hazardous waste characteristics.”
Challenge 3. Similarly, federal and state regulations have long dictated not only the application
of a landfill cover as a remedial alternative, but also its actual technical design. RCRA is the
controlling federal law for both municipal solid waste and hazardous waste landfills. RCRA
regulations require that the final cover have permeability no greater than 1 10–5
cm/sec. This
permeability requirement applies for both municipal solid waste and hazardous waste landfills
(RCRA Subtitle D and C, respectively). However, at several points in 40 CFR Subchapter I, Parts
260–279 the regulations indicate “alternative regulatory requirements may be used to supplant
the more prescriptive regulations” (ITRC 2003c, Section 2.2.1). See ITRC 2003c for the proper
application of ET covers.
Challenge 4. During the implementation/growth stage of a remediation project using
phytotechnologies, the project should clearly focus on managing potential exposure.
4. BIBLIOGRAPHY AND REFERENCES
Adler, T. 1996. “Botanical Cleanup Crews,” Science News 150: 42–43.
Allen, R. G., M. E. Jensen, J. L. Wright, and R. D. Burman. 1989. “Operational Estimates of
Reference Evapotranspiration,” Agronomy Journal 81(4): 650–62.
Allen, R. G., L. S. Pereira, D. Raes, and M. Smith. 1998. Crop Evapotranspiration: Guidelines
for Computing Crop Water Requirements. Irrigation and Drainage Paper 56. Rome: Food and
Agriculture Organization of the United Nations.
Anderson, T. A., E. A. Guthrie, B. T. Walton. 1993. “Bioremediation in the Rhizosphere,”
Environmental Science and Technology 27: 2630–36.
Anderson, T. A., E. L. Kruger, and J. R. Coats. 1994. “Biological Degradation of Pesticide
Wastes in the Root Zone of Soils Collected at an Agrochemical Dealership,” in
Bioremediation Through Rhizosphere Technology, ACS Symposium Series 563, T. A.
Anderson and J. R. Coats, eds. Washington, D.C.: American Chemical Society.
Anderson, T. A., and B. T. Walton. 1991. “Fate of Trichloroethylene in Soil-Plant Systems,”
pp. 197–200 in American Chemical Society, Division of Environmental Chemistry, Extended
Abstracts.
Anderson, T. A., and B. T. Walton. 1992. Comparative Plant Uptake and Microbial Degradation
of Trichloroethylene in the Rhizospheres of Five Plant Species: Implication for
Bioremediation of Contaminated Surface Soils. ORNL/TM-12017. Oak Ridge, Tenn.: Oak
Ridge National Laboratory, Environmental Sciences Division.

ITRC — Phytotechnology Technical and Regulatory Guidance and Decision Trees, Revised February 2009
115
Anderson, T. A., and B. T. Walton. 1995. “Comparative Fate of 14
C Trichloroethylene in the
Root Zone of Plants from a Former Solvent Disposal Site,” Environmental Toxicology and
Chemistry 14: 2041–47.
Applied Natural Sciences, Inc. 1997. Site Data Information. Fairfield, Ohio: Applied Natural
Sciences, Inc.
Aprill, W., and R. C. Sims. 1990. “Evaluation of the Use of Prairie Grasses for Stimulating
Polycyclic Aromatic Hydrocarbon Treatment in Soils,” Chemosphere 20: 253–65.
Argonne National Laboratory. 1998. “Worth Their Salt: New Ways to Treat Produced Water,”
Tech Transfer Highlights 9: 1–2.
Arnold, C. W., D. G. Parfitt, and M. Kaltreider. 2007. “Phytovolatilization of Oxygenated
Gasoline-Impacted Groundwater at an Underground Storage Tank Site via Conifers,”
International Journal of Phytoremediation 9: 53–69.
ARRIBPP (All-Russian Research Institute of Biological Plant Protection). 2004. Optimization
and Validation of Bioremediation of Oilfield Contamination by an Integrated Microbial and
Plant System. First Quarterly Report to Argonne National Laboratory and U.S. Industry
Coalition Partners for Project ANL-T2-0227-RU.
Baker, A. J. M., R. R. Brooks, and R. D. Reeves. 1988. “Growing for Gold ... and Copper ... and
Zinc,” New Science 177: 44–48.
Banks, K., and P. Schwab. 1998. “Phytoremediation in the Field: Craney Island Site,” presented
at the 3rd
Annual International Conference on Phytoremediation, Houston.
Bañuelos, G. S. 2000. “Factors Influencing Field Phytoremediation of Selenium-Laden Soils,”
pp. 41–59 in Phytoremediation of Contaminated Soil and Water, N. Terry and G. S.
Bañuelos, eds. Boca Raton, Fla.: CRC Press.
Bañuelos, G. S., H. A. Ajwa, L. Wu, and S. Zambrzuski. 1998. “Selenium Accumulation by
Brassica napus Grown in Se-Laden Soil from Different Depths of Kesterson Reservoir,”
Journal of Soil Contamination 7: 481–96.
Barnett, M., and A. Hawkins. 2007. The Effect of Soil Properties on Toxic Metal Bioavailability:
Field-Scale Validation to Support Regulatory Acceptance. Technology Demonstration Plan
ESTCP ER-0517. Oak Ridge, Tenn.: Oak Ridge National Laboratory, Environmental
Sciences Division.
Bell, J. N. B., M. J. Minski, and H. A. Grogan. 1988. “Plant Uptake of Radionuclides,” Soil Use
Management 4: 76–84.
Black, H. 1995. “Absorbing Possibilities: Phytoremediation,” Environmental Health
Perspectives 103: 1106–08.
Blaylock, M. J., D. E. Salt, S. Dushenkov, O. Zakharova, C. Gussman, Y. Kapulnik, B. D.
Ensley, and I. Raskin. 1997. “Enhanced Accumulation of Pb in Indian Mustard by Soil-
Applied Chelating Agents,” Environmental Science and Technology 31: 860–65.
BNL (Brookhaven National Laboratory). 1999. “Striking Results from Brookhaven Ecology
Facility: Trees Grow Faster in Simulated Future CO2-Rich Atmosphere.” Press Release 99-
43. Upton, N.Y.: Brookhaven National Laboratory. www.bnl.gov/bnlweb/pubaf/pr/1999/
bnlpr051399.html
Bonet, A., C. Poschenrieder, and J. Barcelo. 1991. “Chromium III-Iron Interaction in Fe-
ITRC — Phytotechnology Technical and Regulatory Guidance and Decision Trees, Revised February 2009
116
Deficient and Fe-Sufficient Bean Plants, I. Growth and Nutrient Content,” Journal of Plant
Nutrition 14: 403–14.
Briggs, G. G., R. H. Bromilow, and A. A. Evans. 1982. “Relationship between Lipophilicity and
Root Uptake and Translocation of Non-Ionized Chemicals by Barley,” Pesticide Science 13:
495–504.
Bunzl, K., and W. Kracke. 1984. “Distribution of 210
Pb, 210
Po, Stable Lead, and Fallout 137
Cs in
Soil, Plants, and Moorland Sheep on the Heath,” Science of Total Environment 39: 143–59.
Burken, J. G., and J. L. Schnoor. 1997a. “Uptake and Fate of Organic Contaminants by Hybrid
Poplar Trees,” pp. 302–04 (Paper #106) in Proceedings, 213th
ACS National Meeting,
American Chemical Society Environmental Division Symposia, San Francisco.
Burken, J. G., and J. L. Schnoor. 1997b. “Uptake and Metabolism of Atrazine by Poplar Trees,”
Environmental Science and Technology 31: 1399–1406.
Cai, X.-H., C. Brown, J. Adhiya, S. J. Traina, and R. T. Sayre. 1999. “Growth and Heavy Metal
Binding Properties of Transgenic Chlamydomonas Expressing a Foreign Metallothionen
Gene,” International Journal of Phytoremediation 1: 53–66.
Campbell, R., and M. P. Greaves. 1990. “Anatomy and Community Structure of the
Rhizosphere,” in The Rhizosphere. West Sussex, U.K.: Wiley & Sons.
Carbonell-Barrachina, A. A., F. Burlo-Carbonell, and J. Mataix-Beneyto. 1997. “Arsenic Uptake,
Distribution, and Accumulation in Bean Plants: Effect of Arsenite and Salinity on Plant
Growth and Yield,” Journal of Plant Nutrition 20: 1419–30.
Carman, E. P., T. L. Crossman, and E. G. Gatliff. 1997. “Phytoremediation of Fuel Oil–
Contaminated Soil,” In Situ and On-Site Bioremediation 4(3): 347–52. Columbus, Ohio:
Battelle Press.
Carman, E. P., T. L. Crossman, and E. G. Gatliff. 1998. “Trees Stimulate Remediation at Fuel
Oil–Contaminated Site,” Soil and Groundwater Cleanup Feb./Mar.: 40–44.
Chappell, J. 1997. Phytoremediation of TCE Using Populus. Status report prepared for the U.S.
Environmental Protection Agency Technology Innovation Office under the National Network
of Environmental Management Studies.
Chappell, J. 1998. Phytoremediation of TCE in Groundwater Using Populus. Status report
prepared for the U.S. Environmental Protection Agency Technology Innovation Office.
http://clu-in.org/products/phytotce.htm
Chard, J. K., B. J. Orchard, C. J. Pajak, W. J. Doucette, and B. Bugbee. 1998. “Design of a Plant
Growth Chamber for Studies on the Uptake of Volatile Organic Compounds,” p. 75 (Abstract
P42), Proceedings, Conference on Hazardous Waste Research, Snow Bird, Utah.
Chaudhry, F. M., A. Wallace, and R. T. Mueller. 1977. “Barium Toxicity in Plants,”
Communications in Soil Science and Plant Analysis 8: 795–97.
Christensen-Kirsh, K. M. 1996. Phytoremediation and Wastewater Effluent Disposal: Guidelines
for Landscape Planners and Designers. M. A. thesis, University of Oregon.
Cipollini, M. L., and J. L. Pickering. 1986. “Determination of the Phytotoxicity of Barium in
Leach-Field Disposal of Gas Well Brines,” Plant and Soil 92: 159–69.
Clulow, F. V., T. P. Lim, N. K. Dave, and R. Avadhanula. 1992. “Radium-226 Levels and
Concentration Ratios between Water, Vegetation, and Tissues of Ruffed Grouse (Bonasa

ITRC — Phytotechnology Technical and Regulatory Guidance and Decision Trees, Revised February 2009
117
umbellus) from a Watershed with Uranium Tailings near Elliot Lake, Canada,”
Environmental Pollution 77: 39–50.
Compton, H. R., D. M. Haroski, S. R. Hirsh, and J. G. Wrobel. 1998. “Pilot-Scale Use of Trees
to Address VOC Contamination,” pp. 245–50 in Bioremediation and Phytoremediation,
Chlorinated and Recalcitrant Compounds, G. B. Wickramanayake and R. E. Hinchee, eds.
Columbus, Ohio: Battelle Press.
Coughtery, P. J., J. A. Kirton, and N. G. Mitchell. 1989. “Transfer of Radioactive Cesium from
Soil to Vegetation and Comparison with Potassium in Upland Grasslands,” Environmental
Pollution 62: 281–315.
Cunningham, S. D., and W. R. Berti. 1993. “Remediation of Contaminated Soils with Green
Plants: An Overview,” In Vitro Cellular and Developmental Biology–Plant 29P: 207–12.
Dahlman, R. C., S. I. Auerbach, and P. B. Dunaway. 1969. Environmental Contamination by
Radioactive Materials. Vienna: International Atomic Energy Agency and World Health
Organization.
Davis, L. C., N Muralidharan, V. P. Visser, C. Chaffin, W. G. Fateley, L. E. Erickson, and R. M.
Hammaker. 1994. “Alfalfa Plants and Associated Microorganisms Promote Biodegradation
Rather than Volatilization of Organic Substances from Groundwater,” in Bioremediation
Through Rhizosphere Technology, T. A. Anderson and J. R. Coats, eds. ACS Symposium
Series 563. Washington, D.C.: American Chemical Society.
de Gouw, J. A., C. J. Howard, T. G. Custer, B. M. Baker, and R. Fall. 2000. “Proton-Transfer
Chemical-Ionization Mass Spectrometry Allows Real-Time Analysis of Volatile Organic
Compounds Released from Cutting and Drying of Crops,” Environmental Science and
Technology 34(12): 2640–48.
Dhankher, O. P., J. L. Tucker, V. A. Nzengung, and N. L. Wolfe. 1999. “Isolation, Purification,
and Partial Characterization of Plant Dehalogenase-Like Activity from Waterweed (Elodea
canadensis),” pp. 145–50 in Phytoremediation and Innovative Strategies for Specialized
Remedial Applications, vol. 6, A. Leesan and B. C. Alleman, eds. Columbus, Ohio: Battelle
Press.
Dickmann, D., J. Isebrands, J. Echenwalder, and J. Richardson, eds. 2001. Poplar Culture in
North America. Ottawa: NRC Research Press.
Dickmann, D., and K. Stuart. 1983. The Culture of Poplars in Eastern North America. Ann
Arbor, Mich.: Michigan State University.
Dodge, C. J., and A. J. Francis. 1997. “Biotransformation of Binary and Ternary Citric Acid
Complexes of Iron and Uranium,” Environmental Science and Technology 31: 3062–67.
Domenico, P. A., and F. W. Schwartz. 1997. Physical and Chemical Hydrogeology. New York:
Wiley.
Donnelly, P. K., and J. S. Fletcher. 1994. “Potential Use of Mycorrhizal Fungi as Bioremediation
Agents,” in Bioremediation Through Rhizosphere Technology, T. A. Anderson and J. R.
Coats, eds. Washington, D.C.: American Chemical Society.
Doty, S. L., A. J. James, A. L. Moore, A. Vajzovic, G. L. Singleton, C. Ma, Z. Khan, G. Xin, J.
W. Kang, J. Y. Park, R. Meilan, S. H. Strauss, J. Wilkerson, F. Farin, and S. E. Strand. 2007.

ITRC — Phytotechnology Technical and Regulatory Guidance and Decision Trees, Revised February 2009
118
“Enhanced Phytoremediation of Volatile Environmental Pollutants with Transgenic Trees,”
Applied Biological Sciences 104(43): 16816–21. http://www.pnas.org/content/104/43/16816
Doty, S. L., Q.-T. Shang, A. M., Wilson, J. Tangen, A. D. Westergreen, L. A. Newman, S. E.
Strand, and M. P. Gordon. 2000. “Enhanced Metabolism of Halogenated Hydrocarbons in
Transgenic Plants Containing P450 IIE1,” presented at the 2nd
International Conference on
Remediation of Chlorinated and Recalcitrant Compounds, May 22–25, Monterey, Calif.
Dragun, J. 1998. The Soil Chemistry of Hazardous Materials, 2nd
ed. Amherst, Mass.: Amherst
Scientific Publishers.
Dushenkov, S., Y. Kapulnik, M. Blaylock, B. Sorochinsky, I. Raskin, and B. Ensley. 1997a.
“Phytoremediation: A Novel Approach to an Old Problem,” pp. 563–72 in Global
Environmental Biotechnology, D. L. Wise, ed. Amsterdam: Elsevier Science B. V.
Dushenkov, S., D. Vasudev, Y. Kapulnik, D. Gleba, D. Fleisher, K. C. Ting, and B. Ensley
1997b. “Removal of Uranium from Water Using Terrestrial Plants,” Environmental Science
and Technology 31: 3468–74.
Dushenkov, V., P. B. A. N. Kumar, H. Motto, I. Raskin. 1995. “Rhizofiltration: The Use of
Plants to Remove Heavy Metals from Aqueous Streams,” Environmental Science and
Technology 29: 1239–45.
Ehleringer, J. R., and T. E. Dawson. 1992. “Water Uptake by Plants: Perspectives from Stable
Isotope Composition,” Plant, Cell, and Environment 15: 1073–82.
Entry, J. A., and W. H. Emmingham. 1995. “Sequestration of 137
Cs and 90
Sr from Soil by
Seedlings of Eucalyptus tereticornis,” Canadian Journal of Forest Research 25: 1044–47.
Entry, J. A., P. T. Rygiewicz, and W. H. Emmingham. 1993. “Accumulation of Cesium-137 and
Strontium-90 in Ponderosa Pine and Monterey Pine Seedlings,” Journal of Environmental
Quality 22: 742–46.
Entry, J. A., N. C. Vance, M. A. Hamilton, D. Zabowski, L. S. Watrud, and D. C. Adriano. 1996.
“Phytoremediation of Soil Contaminated with Low Concentrations of Radionuclides,” Water,
Air, and Soil Pollution 88: 167–76.
“Fern Soaks Up Arsenic with Staggering Efficiency,” Environmental Data Interactive Exchange
Weekly Summaries 02/02/2001. www.edie.net/news/news_story.asp?id=3762
Ferro, A. M. 1998. “Biological Pump and Treat Systems Using Poplar Trees,” presented at the
IBC 3rd
Annual International Conference on Phytoremediation, Houston.
Ferro, A., J. Cassada, B. Berra, and D. Tsao. 2006. “Phytoremediation of TPH-Contaminated
Groundwater,” presented at the Annual International Conference on Soils, Sediments, and
Water, University of Massachusetts, Amherst.
Ferro, A. M., J. Kennedy, W. Doucette, S. Nelson, G. Jauregui, B. McFarland, and B. Bugbee.
1997. “Fate of Benzene in Soils Planted with Alfalfa: Uptake, Volatilization, and
Degradation,” pp. 223–37 in Phytoremediation of Soil and Water Contaminants, E. L.
Kruger, T. A. Anderson, and J. R. Coats, eds. ACS Symposium Series No. 664. Washington,
D.C.: American Chemical Society.
Ferro, A. M., J. Kennedy, and D. Knight. 1997. “Greenhouse-Scale Evaluation of
Phytoremediation for Soils Contaminated with Wood Preservatives,” In Situ and On-Site
Bioremediation 4(3): 309–14. Columbus, Ohio: Battelle Press.
ITRC — Phytotechnology Technical and Regulatory Guidance and Decision Trees, Revised February 2009
119
Ferro, A. M., S. A. Rock, J. Kennedy, and J. J. Herrick. 1999. “Phytoremediation of Soils
Contaminated with Wood Preservatives: Greenhouse and Field Evaluations,” International
Journal of Phytoremediation 1(3): 289–306.
Ferro, A. M., R. C. Sims, and B. Bugbee. 1994. “Hycrest Crested Wheatgrass Accelerates the
Degradation of Pentachlorophenol in Soils,” Journal of Environmental Quality 23: 272–79.
Ferro, A. M., F. Thomas, C. Olson, and D. Tsao. 2002. “Assessment of Groundwater Use by
Phreatophytic Trees and Sap Flow Measurements,” internal progress report for the
phytoremediation system at the C-Plant Site, Texas City, Tex.
Fiorenza, S., F. Thomas, L. Rhea, and D. Tsao. 2005. “Groundwater Plume Delineation Using
Tree Trunk Cores,” presented at the 3rd
International Phytotechnologies Conference, Atlanta.
Flathman, P. E, and G. R. Lanza. 1998. “Phytoremediation: Current Views on an Emerging
Green Technology,” Journal of Soil Contamination 7: 415–32.
Fletcher, J. S. 2000. “Biosystem Treatment of Recalcitrant Soil Contaminants,” presented at the
U.S. Environmental Protection Agency Phytoremediation State of the Science Conference,
Boston.
Flint, H. L. 1983. Landscape Plants for Eastern North America. New York: Wiley.
Frick, C., R. Farrell, and J. Germida. 1999. Assessment of Phytoremediation as an In Situ
Technique for Cleaning Oil-Contaminated Sites. Calgary, Alberta: Petroleum Technology
Alliance of Canada.
Frick, C., R. Farrell, and J. Germida. 2000. “Phyto-Pet: A Database of Plants that Play a Role in
the Phytoremediation of Petroleum Hydrocarbons.” CD-ROM developed by the University of
Saskatchewan in Cooperation with Environment Canada and Petroleum Technology Alliance
of Canada.
Gao, J., A. W. Garrison, C. Hoehamer, C. Mazur, and N. L. Wolfe. 1998. “Bioremediation of
Organophosphate Pesticides Using Axenic Plant Tissue Cultures and Tissue Extracts,” poster
abstract at the 3rd
Annual International Conference on Phytoremediation, Houston.
Gardea-Torresdey, J. L., S. Sias, K. J. Tiemann, A. Hernandez, O. Rodriguez, and J. Arenas.
1998a. “Evaluation of Northern Chihuahuan Desert Plants for Phytoextraction of Heavy
Metals from Contaminated Soils,” pp. 26–27 (Abstract 39), Proceedings, Conference on
Hazardous Waste Research, Snow Bird, Utah.
Gardea-Torresdey, J. L., K. J. Tiemann, G. Gamez, K. Dokken, and M. J. Yacaman. 1998b.
“Innovative Technology to Recover Gold(II) from Aqueous Solutions by Using Medicago
sativa (Alfalfa),” pp. 59–60 (Abstract P16), Proceedings, Conference on Hazardous Waste
Research, Snow Bird, Utah.
Gaskell, G. 2000. “Agricultural Biotechnology and Public Attitudes in the European Union,”
AgBioForum 3(2–3): 87–96 www.agbioforum.org/v3n23/v3n23a04-gaskell.htm
Gatliff, E. G. 1994. “Vegetative Remediation Process Offers Advantages over Traditional Pump-
and-Treat Technologies,” Remediation 4(3): 343–52.
Gee, G. 1998. Reported in “Summary of the Remediation Technologies Development Forum
Alternative Covers Assessment Program Workshop,” Desert Research Institute, Las Vegas.
www.rtdf.org/public/phyto/minutes/altcov/Alt21798.htm

ITRC — Phytotechnology Technical and Regulatory Guidance and Decision Trees, Revised February 2009
120
Glass, D. J. 1998. The 1998 United States Market for Phytoremediation. Needham, Mass.: A. D.
Glass Associates, Inc.
Goldsmith, W. 1998. “Lead-Contaminated Sediments Prove Susceptible to Phytoremediation,”
Soil and Groundwater Cleanup Feb./Mar.: 15–18.
Gordon, M. P., N. Choe, J. Duffy, G. Ekuan, P. Heilman, I. Muiznieks, L. Newman, M. Ruszaj,
B. Shurtleff, S. Strand, and J. Wilmoth. 1997. “Phytoremediation of Trichloroethylene with
Hybrid Poplars,” pp. 177–85 in Phytoremediation of Soil and Water Contaminants, E. L.
Kruger, T. A. Anderson, and J. R. Coats. eds. ACS Symposium Series No. 664. Washington,
D.C.: American Chemical Society.
Gordon, M. P., S. Strand, and L. Newman. 1998. Final Report: Degradation of Environmental
Pollutants by Plants. U.S. Environmental Protection Agency, National Center for
Environmental Research, Office of Research and Development.
Green, S., B. Clothier, and B. Jardine. 2003. “Theory and Practical Application of Heat Pulse to
Measure Sap Flow,” Agronomy Journal 95: 1371–79.
Harvey, G. 1998. “How to Evaluate the Efficacy and Cost at the Fields Scale,” presented at the
3rd
Annual International Conference on Phytoremediation, Houston.
Hawari, J. 2000. “Biodegradation of RDX and HMX: From Basic Research to Field
Application,” pp. 277–310 in Biodegradation of Nitroaromatic Compounds and Explosives,
J. C. Spain and H. J. Knackmuss, eds. New York: Lewis.
Hayhurst, S. C., W. J. Doucette, B. J. Orchard, C. J. Pajak, B. Bugbee, and G. Koerner. 1998.
“Phytoremediation of Trichloroethylene: A Field Evaluation,” p. 74 (Abstract P40) in
Proceedings, Conference on Hazardous Waste Research, Snow Bird, Utah.
Heaton, C. P., C. L. Rugh, N.-J. Wang, and R. B. Meagher. 1998. “Phytoremediation of Mercury-
and Methylmercury-Polluted Soils Using Genetically Engineered Plants,” Journal of Soil
Contamination 7: 497–509.
Hewamanna, R., C. M. Samarakoon, and P. A. V. N. Karunaratne. 1988. ”Concentration and
Chemical Distribution of Radium in Plants from Monazite-Bearing Soils,” Environmental
and Experimental Botany 28: 137–43.
Hinchman, R. R., M. C. Negri, and E. G. Gatliff. 1997. Phytoremediation: Using Green Plants to
Clean Up Contaminated Soil, Groundwater, and Wastewater. Submitted to the U.S.
Department of Energy, Assistant Secretary for Energy Efficient and Renewable Energy under
Contract W-31-109-Eng-38.
Hirsh, S., H. Compton, D. Matey, J. Wrobel, and W. Schneider. 2003. “Five-Year Pilot Study:
Aberdeen Proving Ground, Maryland,” in Phytoremediation Transformation and Control of
Contaminants, S. McCutcheon and J. Schnoor, eds. Hoboken, N.J.: Wiley & Sons.
Hoagland, R. E., R. M. Zablotowicz, and M. A. Locke. 1994. “Propanil Metabolism by
Rhizosphere Microflora,” in Bioremediation Through Rhizosphere Technology, T. A.
Anderson and J. R. Coats, eds. ACS Symposium Series 563. Washington, D.C.: American
Chemical Society.
Hsu, T. S., and R. Bartha. 1979. “Accelerated Mineralization of Two Organophosphate
Insecticides in the Rhizosphere,” Applied Environmental Microbiology 37: 36–41.

ITRC — Phytotechnology Technical and Regulatory Guidance and Decision Trees, Revised February 2009
121
ITRC (Interstate Technology & Regulatory Council). 1998. Technical and Regulatory
Requirements for Enhanced In Situ Bioremediation of Chlorinated Solvents in Groundwater.
ISB-6. Washington, D.C.: Interstate Technology & Regulatory Council, In Situ
Bioremediation Team. www.itrcweb.org
ITRC. 1999. Natural Attenuation of Chlorinated Solvents in Groundwater: Principles and
Practices. ISB-3. Washington, D.C.: Interstate Technology & Regulatory Council, In Situ
Bioremediation Team. www.itrcweb.org
ITRC. 2003a. Characterization and Remediation of Soils at Closed Small Arms Firing Ranges.
SMART-1. Washington, D.C.: Interstate Technology & Regulatory Council, Small Arms
Firing Range Team. www.itrcweb.org
ITRC. 2003b. Technical and Regulatory Guidance Document for Constructed Treatment
Wetlands. WTLND-1. Washington, D.C.: Interstate Technology & Regulatory Council,
Wetlands Team. www.itrcweb.org
ITRC. 2003c. Technical and Regulatory Guidance for Design, Installation, and Monitoring of
Alternative Final Landfill Covers. ALT-2. Washington, D.C.: Interstate Technology &
Regulatory Council, Alternative Landfill Technologies Team. www.itrcweb.org
ITRC. 2003d. Technology Overview Using Case Studies of Alternative Landfill Technologies and
Associated Regulatory Topics. ALT-1. Washington, D.C.: Interstate Technology &
Regulatory Council, Alternative Landfill Technologies Team. www.itrcweb.org
ITRC. 2005a Characterization, Design, Construction, and Monitoring of Mitigation Wetlands,
WTLND-2. Washington, D.C.: Interstate Technology & Regulatory Council, Mitigation
Wetlands Team. www.itrcweb.org
ITRC. 2005b. Examination of Risk-Based Screening Values and Approaches of Selected States.
RISK-1. Washington, D.C.: Interstate Technology & Regulatory Council, Risk Assessment
Resources Team. www.itrcweb.org
ITRC. 2006a. Characterization, Design, Construction, and Monitoring of Bioreactor Landfills.
ALT-3. Washington, D.C.: Interstate Technology & Regulatory Council, Alternative Landfill
Technologies Team. www.itrcweb.org
ITRC. 2006b. Evaluating, Optimizing, or Ending Post-Closure Care at MSW Landfills Based on
Site-Specific Data Evaluation. ALT-4. Washington, D.C.: Interstate Technology &
Regulatory Council, Alternative Landfill Technologies Team. www.itrcweb.org
ITRC. 2006c. Planning and Promoting Ecological Land Reuse of Remediated Sites. ECO-2.
Washington, D.C.: Interstate Technology & Regulatory Council, Ecological Land Reuse
Team. www.itrcweb.org
ITRC. 2007a. In Situ Bioremediation of Chlorinated Ethene DNAPL Source Zones: Case Studies.
BIODNAPL-2. Washington, D.C.: Interstate Technology & Regulatory Council,
Bioremediation of DNAPLs Team. www.itrcweb.org
ITRC. 2007b. Triad Implementation Guide. SCM-3. Washington, D.C.: Interstate Technology &
Regulatory Council; Sampling, Characterization, and Monitoring Team. www.itrcweb.org
ITRC. 2008. Enhanced Attenuation: Chlorinated Organics. EACO-1. Washington, D.C.:
Interstate Technology & Regulatory Council, Enhanced Attenuation: Chlorinated Organics
Team. www.itrcweb.org

ITRC — Phytotechnology Technical and Regulatory Guidance and Decision Trees, Revised February 2009
122
Javandel, I., and C.-F. Tsang. 1986. “Capture-Zone Type Curves: A Tool for Aquifer Cleanup,”
Groundwater 24: 616–25.
Kadlec, R. H., and R. L. Knight. 1996. Treatment Wetlands. Boca Raton, Fla.: CRC Press, Lewis
Publishers.
Kadlec, R. H., and R. L. Knight. 1998. Creating and Using Wetlands for Wastewater and
Stormwater Treatment and Water Quality Improvement, Part I. Treatment Wetlands.
Madison, Wis.: University of Wisconsin–Madison Department of Engineering.
Keiffer, C. H. 1996. Comparison of Salt Tolerance and Ion Accumulation of Halophytes and
Their Potential Use for Remediating Brine Contaminated Soil. Ph.D. dissertation. College of
Arts and Sciences of Ohio University, Athens.
Keiffer, C. H., and I. A. Ungar. 1996. Bioremediation of Brine Contaminated Soils. Final Report,
PERF Project #91-18.
Klassen, S. P., J. E. McLean, P. R. Grossl, and R. C. Sims. 1998. “An Investigation of Plant
Species Native to the Intermountain West for Use in the Phytoremediation of Lead
Contaminated Soils,” p. 25 (Abstract 37) in Proceedings, Conference on Hazardous Waste
Research, Snow Bird, Utah.
Koch, I., L. Wang, C. A. Ollson, W. R. Cullen, and K. J. Reimer. 2000. “The Predominance of
Inorganic Arsenic Species in Plants from Yellowknife, Northwest Territories, Canada,”
Environmental Science and Technology 34: 22–26.
Kolhatkar, A. R., D. T. Tsao, L. Diaz Del Castillo, and F. Thomas. 2006. “Use of a Bromide
Tracer to Demonstrate Uptake of Groundwater by Trees,” Research Disclosure, Number
509016.
Kolhatkar, A. R., D. T. Tsao, L. Diaz Del Castillo, and F. Thomas. 2007. “Demonstrating
Effectiveness of a Phytoremediation System Used for Hydraulic Control: A Greenhouse
Study,” presented at the 4th
International Phytotechnologies Conference, Denver.
Komisar, S. J., and J. Park. 1997. “Phytoremediation of Diesel-Contaminated Soil Using
Alfalfa,” In Situ and On-Site Bioremediation 4(3): 331–35. Columbus, Ohio: Battelle Press.
Kumar, P. B. A. N., V. Dushenkov, H. Motto, and I. Raskin. 1995. “Phytoextraction: The Use of
Plants to Remove Heavy Metals from Soils,” Environmental Science and Technology 29:
1232–38.
Landmeyer, J. E. 2000. “Effects of Woody Plants on Ground-Water Hydrology and Contaminant
Concentrations,” presented at the U.S. Environmental Protection Agency Phytoremediation
State of the Science Conference, Boston.
Landmeyer, J. E., D. A. Vroblesky, and P. M. Bradley. 2000. “MTBE and BTEX in Trees above
Gasoline-Contaminated Groundwater,” pp. 17–24 in Case Studies in the Remediation of
Chlorinated and Recalcitrant Compounds, G. B. Wichramanayake, A. R. Gavaskar, J. T.
Gibbs, and J. L Means, eds. Columbus, Ohio: Battelle Press.
Lazaroff, C. 2002. “U.S. Regulation of Transgenic Plants Called Inadequate.” Environmental
News Service. www.ens-newswire.com/ens/feb2002/2002-02-22-06.asp
Licht, L. A. 1993. “Ecolotree Cap: Densely Rooted Trees for Water Management on Landfill
Covers,” presented at Air and Waste Management Association, Denver.

ITRC — Phytotechnology Technical and Regulatory Guidance and Decision Trees, Revised February 2009
123
Ma, L. Q., K. M. Komar, C. Tu, W. Zhang, Y. Cai, and E. D. Kennelley, 2001. “A Fern that
Hyperaccumulates Arsenic,” Nature 409: 579.
Ma, X., and J. G. Burken. 2002. “VOCs Fate and Partitioning in Vegetation: Use of Tree Cores
in Groundwater Analysis,” Environmental Science and Technology 36(21): 4663–68.
Ma, X., A. R. Richter, S. Albers, and J. G. Burken. 2004. “Phytoremediation of MTBE with
Hybrid Poplar Trees,” International Journal of Phytoremediation 6(2): 157–67.
Macklon, A. E. S., and A. Sim. 1990. “Cortical Cell Fluxes of Cobalt in Roots and Transport to
the Shoots of Ryegrass Seedlings,” Physiologia Plantarum 80: 409–16.
Martin, H. W., T. R. Young, D. I. Kaplan, L. Simon, and D. C. Adriano. 1996. “Evaluation of
Three Herbaceous Index Plant Species for Bioavailability of Soil Cadmium, Chromium,
Nickel, and Vanadium,” Plant and Soil 182: 199–207.
Matso, K. 1995. “Mother Nature’s Pump and Treat,” Civil Engineering 65(10): 46–49.
McCutcheon, S. C., N. L. Wolfe, L. H. Carreriaand, T. Y. Ou. 1995. “Phytoremediation of
Hazardous Wastes,” pp. 597–604 in Innovative Technologies for Site Remediation and
Hazardous Waste Management: Proceedings of the National Conference, R. D. Vidic and F.
G. Pohland, eds. New York: American Society of Civil Engineers.
McIntyre, T. 2001. PhytoRem: A Global CD-ROM Database of Aquatic and Terrestrial Plants
that Sequester, Accumulate, or Hyperaccumulate Heavy Metals. Hull, Quebec: Environment
Canada.
McIntyre, T. 2003. “Phytoremediation of Heavy Metals from Soils,” in Advances in Biochemical
Engineering and Biotechnology, vol. 78, D. T. Tsao, ed. Berlin: Springer-Verlag.
Meagher, R. B., and C. Rugh. 1996. “Phytoremediation of Mercury Pollution Using a Modified
Bacterial Mercuric-Ion Reductase Gene,” presented at the International Phytoremediation
Conference, Arlington, Va.
Meagher, R. B., C. Rugh, D. Wilde, M. Wallace, S. Merkle, and A. O. Summers. 1995.
“Phytoremediation of Toxic Heavy Metal Ion Contamination: Expression of a Modified
Bacterial Mercuric Ion Reductase in Transgenic Arabidopsis Confers Reduction of and
Resistance to High Levels of Ionic Mercury,” pp. 29–30 in Proceedings/Abstracts of the 14th
Annual Symposium, Current Topics in Plant Biochemistry, Physiology, and Molecular
Biology—Will Plants Have a Role in Bioremediation? Interdisciplinary Plant Group,
University of Missouri, Columbia.
Medina, V. F., S. L. Larson, W. Perez, and L. E. Agwaramgbo. 2000. “Evaluation of Minced and
Pureed Plants for Phytotreatment of Munitions,” presented at the 2nd
International Conference
on Remediation of Chlorinated and Recalcitrant Compounds, Monterey, Calif.
Million, J. B., J. B. Sartain, R. X. Gonzalez, and W. D. Carrier III. 1994. “Radium-226 and
Calcium Uptake by Crops Grown in Mixtures of Sand and Clay Tailings from Phosphate
Mining,” Journal of Environmental Quality 23: 671–76.
Mills, M. A., J. S. Bonner, T. J. MacDonald, and R. L. Autenreith. 1997. “Bioremediation of an
Experimental Oil Spill in a Wetland,” In Situ and On-Site Bioremediation 4(3): 355–60.
Columbus, Ohio: Battelle Press.

ITRC — Phytotechnology Technical and Regulatory Guidance and Decision Trees, Revised February 2009
124
Mirka, M. A., F. V. Clulow, N. K. Dave, and T. P. Lim. 1996. “Radium-226 in Cattails, Typha
latifolia, and Bone of Muskrat, Ondatra zibethica (L.), from a Watershed with Uranium
Tailings Near the City of Elliot Lake, Canada,” Environmental Pollution 91: 41–51.
Moral, R., J. Navarro-Pedreno, I. Gomez, and J. Mataix. 1995. “Effects of Chromium on the
Nutrient Element Content and Morphology of Tomato,” Journal of Plant Nutrition 18: 815–
22.
Muralidharan, N., L. C. Davis, and L. E. Erickson. 1993. “Monitoring the Fate of Toluene and
Phenol in the Rhizosphere,” in Proceedings, 23rd
Annual Biochemical Engineering
Symposium, R. Harrison, ed. University of Oklahoma, Norman.
Nair, D. R., J. L. Schnoor, L. E. Erickson, L. C. Davis, and J. C. Tracy. 1992. “Beneficial Effects
of Vegetation on Biodegradation of Organic Compounds,” presented at the AIChE Summer
Meeting, Minneapolis.
Naval Facilities Engineering Service Center. 1998a. Alternative Landfill Capping. TechData
Sheet TDS-2059-ENV. Port Hueneme, Calif.: Naval Facilities Engineering Service Center.
Naval Facilities Engineering Service Center. 1998b. Constructed Wetlands: Cost-Effective
Treatment of Non-Point Source Pollution. TechData Sheet TDS-2034-ENV. Port Hueneme,
Calif.: Naval Facilities Engineering Service Center.
Negri, M. C., G. Gopalakrishnan, and C. Hamilton. 2004. 317/319 Phytoremediation Site
Monitoring Report: 2003 Growing Season. Report to Argonne National Laboratory
Environmental Remediation Program. Argonne, Ill.: U.S. Department of Energy, Argonne
Group.
Negri, M. C., R. R. Hinchman, and D. O. Johnson. 1998. “An Overview of Argonne National
Laboratory’s Phytoremediation Program,” presented at the Petroleum Environmental
Research Forum’s Spring General Meeting, Argonne National Laboratory, Argonne, Ill.
Negri, M. C., R. R. Hinchman, and J. B. Wozniak. 2000. “Capturing a Mixed Contaminant
Plume: Tritium Phytoevaporation at Argonne National Laboratory’s Area 319,” presented at
the U.S. Environmental Protection Agency Phytoremediation State of the Science
Conference, Boston.
Negri, M. C., J. Quinn, C. Hamilton, E. G. Gatliff. 2003. “Phytoremediation for Plume Control
of Deep Groundwater, presented at the International Applied Phytotechnologies Conference,
Chicago.
Nelson, S. 1996. Summary of the Workshop on Phytoremediation of Organic Contaminants. Fort
Worth, TX.
Newman, A. 1995. “Plant Enzymes Set for Bioremediation Field Study,” Environmental Science
and Technology 29: 18a.
Newman, L. A., C. Bod, R. Cortellucci, D. Domroes, J. Duffy, G. Ekuan, D. Fogel, P. Heilman,
I. Muiznieks, T. Newman, M. Ruszaj, S. E. Strand, and M. P. Gordon. 1997a. “Results from
a Pilot-Scale Demonstration: Phytoremediation of Trichloroethylene and Carbon
Tetrachloride,” abstract for the 12th
Annual Conference on Contaminated Soils, Amherst,
Mass.

ITRC — Phytotechnology Technical and Regulatory Guidance and Decision Trees, Revised February 2009
125
Newman, L. A., M. P. Gordon, P. Heilman, D. L. Cannon, E. Lory, K. Miller, J. Osgood, and S.
E. Strand. 1999a. “Phytoremediation of MTBE at a California Naval Site,” Soil and
Groundwater Cleanup Feb./Mar.: 42–45.
Newman, L. A., S. E. Strand, N. Choe, J. Duffy, G. Ekuan, M. Ruszaj, B. B. Shurtleff, J.
Wilmoth, P. Heilman, and M. P. Gordon. 1997b. “Uptake and Biotransformation of
Trichloroethylene by Hybrid Poplars,” Environmental Science and Technology 31: 1062–67.
Newman, L. A., X. Wang, I. A. Muiznieks, G. Ekuan, M. Ruszaj, R. Cortellucci, D. Domroes, G.
Karscig, T. Newman, R. S. Crampton, R. A. Hashmonay, M. G. Yost, P. E. Heilman, J.
Duffy, M. P. Gordon, and S. E. Strand. 1999b. “Remediation of Trichloroethylene in an
Artificial Aquifer with Trees: A Controlled Field Study,” Environmental Science and
Technology 33(13): 2257–65.
Nyer, E. K., and E. G. Gatliff. 1996. “Phytoremediation,” Ground Water Monitoring and
Remediation 16: 58–62.
O’Donnell, E. 1998. “Performance of a Phytoremediation Cover at a Humid Region Site,”
presented at the 3rd
Annual International Conference on Phytoremediation, Houston.
Olsen, P. E., and J. S. Fletcher. 1999. “Field Evaluation of Mulberry Root Structure with Regard
to Phytoremediation,” Bioremediation Journal 3(1): 27–33.
Olsen, R. A. 1994. “The Transfer of Radiocaesium from Soil to Plants and Fungi in Seminatural
Ecosystems,” Studies in Environmental Science 62: 265–86.
Orchard, B. J., J. K. Chard, W. J. Doucette, B. Bugbee. 1999. “Laboratory Studies on Plant
Uptake of TCE,” presented at the 5th
International In Situ and On-Site Bioremediation
Symposium, San Diego.
Orchard, B. J., J. K. Chard, C. J. Pajak, W. J. Doucette, and B. Bugbee. 1998. “Fate of TCE in
Hybrid Poplar: Studies on the Uptake, Translocations, and Transpiration,” p. 29 (Abstract 44)
in Proceedings, Conference on Hazardous Waste Research, Snow Bird, Utah.
Otabbong, E. 1990. “Chemistry of Cr in Some Swedish Soils,” Plant and Soil 123: 89–93.
Pais, I., and J. B. Jones, Jr. 1997. The Handbook of Trace Elements. Boca Raton, Fla.: St. Lucie
Press.
Paterson, K. G., and J. L. Schnoor. 1992. “Fate of Alachlor and Atrazine in Riparian Zone Field
Site,” Water Environment Research 64: 274–83.
Phytokinetics, Inc. 1998. Using Plants to Clean Up Environmental Contaminants. Logan, Utah:
Phytokinetics, Inc.
Phytotech, Inc. 1997. Phytoremediation Technical Summary. Monmouth, N.J.: Phytotech, Inc.
Pinder, J. E. III, K. W. McLeod, J. J. Alberts, D. C. Adriano, and J. C. Corey. 1984. “Uptake of 244
Cm, 238
Pu, and Other Radionuclides by Trees Inhabiting a Contaminated Floodplain,”
Health Physics 47: 375–84.
Post, W. M., R. C. Izaurralde, L. K. Mann, and N. Bliss. 1998. “Monitoring and Verifying Soil
Organic Carbon Sequestration,” in Carbon Sequestration in Soils: Science, Monitoring, and
Beyond, Proceedings of the St. Michaels Workshop, N. J. Rosenberg, R. C. Izaurralde, and E.
L. Malone eds. Columbus, Ohio: Battelle Press.
ITRC — Phytotechnology Technical and Regulatory Guidance and Decision Trees, Revised February 2009
126
Potter, S. T. 1998. “Computation of the Hydraulic Performance of a Phyto-Cover Using the
HELP Model and the Water Balance Method,” presented at the 3rd
Annual International
Conference on Phytoremediation, Houston.
Pradhan, S. P., J. R. Conrad, J. R. Paterek, and V. J. Srinistava. 1998. “Potential of
Phytoremediation for Treatment of PAHs in Soil at MGP Sites,” Journal of Soil
Contamination 7: 467–80.
Reddy, B. R., and N. Sethunathan. 1983. “Mineralization of Parathion in the Rice Rhizosphere,”
Applied and Environmental Microbiology 45: 826–29.
Reilley, K., M. K. Banks, and A. P. Schwab. 1993. “Dissipation of Polycyclic Aromatic
Hydrocarbons in the Rhizosphere,” Journal of Environmental Quality 25: 212–19.
Remediation Technologies Development Forum. 2000. Annual Report of the RTDF
Phytoremediation Action Team—TPH Subgroup: Cooperative Field Trials.
www.rtdf.org/public/phyto/phytodoc.htm
Remediation Technologies, Inc. 1997. Phytoremediation of Petroleum-Impacted Soil. Draft Final
Report, PERF Project #94-13.
Reynolds, C. M., C. S. Pidgeon, L. B. Perry, T. J. Gentry, and D. C. Wolf. 1998. “Rhizosphere-
Enhanced Benefits for Remediating Recalcitrant Petroleum Compounds,” Poster Abstract
#51 at the 14th
Annual Conference on Contaminated Soils, Amherst, Mass.
Rice, P. J., T. A. Anderson, and J. R. Coats. 1996a. “The Use of Vegetation to Enhance
Biodegradation and Reduce Off-Site Movement of Aircraft Deicers,” Abstract 054 at the
212th
American Chemical Society National Meeting, Orlando, Fla.
Rice, P. J., T. A. Anderson, and J. R. Coats. 1996b. “Phytoremediation of Herbicide-
Contaminated Water with Aquatic Plants,” presented at the 212th
American Chemical Society
National Meeting, Orlando, Fla.
Riesen, T. K., and I. Brunner. 1996. “Effect of Ectomycorrhizae and Ammonium on 134
Cs and 85
Sr Uptake into Picea abies Seedlings,” Environmental Pollution 93(1): 1–8.
Rock, S. A., and P. Sayre. 1999. “Phytoremediation of Hazardous Wastes: Potential Regulatory
Acceptability,” Environmental Regulations and Permitting, 8(3): 33-42. New York: Wiley &
Sons, Inc.
Rose, M. A., and M. Rose. 1998. “Performance of Heat-Balance Sap-Flow Gauge on Rose,” Acta
Horticulturae 421: 201–08.
Rouhi, A. M. 1997. “Plants to the Rescue,” Chemical and Engineering News 75(2): 21–23.
Rubin, E. 2000. “Potential for Phytoremediation of Methyl-Tert-Butyl-Ether (MTBE),” presented
at the 10th
Annual West Coast Conference on Contaminated Soils and Water, San Diego.
Russell, K. 2005. The Use and Effectiveness of Phytoremediation to Treat Persistent Organic
Pollutants. Washington, D.C.: U.S. Environmental Protection Agency, Office of Solid Waste
and Emergency Response, Technology Innovation and Field Services Division.
Rylott, E. L., R. G. Jackson, J. Edwards, G. L Womack, H. M. B. Seth-Smith, D. A. Rathbone, S.
E. Strand, N. C. Bruce. 2006. “An Explosive-Degrading Cytochrome P450 Activity and Its
Targeted Application for the Phytoremediation of RDX,” Nature Biotechnology 24: 216–19.

ITRC — Phytotechnology Technical and Regulatory Guidance and Decision Trees, Revised February 2009
127
Salt, C. A., R. W. Mayes, and D. A. Elston. 1992. “Effects of Season, Grazing Intensity, and Diet
Composition on the Radiocaesium Intake by Sheep on Reseeded Hill Pasture,” Journal of
Applied Ecology 29: 378–87.
Salt, D. E., M. Blaylock, P. B. A. N. Kumar, V. Dushenkov, B. D. Ensley, I. Chet, and I. Raskin.
1995. “Phytoremediation: A Novel Strategy for the Removal of Toxic Metals from the
Environment Using Plants,” Biotechnology 13: 468–74.
Schirmer, K., and M. Schirmer. 1997. MTBE Phytoremediation Potential of the Forested Area at
the Borden Field Site. API Status Report (Contract DB-08200-82GEF.96-1402). Ontario:
University of Waterloo, Institute for Groundwater Research.
Schnoor, J. L. 1996. Environmental Modeling—Fate and Transport of Pollutants in Water, Air,
and Soil. New York: Wiley & Sons.
Schnoor, J. L. 1997. Phytoremediation. Ground-Water Remediation Technologies Analysis
Center Technology Evaluation Report TE-98-01.
Schnoor, J. L. 1998. “Exploring the Rhizosphere—A Unique Perspective on Achieving
Phytoremediation,” presented at the 3rd
Annual International Conference on
Phytoremediation, Houston.
Schnoor, J. L., E. W. Aitchison, S. L. Kelley, P. J. J. Alvarez, S. Wakefield, J. G. Burken, and C.
L. Just. 1997. “Phytoremediation of 1,4-Dioxane by Hybrid Poplars,” pp. 197–99 (Preprint
Paper #195) in Proceedings, 213th
American Chemical Society National Meeting,
Environmental Division Symposia, San Francisco.
Schnoor, J. L., L. A. Light, S. C. McCutcheon, N. L. Wolfe, and L. H. Carriera. 1995.
“Phytoremediation of Organic and Nutrient Contaminants,” Environmental Science and
Technology 29: 318–23.
Schumacher, J. G., G. C. Struckhoff, and J. G. Burken. 2004. Assessment of Subsurface
Chlorinated Solvent Contamination Using Tree Cores at the Front Street Site and Former
Dry Cleaning Facility at the Riverfront Superfund Site, New Haven, Missouri, 1999–2003.
Scientific Investigations Report 2004-5049. U.S. Department of Interior, U.S. Geological
Survey.
Schwab, A. P., and M. K. Banks. 1994. “Biologically Mediated Dissipation of Polyaromatic
Hydrocarbons in the Root Zone,” in Bioremediation Through Rhizosphere Technology, T. A.
Anderson and J. R. Coats, eds. ACS Symposium Series 563. Washington, D.C.: American
Chemical Society.
Schwab, A. P., L. E. Newman, M. K. Banks, and K. Nedunari. 2000. Dewatering, Remediation,
and Evaluation of Dredged Sediments. West Lafayette, Ind.: U.S. Environmental Protection
Agency Hazardous Substance Research Center, Center for Integrated Remediation Using
Managed Natural Systems.
Schwarzenbach, R. P., P. M. Gschwend, and D. M. Imboden. 1993. Environmental Organic
Chemistry. New York: Wiley & Sons.
Shigo, A. L., and W. C. Shortle. 1983. “Wound Dressings: Results of Studies over 13 Years,”
Journal of Arboriculture 9(12): 317–28.
Shimp, J. F., J. C. Tracey, L. C. Davis, E. Lee, W. Huang, L. E. Erickson, and J. L. Schnoor.
1993. “Beneficial Effects of Plants in the Remediation of Soil and Groundwater

ITRC — Phytotechnology Technical and Regulatory Guidance and Decision Trees, Revised February 2009
128
Contaminated with Organic Materials,” Critical Reviews in Environmental Science and
Technology 23: 41–77.
Speir, T. W., J. A. August, and C. W. Feltham. 1992. “Assessment of the Feasibility of Using
CCA (Copper, Chromium and Arsenic)–Treated and Boric Acid–Treated Sawdust as Soil
Amendments, I. Plant Growth and Element Uptake,” Plant and Soil 142: 235–48.
Stomp, A. M., K. H. Han, S. Wilbert, M. P. Gordon, and S. D. Cunningham. 1994. “Genetic
Strategies for Enhancing Phytoremediation,” Annals of the New York Academy of Sciences
721: 481–91.
Strand, S. E., M. P. Gordon, L. A. Newman, and P. Heilman. 1998. Phytoremediation of Methyl-
t-Butylether (MTBE). Report on Project No. 15018-02002 2101/02 to the U.S. Navy, Naval
Facilities Engineering Services Center, National Test Site, Port Hueneme, Calif.
Strand, S. E., L. Newman, M. Ruszaj, J. Wilmoth, B. Shurtleff, M. Brandt, N. Choe, G. Ekuan, J.
Duffy, J. W. Massman, P. E. Heilman, and M. P. Gordon. 1995. “Removal of
Trichloroethylene from Aquifers Using Trees,” presented at the National Conference on
Environmental Engineering, Pittsburgh.
Struckhoff, G. C., J. G. Burken, and J. G. Schumacher. 2005. “Vapor Phase Exchange of PCE
between Soil and Plants,” Environmental Science and Technology 39(6): 1563–68.
Susarla, S. S. T. Bacchus, N. L. Wolfe, and S. C. McCutcheon. 1999. “Phytotransformation of
Perchlorate Using Parrot-Feather,” Soil and Groundwater Cleanup Feb./Mar.: 20–23.
Taiz, L., and E. Zeiger. 1991. Plant Physiology. Redwood City, Calif.: Benjamin/Cummings
Publishing.
Thomas, F., J. Reider, A. Ferro, and D. Tsao. 1998. “Using Trees as a Barrier Strip to Metals-
Contaminated Saline Groundwater,” presented at the 3rd
Annual International Conference on
Phytoremediation, Houston.
Tiemann, K. J., J. L. Gardea-Torresdey, G. Gamez, and K. Dokken. 1998. “Interference Studies
for Multi-Metal Binding by Medicago sativa (Alfalfa),” p. 42 (Abstract 67) in Proceedings,
Conference on Hazardous Waste Research, Snow Bird, Utah.
Tossell, R. W. 2000. “Uptake of Arsenic by Tamarisk and Eucalyptus under Saline Conditions,”
presented at the 2nd
International Conference on Remediation of Chlorinated and Recalcitrant
Compounds, Monterey, Calif.
Trapp, S. 2003. “Plant Uptake and Transport Models for Neutral and Ionic Chemicals,”
Environmental Science and Pollution Research 11(1): 33–39.
Tsao, D. T. 1997. Development of Phytoremediation Technology Developments. Technology
Assessment and Development (HEM) Status Report 0497.
Tsao, D. T. 1998. Phytoremediation Technologies. BP Amoco Technology Guidance Document.
Naperville, Ill.
Tsao, D. T., ed. 2003. Advances in Biochemical Engineering and Biotechnology, vol. 78. Berlin:
Springer-Verlag.
Tsao, D. T., and K. Tsao. 2003. Analysis of Phytoscape Species for BP Retail Sites. Capstone
Project Paper. Atlantic Richfield Company.
USDA (U.S. Department of Agriculture). 2007. “USDA Concludes Genetically Engineered
Creeping Bentgrass Investigation.” Release No. 0350.07. www.usda.gov/wps/portal/

ITRC — Phytotechnology Technical and Regulatory Guidance and Decision Trees, Revised February 2009
129
usdahome?contentidonly=true&contentid=2007/11/0350.xml>%20&contentid=2007/11/
0350.xml
USEPA (U.S. Environmental Protection Agency). 1993. Wildlife Exposure Factors Handbook,
vol. 1. EPA/600/R-93/187.
USEPA. 1998. Green Landscaping with Native Plants. www.epa.gov/greenacres
USEPA. 1999a. Phytoremediation Resource Guide. EPA/542/B-99/003. www.epa.gov/tio
USEPA. 1999b. Screening Level Ecological Risk Assessment Protocol, Appendix C. “Media-to-
Receptor Bioconcentration Factors (BCFs)” and Appendix D. “Bioconcentration Factors
(BCFs) for Wildlife Measurement Receptors.” www.epa.gov/osw/hazard/tsd/td/combust/eco-
risk/volume3/appx-c.pdf and www.epa.gov/osw/hazard/tsd/td/combust/eco-risk/volume3/
appx-d.pdf
USEPA. 2000. Introduction to Phytoremediation. EPA/600/R-99/107. Cincinnati: Office of
Research and Development. www.cluin.org/download/remed/introphyto.pdf
USEPA. 2003. Phytoremediation of Groundwater at Air Force Plant 4, Carswell, Texas.
EPA/600/R-03/506. Cincinnati: Office of Research and Development.
USEPA. 2005. Evaluation of Phytoremediation for Management of Chlorinated Solvents and
Groundwater. EPA 542-R-05-001. Remediation Technologies Development Forum
Phytoremediation of Organics Action Team, Chlorinated Solvents Workgroup.
USEPA. 2007a. Ecological Revitalization and Attractive Nuisance Issues. EPA 542-F-06-003.
www.cluin.org/s.focus/c/pub/i/1438
USEPA. 2007b. The Use of Soil Amendments for Remediation, Revitalization, and Reuse. EPA
542-R-07-013. www.clu-in.org/s.focus/c/pub/i/1515
USEPA. 2008. “Assessing Relative Bioavailability in Soil at Superfund Sites.”
www.epa.gov/superfund/health/contaminants/bioavailability/index.htm
Van Aken, B., J. M. Yoon, C. L. Just, and J. L. Schnoor. 2004. “Metabolism and Mineralization
of Hexahydro-1,3,5-trinitro-1,3,5-triazine inside Poplar Tissues (Populus deltoides x
nigra DN34). Environmental Science and Technology 38: 4572–79.
Van Bavel, C. H. M. 1966. “Potential Evapotranspiration: The Combination Concept and Its
Experimental Verification,” Water Resources Research 2: 445–67.
Van Den Bos, A. 2002. Phytoremediation of Volatile Organic Compounds in Groundwater:
Case Studies in Plume Control. Washington, D.C.: U.S. Environmental Protection Agency,
Office of Solid Waste and Emergency Response, Technology Innovation Office.
Vasudev, D., T. Ledder, S. Dushenkov, A. Epstein, N. Kumar, Y. Kapulnik, B. Ensley, G.
Huddleston, J. Cornish, I. Raskin, B. Sorochinsky, M. Ruchko, A. Prokhnevsky, A. Mikheev,
and D. Grodzinsky. 1996. “Removal of Radionuclide Contamination from Water by Metal-
Accumulating Terrestrial Plants,” presented at the In Situ Soil and Sediment Remediation
Conference, New Orleans.
Viessman, W., G. L. Lewis, and J. W. Knapp. 1989. Introduction to Hydrology, 3rd
ed. New
York: Harper & Row.
Vroblesky, D. A. 2008. User’s Guide to the Collection and Analysis of Tree Cores to Assess the
Distribution of Subsurface Volatile Organic Compounds. U.S. Geological Survey Scientific
Investigations Report 2008–5088. http://pubs.water.usgs.gov/sir2008-5088

ITRC — Phytotechnology Technical and Regulatory Guidance and Decision Trees, Revised February 2009
130
Vroblesky, D. A., C. T. Nietch, and J. T. Morris. 1999. “Chlorinated Ethenes from Groundwater
in Tree Trunks,” Environmental Science and Technology 33(1): 510–15.
Wang, Y. Y., B. M. Biwer, and C. Yu. 1993. A Compilation of Radionuclide Transfer Factors
for Plants, Meats, Milk, and Aquatic Food Pathways and the Suggested Default Values for
the RESRAD Code. ANL/EAIS/TM-103. Argonne, Ill.: Argonne National Laboratory,
Environmental Assessment and Information Sciences Division.
Weand, B. L., and V. L. Hauser. 1997. “The Evapotranspiration Cover: Soil-Vegetative Covers
for Landfills Save Money without Sacrificing Performance,” Journal of Environmental
Protection November: 40–42.
Wong, T. 1997. Summary of the Remediation Technologies Development Forum Alternative
Covers Assessment Program Workshop, Cincinnati Bell Long Distance Center, Cincinnati.
Wong, T. 1998. “How to Assess Phytoremediation Without Baseline Data through Case Study
Analysis,” presented at the 3rd
Annual International Conference on Phytoremediation,
Houston.
Wood, T. K., H. Shim, D. Ryoo, J. S. Gibbons, and J. G. Burken. 2000. “Root-Colonizing
Genetically Engineered Bacteria for Trichloroethylene Phytoremediation,” presented at the
2nd
International Conference on Remediation of Chlorinated and Recalcitrant Compounds,
Monterey, Calif.
Woodward, R. 1996. Summary of the Workshop on Phytoremediation of Organic Contaminants.
Fort Worth, Tex.
Yancey, N. A., J. E. McLean, P. Grossl, R. C. Sims, and W. H. Scouten. 1998. “Enhancing
Cadmium Uptake in Tobacco Using Soil Amendments,” pp. 25–26 (Abstract 38) in
Proceedings, Conference on Hazardous Waste Research, Snow Bird, Utah.
Zeeb, B., J. Amphlett, A. Rutter, and K. Reimer. 2006. “Potential for Phytoremediation of
Polychlorinated Biphenyl (PCB)–Contaminated Soil,” International Journal of
Phytoremediation 8(3): 199–221.
Zhang, Q., L. C. Davis, and L. E. Erickson. 1998. “Using Vegetation to Treat Methyl-Tert-Butyl
Ether–Contaminated Groundwater,” p. 76 (Abstract P44) in Proceedings, Conference on
Hazardous Waste Research, Snow Bird, Utah.
Zhang, Q., L. Davis, L. Erickson. 2000. “Transport of Methyl Tert-Butyl Ether (MTBE) through
Alfalfa Plants,” presented at the U.S. Environmental Protection Agency Phytoremediation
State of the Science Conference, Boston.
Zhao, K.-F. 1991. “Desalination of Saline Soils by Suaeda salsa,” Plant and Soil 135: 303–05.

ITRC — Phytotechnology Technical and Regulatory Guidance and Decision Trees, Revised February 2009
131
This page intentionally left blank.

Appendix A
Internet Resources for Phytoremediation

This page intentionally left blank.

A-1
INTERNET RESOURCES FOR PHYTOREMEDIATION
1. Interstate Technology & Regulatory Council: www.itrcweb.org
Phytotechnologies Team Public Page:
http://www.itrcweb.org/Team/Public?teamID=40
2. Remediation Technologies Development Forum:
Phytoremediation of Organics Action Team:
www.rtdf.org/public/phyto/phylinks.htm#Resources
Field study protocol for the phytoremediation of petroleum hydrocarbons in soil put
together by the Phytoremediation Action Team (1999):
www.rtdf.org/PUBLIC/phyto/protocol/protocol99.htm
Evaluation of Phytoremediation for Management of Chlorinated Solvents in Soil and
Groundwater: www.rtdf.org/public/phyto/chlor_solv_management.pdf
3. Federal Remediation Technologies—Roundtable Remediation Technologies Screening
Matrix and Reference Guide Version 4.0:
www.frtr.gov/matrix2/top_page.html
www.frtr.gov/matrix2/section4/4-3.html
www.frtr.gov/matrix2/section4/4-33.html
4. International Journal of Phytoremediation: www.aehs.com/journals/phytoremediation
5. Great Plains/Rocky Mountain Hazardous Substance Research Center, a 14-institution
consortium led by Kansas State University—see list-serv and additional links:
www.engg.ksu.edu/HSRC/phytorem/home.html
6. “Phytopet,” a database of plants that play a role in the phytoremediation of petroleum
hydrocarbons from the University of Saskatchewan: www.phytopet.usask.ca/mainpg.php
7. Order a copy of “Phytorem,” the searchable database of plants that that remediate metals,
created by Environment Canada:
www.ec.gc.ca/publications/index.cfm?screen=PubDetail&PubID=546&CategoryID=
0&showimage=False&order_by=pubyear&search=phytorem&lang=e&start=1
8. International resources:
International Phytotechnology Society, host of International Conference on
Phytotechnologies: www.phytosociety.org/index.htm
PHYTONET Phytoremediation Electronic Newsgroup Network:
www.dsa.unipr.it/phytonet
Cost 859, a network of 29 European countries’ coordinated research projects:
http://w3.gre.ac.uk/cost859
Phytolink Australia: www.phytolink.com.au

A-2
9. USDA Natural Resource Conservation Service:
USDA PLANTS National Database: http://www.plants.usda.gov
Plant Materials Program: http://plant-materials.nrcs.usda.gov
10. U.S. EPA Hazardous Waste Clean-Up Information: www.clu-in.org
Phytotechnology Project Profiles Searchable Database: www.cluin.org/products/phyto
Phytoremediation Technology Focus: www.cluin.org/techfocus/default.focus/sec/
Phytoremediation/cat/Overview
“Citizen’s Guide to Phytoremediation”: http://clu-in.org/s.focus/c/pub/i/67
“Status Report on Use of Field-Scale Phytotechnology for Chlorinated Solvents, Metals,
Explosives and Propellants, and Pesticides”: www.cluin.org/download/remed/542-r-05-
002.pdf

Appendix B
Database of Contaminant Remediation by Plants

This page intentionally left blank.

B-1
DATABASE OF CONTAMINANT REMEDIATION BY PLANTS
Key to phytomechanism abbreviations:
CW = constructed wetland
NW = natural wetlands
PD = phytodegradation
PE = phytoextraction
PS = phytosequestration
PV = phytovolatilization
RD = rhizodegradation
RF = rhizofiltration
1. ORGANIC REMEDIATION BY PLANTS
Table B-1. Plants remediating petroleum constituents Petroleum
hydrocarbon Plant species
Phyto-
mechanism Comments on phytoremedial effectiveness Reference
Acenaphthene Perennial ryegrass (Lolium perenne)
RD Decreased concentrations from 33.0 to 1.8 mg/kg in 258 days
Ferro, Kennedy, and Knight 1997
Acenaphthene Mixed plant/tree community (51 species identified)
RD Natural regrowth in sludge basin; 38 and 566 mg/kg within and below the rhizosphere, respectively
Wong 1998
Acenaphthylene Mixed plant/tree community (51 species identified)
RD Natural regrowth in sludge basin; 202 and 1,722 mg/kg within and below the rhizosphere, respectively
Wong 1998
Aliphatics (total) Mixed grass community (5–7 species)
RD Decreased total aliphatic (C8–C21+) soil concentrations from 14,500 to 2,500 mg/kg in 44 weeks
Remediation Technologies, Inc. 1997
Aliphatics (total) Mixed grass community (5–6 species)
RD Decreased total aliphatic (C8–C21+) soil concentrations from 6,300 to 1,400 mg/kg in 34 weeks
Remediation Technologies, Inc. 1997
Aniline Carolina hybrid poplar (Populus deltoides x nigra DN34)
(PE, PV) 15% of 50 ppm hydroponic feed volatilized, 10% accumulated in upper stem, 10% in leaves, and 65% in roots in 3–6 days
Burken and Schnoor 1997a
Anthracene Fescue (Festuca arundinacea)
RD Decreased soil concentrations from 100 to 0.76 mg/kg in 24 weeks
Reilley, Banks, and Schwab 1993; Schwab and Banks, 1994
Anthracene Alfalfa (Medicago sativa) RD Decreased soil concentrations from 100 to 0.60 mg/kg in 24 weeks
Reilley, Banks, and Schwab 1993; Schwab and Banks 1994
Anthracene Switchgrass (Panicum virgatum)
RD Decreased soil concentrations from 100 to 0.79 mg/kg in 24 weeks
Reilley, Banks, and Schwab 1993; Schwab and Banks 1994
Anthracene Sudangrass (Sorghum vulgare)
RD Decreased soil concentrations from 100 to 0.74 mg/kg in 24 weeks
Reilley, Banks, and Schwab 1993; Schwab and Banks 1994

B-2
Petroleum
hydrocarbon Plant species
Phyto-
mechanism Comments on phytoremedial effectiveness Reference
Anthracene Mixed grass community (5–7 species)
RD Decreased soil concentrations from 493 to 9 µg/kg in 44 weeks
Remediation Technologies, Inc. 1997
Anthracene Mixed grass community (5–6 species)
RD Decreased soil concentrations from 108 µg/kg to nondetect (ND) in 34 weeks
Remediation Technologies, Inc. 1997
Anthracene Mixed plant/tree community (51 species identified)
RD Natural regrowth in sludge basin, 66 and 856 mg/kg within and below the rhizosphere, respectively
Wong 1998
Aromatics (total) Mixed grass community (5–7 species)
RD Decreased total aromatics (C8–C35+) soil concentrations from 5,900 to 2,300 mg/kg in 44 weeks
Remediation Technologies, Inc. 1997
Aromatics (total) Mixed grass community (5–6 species)
RD Decreased total aromatics (C8–C35+) soil concentrations from 5,700 to 2,900 mg/kg in 34 weeks
Remediation Technologies, Inc. 1997
Benzene Alfalfa (Medicago sativa Mesa var. Cimarron VR)
RD, PD 2% of 14
C-label recovered in foliage, 2%–8% in rhizosphere soil/roots (probably biodegraded in soil then taken up)
Ferro et al. 1997
Benzene Common reed (Phragmites communis)
(RD) Increased removal rates in vegetated wetland filters compared to unvegetated filters
See original reference in Anderson, Guthrie, and Walton 1993
Benzene Carolina hybrid poplar (Populus deltoides x nigra DN34)
(PE, PV) 90% of 50 ppm hydroponic feed volatilized, 10% accumulated in stems in 3–6 days
Burken and Schnoor 1997a
Benzo(a)anthracene Perennial ryegrass (Lolium perenne)
RD Decreased concentrations from 4.1 to 0.9 mg/kg in 258 days
Ferro, Kennedy, and Knight 1997
Benzo(a)anthracene Mixed grass community (5–7 species)
RD Decreased soil concentrations from 375 to 36 µg/kg in 44 weeks
Remediation Technologies, Inc. 1997
Benzo(a)anthracene Mixed grass community (5–6 species)
RD Decreased soil concentrations from 114 to 39 µg/kg in 34 weeks
Remediation Technologies, Inc. 1997
Benzo(a)anthracene Various prairie grasses (8 species)
RD Decreased soil concentrations by 97% Aprill and Sims 1990
Benzo(a)anthracene Mixed plant/tree community (51 species identified)
RD Natural regrowth in sludge basin, 39 and 558 mg/kg within and below the rhizosphere, respectively
Wong 1998
Benzo(a)pyrene Perennial ryegrass (Lolium perenne)
RD Decreased concentrations from 13.1 to 7.1 mg/kg in 258 days
Ferro, Kennedy, and Knight 1997
Benzo(a)pyrene Mixed grass community (5–7 species)
RD Decreased soil concentrations from 115 to 57 µg/kg in 44 weeks
Remediation Technologies, Inc. 1997
Benzo(a)pyrene Mixed grass community (5–6 species)
RD Decreased soil concentrations from 46 to 36 µg/kg in 34 weeks
Remediation Technologies, Inc. 1997
Benzo(a)pyrene Various prairie grasses (8 species)
RD Decreased soil concentrations by 93% Aprill and Sims 1990
Benzo(a)pyrene Mixed plant/tree community (51 species identified)
RD Natural regrowth in sludge basin, 15 and 174 mg/kg within and below the rhizosphere, respectively
Wong 1998
Benzo(b)fluoranthene Perennial ryegrass (Lolium perenne)
RD Decreased concentrations from 17.6 to 8.4 mg/kg in 258 days
Ferro, Kennedy, and Knight 1997

B-3
Petroleum
hydrocarbon Plant species
Phyto-
mechanism Comments on phytoremedial effectiveness Reference
Benzo(b)fluoranthene Mixed grass community (5–7 species)
RD Decreased soil concentrations from 180 to 57 µg/kg in 44 weeks
Remediation Technologies, Inc. 1997
Benzo(b)fluoranthene Mixed grass community (5–6 species)
RD Decreased soil concentrations from 91 to 61 µg/kg in 34 weeks
Remediation Technologies, Inc. 1997
Benzo(b)fluoranthene Mixed plant/tree community (51 species identified)
RD Natural regrowth in sludge basin, 8 and 73 mg/kg within and below the rhizosphere, respectively
Wong 1998
Benzo(e)pyrene Mixed grass community (5–7 species)
RD Decreased soil concentrations from 238 to 150 µg/kg in 44 weeks
Remediation Technologies, Inc. 1997
Benzo(ghi)perylene Perennial ryegrass (Lolium perenne)
RD Decreased concentrations from 12.0 to 2.6 mg/kg in 258 days
Ferro, Kennedy, and Knight 1997
Benzo(ghi)perylene Mixed plant/tree community (51 species identified)
RD Natural regrowth in sludge basin, 3 and 166 mg/kg within and below the rhizosphere, respectively
Wong 1998
Benzo(k)fluoranthene Perennial ryegrass (Lolium perenne)
RD Decreased concentrations from 8.8 to 2.7 mg/kg in 258 days
Ferro, Kennedy, and Knight 1997
Benzo(k)fluoranthene Mixed grass community (5–7 species)
RD Decreased soil concentrations from 29 to 16 µg/kg in 44 weeks
Remediation Technologies, Inc. 1997
Benzo(k)fluoranthene Mixed grass community (5–6 species)
RD Decreased soil concentrations from 16 to 10 µg/kg in 34 weeks
Remediation Technologies, Inc. 1997
Biphenyl Common reed (Phragmites communis)
RD Increased removal rates in vegetated wetland filters compared to unvegetated filters
See original reference in Anderson, Guthrie, and Walton 1993
Biphenyl Mixed grass community (5–7 species)
RD Decreased soil concentrations from 3,675 to 6 µg/kg in 44 weeks
Remediation Technologies, Inc. 1997
Biphenyl Mixed grass community (5–6 species)
RD Decreased soil concentrations from 160 to 4 µg/kg in 34 weeks
Remediation Technologies, Inc. 1997
Biological oxygen demand
Bulrush and cattail(Scirpus and Typha spp.)
25 mg/L influent reduced to 3 mg/L at effluent Kadlec and Knight 1996
Biological oxygen demand
Multiple wetland species (numbers of types not reported)
Average reduction from 25.9 to 7.4 mg/L sustained for 2 years
Kadlec and Knight 1996
Chemical oxygen demand
Bulrush and cattail (Scirpus and Typha spp.)
175 mg/L influent reduced to 37 mg/L at effluent Kadlec and Knight 1996
Chrysene Perennial ryegrass (Lolium perenne)
RD Decreased concentrations from 19.6 to 3.0 mg/kg in 258 days
Ferro, Kennedy, and Knight 1997
Chrysene Mixed grass community (5–7 species)
RD Decreased soil concentrations from 793 to 88 µg/kg in 44 weeks
Remediation Technologies, Inc. 1997
Chrysene Mixed grass community (5–6 species)
RD Decreased soil concentrations from 220 to 133 µg/kg in 34 weeks
Remediation Technologies, Inc. 1997
Chrysene Various prairie grasses (8 species)
RD Decreased soil concentrations by 94% Aprill and Sims 1990
Chrysene Mixed plant/tree community (51 species identified)
RD Natural regrowth in sludge basin, 27 and 370 mg/kg within and below the rhizosphere, respectively
Wong 1998

B-4
Petroleum
hydrocarbon Plant species
Phyto-
mechanism Comments on phytoremedial effectiveness Reference
Dibenzo(ah)anthracene Perennial ryegrass (Lolium perenne)
RD Decreased concentrations from 2.1 to 1.6 mg/kg in 258 days
Ferro, Kennedy, and Knight 1997
Dibenzo(ah)anthracene Mixed grass community (5–7 species)
RD Decreased soil concentrations from 45 to 28 µg/kg in 44 weeks
Remediation Technologies, Inc. 1997
Dibenzo(ah)anthracene Various prairie grasses (8 species)
RD Decreased soil concentrations by 43% Aprill and Sims 1990
Dibenzothiophene Mixed grass community (5–7 species)
RD Decreased soil concentrations from 1,700 to 7 µg/kg in 44 weeks
Remediation Technologies, Inc. 1997
Dibenzothiophene Mixed grass community (5–6 species)
RD Decreased soil concentrations from 5,450 to 120 µg/kg in 34 weeks
Remediation Technologies, Inc. 1997
DROs Cattail (Typha spp.) CW Decreased sediment concentrations from 100 to 1 mg/L in 20 hours hydraulic residence time
Kadlec and Knight 1998
DROs Willows (Salix spp.) RD Decreased soil concentrations up to 5,000 mg/kg by 40%–90% in 24 weeks
Carman, Crossman, and Gatliff 1997, 1998
DROs Willows and hybrid poplars (Salix and Populus spp.)
RD Decreased soil concentrations from 225 to 25 mg/kg in 2 years
Applied Natural Sciences, Inc. 1997
Ethylbenzene Common reed (Phragmites communis)
(RD) Increased removal rates in vegetated wetland filters compared to unvegetated filters
See original reference in Anderson, Guthrie, and Walton 1993
Ethylbenzene Carolina hybrid poplar (Populus deltoides x nigra DN34)
(PE, PV) 50% of 50 ppm hydroponic feed volatilized, 5% accumulated in upper stems, 35% in lower stems, 5% in leaves, and 5% in roots in 3–6 days
Burken and Schnoor 1997a
Ethylene glycol Tall fescue (Festuca arundinacea)
RD 41% reduction in soil concentrations after 28 days Rice, Anderson, and Coats 1996a
Ethylene glycol Alfalfa (Medicago sativa) RD 40% reduction in soil concentrations after 28 days Rice, Anderson, and Coats 1996a
Fluoranthene Bermuda grass (Cynodon dactylon)
RD, PE Approximately 35% degradation in soil achieved in 23 months, 10 µg/kg measured in plant shoots
Banks and Schwab 1998
Fluoranthene Tall fescue (Festuca arundinacea)
RD, PE Approximately 55% degradation in soil achieved in 23 months, 10 µg/kg measured in plant shoots
Banks and Schwab 1998
Fluoranthene Perennial ryegrass (Lolium perenne)
RD Decreased concentrations from 63.7 to 3.6 mg/kg in 258 days
Ferro, Kennedy, and Knight 1997
Fluoranthene Perennial ryegrass (Lolium perenne)
RD Decreased concentrations from 63.7 to 2.8 mg/kg in 11 months
Ferro et al. 1999
Fluoranthene White clover (Trifolium repens)
RD Approximately 35% degradation in soil achieved in 23 months
Banks and Schwab 1998
Fluoranthene Mixed grass community (5–7 species)
RD Decreased soil concentrations from 293 to 78 µg/kg in 44 weeks
Remediation Technologies, Inc. 1997
Fluoranthene Mixed grass community (5–6 species)
RD Decreased soil concentrations from 102 to 45 µg/kg in 34 weeks
Remediation Technologies, Inc. 1997
Fluoranthene Mixed plant/tree community (51 species identified)
RD Natural regrowth in sludge basin, 80 and 940 mg/kg within and below the rhizosphere, respectively
Wong 1998

B-5
Petroleum
hydrocarbon Plant species
Phyto-
mechanism Comments on phytoremedial effectiveness Reference
Fluorene Mixed grass community (5–7 species)
RD Decreased soil concentrations from 2,800 to 10 µg/kg in 44 weeks
Remediation Technologies, Inc. 1997
Fluorene Mixed grass community (5–6 species)
RD Decreased soil concentrations from 248 to 8 µg/kg in 34 weeks
Remediation Technologies, Inc. 1997
Fluorene Mixed plant/tree community (51 species identified)
RD Natural regrowth in sludge basin, 82 and 1,487 mg/kg within and below the rhizosphere, respectively
Wong 1998
GROs Mixed grass community (5–7 species)
RD Decreased soil aliphatic concentrations from 45 to 2 mg/kg in 44 weeks
Remediation Technologies, Inc. 1997
GROs Mixed grass community (5–7 species)
RD Decreased soil aromatics concentrations from 6 mg/kg to ND in 44 weeks
Remediation Technologies, Inc. 1997
GROs Mixed grass community (5–6 species)
RD Decreased soil aliphatic concentrations from 11 mg/kg to ND in 34 weeks
Remediation Technologies, Inc. 1997
n-Heptadecane Mixed grass community (5–7 species)
RD Decreased soil concentrations from 72 to 0.38 mg/kg in 44 weeks
Remediation Technologies, Inc. 1997
n-Heptadecane Mixed grass community (5–6 species)
RD Decreased soil concentrations from 57 to 0.27 mg/kg in 34 weeks
Remediation Technologies, Inc. 1997
Indeno(123cd)pyrene Perennial ryegrass (Lolium perenne)
RD Decreased concentrations from 6.4 to 4.4 mg/kg in 258 days
Ferro, Kennedy, and Knight 1997
Indeno(123cd)pyrene Mixed plant/tree community (51 species identified)
RD Natural regrowth in sludge basin, 1 and 18 mg/kg within and below the rhizosphere, respectively
Wong 1998
MTBE Alfalfa (Medicago sativa) PE, PV Preliminary results indicating 0.844 mM feed in groundwater is significantly reduced
Zhang, Davis, and Erickson 1998
MTBE Hybrid poplars (Populus spp.) PE, PD, PV Preliminary laboratory results indicate 0.03% mineralized to CO2, 0.37% fixed in tissues, and 5.1% transpired
L. A. Newman, personal communication, 1998
Naphthalene Perennial ryegrass (Lolium perenne)
RD Decreased concentrations from 23.6 to 0.0 mg/kg in 258 days
Ferro, Kennedy, and Knight 1997
Naphthalene Mixed grass community (5–7 species)
RD Decreased soil concentrations from 4,725 to 16 µg/kg in 44 weeks
Remediation Technologies, Inc. 1997
Naphthalene Mixed grass community (5–6 species)
RD Decreased soil concentrations from 1,030 to 11 µg/kg in 34 weeks
Remediation Technologies, Inc. 1997
Naphthalene Mixed plant/tree community (51 species identified)
RD Natural regrowth in sludge basin, 38 and 6,813 mg/kg within and below the rhizosphere, respectively
Wong 1998
Naphthalene Wetland species (species not identified)
RD Reduced sediment concentrations by 64%–82% in 140 days
Mills et al. 1997
n-Octadecane Mixed grass community (5–7 species)
RD Decreased soil concentrations from 63 to 0.19 mg/kg in 44 weeks
Remediation Technologies, Inc. 1997
n-Octadecane Mixed grass community (5–6 species)
RD Decreased soil concentrations from 52 to 0.16 mg/kg in 34 weeks
Remediation Technologies, Inc. 1997
n-Octadecane Wetland species (species not identified)
RD Reduced sediment concentrations by 93%–99% in 140 days
Mills et al. 1997

B-6
Petroleum
hydrocarbon Plant species
Phyto-
mechanism Comments on phytoremedial effectiveness Reference
Oil and gasoline Bulrush and cattail (Scirpus and Typha spp.)
CW 2,100 µg/L influent reduced to 130 µg/L at effluent Kadlec and Knight 1996
Perylene Mixed grass community (5–7 species)
RD Decreased soil concentrations from 135 to 77 µg/kg in 44 weeks
Remediation Technologies, Inc. 1997
Phenanthrene Bermuda grass (Cynodon dactylon)
RD, PE Between 50%–55% degradation in soil achieved in 23 months, 30 µg/kg measured in plant shoots
Banks and Schwab 1998
Phenanthrene Tall fescue (Festuca arundinacea)
RD, PE Approximately 60% degradation in soil achieved in 23 months, 20 µg/kg measured in plant shoots
Banks and Schwab 1998
Phenanthrene White clover (Trifolium repens)
RD 60%–70% degradation in soil achieved in 23 months Banks and Schwab 1998
Phenanthrene Mixed grass community (5–7 species)
RD Decreased soil concentrations from 6,050 to 58 µg/kg in 44 weeks
Remediation Technologies, Inc. 1997
Phenanthrene Mixed grass community (5–6 species)
RD Decreased soil concentrations from 1,038 to 52 µg/kg in 34 weeks
Remediation Technologies, Inc. 1997
Phenanthrene Mixed plant/tree community (51 species identified)
RD Natural regrowth in sludge basin, 219 and 3,678 mg/kg within and below the rhizosphere, respectively
Wong 1998
Phenanthrene Wetland species (species not identified)
RD Reduced sediment concentrations by 87%–92% in 140 days
Mills et al. 1997
Phenol Alfalfa (Medicago sativa) RD 500 ppm solution at inlet decreased 85%–100% at outlet at flow rates of 0.6–1.4 L/day
Muralidharan, Davis, and Erickson 1993; Davis et al. 1994
Phenol Bulrush (Schoenoplectus lacustris)
CW Decreased concentrations from 105 to 0 mg/L in 6 days (microcosm study)
Kadlec and Knight 1996
Phenol Bulrush and cattail (Scirpus and Typha spp.)
CW 80 µg/L influent reduced to 5 µg/L at effluent Kadlec and Knight 1996
Phenol Cattail (Typha spp.) CW Decreased concentrations from 87 to 0 mg/L in 340 hours (microcosm study)
Kadlec and Knight 1996
Phenol Cattail (Typha spp.) CW Decreased concentrations from 400 to 40 mg/L in 12.5 m through the wetland
Kadlec and Knight 1996
Phenol Carolina hybrid poplar (Populus deltoides x nigra DN34)
(PE, PV) 5% of 50 ppm hydroponic feed volatilized, 10% accumulated in upper stem, 5% in leaves, 80% in roots in 3–6 days
Burken and Schnoor 1997a
Phytane Mixed grass community (5–7 species)
RD Decreased soil concentrations from 120 to 1.70 mg/kg in 44 weeks
Remediation Technologies, Inc. 1997
Phytane Mixed grass community (5–6 species)
RD Decreased soil concentrations from 54 to 1.73 mg/kg in 34 weeks
Remediation Technologies, Inc. 1997
Phytane Wetland species (species not identified)
RD Reduced sediment concentrations by 88%–97% in 140 days
Mills et al. 1997
PAH (total priority) Alfalfa (Medicago sativa) RD Decreased soil concentrations from 49.4 to 35.4 mg/kg in 6 months
Pradhan et al. 1998
PAH (total priority) Switchgrass (Panicum virgatum)
RD Decreased soil concentrations from 49.4 to 34.7 mg/kg in 6 months
Pradhan et al. 1998
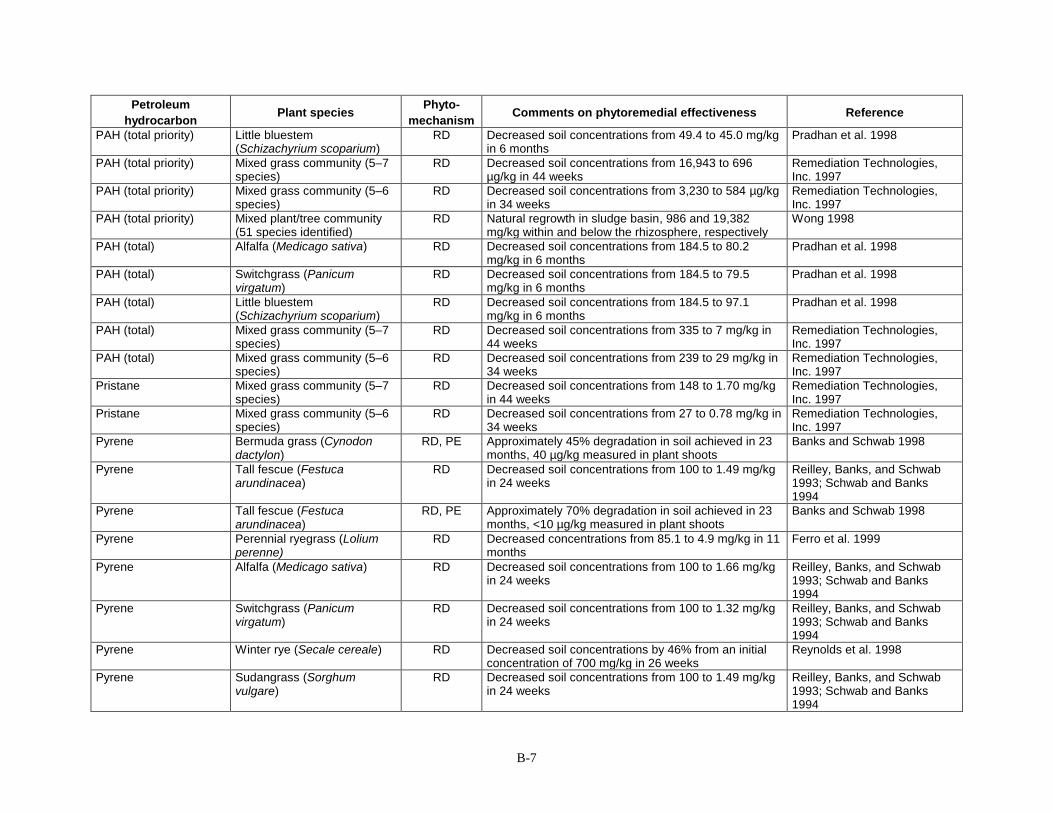
B-7
Petroleum
hydrocarbon Plant species
Phyto-
mechanism Comments on phytoremedial effectiveness Reference
PAH (total priority) Little bluestem (Schizachyrium scoparium)
RD Decreased soil concentrations from 49.4 to 45.0 mg/kg in 6 months
Pradhan et al. 1998
PAH (total priority) Mixed grass community (5–7 species)
RD Decreased soil concentrations from 16,943 to 696 µg/kg in 44 weeks
Remediation Technologies, Inc. 1997
PAH (total priority) Mixed grass community (5–6 species)
RD Decreased soil concentrations from 3,230 to 584 µg/kg in 34 weeks
Remediation Technologies, Inc. 1997
PAH (total priority) Mixed plant/tree community (51 species identified)
RD Natural regrowth in sludge basin, 986 and 19,382 mg/kg within and below the rhizosphere, respectively
Wong 1998
PAH (total) Alfalfa (Medicago sativa) RD Decreased soil concentrations from 184.5 to 80.2 mg/kg in 6 months
Pradhan et al. 1998
PAH (total) Switchgrass (Panicum virgatum)
RD Decreased soil concentrations from 184.5 to 79.5 mg/kg in 6 months
Pradhan et al. 1998
PAH (total) Little bluestem (Schizachyrium scoparium)
RD Decreased soil concentrations from 184.5 to 97.1 mg/kg in 6 months
Pradhan et al. 1998
PAH (total) Mixed grass community (5–7 species)
RD Decreased soil concentrations from 335 to 7 mg/kg in 44 weeks
Remediation Technologies, Inc. 1997
PAH (total) Mixed grass community (5–6 species)
RD Decreased soil concentrations from 239 to 29 mg/kg in 34 weeks
Remediation Technologies, Inc. 1997
Pristane Mixed grass community (5–7 species)
RD Decreased soil concentrations from 148 to 1.70 mg/kg in 44 weeks
Remediation Technologies, Inc. 1997
Pristane Mixed grass community (5–6 species)
RD Decreased soil concentrations from 27 to 0.78 mg/kg in 34 weeks
Remediation Technologies, Inc. 1997
Pyrene Bermuda grass (Cynodon dactylon)
RD, PE Approximately 45% degradation in soil achieved in 23 months, 40 µg/kg measured in plant shoots
Banks and Schwab 1998
Pyrene Tall fescue (Festuca arundinacea)
RD Decreased soil concentrations from 100 to 1.49 mg/kg in 24 weeks
Reilley, Banks, and Schwab 1993; Schwab and Banks 1994
Pyrene Tall fescue (Festuca arundinacea)
RD, PE Approximately 70% degradation in soil achieved in 23 months, <10 µg/kg measured in plant shoots
Banks and Schwab 1998
Pyrene Perennial ryegrass (Lolium perenne)
RD Decreased concentrations from 85.1 to 4.9 mg/kg in 11 months
Ferro et al. 1999
Pyrene Alfalfa (Medicago sativa) RD Decreased soil concentrations from 100 to 1.66 mg/kg in 24 weeks
Reilley, Banks, and Schwab 1993; Schwab and Banks 1994
Pyrene Switchgrass (Panicum virgatum)
RD Decreased soil concentrations from 100 to 1.32 mg/kg in 24 weeks
Reilley, Banks, and Schwab 1993; Schwab and Banks 1994
Pyrene Winter rye (Secale cereale) RD Decreased soil concentrations by 46% from an initial concentration of 700 mg/kg in 26 weeks
Reynolds et al. 1998
Pyrene Sudangrass (Sorghum vulgare)
RD Decreased soil concentrations from 100 to 1.49 mg/kg in 24 weeks
Reilley, Banks, and Schwab 1993; Schwab and Banks 1994

B-8
Petroleum
hydrocarbon Plant species
Phyto-
mechanism Comments on phytoremedial effectiveness Reference
Pyrene White clover (Trifolium repens)
RD Approximately 55% degradation in soil achieved in 23 months
Banks and Schwab 1998
Pyrene Mixed grass community (5–7 species)
RD Decreased soil concentrations from 910 to 88 µg/kg in 44 weeks
Remediation Technologies, Inc. 1997
Pyrene Mixed grass community (5–6 species)
RD Decreased soil concentrations from 145 to 79 µg/kg in 34 weeks
Remediation Technologies, Inc. 1997
Pyrene Mixed plant/tree community (51 species identified)
RD Natural regrowth in sludge basin, 167 and 1,955 mg/kg within and below the rhizosphere, respectively
Wong 1998
Toluene Alfalfa (Medicago sativa) RD Solution saturated with toluene at 26C at inlet decreased 50%–70% at outlet at flow rates of 1.0–3.5 L/day
Muralidharan, Davis, and Erickson 1993; Davis et al. 1994
Toluene Common reed (Phragmites communis)
RD Increased removal rates in vegetated wetland filters compared to unvegetated filters
See original reference in Anderson, Guthrie, and Walton 1993
Toluene Carolina hybrid poplar (Populus deltoides x nigra DN34)
(PE, PV) 50% of 50 ppm hydroponic feed volatilized, 10% accumulated in upper stem, 40% in lower stem in 3–6 days
Burken and Schnoor 1997a
TPH Bermuda grass (Cynodon dactylon)
RD Decreased soil concentrations ranging from 2,500 to 3,000 ppm by 41% in 26 months
Banks and Schwab 1998, Flathman and Lanza 1998
TPH Tall fescue (Festuca arundinacea)
RD Decreased soil concentrations ranging from 2,500 to 3,000 ppm by 45% in 26 months
Banks and Schwab 1998, Flathman and Lanza 1998
TPH Annual rye (Lolium multiflorum)
RD Decreased soil concentrations ranging from 2,000 to 20,000 ppm by 50% in 9 months
Flathman and Lanza 1998
TPH Alfalfa (Medicago sativa) RD Decreased soil diesel concentrations from 7,300 to 2,000 mg/kg in 6 weeks
Komisar and Park 1997
TPH Alfalfa (Medicago sativa) RD Decreased soil diesel concentrations from 12,400 to <1,000 mg/kg in 10 weeks
Komisar and Park 1997
TPH Winter rye (Secale cereale) RD Decreased soil concentrations from 5,000 to 4,000 mg/kg in 26 weeks
Reynolds et al. 1998
TPH Sorghum (Sorghum bicolor) RD Decreased soil concentrations ranging 2,000–20,000 ppm by 34% in 9 months
Flathman and Lanza 1998
TPH St. Augustine grass (Stenotaphrum secundatum)
RD Decreased soil concentrations ranging 2,000–20,000 ppm by 50% in 9 months
Flathman and Lanza 1998
TPH White clover (Trifolium repens)
RD Decreased soil concentrations ranging 2,500–3,000 ppm by 50% in 26 months
Banks and Schwab 1998, Flathman and Lanza 1998
TPH Mixed grass community (5–7 species)
RD Decreased soil concentrations from 27,000 to 10,500 mg/kg in 44 weeks
Remediation Technologies, Inc. 1997
TPH Mixed grass community (5–6 species)
RD Decreased soil concentrations from 19,000 to 13,500 mg/kg in 34 weeks
Remediation Technologies, Inc. 1997
Total suspended solids Bulrush and cattail (Scirpus and Typha spp.)
CW 35 mg/L influent reduced to 5 mg/L at effluent Kadlec and Knight 1996

B-9
Petroleum
hydrocarbon Plant species
Phyto-
mechanism Comments on phytoremedial effectiveness Reference
Total suspended solids Multiple wetland species (numbers of types not reported)
CW Average reduction from 40.4 to 14.1 mg/L for 2 years Kadlec and Knight 1996
m-Xylene Carolina hybrid poplar (Populus deltoides x nigra DN34)
(PE, PV) 40% of 50 ppm hydroponic feed volatilized, 10% accumulated in upper stems, 40% in lower stems, 10% in roots in 3–6 days
Burken and Schnoor 1997a
p-Xylene Common reed (Phragmites communis)
RD Increased removal rates in vegetated wetland filters compared to unvegetated filters
See original reference in Anderson, Guthrie, and Walton 1993
Table B-2. Plants remediating halogenated compounds and surfactants Chlorinated
hydrocarbon Plant species
Phyto-
mechanism Comments on phytoremedial effectiveness Reference
Bromoform Common reed (Phragmites communis)
RD Increased removal rates in vegetated wetland filters compared to unvegetated filters
See original reference in Anderson, Guthrie, and Walton 1993
Carbon tetrachloride Hybrid poplar (Populus trichocarpa xP.deltoides H11-11)
PE, PD Removed 95% from 50 ppm continuous feed stream, negligible phytovolatilization measured
Newman et al. 1997a
Chlorobenzene Common reed (Phragmites communis)
RD Increased removal rates in vegetated wetland filters compared to unvegetated filters
See original reference in Anderson, Guthrie, and Walton 1993
Chloroform Common reed (Phragmites communis)
RD Increased removal rates in vegetated wetland filters compared to unvegetated filters
See original reference in Anderson, Guthrie, and Walton 1993
Dichloroethane Common reed (Phragmites communis)
RD Increased removal rates in vegetated wetland filters compared to unvegetated filters
See original reference in Anderson, Guthrie, and Walton 1993
Dodecyl linear alcohol ethoxylate
Soybean (Glycine max) RD Initial mineralization rates in rhizosphere soils increased by 1.1x to 1.9x compared to unvegetated soils
See original reference in Anderson, Guthrie, and Walton 1993
Dodecyl linear alcohol ethoxylate
Cattail (Typha spp.) RD Increased mineralization rates in vegetated sediments compared to root-free sediments
See original reference in Anderson, Guthrie, and Walton 1993
Dodecyl linear alcohol ethoxylate
Corn (Zea mays) RD Initial mineralization rates in rhizosphere soils increased by 1.1x to 1.9x compared to unvegetated soils
See original reference in Anderson, Guthrie, and Walton 1993
Dodecyl linear alkylbenzene sulfonate
Soybean (Glycine max) RD Initial mineralization rates in rhizosphere soils increased by 1.1x to 1.9x compared to unvegetated soils
See original reference in Anderson, Guthrie, and Walton 1993
Dodecyl linear alkylbenzene sulfonate
Cattail (Typha spp.) RD Increased mineralization rates in vegetated sediments compared to root-free sediments
See original reference in Anderson, Guthrie, and Walton 1993
Dodecyl linear alkylbenzene sulfonate
Corn (Zea mays) RD Initial mineralization rates in rhizosphere soils increased by 1.1x to 1.9x compared to unvegetated soils
See original reference in Anderson, Guthrie, and Walton 1993
Dodecyltrimethyl ammonium chloride
Soybean (Glycine max) RD Initial mineralization rates in rhizosphere soils increased by 1.1x to 1.9x compared to unvegetated soils
See original reference in Anderson, Guthrie, and Walton 1993
Dodecyltrimethyl ammonium chloride
Cattail (Typha spp.) RD Increased mineralization rates in vegetated sediments compared to root-free sediments
See original reference in Anderson, Guthrie, and Walton 1993
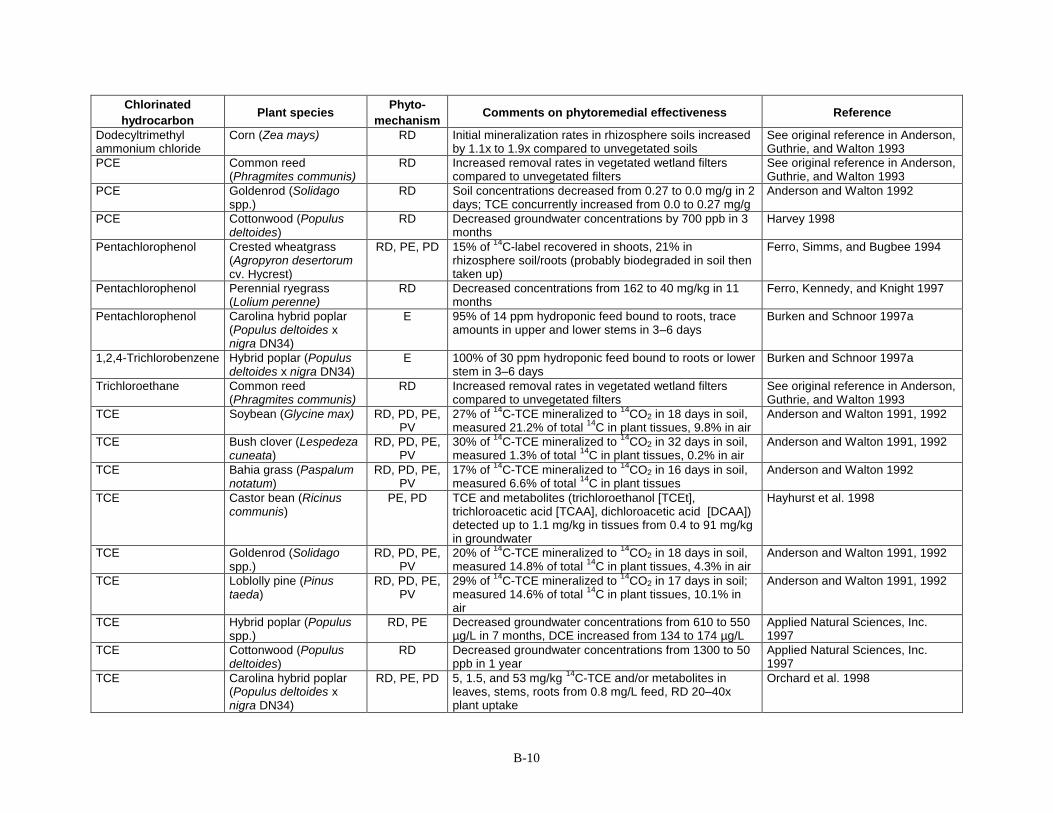
B-10
Chlorinated
hydrocarbon Plant species
Phyto-
mechanism Comments on phytoremedial effectiveness Reference
Dodecyltrimethyl ammonium chloride
Corn (Zea mays) RD Initial mineralization rates in rhizosphere soils increased by 1.1x to 1.9x compared to unvegetated soils
See original reference in Anderson, Guthrie, and Walton 1993
PCE Common reed (Phragmites communis)
RD Increased removal rates in vegetated wetland filters compared to unvegetated filters
See original reference in Anderson, Guthrie, and Walton 1993
PCE Goldenrod (Solidago spp.)
RD Soil concentrations decreased from 0.27 to 0.0 mg/g in 2 days; TCE concurrently increased from 0.0 to 0.27 mg/g
Anderson and Walton 1992
PCE Cottonwood (Populus deltoides)
RD Decreased groundwater concentrations by 700 ppb in 3 months
Harvey 1998
Pentachlorophenol Crested wheatgrass (Agropyron desertorum cv. Hycrest)
RD, PE, PD 15% of 14
C-label recovered in shoots, 21% in rhizosphere soil/roots (probably biodegraded in soil then taken up)
Ferro, Simms, and Bugbee 1994
Pentachlorophenol Perennial ryegrass (Lolium perenne)
RD Decreased concentrations from 162 to 40 mg/kg in 11 months
Ferro, Kennedy, and Knight 1997
Pentachlorophenol Carolina hybrid poplar (Populus deltoides x nigra DN34)
E 95% of 14 ppm hydroponic feed bound to roots, trace amounts in upper and lower stems in 3–6 days
Burken and Schnoor 1997a
1,2,4-Trichlorobenzene Hybrid poplar (Populus deltoides x nigra DN34)
E 100% of 30 ppm hydroponic feed bound to roots or lower stem in 3–6 days
Burken and Schnoor 1997a
Trichloroethane Common reed (Phragmites communis)
RD Increased removal rates in vegetated wetland filters compared to unvegetated filters
See original reference in Anderson, Guthrie, and Walton 1993
TCE Soybean (Glycine max) RD, PD, PE, PV
27% of 14
C-TCE mineralized to 14
CO2 in 18 days in soil, measured 21.2% of total
14C in plant tissues, 9.8% in air
Anderson and Walton 1991, 1992
TCE Bush clover (Lespedeza cuneata)
RD, PD, PE, PV
30% of 14
C-TCE mineralized to 14
CO2 in 32 days in soil, measured 1.3% of total
14C in plant tissues, 0.2% in air
Anderson and Walton 1991, 1992
TCE Bahia grass (Paspalum notatum)
RD, PD, PE, PV
17% of 14
C-TCE mineralized to 14
CO2 in 16 days in soil, measured 6.6% of total
14C in plant tissues
Anderson and Walton 1992
TCE Castor bean (Ricinus communis)
PE, PD TCE and metabolites (trichloroethanol [TCEt], trichloroacetic acid [TCAA], dichloroacetic acid [DCAA]) detected up to 1.1 mg/kg in tissues from 0.4 to 91 mg/kg in groundwater
Hayhurst et al. 1998
TCE Goldenrod (Solidago spp.)
RD, PD, PE, PV
20% of 14
C-TCE mineralized to 14
CO2 in 18 days in soil, measured 14.8% of total
14C in plant tissues, 4.3% in air
Anderson and Walton 1991, 1992
TCE Loblolly pine (Pinus taeda)
RD, PD, PE, PV
29% of 14
C-TCE mineralized to 14
CO2 in 17 days in soil; measured 14.6% of total
14C in plant tissues, 10.1% in
air
Anderson and Walton 1991, 1992
TCE Hybrid poplar (Populus spp.)
RD, PE Decreased groundwater concentrations from 610 to 550 µg/L in 7 months, DCE increased from 134 to 174 µg/L
Applied Natural Sciences, Inc. 1997
TCE Cottonwood (Populus deltoides)
RD Decreased groundwater concentrations from 1300 to 50 ppb in 1 year
Applied Natural Sciences, Inc. 1997
TCE Carolina hybrid poplar (Populus deltoides x nigra DN34)
RD, PE, PD 5, 1.5, and 53 mg/kg 14
C-TCE and/or metabolites in leaves, stems, roots from 0.8 mg/L feed, RD 20–40x plant uptake
Orchard et al. 1998

B-11
Chlorinated
hydrocarbon Plant species
Phyto-
mechanism Comments on phytoremedial effectiveness Reference
TCE Carolina hybrid poplar (Populus deltoides x nigra DN34)
RF (PE, PV) 70% of 50 ppm hydroponic feed volatilized, 5% accumulated in upper stems, 20% in lower stems, and 5% bound to roots in 3–6 days
Burken and Schnoor 1997a
TCE Hybrid poplar (Populus trichocarpa xP.deltoides 50-189)
PE, PD, PV From 50 ppm TCE in feed, up to 49 and 1,900 mg/kg TCE found in leaves and stems, up to 7,200 and 170 mg/kg metabolites (TCEt, TCAA, DCAA) in leaves and stems, up to 0.81 µg TCE transpired in 0.5 hours
Newman et al. 1997b, Gordon et al. 1997
TCE Hybrid poplar (Populus trichocarpa xP.deltoides H11-11)
PE, PD, PV From 50 ppm TCE in feed, up to 13, 770, and 640 mg/kg TCE found in leaves, stems, roots, up to 1,100, 140, and 320 mg/kg metabolites (TCEt, TCAA, DCAA) in leaves, stems, roots, up to 0.54 µg TCE transpired in 0.5 hours
Newman et al. 1997b, Gordon et al. 1997
TCE Hybrid poplar (Populus trichocarpa xP.maximowiczii 289-19)
PV Up to 0.22 µg TCE transpired in 0.5 hours Newman et al. 1997b
TCE Live oak (Quercus virginiana)
PE, PD, PV 9 µg/L measured in transpiration, TCE and metabolites detected up to 1.1 mg/kg in tissues from 0.4 to 91 mg/kg in groundwater
Hayhurst et al. 1998
TCE Saw palmetto (Serenoa repens)
PE, PD TCE and metabolites (TCEt, TCAA, DCAA ) detected up to 1.1 mg/kg in tissues from 0.4 to 91 mg/kg in groundwater
Hayhurst et al. 1998
Table B-3. Plants remediating pesticides
Pesticide Plant species Phyto-
mechanism Comments on phytoremedial effectiveness Reference
2,4-D Flax (Linum spp.) RD Specific bacterial populations increased in the rhizosphere by 1–2 orders of magnitude
See original reference in Anderson, Guthrie, and Walton 1993
2,4-D Sugarcane/African clover (Saccharum spp./Trifolium spp.)
RD Population of degrading microbes higher in sugarcane rhizosphere compared to sensitive African clover
See original reference in Anderson, Guthrie, and Walton 1993
2,4-D Wheat (Triticum aestevum) RD Mixed rhizosphere consortia shown to use as carbon source See original reference in Anderson, Guthrie, and Walton 1993
Alachlor Corn (Zea mays) RD, PE 74.6% of 1.35 kg/ha biotransformed in the soil, 12.5% taken up into plant
Paterson and Schnoor 1992
Alachlor Hybrid poplars (Populus spp.) RD Decreased groundwater concentrations from 1,900 to 100 ppb in 4 years
Applied Natural Sciences, Inc. 1997
Alachlor Hybrid poplars (Populus spp.) RD Decreased soil concentrations from 175 to 10 ppm in 3 years Applied Natural Sciences, Inc. 1997
Atrazine Kochia spp. RD Decreased soil concentrations from an initial of 0.5 ppm by 43% in 14 days
Anderson, Kruger, and Coats 1994

B-12
Pesticide Plant species Phyto-
mechanism Comments on phytoremedial effectiveness Reference
Atrazine Cattail (Typha spp.) (PS) 95% removals achieved Kadlec and Knight 1996
Atrazine Corn (Zea mays) RD, PE 82.0% of 0.78 kg/ha biotransformed in the soil, 5.5% taken up into plant
Paterson and Schnoor 1992
Atrazine Hybrid poplar (Populus spp.) RD Decreased groundwater concentrations from 1,600 to 50 ppb in 4 years
Applied Natural Sciences, Inc. 1997
Atrazine Hybrid poplar (Populus spp.) RD Decreased soil concentrations from 900 to 10 ppm in 3 years Applied Natural Sciences, Inc. 1997
Atrazine Hybrid poplar (Populus spp.) RD, PD Concentrations reduced by 10%–20% in soil and 100% in sand
Black 1995
Atrazine Hybrid poplar (Populus spp.) RD, PE 82.6% of 1.34 kg/ha biotransformed in the soil, 3.6% taken up into plant
Paterson and Schnoor 1992
Atrazine Hybrid poplar (Populus spp. cv. Imperial Carolina)
RD, PE, PD 370 mg/kg 14
C-atrazine applied to soil, 10.4, 1.4, and 2.8 mg/kg
14C found in tissue, majority degraded in soil
Nair et al. 1992
Atrazine Carolina hybrid poplar (Populus deltoides x nigra DN34)
RD, PE, PD Metabolic products of 14
C-atrazine found in soil, roots, stems, and leaves at various percentages of total label
Burken and Schnoor 1997b
Atrazine Carolina hybrid poplar (Populus deltoides x nigra DN34)
(PE, PV) 60% of 260 ppb hydroponic feed volatilized, 5% accumulated in upper stem, 5% in leaves in 3–6 days
Burken and Schnoor 1997a
Benthiocarb Rice (Oryza sativa) RD 8x increase in heterotrophic bacteria in rhizospheric soils compared to unvegetated soils
See original reference in Anderson, Guthrie, and Walton 1993
Demeton-8-methyl
Duckweed (Lemna minor) PE, PD Approximately 10% total transformation (PE and PD) measured in 48 hours
Gao et al. 1998
Demeton-8-methyl
Parrot feather (Myriophyllum aquaticum)
PE, PD Approximately 14% total degradation measured (10% found in plant) in 48 hours
Gao et al. 1998
Diazinon Bush bean (Phaseolus vulgaris)
RD Decreased soil concentrations by 18%, mineralization to 14
CO2 measured Hsu and Bartha 1979
Diazinon Peas (Pisum sativum) RD Rhizosphere microbes increased by 2 orders of magnitude compared to unvegetated soils
See original reference in Anderson, Guthrie, and Walton 1993
Diazinon Wheat (Triticum aestevum) RD Rhizosphere microbes increased by 2 orders of magnitude compared to unvegetated soils
See original reference in Anderson, Guthrie, and Walton 1993
Diazinon Corn (Zea mays) RD Rhizosphere microbes increased by 2 orders of magnitude compared to unvegetated soils
See original reference in Anderson, Guthrie, and Walton 1993
Dioxane Hybrid poplar (Populus spp.) RD, PE, PD Decreased soil microcosm concentrations from 95 to 0 mg/L in 40 days
Schnoor et al. 1997, Schnoor 1997
MCPA Wheat (Triticum aestevum) RD Mixed rhizosphere consortia shown to use as carbon source See original reference in Anderson, Guthrie, and Walton 1993

B-13
Pesticide Plant species Phyto-
mechanism Comments on phytoremedial effectiveness Reference
Malathion Duckweed (Lemna minor) PE, PD Approximately 25% total transformation (PE and PD) measured in 24 hours
Gao et al. 1998
Malathion Parrot feather (Myriophyllum aquaticum)
PE, PD Approximately 55% total degradation measured (25% found in plant) in 48 hours
Gao et al. 1998
Mecoprop Wheat (Triticum aestevum) RD Mixed rhizosphere consortia shown to use as carbon source See original reference in Anderson, Guthrie, and Walton 1993
Metolachor Coontail (Ceratophyllum demersum)
PE 1.5% remaining in the water after 16 days Rice, Anderson, and Coats 1996b
Metolachlor Kochia spp. RD Decreased soil concentrations from an initial of 9.6 ppm by 49% in 14 days
Anderson, Kruger, and Coats 1994
Metolachor Duckweed (Lemna minor) PE 25% remaining in the water after 16 days Rice, Anderson, and Coats 1996b
Metolachlor Hybrid poplar (Populus spp.) RD Decreased groundwater concentrations from 1,900 to 350 ppb in 4 years
Applied Natural Sciences, Inc. 1997
Metolachlor Hybrid poplar (Populus spp.) RD Decreased soil concentrations from 300 to 10 ppm in 3 years Applied Natural Sciences, Inc. 1997
Metribuzin Hybrid poplar (Populus spp.) RD Decreased groundwater concentrations from 400 to 25 ppb in 4 years
Applied Natural Sciences, Inc. 1997
Parathion Rice (Oryza sativa) RD Decreased soil concentrations by 25%, mineralization to 14
CO2 measured Reddy and Sethunathan 1983
Parathion Rice (Oryza sativa) RD Increased mineralization in rhizospheric soils compared to unvegetated soils
See original reference in Anderson, Guthrie, and Walton 1993
Parathion Bush bean (Phaseolus vulgaris)
RD Decreased soil concentrations by 18%, mineralization to 14
CO2 measured Hsu and Bartha 1979
Propanil Rice (Oryza sativa) RD Decreased soil concentrations from an initial of 3 mg/kg by >90% in 48 hours
Hoagland, Zablotowicz, and Locke 1994
Ruelene Parrot feather (Myriophyllum aquaticum)
PE, PD Approximately 17% total degradation measured (11% found in plant) in 48 hours
Gao et al. 1998
Temik Cotton (Gossypium spp.) RD Higher microbial counts in rhizosphere soils compared to unvegetated soils
See original reference in Anderson, Guthrie, and Walton 1993
Temik Beans (Phaseolus spp.) RD Higher microbial counts in rhizosphere soils compared to unvegetated soils
See original reference in Anderson, Guthrie, and Walton 1993
Temik Corn (Zea mays) RD Higher microbial counts in rhizosphere soils compared to unvegetated soils
See original reference in Anderson, Guthrie, and Walton 1993
Trifluralin Kochia spp. RD Decreased soil concentrations from an initial of 0.3 ppm by 69% in 14 days
Anderson, Kruger, and Coats 1994

B-14
2. INORGANIC REMEDIATION BY PLANTS
Table B-4. Plants accumulating significant concentrations of essential plant elements
Inorganic Plant species Phyto-
mechanism Comments on phytoremedial effectiveness Reference
B Beetroot (Beta vulgaris) PE, PS 36 mg/kg in soil concentrated to 800 mg/kg in beetroot leaves and 73 mg/kg in beetroot
Speir, August, and Feltham 1992
B Day flower (Commelinae spp.) PE Accumulated up to 43.5 mg/kg in plant tissue Keiffer and Ungar 1996
B Morning glory (Ipomoea spp.) PE Accumulated up to 35.0 mg/kg in plant tissue Keiffer and Ungar 1996
B Clover (Trifolium repens cv. Huia)
PE, PS 36 mg/kg in soil concentrated to 570 mg/kg in leaves and 89 mg/kg in roots
Speir, August, and Feltham 1992
Ca Atriplex prostrata PE Accumulated up to 6,460 mg/kg in shoots Keiffer 1996
Ca Day flower (Commelinae spp.) PE Accumulated up to 13,690 mg/kg in plant tissue Keiffer and Ungar 1996
Ca Bermuda grass (Cynodon dactylon)
PE Accumulated up to 6,180 mg/kg in plant tissue Keiffer and Ungar 1996
Ca Cyperus spp. PE Accumulated up to 11,200 mg/kg in plant tissue Keiffer and Ungar 1996
Ca Wild rye (Elymus spp.) PE, PS 410 ppm in soil concentrated to 7,000 ppm in plants Cipollini and Pickering 1986
Ca Squirrel tail grass (Hordeum jubatum)
PE Accumulated up to 4,130 mg/kg in shoots Keiffer 1996
Ca Barley (Hordeum vulgare) PE, PS 4,700 ppm in soil concentrated to 35,000 ppm in plants Cipollini and Pickering 1986
Ca Barley (Hordeum vulgare cv. Atlas 57)
PE Accumulated up to 4.43% (dry wt.) in shoots Chaudhry, Wallace, and Mueller 1977
Ca Morning glory (Ipomoea spp.) PE Accumulated up to 13,200 mg/kg in plant tissue Keiffer and Ungar 1996
Ca Tomato (Lycopersicon esculentum cv. Marmande)
PE, PS 160.4 mg/L in soil water concentrated up to 21,000, 19,000, and 50,000 mg/kg in roots, stems, and leaves
Moral et al. 1995
Ca Beans (Phaseolus vulgaris) PE, PS 3,500 ppm in soil concentrated to 30,000 ppm in plants Cipollini and Pickering 1986
Ca Bush beans (Phaseolus vulgaris cv. Improved Tendergreen)
PE Accumulated up to 4.3% (dry wt.) in leaves Chaudhry, Wallace, and Mueller 1977
Ca Slender or jointed glasswort (Salicornia europaea)
PE Accumulated up to 4,650 mg/kg in shoots Keiffer 1996
Ca Spurries (Spergularia marina) PE Accumulated up to 3,050 mg/kg in shoots Keiffer 1996
Ca Type of sea blight (Suaeda calceoliformis)
PE Accumulated up to 5,050 mg/kg in shoots Keiffer 1996
Cu Beetroot (Beta vulgaris) PE, PS 64 mg/kg in soil concentrated to 200 mg/kg in beetroot Speir, August, and Feltham 1992
Cu Indian mustard (Brassica juncea)
Decreased solution concentration from 6.0 to 1.2 mg/L in 8 hours
Phytotech, Inc. 1997
Cu Indian mustard (Brassica juncea cv. 182921)
PE 10 mg/kg in soil concentrated to 70 mg/kg in shoots Kumar et al. 1995
Cu Indian Mustard (Brassica juncea cv. 426308)
PE 200 mg/kg in soil (+chelate) concentrated to 1,000 mg/kg in shoots, simultaneous with other metals
Blaylock et al. 1997

B-15
Inorganic Plant species Phyto-
mechanism Comments on phytoremedial effectiveness Reference
Cu Sunflower (Helianthus annuus)
Decreased solution concentration from 9,000 to 1,000 µg/L in 24 hours
Salt et al. 1995
Cu Lettuce (Lactuca sativa cv. cos)
PE, PS 64 mg/kg in soil concentrated to 80 mg/kg in roots Speir, August, and Feltham 1992
Cu Ryegrass (Lolium perenne) PE, PS Accumulated up to 50 mg/kg in shoots and 94 mg/kg in roots Otabbong 1990
Cu Alfalfa (Medicago sativa) PE, PS Bound 3.4 mg/g tissue from groundwater Tiemann et al. 1998
Cu Reed (Phragmites spp.) Accumulated up to 38 mg/kg in plant tissue Kadlec and Knight 1996
Cu Alpine pennycress (Thlaspi caerulescens)
PE, PS 1 mg/L in solution concentrated to 623 mg/kg in shoots and 61,000 mg/kg in roots
Salt et al. 1995
Cu Clover (Trifolium repens cv. Huia)
PE, PS 64 mg/kg in soil concentrated to 85 mg/kg in roots Speir, August, and Feltham 1992
Cu Cattail (Typha spp.) Accumulated up to 45 mg/kg in plant tissue Kadlec and Knight 1996
Fe Day flower (Commelinae spp.) PE Accumulated up to 102.2 mg/kg in plant tissue Keiffer and Ungar 1996
Fe Cyperus spp. PE Accumulated up to 125.6 mg/kg in plant tissue Keiffer and Ungar 1996
Fe Morning glory (Ipomoea spp.) PE Accumulated up to 248.4 mg/kg in plant tissue Keiffer and Ungar 1996
Fe Ryegrass (Lolium perenne) PE, PS 25 mg/kg in soil concentrated up to 1,210 mg/kg in shoots and 4,910 mg/kg in roots
Otabbong 1990
Fe Bush beans (Phaseolus vulgaris cv. Contender)
PE 0.56 mg/kg concentrated up to 102.5 mg/kg in roots, 59.7 mg/kg in stems, and 130.3 mg/kg in leaves
Bonet, Poschenreider, and Barcelo 1991
Fe Common reed (Phragmites australis)
Accumulated 65.8 mg/kg in shoots, 3,709 mg/kg in roots Kadlec and Knight 1996
Fe Ground cherry (Physalis spp.) PE Accumulated up to 350.9 mg/kg in plant tissue Keiffer and Ungar 1996
Mg Atriplex prostrata PE Accumulated up to 6,200 mg/kg in shoots Keiffer 1996
Mg Day flower (Commelinae spp.) PE Accumulated up to 8,260 mg/kg in plant tissue Keiffer and Ungar 1996
Mg Type of grass (Echinochloa spp.)
PE Accumulated up to 4,330 mg/kg in plant tissue Keiffer and Ungar 1996
Mg Wild rye (Elymus spp.) PE, PS 60 ppm in soil concentrated to 1,200 ppm in plants Cipollini and Pickering 1986
Mg Squirrel tail grass (Hordeum jubatum)
PE Accumulated up to 3,330 mg/kg in shoots Keiffer 1996
Mg Barley (Hordeum vulgare) PE, PS 570 ppm in soil concentrated to 9,100 ppm in plants Cipollini and Pickering 1986
Mg Barley (Hordeum vulgare cv. Altas 57)
PE Accumulated up to 0.55% (dry wt.) in shoots Chaudhry, Wallace, and Mueller 1977
Mg Morning glory (Ipomoea spp.) PE Accumulated up to 6,650 mg/kg in plant tissue Keiffer and Ungar 1996
Mg Tomato (Lycopersicon esculentum cv.Marmand)
PE, PS 31.6 mg/L in soil water concentrated up to 10,000, 11,000, and 9,500 mg/kg in roots, stems, and leaves
Moral et al. 1995
Mg Beans (Phaseolus vulgaris) PE, PS 390 ppm in soil concentrated to 7,200 ppm in plants Cipollini and Pickering 1986
Mg Bush beans (Phaseolus vulgaris cv. Improved Tendergreen)
PE Accumulated up to 0.61% (dry wt.) in leaves Chaudhry, Wallace, and Mueller 1977
Mg Slender or jointed glasswort (Salicornia europaea)
PE Accumulated up to 5,690 mg/kg in shoots Keiffer 1996

B-16
Inorganic Plant species Phyto-
mechanism Comments on phytoremedial effectiveness Reference
Mg Spurries (Spergularia marina) PE Accumulated up to 3,450 mg/kg in shoots Keiffer 1996
Mg Type of sea blight (Suaeda calceoliformis)
PE Accumulated up to 5,250 mg/kg in shoots Keiffer 1996
Mg Corn (Zea mays) PE, PS 60 ppm in soil concentrated to 1,800 ppm in plants Cipollini and Pickering 1986
Mn Beaked sedge (Carex rostrata)
PE Accumulated up to 616 mg/kg in plant tissues Kadlec and Knight 1996
Mn Bermuda grass (Cynodon dactylon)
PE Accumulated up to 114.1 mg/kg in plant tissue Keiffer and Ungar 1996
Mn Cyperus spp. PE Accumulated up to 136.5 mg/kg in plant tissue Keiffer and Ungar 1996
Mn Sunflower (Helianthus annuus)
Decreased solution concentration from 5,000 to 0 µg/L in 24 hours
Salt et al. 1995
Mn Morning glory (Ipomoea spp.) PE Accumulated up to 149.5 mg/kg in plant tissue Keiffer and Ungar 1996
Mn Common reed (Phragmites australis)
Accumulated 68.9 mg/kg in shoots, 289 mg/kg in roots Kadlec and Knight 1996
Mn Bulrush and cattail (Scirpus and Typha spp.)
Accumulated up to 1,200 mg/kg in plant tissues Kadlec and Knight, 1996
NH4 Meadow rush and salt grass (Juncus spp. and Distichlis spicata)
Decreased concentrations from 14.1 to 0.1 mg/L (near natural background)
Kadlec and Knight 1996
NH4 Hybrid poplars (Populus spp.) PE, PS Decreased groundwater concentrations from 140 to 20 mg/kg in 1 year
Applied Natural Sciences, Inc. 1997
NO3 Meadow rush and salt grass (Juncus spp. and Distichlis spicata)
Decreased concentrations from 41 to 0.6 mg/L (below natural background)
Kadlec and Knight 1996
NO3 Tomato (Lycopersicon esculentum cv.Marmand)
PE, PS 700 mg/L in soil water concentrated up to 21,000, 27,000, and 47,000 mg/kg in roots, stems, and leaves
Moral et al. 1995
NO3 Hybrid poplars (Populus spp.) PE, PS Decreased groundwater concentrations by over 100 mg/kg compared to unvegetated areas
Applied Natural Sciences, Inc. 1997
Total P Day flower (Commelinae spp.) PE Accumulated up to 3,990 mg/kg in plant tissue Keiffer and Ungar 1996
Total P Bermuda grass (Cynodon dactylon)
PE Accumulated up to 3,000 mg/kg in plant tissue Keiffer and Ungar 1996
Total P Cyperus spp. PE Accumulated up to 6,010 mg/kg in plant tissue Keiffer and Ungar 1996
Total P Type of grass (Echinochloa spp.)
PE Accumulated up to 5,430 mg/kg in plant tissue Keiffer and Ungar 1996
Total P Morning glory (Ipomoea spp.) PE Accumulated up to 4,060 mg/kg in plant tissue Keiffer and Ungar 1996
Total P Type of grass (Leptochola spp.)
PE Accumulated up to 3,090 mg/kg in plant tissue Keiffer and Ungar 1996
Total P Ryegrass (Lolium perenne) PE, PS Accumulated up to 4,110 mg/kg in shoots and 3,010 mg/kg in roots
Otabbong 1990

B-17
Inorganic Plant species Phyto-
mechanism Comments on phytoremedial effectiveness Reference
Total P Meadow rush and salt grass (Juncus spp. and Distichlis spicata)
Decreased concentrations from 24 to 0.7 mg/L (below natural background)
Kadlec and Knight 1996
Total P Sesbania spp. PE Accumulated up to 4,010 mg/kg in plant tissue Keiffer and Ungar 1996
PO4 Tomato (Lycopersicon esculentum cv.Marmand)
PE, PS 142.5 mg/L in soil water concentrated up to 2,500, 2,600, and 5,500 mg/kg in roots, stems, and leaves
Moral et al. 1995
K Atriplex prostrata PE Accumulated up to 20,300 mg/kg in shoots Keiffer 1996
K Day flower (Commelinae spp.) PE Accumulated up to 24,400 mg/kg in plant tissue Keiffer and Ungar 1996
K Bermuda grass (Cynodon dactylon)
PE Accumulated up to 19,700 mg/kg in plant tissue Keiffer and Ungar 1996
K Cyperus spp. PE Accumulated up to 51,000 mg/kg in plant tissue Keiffer and Ungar 1996
K Type of grass (Echinochloa spp.)
PE Accumulated up to 26,100 mg/kg in plant tissue Keiffer and Ungar 1996
K Wild rye (Elymus spp.) PE, PS 110 ppm in soil concentrated to 25,000 ppm in plants (concentration factors up to 257x reported)
Cipollini and Pickering 1986
K Squirrel tail grass (Hordeum jubatum)
PE Accumulated up to 29,300 mg/kg in shoots Keiffer 1996
K Barley (Hordeum vulgare) PE, PS 200 ppm in soil concentrated to 20,000 ppm in plants (concentration factors up to 2,900x reported)
Cipollini and Pickering 1986
K Barley (Hordeum vulgare cv. Altas 57)
PE Accumulated up to 6.15% (dry wt.) in shoots Chaudhry, Wallace, and Mueller 1977
K Morning glory (Ipomoea spp.) PE Accumulated up to 34,300 mg/kg in plant tissue Keiffer and Ungar 1996
K Tomato (Lycopersicon esculentum cv. Marmande)
PE, PS 215.1 mg/L in soil water concentrated up to 23,000, 51,000, and 34,000 mg/kg in roots, stems, and leaves
Moral et al. 1995
K Beans (Phaseolus vulgaris) PE, PS 140 ppm in soil concentrated to 21,000 ppm in plants (concentration factors up to 1,200x reported)
Cipollini and Pickering, 1986
K Bush beans (Phaseolus vulgaris cv. Improved Tendergreen)
PE Accumulated up to 3.06% (dry wt.) in leaves Chaudhry, Wallace, and Mueller 1977
K Slender or jointed glasswort (Salicornia europaea)
PE Accumulated up to 38,800 mg/kg in shoots Keiffer 1996
K Spurries (Spergularia marina) PE Accumulated up to 41,200 mg/kg in shoots Keiffer 1996
K Type of sea blight (Suaeda calceoliformis)
PE Accumulated up to 15,900 mg/kg in shoots Keiffer 1996
K Corn (Zea mays) PE, PS 60 ppm in soil concentrated to 13,000 ppm in plants Cipollini and Pickering 1986
Zn Indian mustard (Brassica juncea)
RF Decreased solution concentration from 95 to 15 mg/L in 8 hrs Phytotech, Inc. 1997
Zn Indian mustard (Brassica juncea cv. 182921)
PE 100 mg/kg in soil concentrated to 1,723 mg/kg in shoots Kumar et al. 1995
Zn Indian mustard (Brassica juncea cv. 426308)
PE 300 mg/kg in soil (+chelate) concentrated to 1,100 mg/kg in shoots, simultaneous with other metals
Blaylock et al. 1997
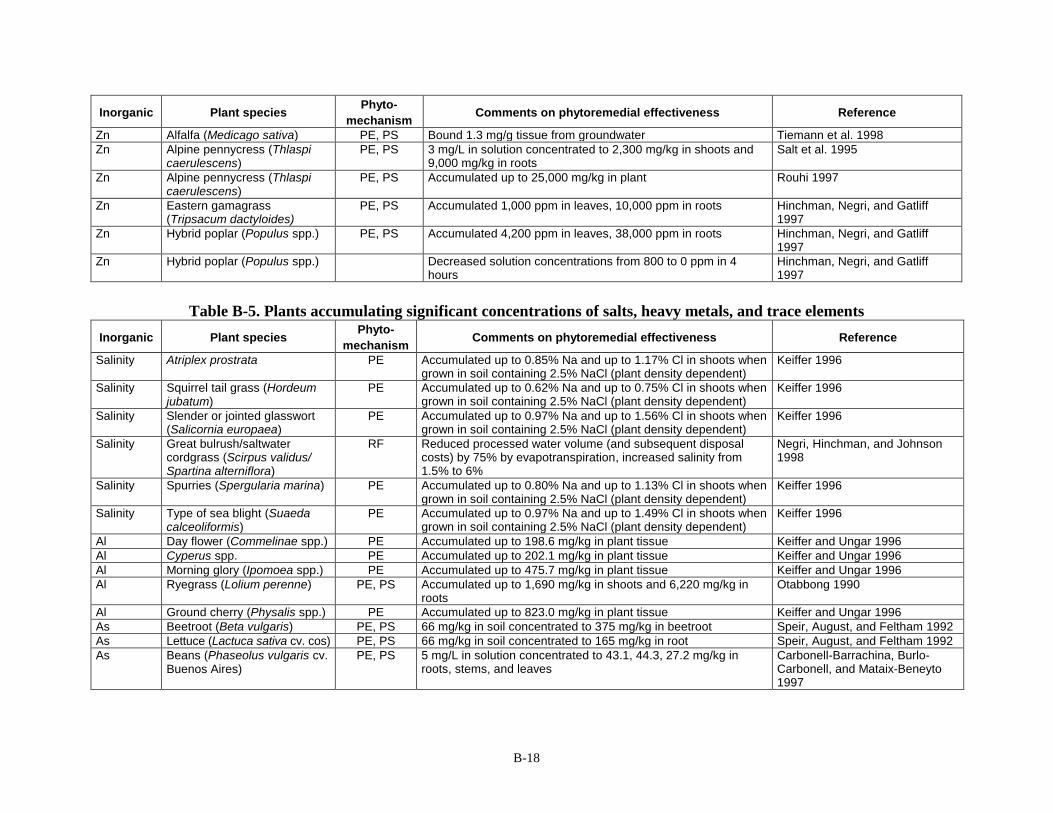
B-18
Inorganic Plant species Phyto-
mechanism Comments on phytoremedial effectiveness Reference
Zn Alfalfa (Medicago sativa) PE, PS Bound 1.3 mg/g tissue from groundwater Tiemann et al. 1998
Zn Alpine pennycress (Thlaspi caerulescens)
PE, PS 3 mg/L in solution concentrated to 2,300 mg/kg in shoots and 9,000 mg/kg in roots
Salt et al. 1995
Zn Alpine pennycress (Thlaspi caerulescens)
PE, PS Accumulated up to 25,000 mg/kg in plant Rouhi 1997
Zn Eastern gamagrass (Tripsacum dactyloides)
PE, PS Accumulated 1,000 ppm in leaves, 10,000 ppm in roots Hinchman, Negri, and Gatliff 1997
Zn Hybrid poplar (Populus spp.) PE, PS Accumulated 4,200 ppm in leaves, 38,000 ppm in roots Hinchman, Negri, and Gatliff 1997
Zn Hybrid poplar (Populus spp.) Decreased solution concentrations from 800 to 0 ppm in 4 hours
Hinchman, Negri, and Gatliff 1997
Table B-5. Plants accumulating significant concentrations of salts, heavy metals, and trace elements
Inorganic Plant species Phyto-
mechanism Comments on phytoremedial effectiveness Reference
Salinity Atriplex prostrata PE Accumulated up to 0.85% Na and up to 1.17% Cl in shoots when grown in soil containing 2.5% NaCl (plant density dependent)
Keiffer 1996
Salinity Squirrel tail grass (Hordeum jubatum)
PE Accumulated up to 0.62% Na and up to 0.75% Cl in shoots when grown in soil containing 2.5% NaCl (plant density dependent)
Keiffer 1996
Salinity Slender or jointed glasswort (Salicornia europaea)
PE Accumulated up to 0.97% Na and up to 1.56% Cl in shoots when grown in soil containing 2.5% NaCl (plant density dependent)
Keiffer 1996
Salinity Great bulrush/saltwater cordgrass (Scirpus validus/ Spartina alterniflora)
RF Reduced processed water volume (and subsequent disposal costs) by 75% by evapotranspiration, increased salinity from 1.5% to 6%
Negri, Hinchman, and Johnson 1998
Salinity Spurries (Spergularia marina) PE Accumulated up to 0.80% Na and up to 1.13% Cl in shoots when grown in soil containing 2.5% NaCl (plant density dependent)
Keiffer 1996
Salinity Type of sea blight (Suaeda calceoliformis)
PE Accumulated up to 0.97% Na and up to 1.49% Cl in shoots when grown in soil containing 2.5% NaCl (plant density dependent)
Keiffer 1996
Al Day flower (Commelinae spp.) PE Accumulated up to 198.6 mg/kg in plant tissue Keiffer and Ungar 1996
Al Cyperus spp. PE Accumulated up to 202.1 mg/kg in plant tissue Keiffer and Ungar 1996
Al Morning glory (Ipomoea spp.) PE Accumulated up to 475.7 mg/kg in plant tissue Keiffer and Ungar 1996
Al Ryegrass (Lolium perenne) PE, PS Accumulated up to 1,690 mg/kg in shoots and 6,220 mg/kg in roots
Otabbong 1990
Al Ground cherry (Physalis spp.) PE Accumulated up to 823.0 mg/kg in plant tissue Keiffer and Ungar 1996
As Beetroot (Beta vulgaris) PE, PS 66 mg/kg in soil concentrated to 375 mg/kg in beetroot Speir, August, and Feltham 1992
As Lettuce (Lactuca sativa cv. cos) PE, PS 66 mg/kg in soil concentrated to 165 mg/kg in root Speir, August, and Feltham 1992
As Beans (Phaseolus vulgaris cv. Buenos Aires)
PE, PS 5 mg/L in solution concentrated to 43.1, 44.3, 27.2 mg/kg in roots, stems, and leaves
Carbonell-Barrachina, Burlo-Carbonell, and Mataix-Beneyto 1997

B-19
Inorganic Plant species Phyto-
mechanism Comments on phytoremedial effectiveness Reference
As Clover (Trifolium repens cv. Huia)
PE, PS 66 mg/kg in soil concentrated to 130 mg/kg in root Speir, August, and Feltham 1992
As Hybrid willow (Salix spp.) PE, PS 40 ppm sequestered mainly in the roots in 1 month from 100 ppm irrigation
Hinchman, Negri, and Gatliff 1997
Ba Barley (Hordeum vulgare cv. Altas 57)
PE 2,000 mg/kg in soil concentrated to 9,770 mg/kg in shoots Chaudhry, Wallace, and Mueller 1977
Ba Bush beans (Phaseolus vulgaris cv. Imp. Tendergreen)
PE 2,000 mg/kg in soil concentrated to 22,200 mg/kg in leaves, 12,600 in stems
Chaudhry, Wallace, and Mueller 1977
Cd Indian mustard (Brassica juncea)
Decreased solution concentration from 1.7 to 0.2 mg/L in 8 hours
Phytotech, Inc. 1997
Cd Indian mustard (Brassica juncea cv. 182921)
PE 2.0 mg/kg in soil concentrated to 104 mg/kg in shoots Kumar et al. 1995
Cd Indian mustard (Brassica juncea cv. 426308)
PE 100 mg/kg in soil (+chelate) concentrated to 2,800 mg/kg in shoots, simultaneous with other metals
Blaylock et al. 1997
Cd Chicory (Chicorium intybus var. foliosum)
PE 1.9 mg/kg in soil concentrated to 44.8, 23.6, and 18.0 mg/kg in leaves, stems, and roots
Martin et al. 1996
Cd Canada fleabane (Erigeron canadensis)
PE 1.9 mg/kg in soil concentrated to 47.4 mg/kg in leaves and 38.2 mg/kg in stems
Martin et al. 1996
Cd Dogfennel (Eupatorium capillifolium)
PE 1.9 mg/kg in soil concentrated to 12.3 mg/kg in leaves and 16.4 mg/kg in stems
Martin et al. 1996
Cd Sunflower (Helianthus annuus)
RF Decreased solution concentration from 900 to 220 µg/L in 24 hours
Salt et al. 1995
Cd Alfalfa (Medicago sativa) PE, PS Bound 1.5 mg/g tissue from groundwater Tiemann et al. 1998
Cd Tobacco (Nicotiana tabacum) (PE) Accumulated 550 mg/kg in aboveground tissues from 3.4 mg/L hydroponic solution
Yancey et al. 1998
Cd Purple nightshade (Solanum elaegnofolium)
PE, PS Accumulated up to 745, 65, 370 mg/kg in roots, stems, and leaves, respectively
Gardea-Torresdey et al. 1998a
Cd Alpine pennycress (Thlaspi caerulescens)
PE, PS 5 mg/L in solution concentrated to 295 mg/kg in shoots and 21,000 mg/kg in roots
Salt et al. 1995
Cd Alpine pennycress (Thlaspi caerulescens)
PE, PS Accumulated up to 5,000 mg/kg in plant Rouhi 1997
Cr(III) Chicory (Chicorium intybus var. foliosum)
PE 0.06 mg/kg in soil concentrated to 9.2, 3.4, and 5.1 mg/kg in leaves, stems, and roots
Martin et al. 1996
Cr(III) Canada fleabane (Erigeron canadensis)
PE 0.06 mg/kg in soil concentrated to 7.6 mg/kg in leaves and 6.4 mg/kg in stems
Martin et al. 1996
Cr(III) Dogfennel (Eupatorium capillifolium)
PE 0.06 mg/kg in soil concentrated to 9.4 mg/kg in leaves and 8.1 mg/kg in stems
Martin et al. 1996
Cr(III) Tomato (Lycopersicon esculentum cv. Marmande)
PE, PS 100 mg/L in soil water concentrated to 2354 mg/kg in roots Moral et al. 1995
Cr(III) Alfalfa (Medicago sativa) PE, PS Bound 8.2 mg/g tissue from groundwater Tiemann et al. 1998

B-20
Inorganic Plant species Phyto-
mechanism Comments on phytoremedial effectiveness Reference
Cr(III) Bush beans (Phaseolus vulgaris cv. Contender)
PE 52 µg/kg concentrated up to 155.4 mg/kg in roots, 3.8 mg/kg in stems, and 12.5 mg/kg in leaves
Bonet, Poschenrieder, and Barcelo 1991
Cr(VI) Beetroot (Beta vulgaris) PE, PS 179 mg/kg in soil concentrated to 320 mg/kg in beetroot Speir, August, and Feltham 1992
Cr(VI) Indian mustard (Brassica juncea)
RF Decreased solution concentration from 4.7 to 1.2 mg/L in 8 hours
Phytotech, Inc. 1997
Cr(VI) Indian mustard (Brassica juncea cv. 182921)
PE 3.5 mg/kg in soil concentrated to 202 mg/kg in shoots Kumar et al. 1995
Cr(VI) Sunflower (Helianthus annuus)
RF Decreased solution concentration from 1,100 to 0 µg/L in 24 hours
Salt et al. 1995
Cr(VI) Lettuce (Lactuca sativa cv. cos) PE, PS 179 mg/kg in soil concentrated to 200 mg/kg in root Speir, August, and Feltham 1992
Cr(VI) Duckweed (Lemna spp.) PE Accumulated up to 38 mg/kg in plant tissues Kadlec and Knight 1996
Cr(VI) Alpine pennycress (Thlaspi caerulescens)
PE, PS 0.4 mg/L in solution concentrated to 35.6 mg/kg in shoots and 3,400 mg/kg in roots
Salt et al. 1995
Cr(VI) Cattail and bulrush (Typha and Scirpus spp.)
PE 16.0 µg/L influent reduced to 3.6 µg/L at effluent Kadlec and Knight 1996
Au Alfalfa (Medicago sativa) PE Bound 40.9 mg/g in shoots and 18.7 mg/g in roots, gold reduced in tissues from Au(III) to Au(0)
Gardea-Torresdey et al. 1998b
Pb Spleen amaranth (pilewort) (Amaranthus hybridus)
PE, PS 625 mg/kg in solution concentrated to 0.3 g/kg in shoots and 8.7 g/kg in roots
Kumar et al. 1995
Pb Amaranth (Amaranthus paniculata)
PE, PS 625 mg/kg in solution concentrated to 0.4 g/kg in shoots and 8.9 g/kg in roots
Kumar et al. 1995
Pb Turnip (Brassica campestris) PE, PS 625 mg/kg in solution concentrated to 7.2 g/kg in shoots and 103.4 g/kg in roots
Kumar et al. 1995
Pb Brassica (Brassica carinata) PE, PS 625 mg/kg in solution concentrated to 4.6 g/kg in shoots and 108.9 g/kg in roots
Kumar et al. 1995
Pb Indian mustard (Brassica juncea)
PE, PS 625 mg/kg in solution concentrated to 10.3 g/kg in shoots and 103.5 g/kg in roots
Kumar et al. 1995
Pb Indian mustard (Brassica juncea)
PE Decreased solution concentration from 0.8 to 0.2 mg/L in 8 hours
Phytotech, Inc. 1997
Pb Indian mustard (Brassica juncea cv. 182921)
PE 500 mg/kg in soil concentrated to 844 mg/kg in shoots Kumar et al. 1995
Pb Indian mustard (Brassica juncea cv. 426308)
PE 600 mg/kg in soil (+chelate) concentrated to 16,500 mg/kg in shoots, simultaneous with other metals
Blaylock et al. 1997
Pb Canola (Brassica Napus) PE, PS 625 mg/kg in solution concentrated to 3.4 g/kg in shoots and 61.2 g/kg in roots
Kumar et al. 1995
Pb Black mustard (Brassica nigra)
PE, PS 625 mg/kg in solution concentrated to 9.4 g/kg in shoots and 106.6 g/kg in roots
Kumar et al. 1995
Pb Wild cabbage (Brassica oleracea)
PE, PS 625 mg/kg in solution concentrated to 0.6 g/kg in shoots and 52.7 g/kg in roots
Kumar et al. 1995
Pb Sedge (Carex microptera) PE Accumulated up to 1,000 mg/kg in aboveground tissues from soils at 3,000–15,000 mg/kg
Klassen et al. 1998

B-21
Inorganic Plant species Phyto-
mechanism Comments on phytoremedial effectiveness Reference
Pb Sunflower (Helianthus annuus)
PE, PS 625 mg/kg in solution concentrated to 5.6 g/kg in shoots and 61.6 g/kg in roots
Kumar et al. 1995
Pb Duckweed (Lemna minor) PE Accumulated up to 200 mg/kg in tissues Kadlec and Knight 1996
Pb Alfalfa (Medicago sativa) PE, PS Bound 43.3 mg/g tissue from groundwater Tiemann et al. 1998
Pb Tobacco (Nicotiana tabacum) PE, PS 625 mg/kg in solution concentrated to 0.8 g/kg in shoots and 24.9 g/kg in roots
Kumar et al. 1995
Pb Purple nightshade (Solanum elaegnofolium)
PE, PS Accumulated up to 1,875, 97, and 380 mg/kg in roots, stems, and leaves, respectively
Gardea-Torresdey et al. 1998a
Pb Sorghum (Sorghum bicolor) PE, PS 625 mg/kg in solution concentrated to 0.3 g/kg in shoots and 8.2 g/kg in roots
Kumar et al. 1995
Pb Alpine pennycress (Thlaspi caerulescens)
PE, PS 5 mg/L in solution concentrated to 145 mg/kg in shoots and 35,000 mg/kg in roots
Salt et al. 1995
Pb Cattail and reed (Typha and Phragmites spp.)
PE Accumulated up to 444 mg/kg in tissues Kadlec and Knight 1996
Pb Corn (Zea mays) PE, PS 625 mg/kg in solution concentrated to 0.2 g/kg in shoots and 14.7 g/kg in roots
Kumar et al. 1995
Pb 5 Dicotyledonous (broadleaf) crops
PE, PS 300 mg/L in solution concentrated to 95–140 g/kg in roots Dushenkov et al. 1995
Pb 3 Monocotyledonous (cereal) crops
PE, PS 300 mg/L in solution concentrated to 75–104 g/kg in roots Dushenkov et al. 1995
Pb 11 Cool-season grass species PE, PS 300 mg/L in solution concentrated to 60–169 g/kg in roots Dushenkov et al. 1995
Pb 6 Warm-season grass species PE, PS 300 mg/L in solution concentrated to 56–124 g/kg in roots Dushenkov et al. 1995
Pb Alder (Alnus tenuifolia) PE Accumulated up to 1,000 mg/kg in aboveground tissues from soils at 3,000–15,000 mg/kg
Klassen et al. 1998
Pb Birch (Betula occidentalis) PE, PS Accumulated up to 1,000 mg/kg in aboveground tissues from soils at 3,000–15,000 mg/kg, increased total concentrations in root zone but maintained concentrations of exchangeable form
Klassen et al. 1998
Pb Hybrid willow (Salix spp.) PE, PS 4 ppm sequestered mainly in the roots in 1 month from 10 ppm irrigation
Hinchman, Negri, and Gatliff 1997
Hg(II) Mustard weed (Arabidopsis thaliana - merA transgenic)
(PV) Bound 1 ppm Hg(II) to roots in 24 hours, reduced to Hg(0) and volatilized 70% in 7 days
Heaton et al. 1998
Hg(II) Tobacco (Nicotiana tabacum - merA transgenic)
PE, (PV) Accumulated 17–76 ppm Hg(II) in shoots from 500 ppm soil, reduced to Hg(0) and volatilized an (undisclosed) amount
Heaton et al. 1998
Ni Indian mustard (Brassica juncea
PE Decreased solution concentration from 12.0 to 2.0 mg/L in 8 hours
Phytotech, Inc. 1997
Ni Indian mustard (Brassica juncea cv. 182921)
PE 100 mg/kg in soil concentrated to 3,086 mg/kg in shoots Kumar et al. 1995
Ni Indian mustard (Brassica juncea cv. 426308)
PE 300 mg/kg in soil (+chelate) concentrated to 300 mg/kg in shoots, simultaneous with other metals
Blaylock et al. 1997
Ni Chicory (Chicorium intybus var. foliosum)
PE 0.16 mg/kg in soil concentrated to 5.7, 6.9, and 4.1 mg/kg in leaves, stems, and roots
Martin et al. 1996

B-22
Inorganic Plant species Phyto-
mechanism Comments on phytoremedial effectiveness Reference
Ni Canada fleabane (Erigeron canadensis)
PE 0.16 mg/kg in soil concentrated to 4.2 mg/kg in leaves and 3.8 mg/kg in stems
Martin et al. 1996
Ni Dogfennel (Eupatorium capillifolium)
PE 0.16 mg/kg in soil concentrated to 4.6 mg/kg in leaves and 2.3 mg/kg in stems
Martin et al. 1996
Ni Sunflower (Helianthus annuus)
PE Decreased solution concentration from 2,000 to 300 µg/L in 24 hours
Salt et al. 1995
Ni Alfalfa (Medicago sativa) PE, PS Bound 0.5 mg/g tissue from groundwater Tiemann et al. 1998
Ni Alpine pennycress (Thlaspi caerulescens)
PE, PS 1 mg/L in solution concentrated to 2,739 mg/kg in shoots and 8,425 mg/kg in roots
Salt et al. 1995
Ni Alpine pennycress (Thlaspi caerulescens)
PE, PS Accumulated up to 16,200 mg/kg in plant Rouhi 1997
Ni Latex rubber tree (Sebertia acuminata)
PE Accumulated up to 25% (dry wt.) in tissues Cunningham and Berti 1993
Se Canola (Brassica Napus) PE, PS Accumulated up to 700 mg/kg in plant, also volatilized Se as dimethyl selenide
Rouhi 1997
Se Canola (Brassica Napus cv. Westar)
PE, PS In greenhouse: 104 mg/kg in 0–30 cm deep soil (0.39 mg/L extractable) concentrated to 182, 27, and 25 mg/kg in leaves, stems, roots, 8 mg/kg in 60–90 cm deep soil (0.99 mg/L ext.) concentrated to 19, 8, and 11 mg/kg in leaves, stems, roots
Bañuelos et al. 1998
Se Canola (Brassica Napus cv. Westar)
PE, PS In field: 21.6 mg/kg in 0–30 cm deep soil (<0.01 mg/L ext.) and 1.6 mg/kg in 60–90 cm deep soil (<0.01 mg/L ext.) concentrated to 44.5, 8.3, and 12.1 mg/kg in leaves, stems, roots
Bañuelos et al. 1998
Se Cattails and bulrushes (Typha and Scirpus spp.)
PE 70%–75% reduction in concentrations from 10,000,000 L/day feed
Adler 1996
Na Atriplex spp. PE Soil concentrations reduced by an average of 65% Keiffer and Ungar 1996
Na Day flower (Commelinae spp.) PE Accumulated up to 60,500 mg/kg in plant tissue Keiffer and Ungar 1996
Na Wild rye (Elymus spp.) PE, PS 140 ppm in soil concentrated to 1,300 ppm in plants (concentration factors up to 32x reported)
Cipollini and Pickering 1986
Na Barley (Hordeum vulgare) PE, PS 8,200 ppm in soil concentrated to 73,000 ppm in plants Cipollini and Pickering 1986
Na Morning glory (Ipomoea spp.) PE Accumulated up to 7,100 mg/kg in plant tissue Keiffer and Ungar 1996
Na Type of grass (Leptochola spp.)
PE Accumulated up to 6,600 mg/kg in plant tissue Keiffer and Ungar 1996
Na Tomato (Lycopersicon esculentum cv. Marmande)
PE, PS 3.7 mg/L in soil water concentrated up to 10,000, 1,900, and 2,100 mg/kg in roots, stems, and leaves
Moral et al. 1995
Na Beans (Phaseolus vulgaris) PE, PS 5,000 ppm in soil concentrated to 48,000 ppm in plants Cipollini and Pickering 1986
Na Ground cherry (Physalis spp.) PE Accumulated up to 12,500 mg/kg in plant tissue Keiffer and Ungar 1996
Na Sea blight (Suaeda spp.) PE Soil concentrations reduced by an average of 65% Keiffer and Ungar 1996
Na Type of sea slight (Suaeda salsa)
PE Up to 3,860 kg/ha of Na removed by 15 plants/m2 in one season Zhao 1991
Na Corn (Zea mays) PE, PS 600 ppm in soil concentrated to 820 ppm in plants (concentration factors up to 15x reported)
Cipollini and Pickering 1986

B-23
Inorganic Plant species Phyto-
mechanism Comments on phytoremedial effectiveness Reference
V Chicory (Chicorium intybus var. foliosum)
PE 0.08 mg/kg in soil concentrated to 2.9, 1.2, and 6.5 mg/kg in leaves, stems, and roots
Martin et al. 1996
V Canada fleabane (Erigeron canadensis)
PE 0.08 mg/kg in soil concentrated to 2.0 mg/kg in leaves and 1.4 mg/kg in stems
Martin et al. 1996
V Dogfennel (Eupatorium capillifolium)
PE 0.08 mg/kg in soil concentrated to 1.9 mg/kg in leaves and 1.2 mg/kg in stems
Martin et al. 1996
Table B-6. Plants accumulating significant concentrations of radionuclides
(1 Becquerel [Bq] = 1 disintegration/second; 3.7 1010
Bq = 1 Curie [Ci])
Inorganic Plant species Phyto-
mechanism Comments on phytoremedial effectiveness Reference
144Ce
Peas (Pisum sativum) PE, PS 2.0 10
4 Bq/kg in leaves, simultaneous with other radionuclides
spiked into soil
Bell, Minski, and Grogan 1988
144Ce
Wheat (Triticum aestevum) PE, PS 3.0 10
3 Bq/kg in straw, simultaneous with other radionuclides
spiked into soil
Bell, Minski, and Grogan 1988
134Cs
Chickweed (Cerastium fontanum) PE Accumulated up to 1.04 10
6 Bq/kg in shoots in 4 weeks Salt, Mayes, and Elston 1992
134Cs
Red fescue (Festuca rubra) PE Accumulated up to 1.60 10
5 Bq/kg in shoots in 4 weeks Salt, Mayes, and Elston 1992
134Cs
Wild millet (Holcus mollis) PE Accumulated up to 1.75 10
5 Bq/kg in shoots in 4 weeks Salt, Mayes, and Elston 1992
134Cs
Perennial ryegrass (Lolium perenne)
PE Accumulated up to 1.14 105 Bq/kg in shoots in 4 weeks Salt, Mayes, and Elston 1992
134Cs
Common meadow grasses (Poa spp.)
PE Accumulated up to 1.99 105 Bq/kg in shoots in 4 weeks Salt, Mayes, and Elston 1992
134Cs
White clover (Trifolium repens) PE Accumulated up to 2.55 10
5 Bq/kg shoots in 4 weeks Salt, Mayes, and Elston 1992
134Cs
7 (Dominant) pasture species community
PE 74 Bq/kg in soil concentrated to 2,080 Bq/kg in vegetation, 950 Bq/kg in roots
Coughtery, Kirton, and Mitchell 1989
134Cs
5 (Dominant) pasture species community
PE 94 Bq/kg in soil concentrated to 1,670 Bq/kg in vegetation, 990 Bq/kg in roots
Coughtery, Kirton, and Mitchell 1989
137Cs Meadow foxtail grass (Alopecurus
pratensis) PE 2.2 10
5 Bq/kg in shoots, 2.3 10
5 Bq/kg in roots Coughtery, Kirton, and Mitchell
1989 137
Cs Indian mustard (Brassica juncea) PE 1.6 104 Bq/kg in shoots Vasudev et al. 1996
137Cs
Turnip (Brassica Rapa) PE, PS 6.3 10
3 Bq/kg in outer leaves, simultaneous with other
radionuclides spiked into soil
Bell, Minski, and Grogan 1988
137Cs
Common heather (Calluna vulgaris)
PE, PS Concentration factors (plant to soil Bq/kg levels) of 28.7 leaves, 35.3 flowers, 10.0 stems, 13.3 roots
Bunzl and Kracke 1984
137Cs
Black sedge (Carex nigra) PE, PS Accumulated 1,300 Bq/kg in dry tissue weight Olsen 1994
137Cs
Tall cottongrass (Eriophorum augustifolium)
PE, PS Accumulated 2,500 Bq/kg in dry tissue weight Olsen 1994
137Cs
Tall fescue (Festuca arundinacea)
PE Accumulated 4.2 106 Bq/m
2 in 8 months Dalhman, Auerbach, and
Dunaway 1969

B-24
Inorganic Plant species Phyto-
mechanism Comments on phytoremedial effectiveness Reference
137Cs Sunflower (Helianthus annuus cv.
SF-187) PE Decreased solution concentration from 200 to 3 µg/L in 24
hours, accumulated 1.6 105 Bq/kg of dry matter
Dushenkov et al. 1997a,b
137Cs
Cow wheat (Melampyrum sylvaticum)
PE, PS Accumulated 1,600 Bq/kg in dry tissue weight Olsen 1994
137Cs
Buckbean (Menyanthes trifoliata) PE, PS Accumulated 1,600 Bq/kg in dry tissue weight Olsen 1994
137Cs
Switchgrass (Panicum virginatum) PE 36.2% of total
137Cs in sand medium removed after 5 monthly
cuttings Entry et al. 1996
137Cs Common timothy grass (Phleum
pratense) PE 4.5 10
4 Bq/kg in shoots; 8.0 10
4 Bq/kg in roots Vasudev et al. 1996
137Cs Peas (Pisum sativum) PE 3.1 10
4 Bq/kg in shoots, 7.1 x 10
4 Bq/kg in roots Vasudev et al. 1996
137Cs
Peas (Pisum sativum) PE, PS 9.2 10
4 Bq/kg in leaves, simultaneous with other radionuclides
spiked into soil
Bell, Minski, and Grogan 1988
137Cs
Common sorrel (Rumex acetosa) PE, PS Accumulated 5,500 Bq/kg in dry tissue weight Olsen 1994
137Cs
Potato (Solanum tuberosum) PE, PS 1.4 10
4 Bq/kg in tubers, simultaneous with other radionuclides
spiked into soil
Bell, Minski, and Grogan 1988
137Cs
Wheat (Triticum aestevum) PE, PS 1.1 10
4 Bq/kg in straw, simultaneous with other radionuclides
spiked into soil
Bell, Minski, and Grogan 1988
137Cs
Bilberry (Vaccinium myrtillus) PE, PS Concentration factors (plant to soil Bq/kg levels) of 15.3 leaves,
9.3 stems Bunzl and Kracke 1984
137Cs
7 (Dominant) pasture species community
PE 280 Bq/kg in soil concentrated to 4,690 Bq/kg in vegetation, 2,340 Bq/kg in roots
Coughtery, Kirton, and Mitchell 1989
137Cs
5 (Dominant) pasture species community
PE 490 Bq/kg in soil concentrated to 3,750 Bq/kg in vegetation, 2,370 Bq/kg in roots
Coughtery, Kirton, and Mitchell 1989
137Cs
Eucalyptus (Eucalyptus tereticornis)
PE 31.0% of total 137
Cs in sphagnum peat removed after 1 month Entry and Emmingham 1995
137Cs
Ponderosa pine (Pinus ponderosa Dougl. ex Laws)
PE Accumulated 5.28 105 Bq/kg in roots, 2.86 10
5 Bq/kg in
shoots (removed from site with needle litter removal) in 4 weeks
Entry, Rygiewicz, and Emmingham 1993
137Cs
Monterey pine (Pinus radiata D Don)
PE Accumulated 6.28 105 Bq/kg in roots, 1.72 10
5 Bq/kg in
shoots (removed from site with needle litter removal) in 4 weeks
Entry, Rygiewicz, and Emmingham 1993
58Co Ryegrass (Lolium perenne cv.
Premo) PE, PS 0.06 mg/kg in solution concentrated to 58.9 mg/kg in plant Macklon and Sim 1990
224Ra Tassel flower (Emilia baldwinii) PE, PS Concentration factors (plant to soil Bq/kg levels) of 3.36 in
shoots and 2.86 in roots Hewamanna, Samarakoon, and Karunaratne 1988
226Ra
Cattail (Typha latifolia) PE, PS Accumulated 275.9 Bq/kg in leaves, 248.2 Bq/kg in stems, and
1,135 Bq/kg in roots Mirka et al. 1996
226Ra
Red maple, sweet gum, tulip (Acer rubrum, Liquidamber stryaciflua, Liriodendron tulipifera)
PE Concentration factors (plant to soil Bq/kg levels) of 2.0 in leaves (composite of each species)
Pinder et al. 1984
226Ra
Trembling aspen (Populus tremuloides)
PE Accumulated 41.8 Bq/kg in leaves, 68.9 Bq/kg in stems Clulow et al. 1992

B-25
Inorganic Plant species Phyto-
mechanism Comments on phytoremedial effectiveness Reference
226Ra
Largetooth aspen (Populus grandidentata)
PE Accumulated 52.7 Bq/kg in leaves, 98.7 Bq/kg in stems Clulow et al. 1992
106Ru
Peas (Pisum sativum) PE, PS 7.9 10
4 Bq/kg in leaves, simultaneous with other radionuclides
spiked into soil
Bell, Minski, and Grogan 1988
106Ru
Potato (Solanum tuberosum) PE, PS 4.9 10
3 Bq/kg in tuber peels, simultaneous with other
radionuclides spiked into soil
Bell, Minski, and Grogan 1988
106Ru
Wheat (Triticum aestevum) PE, PS 7.3 10
3 Bq/kg in straw, simultaneous with other radionuclides
spiked into soil
Bell, Minski, and Grogan 1988
90Sr Meadow foxtail grass (Alopecurus
pratensis) PE 1.1 10
6 Bq/kg in shoots Vasudev et al. 1996
90Sr Sunflower (Helianthus annuus cv.
SF-187) PE Decreased solution concentration from 200 to 1 µg/L in 75
hours, accumulated 2.5 106 Bq/kg of dry matter
Dushenkov et al. 1997a,b
90Sr Switchgrass (Panicum virginatum) PE 43.6% of total
90Sr in sand medium removed after 5 monthly
cuttings Entry et al. 1996
90Sr Common timothy grass (Phleum
pratense) PE 1.4 10
5 Bq/kg in roots Vasudev et al. 1996
90Sr Eucalyptus (Eucalyptus
tereticornis) PE 11.3% of total
90Sr in sphagnum peat removed after 1 month Entry and Emmingham 1995
90Sr Ponderosa pine (Pinus
ponderosa Dougl. ex Laws) PE Accumulated 2.63 10
6 Bq/kg in roots, 1.66 10
6 Bq/kg in
shoots (removed from site with needle litter removal) in 4 weeks
Entry, Rygiewicz, and Emmingham 1993
90Sr Monterey pine (Pinus radiata D
Don) PE Accumulated 2.62 10
6 Bq/kg in roots, 2.47 10
6 Bq/kg in
shoots (removed from site with needle litter removal) in 4 weeks
Entry, Rygiewicz, and Emmingham 1993
99Tc
Turnip (Brassica Rapa) PE, PS 1.1 10
6 Bq/kg in outer leaves, simultaneous with other
radionuclides spiked into soil
Bell, Minski, and Grogan 1988
99Tc
Peas (Pisum sativum) PE, PS 9.2 10
6 Bq/kg in leaves, simultaneous with other radionuclides
spiked into soil
Bell, Minski, and Grogan 1988
99Tc
Wheat Triticum aestevum) PE, PS 9.9 10
5 Bq/kg in straw, simultaneous with other radionuclides
spiked into soil
Bell, Minski, and Grogan 1988
238U Indian mustard (Brassica juncea
cv. 426308) PE Decreased solution concentration from 56 to 42 µg/L in 72 hours Dushenkov et al. 1997b
238U Sunflower (Helianthus annuus cv.
Mammoth) PE Decreased solution concentration from 56 to 2 µg/L in 24 hours Dushenkov et al. 1997b
238U Sunflower (Helianthus annuus cv.
SF-187) PE Decreased solution concentration from 600 to 10 µg/L in 48
hours; 90-day operation at average inlet concentration of 207 µg/L to below 20 µg/L outlet
Dushenkov et al. 1997a,b
238U Beans (Phaseolus coccineus cv
Half White Runner) PE Decreased solution concentration from 56 to 23 µg/L in 72 hours Dushenkov et al. 1997b
3. PLANT HYDRAULIC CHARACTERISTICS AND RAIN INTERCEPTION CAPACITIES

B-26
Table B-7. Plant hydraulic characteristics Species Transpiration Comments Reference
Brachiari mutica 3.9 mm/day From potential evapotranspiration (PET) calculations and lysimeter data taken during 12 peak months in Zaire
Allen et al. 1989
Soybeans (Glycine max) 475 gal/day/acre Estimated from 200,000 plants/acre 9 mL/plant/day for young plants (Anderson and Walton 1991)
Tsao 1997
Perennial ryegrass (Lolium perenne)
6.9 mm/day From PET calculations and lysimeter data taken during 12 peak months in California
Allen et al. 1989
Perennial ryegrass (Lolium perenne)
4.1 mm/day From PET calculations and lysimeter data taken during 12 peak months in California
Allen et al. 1989
Perennial ryegrass (Lolium perenne)
5.4 mm/day From PET calculations and lysimeter data taken during 12 peak months in New Jersey
Allen et al. 1989
Alfalfa (Medicago sativa) 8,300 gal/acre Estimated daily average Gatliff 1994
Alfalfa (Medicago sativa) 10.5 mm/day From PET calculations and lysimeter data taken during 8 peak months in California
Allen et al. 1989
Alfalfa (Medicago sativa) 7.9 mm/day From PET calculations and lysimeter data taken during 7 peak months in Idaho
Allen et al. 1989
Alfalfa (Medicago sativa) 10.1 mm/day From PET calculations and lysimeter data taken during 4 peak months in Nebraska
Allen et al. 1989
Great bulrush (Scirpus validus) 21.9 L/m2day 16,655 L evapotranspired in 7.6 days from one 100 m
2
aboveground compartment (modeled from laboratory results) Negri, Hinchman, and Johnson 1998
Saltwater cordgrass (Spartina spp.) 8,500 gal/acre Estimated daily average Hinchman, Negri, and Gatliff 1997
Saltwater cordgrass (Spartina alterniflora)
21.9 L/m2day 33,310 L evapotranspired in 7.6 days from two 100 m
2
aboveground compartments (modeled from laboratory results) Negri, Hinchman, and Johnson 1998
Clover/perennial ryegrass (Trifolium spp./Lolium perenne)
7.7 mm/day From PET calculations and lysimeter data taken during 12 peak months in Australia
Allen et al. 1989
Clover/grass mix (unspecified) 3.0 mm/day From PET calculations and lysimeter data taken during 8 peak months in Denmark
Allen et al. 1989
Grass species (unspecified) 46.18 inches/year From PET calculations and lysimeter data taken during over a 1 year in Ohio, ranged from 1.5 (February) to 7.0 (July) inches/month
Potter 1998
Grass/legume mix (unspecified) 4.1 mm/day From PET calculations and lysimeter data taken during 9 peak months in Ohio
Allen et al. 1989
Native meadow (unspecified) 4.1 mm/day From PET calculations and lysimeter data taken during the 4 peak months in Colorado
Allen et al. 1989
Alders (Alnus spp.) 200–800 gal/day/tree 1 of 12 species identified that would use desired range of water Woodward 1996
River birch (Betula nigra) 200–800 gal/day/tree 1 of 12 species identified that would use desired range of water Woodward 1996
Eucalyptus (Eucalyptus spp.) 200–800 gal/day/tree 1 of 12 species identified that would use desired range of water Woodward 1996
Ash (Fraxinus spp.) 200–800 gal/day/tree 1 of 12 species identified that would use desired range of water Woodward 1996
Hybrid poplar (Populus spp.) 20–40 gal/day/tree Average transpirations for 5-year-old trees, dependent on local climate
Phytokinetics, Inc. 1998
Hybrid poplar (Populus spp.) 200–800 gal/day/tree For 5-year-old trees Newman et al. 1997b

B-27
Species Transpiration Comments Reference
Hybrid poplar (Populus spp.) 100 L/day/tree For a 5-year-old tree under optimal conditions Stomp et al. 1994
Hybrid poplar (Populus spp.) 13 gal/day/tree Calculated based on trees acting as low-flow pumping wells Nelson 1996
Hybrid poplar (Populus spp.) 1.6–10 gal/day/tree Sap flow measurements of young trees in Maryland Chappell 1997
Hybrid poplar (Populus spp.) 2,300,000 gal/acre Stand of 5-year-old trees at a density of 2170 trees/acre Chappell 1997
Hybrid poplar (Populus spp.) 55.62 inches/year From PET calculations and lysimeter data taken during over 1 year in Ohio, ranged from 1.5 (February) to 9.5 (July) inches/month
Potter 1998
Poplar (Populus spp.) 200–800 gal/day/tree 1 of 12 species identified that would use desired range of water Woodward 1996
Cottonwood (Populus deltoides) 50–350 gal/day 40-foot-tall trees in Ohio, 0.5–1 foot decrease in water level from April to November
Gatliff 1994
Cottonwood (Populus deltoides) 3.75–350 gal/day Pumped 3.75 gpd per tree after only 1.5 years and 350 gpd by a 19-year-old tree in Ft. Worth., Texas
Harvey 1998
Cottonwood (Populus deltoides) 10–11 kg/gal/day Observed in early summer for 1–2-year-old trees in Texas Chappell 1997
Cottonwood (Populus deltoides) 200–800 gal/day/tree 1 of 12 species identified that would use desired range of water Woodward 1996
Hybrid poplar (Populus deltoides x nigra DN34)
100 mL/day Very young trees in an experimental plant growth chamber Chard et al. 1998
Aspen (Populus tremuloides) 200–800 gal/day/tree 1 of 12 species identified that would use desired range of water Woodward 1996
Mesquite (Prosopis glandulosa) 200–800 gal/day/tree 1 of 12 species identified that would use desired range of water Woodward 1996
Hybrid willow (Salix spp.) 5,000 gal in 1 day Maximum value measured on a single, hot summer day Hinchman, Negri, and Gatliff 1997
Willow (Salix spp.) 200–800 gal/day/tree 1 of 12 species identified that would use desired range of water Woodward 1996
Salt cedar (Tamarisk gallica) 200–800 gal/day/tree 1 of 12 species identified that would use desired range of water Woodward 1996
Bald cypress (Taxodium distichum) 200–800 gal/day/tree 1 of 12 species identified that would use desired range of water Woodward 1996
Greasewood (Sarcobatus vermiculatus)
200–800 gal/day/tree 1 of 12 species identified that would use desired range of water Woodward 1996

B-28
Table B-8. Plant rain interception capacities
Source: Viessman, Lewis, and Knapp 1989
Species
Interception
capacity
(%)
Comments
Big bluestem (Andropogon furcatus) 5 Water applied at a rate of 1/2 inch in 30 minutes
Oats (Avena spp.) 7
Buffalo grass (Bulbilis dactyloides) 31 Water applied at a rate of 1/2 inch in 30 minutes
Bindweed (Convovulus spp.) 17 Water applied at a rate of 1/2 inch in 30 minutes
Soybeans (Glycine max) 1
Alfalfa (Medicago sativa) 36
Tall panicgrass (Panicum spp.) 57 Water applied at a rate of 1/2 inch in 30 minutes
Bluegrass (Poa spp.) 17
Little bluestem (Schizachyrium scoparium) 50–60 Water applied at a rate of 1/2 inch in 30 minutes
Corn (Zea mays) 16
Mixed species (unspecified) 26
Natural grass pasture (unspecified) 14–19
Birch (Betula spp.) 10 Average over 5-month span in a forest cover
Ash (Fraxinus spp.) 24 0.36 inches intercepted from a 1.5-inch rain event
Spruce and fir (Picea and Abies spp.) 30 Average over 5-month span in a forest cover
Ponderosa pine (Pinus ponderosa) 12
Loblolly pine (Pinus taeda) 14 10-year old plantation in southern United States
Douglas fir (Pseudotsuga douglasii) 24 Dense, closed canopy forest in western United States
Oak (Quercus spp.) 24 0.36 inches intercepted from a 1.5-inch rain event

Appendix C
Case Study Information Collected during the International
Phytoremediation Conference 2007 in Denver Colorado

This page intentionally left blank.

C-1
CASE STUDY INFORMATION COLLECTED DURING THE INTERNATIONAL PHYTOREMEDIATION
CONFERENCE 2007 IN DENVER COLORADO
Figure C-1. Case study locations.
23
60
29, 30,
31, 36
51
39
52, 53,
54, 55
56
47
32
24,
25, 26
27,
28
35
40
46
48
58
59
59
59
59
59
58
59
59
17
15
7
13, 5
17
20
12
13
60
38
22,
44, 45
6
57

C-2
Figure C-2. Case study locations.
58
41 43
33
59
49
50
33
18
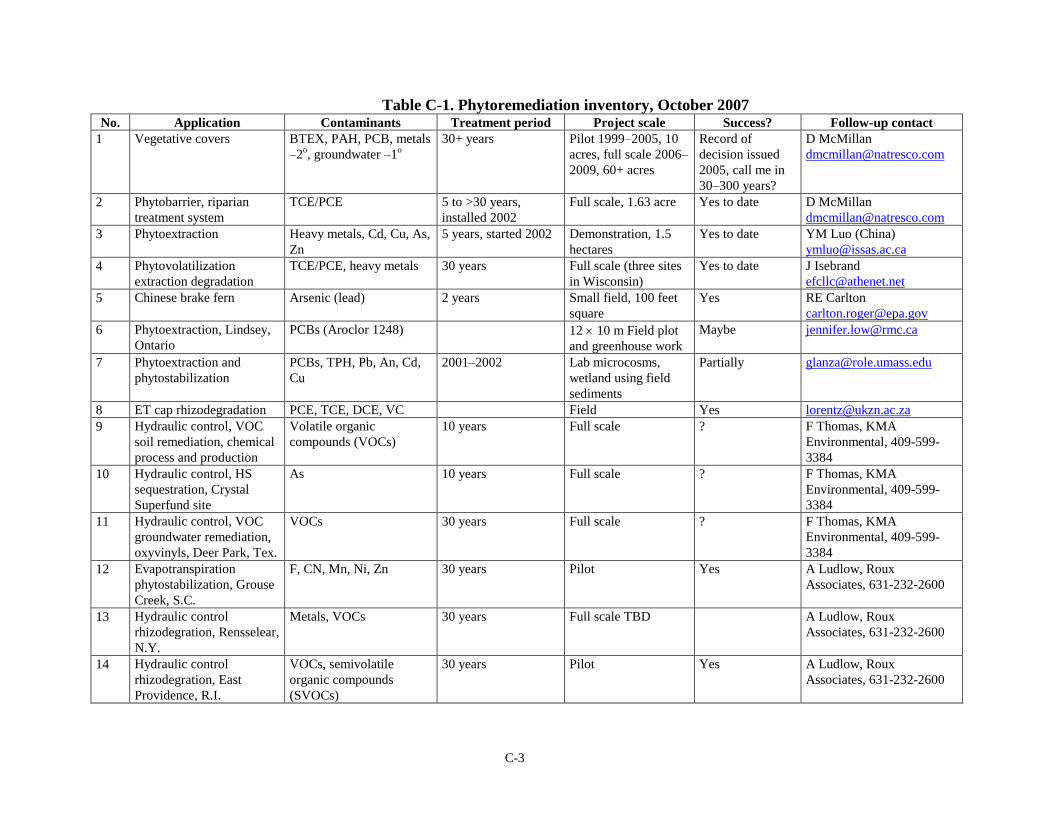
C-3
Table C-1. Phytoremediation inventory, October 2007 No. Application Contaminants Treatment period Project scale Success? Follow-up contact
1 Vegetative covers BTEX, PAH, PCB, metals
–2o, groundwater –1
o
30+ years Pilot 1999–2005, 10
acres, full scale 2006–
2009, 60+ acres
Record of
decision issued
2005, call me in
30–300 years?
D McMillan
2 Phytobarrier, riparian
treatment system
TCE/PCE 5 to >30 years,
installed 2002
Full scale, 1.63 acre Yes to date D McMillan
3 Phytoextraction Heavy metals, Cd, Cu, As,
Zn
5 years, started 2002 Demonstration, 1.5
hectares
Yes to date YM Luo (China)
4 Phytovolatilization
extraction degradation
TCE/PCE, heavy metals 30 years Full scale (three sites
in Wisconsin)
Yes to date J Isebrand
5 Chinese brake fern Arsenic (lead) 2 years Small field, 100 feet
square
Yes RE Carlton
6 Phytoextraction, Lindsey,
Ontario
PCBs (Aroclor 1248) 12 10 m Field plot
and greenhouse work
Maybe [email protected]
7 Phytoextraction and
phytostabilization
PCBs, TPH, Pb, An, Cd,
Cu
2001–2002 Lab microcosms,
wetland using field
sediments
Partially [email protected]
8 ET cap rhizodegradation PCE, TCE, DCE, VC Field Yes [email protected]
9 Hydraulic control, VOC
soil remediation, chemical
process and production
Volatile organic
compounds (VOCs)
10 years Full scale ? F Thomas, KMA
Environmental, 409-599-
3384
10 Hydraulic control, HS
sequestration, Crystal
Superfund site
As 10 years Full scale ? F Thomas, KMA
Environmental, 409-599-
3384
11 Hydraulic control, VOC
groundwater remediation,
oxyvinyls, Deer Park, Tex.
VOCs 30 years Full scale ? F Thomas, KMA
Environmental, 409-599-
3384
12 Evapotranspiration
phytostabilization, Grouse
Creek, S.C.
F, CN, Mn, Ni, Zn 30 years Pilot Yes A Ludlow, Roux
Associates, 631-232-2600
13 Hydraulic control
rhizodegration, Rensselear,
N.Y.
Metals, VOCs 30 years Full scale TBD A Ludlow, Roux
Associates, 631-232-2600
14 Hydraulic control
rhizodegration, East
Providence, R.I.
VOCs, semivolatile
organic compounds
(SVOCs)
30 years Pilot Yes A Ludlow, Roux
Associates, 631-232-2600

C-4
No. Application Contaminants Treatment period Project scale Success? Follow-up contact
15 Hydraulic control,
Riverview, Mich.
Metals 30 years Full scale Yes A Ludlow, Roux
Associates, 631-232-2600
16 Evapotranspiration,
Iceland
Metals, F 30 years Full scale TBD W Eifert, Roux Associates,
304-274-0156
17 Hydraulic control,
Williamsburg, Va.
Metals 30 years Full scale Yes W Eifert, Roux Associates,
304-274-0156
18 Vegetative cover (dermal
barrier)/hydraulic control
Benzene, acetone, MIBK
primarily (waste oil,
weathered)
30 years Full scale So far (2 years) J Stathyelich, ERM,
Indianapolis, IN, 317-706-
2014
19 Phytovolatilization,
phytocontainment,
Minnesota
Landfill mix, As, solvents 30+ years Full scale Yes J Isebrands
20 Phytoremediation
groundcover, active
refinery land farm
TPH, organics 2001–2006 Full scale, 25 acres Yes [email protected]
21 Constructed treatment
wetland, former refinery
Various petroleum
products
99 years as part of the
redevelopment
Full scale, 3.5 acres Yes [email protected]
22 Constructed treatment
wetland, active refinery
outfall
Phenol, alkalinity Operating since 2003,
active facility
Full scale, 1 acre Yes [email protected]
23 Phytoremediation
groundcover, active
refinery warehouse
Xylene Operating since 2003,
active facility
Full scale, 1 acre v [email protected]
24 Phytoremediation
groundcover, active
refinery off-site area
TPH 5 years Full scale, 2 acre total
(of phytoscapes)
25 Riparian buffer, former
refinery tank farm
BTEX, MTBE Installed in 2001 Full scale, <1 acre Yes [email protected]
26 Phytoremediation tree
stand, former refinery off-
site area
BTEX Installed in 2005 Full scale, 1 acre Yes ? [email protected]
27 Phytoremediation
groundcover, former
refinery fire training area
TPH 2001–2004 Full scale, 1 acre N [email protected]
28 Phytoremediation
groundcover, former
refinery process area
TPH Installed in 2001,
until redevelopment
Full scale, 30 acres Yes [email protected]
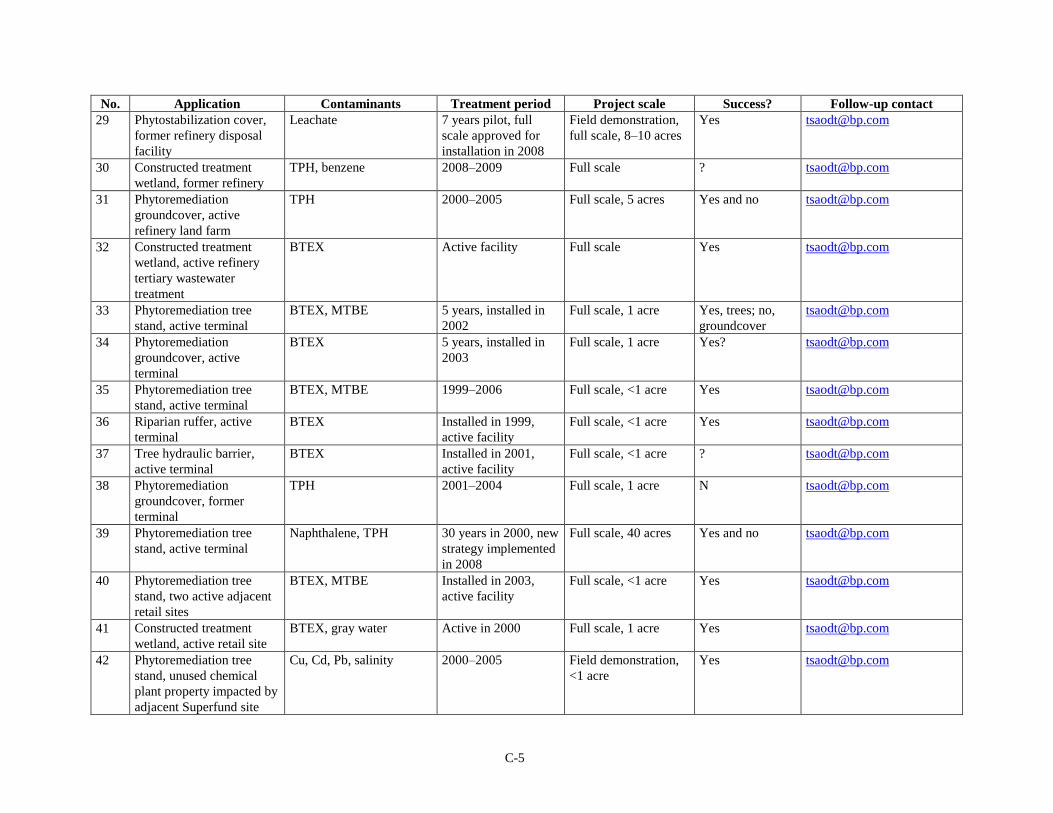
C-5
No. Application Contaminants Treatment period Project scale Success? Follow-up contact
29 Phytostabilization cover,
former refinery disposal
facility
Leachate 7 years pilot, full
scale approved for
installation in 2008
Field demonstration,
full scale, 8–10 acres
30 Constructed treatment
wetland, former refinery
TPH, benzene 2008–2009 Full scale ? [email protected]
31 Phytoremediation
groundcover, active
refinery land farm
TPH 2000–2005 Full scale, 5 acres Yes and no [email protected]
32 Constructed treatment
wetland, active refinery
tertiary wastewater
treatment
BTEX Active facility Full scale Yes [email protected]
33 Phytoremediation tree
stand, active terminal
BTEX, MTBE 5 years, installed in
2002
Full scale, 1 acre Yes, trees; no,
groundcover
34 Phytoremediation
groundcover, active
terminal
BTEX 5 years, installed in
2003
Full scale, 1 acre Yes? [email protected]
35 Phytoremediation tree
stand, active terminal
BTEX, MTBE 1999–2006 Full scale, <1 acre Yes [email protected]
36 Riparian ruffer, active
terminal
BTEX Installed in 1999,
active facility
Full scale, <1 acre Yes [email protected]
37 Tree hydraulic barrier,
active terminal
BTEX Installed in 2001,
active facility
Full scale, <1 acre ? [email protected]
38 Phytoremediation
groundcover, former
terminal
TPH 2001–2004 Full scale, 1 acre N [email protected]
39 Phytoremediation tree
stand, active terminal
Naphthalene, TPH 30 years in 2000, new
strategy implemented
in 2008
Full scale, 40 acres Yes and no [email protected]
40 Phytoremediation tree
stand, two active adjacent
retail sites
BTEX, MTBE Installed in 2003,
active facility
Full scale, <1 acre Yes [email protected]
41 Constructed treatment
wetland, active retail site
BTEX, gray water Active in 2000 Full scale, 1 acre Yes [email protected]
42 Phytoremediation tree
stand, unused chemical
plant property impacted by
adjacent Superfund site
Cu, Cd, Pb, salinity 2000–2005 Field demonstration,
<1 acre

C-6
No. Application Contaminants Treatment period Project scale Success? Follow-up contact
43 Phytoremediation tree
stand, unused chemical
plant property
TPH Divested Full scale, 1 acre ? [email protected]
44 Constructed treatment
wetland, chemical plant
remediation streams
Organic acids 2003–2004 Field demonstration,
<1 acre
45 Riparian buffer, former
exploration and production
site
DRO 30 years Field demonstration,
<1 acre
46 Phytostabilization cover,
exploration and production
brine release site
Salinity, sodium (sodic
soils)
2000–2005 Field demonstration,
<1 acre
47 Phytostabilization cover,
former exploration and
production disposal pits
TPH 20 years Full scale, 4 acres Yes [email protected]
48 Constructed treatment
wetland
Crude Active pipeline Full scale Backup
containment
system, never
used
49 Tree hydraulic barrier,
former mine site
Metals, acid pH 1 year Field demonstration,
<1 acre
Yes? [email protected]
50 Phytostabilization cover,
former smelter
Metals tailings In perpetuity Full scale Yes [email protected]
51 Phytostabilization cover,
former tailings
impoundment
Metals tailings In perpetuity Full scale Yes [email protected]
52 Constructed treatment
wetland, former tailings
impoundment
Acid, arsenic In perpetuity Full scale Yes [email protected]
53 Constructed treatment
wetland, city storm water
system
Acid pH, metals In perpetuity Full scale, 1–2 acres Yes [email protected]
54 Constructed treatment
wetland, former aluminum
processing landfill
Cyanide, fluoride To be installed in
2008
Full scale Yes, pilot [email protected]
55 Phytoremediation tree
stand, former
manufacturing facility
Toluene 2007 Full scale, <1 acre ? [email protected]

C-7
No. Application Contaminants Treatment period Project scale Success? Follow-up contact
56 Constructed treatment
wetland, former solvent
recycling facility
TCE Installed in 1997, still
operating
Full scale, 2 acres Yes [email protected]
57 Phytostabilization cover,
former waste disposal
Acid tar ? Full scale, 2.5 acres Yes and no [email protected]
58 Phytoremediation tree
stand, Superfund site
EDC, TDA 30 years (5-year
review)
Full scale Yes? [email protected]
59 Phytoscapes prevention in
various retail markets
Gasoline, BTEX,
oxygenates
Prevention Full scale Yes [email protected]
60 Vegetative covers for
infiltration control
Zinc Full scale, 1000 acres Yes [email protected]

C-8
This page intentionally left blank.

Appendix D
Phytotechnologies Update Team Contacts

This page intentionally left blank.

D-1
PHYTOTECHNOLOGIES UPDATE TEAM CONTACTS
Kris Geller, Update Team Leader
New Jersey Dept. of Environmental
Protection
401 E. State St.
Trenton, NJ 08625
609-633-2318
Steve Hill, ITRC Program Advisor
RegTech, Inc.
6750 Southside Blvd.
Nampa, ID 83686
208-442-4383
Ken Beard
Pennsylvania Dept. of Environmental
Protection
400 Market St.
Harrisburg, PA 17105
717-783-9475
Ramesh Belani
Pennsylvania Dept. of Environmental
Protection
2 E. Main St.
Norristown, PA 19401
484-250-5756
John Chambliss
Initiative to Clean Up Chattanooga
826 Vine St.
Chattanooga, TN 37403
423-756-7274
Stephen C. Geiger
ENSR
3101 Wilson Blvd, 4th
Floor
Arlington, VA 22201
703-297-9118
Dib Goswami, Ph.D.
Washington State Dept. of Ecology
1315 W. 4th
Ave.
Kennewick, WA 99337
509-736-3015
Steve Rock
U.S. EPA ORD
5995 Center Hill Ave.
Cincinnati, OH 45224
513-569-7149
Peter Strauss
PM Strauss & Associates
317 Rutledge St.
San Francisco, CA 94110
415-647-4404
David Tsao, Ph.D.
BP North America, Inc
28100 Torchway Pkwy.
Cantera I MC2N
Warrenville, IL 60555
630-836-7169
Eleanor Wehner
Texas Commission on Environmental
Quality
12100 Park Circle Bldg.
Austin, TX 78753
512-239-2358

D-2
This page intentionally left blank.

Appendix E
Glossary

This page intentionally left blank.

E-1
GLOSSARY
absorption The process of one substance actually penetrating into the structure of another
substance. This is different from adsorption, in which one substance adheres to the surface of
another substance.
adsorption The physical process occurring when liquids, gases, or suspended matter adhere to
the surfaces of, or in the pores of, an adsorbent material. Adsorption is a physical process
which occurs without chemical reaction.
aerobe An organism that can grow in the presence of air or free oxygen.
aerobic An environment that has a partial pressure of oxygen similar to normal atmospheric
conditions.
anaerobe An organism that grows in the absence of oxygen or air.
anaerobic An environment without oxygen or air.
anoxic An atmosphere greatly deficient in oxygen.
bacteria A group of diverse and ubiquitous prokaryotic single-celled microorganisms.
bioaccumulation Intracellular accumulation of environmental pollutants such as heavy metals by
living organisms.
biodegradation The breakdown of organic substances by microorganisms.
bioremediation The process by which living organisms are used to degrade or transform
hazardous organic contaminants.
bound residue Chemical contaminant that is not extractable from plant tissues by conventional
methods (covalent bonding, polymerization, or lignification within the plant).
brownfield An abandoned, idled, or underused industrial or commercial facility where
expansion or redevelopment is complicated by a real or perceived environmental
contamination.
capillary fringe The porous material just above the water table which may hold water by
capillarity (a property of surface tension that draws water upward) in the smaller soil void
spaces.
chelate The type of coordination compound in which a central metallic ion (CO2+, Ni
2+, or
Zn2+) is attached by covalent bonds to two or more nonmetallic atoms in the same molecule,
called “ligands.” Chelating agents are used to remove ions from solutions and soil.
creosote An antifungal wood preservative used frequently to treat telephone poles and railroad
ties. Creosote consists of coal tar distillation products, including phenols and PAHs.
enhanced rhizosphere biodegradation Enhanced biodegradation of contaminants near plant
roots where compounds exuded by the roots increase microbial biodegradation activity. Other
plant processes such as water uptake by the plant roots can enhance biodegradation by
drawing contaminants to the root zone.
enzyme Protein that acts as a biological catalyst. These chemicals produced by living organisms
bring about the digestion (breakdown) of organic molecules into smaller units that can be
used by living cell tissues.

E-2
evapotranspiration Water lost to the atmosphere from the ground surface, evaporation from the
capillary fringe of the groundwater table, and the transpiration of groundwater by plants
whose roots tap the capillary fringe of the groundwater table.
ex situ Out of the original position (excavated).
exudate Soluble organic matter released from the roots of plants to enhance availability of
nutrients or as a by-product of fine root degradation.
greenhouse study Study conducted to evaluate the ability of green plants to grow in toxic soil or
water environments. Greenhouse studies are normally conducted during treatability studies.
groundwater Water found beneath the surface of the ground. Groundwater is primarily water
which has seeped down from the surface by migrating through the interstitial spaces in soils
and geologic formations.
hydrophobic Repelling, tending not to combine with, or incapable of dissolving in water.
in situ In place, without excavation.
lignification Covalent bonding of the chemical or its by-products into the lignin of a plant.
log Kow The octanol-water partition coefficient, a dimensionless constant which provides a
measure of how an organic compound will partition between an organic phase and water. A
low log Kow indicates that a chemical readily partitions into a water phase; a high log Kow
indicates that the chemical prefers to stay in the organic phase. It provides an indication of
the quantity of the chemical that will be taken up by the plants.
microorganism Includes bacteria, algae, fungi, and viruses.
mineralization The breakdown of organic matter to inorganic materials (such as carbon dioxide
and water) by bacteria and fungi.
nutrients Elements or compounds essential as raw materials for organism growth and
development. Nitrogen, phosphorous, potassium, and numerous other mineral elements are
essential plant nutrients.
organic pump Uptake of large quantities of water by plant (trees) roots and translocation into the
atmosphere to reduce a flow of water. Used to keep contaminated groundwater from reaching
a body of water or to keep surface water from seeping into a capped landfill and forming
leachate.
part per billion (ppb) A measure of proportion by weight which is equivalent to one unit weight
of solute (dissolved substance) per billion unit weights of the solution. One liter of water
weighs 1 billion micrograms, and 1 ppb is the equivalent of 1 microgram per liter (µg/L)
when used for water analysis.
part per million (ppm) A measure of proportion by weight which is equivalent to one unit
weight of solute (dissolved substance) per million unit weights of the solution. One liter of
water weighs 1 million milligrams, and 1 ppm is equal to 1 milligram per liter (mg/L) when
used for water analysis.
phenol Carbolic acid (C6H5OH). Phenols and substituted phenols are used as antimicrobial
agents in high concentrations.
phytoaccumulation See “phytoextraction.”

E-3
phytodegradation The process where plant-produced enzymes break down dissolved organic
contaminants that are in the plant through the uptake of water.
phytoextraction The uptake and accumulation of inorganic elements into the plant tissues.
phytoremediation Use of plants to remediate contaminated soil, sediments, surface water, or
groundwater.
phytosequestration The ability of plant to sequester certain inorganic elements in the plant and
the root zone.
phytostabilization Commonly referred to as “phytosequestration.”
phytotoxic Harmful to plants.
phytovolatilization The uptake and subsequent transpiration of volatile contaminants through
the plant leaves.
polynuclear aromatic hydrocarbon (PAH) A hydrocarbon compound with multiple benzene
rings. PAHs are typical components of asphalts, fuels, oils, and greases.
rhizodegradation Biodegradation of organics by the soil organisms. Exuded plant products
through phytosequestration can lead to enhanced biodegradation in the rhizosphere
rhizofiltration Uptake of contaminants by the roots of plants immersed in water. When the roots
are saturated with contaminants, they are harvested. This is not synonymous with
“hydroponics.”
rhizosphere Soil in the area surrounding plant roots that is influenced by the plant root.
Typically a few millimeters or at most centimeters from the plant root. Important because this
area is higher in nutrients and thus has a higher and more active microbial population.
root turnover The release and decay of fine roots in the soil profile.
Toxicity Characteristic Leaching Procedure (TCLP) An EPA-developed test to determine the
toxicity of a chemical.
toxic substances Chemical elements and compounds such as lead, benzene, dioxin, and others
that have toxic (poisonous) properties when exposure by ingestion, inhalation, or absorption
into the organism occurs. There is a large variation in the degree of toxicity among toxic
substances and in the exposure levels that induce toxicity.
translocation Cellular transport through the plant vascular system (xylem) from roots to other
plant tissues.
transpiration The plant-based process involving the uptake, transport, and eventual vaporization
of water through the plant body.
vadose zone Unsaturated zone of soil above the groundwater, extending from the bottom of the
capillary fringe all the way to the soil surface.
volatile organic compound Synthetic organic chemical capable of becoming vapor at relatively
low temperatures.
water table The level at the top of the zone of groundwater saturation.
water table depression A drop in water table level caused by mechanical or natural groundwater
pumping.
zone of saturation The layer in the ground in which all available interstitial voids (cracks,
crevices, and holes) are filled with water. The level of the top of this zone is the water table.

E-4
This page intentionally left blank.

Appendix F
Acronyms

This page intentionally left blank.

F-1
ACRONYMS
ARAR applicable or relevant and appropriate requirement
ASTM American Society for Testing and Materials
B&B balled and burlapped
BA basal trunk area
bgs below ground surface
BT Bacillus thuringiensis
BTEX benzene, toluene, ethylbenzene, and (o-, m-, p-) xylenes
CADD computer-aided design and drafting
CEC cation exchange capacity
CERCLA Comprehensive Environmental Response, Compensation, and Liability Act
CFR Code of Federal Regulations
COC contaminant of concern
DCE dichloroethene
DRO diesel-range organic
EC electrical conductivity
ECOS Environmental Council of the States
EDC ethylene dichloride
EDTA ethylene diamine tetra-acetic acid
EPA U.S. Environmental Protection Agency
EPIC Erosion/Productivity Impact Calculator
ERIS Environmental Research Institute of the States
ET evapotranspiration
FAC facultative
FACU facultative upland
FACW facultative wetland
GAC granulated activated carbon
GC/MS gas chromatography/mass spectrometry
GMO genetically modified organism
gpd gallons per day
GRO gasoline-range organic
ITRC Interstate Technology & Regulatory Council
HELP hydrologic evaluation of landfill performance
HMX 1,3,5,7-tetranitro-1,3,5,7-tetrazocane
HRT hydraulic retention time

F-2
LAI leaf area index
MIBK methyl isobutyl ketone
MTBE methyl tertiary-butyl ether
ND nondetect
NESHAPS National Emissions Standards for Hazardous Air Pollutants
NGO nongovernmental organization
NPDES National Pollutant Discharge and Elimination System
NPS nonpoint source
O&M operation and maintenance
OBL obligate wetland
OM&M operation, maintenance, and monitoring
PAH polycyclic aromatic hydrocarbon
PAR photosynthetically active radiation
PCB polychlorinated biphenyl
PCE perchloroethene
PET potential evapotranspiration
PLFA phospholipid fatty acid
PPE personal protective equipment
PSI photosystem I
PSII photosystem II
PVC polyvinyl chloride
RCF root concentration factor
RCRA Resource Conservation and Recovery Act
RDX 1,3,5-trinitroperhydro-1,3,5-triazine
RO reverse osmosis
SAR sodium adsorption ratio
SVOC semivolatile organic compound
TBA tertiary butyl alcohol
TCE trichloroethene
TDA toluenediamine
TDS total dissolved solids
TNT trinitrotoluene
TPH total petroleum hydrocarbons
TSCA Toxic Substances Control Act
TSCF transpiration stream concentration factor
UPL upland
U.S.C. U.S. Code

F-3
USDA U.S. Department of Agriculture
VC vinyl chloride
VOC volatile organic compound