piaac can help colleges in north america to fulfill their role in the higher education sector satya...
TRANSCRIPT

PIAAC can help Colleges in North America to fulfill their role in the Higher Education Sector
Satya Brink, [email protected]

Colleges form an important component in the higher education sector but also for raising the human capital of people and the national economy
PIAAC provides large picture information for a number issues facing the colleges
• Improving intake of students based on merit for maintaining a high standard of education
• Providing a responsive array of courses and programs that prepare students for work and the economy
• To be an efficient provider of higher education, with fewer drop outs, fewer changes in major and more students graduating in two years.
• To increase enrolment and to be competitive in the college sector• To build a reputation based on successful graduates with a high standard
of education.

Programme for International Assessment of Adult Competencies (PIAAC), is also called International Survey of Adults (ISA)
• PIAAC measures foundational skills essential for learning of specific disciplines and transferable job related skills of adults of working age (16 to 64) at a group or population level.
• Complements the need for competency based tests on specific disciplines at the individual level. • However, data can be analysed to provide important evidence for the college sector.
16-24 years 25-34 years 35-44 years 45-54 years 55-64 years
Students in college
Students in the years following college graduation
HS graduation 2008-2016
HS graduation 1998-2007
HS graduation 1988-1997
HS graduation 1978-1987
HS graduation 1968-1977
College graduation2010-2018
College graduation2000-2009
College graduation1990-1999
College graduation1980-1989
College graduation1970-1979
University graduation2012-2020
University graduation2002-2011
University graduation1992-2001
University graduation1982-1991
University graduation1972-1981

PIAAC suggests that people need to score level 3 or above (276 and above) in literacy and numeracy to function in higher education and work in the modern world. This
would be a factor to consider during the admission process
18 years 19 years 20 years 21 years 22 years 23 years 24 years 25 years 26 years 27 years 28 years 29 years 30 years 255
260
265
270
275
280
285
290
295
Average scores in literacy by college going age (18-30) , Canada and the United States (Desirable 276+)
Canada USAForeign born excluded
Direct transition to college from High School? Gap year?

JapanUSA
Canada
Newfoundland
Prince
Edward Island
Nova Sco
tia
New Brunswick
Quebec
Ontario
Manitoba
Saskatch
ewan
Alberta
British
Columbia225
235
245
255
265
275
285
295
Regional variation in literacy and numeracy in Canada in comparison with USA and Japan
Literacy average score Numeracy average score
Japan
USA
Canada
Newfoundland
Prince Edward Island
Nova Scotia
New Brunswick
Quebec
Ontario
Manitoba
Saskatchewan
Alberta
British Columbia
0 10 20 30 40 50 60 70 80
Regional variation in Level 3 and above literacy and numeracy in Canada in comparison with USA and Japan
Numeracy % Level 3 and above Literacy % Level 3 and above
College location can be impacted by regional variation in literacy and numeracy scores and the proportion with Levels 3 and above
Low literacy and numeracy scores in the population in the area affects potential enrolment, the level of the economy and therefore, the ability to pay for college related costs and the challenge to raise the human capital of the area for future economic growth.
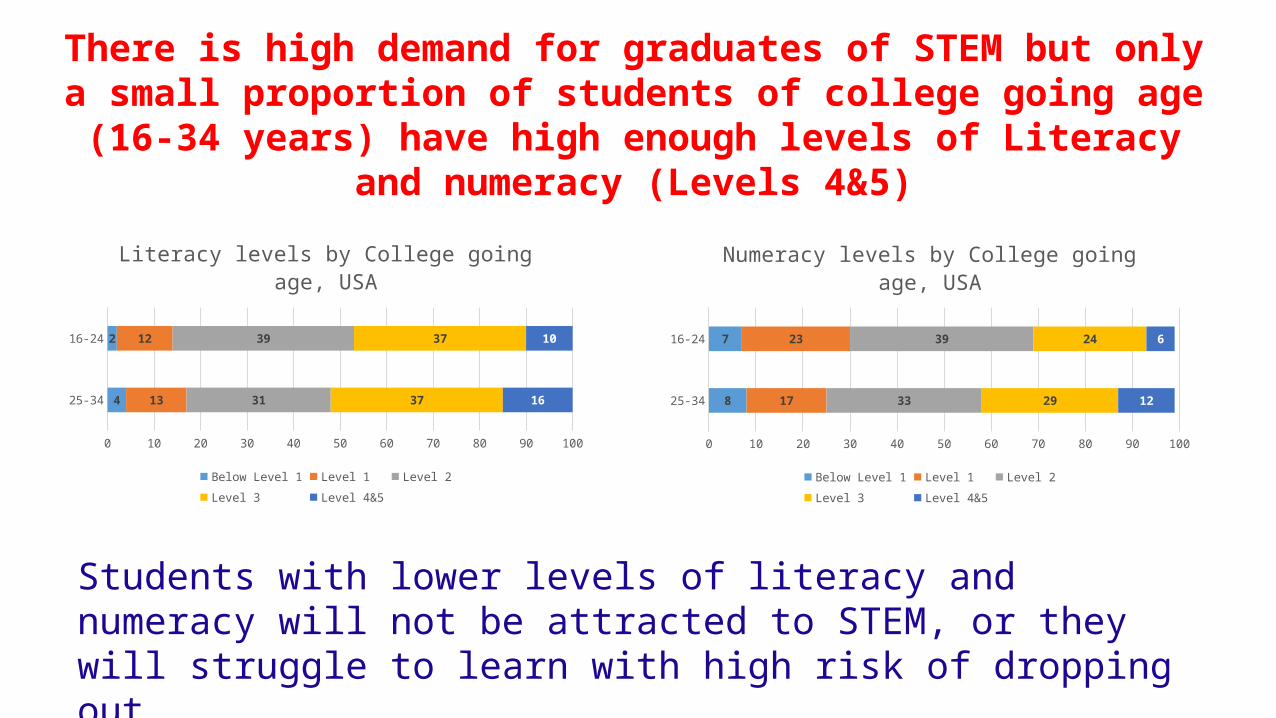
There is high demand for graduates of STEM but only a small proportion of students of college going age (16-34 years) have high enough levels of
Literacy and numeracy (Levels 4&5)
25-34
16-24
0 10 20 30 40 50 60 70 80 90 100
8
7
17
23
33
39
29
24
12
6
Numeracy levels by College going age, USA
Below Level 1 Level 1 Level 2 Level 3 Level 4&5
25-34
16-24
0 10 20 30 40 50 60 70 80 90 100
4
2
13
12
31
39
37
37
16
10
Literacy levels by College going age, USA
Below Level 1 Level 1 Level 2 Level 3 Level 4&5
Students with lower levels of literacy and numeracy will not be attracted to STEM, or they will struggle to learn with high risk of dropping out.

To increase successful enrolment ideally students should have high levels of literacy and numeracy. A high proportion of those 16-24 are already in education. Mature students without college education could be a possibility because 40% of the 82m, 25-44 in the US have only a high school credential
Persons aged 16-24
In education Not in education Of which % who were in education in the previous 12 months.
Canada 66 34 4.7
USA 57.9 42.1 6.8
Literacy
Numeracy
Literacy
Numeracy
25-3
4 35
-44
0 10 20 30 40 50 60 70 80 90 100
4
8
3
9
13
17
14
20
31
33
32
31
37
29
36
29
16
12
15
11
Literacy and Numeracy levels of Persons aged 25 to 44
Below Level 1 Level 1 Level 2 Level 3 Level 4&5

16-24 25-34 16-24 25-34 16-24 25-34 16-24 25-34Men Women Men Women
Literacy Numeracy
220
225
230
235
240
245
250
255
260
265
270
275
280
285
290
275.1
285.4
276.4
284.8
272.7
283.1
263.7
269.9270
274 273.4276.2
253.2
267.6
245
252.7
Mean literacy and numeracy proficiency, by age and gender
Canada USA
How should remedial courses in foundational competencies be planned?
More younger students require remedial courses. Greater need for remedial courses in Numeracy than Literacy for both men and women. Women will need a longer time to build their Numeracy competency because of lower scores.

9
Nova Scotia - Number of Adults at Levels 1 and 2 Prose Literacy
0 - 30
31 - 60
61 - 90
91 - 120
121 - 150
151 - 180
181 - 210
211 - 240
241 - 270
More than 270
No Data100 0 10050 Kilometers
Mapping the results of Literacy performance shows areas for potential recruitment as well as areas for outreach

No
com
pute
r exp
erie
nce
Faile
d IC
T co
re
Opt
ed o
ut o
f tak
ing
CBA
Took
Com
pute
r bas
ed A
sses
smen
t
No
com
pute
r exp
erie
nce
Faile
d IC
T co
re
Opt
ed o
ut o
f tak
ing
CBA
Took
Com
pute
r bas
ed A
sses
smen
t
Literacy score Numeracy score
0
25
50
75
100
125
150
175
200
225
250
275
300
ICT competence and Literacy scores, Canada and USA
Canada USA
Literacy and numeracy skills are important if courses are delivered on-line. Level 3 Literacy and Numeracy is linked to ICT skills
Those with no computer experience, those who failed the ICT core and those who opted out of the Computer Based Assessment had scores below Level 3.

Percentage of adults 25-34 at each proficiency level in problem solving in technology-rich environments
Application of acquired knowledge can be reflected in the skill of Problem Solving in Technology Rich Environments
No experience or failed core
Below Level 1 Level 1 Level 2 Level 3
Canada 5 12.1 29.1 37.7 11.3
USA 5.6 14.4 32.7 31.5 7.3
Finland 3.5 4.1 23.3 47.7 19.8
A far greater proportion of adults of college graduation age have higher Problem Solving Competencies in Finland than in Canada or the United States. Problem Solving Skills are important for productivity and innovation in the labour market and the academic sector.

Occupation Ave literacy16-65
Ave Numeracy
16-65
Average literacy 16-24 years
Average numeracy
16-24 years
Average literacy 25-34 years
Average numeracy
23-34 years
Managerial and professional
286 278 292.7 286.4 301.9 294.3
Service and support
270 259 277.8 274.2 268.6 258.2
Trade, production and manufacturing
269.9 271 270.5 267.9 262.6 263.3
Manual and other services
263 254 269.9 263.3 256.8 247.2
Literacy and Numeracy competencies of college educated workers in occupations in Canada and the competencies of college age students 16-25
and of recent graduates 25-34 in those occupations
There is no indication of skills mismatch however, younger college educated workers may not have an advantage in the job market. The competency levels are mostly at the border line of Level 3.

How do standards of College education compare?
Canada USA Japan0
50
100
150
200
250
300
350
279.7270.3
304.9288.7 295.4
305308.4 308.4
326.4
Average literacy scores by educational attainment
Upper secondary graduates 16-19 Two years of Post secondary (college) 16-29 Tertiary education (university) 4 years or more 16-29
21.4
On average, each year of education adds 7 points. While Canada and Japan, create large gains between College and University, the US creates its largest gains between High School and College. Note, however, that High School graduates in Japan have higher scores than college graduates in Canada and the US and almost as high as University graduates!
919.7
25.113 0.1

Mean literacy proficiency, by type of occupation, and score difference between workers in skilled and elementary occupations, Canada, USA and Japan
Skilled occupations
Semi-skilled white collar occupations
Semi-skilled blue collar occupations
Elementary occupations
Difference between skilled and elementary occupations
Canada 292.3 266.0 256.5 251.0 41.2
USA 292.1 265.8 252.2 239.4 52.7
Japan 310.6 296.7 285.6 280.4 30.2
Workers in skilled occupations have Level 3 literacy however, workers in skilled occupations in Japan have much higher Average Literacy scores for
skilled occupations and white collar occupations
These differences affect the attraction of plants and companies to North America and the off-shoring of jobs.

Though the demand for higher levels of skills has been growing in the job market, there has not been much increase in the level of literacy skills between cohorts compared to Korea
Average Literacy scores by age bands, Canada and USA
16-24 years
25-34 years
35-44 years
45-54 years
55-65 years
Difference between youngest and oldest
Canada 275.7 285.1 279.7 268.0 260.4 15.4
USA 271.5 275.5 273.4 265.9 262.9 8.6
Korea 292.9 289.5 277.5 258.6 244.1 48.8

PIAAC provides a large picture view of foundational competencies that can help the college sector to make
important decisions based on evidence• Direct measures of the stock of skills of the college educated population in a
country.• Calculation of the premiums gained over high school graduates and under
university graduates. • Equity - with the performance of college graduates in other regions in a country • Benchmarking internationally with 23 other countries. Most EU countries and
Australia. • Relationship between the proficiencies gained in college in relation to job related
skills. • The proficiencies of the intake cohort of students. • The proficiency requirements by occupational categories as demanded by the
market.

Thank you!