pickles, j., blundy, j., & brooker, r. (2016). trace ... · blundy (1997) developed the lattice...
TRANSCRIPT
Pickles, J., Blundy, J., & Brooker, R. (2016). Trace element thermometry ofgarnet-clinopyroxene pairs. American Mineralogist, 101(6), 1438-1450. DOI:10.2138/am-2016-5427
Peer reviewed version
Link to published version (if available):10.2138/am-2016-5427
Link to publication record in Explore Bristol ResearchPDF-document
This is the author accepted manuscript (AAM). The final published version (version of record) is available onlinevia Mineralogical Society of America athttp://www.minsocam.org/msa/ammin/toc/2016/Jun2016_data/Jun2016_data.html. Please refer to anyapplicable terms of use of the publisher.
University of Bristol - Explore Bristol ResearchGeneral rights
This document is made available in accordance with publisher policies. Please cite only the publishedversion using the reference above. Full terms of use are available:http://www.bristol.ac.uk/pure/about/ebr-terms
1
Trace Element Thermometry of Garnet-Clinopyroxene Pairs Revision 1
Jonathan R Pickles1,2, Jonathan D Blundy2 and Richard A Brooker2
1Camborne School of Mines, University of Exeter, Penryn Campus, Penryn, TR10 9FE. UK 2School of Earth Sciences, University of Bristol, Wills Memorial Building, Bristol BS8 1RJ, UK
Abstract
We present major and trace element data on coexisting garnet and clinopyroxene from
experiments carried out between 1.3 and 10 GPa and 970 and 1400 ◦C. We demonstrate that
the lattice strain model, which was developed for applications to mineral-melt partitioning, can
be adapted to garnet-clinopyroxene partitioning. Using new and published experimental data
we develop a g eothermometer for coexisting garnet and clinopyroxene using the concentration
of rare earth elements (REE). The thermometer, which is based on an extension of the
lattice strain model, exploits the tendency of minerals at elevated temperatures to be less
discriminating against cations that are too large or too small for lattice sites. The extent of
discrimination against misfit cations is also related to the apparent elasticity of the lattice site
on which substitution occurs, in this case the greater stiffness of the dodecahedral X-site in
garnet compared with the 8-fold M2-site in clinopyroxene. W e d e m o n s t r a t e t h a t the
ratio of REE in clinopyroxene to that in c o e x i s t i n g garnet is particularly sensitive to
temperature. We present a method by which knowledge of the major and REE chemistry of
garnet and clinopyroxene can be used to solve for the equilibrium temperature. This method
is applicable to any scenario in which the two minerals are in equilibrium, both above and below
the solidus, and where the mole fraction of grossular in garnet is less than 0.4. Our method,
2
which can be widely applied to both peridotitic and eclogitic paragenesis with particular
potential for diamond exploration studies, has the advantage over commonly used Fe-Mg
exchange thermometers in having a higher closure temperature because of slow interdiffusion
of REE. The uncertainty in the calculated temperatures, based on the experimental data set, is
less than ±80 ◦C.
Keywords: Lattice Strain Model, geothermometer, garnet, clinopyroxene, eclogite,
experimental petrology , REE
Introduction
Deciphering the pressure (P) and temperature (T) conditions of deep earth
processes using samples that are now exhumed to the surface requires a detailed
understanding of the high-pressure phases and their chemistry over a range of
relevant conditions. Such information has played an important role in the unraveling of
P -T conditions during metamorphism and tectonic events. One industrial application
involves diamond exploration where a particular challenge is establishing whether
mantle-derived samples formed at P and T conditions conducive to diamond stability.
I n t h i s c o n t e x t , t he paragenesis of garnet (grt) + clinopyroxene (cpx) in rocks of
mafic or ultramafic composition has focused attention on this mineral pair as potential
3
geothermometers and barometers. A number of models exist to estimate equilibrium
temperatures of coexisting garnet and clinopyroxene (Raheim and Green 1974; Ellis and
Green 1979; Powell 1985; Ai 1994; Nakamura 2009; Sun and Liang 2015). The majority of these
thermometers rely on Fe-Mg exchange between garnet and clinopyroxene. For example,
the geothermometer of Ellis and Green (1979) utilizes the Fe-Mg exchange KD (𝐾𝐷 =
(𝐹𝑒2+/𝑀𝑔)𝑔𝑛𝑡
(𝐹𝑒2+/𝑀𝑔)𝑐𝑝𝑥) between garnet and clinopyroxene. This method is widely used but is
susceptible to uncertainty in stoichiometrically-derived estimates of Fe3+ in the minerals
that can arise from cumulative errors in electron microprobe analyses (EMPA). This has
been clearly demonstrated by Li et al. (2005) who measured the Fe2+:Fe3+ ratio with
Mossbauer and compared this to the ratio calculated by stoichiometry using EMPA. They
found that in every instance the ratios were different. However it should be noted that
advances are being made to EMPA methodology (Matjuschkin et al. 2014) and increasingly
XANES is being used to estimate garnet Fe2+:Fe3+ ratios (Berry et al. 2010; Hanger et
al. 2015).
Although there are alternative permutations to the thermometer of Ellis and
Green (1979) most methods rely on the Fe-Mg KD. A further limitation with this type
of thermometer can arise through the relative ease of resetting of Fe-Mg
exchange during cooling. For these reasons exchange of slow-diffusing trace
elements between garnet and clinopyroxene has potential as a more reliable
alternative geothermometer, e.g. Sun and Liang (2012, 2013, 2015). The trace element
concentrations of garnet and clinopyroxene from eclogite and garnet peridotite are
routinely measured (for example Harte and Kirkley (1997); Appleyard et al. (2007); Greau
4
et al. (2011)), often as an aspect of diamond exploration strategies. However,
interpreting the trace element data is less routine (Griffin and Ryan 1995). Here we further
explore the use of trace element contents of coexisting garnet and clinopyroxene as a
geothermometer.
Theoretical Framework
Early work by Goldschmidt (1937) demonstrated that trace elements re side
on specific mineral sites and he proposed that ionic charge and radius strongly
influence trace element uptake, as measured, for example, by the partition coefficient
for a trace element between coexisting phases. Based on the thermodynamic work of
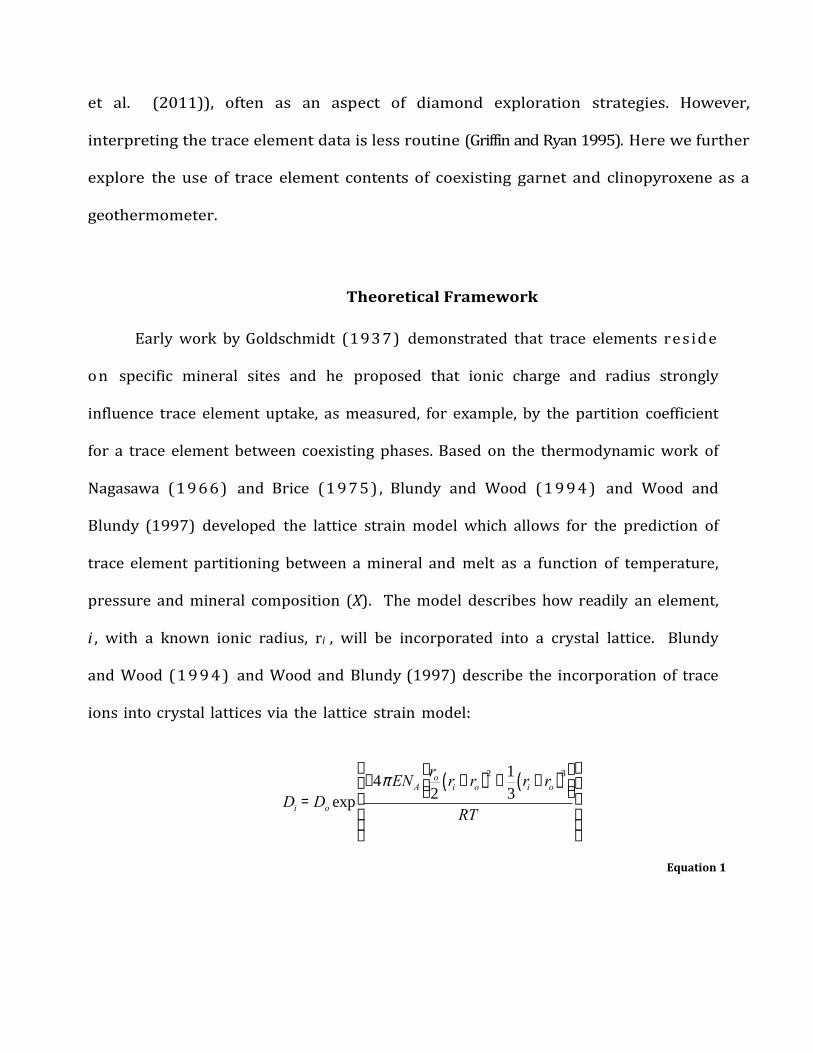
Nagasawa (1 9 6 6 ) and Brice (1 9 7 5 ) , Blundy and Wood ( 1 9 9 4 ) and Wood and
Blundy (1997) developed the lattice strain model which allows for the prediction of
trace element partitioning between a mineral and melt as a function of temperature,
pressure and mineral composition (X). The model describes how readily an element,
i , with a known ionic radius, ri , will be incorporated into a crystal lattice. Blundy
and Wood ( 1 9 9 4 ) and Wood and Blundy (1997) describe the incorporation of trace
ions into crystal lattices via the lattice strain model:
Di = Do exp
-4pENAro2ri - ro( )
2+
1
3ri - ro( )
3é
ëêù
ûú
RT
æ
è
çççç
ö
ø
÷÷÷÷
Equation 1
5
Where Di is the partition coefficient of element i between crystal and melt, Do is
the theoretical strain-free partition coefficient, E is the apparent Young’s modulus of
the lattice site, NA is Avogadro’s Number and ro is the ideal cation size for the lattice
s i t e of interest. Based on this model Wood and Blundy (1997) give equations to
predict each term for clinopyroxene-melt partitioning of rare earth elements (REE),
van Westrenen et al. (1999) and van Westrenen and Draper (2007) give
e q u i v a l e n t terms for garnet-melt partitioning of REE.
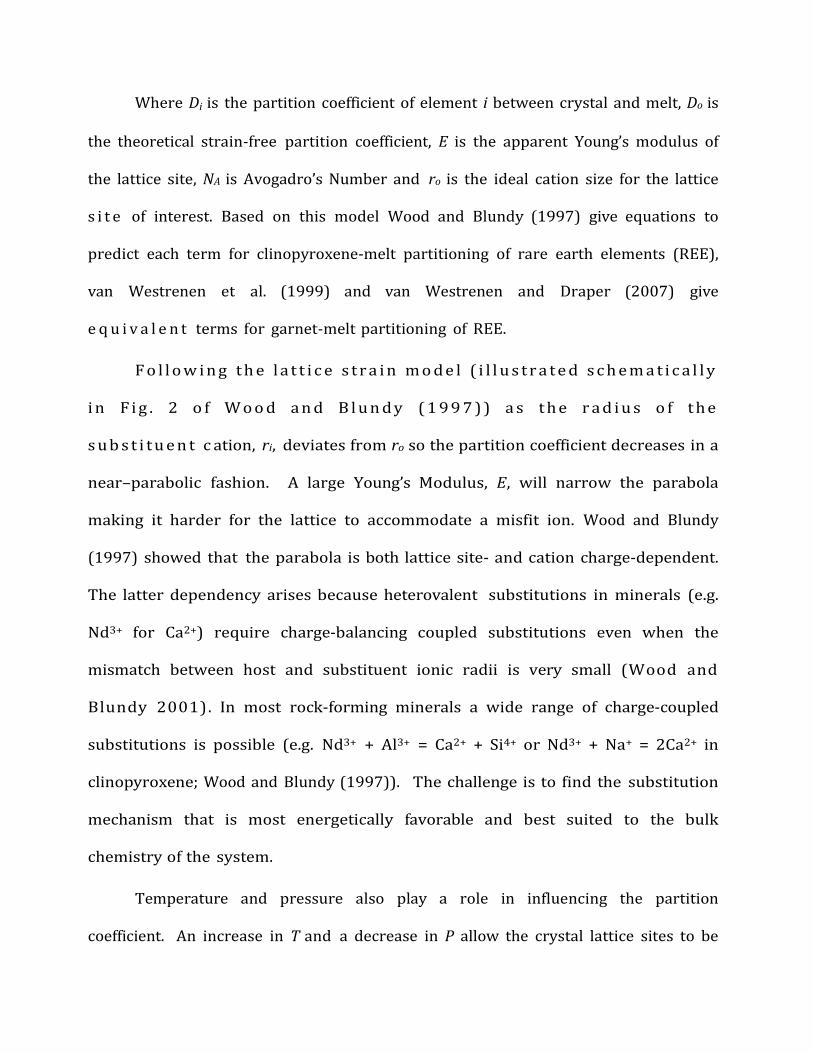
F o l l o w i n g t h e l a t t i c e s t r a i n m o d e l ( i l l u s t r a t e d s c h e m a t i c a l l y
i n F i g . 2 o f W o o d a n d B l u n d y ( 1 9 9 7 ) ) a s t h e r a d i u s o f t h e
s u b s t i t u e n t c ation, ri, deviates from ro so the partition coefficient decreases in a
near–parabolic fashion. A large Young’s Modulus, E, will narrow the parabola
making it harder for the lattice to accommodate a misfit ion. Wood and Blundy
(1997) showed that the parabola is both lattice site- and cation charge-dependent.
The latter dependency arises because heterovalent substitutions in minerals (e.g.
Nd3+ for Ca2+) require charge-balancing coupled substitutions even when the
mismatch between host and substituent ionic radii is very small (Wood and
Blundy 2001). In most rock-forming minerals a wide range of charge-coupled
substitutions is possible (e.g. Nd3+ + Al3+ = Ca2+ + Si4+ or Nd3+ + Na+ = 2Ca2+ in
clinopyroxene; Wood and Blundy (1997)). The challenge is to find the substitution
mechanism that is most energetically favorable and best suited to the bulk
chemistry of the system.
Temperature and pressure also play a role in influencing the partition
coefficient. An increase in T and a decrease in P allow the crystal lattice sites to be
6
more flexible, i.e. reduce their effective E, which in turn allows them to accommodate
misfit cations more easily. Note also that T appears in the denominator to Equation 1
so that at very high temperatures all mineral-melt partition coefficients approach
unity.
The success of the lattice strain model for mineral-melt pairs lies primarily in
the fact that the shear moduli of silicate melts are zero, hence Emelt=0.
Consequently from a purely lattice strain point of view there is no mechanical
energy associated with replacing one ion with another in a silicate melt. In reality
this is unlikely to be true, especially as other factors influence trace element
incorporation into melts, such as co-ordination environment, complexation,
configurational entropy etc. Experimental studies of melt-melt partitioning (e.g.
Watson (1976), Ryerson and Hess (1978), Schmidt et al. (2006)) reveal that elements
in general partition unequally between melts of different composition reflecting the
energetic preferences of ions with different charges and/or radii for melts with
different compositions/structures. However, the magnitude of melt-melt partition
coefficients is always smaller, by several orders of magnitude, than that of mineral-
melt partition coefficients for the same range of ionic radii and charge, demonstrating
that it is the energetics of trace ion incorporation into minerals that dominates the
energetics of mineral-melt exchange equilibria. Moreover, atomistic simulations in
which ions are substituted onto lattice sites and the resultant relaxation (strain)
energies calculated (e.g. Allan et al. (2003)) corroborate the findings of mineral-
melt partitioning studies.
Having established that it is the energetics of trace ion incorporation into
7
crystals that dominates mineral-melt partitioning equilibria it is a simple matter to
show that an understanding of mineral-melt partitioning for Mineral 1 and for
Mineral 2 constitutes an approach to understanding trace element partitioning
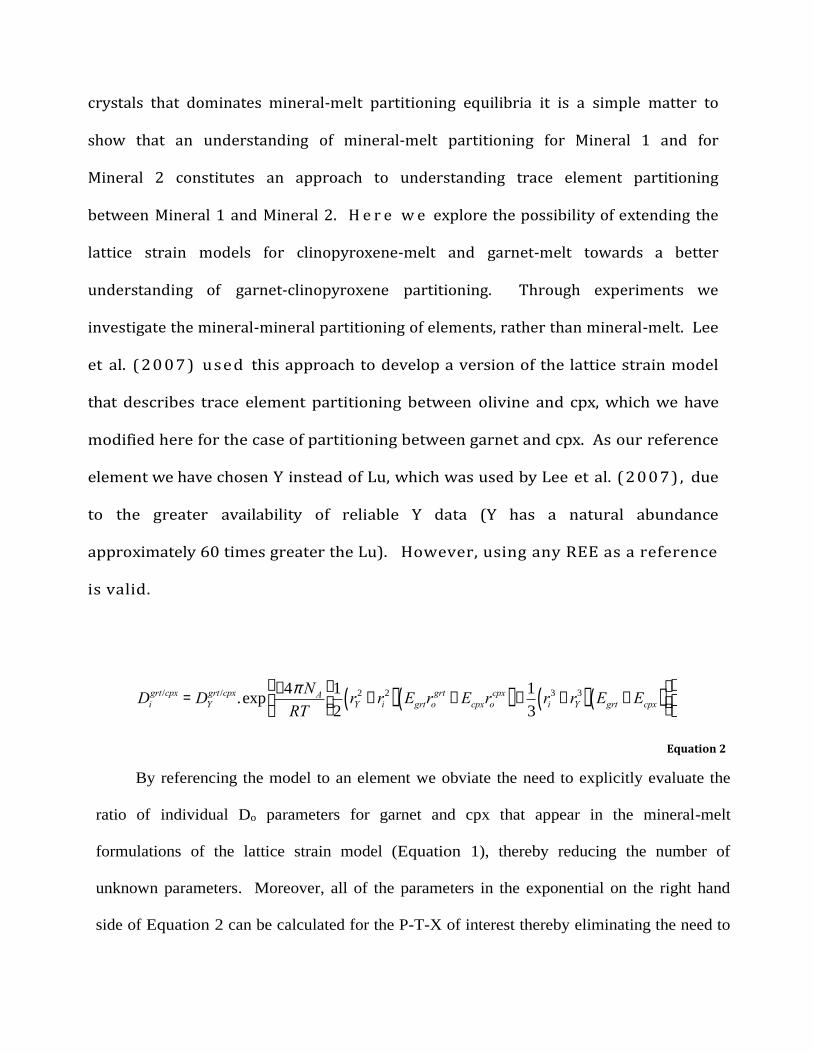
between Mineral 1 and Mineral 2. H e r e w e explore the possibility of extending the
lattice strain models for clinopyroxene-melt and garnet-melt towards a better
understanding of garnet-clinopyroxene partitioning. Through experiments we
investigate the mineral-mineral partitioning of elements, rather than mineral-melt. Lee
et al. (20 07 ) used this approach to develop a version of the lattice strain model
that describes trace element partitioning between olivine and cpx, which we have
modified here for the case of partitioning between garnet and cpx. As our reference
element we have chosen Y instead of Lu, which was used by Lee et al. (2007) , due
to the greater availability of reliable Y data (Y has a natural abundance
approximately 60 times greater the Lu). However, using any REE as a reference
is valid.
Digrt/cpx =DY
grt /cpx.exp-4pNART
1
2rY
2 - ri2( ) Egrtrogrt -Ecpxrocpx( ) +
1
3ri
3 - rY3( ) Egrt -Ecpx( )
é
ëê
ù
ûú
æ
èç
ö
ø÷
Equation 2
By referencing the model to an element we obviate the need to explicitly evaluate the
ratio of individual Do parameters for garnet and cpx that appear in the mineral-melt
formulations of the lattice strain model (Equation 1), thereby reducing the number of
unknown parameters. Moreover, all of the parameters in the exponential on the right hand
side of Equation 2 can be calculated for the P-T-X of interest thereby eliminating the need to
8
know anything about the composition of any melt that may or may not have coexisted with
the garnet and clinopyroxene.
To test our model we p e r f o r m e d a series of experiments aimed at
investigating the partitioning of trace elements, particularly the rare earth elements
(REE) and Y, between garnet and clinopyroxene, using a flux, e.g. a silicate melt, to
promote crystal growth. The new experimental dataset are augmented by published
experimental data on garnet-clinopyroxene pairs. Conditions of the new experiments
were designed so as to increase the coverage of P -T –X space. We will use our
experimental dataset to (a) investigate extension of the Lee et al. (20 07 ) approach
to garnet and clinopyroxene (b) critically appraise the recent mineral-mineral
partitioning work by Sun and Liang (2015, 2013, 2012) and (c) develop a REE
geothermometer for coexisting garnet and cpx. We use experimental garnet and cpx
from both eclogitic and peridotitic bulk compositions to increase the applicability of the
models. In all cases the Nernst partition coefficient, Di, is defined as the weight
concentration of the element i in garnet divided by the concentration of i in cpx. Thus
Di is shorthand for Dgrt/cpx.
Methods
Experimental Methods
Experimental starting materials (supplementary data table S1) consisted of
either a mechanical mixture of synthetic oxides (SiO2, TiO2, Al2O3, Fe2O3, MnO, MgO)
and carbonates (CaCO3, Na2CO3, K2CO3) or a natural basanitic glass. Starting
materials were doped with trace elements chosen to represent the different
9
geochemical groups (HFSE, REE, LILE etc.) but also in a way that minimizes
isobaric mass interferences during analysis (see below). Analytical grade oxides of
SiO2, MgO and Al2O3 were dried at 1000 ◦C for 2 hours. Other oxides and carbonates
were oven-dried at 200 ◦C for 24 hours. All oxides and carbonates were then stored
either in a desiccator or an oven at 110 ◦C prior to mixing. Reagents were mixed in
appropriate proportions and ground under acetone to homogenize and reduce the
grain size. The mixture was decarbonated at 600 to 1000 ◦C over a minimum of 12
hours.
Starting material JP1 (Table S1) is based on analyses of g a r n e t a n d c p x
f r o m an eclogite xenolith from the Roberts Victor mine. A synthetic hydrous
“rhyolite” flux, based on a partial melt in equilibrium with an eclogitic residue at
subduction zone conditions (Klimm et al. 2008), was mixed with the synthetic garnet
powder and synthetic cpx powder to enhance the equilibration rate s on the
timescales of experiments. The use of a fluxing agent has previously proven to be
successful in the case of zircon-garnet partitioning by Rubatto and Hermann (2007).
The rhyolite flux was formulated using dried oxides and carbonates, as above; alkalis
were added as natural albite and K-feldspar. For experimental run temperatures
below 1300 ◦C 10 wt.% deionized water was added with a micro-syringe. The flux, the
synthetic garnet and cpx powders were mixed in the desired proportions and
ground under acetone to further homogenize. The w e ight proportions used for JP1
were 20:40:40, flux:garnet:cpx. Of the other starting materials, ZrTi is a 25:25:50
mixture of synthetic o x i d e m i x e s o f grossular, pyrope and diopside, respectively,
10
with extra Zr and Ti to saturate with zircon and rutile; BAS is a natural basanitic
glass used in experiments by Green et al. (2000), AOB is a synthetic alkali olivine
basalt based on previous work by Withers (1997); and NSR-16 is a synthetic basaltic
glass, similar in composition to a 12.8 Ma transitional low-K basalt, from the Little
North Santiam River area of Oregon in the Western Cascades volcanic arc (R.M.
Conrey, written comm). Crystal seeds were not used in any experiments. These
different starting materials were chosen to generate garnet and cpx across a wide
variation in bulk composition.
Trace elements were added to all starting materials as ICP-standard nitrate
solutions using a micropipette and dried under a heat lamp. The doped mixtures
were re-homogenized in an agate mortar and denitrified at 300 ◦C. As the BAS glass
is natural and already contains a wide range of trace elements only 200 ppm of Li
were added. JP1, ZrTi, AOB and NSR-16 had a complete suite of trace elements added.
The trace element contents of all starting materials are given in Table S2. Following
doping and denitrification starting materials JP1, ZrTi and AOB were melted and
quenched in a controlled atmosphere, vertical quench furnace at an f O 2 equivalent
to the nickel-bunsenite (NNO) buffer, between 1000 and 1520 ◦C. This fixes the
Fe2+:Fe3+ ratio in the starting material to match the r e l a t i v e l y o x i d i z e d
intrinsic f O 2 of the experimental apparatus ( > N N O ) and thereby minimizes redox
reactions, mediated by H2 diffusion, taking place during the experiments. NSR-16 was
prepared as a hydrous glass, using Al(OH)3 as a source of H2O. Trace element-doped
NSR-16 powder was loaded into an Au80:Pd20 capsule and held at 0.22 GPa and 1000
11
◦C for 2 hrs in a rapid-quench TZM cold-seal apparatus at NNO+1.
To minimize Fe loss during experiments we used Au80:Pd20 capsules that were
annealed and acid-cleaned before loading and welding. The outside diameter of the
capsules was 2 mm and they ranged in length from 0.5 to 2 mm. Some experiments
w e re run w ith two capsules each containing different starting materials in end-to-
end configuration. Experimental run times were between 4 and 123 hours, see Table 1.
We note that for the basanite runs these run durations are identical to those of Green et
al. (2000) for the same starting materials and run conditions.
Experiments from 3.0 to 3.4 GPa pressure were carried out using 1/2” end-
loaded piston cylinder apparatus at the University of Bristol. The pressure media
were NaCl, Pyrex and crushable alumina with a graphite furnace. The experiments
were pressurized and heated simultaneously with the pressure always being the
final variable to be increased, i.e. hot piston-in technique. During the experiment
pressure was maintained manually at the desired value and the temperature was
measured using an axial W95Re5-W75Re25 thermocouple (not corrected for
pressure) and regulated by a Eurotherm controller. The pressure correction of
McDade et al. (2002b) was applied and verified by bracketing the quartz-coesite
boundary. RB627 (1.3 GPa) was performed in a 3/4” talc/Pyrex assembly with a
tapered graphite furnace and pressure-calibrated using the melting point of CsCI
(see McDade et al. (2002a)).
Experiments above 3.4 GPa were carried out using a Walker-type multi-anvil
apparatus at Bayerisches Geoinstitut (B.G.I.), University College London (U.C.L.) and
the University of Bristol. In each case the pressure medium was precast MgO
12
octahedra with truncations of varying length depending on the pressure required.
Either an MgO or alumina spacer surrounded the capsule with a ZrO2 insulator
around the furnace. Experiments at B.G.I. used the 10/4 assembly with a LaCrO3
furnace; at U.C.L. a 14/8 assembly with a graphite furnace; and at Bristol an 18/11
assembly with graphite furnace. The temperature was measured with a W97Re3-
W75Re25 thermocouple, inserted radially in U.C.L. experiments and axially at B.G.I.
and Bristol. The experiments were pressurized over 3 hours and heated for between
6 and 8 hours. The pressure calibrations used the following phase changes: quartz-
coesite, coesite-stishovite, Bi I-II, Bi III-V and CaGeO4 (garnet to pervoskite). All
experiments were ended by turning the power off to give quench times of less than
10 seconds to reach 300 ◦C.
Analytical Methods
Major element data were collected using a five-spectrometer Cameca SX100
electron microprobe at the University of Bristol. For both garnet and cpx the
analytical conditions were 20 kV, 20 nA beam and 1 µm spot size. Peak count
times ranged from 10 to 30 s depending on the concentration of the element of
interest.
A Cameca IMS-4f ion-microprobe at the University of Edinburgh was used to
measure trace elements in garnet and cpx of the experimental run products by
secondary ion mass spectrometry (SIMS). All samples had a 20 nm gold coat applied
under vacuum. A primary beam of 16O- with a net impact of energy of 15 keV was
used. Positive secondary ions were accelerated to 4500 V with an energy offset of 75
13
eV and a window of 40 eV to minimize transmission of molecular ions. The beam
current was varied as necessary to permit analysis of the smaller grains because, in
general, beam diameter is a strong function of beam current, i.e. 30 µm beam
diameter at 5 nA, 15 µm at 1.5 nA. All SIMS pits were examined subsequently by
SEM to check that there was no visible overlap onto adjacent phases. Secondary ion
yields were calibrated using standard glass NIST SRM 610 (Hinton 1990 ) and
checked using secondary standards of garnets DD1 (Irving and Frey 1978), AP, SG
and cpx SC8804 (van Westrenen 2000). The following positive secondary ion masses
were analyzed and ratioed to 30Si (as determined by electron microprobe): 7Li, 11B,
30Si, 42Ca, 44Ca, 45Sc, 47Ti, 51V, 59Co, 69Ga, 88Sr, 89Y, 90Zr, 93Nb, 138Ba, 139La, 140Ce, 143Nd,
149Sm, 151Eu, 157Gd, 159Tb, 267Er, 171Yb 175Lu, 178Hf, 181Ta, 208Pb, 232Th, 238U. (Note that
71Ga was used for the NIST610 glass due to overlap on 69Ga of 138Ba, a species with
negligible concentration in garnet and clinopyroxene.) The count times per cycle
were 5 s for all isotopes, except: 2 s for Si and 42Ca, 3 s for 140Ce, 47Ti and 88Sr, 7 s for
143Nd and 149Sm and 10 s for 178Hf. The number of cycles was between 8 and 15 to
produce statistically significant data, with low c ount ing error. Isobaric oxide
interferences were greatly minimized by the careful choice of elements, doping levels
and energy filtering of secondary ions. The remaining molecular interferences, such
as 29Si16O on 45Sc, were removed by conventional peak- stripping. Overlap of LREE
oxides on HREE was corrected using in-house REEO/REE values for cpx and values of
van Westrenen (2000) for garnet. Analysis of secondary standards demonstrated that
there was no significant secondary ion-yield differences between garnet and cpx thus
Di is taken to be the Si-normalized concentration of an element in garnet divided by
14
that in cpx.
Results and Discussion
Experimental run conditions and major element mineral data measured by EMPA are
presented in Table 1 and Table 2. Attainment of equilibrium in the new experiments is
demonstrated through the homogeneity of the run products (Figure 1), the small standard
deviation in the major element data, Table 1 and Table 2, and the shape of the
parabolae of the REE data. The presented EMPA data for each experiment are a
mixture of core and rim measurements, therefore any variability within a crystal, i.e.
zoning, would result in a large standard deviation in the major element data. A total of 12
experiments contained garnet and cpx crystals between 20 and 100 µm that could be
analysed by ion-microprobe. Occasionally garnets contained cpx inclusions, which
were avoided during analysis. Areas of melt or quench crystals occurred in some
experiments. The garnet and cpx end members were calculated using the methods of
Deer et al. (1992) and Morimoto et al. (1988 ) respectively. SIMS trace element data
for cpx are presented in Table 3 and for garnet in Table 4. Care was taken during data
processing to check that there was no contamination by other phases during analysis.
One clear indication of glass contamination is elevated concentrations of highly
incompatible elements, such as U or Th. In some cases contamination only involved a
few analytical cycles and these were eliminated during processing. In cases where
there was persistent contamination throughout the analysis the trace element data
were discarded.
The major element composition of garnet varies very little between each
starting composition. All garnets are pyrope-rich (0.65-0.41 mol fraction) with lesser
15
amounts of grossular (0.26-0.14 mol fraction) and almandine (0.32-0.07 mol fraction),
where almandine was calculated from stoichiometric Fe2+. The only experiment
with a greater almandine than grossular content is RB627. The majority of the
experimental cpx are Na-rich (omphacite following Morimoto et al. (1988)) with three
being relatively Mg-rich and falling within the Ca-Fe-Mg quadrilateral. Aliv ranges
between 0.175-0.003 cations per formula unit (c.p.f.u.), Na 0.507-0.108 c.p.f.u., Ca
0.757-0.475 c.p.f.u., Mg 1.049-0.539 c.p.f.u. and Fe 0.375-0.069 c.p.f.u. The
concentration of Ca in both garnet and cpx increases with an increase in pressure,
however the rate of change per GPa is greatest in garnet, which may have potential
as a barometer, although this is not explored here.
The high Fe3+ content of the garnets and most cpx (Table 1 and Table 2) is
consistent with the assumption of a run ƒO2 above NNO. For instance, the average
calculated garnet Fe3+/Fetot is 26% (range 8-41%; See Table 2) which is closer to the
ReReO2 buffered runs (~NNO+2) of Matjuschkin et al. (2014) than the 5% Fe3+/Fetot in
garnets of the NNO runs of Rubatto & Hermann (2007). Note that at these high ƒO2
values it is anticipated that >90% of the Eu can be considered as trivalent (see Burnham
et al. (2015)).
Garnet-cpx trace element partition coefficient data, Figure 2, show that the
differing starting compositions produce similar trends. In all experiments Sr has
the smallest garnet-cpx partition coefficient. The absolute concentration of Sr
increases greatly in both garnet and cpx with an increase in pressure, however the
change in concentration is similar in both minerals resulting in only a modest
increase in DSr with P. A comparable effect is seen in Li with P except that the
16
concentration in garnet increases more quickly than cpx resulting in a potential
barometer, as previously identified by Hanrahan et al. (2009, 2009b). Lutetium
has the highest partition garnet-cpx coefficient in all experiments.
Lattice Strain Model Applied to Garnet-Cpx Pairs
Our new data on REE partitioning between the dodecahedral X-site in garnet and
the 8-fold M2 site in cpx are in agreement with previous studies. Figure 3 shows the
partition coefficient plotted against the ionic radius of the cation, using 8-fold ionic
radii values from Shannon (1976). There is an increase in concentration from La to
Lu in both minerals, however the LREE have a greater affinity for cpx than garnet,
whereas HREE more readily enter garnet. The change in the REE concentration,
from LREE to HREE, is far greater for garnet than for cpx. The concentration of Sm
is approximately equal in garnet and cpx, resulting in DSm≈1. Garnet-melt and cpx-
melt data have been shown to form parabolae by van Westrenen (2000) and Wood
and Blundy (1997) respectively. By combining these two mineral-melt parabolae
we see an almost linear trend. This is in part because Sc is not considered here as it
enters the cpx M1 site rather than the M2 site which accommodates the REE (Allan
et al. 2003). Consequently, we only observe one limb of what is still a parabola.
One of the objectives of this paper is to investigate the ability of the lattice strain
model to describe partitioning between garnet and cpx. To this end we have used
the equations of Wood and Blundy (1997) and van Westrenen and Draper (2007) to
derive the lattice strain parameters rocpx, Ecpx, rogrt, Egrt. We find that these
parameters describe the garnet-cpx partitioning data well. Figure 3 shows the curve
17
of weighted best fit for the lattice strain model for the new experimental data
(Equation 2) having adopted the Wood and Blundy (1997) and van Westrenen and
Draper (2007) ro and E terms for cpx and garnet respectively. As all variables that
influence E and ro parameters are known, i.e. T, P and mineral composition, there is
evidently a self-consistency between the published mineral-melt and the new
mineral-mineral models.
To further investigate the lattice strain approach, garnet-cpx partitioning data
from other experimental studies were also considered (Table S3). These
experiments cover a wide range of P – T conditions (1000 to 1750 oC and 1.5 to 7.0
GPa). As with our experiments, the weighted curve of best fit to the garnet-cpx REE
partition coefficients is calculated using Equation 2 with ro and E for cpx and garnet
calculated from Wood and Blundy (1997) and van Westrenen and Draper (2007)
respectively. Most data are well described by the lattice strain model and the
imposed lattice strain parameters (see Figure S1, Figure S2 and Figure S3). Poor
agreement between the model and the data can often be attributed to the quality of
the analyses. The experiments by Hauri et al. (1994) and Klein et al. (2000), for
example, show many inconsistencies with the other datasets, possibly due to
contamination by glass or cpx in the garnet analyses. For this reason these data
were not included in further analysis. The experiments by Kuzyura et al. (2010),
however, have small analytical uncertainties and no obviously anomalous results,
yet the model provides a poor fit to their data (Figure S2). The primary difference
between these experiments and all the others is that Kuzyura et al. (2010) used a
carbonate-silicate mix, as opposed to silicate only. This results in garnets with a
18
much greater Ca content (around 0.5 mole fraction grossular end-member as
opposed to between 0.1 and 0.2 in the other experiments). The effect of Ca on REE
partitioning was investigated by van Westrenen et al. (1999) who found that as the
grossular component in garnet increases Egrt decreases. van Westrenen and Draper
(2007) provide a correction for Ca in the rogrt term which is then used to calculate
Egrt. It would appear that in the case of Kuzyura et al.’s (2010) unusually Ca-rich
garnets this approach breaks down. For this reason those experiments are not
considered further in our study, pending further work to better quantify the effect
of high-Ca on Egrt.
Sun and Liang (2012, 2013) present a model for garnet-cpx partitioning of
REE in which they define new terms for predicting E and r for both minerals. A
comparison of the rocpx and Ecpx values obtained by Sun and Liang (2012) to those
of Wood and Blundy (1997) shows very good agreement. However, for rogrt the term
of Sun and Liang (2013) is calculated from the Ca content alone, and Egrt
depends only on rogrt. The result is that both parameters in garnet are defined
solely by its Ca content. Previous work by van Westrenen et al. (1999); van
Westrenen (2000); van Westrenen and Draper (2007) demonstrated that Egrt is
heavily dependent on a number of other garnet compositional terms, in addition to
T and P. Comparing the Egrt values calculated through the method of Sun and Liang
(2013) with those calculated with the method of van Westrenen and Draper (2007)
demonstrates little correlation between the values (Figure 4). The method of Sun
and Liang (2013) underestimates the majority of the Egrt by several hundred GPa
compared to the method of van Westrenen and Draper (2007). Egrt values from the
19
two experiments by Kuzyura et al. (2010) are overestimated by around 250 GPa.
These mismatches have consequences for garnet-cpx partitioning.
Calculating Ecpx, rocpx, Egrt and rogrt using the method of Sun and Liang (2013, 2015)
and comparing the fit to the garnet-cpx experimental data, analogous to Figure 3,
demonstrates little correlation between the fit and the data. We attribute this
mismatch to the values of Egrt, which cannot be calculated solely from Ca in garnet.
Whilst the method given by Sun and Liang (2013) is useful for estimating
temperature and pressure their Egrt values are inconsistent with garnet-melt
experimental data.
Lattice Strain Model and Temperature The partitioning of trace elements between garnet and cpx given by Equation 2 has an
inherent T term; a change in Di with T is predicted, both through its occurrence in the
denominator of the exponential terms and in its tendency to reduce E and increase
r o . In contrast, although pressure will also affect E and r o the magnitude of this effect
is small relative to that of temperature. The influence of temperature was confirmed
by the work of Wood and Blundy (1997) and van Westrenen and Draper (2007) who
found that E in both cpx and garnet has a quantifiable temperature dependence.
Dohmen and Blundy (2014) came to a similar conclusion from a study of plagioclase-
melt trace element partitioning. Figure 5 confirms the importance of T by displaying
the change in the shape of the parabola when all the lattice strain terms are kept
constant and only T is altered. Equation 2 can be re-arranged to make T the dependent
variable and therefore yield a geothermometer that can be applied to REE
p a rt i t ioning be twe e n coexisting garnet and cpx.
20
Digrt/cpx =Dj
grt /cpx.exp-4pNART
1
2rj
2 - ri2( ) Egrtrogrt -Ecpxrocpx( ) +
1
3ri
3 - rj3( ) Egrt -Ecpx( )
é
ëê
ù
ûú
æ
èç
ö
ø÷
T (K ) =
-4pNAR
1
2rj
2 - ri2( ) Egrtrogrt -Ecpxrocpx( ) +
1
3ri
3 - rj3( ) Egrt -Ecpx( )
é
ëêù
ûú
lnDiDj
æ
èçç
ö
ø÷÷
Equation 3
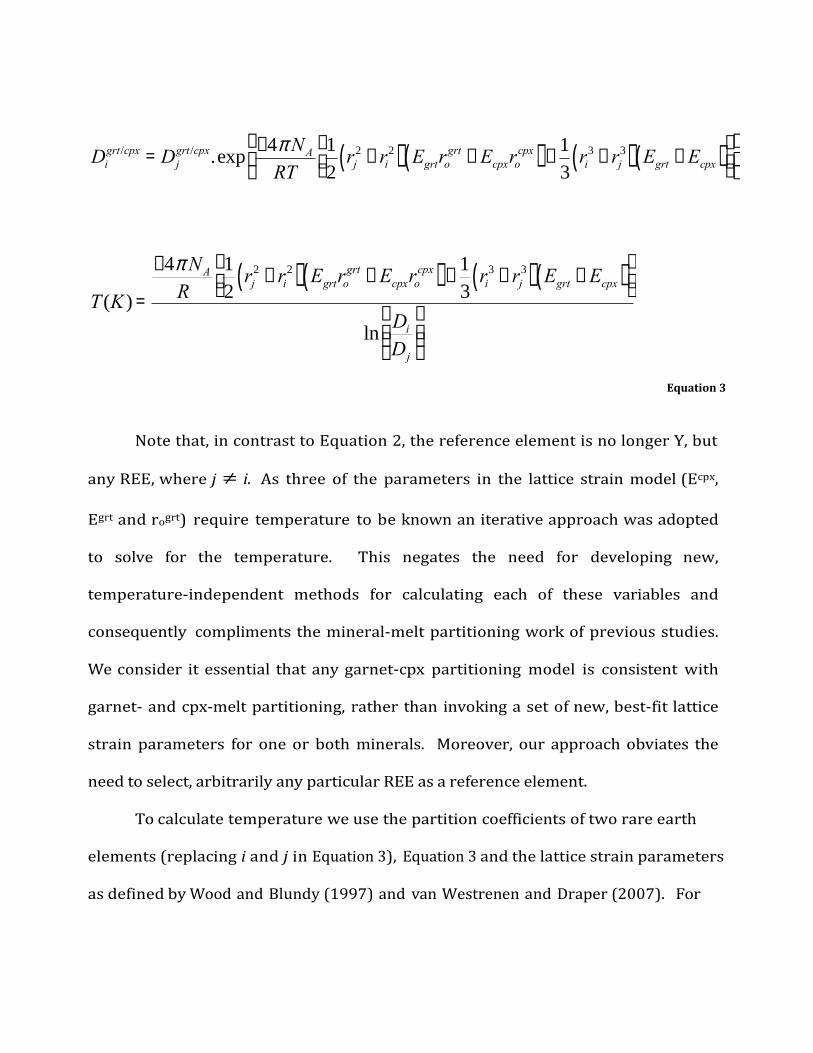
Note that, in contrast to Equation 2, the reference element is no longer Y, but
any REE, where j ≠ i. As three of the parameters in the lattice strain model (Ecpx,
Egrt and rogrt) require temperature to be known an iterative approach was adopted
to solve for the temperature. This negates the need for developing new,
temperature-independent methods for calculating each of these variables and
consequently compliments the mineral-melt partitioning work of previous studies.
We consider it essential that any garnet-cpx partitioning model is consistent with
garnet- and cpx-melt partitioning, rather than invoking a set of new, best-fit lattice
strain parameters for one or both minerals. Moreover, our approach obviates the
need to select, arbitrarily any particular REE as a reference element.
To calculate temperature we use the partition coefficients of two rare earth
elements (replacing i and j in Equation 3), Equation 3 and the lattice strain parameters
as defined by Wood and Blundy (1997) and van Westrenen and Draper (2007). For
21
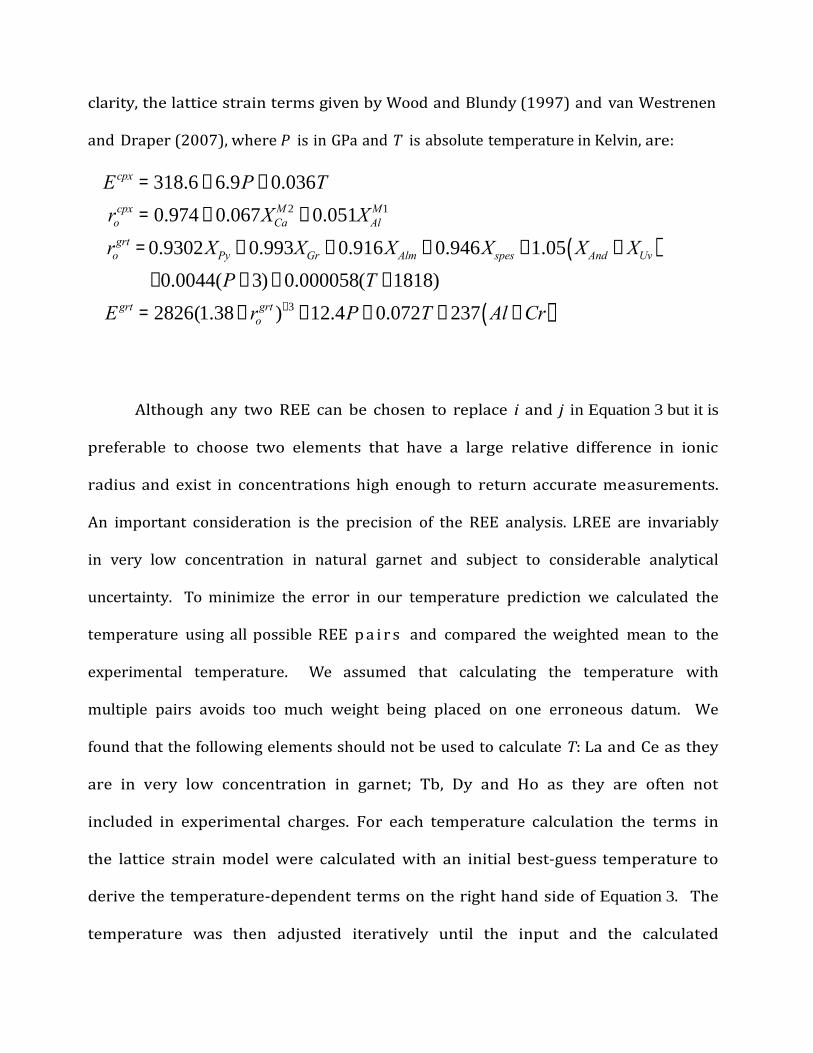
clarity, the lattice strain terms given by Wood and Blundy (1997) and van Westrenen
and Draper (2007), where P is in GPa and T is absolute temperature in Kelvin, are:
Ecpx = 318.6 + 6.9P - 0.036T
rocpx = 0.974 + 0.067XCa
M 2 - 0.051XAlM1
rogrt =0.9302XPy + 0.993XGr + 0.916XAlm + 0.946Xspes +1.05 XAnd + XUv( )
-0.0044(P -3)+ 0.000058(T -1818)
E grt = 2826(1.38+ rogrt )-3 +12.4P - 0.072T + 237 Al +Cr( )
Although any two REE can be chosen to replace i and j in Equation 3 but it is
preferable to choose two elements that have a large relative difference in ionic
radius and exist in concentrations high enough to return accurate measurements.
An important consideration is the precision of the REE analysis. LREE are invariably
in very low concentration in natural garnet and subject to considerable analytical
uncertainty. To minimize the error in our temperature prediction we calculated the
temperature using all possible REE p a i r s and compared the weighted mean to the
experimental temperature. We assumed that calculating the temperature with
multiple pairs avoids too much weight being placed on one erroneous datum. We
found that the following elements should not be used to calculate T: La and Ce as they
are in very low concentration in garnet; Tb, Dy and Ho as they are often not
included in experimental charges. For each temperature calculation the terms in
the lattice strain model were calculated with an initial best-guess temperature to
derive the temperature-dependent terms on the right hand side of Equation 3. The
temperature was then adjusted iteratively until the input and the calculated
22
temperature were the same to within 1 degree. The temperature for each element
pair, along with the error on Di from the ion probe data, allow a weighted mean to
be calculated for each experiment. This approach means that the mean temperature
can be screened for analyses with a large error. Calculated temperatures less than
600 or greater than 2000 oC were assumed to be erroneous and removed from
consideration. An excel spreadsheet to perform these calculations is available from the
first author.
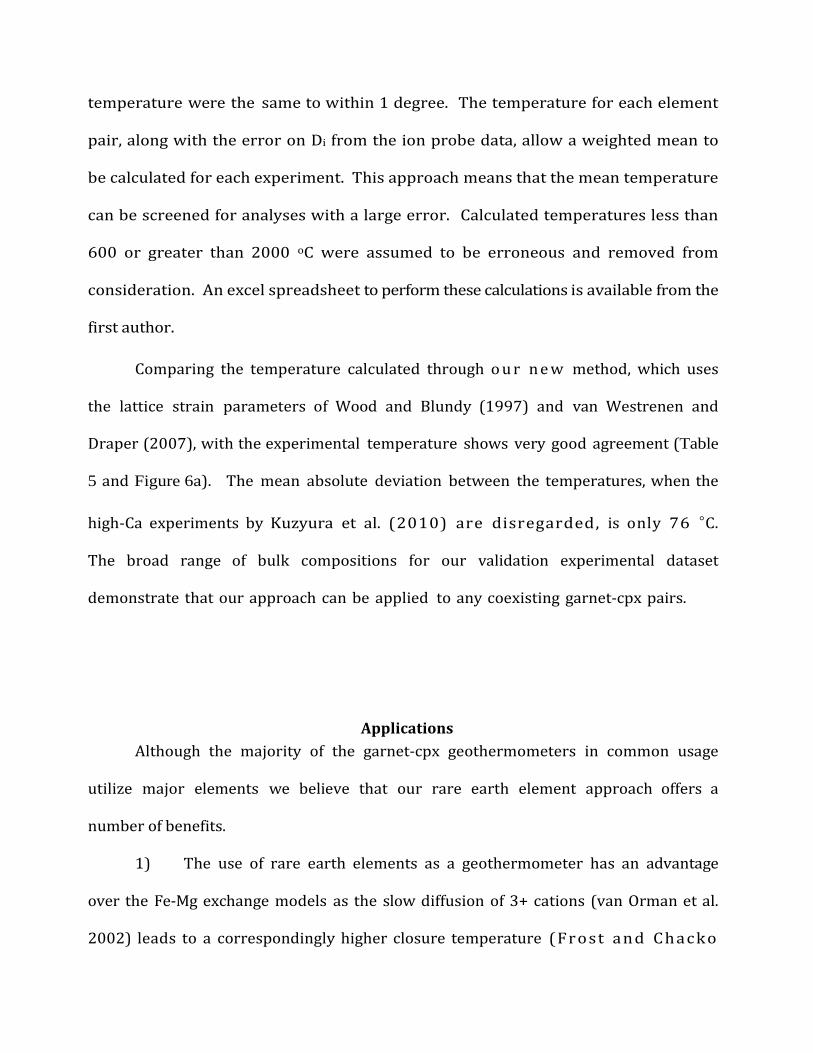
Comparing the temperature calculated through o u r n e w method, which uses
the lattice strain parameters of Wood and Blundy (1997) and van Westrenen and
Draper (2007), with the experimental temperature shows very good agreement (Table
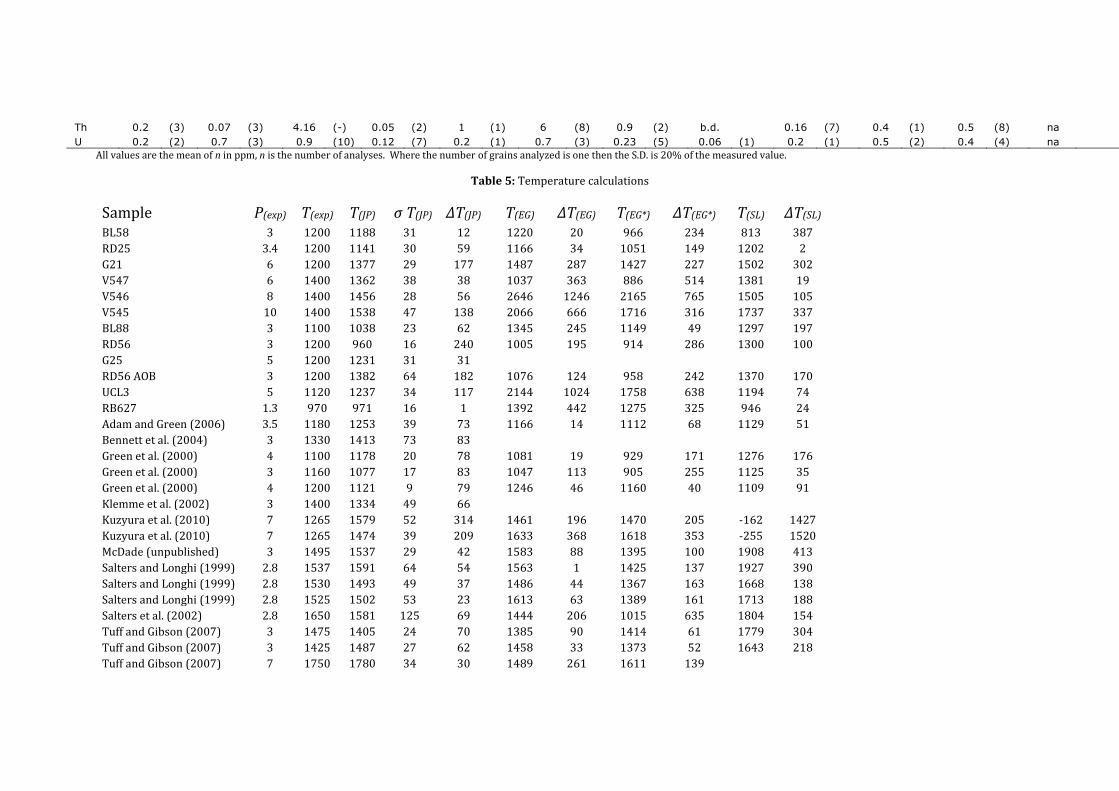
5 and Figure 6a). The mean absolute deviation between the temperatures, when the
high-Ca experiments by Kuzyura et al. (2010) are disregarded, is only 76 ◦C.
The broad range of bulk compositions for our validation experimental dataset
demonstrate that our approach can be applied to any coexisting garnet-cpx pairs.
Applications
Although the majority of the garnet-cpx geothermometers in common usage
utilize major elements we believe that our rare earth element approach offers a
number of benefits.
1) The use of rare earth elements as a geothermometer has an advantage
over the Fe-Mg exchange models as the slow diffusion of 3+ cations (van Orman et al.
2002) leads to a correspondingly higher closure temperature (Frost and Chacko
23
1989) . Work by Pattison (1994) and others shows that the Fe-Mg exchange can
return differing temperatures that depend on the grain size of the minerals analyzed, a
hallmark of a diffusion-controlled process. Pattison (1994) suggested that the Fe-Mg
in granulites may record the temperature at which inter granular exchange ceased in
the rock. By using REE, which diffuse much more slowly, the peak metamorphic
temperature should be recovered. See Yao and Liang (2015) and Sun and Liang (2015)
for detailed discussion of closure temperatures in bi-mineralic systems.
2) The REE geothermometer presented here is developed independently of
any other geothermometer. Other models, such as Witt-Eickschen and O’Neill
( 2 0 0 5 ) , use natural xenoliths along with extant major element thermometers to
develop trace element geothermometers. Such models will therefore inherit any
inaccuracies from their “parent” model against which they are calibrated. This will
not be the case with our model as it has been developed independently of any pre-
existing geothermometer.
3) The thermometer developed here is entirely consistent with a
substantial body of garnet-melt and cpx-melt partitioning studies that have gone
some way to refining the key lattice strain parameters. We have not had to invoke
new lattice strain parameters for the specific purpose of recovering temperature
from garnet-cpx pairs.
4) Finally, the availability of a large number of REE data gives our
approach considerable flexibility in that different pairs of REE can be used,
according to data availability and precision. Through combining the weighted
temperature predictions of multiple REE pairs the most accurate temperature can
24
be estimated.
An enduring shortcoming of this and other thermometers is the need to
know the equilibrium pressure. Throughout this study where a pressure estimate
is required, such as in predicting Egrt, the experimental P has been used. Currently
the barometers of Simakov (2008) and Sun and Liang (2015) are available for
garnet-cpx pairs. Alternatively, many studies use an assumed pressure of 5 GPa to
compare data. To avoid amplifying uncertainties inherent in the barometers and to
clearly display the error associated with our model we have only used experimental
pressures. An increase of 1 GPa in assumed pressure increases the temperature
estimate by, on average, 50 oC in our model irrespective of the REE pair chosen.
Our experiments show that the effect of pressure on rare earth element
partitioning in isothermal, isochemical experiments is not consistent enough to be used
as barometer. Comparing isothermal series of experiments carried out at 1200 and
1400 oC (Figure 7) shows that there is no consistent effect of pressure that can be
used to solve for the pressure. The experiments carried out at 1200 oC, but variable
pressure, are all within error of each other, whereas the experiments at 1400 oC
appear to show a pressure effect, which on closer inspection is found to be not
consistent.
Comparison to existing thermometers
The Fe-Mg exchange geothermometer of Ellis and Green (1979) is the most
widely used method of estimating temperature for garnet-clinopyroxene pairs. To
25
evaluate our new geothermometer we have calculated the temperature using the
method of Ellis and Green (1979), bot h with and without the calculation of Fe2+ b y
stoichiometry. We have also calculated temperature f o r t h e s a m e
e x p e r i m e n t s with the REE method of Sun and Liang (2015) and compared all
T estimates to the experimental temperature (Table 5 and Figure 6b). Points of note
are that temperature estimates for some of our new experiments are significantly
over-estimated using the method of Ellis and Green (1979). Even when the error
associated with the Fe2+ calculation is removed (T(EG*) in Table 5) the temperature
estimates are still several hundred degrees too high. This results in a mean
absolute deviation of 240 oC between the temperature calculated using the method of
Ellis and Green (1979) and the experimental temperature. The mean absolute
deviation between the experimental temperature and that calculated T using the
method of Sun and Liang (2014) is 174 oC. These values can be compared with our
lattice strain approach which has an absolute mean deviation of only 76 oC when the
temperature is calculated using the mean of all REE pairs. (The highly discrepant
values for Kuzyura et al. (2010) data are not included in either of the REE temperature
estimates.) This clearly demonstrates that not only can the lattice strain model be
used to estimate temperature but also the T may be more accurate than the most
commonly used eclogitic geothermometer. It should be reemphasized that our
temperature formulation is not calibrated on the experimental data presented in
Table 5. We have simply transferred the lattice strain parameters from garnet-melt
and cpx-melt models and applied them the case of garnet-cpx partitioning. Thus this
is a fair test of all thermometers.
26
Implications
In this paper we explore the potential of the lattice strain model, as derived from studies
of mineral-melt trace element partitioning, to be used as a mineral-mineral
geothermometer. By testing our approach to estimating temperature with both
eclogitic and peridotitic minerals we have demonstrated the versatility of the lattice
strain model as a thermometer for mantle minerals. Through focusing on garnet and
cpx, which are stable over a very wide range of temperature and pressure conditions,
we have developed a model that has very wide-reaching applications, both in
metamorphic geology, tectonic reconstructions and diamond exploration. Whilst the
focus of this paper is on the partitioning of garnet and cpx the approach taken here
can be applied to any coexisting mineral pair, as long as a method exists to
calculated E and r for the minerals of interest, ideally from mineral-melt
partitioning studies. In light of recent predictive models for plagioclase-melt
partitioning of trace elements (Dohmen and Blundy 2014) the potential of cpx-
plagioclase pairs as trace element geothermometers would benefit from further
evaluation.
Acknowledgements
JP is grateful to Rio Tinto for a PhD studentship at the University of Bristol, B.G.I. and
27
Dave Dobson for access to their multi-anvil apparatus and Richard Hinton for
assistance with the ion-microprobe analyses. JB acknowledges funding from ERC
Advanced Grant CRITMAG and a Royal Society Wolfson Research Merit Award. This
work has benefitted from discussion with Chris Smith, Russell Sweeney, John
Schumacher, Susanne Skora and Wim van Westrenen. We thank Yan Liang and an
anonymous reviewer for thoughtful reviews of our manuscript.
28
References
Adam, J., and Green, T. (2006) Trace element partitioning between mica- and amphibole-bearing garnet lherzolite and hydrous basanitic melt: 1. Experimental results and the investigation of controls on partitioning behaviour. Contributions to Mineralogy and Petrology, 152, 1–17.
Ai, Y. (1994) A revision of the garnet-clinopyroxene Fe2+-Mg exchange geothermometer. Contributions to Mineralogy and Petrology, 115, 467–473.
Allan, N.L., Du, Z., Lavrentiev, M.Y., Blundy, J.D., Purton, J.A., and Westrenen, W. van (2003) Atomistic simulation of mineral–melt trace-element partitioning. Physics of the Earth and Planetary Interiors, 139, 93 – 111.
Appleyard, C.M., Bell, D.R., and le Roex, A.P. (2007) Petrology and geochemistry of eclogite xenoliths from the Rietfontein kimberlite, Northern Cape. Contributions to Mineralogy and Petrology, 154, 309–333.
Bennett, S., Blundy, J., and Elliott, T. (2004) The effect of sodium and titanium on crystal-melt partitioning of trace elements. Geochimica et Cosmochimica Acta, 68, 2335–2347.
Berry, A.J., Yaxley, G.M., Woodland, A.B., and Foran, G.J. (2010) A XANES calibration for determining the oxidation state of iron in mantle garnet. Chemical Geology, 278, 31–37.
Blundy, J., and Wood, B. (1994) Prediction of crystal-melt partition coefficients from elastic-moduli. Nature, 372, 452–454.
Brice, J. (1975) Some thermodynamic aspects of growth of strained crystals. Journal of Crystal Growth, 28, 249–253.
Deer, W.A., Howie, R.A., and Zussman, J. (1992) An introduction to the Rock Forming Minerals Vol. 2. Prentice Hall.
Dohmen, R., and Blundy, J.D. (2014) A predictive thermodynamic model for element partitioning between plagio- clase and melt as a function of pressure, temperature and composition. American Journal Of Science, 314, 1310–1372.
Ellis, D., and Green, D. (1979) An experimental study of the effect of Ca upon garnet-clinopyroxene Fe-Mg exchange equilibria. Contributions to Mineralogy and Petrology, 71, 13–22.
Frost, B.R., and Chacko, T. (1989) The granulite uncertainty principle - Limitations on thermobarometry in granulites. Journal of Geology, 97, 435–450.
29
Goldschmidt, V. (1937) The principles of distribution of chemical elements in minerals and rocks. The seventh Hugo Muller Lecture, delivered before the Chemical Society on March 17th, 1937. Journal Of The Chemical Society, 655–673.
Gréau, Y., Huang, J.-X., Griffin, W.L., Renac, C., Alard, O., and O’Reilly, S.Y. (2011) Type I eclogites from Roberts Victor kimberlites: Products of extensive mantle metasomatism. Geochimica et Cosmochimica Acta, 75, 6927–6954.
Green, T., Blundy, J., Adam, J., and Yaxley, G. (2000) SIMS determination of trace element partition coefficients between garnet, clinopyroxene and hydrous basaltic liquids at 2-7.5 GPa and 1080-1200 oC. Lithos, 53, 165–187.
Griffin, W.L., and Ryan, C.G. (1995) Trace elements in indicator minerals: area selection and target evaluation in diamond exploration. Journal of Geochemical Exploration, 53, 311.
Hanger, B.J., Yaxley, G.M., Berry, A.J., and Kamenetsky, V.S. (2015) Relationships between oxygen fugacity and metasomatism in the Kaapvaal subcratonic mantle, represented by garnet peridotite xenoliths in the Wesselton kimberlite, South Africa. Lithos, 212, 443–452.
Hanrahan, M., Brey, G., Woodland, A., Altherr, R., and Seitz, H. (2009) Towards a Li barometer for bimineralic eclogites: experiments in CMAS. Contributions to Mineralogy and Petrology, Online.
Harte, B., and Kirkley, M.B. (1997) Partitioning of trace elements between clinopyroxene and garnet: Data from mantle eclogites. Chemical Geology, 136, 1–24.
Hauri, E., Wagner, T., and Grove, T. (1994) Experimental and natural partitioning of Th, U, Pb and other trace elements between garnet, clinopyroxene and basaltic melts. Chemical Geology, 117, 149–166.
Hinton, R. (1990) Ion microprobe trace-element analysis of silicates- Measurement of multi-element glasses. Chemical Geology, 83, 11–25.
Irving, A.J., and Frey, F.A. (1978) Distribution of trace-elements between garnet megacrysts and host volcanic liquids of kimberllitic to rhyolitic composition. Geochimica et Cosmochimica Acta, 42, 771–787.
Klein, M., Stosch, H., Seck, H., and Shimizu, N. (2000) Experimental Partitioning of High Field Strength and Rare Earth Elements Between Clinopyroxene and Garnet in Andesitic to Tonalitic Systems. Geochimica et Cosmochimica Acta, 64, 99–115.
Klemme, S., Blundy, J., and Wood, B. (2002) Experimental constraints on major and trace element partitioning during partial melting of eclogite. Geochimica et Cosmochimica Acta, 66, 3109–3123.
30
Klimm, K., Blundy, J.D., and Green, T.H. (2008) Trace element partitioning and accessory phase saturation during H2O-saturated melting of basalt with implications for subduction zone chemical fluxes. Journal of Petrology, 49, 523–553.
Kuzyura, A.V., Wall, F., Jeffries, T., and Litvin, Y.A. (2010) Partitioning of trace elements between garnet, clinopyroxene and diamond-forming carbonate-silicate melt at 7 GPa. Mineralogical Magazine, 74, 227–239.
Lee, C.-T.A., Harbert, A., and Leeman, W.P. (2007) Extension of lattice strain theory to mineral/mineral rare-earth element partitioning: An approach for assessing disequilibrium and developing internally consistent partition coefficients between olivine, orthopyroxene, clinopyroxene and basaltic melt. Geochimica et Cosmochimica Acta, 71, 481–496.
Li, Y., Zheng, Y., and Fu, B. (2005) Mossbauer spectroscopy of omphacite and garnet pairs from elogites: Application to geothermobarometry. American Mineralogist, 90, 90–100.
Matjuschkin, V., Brey, G.P., Hoefer, H.E., and Woodland, A.B. (2014) The influence of Fe3+ on garnet-orthopyroxene and garnet-olivine geothermometers. Contributions to Mineralogy and Petrology, 167.
McDade, P., Wood, B., and Blundy, J. (2002a) Experimental determination of near-solidus peridotite trace partition coefficients. Geochimica et Cosmochimica Acta, 66, A499.
McDade, P., Wood, B., Van Westrenen, W., Brooker, R., Gudmundsson, G., Soulard, H., Najorka, J., and Blundy, J. (2002b) Pressure corrections for a selection of piston-cylinder cell assemblies. Mineralogical Magazine, 66, 1021–1028.
Morimoto, N., Fabries, J., Ferguson, A.K., Ginzburg, I.V., Ross, M., Seifert, F.A., and Zussman, J. (1988) Nomenclature of pyroxenes. American Mineralogist, 73, 1123–1133.
Nagasawa, H. (1966) Trace Element Partition Coefficient In Ionic Crystals. Science, 152, 767–&.
Nakamura, D. (2009) A new formulation of garnet-clinopyroxene geothermometer based on accumulation and statistical analysis of a large experimental data set. Journal of Metamorphic Geology, 27, 495–508.
Pattison, D.R.M. (1994) Are Reversed Fe-Mg Exchange And Solid-Solution Experiments Really Reversed. American Mineralogist, 79, 938–950.
Powell, R. (1985) Regression diagnostics and robust regression in geothermometer geobarometer calibration - The garnet clinopyroxene geothermometer revisited. Journal of Metamorphic Geology, 3, 231–243.
31
Raheim, A., and Green, D. (1974) Experimental determination of temperature and pressure-dependence of Fe-Mg partition coefficient for coexisting garnet and clinopyroxene. Contributions to Mineralogy and Petrology, 48, 179–203.
Rubatto, D., and Hermann, J. (2007) Experimental zircon/melt and zircon/garnet trace element partitioning and implications for the geochronology of crustal rocks. Chemical Geology, 241, 38–61.
Ryerson, F.J., and Hess, P.C. (1978) Implications of liquid-liquid distribution coefficients to mineral-liquid partitioning. Experimental trace element geochemistry, 42, 921–932.
Salters, V.J.M., and Longhi, J. (1999) Trace Element Partitioning During the Initial Stages of Melting Beneath Mid-Ocean Ridges. Earth and Planetary Science Letters, 166, 15–30.
Salters, V.J.M., Longhi, J., and Bizimis, M. (2002) Near Mantle Solidus Trace Element Partitioning at Pressures up to 3.4 GPa. Geochemistry Geophysics Geosystems, 3.
Schmidt, M., Connolly, J., Gunther, D., and Bogaerts, M. (2006) Element partitioning: The role of melt structure and composition. Science, 312, 1646–1650.
Schumacher, J.C. (1991) Empirical ferric iron corrections - Necessity, assumptions and effects on selected geothermobarometers. Mineralogical Magazine, 55, 3–18.
Shannon, R. (1976) Revised Effective Ionic-Radii And Systematic Studies Of Interatomic Distances In Halides And Chalcogenides. Acta Crystallographica Section A, 32, 751–767.
Simakov, S.K. (2008) Garnet-clinopyroxene and clinopyroxene geothermobarometry of deep mantle and crust eclogites and peridotites. Lithos, 106, 125–136.
Sun, C., and Liang, Y. (2012) Distribution of REE between clinopyroxene and basaltic melt along a mantle adiabat: effects of major element composition, water, and temperature. Contributions to Mineralogy and Petrology, 163, 807–823.
——— (2013) The importance of crystal chemistry on REE partitioning between mantle minerals (garnet, clinopyroxene, orthopyroxene, and olivine) and basaltic melts. Chemical Geology, 358, 23 – 36.
——— (2015) A REE-in garnet-clinopyroxene thermobarometer for eclogites, granulites and garnet peridotites. Chemical Geology, 393-394, 79–92.
32
Tuff, J., and Gibson, S.A. (2007) Trace-element partitioning between garnet, clinopyroxene and Fe-rich picritic melts at 3 to 7 GPa. Contributions to Mineralogy and Petrology, 153, 369–387.
Van Orman, J.A., Grove, T.L., Shimizu, N., and Layne, G.D. (2002) Rare earth element diffusion in a natural pyrope single crystal at 2.8 GPa. Contributions to Mineralogy and Petrology, 142, 146.
Van Westrenen, W. (2000) Thermodynamics of garnet-melt partitioning. University of Bristol.
Van Westrenen, W., and Draper, D.S. (2007) Quantifying garnet-melt trace element partitioning using lattice-strain theory: new crystal-chemical and thermodynamic constraints. Contributions to Mineralogy and Petrology, 154, 717–730.
Van Westrenen, W., Blundy, J., and Wood, B. (1999) Crystal-chemical controls on trace element partitioning between garnet and anhydrous silicate melt. American Mineralogist, 84, 838–847.
Van Westrenen, W., Blundy, J., and Wood, B. (2000) Effect of Fe2+ on garnet-melt trace element partitioning: experiments in FCMAS and quantification of crystal-chemical controls in natural systems. Lithos, 53, 189–201.
Watson, E.B. (1976) Two-Liquid Partition Coefficients: Experimental Data and Geochemical Implications. Contributions to Mineralogy and Petrology, 56, 119–134.
Withers, A.. (1997) Water in the Mantle. University of Bristol.
Witt-Eickschen, G., and O’Neill, H. (2005) The effect of temperature on the equilibrium distribution of trace elements between clinopyroxene, orthopyroxene, olivine and spinel in upper mantle peridotite. Chemical Geology, 221, 65–101.
Wood, B.J., and Blundy, J.D. (1997) A predictive model for rare earth element partitioning between clinopyroxene and anhydrous silicate melt. Contributions to Mineralogy and Petrology, 129, 166–181.
——— (2001) The effect of cation charge on crystal-melt paritioning of trace elements. Earth and Planetary Science Letters, 188.
Yao, L., and Liang, Y. (2015) Closure temperature in cooling bi-mineralic systems: I. Definition and with application to REE-in-two-pyroxene thermometer. Geochimica et Cosmochimica Acta, 162, 137–150.
Figures
33
Figure 1. SEM images of typical experimental run products demonstrating homogenous grains, indicative of equilibrium. a piston cylinder experiment, RD25, at 1200 oC and 3.4 GPa. b multi-anvil experiment, V545, at 1400 oC and 10 GPa. The scale bar is 100 μm in both cases. Figure 2. Spider diagram of partition coefficients between garnet and cpx for trace element data presented in this paper. a experiments using JP1 starting composition, b BAS starting composition and c is the AOB, ZrTi and NSR-16 starting compositions.
Figure 3. Experimental REE partitioning between garnet and cpx as a function of ionic radius of the element. The red line shows the weighted fit calculated using Equation 2 with values of E and ro for cpx and garnet calculated by the method of Wood and Blundy (1997) and van Westrenen and Draper (2007) respectively. Error bars show 1 s.d. of the mean.
Figure 4. Comparison of values of Egrt calculated through the model of Sun and Liang (2013) (E(S&L)) with those found with the model van Westrenen and Draper (2007) (E(vW&D)) using the experimental the garnet-cpx data set.
Figure 5. The effect of change in T on the partitioning of REE. The black lines use the same experimental data values for E and r and change only T from 800 to 1400 oC in 200 oC intervals.
Figure 6. a. Comparison of experimental temperature with T found through a weighted mean of REE pairs, from Nd to Lu, and the lattice strain model, Equation
3. Error bars are shown where larger than symbol. The red circles are experiments from this study and the black diamonds are those from the literature, see Table 5. The mean absolute deviation is only 75 oC for all the data. b. Comparison of calculated T using the weighted mean temperature using all REE pairs lattice strain model (T(JP)) with the T found using Ellis and Green (1979) (T(EG)) and Sun and Liang (2015) (T(SL)), which have a mean absolute deviation of 240 and 278 oC respectively. In both figures the black line shows the 1:1 relationship.
Figure 7: Comparison of isothermal, isochemical experiments to show the effect of pressure. The temperature is the experimental T.
Figure S1: Graphs showing published data with red fit line calculated using the methods of Wood and Blundy (1997) and van Westrenen and Draper (2007). The superscript 1 denotes data are normalized to Yb, superscript 2 are normalized to Eu and superscript 3 denotes Er, as opposed to Y, as no Y partitioning data are available.

34
Figure S2: See Figure S1 for explanation.
Figure S3: See Figure S1 for explanation.
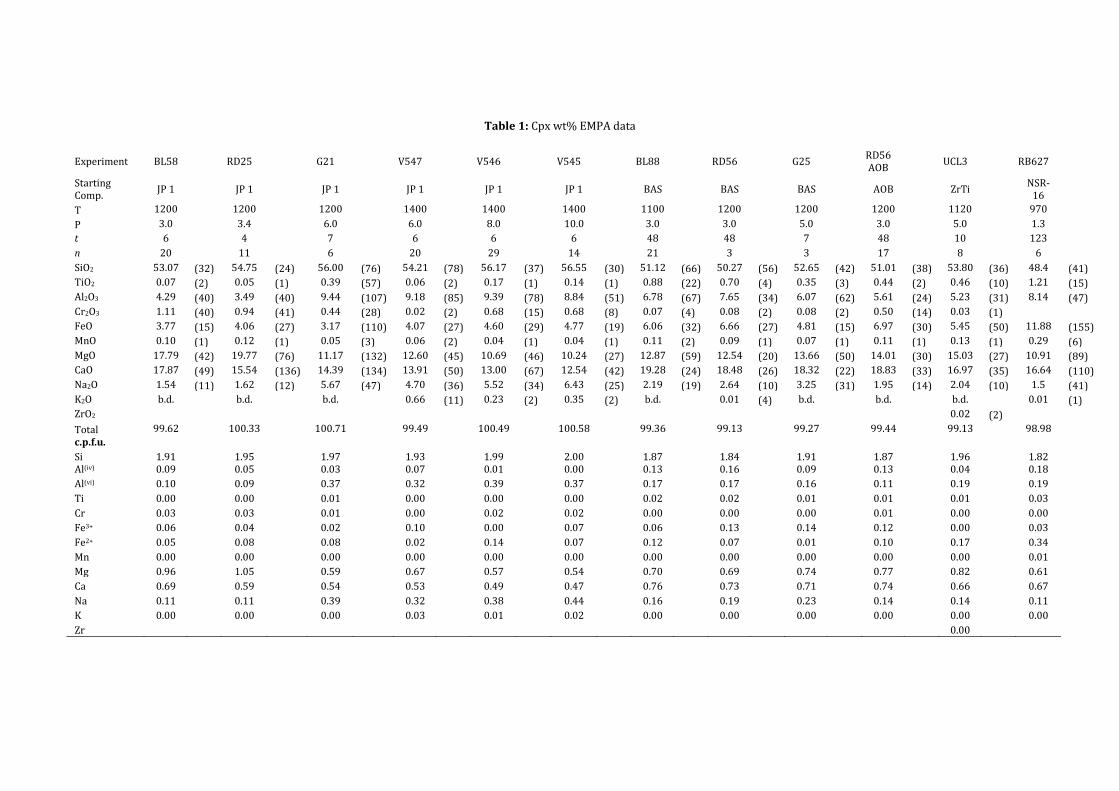
Table 1: Cpx wt% EMPA data
Experiment BL58
RD25
G21
V547
V546
V545
BL88
RD56
G25
RD56 AOB
UCL3
RB627
Starting Comp.
JP 1
JP 1
JP 1
JP 1
JP 1
JP 1
BAS
BAS
BAS
AOB
ZrTi
NSR-16
T 1200
1200
1200
1400
1400
1400
1100
1200
1200
1200
1120
970
P 3.0
3.4
6.0
6.0
8.0
10.0
3.0
3.0
5.0
3.0
5.0
1.3
t 6 4 7 6 6 6 48 48 7 48 10 123
n 20
11
6
20
29
14
21
3
3
17
8
6
SiO2 53.07 (32) 54.75 (24) 56.00 (76) 54.21 (78) 56.17 (37) 56.55 (30) 51.12 (66) 50.27 (56) 52.65 (42) 51.01 (38) 53.80 (36) 48.4 (41)
TiO2 0.07 (2) 0.05 (1) 0.39 (57) 0.06 (2) 0.17 (1) 0.14 (1) 0.88 (22) 0.70 (4) 0.35 (3) 0.44 (2) 0.46 (10) 1.21 (15)
Al2O3 4.29 (40) 3.49 (40) 9.44 (107) 9.18 (85) 9.39 (78) 8.84 (51) 6.78 (67) 7.65 (34) 6.07 (62) 5.61 (24) 5.23 (31) 8.14 (47)
Cr2O3 1.11 (40) 0.94 (41) 0.44 (28) 0.02 (2) 0.68 (15) 0.68 (8) 0.07 (4) 0.08 (2) 0.08 (2) 0.50 (14) 0.03 (1) FeO 3.77 (15) 4.06 (27) 3.17 (110) 4.07 (27) 4.60 (29) 4.77 (19) 6.06 (32) 6.66 (27) 4.81 (15) 6.97 (30) 5.45 (50) 11.88 (155)
MnO 0.10 (1) 0.12 (1) 0.05 (3) 0.06 (2) 0.04 (1) 0.04 (1) 0.11 (2) 0.09 (1) 0.07 (1) 0.11 (1) 0.13 (1) 0.29 (6)
MgO 17.79 (42) 19.77 (76) 11.17 (132) 12.60 (45) 10.69 (46) 10.24 (27) 12.87 (59) 12.54 (20) 13.66 (50) 14.01 (30) 15.03 (27) 10.91 (89)
CaO 17.87 (49) 15.54 (136) 14.39 (134) 13.91 (50) 13.00 (67) 12.54 (42) 19.28 (24) 18.48 (26) 18.32 (22) 18.83 (33) 16.97 (35) 16.64 (110)
Na2O 1.54 (11) 1.62 (12) 5.67 (47) 4.70 (36) 5.52 (34) 6.43 (25) 2.19 (19) 2.64 (10) 3.25 (31) 1.95 (14) 2.04 (10) 1.5 (41)
K2O b.d. b.d. b.d. 0.66 (11) 0.23 (2) 0.35 (2) b.d.
0.01 (4) b.d.
b.d.
b.d.
0.01 (1)
ZrO2 0.02 (2)
Total 99.62
100.33
100.71
99.49
100.49
100.58
99.36
99.13
99.27
99.44
99.13
98.98
c.p.f.u.
Si 1.91
1.95
1.97
1.93
1.99
2.00
1.87
1.84
1.91
1.87
1.96
1.82 Al(iv) 0.09
0.05
0.03
0.07
0.01
0.00
0.13
0.16
0.09
0.13
0.04
0.18
Al(vi) 0.10
0.09
0.37
0.32
0.39
0.37
0.17
0.17
0.16
0.11
0.19
0.19 Ti 0.00
0.00
0.01
0.00
0.00
0.00
0.02
0.02
0.01
0.01
0.01
0.03
Cr 0.03
0.03
0.01
0.00
0.02
0.02
0.00
0.00
0.00
0.01
0.00
0.00 Fe3+ 0.06
0.04
0.02
0.10
0.00
0.07
0.06
0.13
0.14
0.12
0.00
0.03
Fe2+ 0.05
0.08
0.08
0.02
0.14
0.07
0.12
0.07
0.01
0.10
0.17
0.34 Mn 0.00
0.00
0.00
0.00
0.00
0.00
0.00
0.00
0.00
0.00
0.00
0.01
Mg 0.96
1.05
0.59
0.67
0.57
0.54
0.70
0.69
0.74
0.77
0.82
0.61 Ca 0.69
0.59
0.54
0.53
0.49
0.47
0.76
0.73
0.71
0.74
0.66
0.67
Na 0.11
0.11
0.39
0.32
0.38
0.44
0.16
0.19
0.23
0.14
0.14
0.11 K 0.00
0.00
0.00
0.03
0.01
0.02
0.00
0.00
0.00
0.00
0.00
0.00
Zr
0.00
Starting comp. refers to table S1, T is in oC, P is in GPa, t is in hours, n is the number of analyses, b.d. is below detection and the parentheses show one standard deviation, e.g. 53.07 (11) should read
53.07 ±0.11, c.p.f.u. stands for cations per formula unit and are calculated based on 4 cations. The Fe3+ is calculated using the method of Schumacher (1991).
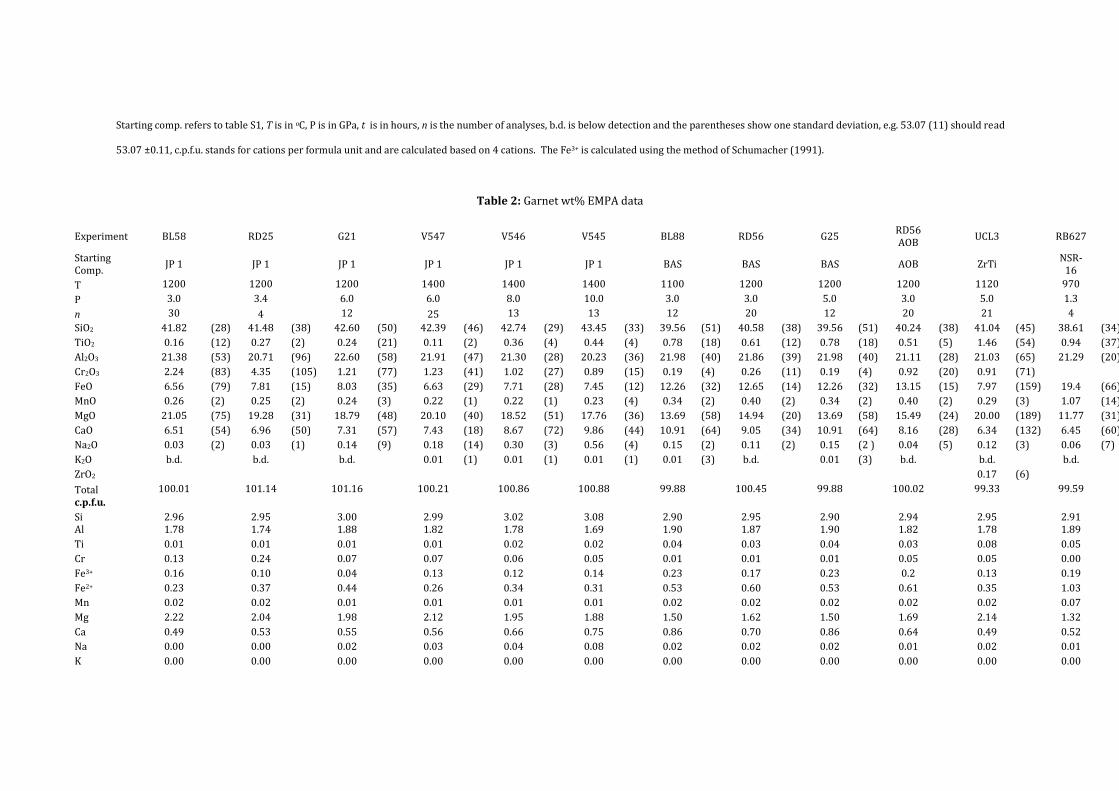
Table 2: Garnet wt% EMPA data
Experiment BL58 RD25
G21
V547
V546
V545
BL88
RD56
G25
RD56 AOB
UCL3
RB627
Starting Comp.
JP 1
JP 1
JP 1
JP 1
JP 1
JP 1
BAS
BAS
BAS
AOB
ZrTi
NSR-16
T 1200 1200
1200
1400
1400
1400
1100
1200
1200
1200
1120
970
P 3.0 3.4
6.0
6.0
8.0
10.0
3.0
3.0
5.0
3.0
5.0
1.3
n 30 4
12
25
13
13
12
20
12
20
21
4
SiO2 41.82 (28) 41.48 (38) 42.60 (50) 42.39 (46) 42.74 (29) 43.45 (33) 39.56 (51) 40.58 (38) 39.56 (51) 40.24 (38) 41.04 (45) 38.61 (34)
TiO2 0.16 (12) 0.27 (2) 0.24 (21) 0.11 (2) 0.36 (4) 0.44 (4) 0.78 (18) 0.61 (12) 0.78 (18) 0.51 (5) 1.46 (54) 0.94 (37)
Al2O3 21.38 (53) 20.71 (96) 22.60 (58) 21.91 (47) 21.30 (28) 20.23 (36) 21.98 (40) 21.86 (39) 21.98 (40) 21.11 (28) 21.03 (65) 21.29 (20)
Cr2O3 2.24 (83) 4.35 (105) 1.21 (77) 1.23 (41) 1.02 (27) 0.89 (15) 0.19 (4) 0.26 (11) 0.19 (4) 0.92 (20) 0.91 (71)
FeO 6.56 (79) 7.81 (15) 8.03 (35) 6.63 (29) 7.71 (28) 7.45 (12) 12.26 (32) 12.65 (14) 12.26 (32) 13.15 (15) 7.97 (159) 19.4 (66)
MnO 0.26 (2) 0.25 (2) 0.24 (3) 0.22 (1) 0.22 (1) 0.23 (4) 0.34 (2) 0.40 (2) 0.34 (2) 0.40 (2) 0.29 (3) 1.07 (14)
MgO 21.05 (75) 19.28 (31) 18.79 (48) 20.10 (40) 18.52 (51) 17.76 (36) 13.69 (58) 14.94 (20) 13.69 (58) 15.49 (24) 20.00 (189) 11.77 (31)
CaO 6.51 (54) 6.96 (50) 7.31 (57) 7.43 (18) 8.67 (72) 9.86 (44) 10.91 (64) 9.05 (34) 10.91 (64) 8.16 (28) 6.34 (132) 6.45 (60)
Na2O 0.03 (2) 0.03 (1) 0.14 (9) 0.18 (14) 0.30 (3) 0.56 (4) 0.15 (2) 0.11 (2) 0.15 (2 ) 0.04 (5) 0.12 (3) 0.06 (7)
K2O b.d. b.d. b.d. 0.01 (1) 0.01 (1) 0.01 (1) 0.01 (3) b.d.
0.01 (3) b.d.
b.d.
b.d.
ZrO2 0.17 (6)
Total 100.01 101.14
101.16
100.21
100.86
100.88
99.88
100.45
99.88
100.02
99.33
99.59
c.p.f.u.
Si 2.96 2.95
3.00
2.99
3.02
3.08
2.90
2.95
2.90
2.94
2.95
2.91 Al 1.78 1.74
1.88
1.82
1.78
1.69
1.90
1.87
1.90
1.82
1.78
1.89
Ti 0.01 0.01
0.01
0.01
0.02
0.02
0.04
0.03
0.04
0.03
0.08
0.05 Cr 0.13 0.24
0.07
0.07
0.06
0.05
0.01
0.01
0.01
0.05
0.05
0.00
Fe3+ 0.16 0.10
0.04
0.13
0.12
0.14
0.23
0.17
0.23
0.2
0.13
0.19 Fe2+ 0.23 0.37
0.44
0.26
0.34
0.31
0.53
0.60
0.53
0.61
0.35
1.03
Mn 0.02 0.02
0.01
0.01
0.01
0.01
0.02
0.02
0.02
0.02
0.02
0.07 Mg 2.22 2.04
1.98
2.12
1.95
1.88
1.50
1.62
1.50
1.69
2.14
1.32
Ca 0.49 0.53
0.55
0.56
0.66
0.75
0.86
0.70
0.86
0.64
0.49
0.52 Na 0.00 0.00
0.02
0.03
0.04
0.08
0.02
0.02
0.02
0.01
0.02
0.01
K 0.00 0.00
0.00
0.00
0.00
0.00
0.00
0.00
0.00
0.00
0.00
0.00

Zr
0.01 Abbreviations are the same as table 1 and calculations are based on 8 cations.
Table 3: Cpx trace element data measured by SIMS
Sample BL58
RD25
G21
V547
V546
V545
BL88
RD56
G25
RD56AOB
UCL3
RB627
n 4
4
2
4
4
2
4
3
1
3
5
1 Li 10.8 (6) 24 (4) 30.2 (1) 17.8 (4) 33 (2) 35 (3) 28 (2) 25 (1) 15 (3) 44 (1) 417 (20) 24 (5)
B 0.99 (7) 1.3 (2) 3.2 (6) 1.1 (2) 9 (1) 15.6 (6) 1.8 (4) 0.1 (1) 1.8 (4) 1.7 (5) 28 (3) 5.4 (11)
Sc 14.2 (7) 16 (1) 6.7 (7) 6.8 (9) 6.3 (2) 5.0 (5) 21 (2) 21.54 (8) 12 (4) 74 (7) 131 (6) 232 (46)
Ti 336 (10) 380 (173) 382 (33) 267 (13) 835 (19) 790 (98) 5667 (801) 3582 (125) 1832 (366) 2881 (773) 2053 (291) 5422 (1084)
V 20.4 (5) 64 (14) 40.1 (5) 23 (1) 33 (2) 34.9 (1) 309 (17) 135 (10) 243 (49) 67 (4) 72 (7) 534 (107)
Co 54 (2) 54 (6) 27.6 (1) 39 (1) 37 (2) 33 (2) 49 (3) 49 (3) 31 (6) 231 (7) 5.1 (6) na Ga 50 (9) na
na
68 (2) 77 (12) 93 (12) na
na
na
na
na
na
Sr 9 (1) 7 (1) 19.0 (5) 15.7 (8) 77 (1) 96 (22) 169 (7) 163 (2) 142 (28) 70 (6) 76 (8) 14.3 (29)
Y 2.2 (9) 1.5 (2) 0.8 (1) 1.03 (7) 1.11 (8) 0.9 (2) 4.8 (9) 4.41 (1) 2.3 (5) 9 (3) 10 (3) 111 (22)
Zr 0.7 (1) 1.0 (5) 17 (22) 0.5 (1) 1.5 (2) 4.6 (17) 48 (7) 27 (1) 22 (4) 5 (2) 134 (30) 91 (18)
Nb 0.16 (6) 0.4 (2) 0.7 (5) 0.18 (6) 1.2 (5) 4 (5) 0.5 (2) 0.26 (4) 0.25 (5) 14 (15) 0.11 (3) 5.2 (10)
Ba 0.14 (7) 0.06 (6) 3.4 (1) 0.5 (4) 2.1 (14) 0.44 (6) 0.7 (3) 0.4 (3) 2 (4) 2 (1) 0.04 (4) 12.4 (25)
La 2.1 (4) 1.0 (3) 1.0 (3) 0.15 (5) 0.4 (2) 0.8 (8) 4.2 (5) 3.4 (1) 1.8 (4) 11 (3) 5 (1) 47.1 (94)
Ce 1.4 (1) 0.8 (2) 2.7 (9) 0.9 (2) 2.7 (2) 3.4 (8) 14 (1) 10.1 (4) 6 (1) 30 (6) 17 (6) 22.9 (46)
Pr na
na
na
na
na
na
2.5 (3) 1.79 (8) 1.1 (2) 0.04 (4) na
na Nd 1.9 (3) 1.1 (3) 3.15 (2) 1.0 (3) 2.6 (4) 3 (1) 15 (2) 10.6 (6) 6 (1) 39 (3) 27 (9) 53 (11)
Sm 2.2 (9) 0.03 (2) 1.2 (5) 1.1 (3) 3.1 (5) 2.1 (4) 4.0 (5) 2.8 (4) 1.5 (3) 12.7 (8) 11 (3) 79 (16)
Eu 6.7 (6) 3.7 (6) 2.9 (1) 2.7 (4) 5.9 (4) 4.2 (6) 1.3 (1) 0.78 (2) 0.7 (1) 27 (2) 26 (8) 90 (18)
Gd 7.7 (10) 3.6 (9) 2.4 (4) 3.1 (4) 3.9 (3) 4 (1) 3.9 (6) 1.9 (6) 2.0 (4) 29 (3) 27 (8) 115 (23)
Tb b.d.
b.d.
b.d.
b.d.
b.d.
b.d.
0.48 (8) 0.33 (3) 0.23 (5) b.d.
b.d.
na Dy na
na
na
na
na
na
2.8 (3) 1.7 (3) 1.3 (3) 2.6 (4) na
na
Ho na
na
na
na
na
na
0.28 (3) 0.21 (1) 0.17 (3) 0.08 (5) na
na Er 4.2 (5) 2.9 (6) 2.3 (5) 2.1 (6) 1.8 (3) 0.77 (3) b.d.
0.5 (2) 0.36 (7) 22 (7) 20 (5) 74 (15)
Yb 4.6 (4) 3.3 (8) 1.3 (1) 2.1 (6) 1.9 (6) 1.6 (3) 0.4 (2) 0.4 (2) 0.5 (1) 28 (15) 19 (4) na Lu 67 (7) 5.6 (3) 1.8 (3) 3.3 (6) 3.1 (6) 3.1 (4) 0.12 (3) 0.03 (2) 0.02 (3) 43 (16) 24 (5) 23.4 (47)
Hf 0.9 (4) 1.0 (5) 1.5 (3) 0.6 (2) 1.7 (2) 1.6 (6) 2.1 (3) 0.8 (4) 0.9 (2) 6 (1) 0.5 (2) 45 (9)
Ta 0.14 (7) 0.7 (3) 1.0 (9) 0.2 (7) 0.7 (7) 2 (3) 0.35 (4) b.d.
0.21 (4) 7.3 (7) 0.12 (4) 1.8 (4)
Pb 5 (1) na
na
0.07 (4) 42 (16) 29.1 (6) na
na
na
na
na
na
Th 0.13 (3) 0.1 (1) 1 (1) 0.09 (4) 2.2 (16) 11 (1) 0.23 (3) 0.3 (3) 0.17 (3) 8 (5) 0.4 (2) na U 0.09 (5) 0.1 (1) 0.2 (3) 0.07 (4) 0.4 (3) 0.4 (3) 0.21 (5) b.d.
0.15 (3) 5 (4) 0.15 (7) na
All values are the mean of n in ppm, n is the number of analyses. Where the number of grains analyzed is one then the S.D. is 20% of the measured value.
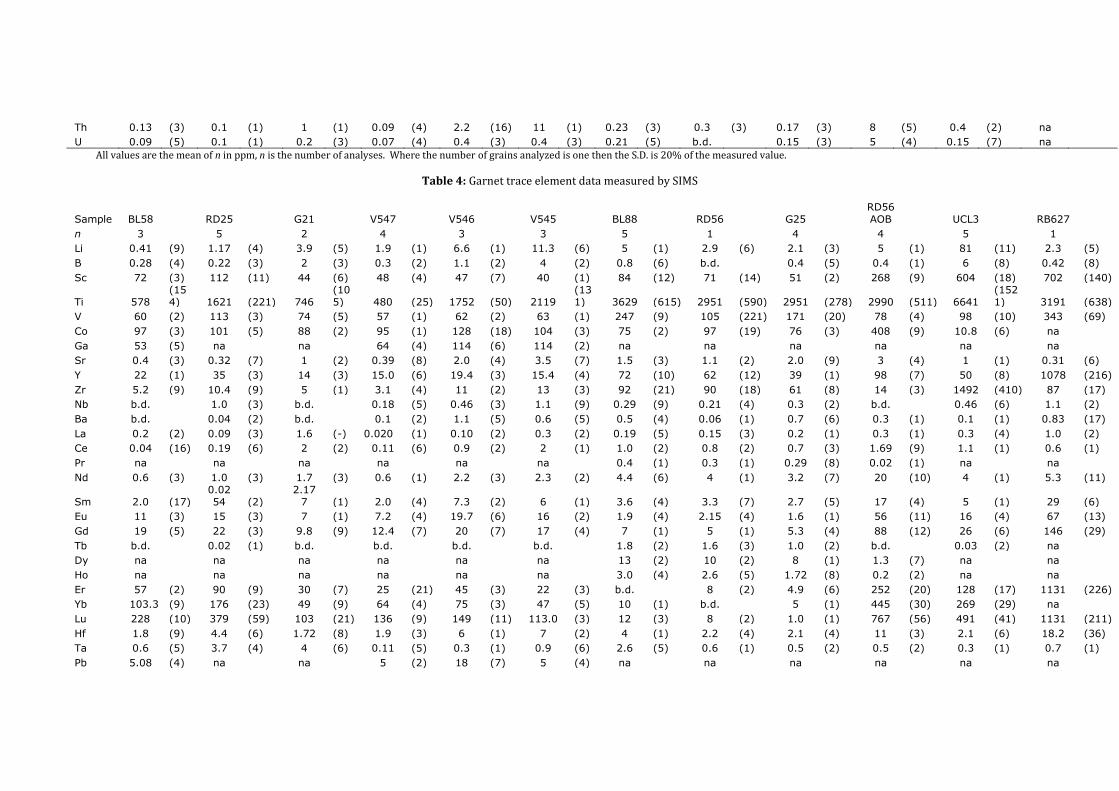
Table 4: Garnet trace element data measured by SIMS
Sample BL58 RD25 G21 V547 V546 V545 BL88 RD56 G25 RD56AOB UCL3 RB627
n 3 5 2 4 3 3 5 1 4 4 5 1
Li 0.41 (9) 1.17 (4) 3.9 (5) 1.9 (1) 6.6 (1) 11.3 (6) 5 (1) 2.9 (6) 2.1 (3) 5 (1) 81 (11) 2.3 (5)
B 0.28 (4) 0.22 (3) 2 (3) 0.3 (2) 1.1 (2) 4 (2) 0.8 (6) b.d. 0.4 (5) 0.4 (1) 6 (8) 0.42 (8)
Sc 72 (3) 112 (11) 44 (6) 48 (4) 47 (7) 40 (1) 84 (12) 71 (14) 51 (2) 268 (9) 604 (18) 702 (140)
Ti 578 (154) 1621 (221) 746
(105) 480 (25) 1752 (50) 2119
(131) 3629 (615) 2951 (590) 2951 (278) 2990 (511) 6641
(1521) 3191 (638)
V 60 (2) 113 (3) 74 (5) 57 (1) 62 (2) 63 (1) 247 (9) 105 (221) 171 (20) 78 (4) 98 (10) 343 (69)
Co 97 (3) 101 (5) 88 (2) 95 (1) 128 (18) 104 (3) 75 (2) 97 (19) 76 (3) 408 (9) 10.8 (6) na
Ga 53 (5) na na 64 (4) 114 (6) 114 (2) na na na na na na
Sr 0.4 (3) 0.32 (7) 1 (2) 0.39 (8) 2.0 (4) 3.5 (7) 1.5 (3) 1.1 (2) 2.0 (9) 3 (4) 1 (1) 0.31 (6)
Y 22 (1) 35 (3) 14 (3) 15.0 (6) 19.4 (3) 15.4 (4) 72 (10) 62 (12) 39 (1) 98 (7) 50 (8) 1078 (216)
Zr 5.2 (9) 10.4 (9) 5 (1) 3.1 (4) 11 (2) 13 (3) 92 (21) 90 (18) 61 (8) 14 (3) 1492 (410) 87 (17)
Nb b.d. 1.0 (3) b.d. 0.18 (5) 0.46 (3) 1.1 (9) 0.29 (9) 0.21 (4) 0.3 (2) b.d. 0.46 (6) 1.1 (2)
Ba b.d. 0.04 (2) b.d. 0.1 (2) 1.1 (5) 0.6 (5) 0.5 (4) 0.06 (1) 0.7 (6) 0.3 (1) 0.1 (1) 0.83 (17)
La 0.2 (2) 0.09 (3) 1.6 (-) 0.020 (1) 0.10 (2) 0.3 (2) 0.19 (5) 0.15 (3) 0.2 (1) 0.3 (1) 0.3 (4) 1.0 (2)
Ce 0.04 (16) 0.19 (6) 2 (2) 0.11 (6) 0.9 (2) 2 (1) 1.0 (2) 0.8 (2) 0.7 (3) 1.69 (9) 1.1 (1) 0.6 (1)
Pr na na na na na na 0.4 (1) 0.3 (1) 0.29 (8) 0.02 (1) na na
Nd 0.6 (3) 1.0 (3) 1.7 (3) 0.6 (1) 2.2 (3) 2.3 (2) 4.4 (6) 4 (1) 3.2 (7) 20 (10) 4 (1) 5.3 (11)
Sm 2.0 (17) 0.0254 (2)
2.177 (1) 2.0 (4) 7.3 (2) 6 (1) 3.6 (4) 3.3 (7) 2.7 (5) 17 (4) 5 (1) 29 (6)
Eu 11 (3) 15 (3) 7 (1) 7.2 (4) 19.7 (6) 16 (2) 1.9 (4) 2.15 (4) 1.6 (1) 56 (11) 16 (4) 67 (13)
Gd 19 (5) 22 (3) 9.8 (9) 12.4 (7) 20 (7) 17 (4) 7 (1) 5 (1) 5.3 (4) 88 (12) 26 (6) 146 (29)
Tb b.d. 0.02 (1) b.d. b.d. b.d. b.d. 1.8 (2) 1.6 (3) 1.0 (2) b.d. 0.03 (2) na
Dy na na na na na na 13 (2) 10 (2) 8 (1) 1.3 (7) na na
Ho na na na na na na 3.0 (4) 2.6 (5) 1.72 (8) 0.2 (2) na na
Er 57 (2) 90 (9) 30 (7) 25 (21) 45 (3) 22 (3) b.d. 8 (2) 4.9 (6) 252 (20) 128 (17) 1131 (226)
Yb 103.3 (9) 176 (23) 49 (9) 64 (4) 75 (3) 47 (5) 10 (1) b.d. 5 (1) 445 (30) 269 (29) na
Lu 228 (10) 379 (59) 103 (21) 136 (9) 149 (11) 113.0 (3) 12 (3) 8 (2) 1.0 (1) 767 (56) 491 (41) 1131 (211)
Hf 1.8 (9) 4.4 (6) 1.72 (8) 1.9 (3) 6 (1) 7 (2) 4 (1) 2.2 (4) 2.1 (4) 11 (3) 2.1 (6) 18.2 (36)
Ta 0.6 (5) 3.7 (4) 4 (6) 0.11 (5) 0.3 (1) 0.9 (6) 2.6 (5) 0.6 (1) 0.5 (2) 0.5 (2) 0.3 (1) 0.7 (1)
Pb 5.08 (4) na na 5 (2) 18 (7) 5 (4) na na na na na na
Th 0.2 (3) 0.07 (3) 4.16 (-) 0.05 (2) 1 (1) 6 (8) 0.9 (2) b.d. 0.16 (7) 0.4 (1) 0.5 (8) na
U 0.2 (2) 0.7 (3) 0.9 (10) 0.12 (7) 0.2 (1) 0.7 (3) 0.23 (5) 0.06 (1) 0.2 (1) 0.5 (2) 0.4 (4) na
All values are the mean of n in ppm, n is the number of analyses. Where the number of grains analyzed is one then the S.D. is 20% of the measured value.
Table 5: Temperature calculations
Sample P(exp) T(exp) T(JP) σ T(JP) ΔT(JP) T(EG) ΔT(EG) T(EG*) ΔT(EG*) T(SL) ΔT(SL) BL58 3 1200 1188 31 12 1220 20 966 234 813 387
RD25 3.4 1200 1141 30 59 1166 34 1051 149 1202 2
G21 6 1200 1377 29 177 1487 287 1427 227 1502 302
V547 6 1400 1362 38 38 1037 363 886 514 1381 19
V546 8 1400 1456 28 56 2646 1246 2165 765 1505 105
V545 10 1400 1538 47 138 2066 666 1716 316 1737 337
BL88 3 1100 1038 23 62 1345 245 1149 49 1297 197
RD56 3 1200 960 16 240 1005 195 914 286 1300 100
G25 5 1200 1231 31 31 RD56 AOB 3 1200 1382 64 182 1076 124 958 242 1370 170
UCL3 5 1120 1237 34 117 2144 1024 1758 638 1194 74
RB627 1.3 970 971 16 1 1392 442 1275 325 946 24
Adam and Green (2006) 3.5 1180 1253 39 73 1166 14 1112 68 1129 51
Bennett et al. (2004) 3 1330 1413 73 83 Green et al. (2000) 4 1100 1178 20 78 1081 19 929 171 1276 176
Green et al. (2000) 3 1160 1077 17 83 1047 113 905 255 1125 35
Green et al. (2000) 4 1200 1121 9 79 1246 46 1160 40 1109 91
Klemme et al. (2002) 3 1400 1334 49 66 Kuzyura et al. (2010) 7 1265 1579 52 314 1461 196 1470 205 -162 1427
Kuzyura et al. (2010) 7 1265 1474 39 209 1633 368 1618 353 -255 1520
McDade (unpublished) 3 1495 1537 29 42 1583 88 1395 100 1908 413
Salters and Longhi (1999) 2.8 1537 1591 64 54 1563 1 1425 137 1927 390
Salters and Longhi (1999) 2.8 1530 1493 49 37 1486 44 1367 163 1668 138
Salters and Longhi (1999) 2.8 1525 1502 53 23 1613 63 1389 161 1713 188
Salters et al. (2002) 2.8 1650 1581 125 69 1444 206 1015 635 1804 154
Tuff and Gibson (2007) 3 1475 1405 24 70 1385 90 1414 61 1779 304
Tuff and Gibson (2007) 3 1425 1487 27 62 1458 33 1373 52 1643 218
Tuff and Gibson (2007) 7 1750 1780 34 30 1489 261 1611 139
Withers (1997) 3 1470 1410 16 60 1416 54 1375 95 1607 137
mean
88
240
245
278
T(exp) is the experimental temperature, T(JP) is the weighted mean temperature found iteratively using Equation 3 with multiple REE pairs. The error, σT, is propagated from the standard deviation of the ion probe data. In each case ΔT is the mean absolute difference between the experimental T and the calculated T. T(EG) is the temperature calculated with the method of Ellis and Green (1979), T(EG*) is the method of Ellis and Green (1979) where Fe valence is not considered and T(SL) is the temperature calculated with the method of Sun and Liang (2015). Gaps in the table are a result of the models being unable to calculate a temperature or the necessary data not being available. The mean value shows the mean temperature deviation of all the experiments, including Kuzyura et al. (2010).
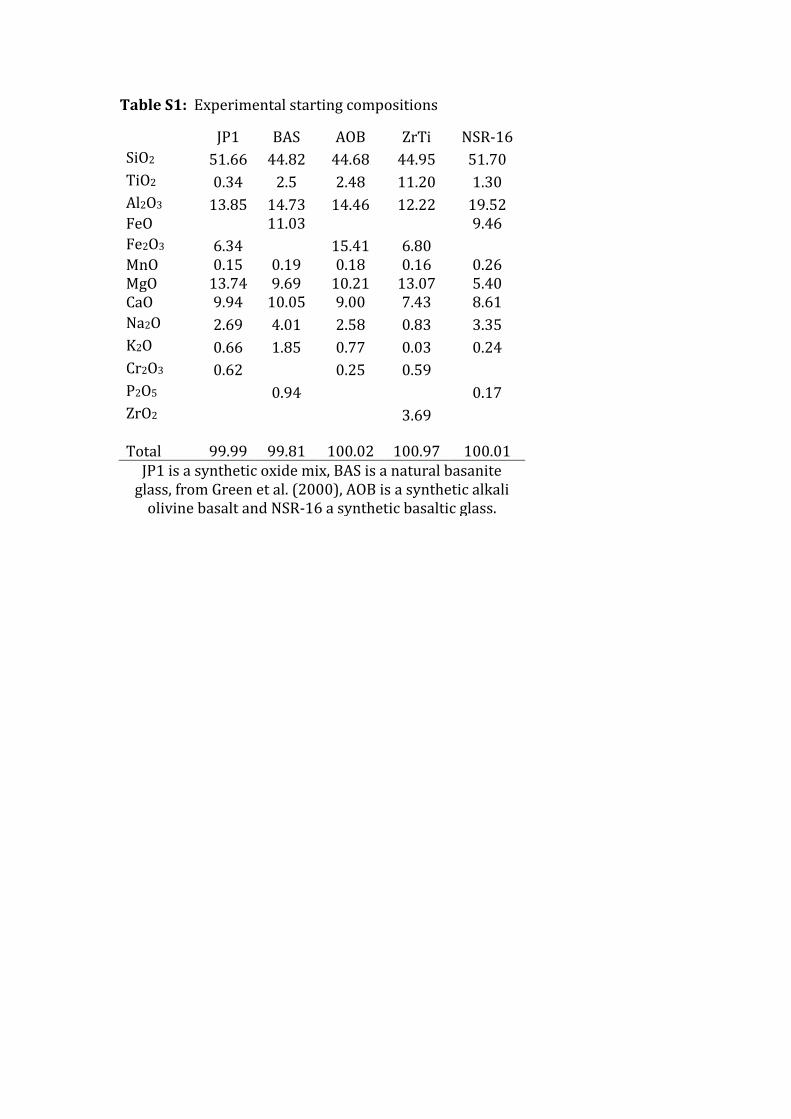
41
Table S1: Experimental starting compositions
JP1 BAS AOB ZrTi NSR-16
SiO2 51.66 44.82 44.68 44.95 51.70
TiO2 0.34 2.5 2.48 11.20 1.30
Al2O3 13.85 14.73 14.46 12.22 19.52 FeO
11.03
9.46
Fe2O3 6.34
15.41 6.80 MnO 0.15 0.19 0.18 0.16 0.26
MgO 13.74 9.69 10.21 13.07 5.40 CaO 9.94 10.05 9.00 7.43 8.61
Na2O 2.69 4.01 2.58 0.83 3.35
K2O 0.66 1.85 0.77 0.03 0.24
Cr2O3 0.62
0.25 0.59 P2O5
0.94
0.17
ZrO2
3.69
Total 99.99 99.81 100.02 100.97 100.01
JP1 is a synthetic oxide mix, BAS is a natural basanite glass, from Green et al. (2000), AOB is a synthetic alkali
olivine basalt and NSR-16 a synthetic basaltic glass.
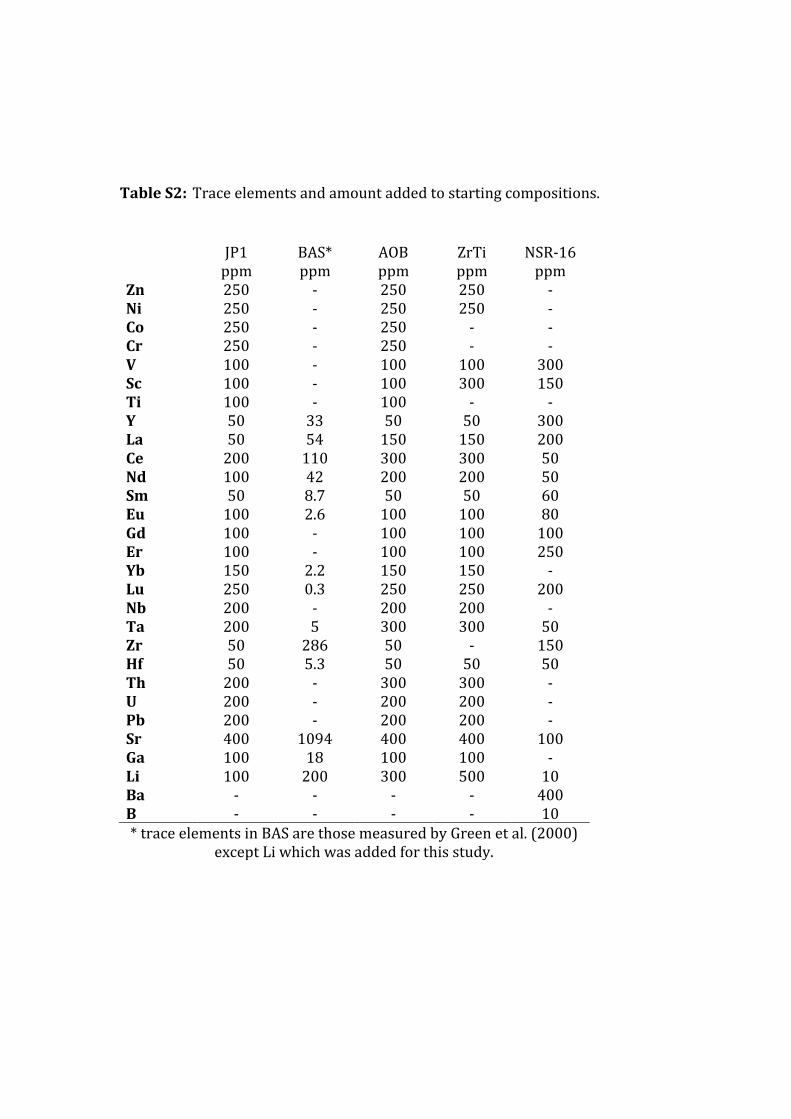
42
Table S2: Trace elements and amount added to starting compositions.
JP1 BAS* AOB ZrTi NSR-16
ppm ppm ppm ppm ppm
Zn 250 - 250 250 - Ni 250 - 250 250 - Co 250 - 250 - - Cr 250 - 250 - - V 100 - 100 100 300 Sc 100 - 100 300 150 Ti 100 - 100 - - Y 50 33 50 50 300 La 50 54 150 150 200 Ce 200 110 300 300 50 Nd 100 42 200 200 50 Sm 50 8.7 50 50 60 Eu 100 2.6 100 100 80 Gd 100 - 100 100 100 Er 100 - 100 100 250 Yb 150 2.2 150 150 - Lu 250 0.3 250 250 200 Nb 200 - 200 200 - Ta 200 5 300 300 50 Zr 50 286 50 - 150 Hf 50 5.3 50 50 50 Th 200 - 300 300 - U 200 - 200 200 - Pb 200 - 200 200 - Sr 400 1094 400 400 100 Ga 100 18 100 100 - Li 100 200 300 500 10 Ba - - - - 400 B - - - - 10 * trace elements in BAS are those measured by Green et al. (2000)
except Li which was added for this study.
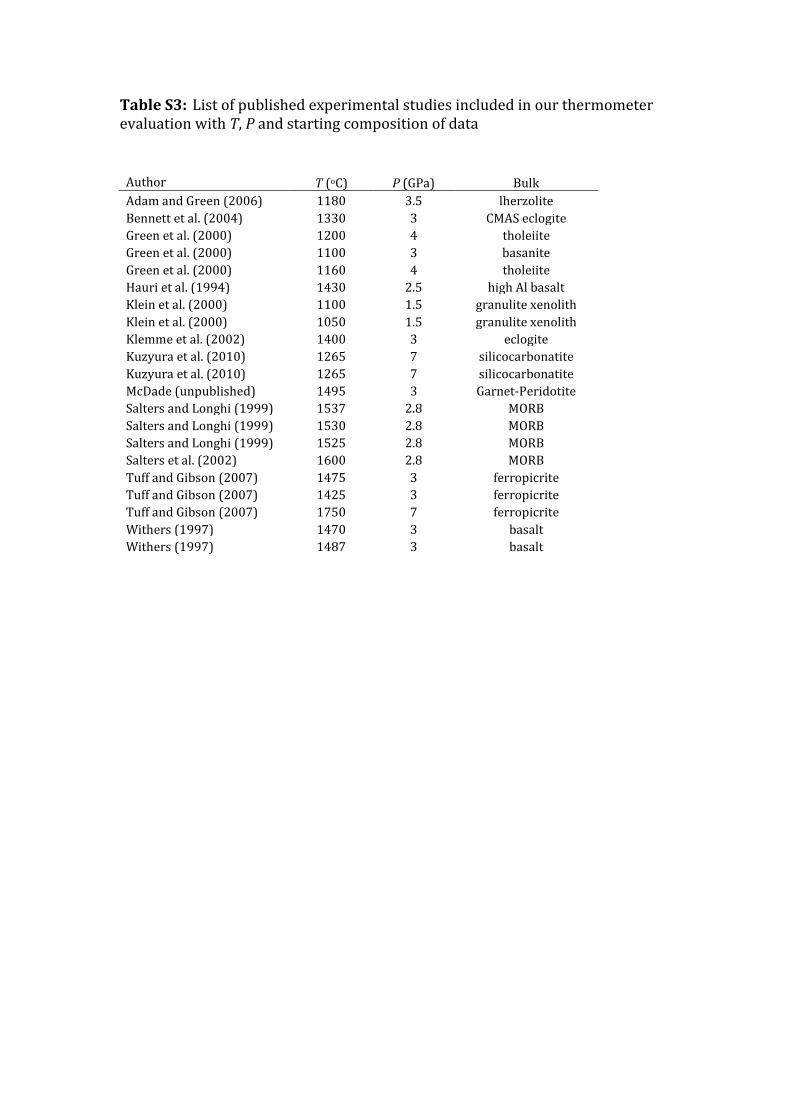
43
Table S3: List of published experimental studies included in our thermometer evaluation with T, P and starting composition of data
Author T (oC) P (GPa) Bulk
Adam and Green (2006) 1180 3.5 lherzolite
Bennett et al. (2004) 1330 3 CMAS eclogite
Green et al. (2000) 1200 4 tholeiite
Green et al. (2000) 1100 3 basanite
Green et al. (2000) 1160 4 tholeiite
Hauri et al. (1994) 1430 2.5 high Al basalt
Klein et al. (2000) 1100 1.5 granulite xenolith
Klein et al. (2000) 1050 1.5 granulite xenolith
Klemme et al. (2002) 1400 3 eclogite
Kuzyura et al. (2010) 1265 7 silicocarbonatite
Kuzyura et al. (2010) 1265 7 silicocarbonatite
McDade (unpublished) 1495 3 Garnet-Peridotite
Salters and Longhi (1999) 1537 2.8 MORB
Salters and Longhi (1999) 1530 2.8 MORB
Salters and Longhi (1999) 1525 2.8 MORB
Salters et al. (2002) 1600 2.8 MORB
Tuff and Gibson (2007) 1475 3 ferropicrite
Tuff and Gibson (2007) 1425 3 ferropicrite
Tuff and Gibson (2007) 1750 7 ferropicrite
Withers (1997) 1470 3 basalt
Withers (1997) 1487 3 basalt