picolog frequently asked questions - pc oscilloscope, data ... · if picolog loses connection with...
TRANSCRIPT

Frequently asked questions
PicoLog®
CONTENTS
1. Introduction ....................................................................................................................................................................... 2
2. PicoLog does not recognize my device .............................................................................................................................. 2
3. Finding the PicoLog software version ................................................................................................................................ 3
4. If PicoLog crashes on start-up ............................................................................................................................................ 3
5. How do I record data from multiple devices? .................................................................................................................... 4
6. What power settings should my PC have? ......................................................................................................................... 7
7. Installing PicoLog 5.23 over PicoLog 5.16.......................................................................................................................... 7
8. When starting PicoLog, you get Player and not Recorder ................................................................................................ 7
9. Remote data logging in PicoLog ......................................................................................................................................... 7
10. PicoLog file size and recovery ............................................................................................................................................ 9
11. PicoLog frequency measurement ....................................................................................................................................... 9
12. Pico devices that can run under PicoLog .......................................................................................................................... 10
13. If copy to clipboard or printing in PLW Spreadsheet does not work ............................................................................... 10
14. How to export data to a file ............................................................................................................................................ 10
15. If PicoLog loses connection with the data logger ............................................................................................................. 10
16. Device-specific: TC-08 ......................................................................................................................................................11
17. Device-specific: PicoLog 1012 and 1216........................................................................................................................... 13
18. Device-specific: ADC-20 and ADC-24 ............................................................................................................................. 17
19. Device-specific: PT-104 .................................................................................................................................................... 19
20. Device-specific: PicoLog CM3 Current Data Logger ........................................................................................................ 19
21. Device-specific: USB DrDAQ ........................................................................................................................................... 20
22. Device-specific: PicoScope 2203, 2204, 2204A, 2205, 2205A ...................................................................................... 20
23. Related documents .......................................................................................................................................................... 22
PicoLog Frequently asked questions 1

1. IntroductionThis FAQ aims to help PicoLog Data Logger users troubleshoot and solve common issues, in addition to providing device-specific setup information. The Related Documents section contains links to electronic versions of User’s Guides that can be accessed from our website. Should you require any further information or assistance, please contact our Technical Support team:
Email: [email protected]
Tel. (UK): +44 (0) 1480 396395
Tel. (USA): +1 800 591 2796
Skype: pico_tech_support
2. PicoLog does not recognize my deviceIf the logger has worked before on this PC, it might be that the correct USB driver for the logger has been corrupted. If this is a new installation, it is more likely that you plugged the logger into the USB port before loading the PicoLog software. Windows then tries to load a generic driver which will not work. It will not be overwritten by the correct driver until the wrong driver has been uninstalled.
Please try this: Plug in the logger and then go to Windows Device Manager (Windows XP: Control Panel > System and then look in the Hardware tab; Windows Vista/7/8: right-click Computer, select Properties then click the Device Manager link; WIndows 10: right-click the Start button and select Device Manager).
If there is an “Unknown USB device” anywhere in the list or, under either “Pico Technology Instruments” or “Universal Serial Bus Controllers”, a “Pico USB [xxxx] data logger” with a yellow warning triangle, click it once to highlight it and then right-click to bring up a list from which select Uninstall. Once that is done, unplug the logger and then plug it back in again. The Windows New Hardware Found Wizard will run. Follow the on-screen instructions and, if the wizard asks to connect to Windows Update, select No and allow Windows to automatically detect and configure your logger.
Note to Windows XP users: During installation, if Windows displays a warning message about Windows Logo testing, click Continue Anyway to complete the installation.
When plugged in, the logger should show up in the Windows Device Manager again either under a Pico Technology Instruments sub-item or under Universal Serial Bus controllers as shown below.
Figure 1.1 – Windows Device Manager showing PicoLog 1000 and USB TC-08 Data Loggers
If the drivers have installed correctly, your PicoLog software should now work. You should not need to reboot the PC.
PicoLog Frequently asked questions 2

If PicoLog still does not recognize your logger, you may have installed it incorrectly or for the wrong device. Please rerun your PicoLog installation file, select Remove when you are asked to select Repair, Modify or Remove. After removal, rerun the installer to install a fresh copy and when asked For which device do you wish to install select the primary device which you use with PicoLog. Also, for maximum compatibility, check the small box for Install for other devices. This will load all the other drivers for all other Pico loggers and allow you to select them if you need to use them with PicoLog at a later date. That should sort things out.
If there is still a problem with the settings of your PC that is preventing PicoLog from being installed, you will need to send an installation log file to enable us to work out the problem. Here is how to generate an Install.log file:
Create a C:\Temp directory and copy the PicoLog_R5_23_0.exe download file into it (or the latest version available). Make sure that the logger is not plugged into the PC. Now go to the Windows Start button, then select Run and in the command-line box copy and paste the following:
C:\Temp\PicoLog_R5_23_0.exe /v”/L Install.log”
Click OK and PicoLog will start to install in the usual way. At the end, whether the software has installed properly or not, there will be an Install.log file in the C:\Temp directory. Please email that file to us at the above address and we can then see what has gone wrong with the installation.
3. Finding the PicoLog software versionClick Help > About. The release number will then be displayed.
Visit the Downloads section of www.picotech.com to find the version of PicoLog that supports your data logger and operating system.
4. If PicoLog crashes on start-upIf the software crashes as soon as you start up it is probably because of some illegal, corrupted, setting in your plw.ini file. When you first run PicoLog, it creates a file called plw.ini and tries to save it in its working directory:
• C:\Program Files\Pico Technology\Pico Full (32-bit operating systems)
• C:\Program Files (x86)\Pico Technology\Pico Full (64-bit operating systems)
PicoLog uses this file to hold information about the preferences you set when running the program. Locate the plw.ini file in the above folder and delete it.
If you still have problems starting PicoLog, it could be that there is a second copy of plw.ini in a hidden directory under Application Data or AppData. This will need to be deleted as well.
To access the Application Data or AppData folder and subfolders, you must enable the option within Windows to view hidden folders:
Windows XP:
• Go to C:\Documents and Settings\<User name> in Windows Explorer
• Click Tools > Folder Options…
Windows Vista/7:
• Go to C:\Users\<User Name> in Windows Explorer
• Click Organize and select Folder and search options
• Click the View tab, then under Hidden Files and Folders, click the checkbox to Show hidden files and folders, and click OK:
PicoLog Frequently asked questions 3

Windows 8/10:
• Click the View tab and ensure that the Hidden items option is checked.
If you navigate to the following folder on your PC:
Windows XP:
C:\Documents and Settings\<User name>\Local Settings\Application Data\Pico Technology\
Windows Vista/7/8/10:
C:\Users\<User name>\AppData\Local\Pico Technology\
you will find one or more folders there with long numeric names. Look through each of them for plw.ini and delete it.
If deleting plw.ini does not fix the problem, you can also try creating backup copies of Recorder.pls and Player.pls and then deleting them from the above folders.
Having done all the above, it would be best to go back to Explorer and select Do not show hidden files and folders.
5. How do I record data from multiple devices?Multiple identical or different loggers can be used at the same time on one PC running under one instance of PicoLog. Here are example instructions how to use, for instance, five TC-08 loggers at a time:
1. Plug in five TC-08s through a powered USB hub. Start up PicoLog. Select File, then New Settings. In the Recording dialog box, check the box for Use multiple converters.
PicoLog Frequently asked questions 4

2. Continue to the Converters dialog and select Add. This will take you to the Converter Details box where you select TC‑08 (USB). PicoLog should find all the data loggers.
3. Click the first one shown in the USB Devices box and click OK. You will be returned to the Converters dialog where you click Add again. This will take you to the Converter Details box where you select TC‑08 (USB) for the second time.
4. When the second TC-08 is found, click OK. This will return you to the Converters dialog where two USB TC-08 devices should be shown.
5. Repeat steps 3 and 4 until all five USB TC-08 devices are found.
PicoLog Frequently asked questions 5

6. Click on Parameters to set up each individual channel, for each TC-08, one at a time. All five TC-08s will now behave as if they are one 40-channel data logger.
The data from all channels is saved to the data file, and Recorder view can display all the channels at once. Only 20 channels can be displayed at any one time in Graph and 16 channels in Spreadsheet view. (Viewing more than 16 to 20 channels at a time would be difficult to interpret).
You need to define multiple groups of channels, no more than 20 (or 16) at a time from the channels you have. You can then at any time call up these groups for viewing, in quick succession. See the description of the Select Parameters dialog in the PicoLog User’s Guide for how to set up a group.
In the Recorder view you can choose which of the groups you display by selecting Settings > Monitor and then, in the Select Parameters dialog, select the required group. (You can leave it set to display all channels in the recorder main window.) When viewing in Graph, select 20 or 16 channels at a time and when in Spreadsheet select just blocks of 16.
You can make up additional groups by selecting the channels you require using the Select Channels button and saving with a new group name. Use the different groups to switch between the different channels to be viewed. Be aware that sometimes in Graph view the new group cannot be fully drawn until you zoom in or out or stretch the window to force a redraw. For the groups to be saved with the data file, the groups must be set up before recording, not after.
Note: If you are looking to use different types of PicoLog data logger devices (such as a USB TC-08 and ADC-20), ensure that the checkbox to Install for other devices is selected in the Default Device Selection dialog during the PicoLog installation process.
Figure 1.2 – PicoLog Installer: default device selection
If this option was not selected, it will be necessary to reinstall the software.
PicoLog Frequently asked questions 6

6. What power settings should my PC have?If, for any reason, the USB port shuts down because of Windows settings for power saving, the logger will freeze and the logged file will probably be corrupt. Please ensure that all power-saving and screensaver settings are turned off in Windows.
For instance, in Windows XP:-
Control Panel > Power Options > Turn off hard disks = Never
Windows Vista/7/8:
Control Panel > Hardware and Sound > Power Options > Change plan settings to edit the power settings. Set Put the computer to sleep to Never.
and then:
Device Manager > Universal Serial Bus Controllers > USB Root Hub (multiple instances) > Properties (right click) > Power management > uncheck Allow the computer to turn off this device to save power
Windows 10:
Right-click the Start button > Power Options > Change plan settings and proceed as above for Windows 8.
and then:
Right-click the Start button > Device Manager and proceed as above for Windows 8.
7. Installing PicoLog 5.23 over PicoLog 5.16It is best to uninstall R5.16.2 and then install R5.23.x so that auto-reconnect will still work.
8. When starting PicoLog, you get Player and not RecorderIf, when running PicoLog, you minimize the Recorder window, it will shrink to a small PL logo near the right-hand end of the toolbar:
Figure 7.1: PicoLog icon in System Tray
After a short while, the icon may disappear – expand the System Tray to locate the icon:
Figure 7.2: PicoLog icon in expanded System Tray
When you wish to restore to the original window size, just double-click on that small PL logo. The display will return to as before.
If, at any time Recorder is running, even when minimized, you double-click on the main PicoLog icon on the desktop, Player will start. (This will happen even if Recorder appears to have crashed, as it is often still running in the background. In that case, go to Windows Task Manager > Processes, highlight plw32.exe and click the End Process button.)
9. Remote data logging in PicoLogIt is possible to connect between two PCs on a network with the logger on one PC (server) and another PC acting as a client:
The following instructions are taken from the Transfer data over an IP network section of the PicoLog User’s Guide:
The PicoLog IP socket facility is used to take measurements on one or more computers and record the data on another computer. The measurements are taken by PicoLog on the server. Another computer, the client, requests the data via an IP network.
PicoLog Frequently asked questions 7

On the server:
1. Click Start
2. Select Run...
3. Type winipcfg.exe
4. Note the server name
On the client:
1. Open a DOS box
2. Type ping followed by the server name
3. The computer will display the time taken to send a message to the server and receive a response
4. Check that it is working and note the time
On the server:
1. Start PicoLog
2. From the File menu, select Preferences
3. Select IP Sockets
4. Check the Enable Server box
5. Click OK
6. Set up PicoLog to measure the channels that you require
On the client:
1. Start PicoLog
2. From the File menu, select Preferences
3. Select IP Sockets
4. Check the Enable Client box
5. Exit and restart PicoLog
6. Select New Settings
7. Enter recording details and click OK
8. Enter the sampling details and click OK
9. Select Socket in the Converter type combo box
10. Click OK
11. Type in the server name, e.g. fred
Note: Server names are case sensitive! Fred is not the same as fred.
12. Click Connect
13. The computer should now display the channels from the server
14. Click on one of the channels
15. If you want to change the name, type in the local name
16. Click OK
17. The channel you selected is marked with an X
18. Repeat for each of the channels
19. Click OK
20. The monitor window should now display the readings from the server
PicoLog Frequently asked questions 8

10. PicoLog file size and recoveryThe largest size file that is can be generated by PicoLog contains about one million samples per channel (whatever the number of channels). If you wish to log for longer periods you need to set PicoLog to Repeat Immediately at the end of a run. A new file will be started with an auto-incremented file name. For ease of use do not use the maximum file size but choose a convenient number of samples that gives a reasonable logging time per file.
Once a file is saved to the hard drive it is safe from a PC crash or power loss. A long file that is interrupted before saving can be corrupted and unreadable. We can sometimes recover corrupted .plw files but only if you also have a good file available as well with exactly the same settings to allow us to clone the headers. Even a settings (.pls) file with no actual data will work as well, as long as the channels, sample rate and number of samples and other parameters are identical.
11. PicoLog frequency measurementYou can use PicoLog with the PicoLog 1000 series (and certain oscilloscopes: see Pico devices section) to measure AC volts, dB and frequency, presenting the values as a graph (real-time continuous mode only). Our other data loggers are too slow to be useful for frequency measurements.
• First, go to File > New Settings, select Real Time Continuous, and click OK.
• Select a sampling time of 1 second to take a reading of frequency once per second.
• Select the total number of samples or the total time of recording, and click OK.
• Select PicoLog 1012/1216 and click OK.
• In PicoLog1216 Measurements click Add.
• In Edit PicoLog1216 Measurement, enter a name for the channel.
• Select Channel 1.
• For Measurement, select Frequency.
• Set the scan time to 100 000 µs. This will give you a frequency range of 20 Hz to 11.626 kHz.
• Using Options > Scaling you can get PicoLog to display in RPM, not frequency, if you wish. (Click Help for instructions.)
• Back in Edit PicoLog1216 Measurement click OK.
• Back in PicoLog1216 Measurements click OK.
• Channel 1 should now be reading in Hz (or RPM if set).
To get frequency measurements for PicoLog at less than 1 second intervals (say 100 ms) you need to modify your plw.ini file. This will be located in the following directory for Windows XP:
C:\Documents and Settings\USER_LOGIN\Local Settings\Application Data\Pico Technology\42f31349-afb8-471d-8a4d4fb7672be39b\
where USER_LOGIN is your user account.
(You will need to enable viewing of Hidden Folders).
The equivalent folder in Windows Vista/7/8/10 is:
C:\Users\<Your user name>\AppData\Local\Pico Technology\42f31349-afb8-471d-8a4d4fb7672be39b\
Open plw.ini in Notepad or a similar text editor and add the following line:
QuickSampleMs=100
in the section labeled:
[Preferences]
Here is an example file:
[Window]Recorder=0,1,-1,-1,-1,-1,614,1168,126,523[Converter]Type=3200Port=0
PicoLog Frequently asked questions 9

Selection=0[Preferences]AllowRerecord=YesAllowPause=YesQuickSampleMs=100
(This will allow sample rates down to 100 ms, for example.)
By default this is at 1000 ms but you can change it to below 1000 ms. Save and exit, and next time you go into PicoLog recorder this will become active. This is covered in the PicoLog User’s Guide, .ini preferences file section, under QuicksampleMs.
You may need to configure your frequency range. When you set up a channel to measure frequency, there a control called Scan time. By changing the scan time you can adjust the frequency range that you wish to measure. The scan time needs to be 3 times as long as the period of the frequency you want to measure.
12. Pico devices that can run under PicoLogThe only USB oscilloscopes that can run under PicoLog are:
PicoScope 2104PicoScope 2105PicoScope 2202PicoScope 2203PicoScope 2204PicoScope 2205PicoScope 2204APicoScope 2205AAny of the older range of PicoScope 3000 Series scopes that do not have an A, B, D or MSO suffix.
Function generator and AWG outputs are not supported in PicoLog.
All data loggers and all parallel port scopes work under PicoLog on 32-bit operating systems. Parallel port products and the USB ADC-11 are not supported on 64-bit operating systems.
13. If copy to clipboard or printing in PLW Spreadsheet does not workOn selecting cells in the PLW Spreadsheet window and pasting to the Windows clipboard, no data is transferred to the clipboard. On attempting to print the cells, unexpected characters appear in the printout. These are intermittent problems that occur on certain versions of Windows.
There is a workaround:
1. Right-click the PicoLog icon or shortcut
2. Select Properties > Compatibility
3. Check the Run this program in compatibility mode for: checkbox
4. Select Windows XP (Service Pack 3)
After you have applied this workaround, PicoLog will start in compatibility mode every time you click the shortcut and the problems with the spreadsheet should not occur.
Alternatively, running PicoLog as Administrator should have the same effect.
14. How to export data to a file1. Load the PicoLog data file into PicoLog Recorder or PicoLog Player.
2. Click File > Save as...
3. In the Save file as... dialog, set the Save as type: to Text files (*.txt) or Comma‑separated value files (*.csv).
4. Enter a filename and click Save.
15. If PicoLog loses connection with the data logger1. In the PicoLog Recorder window, click File > Preferences > Auto Reconnect, set a time and ensure that the Enable
auto reconnection checkbox is set.
2. Consider using powered USB hubs for multiple devices to ensure that sufficient current is delivered to the device.
PicoLog Frequently asked questions 10

16. Device-specific: TC-08
Serial TC-08
To use the Serial TC-08 on a USB port you will need a USB to serial adaptor, either ours or another manufacturer’s. That needs to be installed first, using the software driver that is usually supplied on a small CD. Once that is installed and working, you then need to go to Windows Device Manager and look under Ports (COM & LPT) where there will be an entry for a Serial on USB port with a COM port number in brackets next to it. (If the COM port number is greater than 4, force it be in the range 1 to 4 by manually selecting the COM port number). Go to Windows Device Manager and select the hardware serial port you wish to use. Right-click on it and select Properties. Select Port Settings and then Advanced.
There will be a selection box for COM Port Number. Select a number less than 5 and click OK. Windows might give a warning but ignore that. Use this new port number when setting up the TC-08. Above instructions are for XP but similar will apply to other versions of Windows.
Plug your TC-08 into the USB adaptor and run PicoLog. When asked for the COM port to use, enter the COM port allocated in Device Manager. If you use a different USB port next time, please be aware that the COM port number may change. If you restart a PC with the USB-to-serial converter and TC-08 already connected, Windows frequently assumes that a mouse is connected. This can happen with any device connected through a USB converter.
Please try this: Unplug both devices from the PC and each other. Plug in the USB converter, check it is recognized and which COM port is allocated to it, and finally plug in the TC-08. Use the COM port number found earlier to set up the TC-08 under PicoLog.
You can use the current version of PicoLog (R5.23.0 at the time of writing). When installing, still select Serial TC-08 as the device, not USB TC-08.
TC-08 sampling rate
The TC-08 takes 100 ms per thermocouple to read temperature. Once per cycle through all the active channels it must also read the cold junction temperature, which takes 100 ms. Thus if only one thermocouple is active the full cycle takes 100 + 100 = 200 ms or 5 readings per second. If two channels are active the full cycle takes 2 x 100 + 100 = 300 ms or about three readings per channel per second.
If all 8 channels are in use, the cycle is 8 x 100 + 100 = 900 ms which means all 8 channels are read just quicker than once per second. When the cold junction is being read (once per cycle) the LED is green. It is red when any of the thermocouple channels are being read.
The above cycle is constant for the TC-08 and independent of the requested sample rate. If samples are requested faster than 100 ms, consecutive readings will often be of the same value until the value for that channel has been updated, so readings are never older than the sample time. If the samples are requested at a slower rate, the readings will always be the latest value which has been taken by the hardware, no more than 200 ms ago.
If Filtering is enabled, with say a filter factor of 3, the display is not updated until 3 samples are available and then the average of those three samples is the value displayed. It is generally best to set the sample rate to about the same as the cycle time to get readings from all enabled channels. Adding a filter factor will smooth out fluctuations in the readings at the expense of slower response to a fast temperature change.
Using scaling to adjust the calibration of each channel
It is easy to add a calibration factor to each channel using the Scaling option during setup. The corrections can be saved to a settings (.pls) file; this will allow the calibration data to be reapplied to each channel on startup without the need to type everything again. A greater number of points will give you a better calibration. You can use them to set up Scaling to give you accurate readings directly to your data file and graphical display.
You just need to set the scaling for the channel in question. We will illustrate how to scale Temperature for each channel.
Start PicoLog and set up your sample rates as required. When you get to setting up each channel, click Edit > Options.
In the Parameter Options dialog, click Scaling to go to the next dialog.
In the Parameter Scaling dialog, select Table Lookup as the Scaling method.
Assuming you just have data for the thermocouple for a two-point calibration (indicated and true readings for two different temperatures), type in the text box the two pairs of numbers:
aa bbcc dd
PicoLog Frequently asked questions 11

where aa = the indicated reading at the first temperature bb = the true reading at the first temperature cc = the indicated reading at the second temperature dd = the true reading at the second temperature
(taken from your calibration certificate for the thermocouple or from your own measurements).
Note that there is one space between the two numbers on each line.
The actual table will look like this:
9.5 10.194.5 95.0
This example tells the program to equate 9.5°C indicated reading to a true 10 °C and 94.5°C indicated reading to a true 95°C. When the scaling is applied, the readings will be corrected.
Click OK to go back through the open boxes and temperature should now be scaled correctly.
(Note: Lookup tables have a limit of 14 lines. Above that, use a scaling file. If you use a scaling file you must ensure that either:
1. All parameter formatting is done on the parameter formatting page only and none in the scaling file (just the equation or lookup table).
or
2. Parameter formatting is not checked and all formatting is done in the scaling file only.
Duplication of parameter formatting will cause a crash!
When all channels are done, save a settings (.pls) file and next time, when you want to reapply the same calibration to a logging session, just start PicoLog by double-clicking on the settings file instead of the PicoLog icon.
4–20 mA on the TC-08 using the TC-08 Terminal Board
Here are some standard instructions for scaling a 4–20 mA sensor for use with the TC-08:
The sensor requires a +24 V supply. Feed the positive of the supply to the positive of the sensor. Feed the negative of the sensor to the +5V/4–20 mA input of the TC-08 Terminal Board. Connect the 0 V of the power supply to the COM terminal of the TC-08 Terminal Board. Set the switch of the TC-08 Terminal Board to 4–20 mA.
Here is the setup process:
The 4–20 mA will flow through a load resistor on the adaptor board, generating between 9.5 mV (at 4 mA) and 47.5 mV (20 mA). To convert these voltages into properly scaled readings, you must use the Scaling option in PicoLog.
For example, if the sensor pressure is 0 psi when the current through the load resistor is 4 mA and 30 psi at 20 mA, you would set up a lookup table to equate 9.5 mV to 0 psi and 47.5 mV to 30 psi.
1. Start PicoLog and set up your sample rates as required. When you get to setting up channel 1 (Edit TC‑08 channel), type psi as the Name and mV as the Thermocouple.
2. Now click Options.
3. In the Parameter options box, check Use Parameter Formatting and set Units to psi, set Formatting to your own preference (such as three digits, one after the decimal point), select 0 (min) and 30 (max) for the graph scaling, and then click Scaling.
4. In the Parameter Scaling box, set Scaling method to Table look‑up.
5. In the blank box, you can now enter two pairs of Raw and Scaled readings. In this case the table looks like this:
9.5 047.5 30
Note the single space between the two numbers on each line.
Explanation: The 9.5 is derived from 4 mA times 240 Ω divided by 101 (attenuation in the terminal board) = 9.5 mV.
The 47.5 is 20 mA times 240 Ω divided by 101 = 47.5 mV.
6. Click OK to go back through the open boxes and channel 1 should now be scaled from 0 to 30 psi.
Click Help to read an explanation of the process.
PicoLog Frequently asked questions 12

TC-08 channels all showing incorrect and variable readings
The 8 channels of the TC-08 are differential inputs. There are two pins per channel, each with a 1 MΩ resistance to ground. The differential input resistance is thus 2 MΩ. The TC-08 measures the difference in voltage between the two pins with a working range of ±70 mV maximum. For correct operation, both input voltages must stay in the range ±7.0 V with respect to ground (0 V). No damage will result if this common-mode voltage is higher than ±7.0 V unless the voltage increases to above ±30 V. As long as all the absolute values of voltage with respect to 0 V stay within ±7.0 V of 0 V, the channels will read correctly.
Incorrect and variable readings are usually caused by a thermocouple being used touching something that is at a different potential to the TC-08 or PC earth. If this voltage is greater than about ±7 V the channel is pulled out of the common-mode range of the TC-08. This causes all channels to read very incorrect values. You must ensure that the metal object you are touching with the exposed end of the thermocouple is earthed correctly and at the same potential as the PC earth. If that cannot be done, the thermocouple must be electrically isolated from the metal surface. Failing that, for short-term logging, you can use a laptop running on batteries, as that is not connected to mains earth.
An overload can be on one channel or between two channels. The TC08 has an input range of about 70 mV. If more than 7 V difference occurs between any of the inputs to the TC-08, incorrect readings will result. Additionally, if more than 7 V difference occurs between any input and the TC-08’s ground (also computer ground and usually mains earth), errors will occur. A typical example where this may occur would be if a thermocouple is used to measure the temperature of the motor on a machine tool. The casing of the motor, although earthed, may be at a potential of several volts from the earth of the computer.
Plug in the thermocouples one at at time to locate which are causing the problems. If possible, electrically isolate the thermocouple. If this is not possible, run a wire from the metal outer shell of the TC-08 USB connector to a point near the thermocouple tip. This earths the area near the thermocouple tip and can often pull the two grounds close enough together for normal operation.
Laptops running on mains adaptors can also cause problems. Some laptop power supplies do not have an earth connection and produce large amounts of interference which can be picked up by the sensitive TC-08. If you have problems when the laptop is run off it mains adaptor, but not on battery, try earthing the laptop. There is often a screw on the back of the laptop that can be used for this purpose. Alternatively, run a wire from the TC-08 USB connector shell to mains earth. The USB TC-08 can be modified to have a 4 mm ground socket if required. Contact Technical Support at the above address for further details.
17. Device-specific: PicoLog 1012 and 1216
Sampling at 1 ms in PicoLog with the PicoLog 1012 and 1216
If you find that you any only log at about 20 to 50 ms sampling rates, you are probably running in real-time continuous mode. This allows you to use multiple loggers at one time but the sampling rate is slow (20 to 50 ms, depending on PC speed). 1 ms cannot be obtained even if requested. It does, however, allow you to plot AC voltage, frequency and dB figures for signals that are too fast for the logger to capture the actual waveform.
To get a sampling rate of 1 ms you need to be in Streaming (single converter only) mode:
1. Click File > New Settings.
2. In the Recording dialog, for Recording method select Streaming (single converter only) and then click OK.
3. When the PicoLog 1216 has been detected, click OK again. Now you can select the sampling rate and number of samples.
In this mode you can sample on all 16 channels, getting one reading from each in a 1 ms period, but AC voltage, frequency and dB readings will not be offered.
Triggering in PicoLog
The PicoLog 1012 and 1216 data loggers can trigger from any of the available input channels, but only in block mode.
Sampling modes
PicoLog 1000 series loggers can run in various sampling modes. At high sampling rates, the logger collects data much faster than it can be sent to the PC. To compensate for this, the logger stores a block of data in an internal memory buffer, delaying transfer to the PC until a preset number of data points have been sampled. This is called block mode. At very low sampling rates, you may want to switch to streaming mode. This allows accurately timed data to be transferred back to the PC in short blocks, without gaps. Real-time continuous mode is also provided for use at low sampling rates when immediate data transfer without gaps is required but timing accuracy is not critical.
PicoLog Frequently asked questions 13

Block mode
A sampling mode in which the computer prompts the oscilloscope to collect a block of data into its internal memory before stopping the oscilloscope and transferring the whole block into computer memory. This mode of operation is suitable when the input signal being sampled contains high frequencies. Note: To avoid aliasing effects, the sampling rate must be greater than twice the highest-frequency component of the input signal.
Streaming mode
A sampling mode in which the oscilloscope samples data and returns it to the computer in an unbroken stream. This mode of operation is suitable when the input signal being sampled contains only low frequencies.
Real-time continuous mode
A sampling mode in which the software repeatedly requests single samples from the oscilloscope. This mode is suitable for low sampling rates when you require the latest sample to be displayed as soon as it is captured.
Monitor 4–20 mA signals with the PicoLog 1012 logger
For more information, refer to the PicoLog 1000 Series Data Logger User’s Guide and the PicoLog User’s Guide.
With the addition of one 120R resistor per channel used, the PicoLog 1012 can accept 4–20 mA signals which will develop 0.48 to 2.4 V across the 120R resistors. This can be easily scaled within our free PicoLog program to the correct engineering units, displayed live on screen and saved to a file on the hard drive of the attached PC or laptop. Files can be exported as .txt or .csv for loading into Microsoft Excel or other spreadsheet application.
How to set up for 4–20 mA operation with an example of a 0 to 10 bar pressure sensor
Just pass the 4–20 mA current output by the sensor through a 120R resistor to generate a voltage varying from 480 mV to 2400 mV. The resistor is best placed in parallel with the input terminals of the PicoLog 1012 (from the channel input pin to ground). The 0V terminal of the +12 V to +24 V sensor supply is connected also to the ground of the PicoScope 1012. The resistors used can be soldered to the terminal board permanently or just gripped by the screw terminals on the board.
The positive output of the supply goes to the positive terminal of the sensor. The sensor negative terminal loops back to the other end of the 120R resistor. Thus the sensor current goes round in a loop through the sensor, resistor and supply.
Once you have connected up the sensor, resistor and supply as described above, you just need to set the scaling for the channel in question. We will illustrate how to set up channel 1 for 4–20 mA operation with graph scaling from 0 bar to 10 bar as an example.
1. Start PicoLog and set up your sample rates as required.
2. When you get to the PicoLog 1012 measurements dialog, click Add.
3. Type Pressure as the Name, select DC Volts and leave the Scan time as the default 10 000 µs.
4. Now click Options. (If you are asked to save the present setup, click OK).
5. In the Parameter Options dialog, check Use parameter Formatting and type bar in the Units box. Set Field Width to 4, Decimal places to 2, Minimum value to 0 and Maximum value to 10. Now click Scaling to go to the next dialog.
6. In the Parameter scaling dialog, select Table Lookup as the Scaling method and in the text box, type:
0.48 02.4 10
This tells the program to equate 0.48 V to 0 bar on the graph and 2.4 V to 10 bar on the graph.
Explanation: The 0.48 is derived from 4 mA × 120 Ω = 0.48 V. The 2.4 is 20 mA × 120 Ω = 2.4V.
7. Click OK to go back through the open boxes and channel A should now be scaled from 0 to 10 bar.
If the sensor is not powered up, the reading will be about –1.2 bar as that is the equivalent reading for 0 mA. (0 bar = 4 mA).
See the PicoLog User’s Guide for information on using PicoLog or click Help at any stage in PicoLog.
Using the DD100 thermistor from the DrDAQ on the PicoLog 1216
To use the DD100 thermistor from the DrDAQ with the PicoLog 1216, you will need to cut off the 4-pin connector and use just the two outside wires to connect to the PicoLog small terminal board. (The two inside wires connect to a fixed resistor that is only used with the DrDAQ.)
Connect one of the outside wires (it does not matter which) to one of the GND terminals of the PicoLog small terminal board.
PicoLog Frequently asked questions 14

Connect the other outside wire to the C1 (channel 1) input terminal of the PicoLog terminal board. You will now require a 39k resistor to connect between the channel 1 input and the +2.5 terminal of the PicoLog terminal board. If this resistor has leads, you can easily connect it by clamping it in position using the terminal screws C1 and 2.5. If you have only a surface-mount 39k resistor, you can mount it in the R33 position on the terminal board: see the DO161 Small Terminal Board User’s Guide.
Assuming you have connected up the sensor, resistor and supply as described above, you just need to set the scaling for the channels in question. Below is an illustration of how to set up channel 1 for temperature measurement from –10 °C to 100 °C using a DD100 sensor.
1. Start PicoLog and set up your sample rates as required.
2. When you get to setting up channel 1 (PicoLog 1000 Channels), select Channel 1 and click Edit.
3. Type Temperature as the Name.
4. Now click Options. (If you are asked to save the present setup, click OK).
5. In the Parameter Options dialog, check Use parameter Formatting and type °C in the Units box. Set Field Width = 5, Decimal places = 2, Minimum value = –10 and Maximum value = 100. Now click Scaling to go to the next dialog.
6. In the Parameter scaling dialog, select Table Lookup as the Scaling method and in the visible text box, copy and paste the table below exactly:
2.247 -102.152 02.020 101.848 201.643 301.417 401.187 500.970 600.777 700.614 800.481 900.375 100
Note that there is a single space between each pair of numbers.
This tells the program to equate 2.247 V to –10°C on the graph and 0.375 V to 100°C on the graph (plus intermediate values).
7. Click OK to go back through the open boxes and channel 1 should now be scaled from –10 °C to 100 °C.
See the PicoLog User’s Guide for information on using PicoLog or click Help at any stage in PicoLog.
Note: Lookup tables have a limit of 14 lines. Above that, use a scaling file (see below).
If you use a scaling file you must ensure that either:
1. All parameter formatting is done on the parameter formatting page only and none in the scaling file (just the equation or look-up table).
or
2. Parameter formatting is not checked and all formatting is done in the scaling file only.
Duplication of parameter formatting will cause a crash!
To use a “Scaling file” instead of “Equation” or “Table Lookup”
We will assume that you are going to use a thermistor type NJ28 RA 0104 FCC (100 kΩ @ 25 °C) with a 47k series resistor.
The PicoLog 1012 has an input resistance of 1 MΩ and this is in parallel with the thermistor, so the thermistor resistance value is reduced to (100 × 1000)/(100 + 1000) kΩ = 90.91 kΩ (at 25 °C). Assuming you are using the +2.5 V sensor supply of the PicoScope 1012, this is fed to the 47k resistor and thermistor in series and the voltage at their junction will be (2.5 × 90.91) / (90.91 + 47) V = 1.648 V.
Doing the same calculations from 0 °C to 150 °C gives values:
2.023 (V) = 5 (deg C)1.853 = 15
PicoLog Frequently asked questions 15

1.648 = 251.419 = 351.185 = 450.964 = 550.767 = 650.602 = 750.468 = 850.363 = 950.282 = 1050.219 = 1150.171 = 1250.135 = 1350.107 = 145
Assuming you have connected up the sensor, resistor and supply as described above, you just need to set the scaling for the channels in question. Below is an illustration of how to set up channel 1 for temperature measurement from 0 °C to 150 °C:
1. Start PicoLog and set-up your sample rates as required.
2. When you get to setting up Channel 1 (PicoLog 1000 Channels), highlight Channel 1 and click Edit.
3. Type Temp Chan 1 as the Name.
4. Now click Options. (If you are asked to save the present setup, click OK).
5. In the Parameter options dialog, select Scaling.
6. For Scaling method, select Use scaling from file and click File.
7. Navigate to where you have saved the scaling file below, with the filename 100k thermistor.scl.
8. Open the file. Click OK several times to get back to the main PicoLog window.
You should be reading temperature on channel 1.
Notes=100kthermistor/47kload/2.5VType=TableUnits=°CWidth=4Places=1MinValue=0MaxValue=1502.023 5 1.853 151.648 251.419 351.185 450.964 550.767 650.602 750.468 850.363 950.282 1050.219 1150.171 1250.135 1350.107 145
Note that there is a single space between each pair of numbers.
This tells the program to equate 2.023 V to 5 °C on the graph and 0.107 V to 145 °C on the graph.
Click OK to go back through the open boxes and channel 1 should now be scaled from 0 to 150 °C.
Repeat the above for the five other channels you are using.
See the PicoLog manual for information on using PicoLog or click Help at any stage in PicoLog.
PicoLog Frequently asked questions 16

Offsetting the input with the PicoLog 1000 Series
The PicoLog 1000 series has a nominal voltage range of 0 V to +2.5 V.
It is possible to offset and scale a negative signal. There is a +2.5 V, 10 mA source available on pin 17 of the PicoLog device. To start with, you will need to add resistors to the terminal board exactly as described in the Small Terminal Board User’s Guide. Here are the values to obtain a ±5 V range:
1. Assuming you are using channel 1, add a 20k surface-mount resistor in position R1 (also cutting the track).
2. Fit another 20k resistor in position R2.
3. Finally, to give the correct offset and final scaling, you must add a 10k surface-mount resistor in position R33 (on the back of the PCB, near the 25-way connector).
These three resistors will scale a +5 V to –5 V input to reach the logger as a signal varying from 0 V to +2.5 V. The scaling function of PicoLog can convert this reduced and offset range back to the original voltage reading by multiplying the raw value by 4.02 and subtracting 5 V. To compensate for any residual errors, the actual scaling offset and multiplier can be slightly varied to give exact readings by doing a simple calibration, if required.
If required, the first four channels can be easily offset in this way. (Other channels can too but the pull-up resistor has to be added externally to the PCB as there are only four resistor positions available: R33, R34, R35 and R36.)
1. Start PicoLog and set up your sample rates as required. In PicoLog1216 measurements, click to Add the first channel. In the Name box, type Volts.
2. Leave the Measurement as DC Volts and the Scan Time unchanged.
3. Now click Options. (You will be asked to save channel settings to continue.)
4. Now click Scaling to go to the next dialog.
5. In the Parameter scaling dialog, select Equation as the Scaling method and in the text box, type:
4.02*X-5
6. Click OK to go back through the open boxes and channel 1 should now be scaled from about +5 V to –5 V.
See the PicoLog User’s Guide for information on using PicoLog or click Help at any stage in PicoLog.
See the PicoLog 1000 Series User’s Guide for more information.
When no input is connected, the DC voltage measured will float up to near +1.67 V. As long as the series resistance of the voltage you are feeding to the input of the PicoLog terminal board is much lower than input impedance of the circuit above, the DC level is pulled to the correct value upon connection.
18. Device-specific: ADC-20 and ADC-24
4–20 mA on the ADC-20 and ADC-24
All you have to do is to pass the 4–20 mA current output from the sensor through a 120R resistor to generate a voltage varying from 480 mV to 2400 mV. The resistor is best placed in parallel with the input terminals of the ADC-24 (from the channel input pin to analog ground). The 0 V terminal of the +12 V to +24 V sensor supply is connected also to the analog ground of the ADC-24 (and the sensor COM terminal if it is a 3-wire sensor).
The positive output of the supply goes to the positive terminal of the sensor and the sensor output terminal loops back to the other end of the 120R resistor. Thus the sensor current goes round in a loop through the sensor, resistor and supply.
Assuming you have connected up the sensor, resistor and supply as described above, you just need to set the scaling for the channel in question. Below is an illustration of how to set up channel 1 for 4–20 mA operation with graph scaling from 0 bar to 10 bar as an example:
1. Start PicoLog and set up your sample rates as required.
2. When you get to setting up Channel 1 (ADC‑24 Channels), highlight Channel 1 and click Edit.
3. Type Pressure as the Name, choose a Conversion time between 60 ms and 660 ms, and select ±2500 mV as the Voltage range.
4. Leave Differential input enable unchecked.
5. Now click Options. (If you are asked to save the present setup, click OK.)
PicoLog Frequently asked questions 17

6. In the Parameter Options dialog, check Use parameter Formatting, and type bar in the Units box. Set Field Width = 4, Decimal places = 2, Minimum value = 0, and Maximum value = 40. Now click Scaling to go to the next dialog.
7. In the Parameter scaling dialog select Table Lookup as the Scaling method and in the text box, type:
480 02400 10
This tells the program to equate 480 mV to 0 bar on the graph and 2400 mV to 10 bar on the graph.
Explanation: the 480 mV is derived from 4 mA × 120 Ω = 480 mV. The 2400 is 20 mA × 120 Ω = 2400 mV.
8. Click OK to go back through the open boxes and channel A should now be scaled from 0 to 10 bar.
If the sensor is not powered up, the reading will be about –1.2 bar as that is the equivalent reading for 0 mA (0 bar = 4 mA).
See the PicoLog User’s Guide for information on using PicoLog or click Help at any stage in PicoLog.
Sampling rate of ADC-20 or ADC-24
The ADC-24 takes readings on a single channel at about 1.5 to 17 samples/second depending on your requested conversion (settling) time. When setting up each channel, you are asked to select the conversion time from 60, 100, 180, 340 or 660 ms. To obtain the full resolution of the converter select 660 ms. For information on the ADC-20, see the ADC-20 and ADC-24 User’s Guide.
The settling time for the ADC-24 is based on the hardware and is independent of the requested sample rate set in PicoLog. If samples are requested faster than the settling time chosen, consecutive readings will often be of the same value until the value for that channel has been updated, so readings are never older than the sample time at worst. If the samples are requested at a slower rate than the settling time, the readings will always be the latest value which has been taken by the hardware.
The sampling rate quoted is per channel, not per cycle around all the channels. There is a single ADC with a multiplexer to give multiple channels. The fastest that an ADC-24 can sample all 16 channels is 960 ms with 60 ms conversion time.
Thermistor temperature sensing with the ADC-20 or ADC-24
As an example we will use the B57891-M104-K thermistor from Elfa Distrelec and will assume measurement in the range of 60 to 110 °C. The centre of the range is 85 °C so we will optimize for that value.
The thermistor above has a resistance of 8376 Ω at 85 °C so Ra needs to match that for a centre scale reading of volts (+1.25 V) at this temperature. Use an 8k2 resistor as the nearest standard value. Do not use a variable resistor as you will never know where you are for calibration.
The ADC-24 has an input resistance of 1 MΩ and this is in parallel with the thermistor, so the thermistor resistance value is reduced to (8.376 x 1000) / (8.376 + 1000) kΩ = 8306.4 kΩ (at 85 °C). Assuming you are using the +2.5 V sensor supply of the ADC-24, this is fed to the 8k2 resistor and thermistor in series and the voltage at their junction will be (2.5 x 8306.4) / (8306.4 + 8200) V = 1.2581 V.
Doing the same calculations from 60 °C to 110 °C gives these values:
60C = 1.7997V65C = 1.6987V70C = 1.5931V75C = 1.4828V80C = 1.3707V85C = 1.2581V90C = 1.1473V95C = 1.0419V100C = 0.9415V105C = 0.8464V110C = 0.7579V
Assuming you have connected up the sensor, resistor and supply as described above, you just need to set the scaling for the channels in question. Below is a series of steps describing how to set up channel 1 for temperature measurement from 60 °C to 110 °C.
1. Start PicoLog and set up your sample rates as required.
2. When you get to setting up Channel 1 (ADC‑24 Channels), highlight Channel 1 and click Edit.
3. Type Temp Chan 1 as the Name, leave Conversion time as 60 ms and select ±2500 mV as the Voltage range.
PicoLog Frequently asked questions 18
4. Leave Differential input enable unchecked.
5. Now click Options. (If you are asked to save the present setup, click OK).
6. In the Parameter Options dialog, check Use parameter Formatting, and type °C in the Units box. Set Field Width = 4, Decimal places = 1, Minimum value = 50 and Maximum value = 120. Now click Scaling to go to the next dialog.
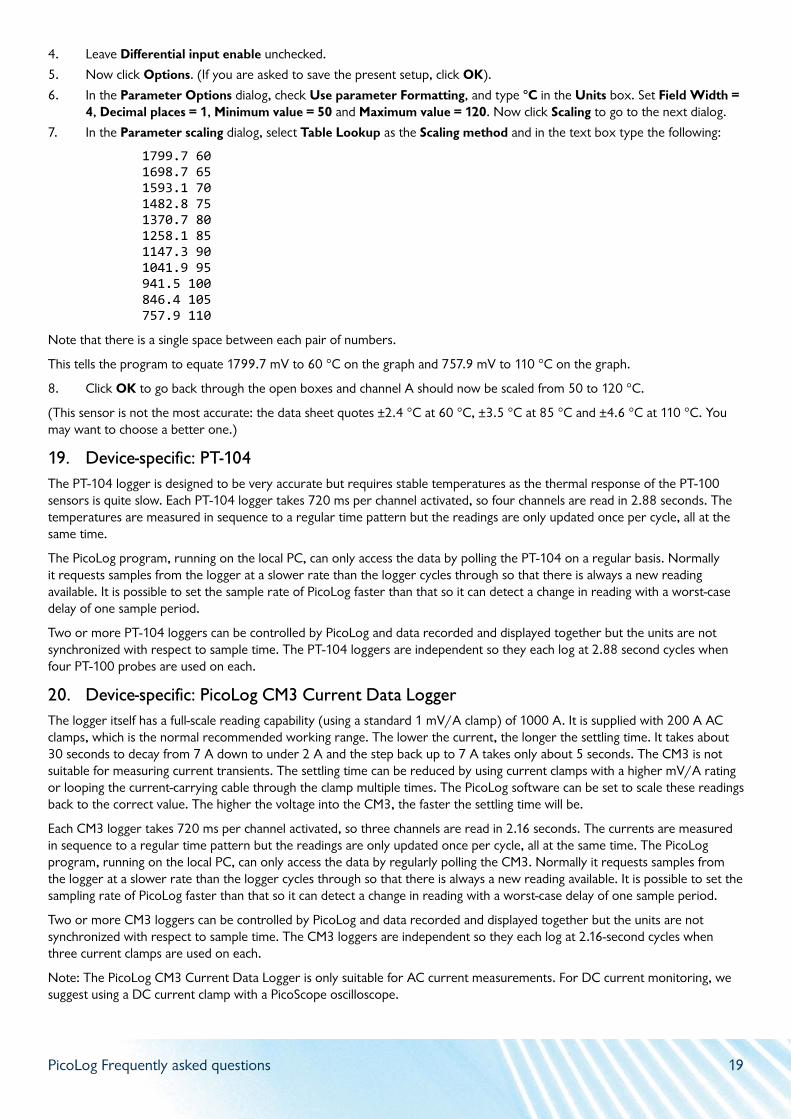
7. In the Parameter scaling dialog, select Table Lookup as the Scaling method and in the text box type the following:
1799.7 601698.7 651593.1 701482.8 751370.7 801258.1 851147.3 901041.9 95941.5 100846.4 105757.9 110
Note that there is a single space between each pair of numbers.
This tells the program to equate 1799.7 mV to 60 °C on the graph and 757.9 mV to 110 °C on the graph.
8. Click OK to go back through the open boxes and channel A should now be scaled from 50 to 120 °C.
(This sensor is not the most accurate: the data sheet quotes ±2.4 °C at 60 °C, ±3.5 °C at 85 °C and ±4.6 °C at 110 °C. You may want to choose a better one.)
19. Device-specific: PT-104The PT-104 logger is designed to be very accurate but requires stable temperatures as the thermal response of the PT-100 sensors is quite slow. Each PT-104 logger takes 720 ms per channel activated, so four channels are read in 2.88 seconds. The temperatures are measured in sequence to a regular time pattern but the readings are only updated once per cycle, all at the same time.
The PicoLog program, running on the local PC, can only access the data by polling the PT-104 on a regular basis. Normally it requests samples from the logger at a slower rate than the logger cycles through so that there is always a new reading available. It is possible to set the sample rate of PicoLog faster than that so it can detect a change in reading with a worst-case delay of one sample period.
Two or more PT-104 loggers can be controlled by PicoLog and data recorded and displayed together but the units are not synchronized with respect to sample time. The PT-104 loggers are independent so they each log at 2.88 second cycles when four PT-100 probes are used on each.
20. Device-specific: PicoLog CM3 Current Data LoggerThe logger itself has a full-scale reading capability (using a standard 1 mV/A clamp) of 1000 A. It is supplied with 200 A AC clamps, which is the normal recommended working range. The lower the current, the longer the settling time. It takes about 30 seconds to decay from 7 A down to under 2 A and the step back up to 7 A takes only about 5 seconds. The CM3 is not suitable for measuring current transients. The settling time can be reduced by using current clamps with a higher mV/A rating or looping the current-carrying cable through the clamp multiple times. The PicoLog software can be set to scale these readings back to the correct value. The higher the voltage into the CM3, the faster the settling time will be.
Each CM3 logger takes 720 ms per channel activated, so three channels are read in 2.16 seconds. The currents are measured in sequence to a regular time pattern but the readings are only updated once per cycle, all at the same time. The PicoLog program, running on the local PC, can only access the data by regularly polling the CM3. Normally it requests samples from the logger at a slower rate than the logger cycles through so that there is always a new reading available. It is possible to set the sampling rate of PicoLog faster than that so it can detect a change in reading with a worst-case delay of one sample period.
Two or more CM3 loggers can be controlled by PicoLog and data recorded and displayed together but the units are not synchronized with respect to sample time. The CM3 loggers are independent so they each log at 2.16-second cycles when three current clamps are used on each.
Note: The PicoLog CM3 Current Data Logger is only suitable for AC current measurements. For DC current monitoring, we suggest using a DC current clamp with a PicoScope oscilloscope.
PicoLog Frequently asked questions 19

21. Device-specific: USB DrDAQTo use any of the three external sensor inputs as plain voltage channels, you must have a fixed and defined resistor fitted between pins 2 and 3 of the external socket to tell the DrDAQ which scaling to use.
The scaling is defined by a Scaling.dds file which you must generate and put in the root directory of PicoLog. Below is an example file Ext Volts.dds which you can use as a start.
If you put a 3.3k resistor between pins 2 and 3, that will tell PicoLog to use [Scale1], which will then give you voltage readings between 0 V and 2.5 V on any Ext input that is connected.
The section on USB DrDAQ scaling files (.DDS) in the USB DrDAQ User’s Guide provides details on this process.
Ext Volts.dds:[Scale1]Resistor=3.3LongName=VoltageUnits=VoltsMinValue=0MaxValue=2.5OutOfRange=2Places=3Method=0NoOfPoints=2Raw1=0Scaled1=0Raw2=2.5Scaled2=2.5
If your external voltage has already been attenuated from a higher value (for instance if you are measuring +5 V), you can adjust the scaling to suit such that the correct voltage is displayed in PicoLog. Simply change two lines in the Ext Volts.dds file:
[Scale1]Resistor=3.3LongName=VoltageUnits=VoltsMinValue=0MaxValue=5.0OutOfRange=2Places=3Method=0NoOfPoints=2Raw1=0Scaled1=0Raw2=2.5Scaled2=5.0
22. Device-specific: PicoScope 2203, 2204, 2204A, 2205, 2205A
Clicking relay noise
The PicoScope 2000 Series scopes have relays that switch between the high and low voltage ranges on each channel. When running in PicoLog, the input signal is fed through from one input connector to both channels’ ADCs in parallel to get twice the sampling rate. Then the other input connector is routed through the same pair of ADCs and so on in a cycle. At any one time, the unused input connector and preamplifier chain is set to the highest voltage (lowest gain) condition to avoid injecting crosstalk onto the live channel. If either channel is set to ±1 V or lower, the gain relay will cycle continuously.
To use two channels without the relay noise, set both to any voltage greater than ±1 V (±2 V to ±20 V, and they can be different).
For the smaller voltage ranges less than ±2 V (±1 V to ±50 mV) the clicking can be reduced or eliminated by increasing the scan time under the Edit Measurements section. You will need to do this for both channels.
This is inherent in the hardware design and cannot be changed or fixed in software.
PicoLog Frequently asked questions 20

Streaming at 1 ms sample time to multiple 1 megasample files
For PicoLog, you must select in the Recording dialog:
• Streaming (Single converter only) and not Real Time Continuous for the recording method.
• Repeat after Delay as the action at end of run.
• 1 second as the restart delay.
In the PicoScope2000 Streaming dialog:
• Number of Samples = 1000000
• Sample Interval = 1 (ms)
• Channel A and Channel B range must be ±2 V (or higher if you wish, but not lower).
• AC or DC as required.
When you start logging, 1 million samples per channel will be saved to the data file you have set up at 1 ms sampling. When 1 million samples are reached, a new file is started with an auto-incremented file name. This cycle will continue as long as there is hard disk space available.
Logging a 4–20 mA sensor
Below is a description on how to use an 8-bit PicoScope 2203 scope but the 10-bit PicoLog 1012 or 12-bit PicoLog 1216 would give more resolution if required.
With the PicoScope 2000 Series scopes, it would be simple for you to use a 50 Ω through-terminator for the load resistor necessary at the BNC input. This is a standard product from RS Components 546-4695, £9.80 (2016 price). It is in fact just a BNC male to female connector with a 50 Ω resistor in parallel internally. Calculating for 50 Ω, 4 mA now equals 200 mV input, and 20 mA now equals 1 V input.
Assuming you have connected up the sensor, terminator and scope, you just need to set the scaling for the channel in question. We will illustrate how to set up channel 1 for 4–20 mA operation with graph scaling from 0 bar to 10 bar.
1. Start PicoLog and set up your sample rates as required.
2. When you get to setting up channel A (PicoScope 2000 Edit Measurement):
a. Type Pressure as the Name and select ±1 V as the Voltage range.
b. Leave the Measurement as DC Volts and the Scan Time as it is.
3. Now click Options.
4. In the Parameter Options dialog, check Use parameter Formatting and type bar in the Units box. Set Field Width = 4, Decimal places = 2, Minimum value = 0 and Maximum value = 10.
5. Now click Scaling to go to the next dialog.
6. In the Parameter scaling dialog, select Table Lookup as the Scaling method and in the text box, type:
0.2 01.0 10
Note that there is a single space between the two numbers on each line.
This tells the program to equate 0.2 V to 0 bar on the graph and 1.0 V to 10 bar on the graph.
Explanation: The 0.2 is derived from 4 mA × 50 Ω = 0.2 V. The 1.0 is 20 mA × 50 Ω = 1.0 V.
7. Click OK to go back through the open boxes and channel A should now be scaled from 0 to 10 bar.
See the PicoLog User’s Guide for information on using PicoLog or click Help at any stage in PicoLog.
If you wish to use the PicoLog 1000 series it is very similar but you need to use a 120R resistor across the input channel in order to generate the following voltages at the input channel:
• 120 Ω x 4 mA = 480 mV
• 120 Ω x 20 mA = 2400 mV
PicoLog Frequently asked questions 21

UK headquarters:Pico TechnologyJames HouseColmworth Business ParkSt. NeotsCambridgeshirePE19 8YP United Kingdom
+44 (0) 1480 396 395 +44 (0) 1480 396 296 [email protected]
Errors and omissions excepted. Pico Technology and PicoLog are internationally registered trade marks of Pico Technology Ltd.
AR346-2. Copyright © 2014–2016 Pico Technology Ltd. All rights reserved. www.picotech.com
US headquarters:Pico Technology320 N Glenwood BlvdTylerTexas 75702United States
+1 800 591 2796 +1 620 272 0981 [email protected]
23. Related documentsADC-20/ADC-24 High-Resolution Data Loggers User’s Guide
ADC-20/ADC-24 Terminal Board User’s Guide
PicoLog 1000 Small Terminal Board User’s Guide
PicoLog 1000 Series User’s Guide
PicoLog CM3 Current Data Logger User’s Guide
PicoLog User’s Guide
PicoScope 2200 Series PC Oscilloscopes User’s Guide
PicoScope 2200A Series PC Oscilloscopes User’s Guide
PT-104 Data Logger User’s Guide
PT-104 Screw Terminal Adapter (PP660) User’s Guide
USB DrDAQ Data Logger User’s Guide
USB TC-08 Single-Channel Terminal Board User’s Guide
USB TC-08 Temperature Logger User’s Guide
PicoLog Frequently asked questions 22