picture of preservation 2021
TRANSCRIPT
OCTOBER 2021
2021PICTURE OF
PRESERVATIONA joint report by
the Public and Affordable Housing and Research Corporation and the National
Low Income Housing Coalition

2021 Picture of Preservation
CONTENTSPICTURE OF PRESERVATION 2021
INTRODUCTION 4
THE FEDERALLY-ASSISTED HOUSING STOCK 5
PRESERVATION RISKS 9EXIT RISK 10DEPRECIATION RISK 13APPROPRIATION RISK 14
TRENDS IN PRESERVATION 15PRESERVATION OF FEDERALLY-ASSISTED HOMES 15
THE LOSS OF FEDERALLY ASSISTED HOMES 19HOMES WITH EXPIRING SUBSIDIES 19LOSSES BEFORE SUBSIDIES EXPIRE 20FUTURE LOSSES 22
RECOMMENDATIONS AND CONCLUSION 23
APPENDIX A: EVALUATING PRESERVATION DATA 25
APPENDIX B: DATA NOTES, SOURCES, AND METHODOLOGY 27
CITATIONS 34
3
2021 PICTURE OF PRESERVATIONANDREW AURAND, PHD., MSWNLIHC Vice President for Research
DAN EMMANUEL, MSWNLIHC Senior Research Analyst
KEELY STATER, PHD.PAHRC Director of Research and Industry Intelligence
KELLY MCELWAIN, MPPPAHRC Research Analyst III
ANNA WARDPAHRC Research Analyst
ABOUT NLIHCEstablished in 1974 by Cushing N. Dolbeare, the Nation-al Low Income Housing Coalition is dedicated solely to achieving socially just public policy that assures people with the lowest incomes in the United States have af-fordable and decent homes. NLIHC educates, organizes, and advocates to ensure decent, affordable housing for everyone.
The National Low Income Housing Coalition 1000 Vermont Avenue, NW Suite 500 Washington, DC 20005 202-662-1530 www.nlihc.org
ABOUT PAHRCThe Public and Affordable Housing Research Cor-poration (PAHRC) is a non-profit research center dedicated to conducting research that promotes the national conversation about the importance of affordable housing. PAHRC spotlights the impact, outcomes, and value affordable housing brings to the families it serves and to the communities it supports, delivering data and tools that assist re-searchers, practitioners, and advocates to build an evidence-based case for why affordable housing matters.
Public and Affordable Housing Research Corporation
189 Commerce Court
PO Box 189 Cheshire, CT 06410
203-272-8220
www.pahrc.org

2021 Picture of Preservation
INTRODUCTION
T he United States faces a shortage of nearly seven million rental homes af-fordable and available to the lowest income households. As a result, 70% of extremely low-income renters whose household income is below the poverty threshold or 30% of their area median income (AMI) are severely cost-bur-
dened, paying more than half of their income on rent and utilities (NLIHC, 2021). Mean-while, federal housing subsidies provide a vital, albeit insufficient, supply of housing affordable to the lowest income renters, while state and local subsidy programs fail to adequately fill the gap. How to address this shortage of affordable housing, while managing and protecting the existing stock is a critical question for affordable housing policy.
Federally assisted rental homes eventually require renewed and sustained funding com-mitments to ensure future affordability and habitability as buildings age and existing rent and tenant eligibility requirements come up for renewal or extensions. Ensuring these commitments is the cornerstone of affordable housing preservation. Preservation is es-sential for any realistic approach to protecting the lowest-income renters and expand-ing the supply of affordable housing for them. Preservation mitigates displacement and housing instability for current tenants, prevents the loss of difficult-to-replace affordable housing, reverses disinvestment from distressed communities, presents an opportunity to reduce greenhouse gas emissions through energy retrofitting, and prevents the further decline of the already limited federally subsidized housing stock (PAHRC and NLIHC, 2020).
Using data from the National Housing Preservation Database (NHPD), this report focus-es on the challenge of preserving the federally assisted housing stock in the face of the national affordability crisis and chronic underfunding for housing programs. Based on our analysis of NHPD data, we find that:
• Nearly five million rental homes were supported by federal project-based assis-tance in 2020, which represented 10% of the US rental housing stock.
• For-profit organizations owned half of federally assisted rental homes in 2020.
• Affordability and income restrictions are set to expire for 312,446 (6%) federally assisted rental homes by the end of 2025. The majority of these homes are sup-ported by the Low Income Housing Tax Credit (LIHTC) (44%) or project-based Section 8 (42%).
• Not all homes with expiring affordability and income restrictions will be lost. Some will be preserved. Based on the percentage of homes lost in past years,
5
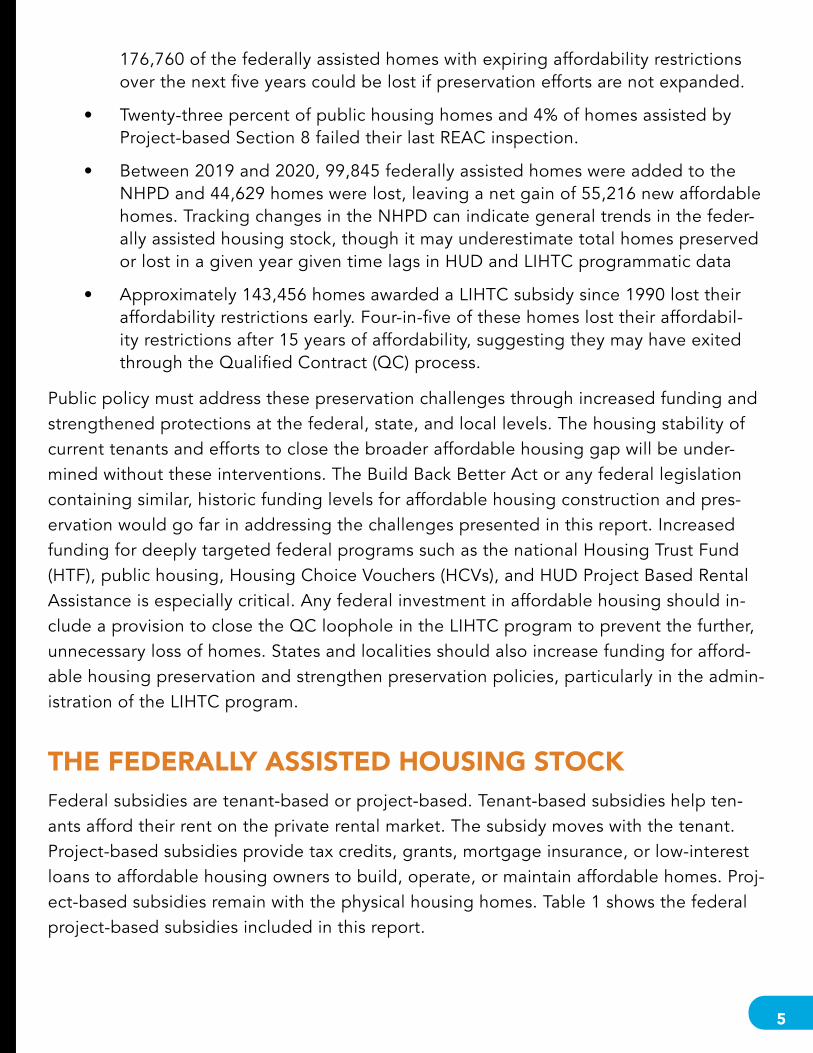
176,760 of the federally assisted homes with expiring affordability restrictions over the next five years could be lost if preservation efforts are not expanded.
• Twenty-three percent of public housing homes and 4% of homes assisted by Project-based Section 8 failed their last REAC inspection.
• Between 2019 and 2020, 99,845 federally assisted homes were added to the NHPD and 44,629 homes were lost, leaving a net gain of 55,216 new affordable homes. Tracking changes in the NHPD can indicate general trends in the feder-ally assisted housing stock, though it may underestimate total homes preserved or lost in a given year given time lags in HUD and LIHTC programmatic data
• Approximately 143,456 homes awarded a LIHTC subsidy since 1990 lost their affordability restrictions early. Four-in-five of these homes lost their affordabil-ity restrictions after 15 years of affordability, suggesting they may have exited through the Qualified Contract (QC) process.
Public policy must address these preservation challenges through increased funding and strengthened protections at the federal, state, and local levels. The housing stability of current tenants and efforts to close the broader affordable housing gap will be under-mined without these interventions. The Build Back Better Act or any federal legislation containing similar, historic funding levels for affordable housing construction and pres-ervation would go far in addressing the challenges presented in this report. Increased funding for deeply targeted federal programs such as the national Housing Trust Fund (HTF), public housing, Housing Choice Vouchers (HCVs), and HUD Project Based Rental Assistance is especially critical. Any federal investment in affordable housing should in-clude a provision to close the QC loophole in the LIHTC program to prevent the further, unnecessary loss of homes. States and localities should also increase funding for afford-able housing preservation and strengthen preservation policies, particularly in the admin-istration of the LIHTC program.
THE FEDERALLY ASSISTED HOUSING STOCKFederal subsidies are tenant-based or project-based. Tenant-based subsidies help ten-ants afford their rent on the private rental market. The subsidy moves with the tenant. Project-based subsidies provide tax credits, grants, mortgage insurance, or low-interest loans to affordable housing owners to build, operate, or maintain affordable homes. Proj-ect-based subsidies remain with the physical housing homes. Table 1 shows the federal project-based subsidies included in this report.

2021 Picture of Preservation
Table 1: Federally funded project-based subsidy programs included in this report
In 2020, nearly five million homes were assisted by the following federal programs:
Low Income Housing Tax
Credit (LIHTC)
2,485,828
Section 8*
1,408,227
Public Housing
913,326
Section 515
383,317
Section 521
272,878
HOME Invest-ment Partnerships Program (HOME)
252,576
HUD insured mortgages
155,228
Project Based Vouchers (PBVs)
128,061**
Section 538
60,448
State HFA Funded Section 236
35,605
Section 202 Direct Loans
32,887
Mod Rehab
17,553**
Note: Multiple programs can assist federally assisted homes. Tax Exempt Multifamily Housing Bonds, Community
Development Block Grants (CDBG), national Housing Trust Fund (HTF), McKinney Vento Permanent Housing, and Housing
Opportunities for Persons with AIDS (HOPEWA) are not included in this report.
*Section 8 includes any property with a project-based Section 8 contract, including Section 8 Project Based Assistance (PBRA),
Section 202 Supportive Housing for the Elderly, and Section 811 Supportive Housing for Persons with Disabilities.
**This is underestimated since buildings with less than 11 assisted by this program are excluded due to data censoring.
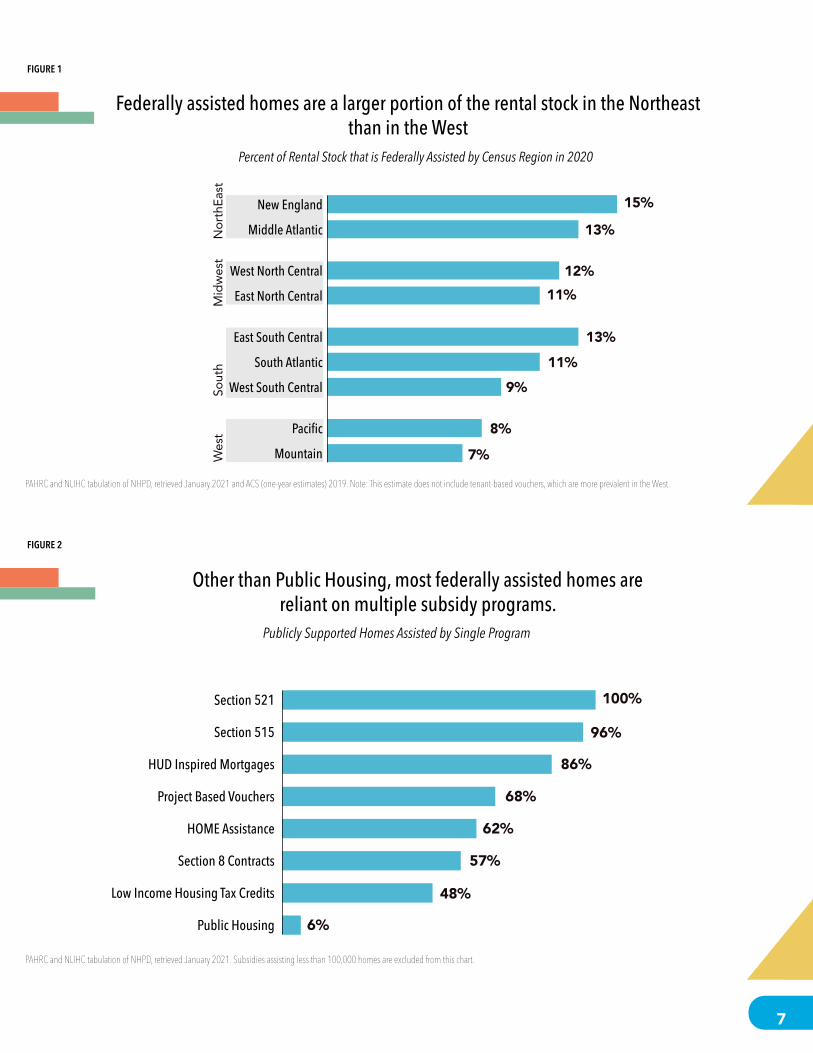
Federally assisted rental homes play a crucial role in the social safety net by making housing affordable to the lowest income families. Communities where HUD-assisted housing comprises a larger share of the rental stock have a lower share of extreme-ly low-income renters who are severely cost burdened (NLIHC, 2021). Nearly 5 million affordable rental homes are supported by federal project-based programs, which rep-resents 10% of the US rental housing stock. Federally assisted homes make up a larger portion of the rental stock in New England, East South Central, and the Middle Atlantic, and a smaller portion of the rental stock in the West (see Figure 1).
LIHTC supports half of the federally assisted housing stock, making it the largest pro-gram, followed by project-based Section 8 (28%), public housing (18%), and Section 515 Rural Rental Housing Loans (8%). Since some subsidies only provide a portion of the funding needed to build or maintain affordable homes, 40% of federally assisted homes rely on funding from multiple subsidy programs. The percent of homes assisted by mul-tiple subsidy types varies, depending on program requirements and the depth of assis-tance provided. Homes assisted by public housing are the least reliant on multiple sub-sidy programs, while about half or more of affordable rental homes supported by other federal programs are reliant on multiple subsidy sources (see Figure 2). For instance, Section 521 rental assistance is only awarded to properties that also have a Section 515 mortgage.
7
Mountain
Pacific
West South Central
South Atlantic
East South Central
East North Central
West North Central
Middle Atlantic
New England 15%
13%
12%
13%
11%
11%9%
8%
7%
Nor
thEa
stM
idw
est
Sout
hW
est
Federally assisted homes are a larger portion of the rental stock in the Northeast than in the West
Percent of Rental Stock that is Federally Assisted by Census Region in 2020
PAHRC and NLIHC tabulation of NHPD, retrieved January 2021 and ACS (one-year estimates) 2019. Note: This estimate does not include tenant-based vouchers, which are more prevalent in the West.
FIGURE 1
100%
96%
86%
62%
68%
57%
48%
6%
Other than Public Housing, most federally assisted homes are reliant on multiple subsidy programs.
Publicly Supported Homes Assisted by Single Program
Public Housing
Low Income Housing Tax Credits
Section 8 Contracts
HOME Assistance
Project Based Vouchers
HUD Inspired Mortgages
Section 515
Section 521
PAHRC and NLIHC tabulation of NHPD, retrieved January 2021. Subsidies assisting less than 100,000 homes are excluded from this chart.
FIGURE 2
2021 Picture of Preservation
Federally assisted rental homes vary in affordability. Properties assisted by public hous-ing, Section 521, project-based Section 8, Mod Rehab, and Project Based Vouchers (PBVs) base tenants’ rent contribution on a percentage of their income, making them af-fordable to the lowest income families. These homes account for 55% of the federally as-sisted rental stock. The remaining federally assisted homes can charge flat rents typically affordable to households at the upper threshold of income eligibility, which is typically an income between 50% and 65% of AMI. Rents are not determined by the occupants’ incomes. Federally assisted homes with rents tied to AMI account for a growing portion of the subsidized housing sock, increasing 2% since 2019.
The funding mechanisms also vary. Programs such as LIHTC, Section 515, Section 202 Direct Loans, HOME, and Section 538 provide low interest loans, tax credits, or grants to build or preserve affordable housing. In exchange, the owner must keep the proper-ty affordable for a set period of time. These subsidies are non-renewable. Once these affordability commitments expire, the owner must compete for new funding to remain affordable once their affordability restrictions expire or new capital needs arise. As LI-HTC continues to comprise a larger portion of the federally assisted housing stock, the portion of properties assisted by non-renewable subsidies has increased. Forty-seven percent of federally assisted homes are assisted by non-renewable subsidies, up 2% from 2019. The remainder of properties are assisted by programs that provide renewable op-erating subsidies, such as project-based Section 8, Project Based Vouchers (PBVs), and public housing, which help owners maintain affordable homes. Most owners of properties assisted by these renewable rental assistance contracts choose to continually renew their assistance and continue to remain affordable (Ray et al., 2015).
The subsidies used to build and preserve affordable housing, and their related incentives and requirements, have evolved with shifting policy priorities. While many of the earlier subsidy programs created between the 1930s and 1980s such as public housing, the Sec-tion 8 Loan Management Set-Aside (LMSA) program, the Section 221(d)(3) Below Market Interest Rate (BMIR) program no longer fund the construction of new affordable homes, the properties they assisted continue to remain affordable until their affordability com-mitments expire, which typically ranges from 20 to 40 years depending on the program. Once their affordability commitments expire, these properties are either lost from the affordable housing stock or are refinanced if funding is available. Public housing contin-ues to be maintained through regular appropriations from Congress, though these funds have not fully covered the cost over the years.
For-profit organizations continue to take a larger ownership role of federally assisted homes as a result of these shifting policy priorities. Since the 1960s, the government
Preservation risks are factors that increase the likelihood that federally assissted rental homes are lost from the affordable rental stock
Exit Risk Depreciation Risk Appropriations Risk
Expiration or termination of affordability restrictions
Declining financial or physical condition of
properties
Insufficient Congressional Funding
Figure 3: Preservation Risk Factors

9
began moving away from public ownership of affordable housing and started offering subsidies to incentivize private developers, both for-profit and non-profit, to build and operate affordable housing (McClure & Johnson, 2014). Recently, for-profit developers have played a larger role in the development of new affordable housing. Seventy-eight percent of LIHTC properties built between 1987 and 2013 were produced by for-profit developers (Lew, 2015). As of 2020, for-profit organizations own half of federally assisted homes, while non-profits and public housing agencies (PHAs) own 39%. The remaining 11% have unknown ownership types. The number of homes owned by for-profit organiza-tions increased 2% since 2019.
PRESERVATION RISKSPreservation risks, stemming from expiring affordability restrictions, underfunding, or dis-repair put federally assisted rental homes at risk of being lost from the affordable hous-ing stock. Reina (2018) characterizes preservation risks as falling into three categories: exit, depreciation, or appropriations risks. These risks can be interrelated and their appli-cability varies across federal project-based subsidy programs. See Figure 3 for a descrip-tion of the preservation risks covered in this report.
Preservation risks are factors that increase the likelihood that federally assissted rental homes are lost from the affordable rental stock
Exit Risk Depreciation Risk Appropriations Risk
Expiration or termination of affordability restrictions
Declining financial or physical condition of
properties
Insufficient Congressional Funding
Figure 3: Preservation Risk Factors

2021 Picture of Preservation
Exit Risk
Exit risk results from affordability restrictions that can expire or policies that enable prop-erty owners to exit affordability restrictions early. In exchange for receiving a federal proj-ect-based subsidy, property owners typically agree to affordability and eligibility restric-tions for a set period of time. The duration of these restrictions is determined prior to the awarding of a one-time capital subsidy, tied to the payment of a mortgage, or subject to the renewal of a rental assistance contract. Affordability restrictions are set to expire for 312,446 (6%) federally assisted rental homes by the end of 2025 (see Figure 4). LIHTC (44%) and project-based Section 8 (42%) currently account for most of these homes. The portion of expiring properties assisted by LIHTC rose 33% since last year and is expected to continue rising towards the end of the decade as the earliest properties assisted by the LIHTC continue to expire. Homes with upcoming subsidy expirations are concentrat-ed in the Midwest and West.
While many properties will renew their assistance or secure new funding to remain afford-able, properties in strong housing markets owned by profit-minded owners are at great-er risk for converting to market-rate housing (Ray, Kim, Nguyen, & Choi, 2015; Reina & Begley, 2014; Finkel, Hanson, Hilton, Lam, & Vandawalker, 2006; Melendez, Schwartz, &
Affordability restrictions are set to expire for 745,017 federally as-sisted homes in the next ten years
Publicly Supported Homes with Affordability Restrictions Expiring by 2031
2021 2022 2023 2024 2025 2026 2027 2028 2029 2030
63,274107,560
158,810229,982
312,466381,101
449,502
528,969
636,290
745,017
LIHTC
Section 8
All Others
Overall
PAHRC and NLIHC tabulation of NHPD, retrieved January 2021. Note: All others include units funded by Section 515, Section 514, Section 538, state HFA funded Section 236, Section 202 direct loans, state subsidies, HOME assistance, and units funded by multiple programs. Properties are excluded if their latest subsidy end date is after 2030.
FIGURE 4
11
Montrichard, 2008). Among homes with upcoming affordability restriction expirations, 8% have profit-driven owners and are in neighborhoods we identify as high or very high risk1 for exit. An additional 66% of homes with upcoming expiring affordability restrictions are in neighborhoods identified as low or very low risk for exit, but may face grater challeng-es with depreciation risk. Findings presented in The Loss of Federally Assisted Homes section of this report describe the characteristics of federally assisted homes lost from the NHPD in 2020 and use these trends to project how many homes facing affordability restrictions in the next five years could be lost if homes continue to be lost at the same rate as previous years.
Competition for scarce funds also threatens the affordability of properties with expiring subsidies. While most properties assisted by project-based Section 8 contracts are re-newed upon expiration and continue to remain affordable (Ray et al., 2015), a growing portion of the housing stock is assisted by nonrenewable subsidies such as LIHTC. Own-ers of these properties must compete for new subsidies to keep their property affordable and in good condition. Nonrenewable subsidies assist 59% of federally assisted homes with affordability restrictions expiring in the next five years compared to 47% last year. Federally assisted homes have tight operating margins and limited reserves to cover growing maintenance costs of aging buildings without continued support. Among homes with expiring subsidies, 79% haven’t received a new capital subsidy in the past 20 years and are likely to have outstanding capital needs.
Overall, 60% of federally assisted homes with expiring affordability restrictions demon-strate two or more preservation risk factors. Risk factors include a lack of capital subsidies received in the past 20 years, for-profit ownership, a pre-1975 construction date, and failing REAC scores for project-based Section 8 homes. The number of expiring homes demonstrating two or more risk factors is higher than last year, rising 9%.
Properties without soon-to-expire affordability restrictions also face exit risk if their owners are eligible to opt out of their restrictions early or prepay their mortgage. A de-scription of the programs and provisions that enable property owners to opt of out af-fordability restrictions early are included in Table 2. These provisions resulted in the loss of between 65,000 and 114,000 homes assisted by LIHTC since 1990 (NCSHA, 2019; PAHRC and NLIHC, 2021), 28,475 homes assisted by Section 515 mortgages between 2001 and 2016 (HAC, 2018), 4,439 homes assisted by Section 202 direct loans between
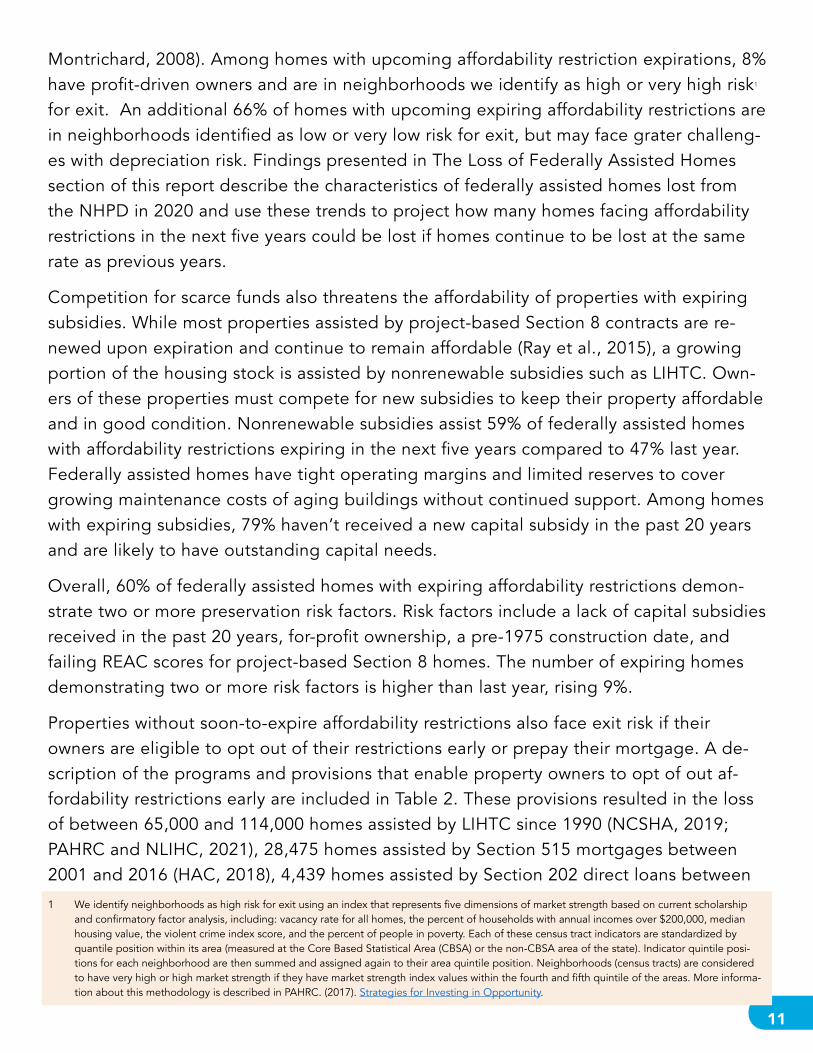
1 We identify neighborhoods as high risk for exit using an index that represents five dimensions of market strength based on current scholarship and confirmatory factor analysis, including: vacancy rate for all homes, the percent of households with annual incomes over $200,000, median housing value, the violent crime index score, and the percent of people in poverty. Each of these census tract indicators are standardized by quantile position within its area (measured at the Core Based Statistical Area (CBSA) or the non-CBSA area of the state). Indicator quintile posi-tions for each neighborhood are then summed and assigned again to their area quintile position. Neighborhoods (census tracts) are considered to have very high or high market strength if they have market strength index values within the fourth and fifth quintile of the areas. More informa-tion about this methodology is described in PAHRC. (2017). Strategies for Investing in Opportunity.

2021 Picture of Preservation
2012 and 2019, 212,152 homes assisted by Section 236 mortgages, and 87,454 homes assisted by Section 221(d)(3) mortgages.
Table 2: Provisions that enable property owners to opt out of affordability restrictions early
Program Provision Homes Currently Eligible Homes Lost
LIHTC
After 15 years of affordability, owners can submit a Qualified Contract (QC). If the state HFA is unable to
find a buyer for the property within one year at the QC price who will maintain the property as affordable, the
affordability restrictions phase out.
Up to 1.2 million1
Between 65,500 and 114,000
homes2
Section 515
Owners can prepay Section 515 mortgages originated before December 21, 1979 at any time after they com-plete the steps outlined in the Emergency Low-Income Housing Preservation Act (ELIHPA). Owners with loans originated between December 21, 1979 and Decem-ber 15, 1989 can also prepay their mortgage at any
time, but they must continue their offering affordabil-ity restrictions for the remainder of the restricted use
provision. When the mortgage is prepaid, any Section 521 rental assistance tied to the property is lost.
150,000 homes in 2016328,475 homes between 2001-
20163
Section 202
In some cases, owners can prepay Section 202 direct loans, however, these prepayments can be used as a preservation tool since they can enable the property owner to refinance the property and make it eligible
to receive Tenant Protection Vouchers.
N/A4,439 homes
between 2012 and 20204
Section 236
In some cases, for-profit owners can prepay Section 236 mortgages after 20 years.
N/A 212,152 homes
Section 221(d)(3)
BMIR
In some cases, for-profit owners can prepay Section 221(d)(3) BMIR mortgages after 20 years.
N/A 87,454 homes
Note: 1PAHRC and NLIHC tabulation of NHPD, retrieved January 2021. 2(NCSHA, 2019) and PAHRC and NLIHC tabulation of
LIHTC Database, retrieved January 2020 (see Appendix B – Section 4b). This estimate only includes LIHTC assisted homes lost
15 or more years early. 3(HAC, 2018). 4PAHRC and NLIHC tabulation of Section 202 Direct Loan Database. See Appendix B–
Section 1a for more information

13
Depreciation Risk
Depreciation risk refers to threats to the physical quality of federally assisted rental homes. Federally assisted homes operate on tight margins to meet program eligibility and affordability requirements (Khadurri et al., 2012; Blumenthal, Jordan, Clark, Handel-man, & King, 2016). As a result, these properties can fall into disrepair if costs or rental income deviate from projections or if appropriated funding is inadequate. Federally assisted rental homes typically require ongoing operating support, subsequent capital infusion, or both, to maintain viability. Older properties assisted by public housing, proj-ect-based Section 8, Section 515, and LIHTC are vulnerable to depreciation risk (Reina, 2018). Approximately 233,000 public housing homes were lost due to disrepair and not replaced between 1996 and 20202 , while 23,689 homes assisted by project-based Sec-tion 8 contracts were lost due to foreclosure or poor property conditions between 2005 and 2014 (Ray et al., 2015). Damage from natural hazards is also a depreciation risk (Re-ina, 2018).
Data on physical quality is available for public housing and Section 8 HUD Multifamily assisted properties through REAC scores. Inspectors assign a REAC score based on the frequency and severity of housing quality and safety deficiencies observed while examin-ing the building exterior, systems, and a sample of homes at each property. Twenty-three percent of public housing homes and 4% of homes assisted by project-based Section 8 scored below 60 and failed their last REAC inspection. Ten percent of homes assisted by public housing and 2% assisted by project-based Section 8 failed at least two of their past three inspections and likely face higher depreciation risk. These properties likely re-quire immediate investment to cover outstanding maintenance deficiencies and provide safe and healthy living conditions for residents.
The full scope of depreciation risk for the federally assisted housing stock is uncertain since 51% of homes are not required to collect housing quality data. Newman & Holupka (2017) analyzed nationally representative surveys of occupants of federally assisted hous-ing. They found that the quality of federally assisted housing is comparable to the pri-vate rental market, suggesting that many owners fix deficiencies identified during failed REAC inspections. Older properties assisted by Section 515 and LIHTC face mounting maintenance costs, suggesting that they also face high depreciation risk (Khadduri et al., 2012; Housing Assistance Council, 2008; RSM & CoreLogic, 2016; Belsky & Nipson, 2010). While comprehensive housing quality data isn’t available for these programs, 72% of Section 515 assisted homes and 23% of LIHTC assisted homes are older than 20 years
2 PAHRC and NLIHC tabulation of Picture of Subsidized Households 1996-2020 and HUD’s Properties Participating in RAD Program data that closed their RAD conversion through 2020.
2021 Picture of Preservation
and likely require capital investment to keep up with routine maintenance.
Appropriations Risk
Appropriations risk refers to insufficient federal appropriations for housing programs, which threatens long-term affordability and quality of federally assisted homes. Afford-able housing requires continual investment in operating assistance and subsequent capi-tal subsidies to prevent its los through exit or depreciation.
Properties receiving operating subsidies, such as project-based Section 8 and public housing, operate at a deficit if Congress fails to appropriate sufficient funds to cover their operating and capital expenses. As a result, they may fall behind on maintenance, posing a health and safety risk to residents, or be unable to assist the lowest income families (Blumenthal, Jordan, Clark, Handelman, & King, 2016). Public housing proper-ties face the largest appropriations risk. The public housing program experienced some of the largest funding cuts among housing programs between 2010 and 2020 and has been appropriated insufficient operating funds most years year since 2002, contributing to a capital needs backlog between $35 and $70 billion (Finkel et al., 2010; Stout et al, 2019; CBPP, 2017). Appropriations for Section 8 PBRA, on the other hand, increased 74% between FY 2007 and FY 2021 even after adjusting for inflation. Appropriations for Sec-tion 8 PBRA have also increased above inflation year-over-year all but four years since FY 2007 and every year since FY 2018. Reina (2018), however, notes that flat tenant incomes and a growing reliance on Section 8 conversions of public housing in the RAD program will necessitate even larger appropriations for Section 8 PBRA.
There are some signs that the funding situation is improving for public housing. Although inflation-adjusted appropriations were down 7% and 3% in FY 2021 since FY 2007 for the Public Housing Capital and Operating Funds, respectively, there is growing support for the program among some members of Congress. The FY 2018 budget included a 39% increase for the Public Housing Capital Fund over FY 2017 levels after adjusting for in-flation, a level of funding not seen since FY 2010. Recently proposed legislation, such as the Build Back Better Act, has also centered on historic investments for the preservation of public housing and there is interest in repealing the Faircloth Amendment, which has effectively prevented new construction in the program.
Federally assisted properties that received capital subsidies are also at risk of experi-encing exit and depreciation risk if adequate funding isn’t available to recapitalize these properties as they age. The LIHTC program is a significant source of funding for recap-italization. However, a shortage of gap financing or changes in investor demand for tax

15
credits can limit the effectiveness of LIHTC as a tool to preserve affordable housing (Scal-ly et al. 2018; Mortgage Professional America, 2020; Scally, Champion, & Neal, 2020; Novogradac, 2020). While LIHTC funds aren’t subject to congressional appropriations, these conditions can make tax credits more difficult to use. The LIHTC program relies on demand from investors to finance the construction or preservation of affordable housing in exchange for tax benefits. With the promise of tax cuts after the 2016 election, the price investors were willing to pay for tax credits dropped about 10 percent, limiting the number of properties that could be built or preserved through the program (Kneebone & Reid, 2021). Since then, LIHTC affordable housing investment has remained stable throughout the pandemic, but could possibly increase, due to low interest rates, strong rent collections, and a new policy that increased the amount of money awarded to devel-opers receiving four percent tax credits (Novogradac, 2021).
The national Housing Trust Fund (HTF) is another federal source of capital subsidy. Unlike LIHTC, the HTF provides block grants directly to states for the construction, rehabilita-tion, or preservation of housing targeted to the lowest income households. Current HTF funding is not a function of investor demand for tax credits or political will in Congress for annual appropriations. The HTF has a dedicated source of funding outside of the Congressional appropriations process based on an annual assessment of 4.2 basis points (0.042%) on the volume of business of Freddie Mac and Fannie Mae. It can also receive allocations of funding from Congress and take on new dedicated funding streams. The HTF’s dedicated, budget-neutral funding stream and diversity of possible funding sourc-es mitigates against appropriations risk. Though the HTF’s annual funding levels are growing, they remain inadequate to meet the need.
TRENDS IN PRESERVATIONPRESERVING FEDERALLY ASSISTED HOMESAffordable housing preservation efforts rely on subsidies that preserve affordability and provide owners with funding to meet outstanding capital needs. Federally funded pro-grams commonly used for preservation are listed in Table 3. At least 129,819 federally assisted homes were preserved in recent years using federal resources.3 These preser-vation efforts addressed both exit and depreciation risks that threatened the long-term affordability and quality of these homes. Federal resources are frequently supplemented by state and local housing programs, such as tax-exempt bonds, tax abatements, and housing trust funds. 3 Many of these homes were preserved prior to 2020, but their new subsidies weren’t added to the NHPD until 2020 due to data lags. These
estimates do not include properties preserved by state funded programs and federally funded programs with unavailable property data, such as national HTF and CDBG. See Appendix B for more information.

2021 Picture of Preservation
Table 3: Federally funded preservation tools
Preservation is the act of awarding a subsidy to a federally assisted rental property so that it continues to remain affordable and habitable to low-income families.
At least 129,819 federally assisted homes were preserved in recent years using federal resources.
The following federally funded programs can be used to support preservation efforts.
Preservation Tool DescriptionAffordable Homes
Preserved in Recent Years
Low Income Housing
Tax Credit (LIHTC)
Tax credit program that finances the construction and preservation of affordable
housing for low-income households.51,741 homes
HUD insured
mortgage
Low interest mortgage that finances the construction and preservation of
affordable housing for low-income households.47,612 homes
Rental Assistance
Demonstration (RAD)
Program that converts the funding source for public housing and Mod Rehab
properties and provides new flexibilities to acquire private capital.17,324 homes*
Section 202 Capital
Advance
Capital advance funds that finance the construction, rehabilitation, and acquisition
of supportive rental homes for very low-income elderly households.5,664 homes
Section 811 Capital
Advance
Capital advance funds that finance the construction, rehabilitation, or acquisition
of supportive rental homes for very low-income disabled households.
HOME Investment
Partnership (HOME)
Block grant that finances activities to increase and preserve the supply of
affordable housing for low-income households.4,178 homes
Section 515 Low interest loan for multifamily properties in rural areas. 4,170 homes
Section 538Guaranteed loans to support the construction and preservation of affordable
housing for low to moderate income households.3,819 homes
Multifamily Housing
Preservation and
Capital advance funds that finance the construction, rehabilitation, and acquisition
of supportive rental homes for very low-income elderly households.Not available
Revitalization (MPR)
demonstration
program
Mortgage restructuring program for properties with Section 515 and 514
mortgages. This program can provide grants, no interest loans, and debt deferral
to property owners.
3,657 homes
Project-based Section
8 (non-RAD)
Operating subsidy to maintain affordable housing for extremely low-income
families. 3,468 homes
Mark-to-MarketMortgage restructuring program that targets FHA-insured properties with expiring
Project-based Section 8 with contracts contract rents that exceed market rents.54 homes
Community
Development Block
Grant (CDBG)
Block grant that finances activities benefiting households with low and moderate
incomes that improve housing, living environments, and economic opportunity.
Property level data not
available
National Housing
Trust Fund
Block grant that finances the construction, rehabilitation, and preservation of
affordable housing for extremely low-income households.
Property level data not
available
Project Based
Vouchers (PBVs)Rental assistance tied to a unit at a property.
Property level data
outdated
PAHRC and NLIHC tabulation of NHPD, retrieved January 2021 and January 2020. Affordable homes may be preserved by multiple
programs. See Appendix B – Section 3a for more information. *Only includes homes that converted through Section PBRA.

17
LIHTC continues to be the largest program responsible for financing the preservation of federally assisted homes. 51,741 federally assisted homes were preserved using LIHTC in recent years. Among the 68,764 homes assisted by tax credits placed in service in 2015, 39% were awarded to preserve 26,822 federally assisted homes.
HUD insured mortgages, which provide low interest loans, helped preserve 47,612 fed-erally assisted homes in recent years. While these mortgages provide less financial assis-tance to support preservation than a grant or tax credit, they indicate that the property has been refinanced.
The Rental Assistance Demonstration (RAD) program converts older public housing and Mod Rehab properties to more stable funding sources and provides new flexibilities to acquire private capital (Stout, Clogston, Thackeray, Stoloff, Anthony, 2019). Since January 2021, 145,205 federally assisted homes closed through RAD and converted to Section 8 PBRA or PBV funding streams.4 In recent years, 17,324 homes were preserved through RAD Section 8 PBRA funding streams. RAD does not provide new funding to support preservation efforts. Instead, RAD lifts restrictions on PHAs and allows them to leverage private debt and equity and seek funding from other housing subsidy programs. At least 44% of federally assisted homes that closed through RAD received LIHTC financing. This budget neutral funding model, however, leaves fewer resources for other preservation needs and the construction of new affordable housing. Estimates suggest that if current trends continue, RAD conversions will account for three-fifths of 4% tax credits and one-fifth of 9% tax credits over the next decade (Schwartz & McClure, 2021). Additionally, a GAO investigation found that RAD-converted Section 8 PBRA homes generally have low-er contract rents than traditional Section 8 PBRA homes, which limit the number of public housing properties that can be preserved through this program (GAO, 2018).
Rental assistance provided by new or renewed Project-based Section 8 contracts and newly awarded PBVs also support preservation efforts by stabilizing the operating in-come of affordable homes. Rental assistance can make it feasible for owners to operate affordable housing in high-cost markets for hard-to-serve populations who otherwise would not afford the rent. This assistance can also ensure the long-term financial viabili-ty of properties located in weaker housing markets by providing owners with additional revenue to address capital needs of aging buildings (Dewar, Deng, & Bloem, 2020). Just 0.3% of homes assisted by project-based Section 8 contracts set to expire in 2019 were not renewed. Funding from Section 202 or 811 Capital Advances, Mark-to-Market re-structuring, and other project-based subsidies can provide additional funding to finance rehabilitation costs and supplement contract renewals. In recent years, 5,664 homes 4 PAHRC and NLIHC tabulation of Properties Participating in RAD Program data, retrieved February 2020.
2021 Picture of Preservation
were preserved using Section 202 or 811 Capital Advances and just 54 were preserved through new Mark-to-Market restructuring. An additional 3,468 homes were preserved after being awarded new project-based Section 8 contracts outside of the RAD program. While a complete estimate of homes preserved by PBVs is unavailable, approximate-ly 31% of homes assisted by PBVs which address data is available for were awarded to properties that have been affordable for at least 20 years. Thirty-seven percent of PBVs awarded to properties affordable for 20 years or more are in former public housing prop-erties that converted to PBVs through RAD.
HOME supports preservation efforts by providing states with block grants to finance the construction and rehabilitation of affordable homes. HOME preserved 4,178 homes in re-cent years. Among the 13,283 homes newly awarded HOME subsidies in 2017, 22% were awarded to preserve 2,924 federally assisted homes.
Section 515, the Multifamily Housing Preservation and Revitalization (MPR) demonstra-tion program, Section 521, and Section 538 Guaranteed Loans are integral to preserving affordable homes in rural areas. MPR provides grants, no interest loans, debt deferral, and mortgage restructuring to owners of older properties assisted by Section 515 and 514. MPR preserved 3,657 homes in recent years. Low-interest Section 515 mortgages, Section 538 Guaranteed Loans, and additional rental assistance through Section 521 also support preservation efforts. New, transferred, or consolidated Section 515 mortgages supported the preservation of 4,170 homes in rural areas in recent years. Section 538 Guaranteed Loans supported the preservation of 3,819 homes in recent years. Limited data is available on how many properties have been awarded Section 521 rental assis-tance as a preservation tool.
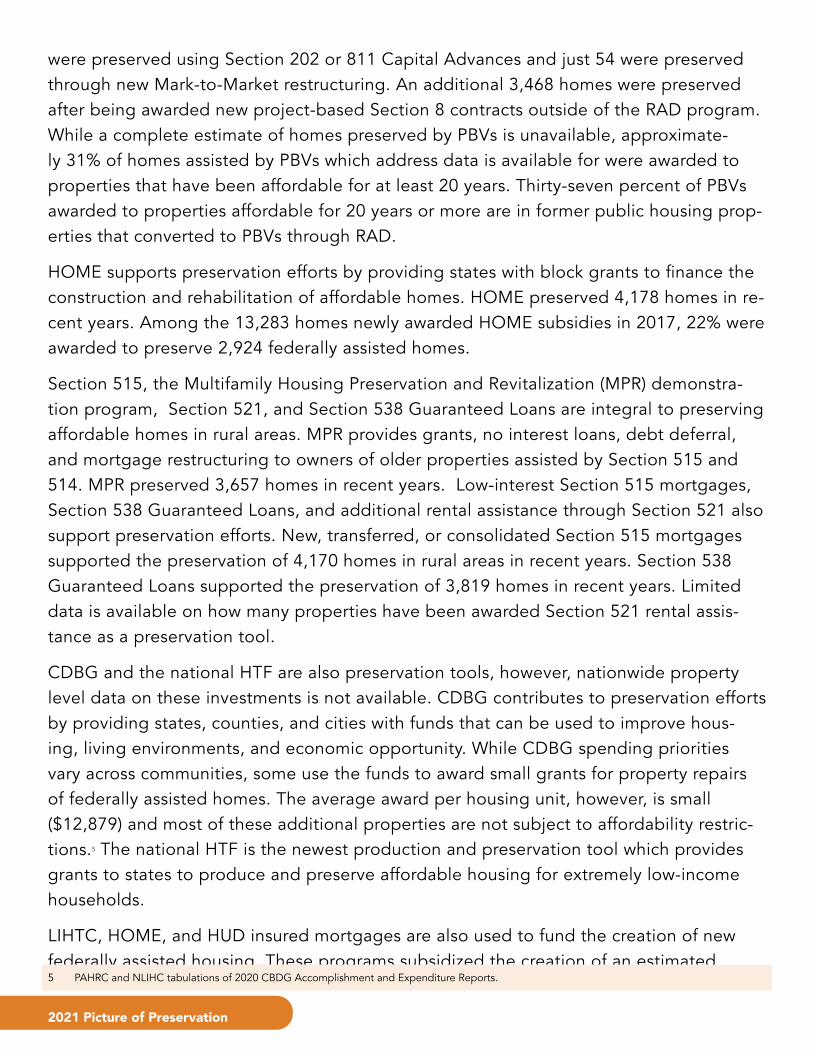
CDBG and the national HTF are also preservation tools, however, nationwide property level data on these investments is not available. CDBG contributes to preservation efforts by providing states, counties, and cities with funds that can be used to improve hous-ing, living environments, and economic opportunity. While CDBG spending priorities vary across communities, some use the funds to award small grants for property repairs of federally assisted homes. The average award per housing unit, however, is small ($12,879) and most of these additional properties are not subject to affordability restric-tions.5 The national HTF is the newest production and preservation tool which provides grants to states to produce and preserve affordable housing for extremely low-income households.
LIHTC, HOME, and HUD insured mortgages are also used to fund the creation of new federally assisted housing. These programs subsidized the creation of an estimated 5 PAHRC and NLIHC tabulations of 2020 CBDG Accomplishment and Expenditure Reports.

19
99,845 new homes identified in 2020 HUD and NHPD data (see Appendix B – Section 3c for methodology). An estimated 44,629 homes were identified lost in the 2020 NHPD data, resulting in a net gain of 55,216 homes in the federally assisted stock. While some homes added to the NHPD in 2020 were likely built a few years earlier, tracking changes in the NHPD can provide a glimpse into how the affordable housing stock is changing overtime. This gain was led by homes financed with LIHTC: 75% of the new homes were funded by LIHTC followed by project-based Section 8 (8%), HUD insured mortgages (7%), HOME (3%). CDBG and the national HTF are also used to fund the construction of new federally assisted homes, but nationwide property level information on these invest-ments are not available.
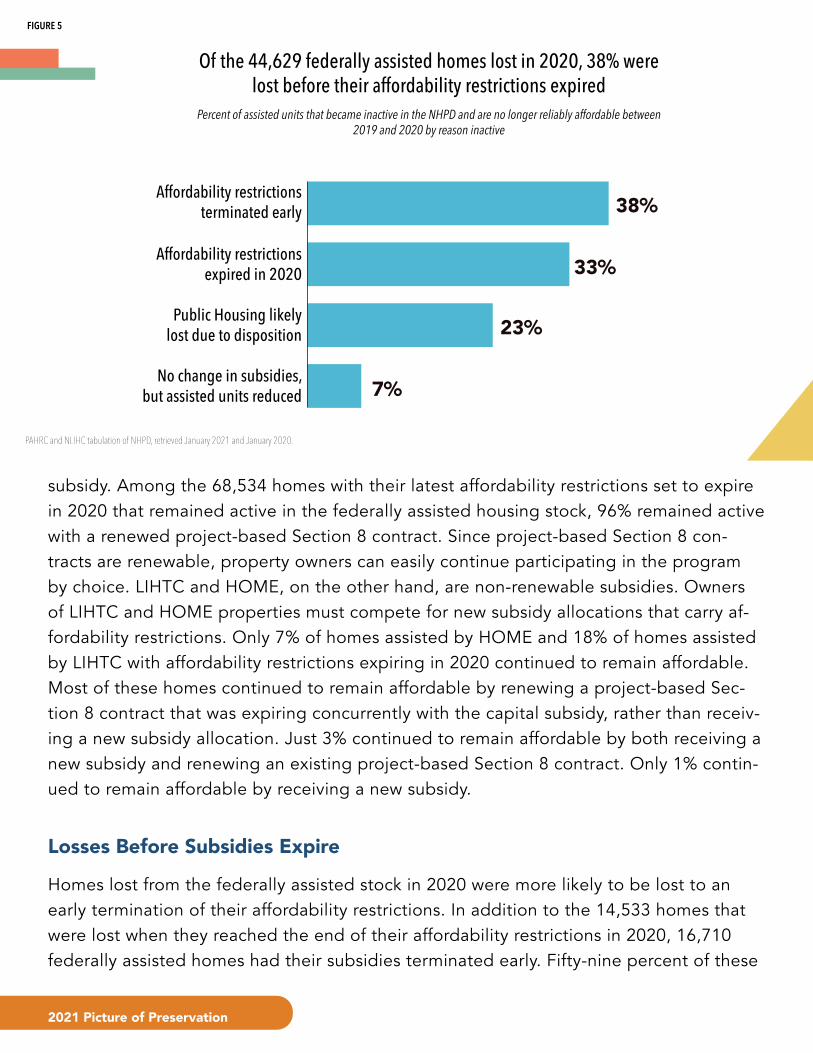
THE LOSS OF FEDERALLY ASSISTED HOMESNumerous federal housing programs preserve and expand the affordable housing stock, but exit, depreciation, and appropriations risks continue to result in losses of afford-able housing. We estimate 44,629 homes were dropped from the NHPD between 2019 and 2020, indicating these homes were lost from the affordable housing stock in recent years (see Appendix B – Section 3c for methodology). While NHPD is a comprehensive inventory of the federal housing stock, some subsidies experience a lag in being report-ed in to the NHPD. Thirty-three percent of these homes were lost when their subsidies expired, 38% were lost from the stock when their subsidies were terminated early, and 23% were public housing homes lost through demolition or disposition (not repositioned under RAD) (Figure 5). Thirty-two percent (14,433) of the homes lost were supported by LIHTC, 15% (6,603) were supported by HOME, 12% (5,349) by project-based Section 8, 5% (2,415) by Section 515, 5% (2,215) by HUD Insured mortgages, and 3% (1,382 by Section 202 direct loans.6
Homes with Expiring Subsidies
An estimated 14,533 federally assisted homes were lost when their affordability restric-tions expired. Of the homes lost by the expiration of their affordability restrictions, 6,394 (44%) were assisted by HOME, 3,894 (32%) by LIHTC, and 2,644 (12%) by project-based Section 8. The remaining 1,620 homes lost from the stock when their subsidies expired were assisted by Section 202 Direct Loans (3%), state funded subsidies (3%), Section 515 (1%), and Section 514 (0.3%).
While 85% of federally assisted homes with their latest affordability restrictions expir-ing in 2020 continued to remain affordable, very few of these properties received a new 6 These values add up to more than the total because some properties were assisted by multiple programs.
2021 Picture of Preservation
subsidy. Among the 68,534 homes with their latest affordability restrictions set to expire in 2020 that remained active in the federally assisted housing stock, 96% remained active with a renewed project-based Section 8 contract. Since project-based Section 8 con-tracts are renewable, property owners can easily continue participating in the program by choice. LIHTC and HOME, on the other hand, are non-renewable subsidies. Owners of LIHTC and HOME properties must compete for new subsidy allocations that carry af-fordability restrictions. Only 7% of homes assisted by HOME and 18% of homes assisted by LIHTC with affordability restrictions expiring in 2020 continued to remain affordable. Most of these homes continued to remain affordable by renewing a project-based Sec-tion 8 contract that was expiring concurrently with the capital subsidy, rather than receiv-ing a new subsidy allocation. Just 3% continued to remain affordable by both receiving a new subsidy and renewing an existing project-based Section 8 contract. Only 1% contin-ued to remain affordable by receiving a new subsidy.
Losses Before Subsidies Expire
Homes lost from the federally assisted stock in 2020 were more likely to be lost to an early termination of their affordability restrictions. In addition to the 14,533 homes that were lost when they reached the end of their affordability restrictions in 2020, 16,710 federally assisted homes had their subsidies terminated early. Fifty-nine percent of these
Of the 44,629 federally assisted homes lost in 2020, 38% were lost before their affordability restrictions expired
Percent of assisted units that became inactive in the NHPD and are no longer reliably affordable between 2019 and 2020 by reason inactive
No change in subsidies, but assisted units reduced
Public Housing likely lost due to disposition
Affordability restrictions expired in 2020
Affordability restrictions terminated early 38%
33%
23%
7%
PAHRC and NLIHC tabulation of NHPD, retrieved January 2021 and January 2020.
FIGURE 5

21
homes were assisted by LIHTC, followed by Section 515 (13%), HUD insured mortgages (12%), project-based Section 8 (7%), Section 514 (4%), Section 202 direct loans (3%), and HOME (1%). Sixty-seven percent of these homes were owned by for-profit organizations, while 18% were owned by non-profits and 3% had multiple ownership types. The remain-ing 12% of homes were missing information on ownership type.
The premature losses incurred through the LIHTC program are significant, but not a new phenomenon. We estimate as many as 143,456 federally assisted homes awarded a LI-HTC subsidy since 1990 were lost from the federally assisted stock prior to reaching Year
30 and the end of their federally-mandated affordability restrictions. Eighty percent of these homes lost their affordability restrictions after 15 years of affordability, suggesting they may have exited through the Qualified Contract process. Most of these homes lost their affordability restrictions 6-10 years early (see Figure 6). Meanwhile, 20% of LIHTC assisted homes lost their affordability restrictions 16 or more years early, suggesting that these properties may have experienced a foreclosure. Estimates suggest that foreclosure rates for LIHTC assisted homes is between one and two percent (Khadurri et al., 2012).

2021 Picture of Preservation
Future Losses
If current patterns hold, 176,760 federally assisted homes with affordability restrictions expiring over the next five years could be lost from the affordable housing stock if pres-ervation efforts aren’t expanded. An additional 21,954 homes not facing a subsidy expi-ration in the next year could also be lost through public housing disposition, foreclosure, or early owner opt outs if current trends persist. Whether these homes will continue to provide affordable rents in the private market is uncertain and will depend on a variety of factors including the motivations of owners, local housing market conditions, and capital needs.
Some analysts contend much of the federally assisted stock, particularly LIHTC proper-ties, will continue to offer relatively affordable rents in the private market after subsidies are terminated early or expire. While this is likely true in many cases, given this housing tends to be sited in lower-cost neighborhoods, tenants of the federally assisted stock typically are at high risk of housing instability. Even small increases in rent can be un-sustainable for them, many of whom have extremely low or fixed incomes and no rental assistance. Other important program requirements such as renting to low-income house-holds or accepting HCVs will no longer apply to owners when subsidies are terminated early or expire.
Four-in-five LIHTC assisted homes that lost their affordability restrictions early were terminated after Year 15
Number of years LIHTC assisted homes lost their affordability restrictions early
25+ years early
21-25 years early
16-20 years early
11-15 years early
6-10 years early
1-5 years early 13%
41%
26%
11%
6%
3%
PAHRC & NLIHC tabulation of HUD’s LIHTC Database 2003-2020. See Appendix B-Section 4b for more information.
FIGURE 6
23
RECOMMENDATIONS AND CONCLUSIONThe nation’s five million federally assisted rental homes are a critical, albeit inadequate, resource when there is a shortage of nearly seven million homes affordable and available to the lowest income renters. Demand for federally assisted housing, and the economic and social stability it can provide, far exceeds supply. Meanwhile the exit, depreciation, and appropriations risks detailed in this report all threaten to further erode this vital public asset. Public policy must address the preservation of federally assisted housing through increased funding and strengthened protections. Public commitments to the housing stability of current tenants and efforts to close the broader affordable housing gap will be undermined without these interventions.
Federal capital and operating subsidies should be increased to preserve and expand the existing supply of affordable housing. Priority should be given to funding programs such as the national HTF, public housing, project-based Section 8, and USDA rural rental assis-tance and preservation programs that serve the lowest income renters. Expanding HCVs could also provide additional resources to support deep affordability and operating ex-penses in properties financed with national HTF, HOME, and LIHTC funding.
President Biden’s proposed $3.5 trillion infrastructure package provides historic invest-ments for the preservation and new construction of federally assisted housing. Current legislation in Congress, the Build Back Better Act, includes $90 billion for rental as-sistance ($75 billion HCVs/$15 billion Project-Based Rental Assistance), $80 billion to preserve public housing, and $37 billion for the national Housing Trust Fund to build and preserve homes affordable to people with the lowest incomes. The legislation also includes $35 billion for the HOME Investment Partnership Program, $6 billion for the green preservation of HUD multifamily housing, $4 billion for the revitalization of dis-tressed HUD multifamily properties, $4.8 billion for rural housing, and a combined total of $10.3 billion for housing programs serving rural and tribal communities, seniors, and people with disabilities. There are also important LIHTC provisions such as a requirement that states set aside at least 10% of 9% credits for developments where at least 20% of homes serve ELI households, the reclassification of rural and Native American areas as Difficult to Develop Areas (DDAs), and a temporary 50% basis boost for LIHTC homes serving ELI households.
While investments proposed in the Build Back Better Act are historic, states and localities should still do more to expand funding for the preservation and construction of afford-able housing. Both states and localities have the power to establish and expand afford-able housing funding through housing trust funds, tax incentives, and appropriations for
2021 Picture of Preservation
housing programs. State and local programs often provide critical funding for preserva-tion and gap financing for new construction.
Policies in federally assisted housing programs must also be strengthened to protect the affordable housing stock. As this report demonstrates, over 100,000 LIHTC homes have likely been lost to QC sales since 1990. The Build Back Better Act closes the QC loop-hole for future LIHTC properties and revises the formula for determining the QC sale price to reflect actual market value for existing LIHTC properties, potentially improving states’ ability to find mission-driven buyers of LIHTC properties to preserve their afford-ability. Congress must also do more to support data collection and transparency within the LIHTC program. HUD requires housing finance agencies (HFAs), the state entities that typically allocate tax credits, to report extensive data on LIHTC tenant and property characteristics, but HFAs often provide incomplete data. Congress should direct HUD to assess and report on the funding, staff capacity, and technology needed to improve LIHTC data collection. Improved data collection will help stakeholders at the local, state, and federal levels better understand and respond to evolving preservation needs in the nation’s largest affordable housing production program. Congress should also consider ways that HUD and the IRS can better collaborate on the enforcement of data collection requirements and other issues pertaining to program oversight.
States also have a role to play in strengthening preservation policies. Half of the federal-ly assisted housing stock is owned by for-profits, a known preservation risk factor. States and localities should do more to build capacity among PHAs and non-profits to develop and operate affordable housing. LIHTC qualified allocation plans (QAPs) offer an import-ant opportunity to strengthen state-wide preservation policy. HFAs are required to de-velop QAPs, which lay out the tax credit allocation process and priorities. QAPs are open for public comment, so advocates can push to amend LIHTC QAPs to further prioritize tax credit allocations for developers and property owners committed to long-term afford-ability, set aside tax credits for priorities such as preservation, and require or incentivize affordability beyond the federal minimum of 30 years.
The current moment presents historic opportunities to invest in some of the nation’s most vital infrastructure: the federally assisted housing stock. The preservation challenges documented in this report all point to the need for bold federal, state, and local, invest-ments in the preservation of affordable housing coupled with strengthened preservation policies. These investments must be made to revitalize the current stock and protect its tenants, while providing a foundation for closing the affordable housing gap.
25
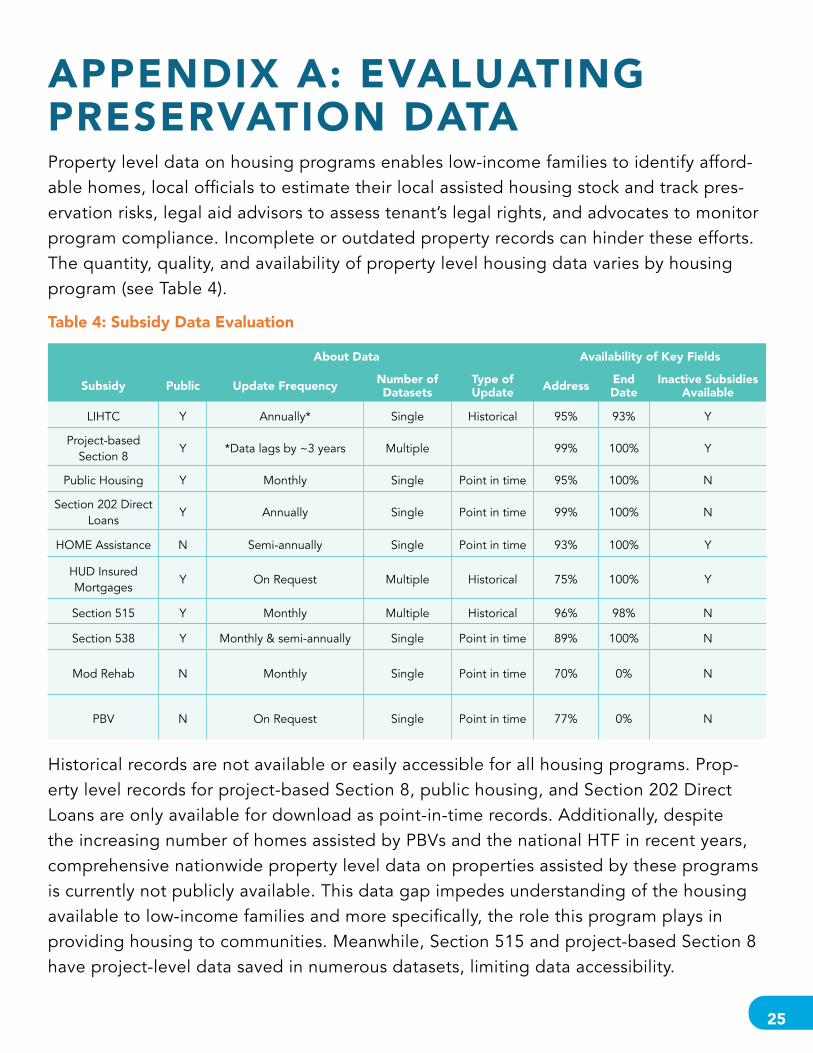
APPENDIX A: EVALUATING PRESERVATION DATAProperty level data on housing programs enables low-income families to identify afford-able homes, local officials to estimate their local assisted housing stock and track pres-ervation risks, legal aid advisors to assess tenant’s legal rights, and advocates to monitor program compliance. Incomplete or outdated property records can hinder these efforts. The quantity, quality, and availability of property level housing data varies by housing program (see Table 4).
Table 4: Subsidy Data Evaluation
About Data Availability of Key Fields
Subsidy Public Update Frequency Number of Datasets
Type of Update Address End
DateInactive Subsidies
Available
LIHTC Y Annually* Single Historical 95% 93% Y
Project-based Section 8
Y *Data lags by ~3 years Multiple 99% 100% Y
Public Housing Y Monthly Single Point in time 95% 100% N
Section 202 Direct Loans
Y Annually Single Point in time 99% 100% N
HOME Assistance N Semi-annually Single Point in time 93% 100% Y
HUD Insured Mortgages
Y On Request Multiple Historical 75% 100% Y
Section 515 Y Monthly Multiple Historical 96% 98% N
Section 538 Y Monthly & semi-annually Single Point in time 89% 100% N
Mod Rehab N Monthly Single Point in time 70% 0% N
PBV N On Request Single Point in time 77% 0% N
Historical records are not available or easily accessible for all housing programs. Prop-erty level records for project-based Section 8, public housing, and Section 202 Direct Loans are only available for download as point-in-time records. Additionally, despite the increasing number of homes assisted by PBVs and the national HTF in recent years, comprehensive nationwide property level data on properties assisted by these programs is currently not publicly available. This data gap impedes understanding of the housing available to low-income families and more specifically, the role this program plays in providing housing to communities. Meanwhile, Section 515 and project-based Section 8 have project-level data saved in numerous datasets, limiting data accessibility.

2021 Picture of Preservation
Data quality and availability also varies by housing program. Key fields, such as the prop-erty address, subsidy start and end date, termination reason, and ownership name are sometimes not available, missing, or inaccurate. For instance, the year placed in service date is missing for 7% tax credits. Additionally, subsidy start and end date information are not available for the PBV, Mod Rehab, Section 202/811 Capital Advance programs.
The LIHTC program has significant data collection gaps. Many states award points in their QAP to incentivize property owners to extend their affordability restrictions beyond the 30-year minimum and 44 require or offer points to incentivize owners to waive their right to a qualified contract (National Housing Trust, n.d.), however, nationwide data doesn’t currently note which properties are subject to these requirements. Information on why properties are no longer monitored for LIHTC compliance is also not collected nationally. This prevents advocates from distinguishing between how many LIHTC prop-erties are lost due to the end of their extended use period, sales under Qualified Con-tracts, or other reasons. National data on QC sales would allow preservation risks linked to QC sales to be monitored and inform appropriate policy interventions. More general-ly, the proposed item will also provide further insight into the extent to which HFAs are proactively monitoring program compliance through the conclusion of the extended use period.
Data update lags also vary by housing program and may not be available timely. Proj-ect-level data on housing programs are updated at various intervals, including monthly, semi-annually, annually, and on request. While project-level data on most programs are available at least annually, it can take time for new investments to be added. For in-stance, project-level data on new LIHTC investments are often not available until three or more years after the property is placed in service.

APPENDIX B: DATA NOTES, SOURCES, AND METHODOLOGYAPPENDIX B DESCRIBES THE DATA USED IN PICTURE OF PRESERVATION. ALL ESTIMATES BELOW USE THE NHPD, RETRIEVED JANUARY 2021.
1. The Federally Assisted Housing Stock
1a. Federally Assisted Homes
Federally assisted homes include properties that have at least one likely active subsidy as of January 1, 2021. These estimates include properties assisted by HUD Project-based Section 8, Section 202 direct loans, HUD insurance programs, State HFA Funded Section 236, LIHTC, HOME rental assistance, Section 515 rural rental housing loans, Section 514 direct loans, rural development Section 538, Mod Rehab, Project Based Vouchers, and public housing. These estimates do not include properties funded by CDBG, national HTF, McKinney Vento Permanent Housing, HOPWA, and Tax-Exempt Multifamily Housing Bonds. Subsidies are considered likely active if:
1. The subsidy status in the NHPD is active,
2. The subsidy status is inconclusive because they are missing an end date, or
3. The subsidy is a Project-based Section 8 contract that has expired by less than one year.
The number of assisted homes for all likely active subsidies at each property was summa-rized to estimate the number of assisted homes at each property. If a subsidy is missing an assisted unit value, the total unit value was used instead. HUD insured mortgages that are not affiliated with Section 236 are updated to have an assisted unit value of 0. The number of federally assisted homes was capped at the property’s total homes.
1b. Property Ownership Type
Properties are affiliated to non-profits if they were ever funded by public housing or Section 202 Direct Loans, have non-profit ownership, or are a LIHTC funded property with a non-profit sponsor. Properties have some profit motivation if their owner type was for-profit, limited dividend, or limited profit and they were not affiliated to a non-profit. 496,992 homes were missing owner type information.
27
2021 Picture of Preservation
1c. Properties Affordable for 20 or More Years
Properties are considered affordable for 20 years or more if their earliest subsidy start or occupancy date in the NHPD was before 2001.
1d. Properties that Received a Capital Infusion in the Past 20 Years
Properties were considered to receive a capital infusion the most recent year they re-ceived any of the following subsidies in the past 20 years: Section 202 direct loans, HUD insurance programs, State HFA Funded Section 236, LIHTC, HOME rental assistance, Section 515 rural rental housing loans, Section 514 direct loans, and rural development Section 538.
1e. Target Tenant Type
Target tenant type was determined by matching the NHPD to HUD’s 2020 LIHTC Da-tabase. Target tenant type information is available for properties assisted by LIHTC, project-based Section 8, Section 202 direct loans, HOME Assistance, Section 515, and Section 538. Properties were considered to target elderly families if any of the subsidies attached to the property stated that the property owner targeted elderly populations. 1,885,407 federally assisted homes are missing information on target tenant type.
1f. Properties with Renewable Subsidies
Properties were considered to have renewable subsidies if they were actively assisted by Section 8, public housing, Project Based Vouchers, or Mod Rehab. All other subsidy programs, including LIHTC, Section 515, Section 521, HOME, HUD insured mortgages, Section 538, Section 202 Direct Loans, and State HFA Funded Section 236 are consid-ered non-renewable.
2. Preservation Risks
2a. Expiring in the Next Five Years
Properties are considered as expiring in the next five years if they are affordable as of December 31, 2020 and their latest active subsidy is set to expire between January 1, 2021 and December 31, 2025. Properties expiring in the next five years also include 7,103 homes assisted by Project-based Section 8 contracts that expired between January 1, 2020 and December 31, 2020 that haven’t been renewed yet. Public housing proper-ties that received a tax credit through HOPE VI were excluded from these estimates.
29
2b. Section 202 Direct Loans No Longer Affordable
Properties with Section 202 Direct Loans that are no longer affordable as of 2020 were identified by matching the Section 202 Direct Loan Database as of October 30, 2020, September 1, 2019, March 28, 2017, September 24, 2015, and December 12, 2012 to active contracts in Project-based Section 8 Contracts Database as of January 1, 2021. Properties assisted by Section 202 direct loans that were paid off, but have active rental assistance contracts were classified as affordable. Section 202 loans were classified as prepaid if they were removed from the Section 202 Direct Loan Database before their maturity date.
2c. Housing Homes Demolished Due to Disrepair
This value is the difference between the number of public housing homes in HUD’s Pic-ture of Subsidized Households project level data between 1996 and 2020, minus the number of public housing homes that closed a RAD conversion through 2020.
2d. Public Housing in Need of Immediate Investment
Public housing homes were classified as in need of immediate investment if their most recent REAC score was below 60.
3. Trends in Preservation
3a. Number of Homes Preserved in Recent Years
Properties were classified as preserved if they have been affordable for at least five years and met any of the following conditions:
• The property was awarded a new subsidy such as LIHTC that appeared in the NHPD in 2020 with a start date at least five years beyond the earliest start or occupancy date of the property.
• The property was awarded Section 202 or 811 Capital Advance in 2020.
• The property was entered into the MPR demonstration program in 2020.
• The property converted to Section 8 PBRA through RAD in 2020.
• The property underwent a Mark to Market conversion in 2020.
• The property completed a transfer of a Section 515 mortgage.
These estimates do not include homes preserved through state or locally funded subsidy programs or federally funded programs which recent project-level data is unavailable for, such as the national HTF, CDBG, and PBVs.
2021 Picture of Preservation
3b. Section 8 Contract Renewals
Project-based Section 8 contracts renewals are determined by matching HUD’s Section 8 Contract Database as of January 1, 2021, November 15, 2019, November 28, 2018, November 28, 2017, November 30, 2016, December 22, 2015, and September 2, 2014 by property ID. Contracts were classified as expiring in 2019 if any of their overall con-tract end date between 2016 and 2020 was in 2019. Contracts were considered renewed if their overall contract expiration date in 2019 or 2020 was 2020 or later. Contracts were considered not renewed if the contract number was removed from HUD’s database, if the contract was listed as terminated or suspended, or if the contract wasn’t yet renewed as of January 1, 2021. Properties with additional affordability restrictions imposed include properties that received Section 811 capital advances, Section 202 capital advances, or underwent full Mark to Market conversions.
3c. Net Gain and Loss of Homes from NHPD
Using the NHPD to examine changes in the federally funded affordable housing stock re-quires that reporting lags, update intervals, and data quality across housing subsidy pro-grams tracked by the NHPD be similar across compared years. To meet these criteria, the 2019 NHPD was retroactively standardized to increase comparability to the 2020 NHPD.
To estimate the number of homes gained and lost from the NHPD between 2019 and 2020, NHPD data retrieved January 2021 was matched to NHPD data retrieved January 2020 using HUD subsidy ID and subsidy name. If a HUD subsidy ID was not available, the NHPD subsidy ID took the place of the HUD subsidy ID. Any records with duplicate HUD subsidy ID and subsidy name was removed from the analysis. Once the 2021 and 2020 NHPD subsidy data was matched, the 2020 data was updated to reduce differences due to administrative changes:
1. Subsidies were re-classified as active if their subsidy was set to expire after Jan-uary 1, 2020, unless the subsidy was made inactive for another reason (i.e. miss-ing from subsequent updates, or listed as terminated).
2. LIHTC subsidies were reclassified as inactive if they were allocated before 1990 or were listed as non-programmatic in 2019.
3. HUD terminated mortgages were listed as inconclusive if their end date was in the future.
4. HOME subsidies that were previously excluded from the NHPD were retroac-tively added to the 2020 data if they were awarded before 2020.
5. All subsidies that were identified as duplicates and were deleted from the NHPD

31
between 2020 and 2021 were removed from the analysis.
6. Public housing homes lost due to RAD conversions were subtracted from the homes lost and added count.
7. Properties suspected to be domestic violence shelters were removed.
After these standardizations were applied, 2021 and standardized 2020 NHPD data was aggregated to the property level. The difference between the active assisted homes in 2021 and 2020 was used to estimate the number of homes added and lost in 2021.
3d. Newly Constructed and Preserved LIHTC Homes in 2015
Properties with tax credits that were placed in service in 2015 and were listed as new construction or awarded to a property with no prior subsidies in the NHPD were classi-fied as newly constructed LIHTC homes Properties were counted as preserved if tax cred-its were awarded in 2015 to a property that had received another federal subsidy at least five years prior.
3e. Newly Constructed and Preserved HOME Homes in 2017
Properties with HOME that were awarded in 2017 and were listed as new construction or awarded to a property with no prior subsidies in the NHPD were classified as newly con-structed HOME homes.
4. The Loss of Federally Assisted Homes
4a. Newly Inactive Public Housing Homes that Likely Repositioned Through RAD
Identifying how many newly inactive public housing homes in the NHPD that were con-verted to PBV or Section 8 PBRA through RAD requires matching additional data to the NHPD. While properties assisted by PBV and Section 8 PBRA, including those that con-verted through RAD, are available in the NHPD, they are often listed on a new property record separate from the original public housing property. Public housing in the NHPD is available at the Asset Management Projects (AMP) level, which can include multiple ad-dress and properties in one record. Therefore, when a public housing property converts to RAD, the new PBV or Section 8 PBRA contract doesn’t always match to the old pub-lic housing property. As of 2020, 56 thousand public housing homes converted through RAD to PBRA are in the NHPD. This matches closely to HUD’s project level RAD data which states 55 thousand public housing homes closed their PBRA RAD conversion by the end of 2020. However, only 23 thousand of RAD PBRA homes matched to a property in the NHPD that had a public housing subsidy at one point.
2021 Picture of Preservation
To estimate the number of newly inactive public housing homes in the NHPD that like-ly repositioned through RAD, the 2019 and 2020 NHPD was matched to data on public housing properties that closed their RAD conversion through 2020 from HUD’s Proper-ties Participating in RAD Program data as of September 2, 2021. Once matched to the NHPD, the number of closed RAD homes according to HUD’s data was aggregated to the property level. The number of closed RAD homes was adjusted by subtracting the number of PBV and Section 8 PBRA assisted homes in the NHPD at properties that ex-perienced a reduction in public housing homes to account for RAD converted homes already listed at the NHPD property record. If a public housing property lost assisted homes between 2019 and 2020, the RAD adjusted 2020 assisted unit count was estimat-ed by adding the adjusted number of closed RAD homes to the 2020 NHPD assisted unit count. The RAD adjusted 2020 NHPD assisted unit count was capped at the 2019 NHPD assisted unit count to account for data lags from HUD removing public housing homes that convert to RAD. The number of newly inactive public housing homes that are un-accounted for and likely lost due to disposition was calculated by taking the difference between the RAD adjusted 2020 NHPD assisted unit count and the 2019 NHPD assist-ed unit count. This value was then subtracted from the number of newly inactive public housing homes in the NHPD to estimate the homes repositioned through RAD.
4b. Number of Years LIHTC Homes Lost Their Affordability Early
HUD’s 2020 LIHTC Database, including tax credits allocated up to 2018, was matched to the following prior versions of HUD’s LIHTC Database released in 2003-2004, 2006-2009, and 2011-2019 using the hud_id field to identify the year properties became inactive. The LIHTC Database was unavailable in 2005 and 2010. Tax credits were included in the analysis if they were allocated 1990 or later and if a placed in service or allocation year was available. If a tax credit was missing the placed in-service year, two years were added to the allocation year to estimate the date the property first became affordable. LIHTC end dates were estimated by adding 30 years to the placed in-service year and applying any additional state imposed affordability restriction requirements (noted here).
LIHTC properties were classified as inactive if they were listed as non-programmatic in 2020. The year a LIHTC property became inactive was identified by taking the earliest year the property was reported as non-programmatic in the LIHTC Database.
The number of LIHTC assisted homes that lost their affordability early was estimated using the minimum LIHTC assisted unit value at the property across all years of HUD’s LIHTC Database. If the LIHTC assisted unit value was missing, the minimum total unit count was used instead.

33
4c. Homes Expiring in Next Five Years Projected to Be Lost if Current Trends Per-sist
This estimate is a product of the rate homes expiring in 2020 became inactive by pro-gram and the number of homes set to expire in the next five years by program. If prop-erties were assisted by multiple programs, the program with the lowest inactive rate was applied.
4d. Homes Not Expiring in the Next Year that Could be Lost if Current Trends Persist
This estimate is a product of the rate homes with an earliest subsidy end date after 2020 became inactive in 2020 by program and the number of homes with an earliest subsidy end date after 2021 by program. If properties were assisted by multiple programs, the program with the lowest inactive rate was applied.
2021 Picture of Preservation
CITATIONSBelsky, E. & Nipson, M. (2010). Long-term Low Income Housing Tax Credit policy questions. Harvard Joint Center for Housing Studies.
Retrieved from https://www.jchs.harvard.edu/sites/default/files/long-term_low_income_housing_tax_credit_policy_questions.pdf
Blumenthal, P., Jordan, R., Clark, A., Handelman, E., & King, R. (2016). The cost of affordable housing: Does it pencil out? Urban
Institute and National Housing Conference. Retrieved from https://apps.urban.org/features/cost-of-affordable-housing/
Center on Budget and Policy Priorities (CBPP). (2017). Policy basics: Public Housing. Retrieved from https://www.cbpp.org/research/
policy-basics-public-housing
Dewar, M., Deng, L., Bloem, M. (2020). Challenges for Low Income Housing Tax Credit projects at year 15 and beyond in a weak
housing market: The case for Detroit, Michigan. Housing Policy Debate, DOI: 10.1080/10511482.2019.1688375
Finkel, M., Hanson, C., Hilton, R., Lam, K., & Vandawalker, M. (2006). Multifamily properties: Opting in, opting out and remaining
affordable. Washington, DC: HUD, Office of Policy Development and Research. Retrieved from https://www.huduser.gov/Publications/
pdf/opting_in.pdf
Finkel, M., Lam, K., Blaine, C., de la Cruz, RJ. DeMarco, D., Vandawalker, M., Woodford, M. (2010). Capital needs in the Public
Housing program. Washington, DC: HUD, Office of Policy Development and Research. Retrieved from https://www.hud.gov/sites/
documents/PH_CAPITAL_NEEDS.PDF
Government Accountability Office (GOA). (2018). Rental Assistance Demonstration: HUD needs to take action to improve metrics and
ongoing oversight. Retrieved at https://www.gao.gov/assets/gao-18-123.pdf
Housing Assistance Council. (2008). A guide to best practices in rural rental preservation. Retrieved from http://www.ruralhome.org/
storage/documents/preservguidebestprac08.pdf
HAC. (2018). Rental housing for a 21st century rural America. Housing Assistance Council. Retrieved from http://www.ruralhome.org/
storage/documents/publications/rrreports/HAC_A_PLATFORM_FOR_PRESERVATION.pdf
HAC. (2020). USDA rural development housing activity: September FY 2020. Retrieved from http://ruralhome.org/storage/documents/
rd_obligations/fy2020/CombinedSepFY20.pdf
HUD. (2020). CDBG accomplishment reports. Retrieved from https://www.hudexchange.info/programs/cdbg/cdbg-accomplishment-
reports/
HUD. (2018). Understanding who the LIHTC serves: data on tenants in LIHTC homes as of December 31, 2017. Washington, DC: HUD,
Office of Policy Development and Research. Retrieved from https://www.huduser.gov/portal/publications/LIHTC-TenantReport-2017.
html
Kincer, B., Shelburne, M. (2017). Qualified Contracts volume: Policies vary widely by state. National Housing and Rehabilitation
Association.
Khadduri, J., Climaco ,C., Burnett, K., Gould, L., & Elving, L. (2012). What happens to Low Income Housing Tax Credit properties at
Year 15 and beyond? Washington, DC: HUD, Office of Policy Development and Research. Retrieved from https://www.huduser.gov/
portal/publications/what_happens_lihtc_v2.pdf
Kneebone, E. & Reid, C. (2021). The complexity of financing Low Income Housing Tax Credit Housing in the United States. Retrieved
at https://ternercenter.berkeley.edu/wp-content/uploads/2021/04/LIHTC-Complexity-Final.pdf
Lew, Irene. (2015). Analysis of data from the Low-Income Housing Tax Credit database, US Department of Housing and Urban
Development (unpublished). Cambridge, MA: Joint Center for Housing Studies.

35
McClure, K. & Johnson, B. (2014). Housing Programs Fail to Deliver on Neighborhood Quality, Reexamined. Housing Policy Debate,
25(3), 463-496.
Melendez, E., Schwartz, A., & Montrichard, A. (2008). Year 15 and preservation of tax credit housing for low-income households: An
assessment of risk. Housing Studies, 23(1), 67–87.
National Council of State Housing Finance Agencies (NCSHA). (2019). The Save Affordable Housing Act of 2019. Retrieved from
https://www.ncsha.org/wp-content/uploads/Updated-Qualified-Contract-Proposal-11.15.19.pdf
National Housing Trust. (n.d.). Qualified Contracts Threaten Affordable Housing Preservation. Retrieved from https://www.
nationalhousingtrust.org/news-article/qualified-contracts-threaten-affordable-housing-preservation
Newman, S. & Holupka, S. (2018). The quality of assisted housing in the United States. Cityscape, 20(1), 89-112.
NLIHC. (2021). The Gap: A shortage of affordable homes. Retrieved from https://reports.nlihc.org/sites/default/files/gap/Gap-
Report_2021.pdf
PAHRC & NLIHC. (2020). Picture of Preservation. Retrieved from https://preservationdatabase.org/reports/picture-of-preservation/
NLIHC. (2019a). HUD announces Section 202 capital advance NOFA. Retrieved from https://nlihc.org/resource/hud-announces-
section-202-capital-advance-nofa
NLIHC. (2019b). FY20 budget chart for selected HUD and USDA programs. Retrieved from https://nlihc.org/sites/default/files/NLIHC_
HUD-USDA_Budget-Chart.pdf
NLIHC & PAHRC. (2018a). Balancing priorities: Preservation and neighborhood opportunity in the Low Income Housing Tax Credit
program beyond Year 30. Retrieved from https://preservationdatabase.org/wp-content/uploads/2018/10/Balancing-Priorities.pdf
NLIHC. (2018b). Getting started: First homes being built with 2016 National Housing Trust Fund awards. Retrieved from https://nlihc.
org/sites/default/files/NHTF_Getting-Started_2018.pdf
NLIHC. (2014). State and city funded rental housing programs. Retrieved from https://nlihc.org/state-and-city-funded-rental-housing-
programs
Novogradac. (2021). Affordable Housing Exports Expect LIHTC Equity Pricing Increase into 2022. Retrieved at https://www.novoco.
com/periodicals/articles/affordable-housing-experts-expect-lihtc-equity-pricing-increase-2022
Novogradac. (2020). The 4 Percent LIHTC Equity Market Persists during Pandemic. Retrieved at https://www.novoco.com/periodicals/
articles/4-percent-lihtc-equity-market-persists-during-pandemic#:~:text=Equity%20pricing%20for%204%20percent,several%20
cents%2C%E2%80%9D%20said%20Segel.&text=%E2%80%9CThe%20average%20price%20per%20credit,economic%20
investors%2C%E2%80%9D%20said%20Anderson.
Mortgage Professional America. (2020). How will COVID-19 affect affordable housing? Retrieved at https://www.mpamag.com/
commercial/how-will-covid19-affect-affordable-housing-221075.aspx
Ray, A., Kim, J., Nguyen, D., Choi, J. (2015). Opting in, opting out a decade later. Washington, DC: HUD, Office of Policy
Development and Research. Retrieved from https://www.huduser.gov/portal/sites/default/files/pdf/508_MDRT_Opting%20In_
Opting%20Out.pdf
Rice, D. (2016). Chart Book: Cuts in federal assistance have exacerbated families’ struggles to afford housing. Center on Budget and
Policy Priorities. Retrieved from https://www.cbpp.org/research/housing/chart-book-cuts-in-federal-assistance-have-exacerbated-
families-struggles-to-afford
Reina, V. (2018). The preservation of subsidized housing: What we know and need to know. Lincoln Institute of Land Policy. Retrieved
from https://www.lincolninst.edu/sites/default/files/pubfiles/reina_wp18vr1.pdf
2021 Picture of Preservation
RSM US LLP & CoreLogic, Inc. (2016). USDA Rural Development multi-family housing comprehensive property assessment. Retrieved
from https://www.rd.usda.gov/files/reports/USDA-RD-CPAMFH.pdf
Scally, C., Champion, E., Neil, M. (2020). An equitable framework for housing policy solutions for COVID-19 and beyond. Retrieved at
https://www.urban.org/sites/default/files/publication/103247/an-equitable-framework-for-housing-policy-solutions-for-covid-19-and-
beyond_1.pdf
Scally, P., Gold, A., Hedman, C., Gerkin, M., DuBois, N. (2018). The Low-Income Housing Tax Credit. Retrieved at https://www.urban.
org/sites/default/files/publication/98761/lihtc_past_achievements_future_challenges_finalized_1.pdf
Schwartz, H., Bostic, R., Green, R., Reina, V., Davis, L. & Augustine, C. (2016). Preservation of affordable rental housing: evaluation of
the MacArthur Foundation’s window of opportunity initiative. Santa Monica, CA: The RAND Corporation. Retrieved from https://www.
rand.org/content/dam/rand/pubs/research_reports/RR1400/RR1444/RAND_RR1444.pdf
Schwartz, H. McClure, K. (2021). The Rental Assistance Demonstration Program and Its Current and Projected Consumption of Low
Income Housing Tax Credits. Cityscape, 23(2): 9-25.
Stout, D., Clogston, F., Thackeray, A., Stoloff, J., Anthony, B., Hayes, C. (2019). Final report: evaluation of HUD’s Rental Assistance
Demonstration (RAD). Washington, DC: HUD, Office of Policy Development and Research. Retrieved from https://www.huduser.gov/
portal/sites/default/files/pdf/RAD-Evaluation-Final-Report.pdf
37
2021PICTURE OF
PRESERVATIONA joint report by
the Public and Affordable Housing andResearch Corporation and the National
Low Income Housing Coalition