~pierrel table of contents - harvard universityrobinson.seas.harvard.edu/papers/pfjl_ulg04.pdfocean...
TRANSCRIPT

AOSN-II in Monterey Bay: Real-Time Error Predictions, Data Assimilation,
Adaptive Sampling and Dynamics
Pierre F.J. Lermusiaux, Wayne G. Leslie, Constantinos Evangelinos (MIT), Patrick J. Haley, Oleg Logoutov, Patricia Moreno, Allan R. Robinson,
Gianpiero Cossarini (Trieste U.), X. San Liang, Sharan Majumdar (U. Miami)
Division of Engineering andApplied Sciences
Department of Earth andPlanetary Sciences
Table of Contents1. AOSN-II: August 2003 experiment and Error Subspace Statistical Estimation2. Real-time ESSE results and physical dynamics3. Quantitative Autonomous Adaptive Sampling 4. Tidal effects and Coupled Biology5. Multi-Scale Energy and Vorticity Analysis6. Multi-Model Adaptive Combination
http://www.deas.harvard.edu/~pierrel

ROMS Modelling8 Hour Duration
HOPS Modelling
5 Hour Duration
22 23 00 01 02 03 04 05 06 07 08 09 10 11 12 13 14 15 16 17 18 19 20 21 22 23 00 01 02 03 04 05 06 07 08 09 10 11 12 13 14 15 16 17 18 2119 20 22
Day N Day N+1
ROMS Modelling8 Hour Duration
NPS A/C Flight & Data Reduce4 hr flight/4hr data
reduction/.5hr drive
ROMS Modeling
HOPSModeling
SuperEnsemble
HOPS Graphical Products
1 Hour Duration
Super Ens. Computation
.5 Hour Duration
LCS Computation3 Hour Duration
Daily Brief Prep1 Hour Duration
LCS
RTOC Functions & Lunch
Asset Tasking
ESSE Comp. (Phys+Bio)36 Hour Duration
ESSE Compuation(Phys)19 Hour Duration HOPS
Modelling5 Hour
Duration
HOPS Graphical Products
1 Hour Duration
Super Ens. Computation
.5 Hour Duration
NPS A/C Flight & Data Reduce4 hr flight/4hr data
reduction/.5hr drive
AS Vehicle Tasking2 Hour Duration
Glider Surfacing/Data & Ship Hydrography Every 2 hours for <20 minutes
RTOC Deliberation3 Hour Duration
Start: 1400 PST Day nEnd: 1700 PST Day n
AS Vehicle Tasking2 Hour Duration
Mooring & CODAR Data Every 1 hour
COAMPS & Bottom ADCP Data Every 24 hours
Glider Waypoints
LCS Computation3 Hour Duration
Daily Brief Prep1 Hour Duration
Glider Waypoints
J. G. Bellingham, MBARI
Two-scale Adaptive Sampling:• Daily identification of features and errors from model forecasts• Two-hourly data feedback for glider coordination

Error Subspace Statistical Estimation (ESSE)
• Uncertainty forecasts (dynamic error subspace and adaptive error learning)• Ensemble-based (with nonlinear and stochastic model)• Multivariate, non-homogeneous and non-isotropic DA• Consistent DA and adaptive sampling schemes• Software: not tied to any model, but specifics currently tailored to HOPS

• Strait of Sicily (AIS96-RR96), Summer 1996
• Ionian Sea (RR97), Fall 1997
• Gulf of Cadiz (RR98), Spring 1998
• Massachusetts Bay (LOOPS), Fall 1998
• Georges Bank (AFMIS), Spring 2000
• Massachusetts Bay (ASCOT-01), Spring 2001
• Monterey Bay (AOSN-2), Summer 2003
Ocean Regions and Experiments/Operationsfor which ESSE has been utilized in real-time

Real-time ESSE : AOSN-II Accomplishments• 10 sets of ESSE nowcasts and forecasts of temperature, salinity and velocity,
and their uncertainties, issued from 4 Aug. to 3 Sep.- Total of 4323 ensemble members: 270 – 500 members per day (7 105 state var.)
- ESSE fields included: central forecasts, ensemble means, a priori (forecast) errors, a posteriori errors, dominant singular vectors and covariance fields
- 104 data points quality controlled and assimilated per day: ship (Pt. Sur, Martin, Pt. Lobos), glider (WHOI and Scripps) and aircraft SST data
• Ensemble of stochastic PE model predictions (HOPS)- Deterministic atmospheric forcing: 3km and hourly COAMPS flux predictions
- Stochastic oceanic/atmos. forcings: for sub-mesoscale eddies, BCs and atmos. fluxes
• ESSE fields formed the basis for daily adaptive sampling recommendations
• Adaptive ocean modeling: BCs and model parameters for transfer of atmos. fluxes calibrated and modified in real-time to adapt to evolving conditions
• ESSE dynamical results described and posted on the Web daily
• Real-time research: stochastic error models, coupled physics-biology, tides

REGIONAL FEATURES• Upwelling centers at Pt AN/ Pt Sur:….………Upwelled water advected equatorward and seaward• Coastal current, eddies, squirts, filam., etc:….Upwelling-induced jets and high (sub)-mesoscale var. in CTZ• California Undercurrent (CUC):…….………..Poleward flow/jet, 10-100km offshore, 50-300m depth• California Current (CC):………………………Broad southward flow, 100-1350km offshore, 0-500m depth
HOPS –Nested Domains
CC
CUCAN
PS
SST on August 11, 2003
REGIONAL FEATURES of Monterey Bay and California Current System and Real-time Modeling Domains (4 Aug. – 3 Sep., 2003)
Coastal C.
AN
PS

Oceanic responses and atmospheric forcings during August 2003
Upwelling Relaxation

Oceanic responses and atmospheric forcings during August 2003
Aug 10: Upwelling Aug 16: Upwelled
Aug 20: Relaxation Aug 23: Relaxed
Cyclonic Circ.
Cyc. Circ.
Bifurcation
Bifurc.
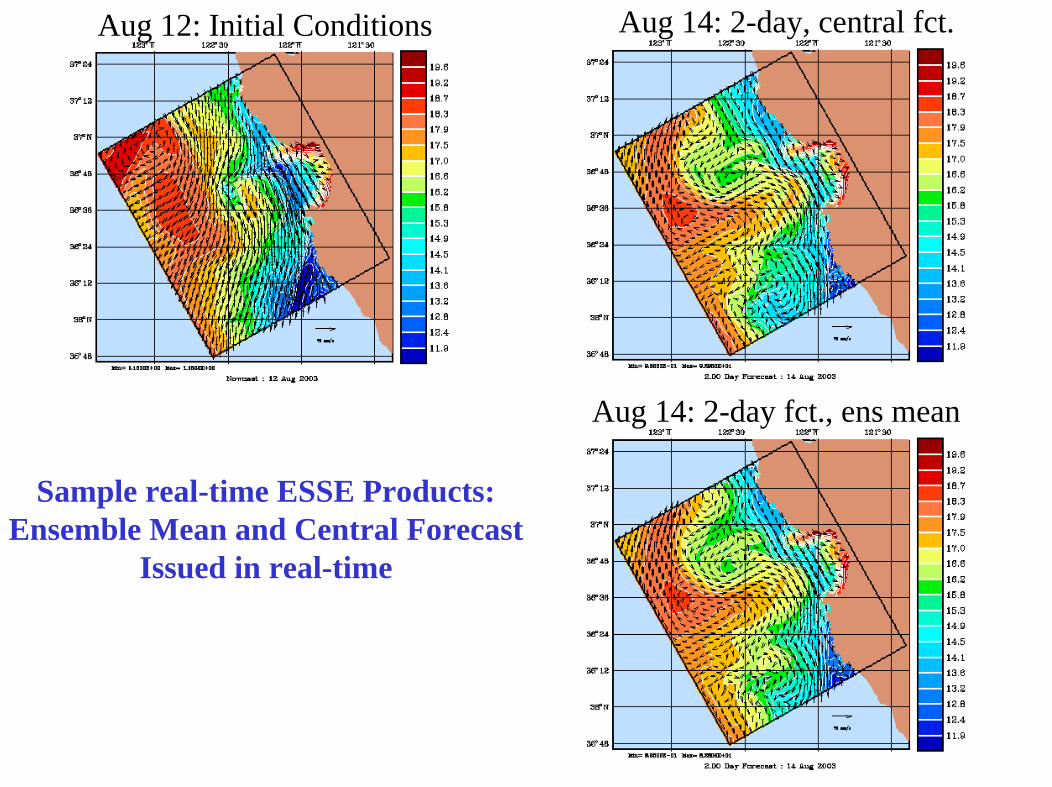
Aug 12: Initial Conditions Aug 14: 2-day, central fct.
Aug 14: 2-day fct., ens mean
Sample real-time ESSE Products:Ensemble Mean and Central Forecast
Issued in real-time

RMSE EstimateStandard deviations of horizontally-averaged data-model differences
•Nowcast: Aug 11 (persistence forecast, red)•2-day forecast for Aug 13 (green)•1-day forecast for Aug 12 (blue, to check phase error)
Verification data time: Aug 13All forecasts are compared to this Aug 13 data

Bias EstimateHorizontally-averaged data-model differences
•Nowcast: Aug 11 (persistence forecast, red)•2-day forecast for Aug 13 (green)•1-day forecast for Aug 12 (blue, to check phase error)
Verification data time: Aug 13All forecasts are compared to this Aug 13 data
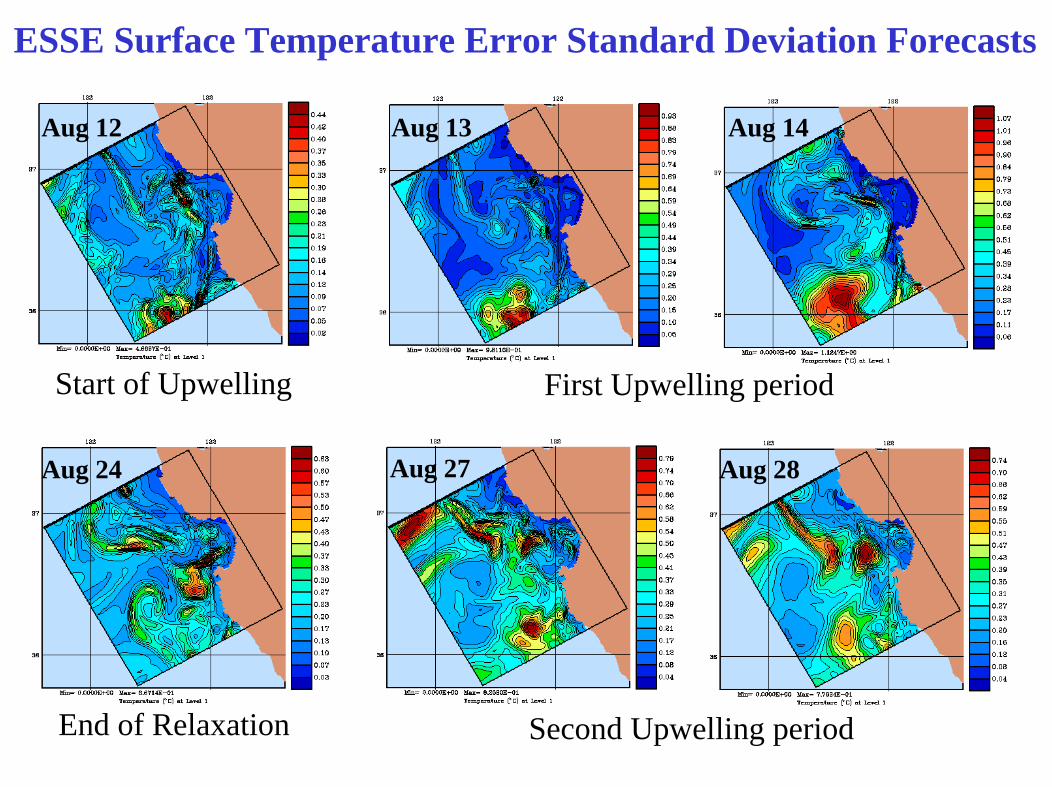
ESSE Surface Temperature Error Standard Deviation Forecasts
Aug 12 Aug 13
Aug 27Aug 24
Aug 14
Aug 28
End of Relaxation Second Upwelling period
First Upwelling periodStart of Upwelling
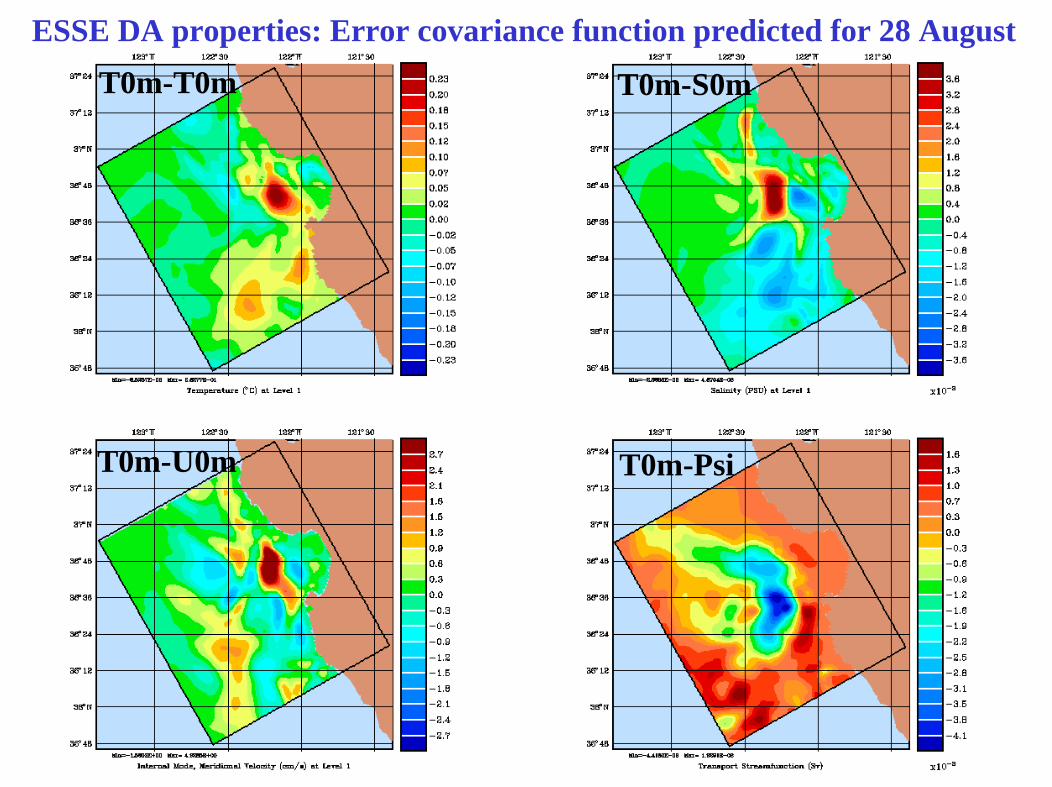
T0m-T0mESSE DA properties: Error covariance function predicted for 28 August
T0m-S0m
T0m-U0m T0m-Psi
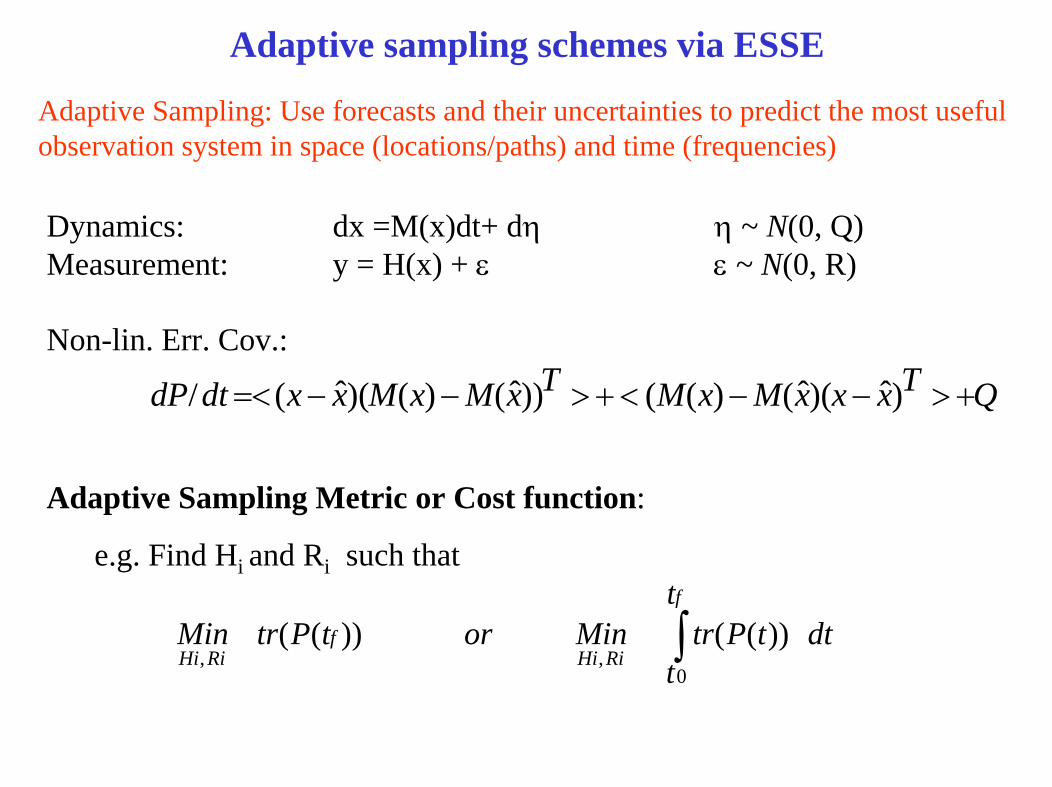
Adaptive sampling schemes via ESSE
Adaptive Sampling Metric or Cost function:
e.g. Find Hi and Ri such that
dtt
ttPtrMinortPtrMin
f
RiHif
RiHi ∫0
,,))(())((
Dynamics: dx =M(x)dt+ dη η ~ N(0, Q)Measurement: y = H(x) + ε ε ~ N(0, R)
Non-lin. Err. Cov.:
QTxxxMxMTxMxMxxdtdP +>−−<+>−−=< )ˆ)(ˆ()(())ˆ()()(ˆ(/
Adaptive Sampling: Use forecasts and their uncertainties to predict the most useful observation system in space (locations/paths) and time (frequencies)
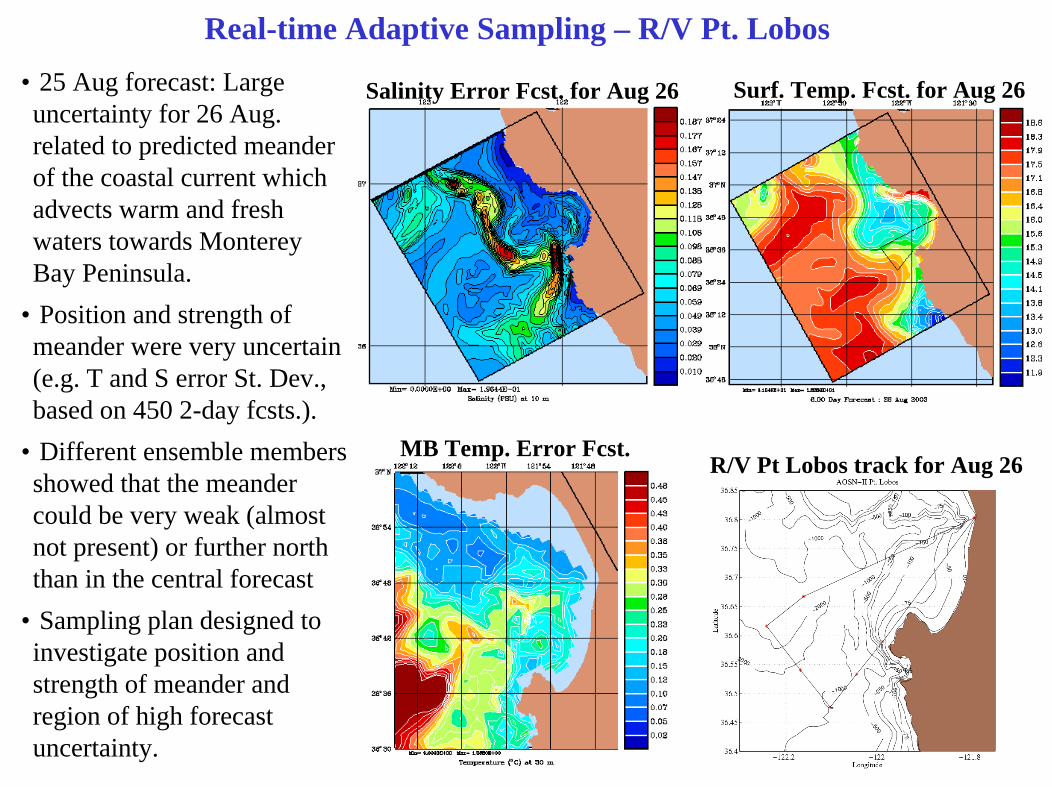
Real-time Adaptive Sampling – R/V Pt. Lobos• 25 Aug forecast: Large uncertainty for 26 Aug. related to predicted meander of the coastal current which advects warm and fresh waters towards Monterey Bay Peninsula.
• Position and strength of meander were very uncertain (e.g. T and S error St. Dev., based on 450 2-day fcsts.).
• Different ensemble members showed that the meander could be very weak (almost not present) or further north than in the central forecast
• Sampling plan designed to investigate position and strength of meander and region of high forecast uncertainty.
MB Temp. Error Fcst.
Salinity Error Fcst. for Aug 26 Surf. Temp. Fcst. for Aug 26
R/V Pt Lobos track for Aug 26

Quantitative Adaptive Sampling via ESSE
1. Select sets of candidate sampling paths/regions and variables that satisfy operational constraints
2. Forecast reduction of errors for each set based on a tree structure of small ensembles and data assimilation
3. Optimization of sampling plan: select sequence of paths/regions and sensor variables which maximize the predicted nonlinear error reduction in the spatial domain of interest, either at tf (trace of ``information matrix’’ at final time) or over [t0 , tf ]
- Outputs:- Maps of predicted error reduction for each sampling paths/regions- Information (summary) maps: assigns to the location of each sampling
region/path the average error reduction over domain of interest- Ideal sequence of paths/regions and variables to sample
• Use exact nonlinear error covariance evolution • For every choice of adaptive strategy, an ensemble is computed

Which sampling on Aug 26 optimally reduces uncertainties on Aug 27?
4 candidate tracks, overlaid on surface T fct for Aug 26
ESSE fcts after DA of each track
Aug 24 Aug 26 Aug 27
2-day ESSE fct
ESSE for Track 4
ESSE for Track 3
ESSE for Track 2
ESSE for Track 1DA 1
DA 2
DA 3
DA 4
IC(nowcast) Forecast DA

Which sampling on Aug 26 optimally reduces uncertainties on Aug 27?
1. Define relative error reduction as: (σ27 - σ27 ) / σ27…..for σ27 > σnoise
0………………for σ27 ≤ σnoise
2. Create relative error reduction maps for each sampling tracks, e.g.:
track i
3. Compute average over domain of interest for each variable, e.g. for full domain: Best to worst error reduction: Track 1 (18%), Pt Lobos (17%), …., Track 3 (6%)
4. Create “Aug 26 information map”: indicates where to sample on Aug 26 for optimal error reduction on Aug 27
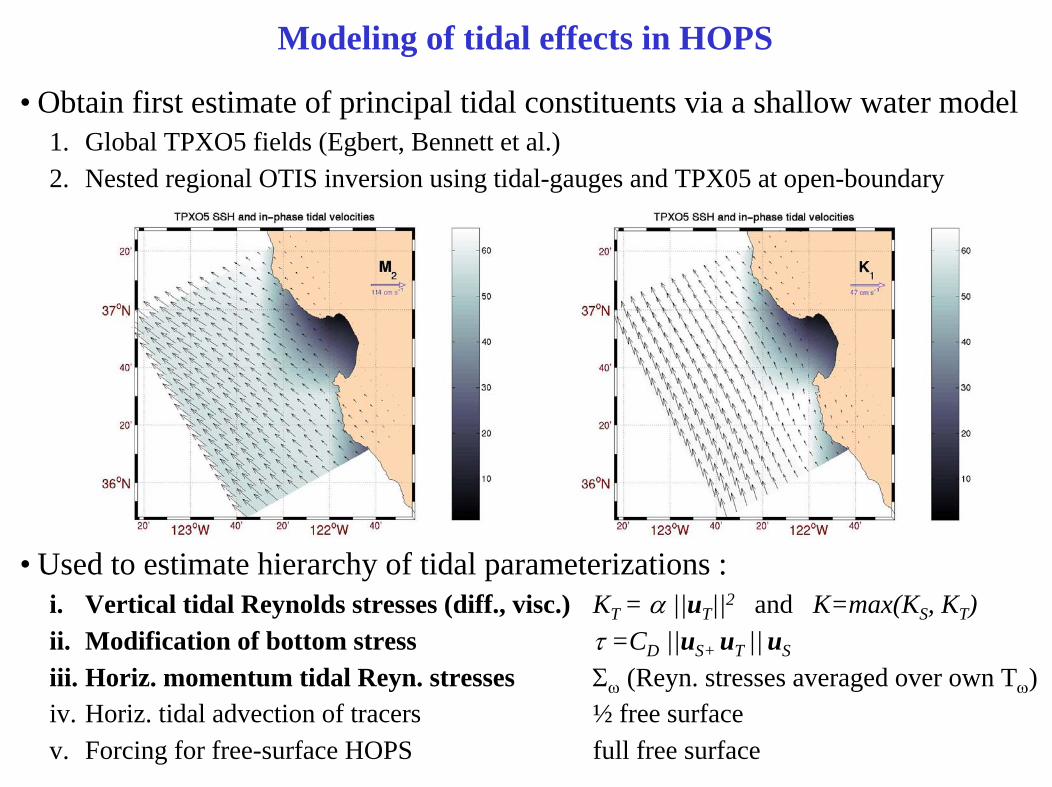
Modeling of tidal effects in HOPS
• Obtain first estimate of principal tidal constituents via a shallow water model1. Global TPXO5 fields (Egbert, Bennett et al.)2. Nested regional OTIS inversion using tidal-gauges and TPX05 at open-boundary
• Used to estimate hierarchy of tidal parameterizations :i. Vertical tidal Reynolds stresses (diff., visc.) KT = α ||uT||2 and K=max(KS, KT)ii. Modification of bottom stress τ =CD ||uS+ uT || uS
iii. Horiz. momentum tidal Reyn. stresses Σω (Reyn. stresses averaged over own Tω)iv. Horiz. tidal advection of tracers ½ free surfacev. Forcing for free-surface HOPS full free surface

T section across Monterey-BayTemp. at 10 m
No-tides
Two 6-day model runs
Tidal effects• Vert. Reyn.
Stress• Horiz.
Momentum Stress

CHL Aug 20
CHL Aug 21
CHL Aug 22
Post-Cruise Surface CHL forecast (Hindcast)• Starts from zeroth-order dynamically balanced IC on Aug 4
• Then, 13 days of physical DA
• Forecast of 3-5 days afterwards
CHL Aug 20,
20:00 GMT

Large-scale Available Potential Energy (APE) Large-scale Kinetic Energy (KE)
• Both APE and KE decrease during the relaxation period• Transfer from large-scale window to mesoscale window takes place to account
for the decrease in energy (as confirmed by transfer and mesoscale terms)
August 18 August 19 August 20
August 21 August 22 August 23 August 23August 22August 21
August 20August 19August 18
Windows: Large-scale (>= 8days; > 30km), mesoscale (0.5-8 days), and sub-mesoscale (< 0.5 days)
Multi-Scale Energy and Vorticity Analysis
Dr. X. San Liang
• Multiscale window decomposition in space and time (wavelet-based) of energy/vorticity eqns.• For example, consider Energetics During Relaxation Period:
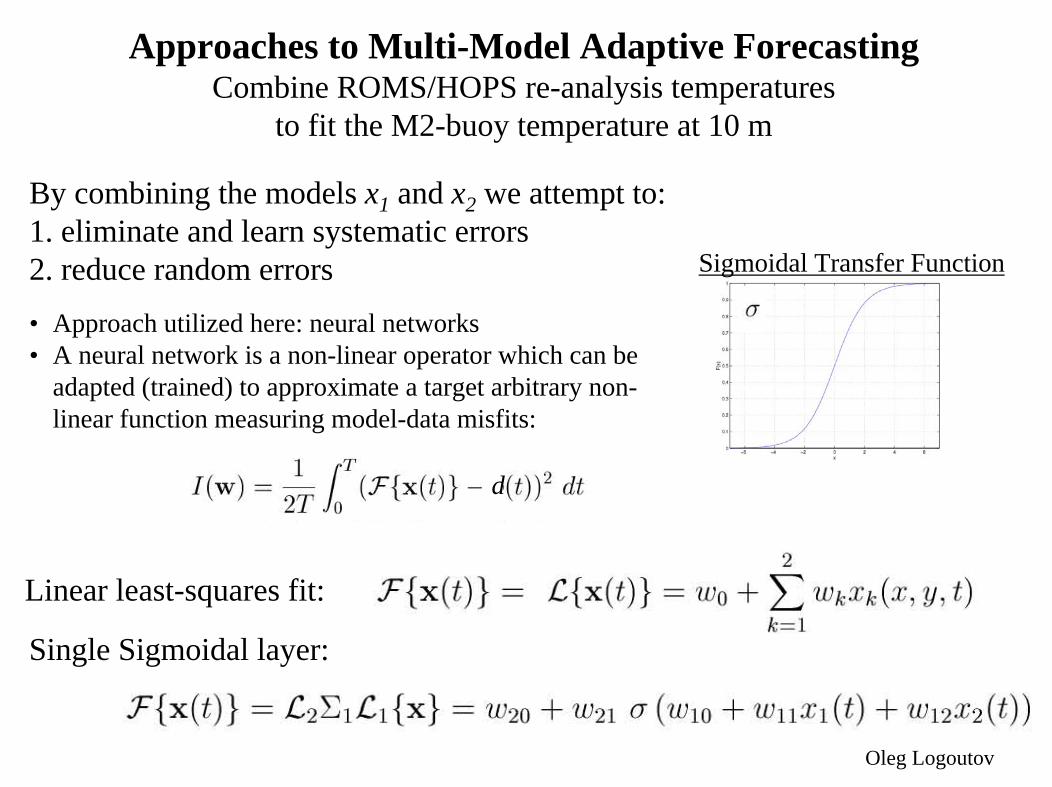
Approaches to Multi-Model Adaptive ForecastingCombine ROMS/HOPS re-analysis temperatures
to fit the M2-buoy temperature at 10 m
By combining the models x1 and x2 we attempt to:1. eliminate and learn systematic errors2. reduce random errors• Approach utilized here: neural networks• A neural network is a non-linear operator which can be
adapted (trained) to approximate a target arbitrary non-linear function measuring model-data misfits:
Sigmoidal Transfer Function
Single Sigmoidal layer:
Oleg Logoutov
Linear least-squares fit:
d

Top: Green – HOPS/ROMS reanalysis combined via neural network trained on the first subset of data (before Aug 17).
Bottom: Green – HOPS/ROMS reanalysis combined via adaptive neural network also trained on the first subset of data (before Aug 17), but over moving-window of 3 days decorrelation
Neural Network Least Squares Fit
Linear Least Squares Fit
IndividualModels
Equal Weights
• Observed (black) temp at the M2mooring• Modeled temp at the M2mooring:
ROMS re-analysis, HOPS re-analysis
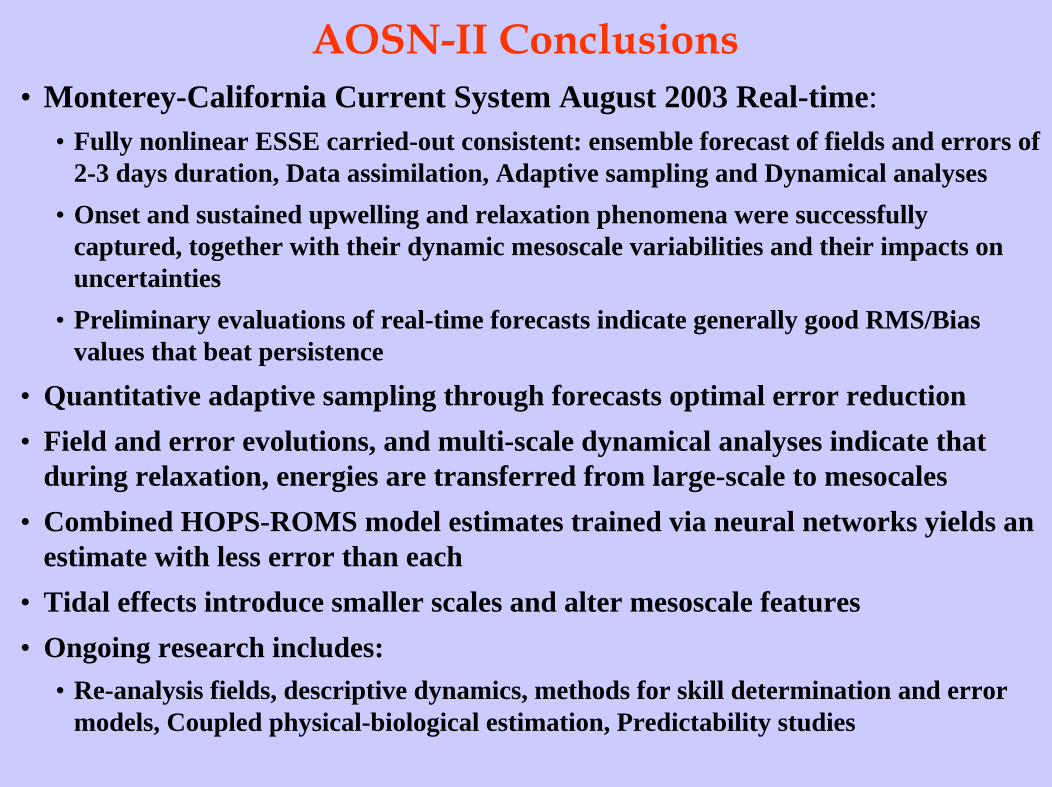
AOSN-II Conclusions• Monterey-California Current System August 2003 Real-time:
• Fully nonlinear ESSE carried-out consistent: ensemble forecast of fields and errors of 2-3 days duration, Data assimilation, Adaptive sampling and Dynamical analyses
• Onset and sustained upwelling and relaxation phenomena were successfully captured, together with their dynamic mesoscale variabilities and their impacts on uncertainties
• Preliminary evaluations of real-time forecasts indicate generally good RMS/Bias values that beat persistence
• Quantitative adaptive sampling through forecasts optimal error reduction • Field and error evolutions, and multi-scale dynamical analyses indicate that
during relaxation, energies are transferred from large-scale to mesocales• Combined HOPS-ROMS model estimates trained via neural networks yields an
estimate with less error than each• Tidal effects introduce smaller scales and alter mesoscale features• Ongoing research includes:
• Re-analysis fields, descriptive dynamics, methods for skill determination and error models, Coupled physical-biological estimation, Predictability studies