pile load tests for helical piles in oil sands site near...
TRANSCRIPT

Pile load tests for helical piles in oil sands site near Fort McMurray, Alberta Mohammed Sakr Almita Manufacturing Ltd., Edmonton, Alberta, Canada ABSTRACT The use of helical piles for permanent foundation applications has become a practical and feasible alternative to the common concrete cast-in-place or steel pipe driven pile. Research & Development, installation equipment and manufacturing improvements in the screw piling industry have led to this trend. Probably nowhere else in Canada has more rapid growth occurred than in the oil sands vicinity. This paper is presented to showcase some of R & D that is ongoing in the screw piles in oil sands research. The results of a comprehensive pile load test program and field monitoring of helical piles with either single helix or double helixes installed in oil sands are presented in this paper. Nine full scale pile load tests were carried out including axial compression and uplift load tests. The results of the full-scale load tests are used to validate the theoretical model used for helical pile design installed in oil sands. This paper describes the pile installation and test setup, presents the test data, and discusses the results. RÉSUMÉ L’utilisation de piliers hélicoìdals pour des utilisations permanentes est devenue une alternative pratique et faisable au forme de ciment ou aux tuyaux d’acier enfoncés. Ceci est due à la Recherche et au Développement, à l’amélioration des équipements pour l’installation et la manufacture des piliers vissés. Il n’y a probablement aucun autre endroit au Canada où nous avons vu une croissance aussi rapide que celle de la région des sables bitumineux. Ce document vous est présenté pour vous montrer les progrès continus de quelques Recherches & Développements des piliers vissés dans le milieu des sables bitumineux. Dans ce document nous présentons les résultats d’une étude compréhensive des piliers vissés et de la surveillance des piliers hélicoìdals à hélix simple ou à hélix double installés en sables bitumineux. Neuf analyses complètes de charge de piliers vissés ont été faites incluant compression axiale et élevation de charge. Les résultats de l’étude complète de charge des piliers vissés sont utilisés pour valider le model théorique utilisé pour le plan des piliers hélicoìdals installés en sols bitumineux. Ce document décrit l’installation de piliers et les essais durant l’installation, présente les données d’analyses et en examine les résultats. 1 INTRODUCTION A helical (or screw) pile (or pier) consists of a central shaft that is made from tubular or solid square sections with one or more formed steel plates (helixes) welded near to the bottom of the shaft. Shaft diameters vary between 73 and 965 mm while helix diameters vary between 152 and 1219 mm. Single helix or multiple helixes may be used depending mainly on the soil conditions and the required piles capacities. Helical piles can be designed to resist a variety of axial loads ranging from 5 to 5000 kN. When large axial or lateral loads are required, screw piles can easily be installed at batter angles and grouped together to deliver larger resistances.
The use of helical piles for foundations offer many benefits including: high compressive and uplift capacities (three to five times that of traditional driven steel piles with the same shaft diameter and length), rapid speed of installation (typical 10 m helical pile long can be installed in about three minutes), suitability for construction in very limited access conditions, installation in frozen or muskeg like soil conditions, unlimited pile length can be installed to target the competent soil layer through the addition of extension segments and their cost effectiveness.
In addition, helical pile installation is a vibration free process. Therefore, compared to other piling types, installation of helical piles, in urban areas, is very favourable in terms of reduced construction noise levels and minimal impact to nearby structures.
The axial capacity of helical piles may be estimated analytically using the individual bearing or cylindrical shear methods which are dependent on soil parameters and pile geometry. These include variables such as: soil type, pile embedment, shaft diameter, helix diameter, number of helixes and spacing between helixes. The failure mechanism is expected to be a function of these variables. Typically the cylindrical shear method is used in design of helical piles in Alberta clays and clay till soils. However when a spacing ratio greater than 1.5 exists and is installed in cohesionless soils, Hoyt and Clemence (1989) and Narasimha Rao et al. (1990) suggested that individual plate bearing method will provide a better capacity prediction.
The rapid growth in multibillion dollar Oil sand development projects in northern Alberta has necessitated construction of a variety of structures and many are supported on deep foundations. Due to the presence of oil sand at relatively shallow depths, piles supporting these structures are typically founded in oil sands. Helical piles used to date to support residential camps, pipe racks, oil tanks, conveyors, substations, powerline towers, tie-backs, etc. have often been founded in oil sands.
The main objective of this study was to evaluate the axial performance of helical piles in oil sands. The specific objectives of the full scale load test program were to define an appropriate failure criterion for helical piles installed in oil sand, to evaluate the their compressive and tensile capacities, and to consider if there is a correlation
GeoEdmonton'08/GéoEdmonton2008
55

between installation torque and the axial capacities of piles.
2 SITE INVESTIGATION The pile load test program was carried out at Cree Burn Lodge site located north of Fort McMurray, Alberta just west of highway 63 at the Albian Sand junction and east of the Athabasca River. The site had been cleared and was originally covered with thick forest and brush. The topography of the site was relatively flat and was graded during the summer of 2007.
The load testing program consisted of nine full-scale load tests carried out in two Phases at two different locations on the site. Phase 1 of testing was carried out between July 5, 2007 and July 9, 2007 and included a total of four load tests (two axial compression and two axial tension (uplift) loads tests). Phase 2 of the load testing program was carried out between January 6, 2008 and January 12, 2008 and included a total of five load tests (two compression and three uplift load tests). Phase 1 of pile load tests was carried out in a location near the central part of the site while Phase 2 was carried out in the northwest corner of the site (due to inaccessibility of central part of the site at the time of testing). Phases 1 and 2 test locations were about 100 m apart.
The subsurface soil stratigraphy at the site consisted of fine to medium grained, compact to dense, moist to wet sand, extending to depths between 1.1 m to 2 m, underlain by dense to very dense oil sand. The sand was brown, medium grained and contained traces of gravel. Standard Penetration Test (SPT) results for sand layer were 11 and 22 blows per 300 mm of penetration indicating a compact sand state.
Oil sand was black, silty, fine to medium grained, moist and contained traces of gravel. SPT tests carried out at selected depths in the oil sand varied between 26 to over 100 blows per 300 mm of penetration indicating a dense to very dense state. As indicated by Sharma and Joshi (1988); Alberta’s oil sand deposits of the McMurray Formation are a Lower Cretaceous unit consisting of uncemented quartz sand with interbedded clay shale. The oil sand is typically composed of the following components (Scott and Kosar 1984): (1) fine to medium grained uniform quartz sand and (2) pore fluids consisting of bitumen, water and occasionally free gas. The sand grains are wet and the water forms a continuous phase throughout the oil and sand matrix. Bitumen occupies the remaining pore space. Dissolved gases are found within the liquid phases and some free gas is occasionally present depending on in situ temperatures and phases.
Groundwater level was relatively high and was measured at depths varying between 0.5 m to 2 m below existing ground. Wet and dry unit weight of sand was about 22 kN/m3 and 19 kN/m3 while for oil sand were 21.6 kN/m3 and 18 kN/m3, respectively. Results of triaxial compression tests on high quality cores in undisturbed oil sand samples (Sharma et al.; 1986) indicated a peak frictional angle of 50° and a residual friction angle of 38°.
3 TEST PILE CONFIGURATIONS AND INSTALLATION
3.1 Pile Configurations Two pile configurations were considered for the study including piles with either a single or double helixes as illustrated in Figure 1. The test piles were manufactured by Almita Manufacturing Ltd. of Ponoka, Alberta. Each pile is composed of a central cylindrical shaft with a diameter of 178 mm, 5.8 m long, with a single or double helixes, 406 mm in diameter and 19.1 mm thick. Piles with double helixes were fabricated such that the spacing ratio (S/D) equalled 3 to reduce the interaction of the end bearing between the individual helixes. The pitch for each helix was 150 mm. The helical shape of the bearing plates minimized soil disturbance during installation.
* All dimensions in mm Figure 1 Test Pile Configurations 3.2 Pile Installation Helical piles are installed through the use of mechanical torque applied at the pile head. Torque applied at the pile head during pile installation was continuously recorded and penetration depth was measured. Final measured torque at the end of pile installation and total embedment depths are summarized in Table 1. It can be seen from
GeoEdmonton'08/GéoEdmonton2008
56

Table 1, that in general, torque values for pile tested in Phase 1 were about 35% higher than torque values recorded for piles tested in Phase 2. This can be attributed to the variability of oil sand depth and strength as observed from torque chart records. Moreover, it can be noted from Table 1, that piles with double helixes required in general about 17% to 29% higher torque values compared to piles with a single helix. For pile T5, (double helixes pile) the torque required to install was about 95% of that that was required to install pile T3 (single helix pile) which indicates a localized softer soil condition at the location of test pile T5.
Table 1. Summary of pile installation.
Pile No
No of Helixes
Test Type Installation Torque kN.m
Embedment Depth m
Phase 1 Pile Load Testing
C1 Single Compression 71.5 5.2
C2 Double Compression 88.1 5.0
T1 Single Uplift 72.5 5.1
T2 Double Uplift 84.7 5.1
Phase 2 Pile Load Testing
C3 Single Compression 52.3 5.3
C4 Double Compression 67.8 5.3
T3 Single Uplift 54.2 5.1
T4 Double Uplift 73.2 5.2
T5 Double Uplift 51.5 4.9
4 TEST SETUP Pile load test setup consisted of either two reaction piles (Phase 1) or four reaction piles (Phase 2) and a test pile. The reaction piles in Phase 1 were positioned at spacing of 6 m (about 7.5 helix diameters from the tested pile). The reaction piles in Phase 2 of pile load testing were positioned in rectangular shape at distances of 4 m and 3 m, so that a clear distance between any reaction pile and the tested pile is about 6 helix diameters (2.5 m). Figures 2 and 3 show typical pile load test setups for uplift load testing for Phases 1 and 2, respectively. The four reaction piles configuration (Phase 2) was used to allow for loading piles up to their ultimate capacities (i.e. failure loads). Upon completion of the test program, all piles were removed by reverse rotation.
For Phase 1, the 150 ton capacity test beam was centered over the test pile and supported on two reaction piles. The test beam and reaction piles were tied with steel plates of nominal thickness of 25 mm using 32 mm diameter all-thread Grade 8 steel bars. The connections were designed to adequately transfer the applied loads to the piles, to prevent slippage, rupture or excessive elongation of the connections under the maximum loads. The axial loads were applied at the pile head using an 800 kN hydraulic jack placed at the pile head for axial compression load tests. In axial compression tests, an additional steel bearing plate was placed between the top
of the jack ram and the bottom of the test beam. Conversely, for the axial tension tests, the hydraulic jack was situated above the test beam, and acted against a reaction frame which compressed an inverted pile cap and steel bearing plates. The reaction frame was anchored to the test piles using steel bars that were bolted to the pile cap test plate. For Phase 2, the 250 ton capacity test beam was centered over the test pile and supported on two reaction beams. Each of the reaction beams were supported on two reaction piles. Load was applied using a 2500 kN hydraulic jack acting against the reaction beam.
Figure 2 Test setup for uplift pile load test (Phase 1)
Figure 3 Test setup for uplift pile load test (Phase 2) Load at pile head was measured using a load cell placed between the hydraulic jack and the reaction beam for the case of compression load tests or placed at the top of the reaction beam and connected to the test pile using plate and tie rods for the case of tension pile load tests. Axial movements at pile head were monitored at two points during the test, using independently supported dial gauges (0.025mm accuracy- 50 mm travel). Another two dial gauges were used to monitor lateral movements along the circumference of the pile shaft to ensure that loads are axial and no excessive lateral movement has occurred during pile testing. Another set of dial gauges (one dial gauge for each reaction pile) were placed at pile head to monitor the reaction pile movement during load
GeoEdmonton'08/GéoEdmonton2008
57

testing. An independent reference beams for dial gauge support were provided at each pile location. The reference beam was supported at a minimum distance of 2.50 m from the test pile or reaction pile centers. Dial gauge readings were recorded manually at selected increment throughout the test duration.
Pile axial load tests were conducted according to the ASTM D-1143 Quick Load Test Method for Piles under Static Axial compressive Load and ASTM D-3689 Quick Load Test Method for Piles under Static Axial Tensile Load. Loads were applied in increments of approximately 10 % of the estimated pile capacity in 10 minutes time intervals. Pile loading for Phase 1 was stopped at load level of about 800 kN due to the limitation of the hydraulic jack. However in Phase 2, pile loading was continued until continuous jacking was required to maintain the load (i.e. plunging failure) or where settlement at pile head reached 10% of helix diameter.
5 TEST RESULTS 5.1 Axial Compressive Load Test Results The results of axial compressive load tests are presented in Figures 4 and 5 in the form of load settlement curves for Phases 1 and 2, respectively. As indicated previously, the pile load tests in Phase 1 (Fig. 4) were terminated at axial loads of about 800 kN due to equipment limitations. It can be seen from Fig. 4 that cycles were carried out at loads of about 450 kN (for pile C1) and 180 kN (for pile C2) indicating that the cyclic loading had a minor effect on the axial compressive response.
It can be seen from Fig. 5 that the load-settlement curves for tested piles include three different regions including: a linear region with steep slope (i.e. high stiffness); a transient non-linear region with a gradual decreasing slope and a final linear region with a flat slope (i.e. low stiffness). Both piles with single and double helixes showed almost identical behaviour at the early stages of loading up to loads of about 800 kN with corresponding settlements varying between 9 mm and 14 mm. However, at higher settlement levels, pile C4 with double helixes showed stiffer response compared to pile C3 with single helix. This behaviour suggests that for pile C4, both helixes acted individually. The behaviour of helical piles, reported in this study, with double helixes spaced at spacing ratio (S/D) of 3 and tested in cohessionless soil, are in general agreement with the findings of Hoyt and Clemence (1989). Moreover, pile C3 showed plunging failure (i.e. a failure where continuous pumping was required to maintain the load at the pile head) at settlement of about 50 mm while pile C4 continued to resist loads till to the end of the test.
Comparing between response of piles C1 and C3 (see Figs. 4 and 5) indicate that piles tested in Phase 1, offered slightly stiffer response compared to that piles tested in Phase 2. This can be explained by the fact that the oil sand layer in Phase 1 of pile load testing, was present at a relatively shallower depth (depth of about 1.1 m) compared to 2 m in Phase 2 of pile load testing.
Figure 4 Loads at pile head vs. settlements for axial compression load tests (Phase 1)
Figure 5 Loads at pile head vs. settlements for axial compression load tests (Phase 2) 5.2 Axial Compressive Load Pile Capacity The axial compressive capacities, Qucomp, of helical piles were defined as the load corresponding to a settlement level equal to 10% of the helix diameter (Terzaghi 1942). The ultimate pile capacity using Terzaghi definition ensures the full mobilization of end bearing resistance at such high settlement levels. Therefore, Terzaghi definition is suitable for the present study since end bearing resistance of helical piles tested in this study is a major component of the compressive pile capacity. However, it should be noted that in many cases, design is controlled by settlement tolerance which is typically about 25 mm in most design codes. Furthermore, the helix diameter of helical piles may vary between 150 mm and 1219 mm. Hence, it may be more suitable to limit the maximum settlements by defining the axial capacities of helical piles as the load applied at the pile head at settlement level of 5% of the average helix diameter.
The ultimate compressive load capacities for piles C3 and C4 are presented in Table 2. It can be seen from Table 2, that the ultimate capacities of piles C3 and C4 based on 5% displacement failure criterion were 940 kN and 1000 kN, respectively, while the ultimate compressive
GeoEdmonton'08/GéoEdmonton2008
58

load capacities using the 10% failure criterion were 1250 and 1580 kN, respectively.
As identified in the Canadian Foundation Engineering Manual, (2006), the ultimate capacity of helical piles may be estimated from the following expression:
fh QQR +=∑ [1]
Where R = ultimate pile capacity; Qh = individual helix bearing capacity; Qf = shaft resistance. The individual helix bearing capacity can be estimated from the following expression:
γγγ DNNDNSAQ qhcuhh 5.0( ++= [2]
where Ah = projected helix area; Su = undrained shear strength of the soil; γ = unit weight of the soil;
Dh = depth to helical bearing plate; D = diameter of helical plate; Nc, Nq and N = bearing capacity factors for local shear conditions. The ultimate compressive capacities of piles C3 and C4 were also estimated using Eqns. 1 and 2 and the results are presented in Table 2. The estimated capacities were in reasonable agreement with the measured ultimate compressive pile capacities obtained using 10% failure criterion. 5.3 Axial Tension (Uplift) Load Test Results The results of axial tension (uplift) load tests are presented in the form of load-displacement curves in Figures 6 and 7 for Phases 1 and 2. Similar to compression test results, the initial part of the load-displacement curves were linear up to a displacement of about 3 mm, followed by a nonlinear part up to displacements of about 26 to 28 mm. However at higher
displacement levels (Fig. 7) both single and double helix piles T3 and T4 exhibited an asymptote (plateau). The asymptote for the piles gave the maximum resistance of the pile as described by Hirany and Kulhawy (1989).
It can also be seen from Fig. 7 that both piles T3 and T4 showed similar response at the early stages of loading (up to a displacement of about 3 mm). However, at higher displacement levels pile T4 showed stiffer response compared to pile T3, manifesting in a higher stiffness at the same displacement levels.
Piles T1 and T2 tested in Phase 1 (Fig. 6), showed stiffer response compared to piles T3 and T4 tested in Phase 2 (Fig. 7) due to the additional frictional resistance gained from the oil sand layer encountered at shallower depth at Phase 1 test location. Comparing between load-displacement curves for both piles with single and double helixes (T3 and T4) suggests that a significant component of pile resistance was gained from end bearing resistance component and hence the individual helix failure mode is the governing mechanism. 5.4 Effect of Embedment Depth into Oil Sand
In order to investigate the effect of the embedment depth into the oil sand layer on the uplift behaviour of piles, an additional uplift load test was carried out at a location where the depth to the oil sand layer is about 3 m and pile T5 with double helixes was tested and the results are presented in Figure 8. It can be seen from Fig. 8 that depth to the oil sand had a major effect on the shaft resistance. The initial part of the load-displacement curve that presents the shaft friction component of the pile resistance was the steepest for the case of pile T2 (where depth to oil sand layer is 1.1 m) followed by pile T4 (depth to oil sand layer is 2 m) followed by pile T5 (depth to oil sand layer is 3 m). The shaft resistance component for piles T2, T4 and T5 were about, 400 kN, 320, kN and 250 kN, respectively. Therefore, the more the pile embedded into oil sand layer, the more gain in shaft frictional resistance. Another important observation for pile T4 that was tested at location where oil sand layer was at 2 m below ground surface, the second part of the load-displacement which represents, the end bearing resistance, showed stiffer response than pile T5 where oil sand layer was relatively deep (about 3 m below existing ground surface).
Table 2. Summary of axial load test results
Measured Ultimate Pile Capacity, kN
Estimated Ultimate Pile Capacity kN
Pile No
No of Helixes
(10% of Helix Dia.)
(5% of Helix Dia.)
Shaft Resistance
Individual Helixes
Ultimate Pile Capacity
Prediction Ratio
Torque kN.m
KT m
-1
Compression Test Results
C3 Single 1250 940 432 648 1080 0.86 52.3 23.9 C4 Double 1580 1000 432 1078 1510 0.96 67.8 23.3 Tension (Uplift) Test Results
T3 Single 620 560 258 307 565 1.01 54.2 10.3 T4 Double 960 820 258 576 834 1.02 73.2 11.2 T5 Double 720 630 164 457 621 0.99 51.5 12.2
GeoEdmonton'08/GéoEdmonton2008
59

Figure 6 Loads at pile head vs. displacements for axial tension (uplift) load tests (Phase 1)
Figure 7 Loads at pile head vs. displacements for axial tension (uplift) load tests (Phase 2)
Figure 8 Effect of embedment depth into oil sand on the uplift resistance of helical piles 5.5 Ultimate Uplift Capacity
The ultimate uplift capacities of tested piles are also defined using the 10% and 5% failure criteria and the
results are presented in Table 2. The ultimate uplift capacities for pile T3 with a single helix and pile T4 with double helixes at a displacement level of 10% were 620 kN and 960 kN, respectively. The ultimate uplift capacities of piles T3 and T4 at a displacement level of 5% were 560 kN and 820 kN, respectively. Comparing between the two failure criteria indicate that a slight increase of uplift capacities of tested piles by about 10% to 17% was gained as a result of using the 10% instead of 5% failure criterion. Therefore, defining the uplift capacity using 5% failure criterion will provide a reasonable estimate of ultimate uplift capacities of helical piles while maintaining reasonable displacement levels.
Similar to compressive loading, uplift capacity may be estimated using Eqn 1 where the individual helix uplift capacity, Qh can be estimated using the following expression:
*qhhh FDAQ γ= [3]
where Ah = projected helix area; γ = unit weight of the soil;
Dh = depth to helical bearing plate; Fq* = breakout factor.
The result of the estimated uplift capacities are also summarized in Table 2. The uplift capacities were estimated using Eqn 1. It should be noted that the residual frictional resistance angle of oil sand was used for estimating the frictional resistance and end bearing resistance for all piles except T5. However, for pile T5 a frictional resistance angle of 36° was used to estimate the end bearing component to account for the proximity of the top helix from the upper compact sand layer. It can be seen from Table 2 that a reasonable agreement was obtained between measured and estimated uplift capacities. 5.6 Comparison between Compressive and Uplift Load
Test Results The load-displacement curves of both compression and uplift load tests for Phase 2 are compared in Figure 9. It can be seen from Fig. 9 that load-displacement curves were almost identical for all tests at the early stages of loadings up to displacement of about 3 mm (about 0.75% of the helix diameter) which represented the pile shaft resistance. Therefore, skin friction for both compression and uplift loading conditions for helical piles tested in oil sand, and considered in the study, were similar. However, at higher displacement levels, piles tested in compression offered higher resistance compared to piles tested in tension. Comparing between axial capacities of piles tested in compression and tension (Table 2) indicates that the compressive capacities of piles C3 and C4 were 40% to 50% higher than the uplift capacities of piles T3 and T4. This can be explained as a result of the differences in the
GeoEdmonton'08/GéoEdmonton2008
60
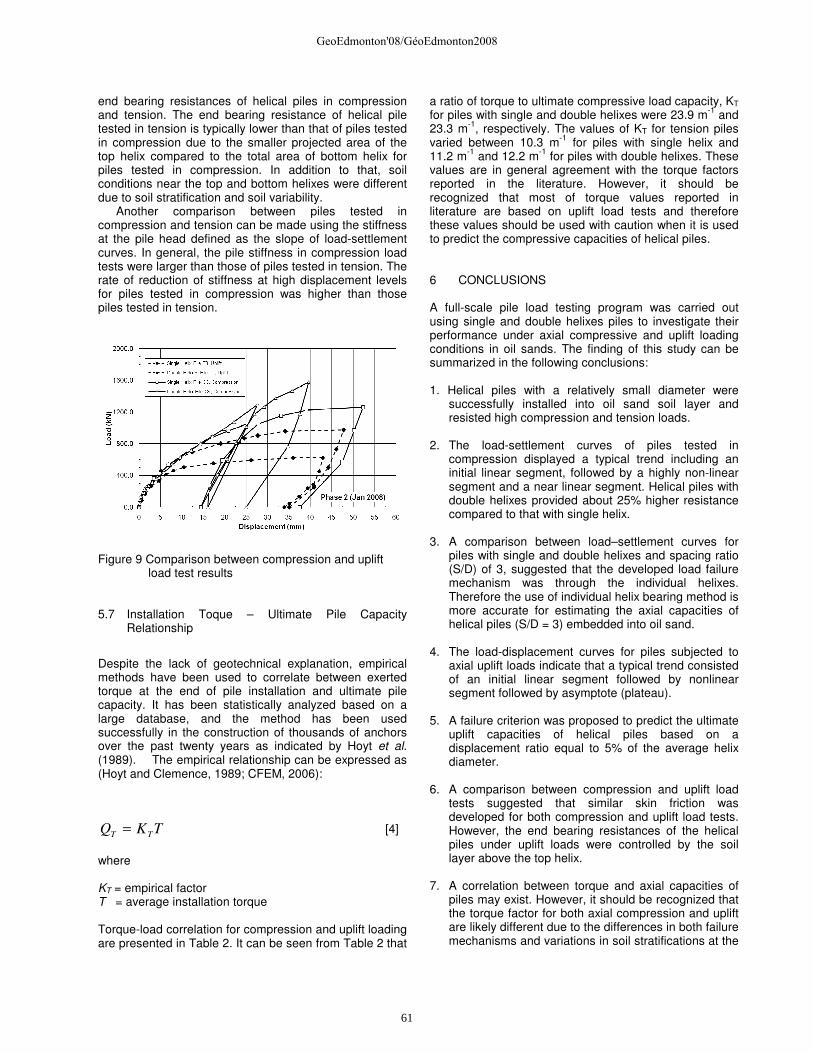
end bearing resistances of helical piles in compression and tension. The end bearing resistance of helical pile tested in tension is typically lower than that of piles tested in compression due to the smaller projected area of the top helix compared to the total area of bottom helix for piles tested in compression. In addition to that, soil conditions near the top and bottom helixes were different due to soil stratification and soil variability.
Another comparison between piles tested in compression and tension can be made using the stiffness at the pile head defined as the slope of load-settlement curves. In general, the pile stiffness in compression load tests were larger than those of piles tested in tension. The rate of reduction of stiffness at high displacement levels for piles tested in compression was higher than those piles tested in tension.
Figure 9 Comparison between compression and uplift load test results 5.7 Installation Toque – Ultimate Pile Capacity
Relationship
Despite the lack of geotechnical explanation, empirical methods have been used to correlate between exerted torque at the end of pile installation and ultimate pile capacity. It has been statistically analyzed based on a large database, and the method has been used successfully in the construction of thousands of anchors over the past twenty years as indicated by Hoyt et al. (1989). The empirical relationship can be expressed as (Hoyt and Clemence, 1989; CFEM, 2006):
TKQ TT = [4]
where KT = empirical factor T = average installation torque Torque-load correlation for compression and uplift loading are presented in Table 2. It can be seen from Table 2 that
a ratio of torque to ultimate compressive load capacity, KT for piles with single and double helixes were 23.9 m-1 and 23.3 m-1, respectively. The values of KT for tension piles varied between 10.3 m-1 for piles with single helix and 11.2 m-1 and 12.2 m-1 for piles with double helixes. These values are in general agreement with the torque factors reported in the literature. However, it should be recognized that most of torque values reported in literature are based on uplift load tests and therefore these values should be used with caution when it is used to predict the compressive capacities of helical piles. 6 CONCLUSIONS A full-scale pile load testing program was carried out using single and double helixes piles to investigate their performance under axial compressive and uplift loading conditions in oil sands. The finding of this study can be summarized in the following conclusions: 1. Helical piles with a relatively small diameter were
successfully installed into oil sand soil layer and resisted high compression and tension loads.
2. The load-settlement curves of piles tested in
compression displayed a typical trend including an initial linear segment, followed by a highly non-linear segment and a near linear segment. Helical piles with double helixes provided about 25% higher resistance compared to that with single helix.
3. A comparison between load–settlement curves for
piles with single and double helixes and spacing ratio (S/D) of 3, suggested that the developed load failure mechanism was through the individual helixes. Therefore the use of individual helix bearing method is more accurate for estimating the axial capacities of helical piles (S/D = 3) embedded into oil sand.
4. The load-displacement curves for piles subjected to
axial uplift loads indicate that a typical trend consisted of an initial linear segment followed by nonlinear segment followed by asymptote (plateau).
5. A failure criterion was proposed to predict the ultimate
uplift capacities of helical piles based on a displacement ratio equal to 5% of the average helix diameter.
6. A comparison between compression and uplift load
tests suggested that similar skin friction was developed for both compression and uplift load tests. However, the end bearing resistances of the helical piles under uplift loads were controlled by the soil layer above the top helix.
7. A correlation between torque and axial capacities of
piles may exist. However, it should be recognized that the torque factor for both axial compression and uplift are likely different due to the differences in both failure mechanisms and variations in soil stratifications at the
GeoEdmonton'08/GéoEdmonton2008
61

helix levels. Therefore, torque values should be used with caution to predict the compressive capacities of helical piles. It is suggested to carry out a full scale static load test program at specific sites to evaluate the torque factor that can be used and to validate the axial capacities of production piles. Then the torque-pile capacity relationship may be used throughout the site for quality assurance purposes.
ACKNOWLEDGEMENTS The author would like to extend his gratitude to his employer and ATCO Frontec for the opportunity to carry out the load testing program at their site. The author would like to thank his coworkers and field staff for their patience, attention to details and careful installation and load testing methods for piles considered in this study. In particular the author would like to thank Messrs, Larry Kaumeyer, Richard Schmidt, Colin McCann, and Patrick Lentz. REFERENCES ASTM D 1143-81. 1997. Standard Test Method for Piles
Under Static Axial Compressive Load; (Reapproved 1994). Annual Book of ASTM Standards, 04.08: 95-105.
ASTM D 3689-90. 1997. Standard Test Method for Individual Piles Under Static Axial Tensile Load; (Reapproved 1995). Annual Book of ASTM Standard, 04.08: 366-375.
CFEM. 2006. Canadian Foundation Engineering Manual. 4th Edition. Canadian Geotechnical Society, Technical Committee on Foundations, BiTech Publishers Ltd., Richmond, BC, 488 p.
Das, B. M. 1990. Earth Anchors. Elsevier, Amsterdam, 241p.
Hoyt, R. M., and Clemence, S. P. 1989. Uplift Capacity of Helical Anchors in Soil. Proceedings of 12th International Conference on Soil Mechanics and Foundation Engineering, Rio de Janerio, Brazil, 2: 1019-1022.
Kulhawy, F. H. and Hirany, A. 1989. Interpretation of Load Tests on Drilled Shafts; Part 2: Axial Uplift. Proceedings of Foundation Engineering: Current Principles and Practices, ASCE, 2: 1150-1159.
Meyerhof, G. G., and Adams, J. I. 1968. The Ultimate Uplift Capacity of Foundations. Canadian Geotechnical Journal, V, ( 4): 225-244.
Mitsch, M. P., and Clemence, S. P. 1985. The Uplift Capacity of Helix Anchors in Sand. Uplift Behavior of Anchor Foundations in Soil. Proceedings of ASCE, New York, N.Y., 26-47.
Scott, J. D., and Kosar, K. M. 1984. Geotechnical Properties of Athabasca Oil Sands; Presented at WRI-DOE Tar Sand Symposium Sponsored by Western Research Institute and U.S. Department of Energy, Vail, CO, 1-32.
Sharma, H. D., and Joshi, R. C. 1988. Drilled Pile Behaviuor in Granular Deposits. Canadian Geotechnical Journal, 25: 222-232.
Sharma, H. D., Haris, M. C., Scott, J. D. and McAllister, K. W. 1986. Bearing Capacity of Bored Cast-in-Place Concrete Piles on Oil Sand. Journal of the Geotechnical Engineering Division, ASCE, 112(12): 1101-1116.
Terzaghi, K. 1942. Discussion of the progress report of the committee on the bearing value of pile foundations. Proceedings of the American Society of Civil Engineers, 68: 311-323.
Vesic, A. S. 1971. Breakout Resistance of Objects Embedded in Ocean Bottom. Journal of Soil Mechanics and Foundation Division, ASCE, 97(SM 9): 1183-1205.
GeoEdmonton'08/GéoEdmonton2008
62