pile-soil structure interaction in jacket latformutpedia.utp.edu.my/6085/1/fatin najwa binti...
TRANSCRIPT

PILE-SOIL STRUCTURE INTERACTION IN JACKET PLATFORM
UNDER LATERAL LOADINGS
by
Fatin Najwa binti Kamaruddin
A project dissertation submitted to the
Civil Engineering Programme
Universiti Teknologi PETRONAS
in partial fulfilment of the requirement for the
BACHELOR OF ENGINEERING (HONS)
CIVIL ENGINEERING

ii
CERTIFICATION OF APPROVAL
PILE-SOIL STRUCTURE INTERACTION IN JACKET PLATFORM
UNDER LATERAL LOADINGS
by
Fatin Najwa binti Kamaruddin
A project dissertation submitted to the
Civil Engineering Programme
Universiti Teknologi PETRONAS
in partial fulfilment of the requirement for the
BACHELOR OF ENGINEERING (HONS)
CIVIL ENGINEERING
Approved by,
__________________
(Prof. Kurian V. John)

iii
CERTIFICATION OF ORIGINALITY
This is to certify that I am responsible for the work submitted in this project, that the
original work is my own except as specified in the reference and acknowledgements,
and that the original work contained herein have not been undertaken or done by
unspecified sources or persons.
___________________________________
(FATIN NAJWA BINTI KAMARUDDIN)
iv
ABSTRACT
It is essential for a fixed offshore platform supported by pile foundation to resist
lateral loading due to wind, wave and current forces subjected to the platform since
minimal movement is required to provide stable work place. Thus, the design of the
pile foundation should satisfy the complicated and uncertain environmental
magnitude. The response of the pile foundation to the environmental load is strongly
affected by pile structure and soil structure interaction. Since the development of p-y
curve represents the pile foundation and soil structure interaction, it will be used to
model the soil resistance to the pile movements and the results obtained will be
analyzed. Structural Analysis Computer System (SACS) will be employed in this
paper to model the structural member of the platform and the pile foundation. A
changed in parameter will be tested to account for responses of the pile foundation to
soil structure interaction which is the pile thickness. The responses of pile due to
these transient loadings have been obtained.
v
ACKNOWLEDGEMENTS
My deepest gratitude goes to Prof Kurian V. John, Professor in University Teknologi
PETRONAS, as my supervisor for my Final Year Project, for giving me a chance to
do my project under his supervision, for his continuous support and delivering many
valuable lessons on both technical and non-technical matters to me.
My sincere and grateful thanks to Ir. Mohamed Mubarak bin Abdul Wahab, for his
informative supervision and countless hours spent in sharing his understanding,
profound knowledge and valuable experiences throughout my project. His kind
assistance and guidance from the beginning to the end of the project really help me to
finish my Final Year Project 1 and 2 successfully.
Not to forget, many thanks to my Final Year Project 1 & 2 coordinator, Dr. Wee Teo
and Ir. Idris bin Othman respectively for their kind help, support and guidance
throughout Final Year Project courses in these two semesters.
Here, I would like to express my full appreciation towards my internal examiner, Ir.
Dr. Mohd Shahir Liew and also my external examiner, Ir. Dr. Yee Jeffrey for
evaluating me during the presentation. Their constructive comments, cooperation,
guidance and generosity in sharing their knowledge and experience made the
learning episode here more comfortable.
I am very thankful to have post graduates students, Mr. Zafarullah and Mr. Nelson
Julio Cossa who are willing to spend their time to share their knowledge and teach
me to use SACS software. And to both of my parents, thank you for their continuous
support and for being there with me during ups and downs, throughout these two
semesters. Last but not least, to my friend, their presence will always be meaningful
to me.
The support and encouragement from the people above will always be a pleasant
memory throughout my life. Thanks again to all; my dear friends and family with
your kindness and formal or informal helps will always be remembered.

vi
TABLE OF CONTENTS
CERTIFICATION OF APPROVAL ......................... Error! Bookmark not defined.
CERTIFICATION OF ORIGINALITY ................................................................. iii
ABSTRACT ............................................................................................................... iv
ACKNOWLEDGEMENTS ....................................................................................... v
LIST OF FIGURES ................................................................................................ viii
LIST OF TABLES .................................................................................................... ix
CHAPTER I ................................................................................................................ 1
INTRODUCTION ...................................................................................................... 1
1.1 Background of Study ............................................................................................... 1
1.2 Problem Statement ................................................................................................... 2
1.3 Objectives of the Study ............................................................................................ 3
1.4 Scope of the Study ................................................................................................... 3
CHAPTER 2 ............................................................................................................... 5
LITERATURE REVIEW .......................................................................................... 5
2.1 Introduction .............................................................................................................. 5
2.2 Types of Offshore Platforms .................................................................................... 5
2.2.1 Fixed Structures ............................................................................................... 5
2.2 Geotechnical characteristics of some offshore regions ............................................ 6
2.3 Soil Properties .......................................................................................................... 7
2.3.1 Strength and Stiffness ...................................................................................... 7
2.4 Load Transfer Mechanism from Pile to Soil ............................................................ 8
2.5 Procedure employed for p-y curve, t-z curve and q-z curve ..................................... 8
2.6 Previous study on similar type of research ............................................................ 12
2.7 Gantt chart & Key Milestones ............................................................................... 17
CHAPTER 3 ............................................................................................................. 19
METHODOLOGY ................................................................................................... 19

vii
3.1 Research Methodology .......................................................................................... 19
3.1.1 Platform Description ...................................................................................... 20
3.1.2 Environmental and Load Data ....................................................................... 21
3.1.3 Modelling Platform ........................................................................................ 23
3.1.4 Input Files ...................................................................................................... 25
3.1.5 Pile/Structure Interaction Analysis ................................................................ 28
CHAPTER 4 ............................................................................................................. 29
RESULT AND DISCUSSION ................................................................................. 29
4.1 P-Y Curve .............................................................................................................. 29
4.2 Axial T-Z Curve ..................................................................................................... 33
4.3 End Bearing T-Z Curve.......................................................................................... 36
4.4 Changing the parameter ......................................................................................... 37
4.5 Unity check ratio .................................................................................................... 39
CHAPTER 5 ............................................................................................................. 41
CONCLUSIONS AND RECOMMENDATIONS ................................................. 41
REFERENCES ......................................................................................................... 42
viii
LIST OF FIGURES
Figure 1: P-y curve for short-term static load case ...................................................... 9
Figure 2: Recommended t-z curve for non-carbonated soils ..................................... 10
Figure 3: Recommended q-z curve for sands and clays ............................................. 11
Figure 4: Methodology process flow ......................................................................... 20
Figure 5: Load condition 63 acting on the structures ................................................. 23
Figure 6: SEASTATE Load Generation .................................................................... 24
Figure 7: F9JT-A platform modelled in Precede. (a) XZ Front View (b) YZ Right
View (c) XY Top View .............................................................................................. 25
Figure 8: SACS Input File.......................................................................................... 26
Figure 9: SEASTATE Option .................................................................................... 27
Figure 10: Load Case Selection ................................................................................. 27
Figure 11: General p-y curve obtained for the whole soil layers ............................... 29
Figure 12: P-y curve for soil layers 2.00 m until 4.10 m ........................................... 30
Figure 13: P-y curve for soil layers 4.11 m until 30.00 m ......................................... 31
Figure 14: P-y curve for soil layers 31.01 m until 52.02 m ....................................... 31
Figure 15: General t-z curve for whole soil layers ..................................................... 33
Figure 16: T-z curve for soil layers 4.11 m till 151. 31 m ......................................... 34
Figure 17: T-z curve for soil layers 4.10 m until 134.30 m ....................................... 35
Figure 18: General q-z curve for the whole soil layers .............................................. 36
Figure 19: Final deflections for load case ST02 in pile head coordinates for wall
thickness 6.0 cm ......................................................................................................... 37
Figure 20: Final deflections for load case ST02 in pile head coordinates for wall
thickness 4.0 cm ......................................................................................................... 37
Figure 21: Unity check ratio for pile joint 101 under load case ST02 with wall
thickness of 6.0 cm ..................................................................................................... 39
Figure 22: Unity check ratio for pile joint 101 under load case ST02 with wall
thickness of 4.0 cm ..................................................................................................... 39

ix
LIST OF TABLES
Table 1: FYP 1 Gantt Chart & Key Milestones ......................................................... 17
Table 2: FYP 2 Gantt Chart & Key Milestones ......................................................... 18
Table 3: Load combinations ....................................................................................... 22
Table 4: Design wave criteria for load condition 63 .................................................. 22
Table 5: Values for associated current for load condition 63 .................................... 23
Table 6: Pile group properties .................................................................................... 27
Table 7: Comparison of deflections for wall thickness 6.0 cm and 4.0 cm ............... 38
Table 8: Percentage difference between wall thickness 6.0 cm and 4.0 cm
respectively ................................................................................................................ 38

1
CHAPTER I
INTRODUCTION
1.1 Background of Study
Offshore jacket structures have been used in oil and gas exploration and production
for decades. They are installed at moderate depth up to 400m depth. In the North Sea
area, the existing jackets have typically been designed for a life of 20 years [1]. In
the present days, engineering practices has allowed more critical and complicated
structures to be designed. Thus, offshore structures should be designed to experience
minimal movement to provide a stable work station for operations such as drilling
and production of oil.
The design of offshore structures should satisfy the complicated and, in most cases,
combined environmental phenomenon of extremely uncertain magnitude of transient
loading (eg. Wind, wave, current, operational loads etc.) [14].
In recent studies, there have been experimental and analytical investigations carried
out to determine response of offshore structures through Finite Element Analysis
Methods. Advanced methods have been developed, such as the Stochastic Response
Surface Method and Spectral Stochastic Finite Element Method [14].
2
Overall structural response and capacity of this type of platform greatly depends on
the member behavior in the non-linear range of deformation and non-linear
interaction of the foundation with the soil [9].
Foundation piles give a significant substantial effect on the response of fixed
offshore structures [11]. The response of the pile foundation and soil structure
interaction is determined through p-y curve. The most commonly used methods for
p-y curve development are based on a relatively small amount of data in specific soil
conditions [15].
1.2 Problem Statement
In general, the magnitude of vertical and lateral loads subjected to onshore pile
groups is substantially lower compared to that supported by offshore pile groups.
[16].
Existing offshore structures are relatively safe with regards to overload from wave
and current loading, provided that the load pattern assumed in design is not
significantly altered [1]. As mentioned before, offshore structures have been
designed for a specific designed life. Some offshore structures will still be used
beyond its designed life.
Thus, it is necessary to examine severe wave forces acting on the offshore structure,
in order to perform reliable design of an offshore structure in ocean. In this case, only
maximum wind, wave and current load will be verified in the determination of p-y
curve. In addition, since large offshore platforms have heavy dead loads, the reaction
forces on the foundation become severe and very firm foundations should be
required [4].
Current knowledge of the soil-pile interaction under lateral loading needs
development because characteristics of lateral load-deflection relations of pile under
lateral loading, fundamental behavior of the soil-pile-structure system, and the
3
effects of soil nonlinearity on the soil-pile-structure response are not well understood
[3].
The major task in this research is to do investigation on pile-soil structure interaction
due to lateral loadings subjected to jacket type offshore structures in order to achieve
a reliable design. In order to determine the pile-soil structure interaction, p-y curve
first must be developed as it indicates the relationship between pile foundation and
soil interaction. The analysis of p-y curve can be performed using various existing
methods.
1.3 Objectives of the Study
The objectives of this study are:
To determine the response of the pile foundation and soil structure interaction
which is the curves needed for pile design.
The study the change in soil properties with depth and the correlation with
pile-soil interaction in offshore jacket structures.
1.4 Scope of the Study
In this project, the focuses are on
Constructing lateral load-deflection relationships of piles embedded in
heterogeneous and nonlinear soil layers.
Examine the maximum loads of the waves, wind and current acting on the
platform to determine the response evaluations for offshore structures
considering the pile-soil interaction.

4
Investigate the response offshore structures considering pile-soil interaction
in nonlinear soil layers.
The case study for this project is F9JT-A, Kumang Cluster Development Project.
This platform is located in F9 Field, offshore Bintulu, Sarawak. The field is part of
block PM318 with the water depth of 94.6 m.
5
CHAPTER 2
LITERATURE REVIEW
2.1 Introduction
In the literature review, we have reviewed four major parts which are the general
explanation about jacket platforms, geotechnical characteristics of some offshore
region, soil mechanics and pile soil interaction in offshore platforms and the previous
researches in pile soil interaction in jacket type offshore platforms.
2.2 Types of Offshore Platforms
Offshore platform is a massive structure that is meant to support the exploration and
production of oil and gas from beneath the seafloor. There are two types of offshore
platforms which are fixed and floating structures.
2.2.1 Fixed Structures
Fixed structures are structures that extend to the seabed which are Jacket, Gravity
Based Structure (GBS), Compliant Tower and Jack-Up offshore platforms.

6
Jacket Platform
Based on Chakrabati, fixed jacket platforms consist of tubular members (typically 8
in to 48 in diameter) interconnected to form a three dimensional truss. These
structures usually have four to eight legs with the outside battered to achieved better
stability against toppling This structure is usually used in moderate water depth up
to 400m. These type of structures are used both as exploratory and production
structures. [5]
2.2 Geotechnical characteristics of some offshore regions
Characteristics of soil conditions in some offshore regions arise from the depositional
environment. Also, the geomorphic and ocean processes have shaped the bathymetry
and work sediments.
Fine-grained sediments prevail further from shore and in deeper water. This is
because of the coarser terrigenous sediments cannot be transported this far, therefore
pelagic sediments prevail.
In extremely broad terms, some common seabed conditions in the major areas of oil
and gas exploration can be characterized as:
Gulf of Mexico – soft, normally consolidated, medium high plasticity clays
(~30<PI<70), often with interbedded sand layers.
Campos and Santos Basins offshore Brazil – sands and clays with high
carbonate content.
West Africa – soft, normally consolidated, very high plasticity clays
(~70<PI<120, Puech et al. 2005), often deposited rapidly by river deltas.
South-East Asia – desiccated crusts of stiff soil, which are remnants of low
sea levels during Pleistocene, with strengths one or two orders of magnitude
greater than underlying soil.
Australia’s North-West Shelf and Timor Sea – carbonate sands, silts, clay-
sized soils, often with variable cementation.

7
Different soil conditions are available across each region and each of these area is
vast.
However, the foregoing descriptions broadly characterize the type of deposit that
dominates design decisions – such as field architecture and foundation solutions – of
offshore oil and gas developments [7].
2.3 Soil Properties
It is difficult to predict the mechanical behavior of soils because of the structure of
the soil may be highly inhomogeneous which is caused by its geological history, and
it is often not possible to determine the detailed behavior of the soil by tests in the
laboratory or in situ. Usually, the mechanical properties are strongly non-linear, with
the material exhibiting irreversible plastic deformations when loaded and unloaded
and often showing anisotropic behavior.
2.3.1 Strength and Stiffness
The shear strength and stiffness of soil determines whether or not soil will be stable
or how much it will deform. The strength of soil is necessary to determine the
stability of a slope, the settlement and the limiting pressure. It is important to
differentiate between failure of a soil element and the failure of a geotechnical
structure. The shear strength of soil depends on many factors including the effective
stress and the void ratio.
The shear stiffness is important, for example, for evaluation of the magnitude of
deformations of foundations and slopes prior to failure and because it is related to
the shear wave velocity. The slope of the initial, nearly linear, portion of a plot of
shear stress as a function of shear strain is called the shear modulus.

8
2.4 Load Transfer Mechanism from Pile to Soil
The load transfer mechanism from a pile to soil is a complex system. Consider a pile
of length L. The load applied on the pile is gradually increased from zero to Q(z=0) at
the ground surface. Part of these loads will be resisted by the side friction evolved
along the shaft, Q1, and part by the soil below the tip of the pile, Q2. The frictional
resistance per unit area at any depth z may be determined as
( ) ( )
( )( )
p = perimeter of the cross section of the pile.
At ultimate load, Q(z=0) = Qu, Q1 = Qs which is the skin friction, and Q2 = Qp, the
maximum point resistance.
2.5 Procedure employed for p-y curve, t-z curve and q-z curve
The pile foundation should be designed to sustain the lateral and axial loads. The
designer should consider overload cases which the design of pile should be increased
with an appropriate factor of safety.
i. P-y curve
Based on API-RP-2A-WSD [19], lateral soil resistance deflection (p-y)
curves should be constructed using stress-stain data from laboratory soil
samples. For the lateral bearing capacity for soft clay, pu has been found
to vary between 8c and 12c except at shallow depth. Pu increases from 3c
to 9c as X increases from 0 to XR according to:
(6.8.2-1)
(6.8.2-2)

9
Where,
Pu = ultimate resistance, psi (kPa)
c = undrained shear strength for undisturbed clay soil samples, psi (kPa)
D = pile diameter, in. (mm)
γ = effective unit weight of soil, lb/in2 (MN/m
3)
J = dimensionless empirical constant with values ranging from 0.25 to
0.5 having been determined by field testing. A value of 0.5 is appropriate
for Gulf of Mexico clays.
X = depth below soil surface, in. (mm)
XR = depth below soil surface to bottom of reduced resistance zone in in.
(mm). For a condition with depth, Equations 6.8.2-1 and 6.8.2-2 are
solved simultaneously to give:
Where the strength varies with depth, Equations 6.8.2-1 and 6.8.2-2 may
be solved by plotting the two equations, i.e., pu vs. depth. The point of
first intersection of the two equations is taken to be XR. These empirical
relationships may not apply where strength variations are erratic. In
general, minimum values of XR should be about 2.5 pile diameter.
The p-y curves for the short-term static load case may be generated from
the following Figure 1:
Figure 1: P-y curve for short-term static load case

10
Where
P = actual lateral resistance, psi (kPa)
Y = actual lateral resistance deflection, in. (mm)
Yc = 2.5εcD, in. (mm)
εc = strain which occurs at one-half the maximum stress on laboratory
undrained compression tests of undisturbed soil samples
ii. T-z curve
The recommended curve for non-carbonated soils is shown in the Figure
2 below:
Figure 2: Recommended t-z curve for non-carbonated soils
Where
t = local pile deflection, in. (mm)
D = pile diameter, in. (mm)
11
t = mobilized soil pile adhesion, lb/ft2 (kPa)
tmax = maximum soil pile adhesion or unit skin friction capacity computed
according to Section 6.4, lb/ft2 (kPa)
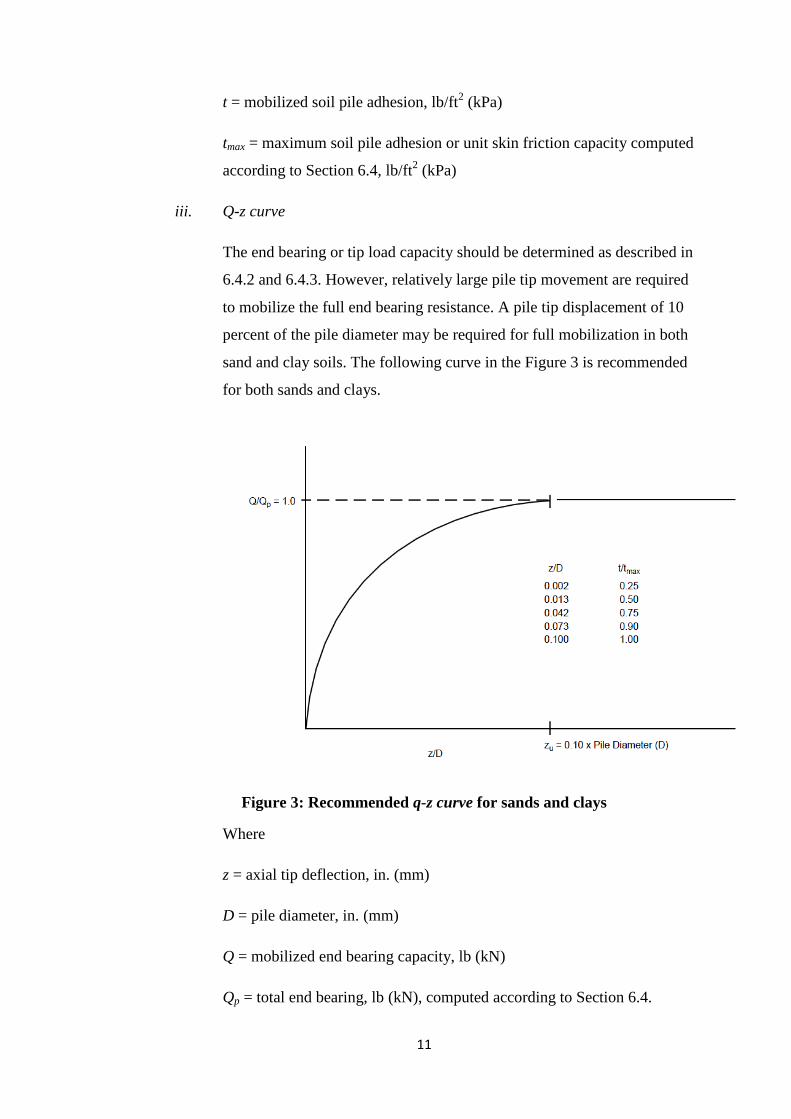
iii. Q-z curve
The end bearing or tip load capacity should be determined as described in
6.4.2 and 6.4.3. However, relatively large pile tip movement are required
to mobilize the full end bearing resistance. A pile tip displacement of 10
percent of the pile diameter may be required for full mobilization in both
sand and clay soils. The following curve in the Figure 3 is recommended
for both sands and clays.
Figure 3: Recommended q-z curve for sands and clays
Where
z = axial tip deflection, in. (mm)
D = pile diameter, in. (mm)
Q = mobilized end bearing capacity, lb (kN)
Qp = total end bearing, lb (kN), computed according to Section 6.4.

12
2.6 Previous study on similar type of research
There are some studies have been done for this similar type of research. There are
five studies that have been reviewed with different kinds of method used and
parameters tested on.
Mostafa & El Naggar (2003) [11] have studied on the response of fixed offshore
platforms to wave and current loading including soil-structure investigation. The
objective of this study is to investigate the response of offshore structures subjected
to loadings supported by clusters of piles and this study is focused on an efficient
approach to model the response of pile groups supporting a jacket structure to
transient loading.
Methods that have been applied by Mostafa & El Naggar (2003) is finite element
package (ASAS) to calculate wave forces on the tower and tower members and
employ the concept of dynamic p-y curves and dynamic p-multipliers, t-z curves and
q-z curves to model the soil reaction to pile movement.
Parameters that they have tested on are foundation flexibility, dynamic soil
resistance, pile-soil-pile interaction, soil stiffness and platform deck mass.
As a conclusion, this study has achieved the objectives and the results obtained are as
follows:
i. Foundation flexibility increases the natural period of the platform, increase in
the response of offshore towers and increases the velocity and acceleration at
the top node of the tower.
ii. Pile-soil-pile interaction increases the response along the offshore tower
height and along the pile length and it also has a significant effect on the

13
stresses along the pile shaft especially in the bending moment, one of the
most important parameters in the design.
iii. Dynamic pile soil resistance decreases the response of the tower and the
supporting piles.
iv. A decrease in the resistance of the upper soil layers results in an increase in
the response at the tower base and along the pile shaft and a decrease in the
shear force and bending moment along the pile shaft.
Asgarian & Lesani (2007) have conducted a research on pile-soil-structure
interaction in pushover analysis of jacket offshore platforms using fiber elements.
The objective of this study is to perform a study on pushover analysis with the
application of “fiber elements” which are capable of modelling post-buckling
behaviour of braces.
Agarian & Lesani (2007) have conducted the simulation of two-dimensional models
of the platforms in Persian Gulf region using “DRAIN-3DX” software which has the
capability if accounting non-linear geometric and material properties. They also have
developed numerical models that incorporated different foundations conditions for
considering pile-soil-structure interaction to perform a pushover analysis of jacket
platform.
Different from Mostafa & El Naggar (2003), this study have tested on the pile-soil
interaction analysis with actual soil in-situ characteristics, pile head fixed below
mud-line elevation, pile head hinged below mud-line elevation, application of linear
and non-linear pile stubs and combination of linear and non-linear pile-soil
characteristics.
The results of the study by Agarian & Lesani (2007), they have found out that the
most favourable capacity is achieved when pile-soil interaction is considered in the
analysis. The usage of linear pile stubs is an equivalent solution that is recommended
for the initial stiffness assessment and it is not recommended for the ultimate
14
assessment. The combination of the non-linear pile, points out the key role of the
surrounding soil resistance, especially for the first layers, which affect the static non-
linear behaviour. Last but not least, the lateral displacements of the linear pile stubs
are combined linear and non-linear pile are significant at the lowermost platform
elevation due to lack of fixity and are not practical.
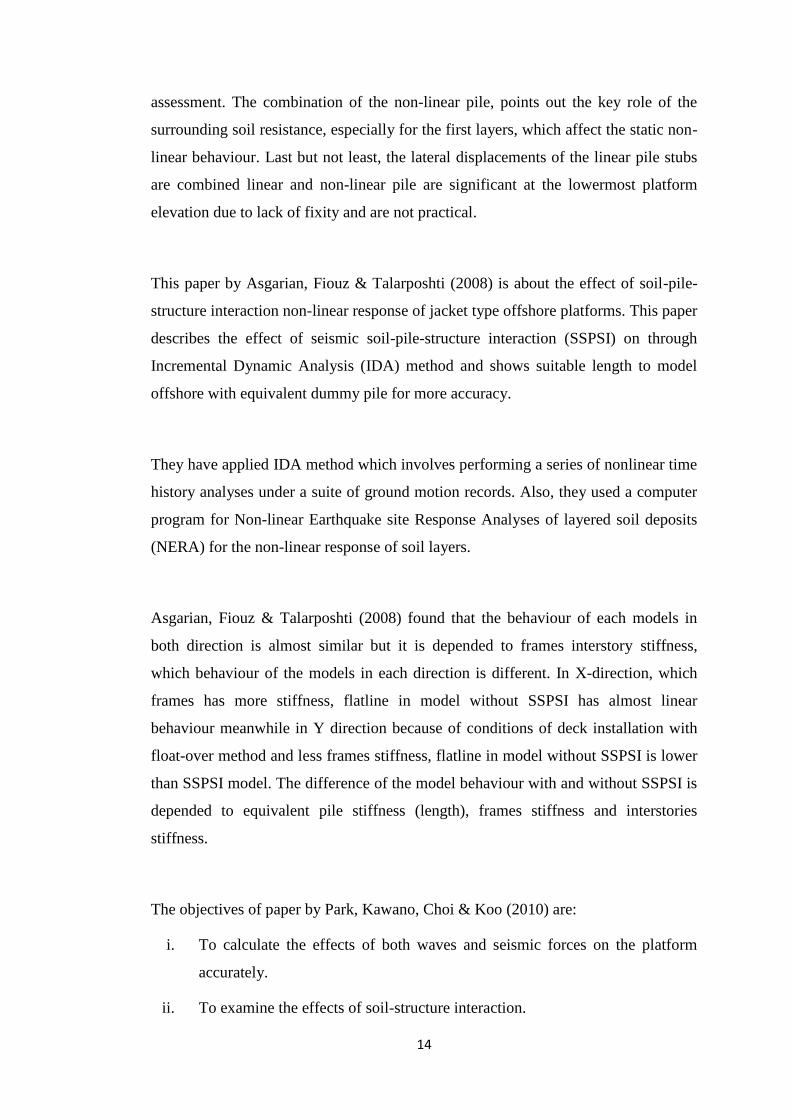
This paper by Asgarian, Fiouz & Talarposhti (2008) is about the effect of soil-pile-
structure interaction non-linear response of jacket type offshore platforms. This paper
describes the effect of seismic soil-pile-structure interaction (SSPSI) on through
Incremental Dynamic Analysis (IDA) method and shows suitable length to model
offshore with equivalent dummy pile for more accuracy.
They have applied IDA method which involves performing a series of nonlinear time
history analyses under a suite of ground motion records. Also, they used a computer
program for Non-linear Earthquake site Response Analyses of layered soil deposits
(NERA) for the non-linear response of soil layers.
Asgarian, Fiouz & Talarposhti (2008) found that the behaviour of each models in
both direction is almost similar but it is depended to frames interstory stiffness,
which behaviour of the models in each direction is different. In X-direction, which
frames has more stiffness, flatline in model without SSPSI has almost linear
behaviour meanwhile in Y direction because of conditions of deck installation with
float-over method and less frames stiffness, flatline in model without SSPSI is lower
than SSPSI model. The difference of the model behaviour with and without SSPSI is
depended to equivalent pile stiffness (length), frames stiffness and interstories
stiffness.
The objectives of paper by Park, Kawano, Choi & Koo (2010) are:
i. To calculate the effects of both waves and seismic forces on the platform
accurately.
ii. To examine the effects of soil-structure interaction.
15
iii. To recognize the importance of dynamic soil-structure interaction for
offshore platforms founded on soft soils.
iv. To clarify the effects of uncertainty due to dynamic forces for the reliability
estimation of the offshore platforms
v. To clarify the effects of uncertainties for the reliable design of offshore
platforms
In their study, they have used eigenfunction method to calculate the wave forces on
the offshore platform which is having permeable cylindrical structures. They also
used modal analysis to evaluate dynamic response of the idealized three-dimensional
platform. They have also used Monte Carlo Simulation (MCS) to access uncertainty
effects of dynamic forces and structural properties play very important roles on the
reliability evaluations of the platform.
In this study, they have proven that the dynamic response of the offshore platform
with porosity is considerably decreased with an increase of the porosity rate. The
effect of seismic forces should be evaluated accurately because the structure is
significantly more influenced by the seismic forces than by the wave force. Last but
not least, for offshore structures with pile-soil foundation system, it is important for
the reliability estimation to understand the relation between dominant frequency of
seismic motions and the natural frequency of the structure system.
The last paper which was prepared by Agaskar & Metcalf (1971) is about the
interaction between structural pile foundations of offshore platforms. The objective
of this paper is to describe method of achieving convergence between the
displacements of the platform at the foundation level and those of the piles in
successive analyses without reanalyzing the entire structure in each cycle.
Agaskar & Metcalf (1971) have applied matrix condensation to reduce stiffness and
ction matrices to involve only the terms corresponding to the displacements of the
structures at foundation level.

16
The parameters that they did the research on are wind, wave, current and earthquake.
The final result that they obtained is that the convergence is rapid and the offshore
platform design involves the consideration of non-linear pile-soil response in the
automated design process.

17
2.7 Gantt chart & Key Milestones
Table 1: FYP 1 Gantt Chart & Key Milestones
No. Detail/Week 1 2 3 4 5 6 7 8 9 10 11 12 13 14
1 Selection of Project Topic
Mid
-se
me
ster
Bre
ak
Pile-Soil Interaction in Jacket Platform
2 Preliminary Research Work
Research on relevant literature review on related study
Research on suitable methodology to be applied
3 Proposal Defence
4 Project work continues
Research on particular platform to be a case study
Study on environmental data and geotechnical information
Learn how to operate software SACS and Finite Element
Analysis
Project Milestones
1 Completion of Extended Proposal Defence
2 Completion of Interim Draft Report
3 Completion of Interim Report

18
Table 2: FYP 2 Gantt Chart & Key Milestones
No Detail/Week 1 2 3 4 5 6 7
8 9 10 11 12 13 14 15
1 Project Work Continues
Mid
-Se
me
ste
r B
reak
Gather information on platform description
Gather and collect data for environmental data
geotechnical information
Start the modelling soil reactions
2 Project Work Continues
Start the using SACS software for the simulation of
structures
Analyse pile structure interaction of the structure
Obtain results on platform response to lateral loading
Project Milestone
3 Submission of Progress Report
4 Pre-EDX
5 Submission of Draft Report
6 Submission of Dissertation (soft bound)
7 Submission of Technical Paper
8 Oral Presentation
9 Submission of Project Dissertation (Hard Bound)
19
CHAPTER 3
METHODOLOGY
3.1 Research Methodology
In this paper, the methodology proposed by Mostafa & El Naggar [11] will be
applied in this research methodology. This paper presents a methodology describes
the efficient approach to model the response of pile groups of a jacket structure to
transient loading. This method applies the concepts of p-y curves to model the soil
reaction subjected to pile movement.
Several parameters that will be tested on which are foundation flexibility, soil
resistance, pile-soil-pile interaction, soil stiffness and platform deck mass. These
parameters are ones that affect the characteristics of the platform and the responses
of the platform due to wind, wave and current loading will be investigated.

20
The proposed process flow for this methodology is shown in the Figure 4.
Figure 4: Methodology process flow
3.1.1 Platform Description
First of all, the information on the platform considered will be gathered. The case
study for this research is F9JT-A, Kumang Cluster Development Project. This
platform has been completed, located in F9 Field, offshore Bintulu, Sarawak . The
water depth at site is 94.6m and the substructure is a pile steel jacket. The F9JT-A
platform is designed for a 4-pile jacket.
Platform description
Environmental and load data
Modelling of platform
Input Files
Pile/Structure Interaction Analysis
Conclusions
21
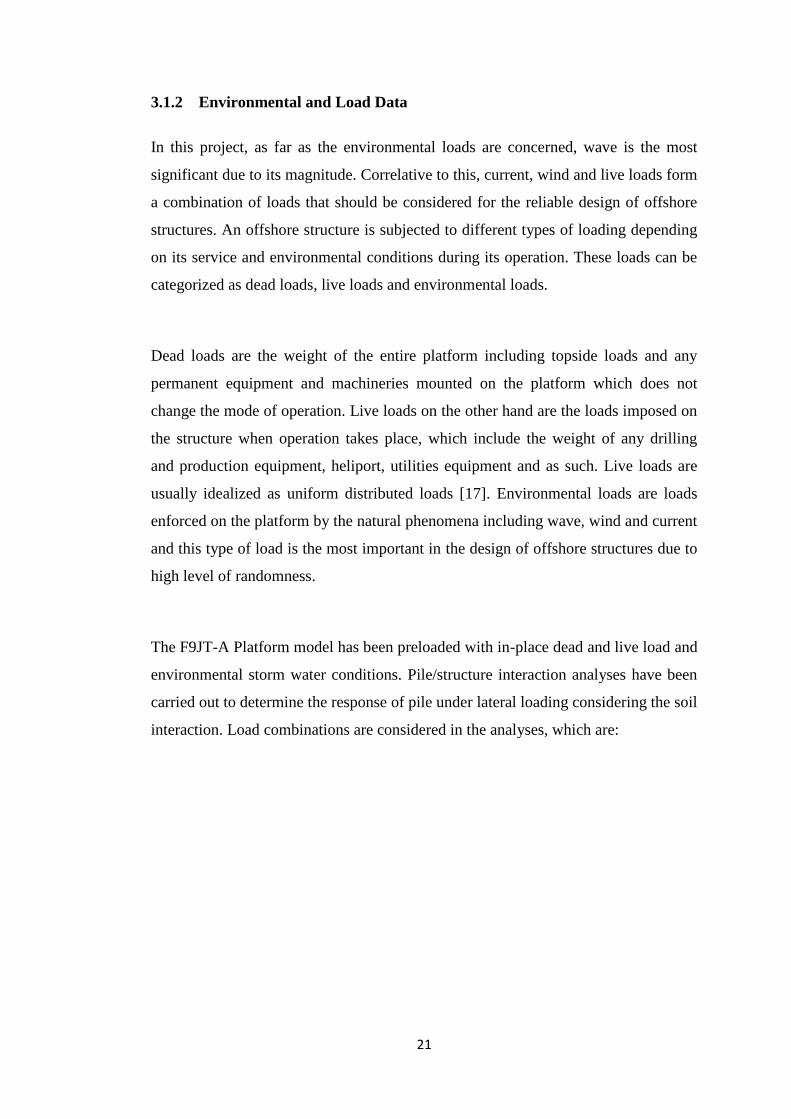
3.1.2 Environmental and Load Data
In this project, as far as the environmental loads are concerned, wave is the most
significant due to its magnitude. Correlative to this, current, wind and live loads form
a combination of loads that should be considered for the reliable design of offshore
structures. An offshore structure is subjected to different types of loading depending
on its service and environmental conditions during its operation. These loads can be
categorized as dead loads, live loads and environmental loads.
Dead loads are the weight of the entire platform including topside loads and any
permanent equipment and machineries mounted on the platform which does not
change the mode of operation. Live loads on the other hand are the loads imposed on
the structure when operation takes place, which include the weight of any drilling
and production equipment, heliport, utilities equipment and as such. Live loads are
usually idealized as uniform distributed loads [17]. Environmental loads are loads
enforced on the platform by the natural phenomena including wave, wind and current
and this type of load is the most important in the design of offshore structures due to
high level of randomness.
The F9JT-A Platform model has been preloaded with in-place dead and live load and
environmental storm water conditions. Pile/structure interaction analyses have been
carried out to determine the response of pile under lateral loading considering the soil
interaction. Load combinations are considered in the analyses, which are:
22
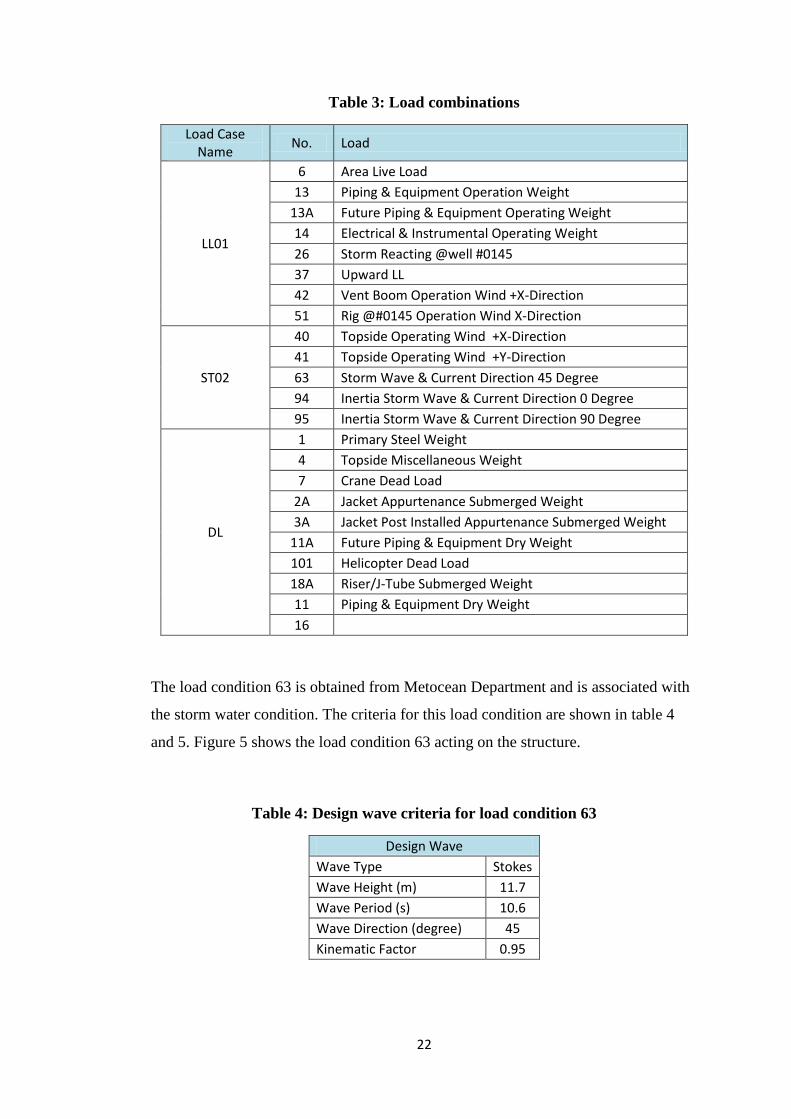
Table 3: Load combinations
Load Case Name
No. Load
LL01
6 Area Live Load
13 Piping & Equipment Operation Weight
13A Future Piping & Equipment Operating Weight
14 Electrical & Instrumental Operating Weight
26 Storm Reacting @well #0145
37 Upward LL
42 Vent Boom Operation Wind +X-Direction
51 Rig @#0145 Operation Wind X-Direction
ST02
40 Topside Operating Wind +X-Direction
41 Topside Operating Wind +Y-Direction
63 Storm Wave & Current Direction 45 Degree
94 Inertia Storm Wave & Current Direction 0 Degree
95 Inertia Storm Wave & Current Direction 90 Degree
DL
1 Primary Steel Weight
4 Topside Miscellaneous Weight
7 Crane Dead Load
2A Jacket Appurtenance Submerged Weight
3A Jacket Post Installed Appurtenance Submerged Weight
11A Future Piping & Equipment Dry Weight
101 Helicopter Dead Load
18A Riser/J-Tube Submerged Weight
11 Piping & Equipment Dry Weight
16
The load condition 63 is obtained from Metocean Department and is associated with
the storm water condition. The criteria for this load condition are shown in table 4
and 5. Figure 5 shows the load condition 63 acting on the structure.
Table 4: Design wave criteria for load condition 63
Design Wave
Wave Type Stokes
Wave Height (m) 11.7
Wave Period (s) 10.6
Wave Direction (degree) 45
Kinematic Factor 0.95
23
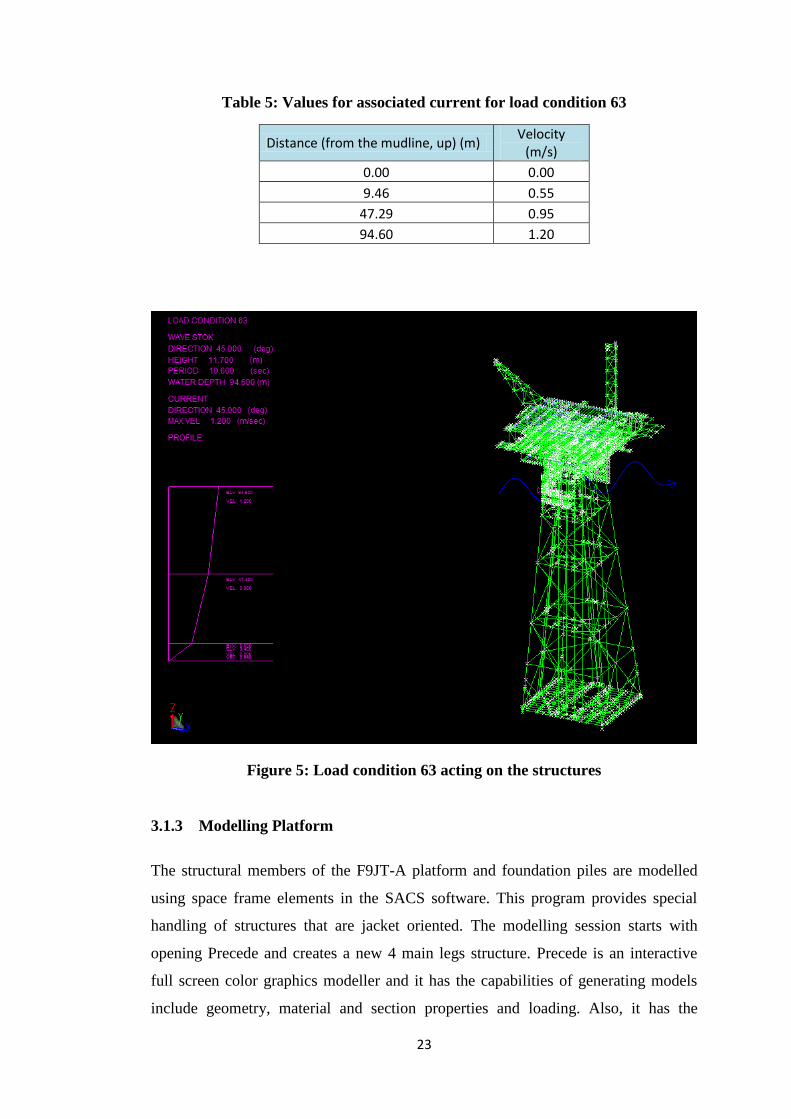
Table 5: Values for associated current for load condition 63
Distance (from the mudline, up) (m) Velocity
(m/s)
0.00 0.00
9.46 0.55
47.29 0.95
94.60 1.20
Figure 5: Load condition 63 acting on the structures
3.1.3 Modelling Platform
The structural members of the F9JT-A platform and foundation piles are modelled
using space frame elements in the SACS software. This program provides special
handling of structures that are jacket oriented. The modelling session starts with
opening Precede and creates a new 4 main legs structure. Precede is an interactive
full screen color graphics modeller and it has the capabilities of generating models
include geometry, material and section properties and loading. Also, it has the
24
capabilities to generate SEASTATE condition. SEASTATE is an environmental
loads generator with full implementation of API 20th
edition and support five wave
theories. Other than that, Precede automatically generate offshore jacket and deck,
load including gravity, pressure and skid mounted equipment loads.
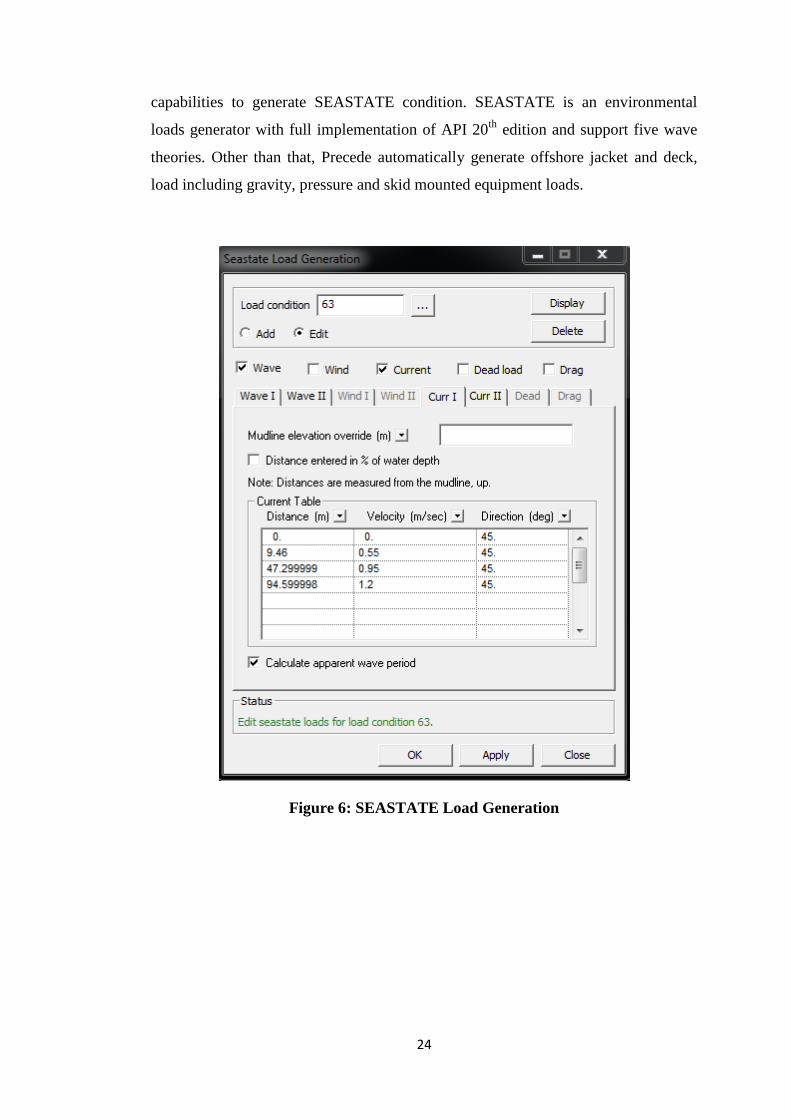
Figure 6: SEASTATE Load Generation
25
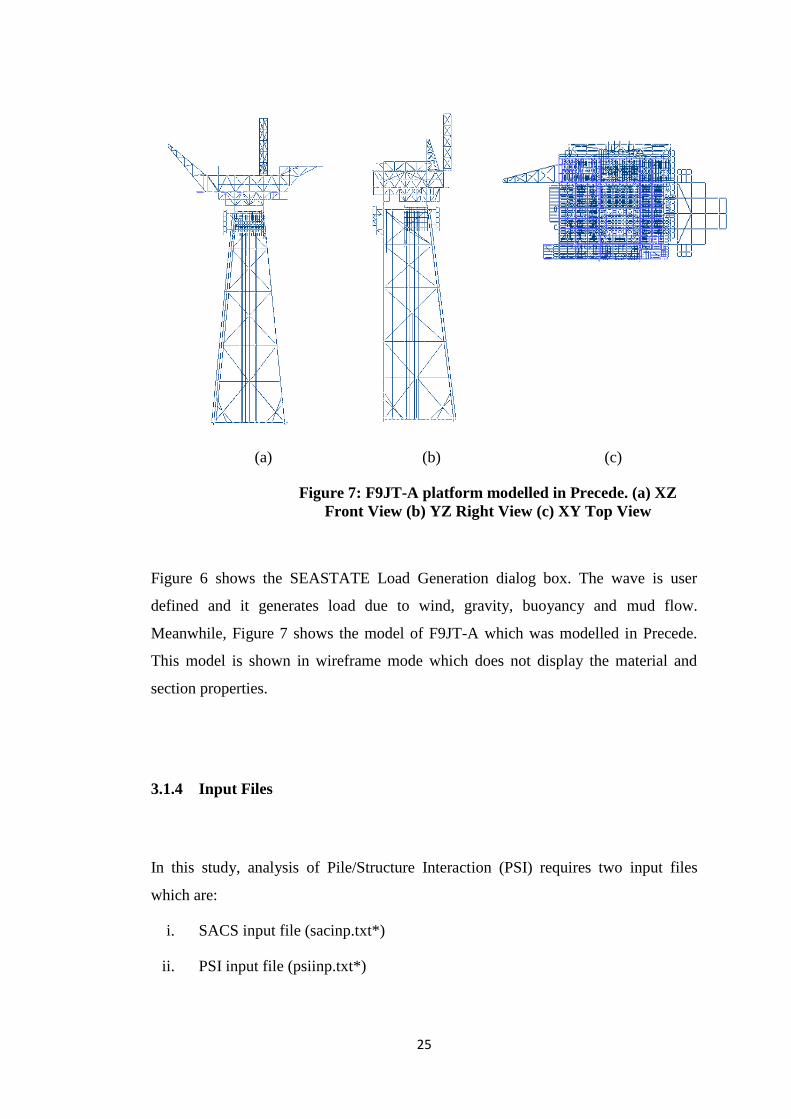
(a) (b) (c)
Figure 7: F9JT-A platform modelled in Precede. (a) XZ
Front View (b) YZ Right View (c) XY Top View
Figure 6 shows the SEASTATE Load Generation dialog box. The wave is user
defined and it generates load due to wind, gravity, buoyancy and mud flow.
Meanwhile, Figure 7 shows the model of F9JT-A which was modelled in Precede.
This model is shown in wireframe mode which does not display the material and
section properties.
3.1.4 Input Files
In this study, analysis of Pile/Structure Interaction (PSI) requires two input files
which are:
i. SACS input file (sacinp.txt*)
ii. PSI input file (psiinp.txt*)

26
SACS input file is auto- generated when the modelling of platform has been done.
The information added into the system will be displayed in numerical form in the
SACS input file. This input file can be displayed using Data Generator. Data
Generator on the other hand is an interactive data generator for all programs. It is an
editor which labels and highlights data fields, and provides help for data input.
Figure 5 below shows the SACS input file for the F9JT-A platform.
Figure 8: SACS Input File
In the SACS input file, the water weight density, structure weight density, mudline
elevation and water depth, are all displayed, refer Figure 6. The load case selection
can also be viewed in this data generator. For this study, three (3) load combinations
are selected to be included in the analysis, refer Figure 7. Other than that, SACS
input file also tells the joints, members, plate information which has been defined
during modelling of the platform.

27
Figure 9: SEASTATE Option
Figure 10: Load Case Selection
For Pile Structure Interaction (PSI), the input file has to be generated using data
generator. The nonlinear foundation model, including the pile and the soil properties,
is specified separate from the model information in a PSI input file. To create a PSI
input file, the interface joints between the linear structure and the nonlinear
foundation must be designated in the SACS model by specifying the support
condition ‘PILEHD’ on the appropriate JOINT input line. In this PSI input file, there
are three (3) pile group defined which is as displayed in the table below.
Table 6: Pile group properties
Pile Group Label
Outside Diameter
(m)
Wall Thickness
(m)
Pile Segment
Length (m)
Elastic Modulus
(Mpa)
Shear Modulus
(Mpa)
Yield Stress
(kN/m2)
PL1 1.524 0.06 23.2 200,000 8,000 340,000
PL1 1.524 0.05 106.8 200,000 8,000 340,000
CN1 0.66 0.19 80 200,000 8,000 345,000
Water weight density,
MT/M3
Structure weight
density, MT/M3
Mudline elevation, m
Water depth, m
Units

28
For pile group labelled PL1, the data for t-z soil axial is added and there are 50
numbers of soil strata. The soil stratum is defined by the distance to top of stratum.
The t-z axial values also added into the input file at the corresponding strata. Then,
the t-z axial bearing data is also added into the input file and there are 21 numbers of
soil strata. For p-y data, there are 70 numbers of soil strata and its reference pile
diameter is 1.524 m. Next is for pile group labelled CN1, the t-z soil axial, t-z axial
bearing and lateral soil data also added into the input file.
3.1.5 Pile/Structure Interaction Analysis
Pile Structure Interaction (PSI), analyses the behaviour of a pile supported structure
subject to one or more static load conditions. Finite deflection of the piles which is
called as “P-delta” effect and nonlinear soil behaviour both along and transverse to
the pile axis are accounted for. The program uses a finite difference solution to solve
the pile model which is represented by a beam column on a nonlinear elastic
foundation. The structure resting on the piles is represented as a linear elastic model.
PSI first obtains the pile axial solution, then uses the resulting internal axial forces to
obtain the lateral solution of the piles. In general, soils exhibit nonlinear behaviour
for both axial and transverse loads, therefore an iterative procedure is used to find the
pile influence on the deflection of the structure.
PSI is designed to use pile and soil data, specified in an input file, in conjunction
with linear structural data produced by the SACS IV program. Earlier, two input files
have been created which are SACS and PSI input files. The analysis category that is
employed in this project is Statics meanwhile the analysis class falls under Static
Analysis With Non-Liner Pile/Structure Interaction. Once these input files have been
selected, run the analysis to obtain the results.
29
CHAPTER 4
RESULT AND DISCUSSION
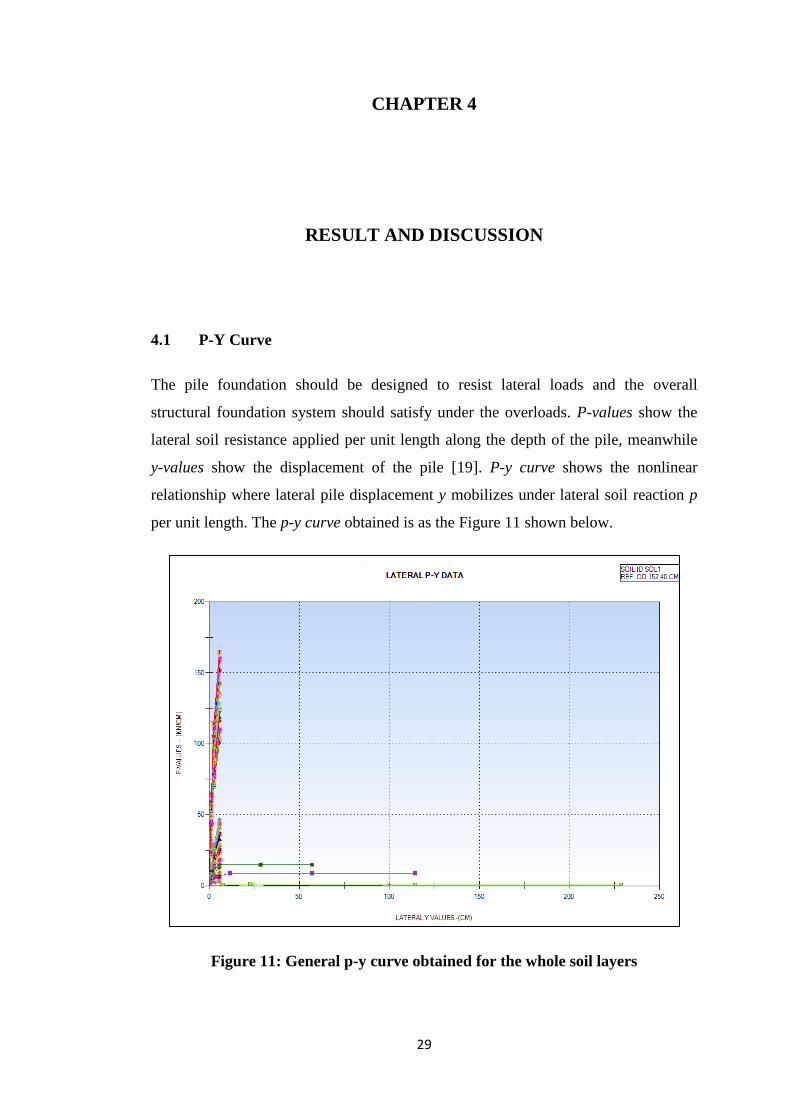
4.1 P-Y Curve
The pile foundation should be designed to resist lateral loads and the overall
structural foundation system should satisfy under the overloads. P-values show the
lateral soil resistance applied per unit length along the depth of the pile, meanwhile
y-values show the displacement of the pile [19]. P-y curve shows the nonlinear
relationship where lateral pile displacement y mobilizes under lateral soil reaction p
per unit length. The p-y curve obtained is as the Figure 11 shown below.
Figure 11: General p-y curve obtained for the whole soil layers
30
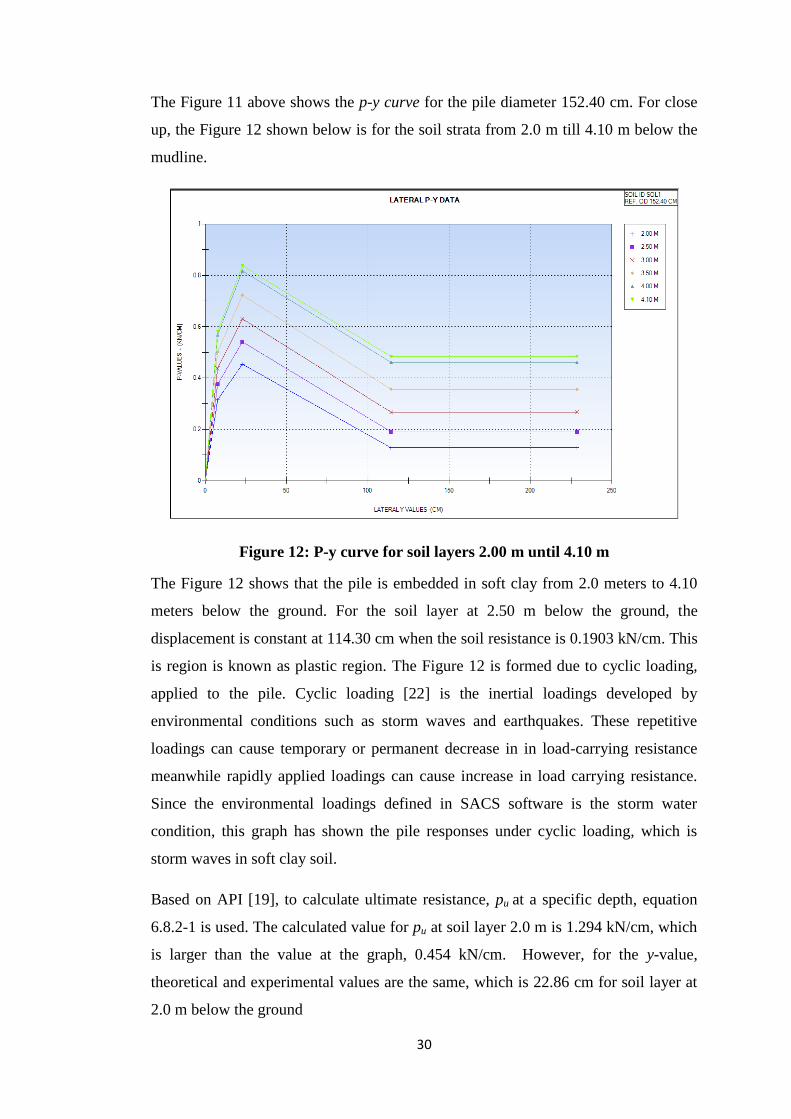
The Figure 11 above shows the p-y curve for the pile diameter 152.40 cm. For close
up, the Figure 12 shown below is for the soil strata from 2.0 m till 4.10 m below the
mudline.
Figure 12: P-y curve for soil layers 2.00 m until 4.10 m
The Figure 12 shows that the pile is embedded in soft clay from 2.0 meters to 4.10
meters below the ground. For the soil layer at 2.50 m below the ground, the
displacement is constant at 114.30 cm when the soil resistance is 0.1903 kN/cm. This
is region is known as plastic region. The Figure 12 is formed due to cyclic loading,
applied to the pile. Cyclic loading [22] is the inertial loadings developed by
environmental conditions such as storm waves and earthquakes. These repetitive
loadings can cause temporary or permanent decrease in in load-carrying resistance
meanwhile rapidly applied loadings can cause increase in load carrying resistance.
Since the environmental loadings defined in SACS software is the storm water
condition, this graph has shown the pile responses under cyclic loading, which is
storm waves in soft clay soil.
Based on API [19], to calculate ultimate resistance, pu at a specific depth, equation
6.8.2-1 is used. The calculated value for pu at soil layer 2.0 m is 1.294 kN/cm, which
is larger than the value at the graph, 0.454 kN/cm. However, for the y-value,
theoretical and experimental values are the same, which is 22.86 cm for soil layer at
2.0 m below the ground

31
Figure 13: P-y curve for soil layers 4.11 m until 30.00 m
Figure 13 shows the pile response from soil layer 4.11 m until 30.00 m below the
ground. The pattern of this Figure 13 is different with the Figure 12 because the soil
layers represented are sand and this prediction is made based on He’s et. al. [20]
findings.
Figure 14: P-y curve for soil layers 31.01 m until 52.02 m

32
The Figure14 shown above is for the soil layers from 31.01 m till 52.20 m. The lower
curves indicate the soil layers for 31.01 m till 44.90 m below the ground, meanwhile
the upper curves indicate the graph for layers 52.00 m till 52.20 m. These layers have
same graph pattern due to loading conditions. The upper curves illustrate that the
piles are subjected to static loadings and in the meantime, the lower curves are
subjected to cyclic loading. The lower curves have larger deflection, and this is
related to the cyclic loadings applied. These curves also have been compared with
the ISO 19902 [22]. Although the values compared are not equal, this can be
explained as the code has been made according to Gulf of Mexico condition.
Malaysia on the other hand, has quite mild conditions compared to Gulf of Mexico.
The ultimate soil resistance according to the curves are 8.888 kN/cm and 14.813
kN/cm respectively. As the soil goes down deeper, the ultimate resistance is
increasing.
For this Figure 14, the theoretical value should be calculated using equation 6.8.2-2
since X value is more than XR. The curves give p-value of 8.888 kN/cm which is quite
close to the theoretical value, 9.60 kN/cm. The y-value gives the ratio of y/yc is 1.5,
meanwhile the theoretical value should be 0.72. Same goes to the upper curve, the
theoretical p-value is 13.716 kN/cm and the ratio of y/yc is 60.96 cm which has a
huge difference compared to the API standard.

33
4.2 Axial T-Z Curve
Axial t-z curve on the other hand, represents the relationship between the induced
shear stress due to load transfer and the vertical movement of the pile, along the pile
shaft [21]. The following Figure 15 shows the result for this analysis.
Figure 15: General t-z curve for whole soil layers

34
There are two types of curve that can be found in this t-z curve, the Figure 16 below
represents the pile response in sand.
Figure 16: T-z curve for soil layers 4.11 m till 151. 31 m
The t-values obtained at the specified soil layers, as recommended in the API should
be equal with the unit skin friction that can be computed according to section 6.4.
Once the mobilized soil pile adhesion, t reached the maximum value, the
displacement will keep constant. The Figure 17 shown below represents the pile
response in clay.

35
Figure 17: T-z curve for soil layers 4.10 m until 134.30 m
The Figure 17 has been compared with API and ISO standard, and the values shown
are equals. All the z-values achieved at maximum t-values are the same for all soil
layers. According to API standard, the ratio for z/D should be 0.01, and it is proven
equal with the result obtained.
36
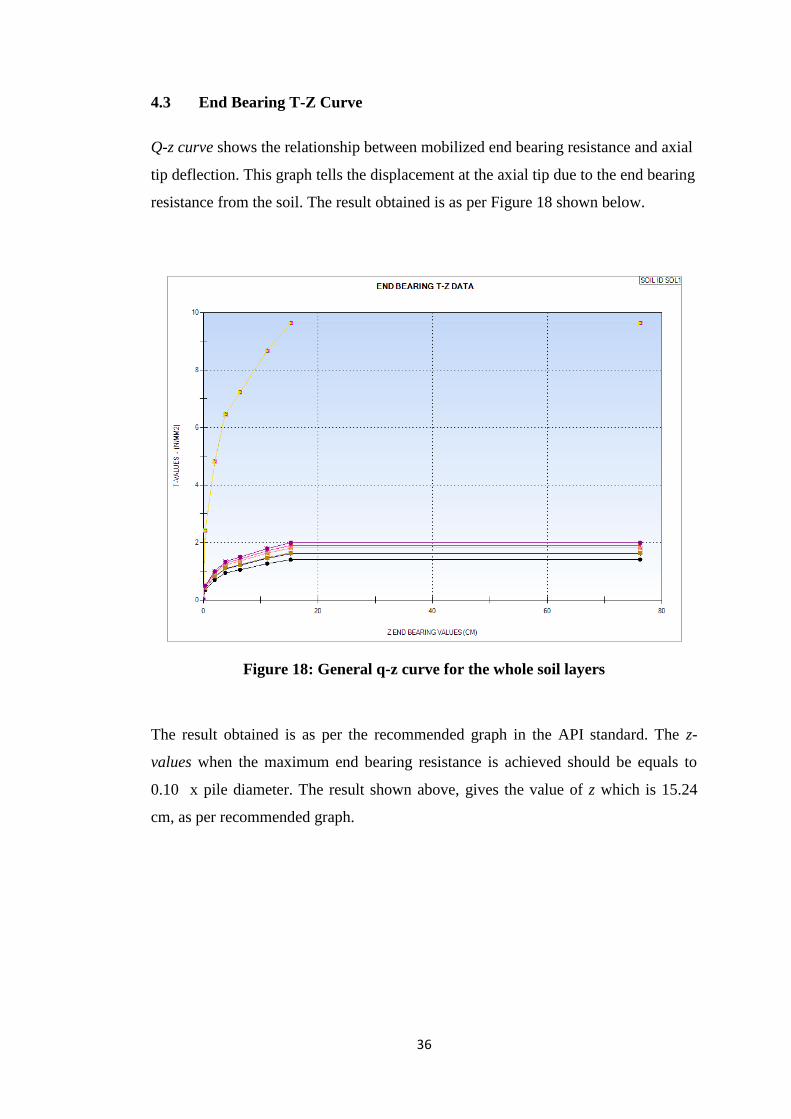
4.3 End Bearing T-Z Curve
Q-z curve shows the relationship between mobilized end bearing resistance and axial
tip deflection. This graph tells the displacement at the axial tip due to the end bearing
resistance from the soil. The result obtained is as per Figure 18 shown below.
Figure 18: General q-z curve for the whole soil layers
The result obtained is as per the recommended graph in the API standard. The z-
values when the maximum end bearing resistance is achieved should be equals to
0.10 x pile diameter. The result shown above, gives the value of z which is 15.24
cm, as per recommended graph.

37
4.4 Changing the parameter
In the analysis, the wall thickness has been reduced from 6.0 cm to 4.0 cm. The
results have shown an expected outcome, which can be concluded that the thinner the
wall thickness of a pile, the larger the deflections occur. However, the differences
cannot be compared with the curves obtained, due to very small number changed.
From the output listings obtained from SACS software, the differences can be shown
in terms of pile head coordinates.
Figure 19: Final deflections for load case ST02 in pile head coordinates for wall
thickness 6.0 cm
The Figure 19 above shows the final deflection for load case ST02 in pile head
coordinates for wall thickness 6.0 cm. These coordinates tell us the final deflection,
not the new pile head coordinates.
Figure 20: Final deflections for load case ST02 in pile head coordinates for wall
thickness 4.0 cm
38
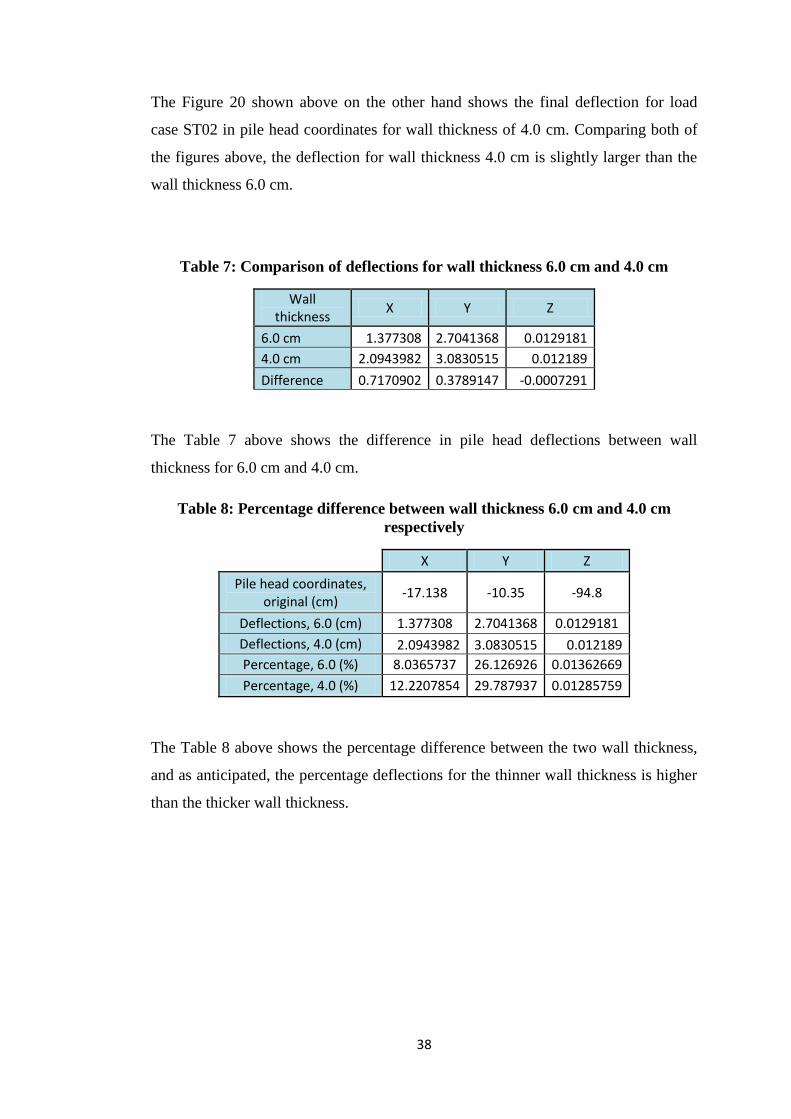
The Figure 20 shown above on the other hand shows the final deflection for load
case ST02 in pile head coordinates for wall thickness of 4.0 cm. Comparing both of
the figures above, the deflection for wall thickness 4.0 cm is slightly larger than the
wall thickness 6.0 cm.
Table 7: Comparison of deflections for wall thickness 6.0 cm and 4.0 cm
Wall thickness
X Y Z
6.0 cm 1.377308 2.7041368 0.0129181
4.0 cm 2.0943982 3.0830515 0.012189
Difference 0.7170902 0.3789147 -0.0007291
The Table 7 above shows the difference in pile head deflections between wall
thickness for 6.0 cm and 4.0 cm.
Table 8: Percentage difference between wall thickness 6.0 cm and 4.0 cm
respectively
X Y Z
Pile head coordinates, original (cm)
-17.138 -10.35 -94.8
Deflections, 6.0 (cm) 1.377308 2.7041368 0.0129181
Deflections, 4.0 (cm) 2.0943982 3.0830515 0.012189
Percentage, 6.0 (%) 8.0365737 26.126926 0.01362669
Percentage, 4.0 (%) 12.2207854 29.787937 0.01285759
The Table 8 above shows the percentage difference between the two wall thickness,
and as anticipated, the percentage deflections for the thinner wall thickness is higher
than the thicker wall thickness.
39
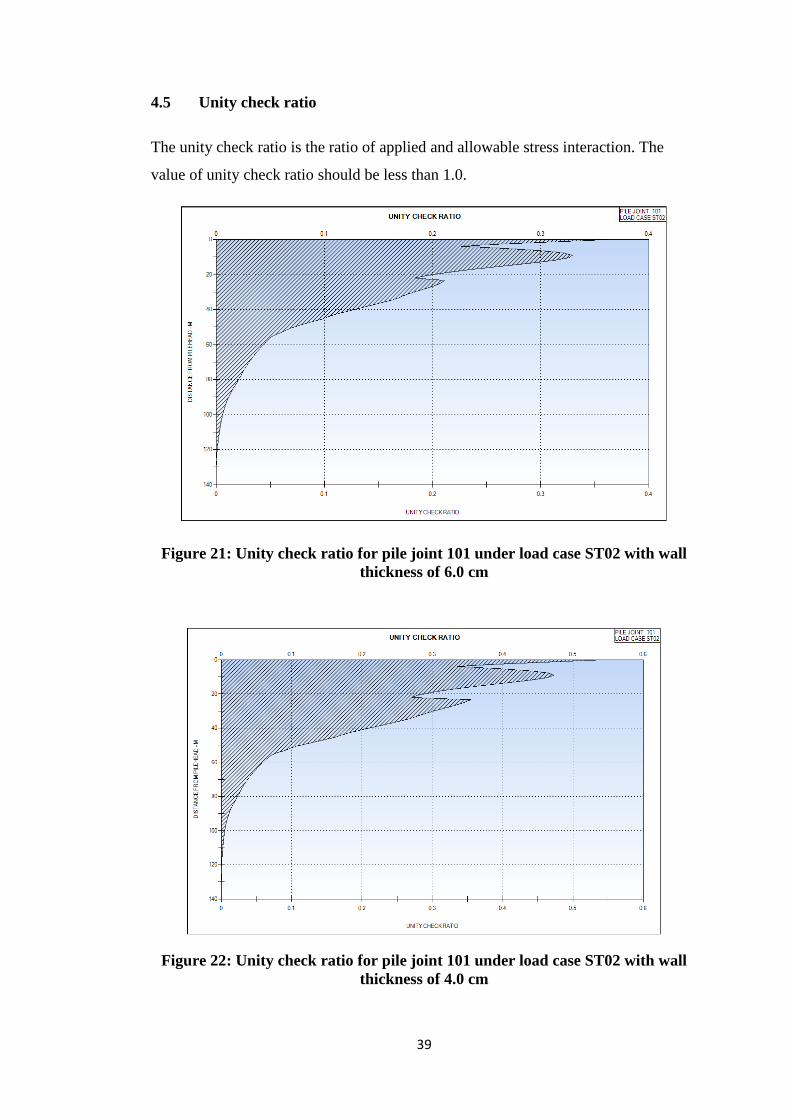
4.5 Unity check ratio
The unity check ratio is the ratio of applied and allowable stress interaction. The
value of unity check ratio should be less than 1.0.
Figure 21: Unity check ratio for pile joint 101 under load case ST02 with wall
thickness of 6.0 cm
Figure 22: Unity check ratio for pile joint 101 under load case ST02 with wall
thickness of 4.0 cm

40
The Figure 21 and 22 above show the unity check ratio for the pile joint 101, under
load case ST02 with 6.0 cm and 4.0 cm wall thickness respectively. Pile with 6.0 cm
wall thickness has the highest value of unity check ratio of 0.35 meanwhile for pile
with 4.0 cm wall thickness has the highest value of unity check ratio of 0.525. This
comparison has shown that the thinner wall thickness, the higher the unity check
ratio is.

41
CHAPTER 5
CONCLUSIONS AND RECOMMENDATIONS
Based on the results obtained, the objective for this project has achieved. The pile
responses has been illustrated into three (3) types of graph, each indicates different
relationship. P-y curve indicates the relationship between the lateral soil resistance
per unit length of pile and deflections of pile due to the resistance. T-z curve
conversely specifies the relationship between the soil-pile shear transfer and local
pile deflections at any depth meanwhile q-z curve shows the relationship between the
mobilized end bearing resistance and axial pile tip deflections.
These graphs also has shown different pile responses in different soil properties that
changes with depth. This has shown that the pile behaves differently under different
soil properties. These findings has satisfy the author’s objectives.
Deep foundations must be designed in such a way to support the substantial lateral
loads as weel as axial loads. The design for axially loaded deep foundations may be
adequately designed by simple static methods, however for the lateral loads is more
complex [19]. The soil-structure interaction compatibility should be satisfied and the
nonlinear soil response complicates the solutions. Therefore, p-y curve is needed in
partial of pile design. The behaviour of pile depends on stiffness of the pile and soil
mobilization of resistance in the surrounding soil.
Based on the author’s judgement, according to the result achieved, the wall thickness
of the pile can be reduced in order to accomplish an optimized design. In the future,
the pile diameter and pile length can be considered into changing the parameters
because these parameters also affects the pile behaviour in terms of deflections and
also unity check ratio. These parameters can contibute to obtain an optimized and
reliable design of a jacket structures if it is considered in the analysis.

42
REFERENCES
[1] Ersdal, G. (2005). Assessment of existing offshore structures for life extension.
University of Stavanger, Norway
[2] Shahrul Izwan Ayob. (2008). Seismic structural vulnerability of offshore structures in
Malaysia. Universiti Teknologi Malaysia, Kuala Lumpur.
[3] Kagawa, T. (1980). Soil-pile-structure interaction of offshore structures during an
earthquake. Proceedings of the 12th
Annual Offshore Technology Conference in
Houston, Tex.,May 5-8, 1980 (pp. 235-245)
[4] Park, M., Kawano, K., Choi, Y. & Koo, W. (2010). Dynamic response and reliability
evaluations of an offshore platform with pile-soil foundation system due to wave and
seismic forces. Proceedings of the Twentieth (2012) International Offshore and Polar
Engineering Conference Beijing, China. (pp. 382-389)
[5] Chakrabati, S. K. (1987). Hydrodynamics of offshore structures: Introduction to
offshore structures. Illinois, USA:WIT Press.
[6] Chakrabati, S. K. (2005). Handbook of offshore engineering (volume 1): Historical
development of offshore structures (Chakrabati, S. K. Ed.). London, UK:Elsevier.
[7] Randolph, M. & Gourvenec. S. (2011). Offshore geotechnical engineering: The
offshore environment. New York, NY: Spon Press.
[8] Skallerud B, Amdahl J. Non-linear analysis of offshore structures. Research Studies
Press LTD; 2002.
43
[9] Asgarian, B., Mohammad Lesani (2007). Pile-soil interaction in pushover analysis of
jacket offshore platforms using fiber elements. Journal of constructional steel
research 65 (2009) 209-218.
[10] Krawinkler H. Pushover analysis: Why, how, when and when not to use it. Structural
Engineers Associatopn of California; 1994.
[11] Mostafa, Y. E., El Naggar, M. H. (2003). Response of fixed offshore platforms to
wave and current loading including soil-structure interaction. Soil Dynamics and
EarthquakeEengineering 24 (2004) 357-368.
[12] Bea RG. Earthquake geotechnology in offshore structures. Proceedings of the 2nd
International Conference on Recent Advances in Geotechnical Earthquake
Engineering and Soil Dynamics, No. SOA13, St. Louis, MI; 1991.
[13] Asgarian, B., Fiouz, A. & Talarposhti, A. S. (2008). Effect of soil-pile-structure
interaction nonlinear response of jacket type offshore platforms through incremental
dynamic analysis. Proceedings to the 14th
World Conference on Earthquake
Engineering in Beijing, China, Oct 12-17.
[14] Kolios, A. I. (2010). A multi-configuration approach to reliability based structural
integrity assessment for ultimate strength. Cranfield University, Bedford, United
Kingdom
[15] Kramer, S. L. (1988). Development of p-y curves for analysis of laterally loaded piles
in Western Washington. University of Washington, Seattle, Washington.
[16] Chaudry, A. R. (1994). Static pile-soil-pile interaction in offshore pile groups.
University of Oxford, Oxford, United Kingdom.

44
[17] A. S. Nowak. and K. R. Collins. Reliability of structures. United States of America.
McGraw Hill. 2000.
[18] Chapter 4, lateral loads. (n.d.). Retrieved from
http://www.hnd.usace.army.mil/techinfo/ti/818-02/chap4.pdf
[19] American Petroleum Institute. Recommended practice for planning, designing and
constructing fixed offshore platforms – working stress design. API Recommended
Practice 2A – WSD. 21st ed. Washington, DC; 2000
[20] He, L., Elgamal, A., Yang, Z. and Lu, J. (2004). A three-dimensional finite element
study to obtain p-y curves for sand. 17th
ASCE Engineering Mechanics Conference in
University of Delaware, Newark, DE.June 13 -16.
[21] Chapter 3, vertical side shear and pile point tip resistance of a pile/shaft in clay. (n.d.).
Retrived from
http://www.dot.ca.gove/hq/esc/earthquake_engineering/Research_Reports/vendor/un_
reno/59A0348/Report-PDF/CHAPTER-3.PDF
[22] International Standard. Petroleum and natural gas industries – Fixed steel offshore
structures. IS0 19902. First ed. 2007-12-01.