pillar 3 disclosure · 2020-03-24 · fundamental review of the trading book (frtb) the company...
TRANSCRIPT

RBC EUROPE LIMITED PILLAR 3 DISCLOSURE
As at 31st October 2019

TABLE OF CONTENTS
1 Overview ................................................................................................................................................................... 1 1.1 Business Profile ................................................................................................................................................ 1 1.2 Basis and Frequency of Disclosures .................................................................................................................. 1 1.3 Risk Governance ............................................................................................................................................... 2 1.4 Regulatory Developments ................................................................................................................................. 2 1.5 Regulatory Capital Management ....................................................................................................................... 3
2 Risk Governance ...................................................................................................................................................... 4 2.1 Accountability Structure ................................................................................................................................... 4
2.1.1 Board of Directors ............................................................................................................................. 4 2.1.2 RBCEL Committees ............................................................................................................................ 5
2.2 Risk Management ............................................................................................................................................. 6 2.2.1 Risk Management Framework .......................................................................................................... 6 2.2.2 Risk Principles .................................................................................................................................... 7 2.2.3 Risk Policy Management ................................................................................................................... 8 2.2.4 Risk Identification .............................................................................................................................. 8 2.2.5 Risk Policy Management ................................................................................................................... 8 2.2.6 Risk Appetite ..................................................................................................................................... 9 2.2.7 Capital Planning ................................................................................................................................. 9
3 Own Funds ............................................................................................................................................................. 10 3.1 Overview of Own Funds ................................................................................................................................. 10 3.2 Countercyclical Capital Buffer ....................................................................................................................... 14 3.3 Unencumbered Assets ..................................................................................................................................... 14 3.4 Leverage Ratio ................................................................................................................................................ 16
4 Capital Requirements ............................................................................................................................................ 17 5 Credit Risk ............................................................................................................................................................. 18
5.1 Definition of Credit Risk ................................................................................................................................. 18 5.2 Governance and Framework ........................................................................................................................... 18 5.3 Credit Risk Profile .......................................................................................................................................... 19
5.3.1 Banking Book Credit Risk ................................................................................................................. 19 5.3.2 Credit Risk Adjustments .................................................................................................................. 23 5.3.3 Counterparty Credit Risk ................................................................................................................. 24 5.3.4 Wrong-Way Risk Exposures ............................................................................................................. 27 5.3.5 Counterparty Credit Risk Arising from Derivative Transactions ...................................................... 27 5.3.6 Use of Credit Risk Mitigation Techniques ........................................................................................ 28 5.3.7 Use of External Credit Assessment Institutions ............................................................................... 29
6 Market Risk ............................................................................................................................................................ 30 6.1 Definition of Market Risk ............................................................................................................................... 30 6.2 Governance and Framework ........................................................................................................................... 30 6.3 Risk Profile ..................................................................................................................................................... 31
7 Securitisations ........................................................................................................................................................ 32 7.1.1 Objectives of Securitisation Activities ............................................................................................. 32 7.1.2 Risk Profile ....................................................................................................................................... 33
8 Summary of Relevant Accounting Policies .......................................................................................................... 34 9 Operational Risk .................................................................................................................................................... 35 10 Non-trading Book Equity Exposures .................................................................................................................... 35 11 Interest Rate Risk in the Banking Book ............................................................................................................... 36 12 Liquidity Risk ......................................................................................................................................................... 36
12.1 Definition of Liquidity Risk ............................................................................................................................ 36 12.2 Governance and Framework ........................................................................................................................... 36 12.3 Risk Profile ..................................................................................................................................................... 37 12.4 Individual Liquidity Adequacy Assessment Process ....................................................................................... 37
13 Remuneration ......................................................................................................................................................... 38 13.1 Constitution and Activities of the UK HRC .................................................................................................... 38 13.2 Criteria for the Identification of Material Risk Takers .................................................................................... 39 13.3 Design and Structure of Compensation for Material Risk Takers ................................................................... 39 13.4 The Link between Pay and Performance for Material Risk Takers ................................................................. 42 13.5 Disclosures on Remuneration ......................................................................................................................... 44
14 Appendices .............................................................................................................................................................. 47 14.1 Appendix 1: Board Membership ..................................................................................................................... 47 14.2 Appendix 2: Countercyclical Buffer Disclosure ............................................................................................. 49

LIST OF TABLES Table 1: Distribution of Risk-weighted amount ......................................................................................................................... 3 Table 2: Risk Management Principles ....................................................................................................................................... 7 Table 3: Full reconciliation of own funds items to audited financial statements ..................................................................... 10 Table 4: Own funds disclosure ................................................................................................................................................ 11 Table 5: Transitional arrangements for IFRS9 ......................................................................................................................... 12 Table 6: Capital instruments main features table ..................................................................................................................... 13 Table 7: Encumbered and unencumbered assets ...................................................................................................................... 14 Table 8: Leverage ratio disclosure ........................................................................................................................................... 16 Table 9: Risk exposure amount by risk type and calculation approach adopted ...................................................................... 17 Table 10: Risk exposure amounts by banking and trading activities ....................................................................................... 19 Table 11: Gross credit exposures within the banking book...................................................................................................... 20 Table 12: Average gross credit exposures within the banking book ........................................................................................ 20 Table 13: Gross credit exposure by residual maturity .............................................................................................................. 21 Table 14: Final credit exposure by residual maturity ............................................................................................................... 21 Table 15: Credit conversion factor for off balance sheet credit exposures............................................................................... 21 Table 16: Gross credit exposure by geographic distribution .................................................................................................... 22 Table 17: Final credit exposure by geographic distribution ..................................................................................................... 22 Table 18: Gross credit exposure by geographic distribution within the EEA .......................................................................... 22 Table 19: Final credit exposure by geographic distribution within the EEA ........................................................................... 23 Table 20: Reconciliation of provision for credit losses for all financial instruments ............................................................... 24 Table 21: Trading credit risk .................................................................................................................................................... 24 Table 22: Counterparty credit risk by exposure class .............................................................................................................. 25 Table 23: Average counterparty credit risk exposure............................................................................................................... 25 Table 24: Gross counterparty credit exposure by residual maturity ......................................................................................... 26 Table 25: Final counterparty credit exposure by residual maturity .......................................................................................... 26 Table 26: Gross counterparty credit exposure by geographic distribution ............................................................................... 26 Table 27: Final counterparty credit exposure by geographic distribution ................................................................................ 26 Table 28: Gross credit exposure by geographic distribution within the EEA and North America ........................................... 26 Table 29: Final credit exposure by geographic distribution within the EEA and North America ............................................ 27 Table 30: Counterparty credit risk for derivative transactions ................................................................................................. 27 Table 31: Notional of CDS ...................................................................................................................................................... 28 Table 32: Exposures amounts subjected to the use of the ECAIs ............................................................................................ 29 Table 33: Market risk by risk type ........................................................................................................................................... 31 Table 34: Exposures by underlying exposure type .................................................................................................................. 33 Table 35: Securitisation exposures by seniority ....................................................................................................................... 33 Table 36: Securitisation exposures by risk weighting .............................................................................................................. 33 Table 37: Non-trading book equity exposures ......................................................................................................................... 35 Table 38: Aggregate remuneration awarded ............................................................................................................................ 44 Table 39: Deferred Remuneration for MRTs ........................................................................................................................... 45 Table 40: Special Payments ..................................................................................................................................................... 46 Table 41: MRTs with Total Remuneration above One Million Euros ..................................................................................... 46

1
1 OVERVIEW
1.1 BUSINESS PROFILE RBC Europe Limited (the Company) is a wholly owned subsidiary of Royal Bank of Canada (RBC), a leading provider of financial services globally. Operating since 1869, RBC is Canada’s largest bank and is amongst the top 15 largest banks globally based on market capitalisation. RBC has amongst the highest credit ratings for financial institutions (Moody's A1 and Standard & Poor's AA-) and continues to be well capitalised with Common Equity Tier 1 Capital Ratio 14.4% as at 31 October 2019 (2018: 14.3%).
The Company is a UK authorised bank and provides investment banking, capital markets and wealth management services to a wide range of clients including financial institutions, corporations, governments and High–Net-Worth clients. The Company works with its clients to help raise capital, access markets, mitigate risk and acquire or divest assets.
The Company obtained a Standard & Poor’s rating since October 2014. As of 31 October 2019 the Company’s long- and short-term counterparty credit rating assigned by Standard & Poor’s are unchanged at AA-/A-1+.
As at 31 October 2019, the Company does not have any subsidiaries or any investment in associates (2018: nil).
1.2 BASIS AND FREQUENCY OF DISCLOSURES Basel III is a global regulatory standard on bank capital adequacy, stress testing and market liquidity risk. It intended to strengthen global capital and liquidity rules with the goal of improving the banking sector’s ability to absorb shocks arising from financial and economic stress, thus reducing the risk of spillover from the financial sector to the real economy.
The EU implemented the Basel framework through the new Capital Requirements Directive and Regulation (CRD IV package). Additional provisions are applied in the UK through the PRA Rulebook.
The Basel III capital adequacy framework comprises three complementary pillars:
Pillar 1 establishes rules for the calculation of minimum capital for Credit, Market, Operational Risk and Leverage (capital adequacy requirements).
Pillar 2 is an internal discipline to evaluate the adequacy of the regulatory capital requirement under Pillar 1 and other non-Pillar 1 risks. This part of the regulatory framework requires banks to conduct an internal assessment of their capital requirements (risk management and supervision) and consider whether additional capital should be held against particular risks. Banks’ supervisors then undertake a supervisory review to assess the robustness of the bank’s internal assessment.
Pillar 3 complements the other pillars and effects market discipline through public disclosure. Expanded disclosure about capital and risk enables interested parties to better understand the risk profile of individual banks and to make comparisons (market discipline).
The aim of Pillar 3 is to publish a set of disclosures which allow market participants to assess key information on the capital condition, risk exposures and risk assessment process. The information disclosed is prepared in accordance with the disclosure requirements set out in Part Eight of the Capital Requirement Regulation (CRR). The disclosures may differ from similar information in the Company’s financial statements for the year ended 31 October 2019, which are prepared in accordance with International Financial Reporting Standards (IFRS). Therefore, the information in these disclosures may not be directly comparable with that information.
The Company updates these disclosures on an annual basis as at its financial year end of 31 October. The Company will assess the need to publish some or all disclosures more frequently than annually in the light of the criteria specified in Article 433 of the CRR and in accordance with European Banking Authority’s Guidelines on materiality, proprietary information and confidentiality, and on disclosure frequency.
In preparing these disclosures, management has adjusted certain prior year amounts to conform to current year presentation. These adjustments do not have any impact on the Company’s capital condition and risk exposures, unless stated otherwise.
Location and Verification
These disclosures have been reviewed and approved by the Company’s Audit Committee and Board. A copy of these disclosures is also available on RBC Group’s corporate website at http://www.rbc.com/aboutus/rbcel-index.html.

2
1.3 RISK GOVERNANCE The Company has a clear and robust corporate and risk governance framework in order to manage, control and provide assurance on risk on behalf of both internal and external stakeholders. The governance structure determines the relationships between the Company’s Board of Directors (the Board), Management, RBC Group and other stakeholders. It also defines the framework in which values are established and the context in which corporate strategies and objectives are set.
The Company considers its risk and control framework to be appropriate for the effective management of its risks and is committed to ensuring that these remain relevant and effective in a changing business environment. The Company has a well-embedded Risk Appetite Framework articulating its appetite for the type and quantum of risk through clearly defined metrics. As at 31 October 2019, all measures were within the Company’s Board limits and tolerances.
1.4 REGULATORY DEVELOPMENTS CRD5 / CRR2
The Company monitors regulatory and legislative developments on an on-going basis to ensure it is prepared for forthcoming regulatory change. In particular, the Company is closely monitoring the implementation of new European legislation that will amend the existing Capital Requirements Directive (CRD) and Regulation (CRR), commonly referred to as CRD5 and CRR2. Counterparty Credit Risk
These amendments will introduce a new methodology for measuring and reporting counterparty credit risk of derivative positions: the Standardised Approach for Counterparty Credit Risk (SA-CCR). SA-CCR is a more complex capital calculation than the current Standardised Method for Counterparty Credit Risk and, in particular, more accurately reflects the effects of margining derivative trades. SA-CCR will also change the inputs into the Company’s large exposure calculations.
Leverage Ratio
CRR2 will also introduce a binding minimum leverage ratio requirement of 3%, to apply from June 2021. The Company already monitors itself against this requirement.
Large Exposures
CRR2 will also amend the large exposure requirements that will apply to the Company from June 2021 – namely by eliminating the eligibility of Tier 2 capital from the large exposure capital base (LECB) and requiring aggregation of exposure to collateral issuers. Internal MREL
The Company is subject to an Internal Minimum Requirement for Own Funds and Eligible Liabilities (iMREL). The Company’s iMREL is equal to its total capital requirements and it meets this at all times.
Intermediate Parent Undertaking (IPU)
CRD5 requires EU banking sub-groups that are subsidiaries of non-EU banking groups to establish an Intermediate Parent Undertaking (IPU) to cover all EU activities undertaken by their EU banks. This requirement will apply to banking groups that have more than €40bn of assets in their EU subsidiaries and branches. It will apply from 2023.
The Company continues to examine legislative developments in Europe for any prospect that these may seek to ‘scope in’ UK entities assets into the IPU threshold even after the transitional period with the EU has ended. Fundamental Review of the Trading Book (FRTB)
The Company closely monitors the development of the Fundamental Review of the Trading Book (FRTB) rules. The new FRTB capital requirements are not expected to become a binding capital requirement in Europe and the UK until 2023 at the earliest. The FRTB rules will represent a substantial change in market risk capital calculations. Under FRTB, standardised calculations using risk sensitivities as inputs will replace the current general risk and specific risk calculations.

3
Finalisation of Basel III Looking further ahead the Company notes the intention of EU regulators to implement the ‘Finalisation of Basel III’ package of new regulations. This includes new methodologies for measuring and reporting:
Counterparty credit risk of Securities Financing Transactions (SFTs),
Credit risk, and
Operational Risk
The Company notes the expected implementation date of the above changes in the EU and UK of 2023.
1.5 REGULATORY CAPITAL MANAGEMENT As at 31 October 2019, the Company continued to be well capitalised with a Common Equity Tier 1 capital ratio of 14.4% (2018: 14.3%), Tier 1 capital ratio of 18.0% (2018: 16.1%) and Total Capital Requirement of 12.0% (including Pillar 2A add-on) (2018: 12.0%).
Table 1: Distribution of Risk-weighted amount
£'000 2019 2018Risk-weighted exposure amounts for credit and counterparty credit
Banking book credit risk 2,859,626 2,752,938Counterparty credit risk 2,141,585 1,902,672Risk exposure amount for contributions to the default fund of a CCP 10,932 35,672
5,012,144 4,691,282
Risk-weighted exposure amount settlement/delivery risk in the Trading book 2,618 1,789
Risk-weighted exposure amount for position, foreign exchange and commodities risksInterest rate 2,208,253 2,266,363Equity 73,974 48,957Foreign exchange risk 75,844 163,545Commodities 10,573 4,819
2,368,644 2,483,684
Risk-weighted exposure amount for operational risk 817,019 794,628
Risk-weighted exposure amount for credit valuation adjustment 8,495 6,571
Total 8,208,920 7,977,954

4
2 RISK GOVERNANCE
2.1 ACCOUNTABILITY STRUCTURE The Company has a clear and robust corporate and risk governance framework in order to manage, control and provide assurance on risk on behalf of both internal and external stakeholders. The governance structure determines the relationships between the Board of Directors, Management, RBC and other stakeholders. It also defines the framework in which values are established and the context in which corporate strategies and objectives are set.
The strength of the company’s governance starts at the top with an independent Chairman and experienced Executive and Non-Executive Directors, who give priority to strategic planning and risk oversight, ensuring that standards exist to promote appropriate behaviour throughout the organisation and driving continuous improvement in governance practices.
The RBCEL Board (“Board”) is ultimately responsible for the running of the firm but has delegated day-to-day decision-making to the Chief Executive Officer. A number of Board and management committees have been established to ensure that appropriate controls and procedures are embedded to support the company’s operations. Each has formal Terms of Reference (ToR) establishing the membership and responsibilities, as well as how each committee sits within the governance structure.
The mandate and membership of all committees are reviewed on a regular basis to ensure that these committees are effective and continue to be relevant to meet business and risk management needs. This allows the Board to be confident that the governance structure remains appropriate and fit for purpose. Cross-membership of various management committees also ensures that senior management have a clear picture of issues impacting the whole of the company.
2.1.1 Board of Directors Ultimate responsibility for managing risk within the business resides with the Board of Directors (the “Board”) of RBCEL. It is tasked with ensuring that an effective systems and controls framework is in place for business, risk and capital management. Through its governance structures and controls, the Board has a line-of-sight on key risks and operational controls across the firm. The Board also monitors and assesses effectiveness of controls against changing regulatory expectations.
The Board is responsible for setting the strategic risk direction and risk appetite for RBCEL. This includes:
Clearly articulating the risk appetite for the firm and establishing mechanisms to ensure that the level of risk within the firm remains within the specified risk appetite.
Maintaining a direct line-of-sight over key current and emerging risks across the firm. Overseeing the implementation of an effective systems and controls framework in place for business, risk and capital
management. Reviewing and approving the recovery strategies outlined in the RBCEL Recovery Plan. Oversight for the financial objectives which to be are aligned with risk appetite and objectives. Monitoring and assessing the effectiveness of controls against changing regulatory expectations.
As at 31 October 2019, the Board consists of three Independent Non-Executive Directors (INEDs), including the Chairman, two Non-Executive Directors (NEDs) representing the shareholder (RBC), and three Executive Directors.
Recruitment Policy for Board Members
Appointments to the Board follow a formal procedure. As the Company is a wholly owned subsidiary within RBC Group, the nomination and selection of board members is undertaken in accordance with internal corporate governance practices, stated within RBC’s Policy on the Legal Governance of Subsidiaries (SGO Policy). The Board has two types of directors, (i) Executive Directors (ED), and (ii) Non-Executive Directors (NED), with three directors meeting the UK Corporate Governance Code’s definition of ‘independent’ (INED).
In 2015, the Company established a Nomination Committee as part of its enhanced Corporate Governance Framework. The Nomination Committee is responsible for:
The identification, nomination and recommendation of INED candidates to the Board, for its consideration and approval. The nomination process follows a formal and rigorous approach, with candidates selected and assessed against established selection criteria. The Nomination Committee is governed by its Terms of Reference, under the umbrella of the SGO Policy, subject to local rules and regulations.
5
Recruitment Criteria/Process
Director selection is based on local applicable laws, regulations and rules, taking into consideration the skills, diversity, geographies and areas of expertise already represented on the Board. In addition to this, successful candidates undergo a robust background check, including inter alia, criminal, financial, regulatory checks and competency validation.
In relation to EDs, candidates are identified in accordance with the SGO Policy. Following consultation with the Board Chair by the Company Secretary, and positive advice and counsel from the RBC Subsidiary Governance Office, the ED candidate is proposed to the Board for its consideration, and if deemed appropriate, approval.
All Board appointments reflect RBC’s core values, in particular, “Diversity & Inclusion”, which is an important factor in the assessment and nomination of all proposed director appointments. In addition, in December 2016 the Board approved a Board Diversity Policy. The relevant background and professional experience of the Directors of the Board are provided in Appendix 1.
2.1.2 RBCEL Committees RBCEL has a robust Corporate Governance and Committee Framework. The key committees are set out below:
UK Risk Committee
The UK Risk Committee (RC) is a Board committee chaired by an Independent Non-Executive Director (INED) to ensure independence and robustness of review and challenge. The RC reviews risk issues, gives advice and makes recommendations to the RBCEL Board, or other parties as appropriate, as well as making decisions on risk issues within its sphere of responsibility. The RC holds the following primary responsibilities:
The RC holds the following primary responsibilities:
Develop a risk appetite for RBCEL and recommend it to the Board. Implement an effective risk management framework including directing and approving risk policies. Monitor all material risk exposures, review and approve any risk exceptions, and ensure that any breaches of risk appetite are
remediated and/or escalated. Review and challenge the findings from the annual RBCEL Internal Capital Adequacy Assessment Process and Internal
Liquidity Adequacy Assessment Process and recommend these to the Board for approval. Review, challenge and recommend for approval to the Board the recovery strategies outlined in the RBC UK Recovery Plan. Review emerging risks and changes in legal, regulatory and accounting requirements and their implications on risk
management at RBCEL.
UK Audit Committee
The UK Audit Committee (AC) is responsible for providing independent assurance to the senior management and the Board of Directors on the effectiveness of risk management practices. The AC is chaired by an INED and includes three additional INEDs. Main responsibilities include:
Monitoring the integrity of RBCEL’s financial statements and reviewing and, where appropriate, making recommendations to the Board on business risks, internal controls and compliance.
Overseeing the governance of independent valuation controls pertaining to RBCEL's financial statements. Reviewing quarterly reports from external and internal auditors. Monitoring performance of the internal audit function.
UK Human Resources Committee
The UK Human Resources Committee (HRC) is responsible for ensuring that RBC’s compensation programs align with prudent risk management principles, regulatory guidance and sound compensation practices. RBCEL has an established process in place to assist the HRC in the determination of whether any performance adjustment to compensation are required. The HRC is chaired by an INED. Main responsibilities include:
Review and approve the remuneration of Senior Managers (under the Senior Managers Regime) and Executive Directors (‘Designated Employees’).
Review the remuneration of Material Risk Takers. Review incentive remuneration plans and equity-based remuneration plans. Review RBC Group Remuneration and Compensation policies. Review performance measures to be used to determine the remuneration of Designated Employees. Review management succession plans for the Executive Directors and senior officers of RBCEL. Review the output from the annual talent management process for the key staff in RBCEL.

6
Nomination Committee
The RBCEL Nominations Committee (Nomco) is chaired by an INED. It is a sub-committee of the Board established to lead the process for Independent Non-Executive Director succession planning and appointments to the RBCEL Board and its sub-Committees. The Committee is responsible for amongst other things, the identification, nomination and recommendation of INED candidates for appointment to the Board and its Committees. Main responsibilities include:
Review the structure, size, and composition (including the skills, knowledge, experience, diversity and independence) of the Board and its Committees, and make recommendations to the Board with regard to any changes taking into account any legislative and/or regulatory requirements.
Give full consideration to succession planning for INEDs, taking into account local regulatory requirements and corporate governance best practice, and the skills and expertise needed on the Board in the future.
Be responsible for identifying and nominating, for the approval of the Board, suitable INED candidates to fill vacancies as and when they arise.
Assets & Liability Committee
The RBCEL, RBC London Branch (RBCLB) and RBC Investor & Treasury Services London Branch (RBCITSLB) Asset and Liability Committee (ALCO), chaired by the CFO, is responsible for all matters relating to RBCEL, RBCLB and RBCITSLB’s financial resources including the management of balance sheet, capital position, funding and liquidity and structural banking book interest rate risk. ALCO is comprised of senior management from the business, Risk, Finance, and Corporate Treasury functions, and meet on a monthly basis. Main responsibilities include:
Review of the current and projected positions relative to regulatory, Board, and management limits. Ensuring business and operational strategies are consistent with appetite, in the context of balance sheet and funding.
2.2 RISK MANAGEMENT RBCEL defines risk as the potential for loss or an undesirable outcome affecting the value of RBCEL’s business with respect to volatility of actual earnings in relation to expected earnings, capital adequacy, and liquidity. This definition includes both risks that have a direct and immediate impact (e.g., Credit risk due to a loan default), and risks that have an indirect or longer term impact (e.g., regulatory and reputation risks due to failure to comply with regulatory guidelines or the failure to live up to clients’ expectations).
The risk of financial and non-financial loss through business activities is inherent in all of the businesses conducted by the company. For this reason, risk management is considered to be an intrinsic part of the strategy and capital planning processes.
2.2.1 Risk Management Framework
The RBCEL Enterprise Risk Management Framework (ERMF) sets out the overarching arrangements for risk management, control and assurance within RBCEL. The ERMF is designed to provide a consistent and structured approach to identify, assess, measure, control, monitor and report on significant risks.
The ERMF helps to ensure that risk is managed and controlled on behalf of internal and external stakeholders, including shareholders, customers, employees and regulators. Effective and efficient risk governance and oversight provide Management with assurance that RBCEL’s business activities will not be excessively impacted by risks that could have been reasonably foreseen. This, in turn, reduces the uncertainty of achieving RBCEL’s strategic objectives.
RBCEL respects and complies with laws and regulations that govern its businesses in the jurisdictions in which it operates. The ERMF recognises that RBCEL is required to comply with a range of external risk governance requirements, including but not limited to:
Prudential Regulatory Authority (PRA) rules; Financial Conduct Authority (FCA) rules; and Office of the Superintendent of Financial Institutions (OSFI) requirements as a subsidiary of a Canadian banking group.

7
2.2.2 Risk Principles
The Company applies the following general principles for its management of risk:
Table 2: Risk Management Principles
Principle Description
Effectively balance risk and reward to enable sustainable growth
RBCEL balances risk and reward to capitalise on opportunities within our business strategy and risk appetite, avoid excessive concentrations of risk through diversification and risk transfer, manage earning volatility, and ensure the long-term viability and profitability of the organisation.
Responsibility for risk management is shared
Collectively as One RBC following the Three Lines of Defence risk governance model (below), employees at all levels of the organisation are responsible for managing the day-to-day risks that arise in the context of their roles.
Undertake only risks we understand. Make thoughtful and future-focused risk decisions
In order to create long term value for RBC Group, clients, employees and communities, RBCEL exercises rigour in our risk assessments, analyse emerging risk factors and trends, ensure transparency in risk discussions, and improve processes and tools for simpler, better, faster decision-making without exposing us to undue risks.
Always uphold our Purpose and Vision, and consistently abide by our Values and Code of Conduct to maintain our reputation and the trust of our clients, colleagues and communities
Guided by our Collective Ambition, RBCEL exhibits Good Conduct and does business openly and fairly. RBCEL never compromises quality or integrity for growth. RBCEL adheres to the “Know You Client” standards, and ensures transparency and suitability of the products and services offered. RBCEL complies with all laws and regulatory requirements, and supports transactions and relationships with proper and complete documentation.
Maintain a healthy and robust control environment to protect our stakeholders.
To achieve our operational and financial performance goals while maintaining our reputation and integrity, and operating within the parameters of applicable laws and established risk appetite, RBCEL employs effective processes and controls and resiliency practices to minimise harm from internal and external threats, avoid business interruptions, and ensure timely resolution of control issues.
Use judgment and common sense Policies and procedures cannot cover all circumstances. RBCEL Employees should apply judgment and common sense, and when in doubt, escalate. Management should hire the right people for the right jobs and provide proper training and support.
Always be operationally prepared and financially resilient for a potential crisis
RBCEL strives to maintain effective protocols and escalation strategies to respond to all risks that we face, including regulatory, macroeconomic, market and other stakeholder developments. This includes maintaining operational readiness and financial resilience to effectively operate during and following a financial crisis. It is also critical to maintain agility and readiness to respond to potential disruptors to the financial industry.

8
2.2.3 Risk Policy Management
Three Lines of Defence Model
RBCEL has implemented a robust system of monitoring, reporting and control based on the Three Lines of Defence model. This details responsibility for risk management, control and assurance, and clarifies the segregation of duties between those who take on risk, those who control risk and those who provide assurance.
First Line of Defence - This is provided by the business and support functions embedded in the business. The First Line of Defence has the ownership and accountability for:
Risk identification, assessment, mitigation, monitoring and reporting in accordance with established RBCEL risk policies and Risk Appetite;
Ensuring appropriate and adequate capabilities to manage risks relevant to the business; Alignment of business and operational strategies with risk conduct and culture and risk appetite; and Execution of Business and Corporate Segments’ Risk Governance practices.
Second Line of Defence - This is provided by areas with independent oversight accountabilities residing in functions such as GRM, Group Compliance, and other areas within Control and Group Functions1. The Second Line of Defence is accountable for:
Establishing the RBCEL-level risk management frameworks and providing risk guidance; Providing oversight for the effectiveness of First Line risk management practices; and Monitoring and independently reporting on the level of risk against the established appetite measures and associated
constraints.
Third Line of Defence - This is provided through Internal Audit Services and the Audit Committee. The Third Line provides independent objective assurance on the effectiveness of risk management policies, processes and practices in all areas of RBCEL to senior management and the Board of Directors. Further assurance is provided by the firm’s external auditor, PricewaterhouseCoopers LLP, in the form of a quarterly report to the Audit Committee.
2.2.4 Risk Identification
The process of Risk Identification and assessment is intrinsic within RBCEL’s pursuit of approved business strategies, and as part of the risk oversight responsibilities undertaken by the support functions outlined in this document. Risk Identification is embedded within a wide range of activities, including but not limited to:
The approval of new products, transactions, client relationships, projects or initiatives; Business strategy development; ICAAP, Stress Testing and Recovery Planning; Monitoring and Reporting Ongoing assessment of Industry and Regulatory Developments RBCEL’s assessment, identification, monitoring and escalation processes are continuously advancing in response to the environment in which it operates and the consequent risks to which it is exposed.
2.2.5 Risk Policy Management
RBCEL has implemented RBC policies and processes in the context of the RBCEL Risk Policy Management Requirements to support the assessment and management of risks. RBCEL regularly reviews policies and controls to ensure continued effectiveness and alignment with relevant laws and regulations. To ensure operation with integrity, RBCEL adheres to a number of other principles, codes and policies, including the RBC Code of Conduct which governs the behaviour of RBCEL employees and informs how RBCEL conducts its business operations.
Where necessary, RBCEL adapts the Enterprise policies to ensure compliance with local legal and regulatory requirements and expectations. The CRO UK, Europe and APAC has the responsibility of ensuring these policies are consistent with:
Regulatory requirements; Relevant RBC policies; and Higher and lower level policy documents within the risk policy architecture.
1 Other Control and Group Functions include Finance, Corporate Treasury, Law and HR

9
The RBCEL Risk Policy Management Requirements document adopts the following three-tier hierarchy for approving frameworks, policies, standing orders, standards and procedures (collectively referred to as policy documents):
Level 1 policy documents include overarching frameworks and policies that outline regulatory requirements and risk governance at RBCEL. These are approved by the RC (Board Committee) or ALCO (Management Committee).
Level 2 policy documents include risk-specific frameworks and policies that lay the foundations for how each risk (and any sub-risk) is managed. These are approved by Management Committees.
Level 3 policy documents include those that are put in place to support Level 2 policy documents. These are approved by either Management Committees or Heads of Risk.
The Board of Directors delegates responsibility to the RC to ensure that all RBCEL risk and capital policies meet the minimum governance standards defined within the RBCEL Risk Policy Management Requirements. RBCEL’s Frameworks and policies (including the Risk Management Framework) are reviewed and refreshed annually, and approved by the Risk Committee. RBCEL’s Risk Frameworks were last approved by the Risk Committee on delegation of the Board in June 2019.
2.2.6 Risk Appetite
RBCEL’s Risk Appetite is defined as the amount and type of risk that the Firm is able and willing to accept in the pursuit of its business objectives.
The overall objective of the RBCEL Risk Appetite Framework is to protect RBCEL from unacceptable levels of risk while supporting and enabling the firm’s overall business strategy and goals. The Framework is defined in the context of the RBC Enterprise Risk Appetite Framework and has been customised to cater to local requirements. It provides details on RBCEL risk appetite principles, constraints and metrics and is reviewed and approved at least annually by the Board.
A comprehensive monthly risk appetite scorecard is disseminated to the Senior Risk Management leadership team which shows the monthly trend against the Board Approved Risk Appetite.
2.2.7 Capital Planning
The Company undertakes an annual Internal Capital Adequacy Assessment Process (ICAAP) to ensure that the business strategy and planning translate into adequate capital levels over internal and external capital minima, and identifies period where capital buffers become tight so corrective action can be undertaken in advance. This also includes reviewing the capital levels against risk appetite to ensure that the business strategy and planned capital levels remain in line with the Company’s risk appetite.
The capital plan is derived from the Company’s base case business plan and takes into account changes to business forecasts, market conditions and other developments, such as accounting or regulatory changes that may impact capital requirements.
The base case capital plan also forms the basis for stress testing analysis. Stressing the capital plans, enables the Company to test the strength of its capital base and also to consider mitigating actions in advance in order to maintain overall financial adequacy in periods of stress.
The capital plan is updated on a periodic basis to reflect actual operating results, updated Profit and Loss forecasts and any changes in business strategies.
The ICAAP is an annual process managed by the Enterprise Risk Management (ERM), UK function within Group Risk Management (GRM).
The ERM UK Steering Committee, which consists of the CRO Europe & APAC, CFO Europe, senior management representatives from ERM, Finance, GRM and Corporate Treasury, oversee all aspects involved in the development of the ICAAP, including accurate documentation of key findings from the assessment. Following the ERM Steering Committee review, the ICAAP report is submitted to the Risk Committee (RC) for review, challenge and recommendation for approval to the Board.
.

10
Per Audited Statement of changes in equity£'000Common shares 497,996Other components of equity:
Capital reserves 36,619Share premium 803Remeasurement of pension assets and liabilities 7,561Fair Value through Other Comprehensive Income reserve 36,241AT1 equity issuance 299,694
Total other components of equity 380,918Retained earnings
Opening 587,423Net profit 39,856
Audited retained earnings at 31 October 2019 627,279Total equity 1,506,192
Adjustments to CET1 due to prudential filtersValue adjustments due to the requirements for prudent valuation (13,409)
Transitional adjustments due to IFRS9 539Deductions of CET1 Capital
Other intangible assets 0Deferred tax liabilities associated to other intangible assets 0Deferred tax assets that rely on future profitability and do not arise from temporary differences net of associated tax liabilities 0Defined benefit pension assets (19,700) Deferred tax liabilities associated to defined benefit pension assets 4,307Deduction of holdings Common Equity Tier 1 instruments where an institution does not have a significant investment in a financial sector entity 0
Total CET1 deductions (15,393) Total Fully Loaded Tier 1 Capital 1,477,928
Tier 2 Capital Subordinated loans 77,322
Deduction of holdings Tier 2 instruments where an intuition does not have a significant investment in a financial sector entity 0
Total Tier 2 deductions 0Total Fully Loaded Tier 2 Capital 77,322
Fully Loaded Own Funds 1,555,250
31 October 2019
3 OWN FUNDS
3.1 OVERVIEW OF OWN FUNDS As at 31 October 2019, the Company had total own funds of £1,555 million (2018: £1,517 million), which comprises of Tier 1 Capital of £1,478 million (2018: £1,282 million) and Tier 2 Capital of £77 million (2018: £235 million) under the transitional provisions. This represents a change in the Company’s capital structure, following the redemption of $200 million Tier 2 sub-debt and the issuance of $200 million Additional Tier 1 equity. A full reconciliation of own funds items to audited financial statements are shown in the table below.
Table 3: Full reconciliation of own funds items to audited financial statements

11
Common Equity Tier 1 capital: instruments and reserves 31 October 2019£'000
Prescribed residual amount
Final CRD IV
Capital instruments and the related share premium accounts 498,799 - 498,799of which: Common shares 497,996 - 497,996Retained earnings 627,279 - 627,279Accumulated other comprehensive income (and any other reserves) 80,421 - 80,421Common Equity Tier 1 (CET1) capital before regulatory adjustments 1,206,498 - 1,206,498
Common Equity Tier 1 (CET1) capital: regulatory adjustmentsAdditional value adjustments (13,409) - (13,409)Goodwill and Other intangible assets (net of related tax liability) - - -Defined-benefit pension fund assets (net of related tax liability) (15,393) - (15,393)
Direct, indirect and synthetic holdings of the CET1 instruments of financial sector entities where the institution does not have a significant investment in those entities (amount above 10% threshold and net of eligible short positions) (negative amount)
- - -
Transitional adjustments due to IFRS9 539 (539) -Total regulatory adjustments to Common Equity Tier 1 (CET1) (28,264) (539) (28,802)
Common Equity Tier 1 (CET1) capital 1,178,234 (539) 1,177,696Additional Tier 1 (AT1) capital 299,694 - 299,694Tier 1 capital (T1 = CET1 + AT1) 1,477,928 (539) 1,477,390
Tier 2 (T2) capital: instruments and provisionsSubordinated loans 77,322 - 77,322Credit risk adjustments - - -Tier 2 (T2) capital before regulatory adjustment 77,322 - 77,322
Tier 2 (T2) capital 77,322 - 77,322
Total capital (TC = T1 + T2) 1,555,250 (539) 1,554,711Total risk-weighted exposures 8,208,920 Capital ratios and buffersCommon Equity Tier 1 ratio 14.4%Tier 1 ratio 18.0%Total capital ratio 18.9%Institution specific buffer requirement 235,571of which: capital conservation buffer requirement 205,223of which: countercyclical buffer requirement 30,348
Common Equity Tier 1 available to meet buffers (as a percentage of risk exposure amount) 9.9%Amounts below the thresholds for deduction (before risk-weighting)
Direct and indirect holdings of the capital of financial sector entities where the institution does not have a significant investment in those entities (amount below 10% threshold and net of eligible short positions -
Direct and indirect holdings of the CET1 instruments of financial sector entities where the institution has a significant investment in those entities (amount below 10% threshold and net of eligible short positions -Deferred tax assets arising from temporary difference -Applicable caps on the inclusion of provisions in Tier 2Credit risk adjustments included in T2 in respect of exposures subject to standardised approach (prior to the application of the cap) -Cap on inclusion of credit risk adjustments in T2 under standardised approach -Credit risk adjustments included in T2 in respect of exposures subject to internal rating-based approach (prior to the application of the cap) -
Cap for inclusion of credit risk adjustments in T2 under internal ratings-based approach -Capital instruments subject to phase-out arrangements (applicable between 1 Jan 2014 and 1 Jan 2022) - Current cap on CET1 instruments subject to phase-out arrangements -
- Amount excluded from CET1 due to cap (excess over cap after redemptions and maturities) - - Current cap on AT1 instruments subject to phase-out arrangements -
- Amount excluded from AT1 due to cap (excess over cap after redemptions and maturities) - - Current cap on T2 instruments subject to phase-out arrangements -
- Amount excluded from T2 due to cap (excess over cap after redemptions and maturities) -
Table 4: Own funds disclosure

12
Table 5: Transitional arrangements for IFRS9
31 October 2019
£'000
Common Equity Tier 1 (CET1) capital 1,178,234Common Equity Tier 1 (CET1) capital as if IFRS 9 or analogous ECLs transitional arrangements had not been applied 1,177,696
Tier 1 capital 1,477,928Tier 1 capital as if IFRS 9 or analogous ECLs transitional arrangements had not been applied 1,477,390
Total capital 1,555,250Total capital as if IFRS 9 or analogous ECLs transitional arrangements had not been applied 1,554,711
Total risk-weighted assets 8,208,920Total risk-weighted assets as if IFRS 9 or analogous ECLs transitional arrangements had not been applied 8,207,955
Common Equity Tier 1 (as a percentage of risk exposure amount) 14.4%Common Equity Tier 1 (as a percentage of risk exposure amount) as if IFRS 9 or analogous ECLs transitional arrangements had not been applied 14.3%
Tier 1 (as a percentage of risk exposure amount) 18.0%Tier 1 (as a percentage of risk exposure amount) as if IFRS 9 or analogous ECLs transitional arrangements had not been applied 18.0%
Total capital (as a percentage of risk exposure amount) 18.9%Total capital (as a percentage of risk exposure amount) as if IFRS 9 or analogous ECLs transitional arrangements had not been applied 18.9%
Leverage ratio total exposure measure 46,933,644
Leverage ratio 3.15%Leverage ratio as if IFRS 9 or analogous ECLs transitional arrangements had not been applied 3.15%
Available capital (amounts)
Risk-weighted assets (amounts)
Capital ratios
Leverage ratio
31 October 2018
£'000
Common Equity Tier 1 (CET1) capital 1,139,859Common Equity Tier 1 (CET1) capital as if IFRS 9 or analogous ECLs transitional arrangements had not been applied 1,139,086
Tier 1 capital 1,281,812Tier 1 capital as if IFRS 9 or analogous ECLs transitional arrangements had not been applied 1,281,039
Total capital 1,516,904Total capital as if IFRS 9 or analogous ECLs transitional arrangements had not been applied 1,516,130
Total risk-weighted assets 7,977,954Total risk-weighted assets as if IFRS 9 or analogous ECLs transitional arrangements had not been applied 7,976,988
Common Equity Tier 1 (as a percentage of risk exposure amount) 14.3%Common Equity Tier 1 (as a percentage of risk exposure amount) as if IFRS 9 or analogous ECLs transitional arrangements had not been applied 14.3%
Tier 1 (as a percentage of risk exposure amount) 16.1%Tier 1 (as a percentage of risk exposure amount) as if IFRS 9 or analogous ECLs transitional arrangements had not been applied 16.1%
Total capital (as a percentage of risk exposure amount) 19.0%Total capital (as a percentage of risk exposure amount) as if IFRS 9 or analogous ECLs transitional arrangements had not been applied 19.0%
Leverage ratio total exposure measure 46,509,827
Leverage ratio 2.76%Leverage ratio as if IFRS 9 or analogous ECLs transitional arrangements had not been applied 2.75%
Available capital (amounts)
Risk-weighted assets (amounts)
Capital ratios
Leverage ratio

13
Table 6: Capital instruments main features table
As at 31 October 2019
Capital instruments’ main features template (1) Common shares Common shares Subordinated loan due 2026Subordinated Perpetual Contingent Conversion
Securities
Subordinated Perpetual Contingent Conversion
Securities
Subordinated Perpetual Contingent Conversion
Securities
Issuer RBC Europe Limited RBC Europe Limited RBC Europe Limited RBC Europe Limited RBC Europe Limited RBC Europe LimitedUnique identifier (eg CUSIP, ISIN or Bloomberg identifier for private placement
N/A N/A N/A N/A N/A N/A
Governing law(s) of the instrument English English English English English EnglishRegulatory treatmentTransitional CRR rules Common Equity Tier 1 Common Equity Tier 1 Tier 2 Additional Tier 1 Capital Additional Tier 1 Capital Additional Tier 1 CapitalPost-transitional CRR rules Common Equity Tier 1 Common Equity Tier 1 Tier 2 Additional Tier 1 Capital Additional Tier 1 Capital Additional Tier 1 CapitalEligible at solo/(sub-)consolidated/solo & (sub-)consolidated Solo Solo Solo Solo Solo Solo
Instrument type (types to be specified by each jurisdiction)Common Equity Tier 1
as published in Regulation (EU) No 575/2013 Article 28
Common Equity Tier 1as published in Regulation (EU) No 575/2013 Article 28
Tier 2 as published in Regulation (EU) No 575/2013 Article 63
Additional Tier 1 Equity as published in Regulation (EU) No 575/2013 Article 52
Additional Tier 1 Equity as published in Regulation (EU) No 575/2013 Article 52
Additional Tier 1 Equity as published in Regulation (EU) No 575/2013 Article 52
Amount recognised in regulatory capital (currency in million, as of most recent reporting date)
GBP 21m GBP 477m GBP 75m GBP 71.7m GBP 70.3m GBP 157.7m
Nominal amount of instrument GBP 25m GBP 477m USD 100m USD 100m USD 100m USD 200mIssue price 84 per cent 100 per cent 100 per cent 100 per cent 100 per cent 100 per cent
Redemption price 100 per cent of Nominal amount
100 per cent of Nominal amount
100 per cent of Nominal amount
100 per cent of Nominal amount
100 per cent of Nominal amount
100 per cent of Nominal amount
Accounting classification Equity Equity Liability - amortised cost Equity Equity EquityOriginal date of issuance 20 December 1970 20 December 1970 28 May 2014 26 February 2018 18 April 2018 28 May 2019Perpetual or dated Perpetual Perpetual Dated Perpetual Perpetual PerpetualOriginal maturity date No maturity No maturity 28 May 2026 No maturity No maturity No maturityIssuer call subject to prior supervisory approval No No Yes Yes Yes Yes
Optional call date, contingent call dates, and redemption amount N/A N/A
Redemption at the Option of the Issuer
100 per cent of Nominal amount
First call date: 28/May/2021In addition Tax/Regulatory call
Redemption at the Option of the Issuer
100 per cent of Nominal amount
First call date:26/Feb/2023In addition Tax/Regulatory call
Redemption at the Option of the Issuer
100 per cent of Nominal amount
First call date: 18/Apr/2023In addition Tax/Regulatory call
Redemption at the Option of the Issuer
100 per cent of Nominal amount
First call date: 28/May/2024In addition Tax/Regulatory call
Subsequent call dates, if applicable N/A N/A N/A Subsequent Interest Payment Dates
Subsequent Interest Payment Dates
Subsequent Interest Payment Dates
Coupons / dividendsFixed or floating dividend/coupon N/A N/A Floating Floating Floating Floating
Coupon rate and any related index N/A N/A Reuters page LIBOR01 +1.92 per cent per annum
Reuters page LIBOR01 +3.4 per cent per annum
Reuters page LIBOR01 +4.0 per cent per annum
Reuters page LIBOR01 +4.75 per cent per annum
Existence of a dividend stopper N/A N/A No No No NoFully discretionary, partially discretionary or mandatory (in terms of timing)
Fully discretionary Fully discretionary Mandatory Fully discretionary Fully discretionary Fully discretionary
Fully discretionary, partially discretionary or mandatory (in terms of amount)
Fully discretionary Fully discretionary Mandatory Fully discretionary Fully discretionary Fully discretionary
Existence of step up or other incentive to redeem No No No No No NoNoncumulative or cumulative Non cumulative Non cumulative Non cumulative Non cumulative Non cumulative Non cumulative Convertible or non-convertible Non-convertible Non-convertible Non-convertible Convertible Convertible Convertible
If convertible, conversion trigger (s) N/A N/A N/A Common Equity Tier 1 Capital Ratio falls below 7.00 per cent
Common Equity Tier 1 Capital Ratio falls below 7.00 per cent
Common Equity Tier 1 Capital Ratio falls below 7.00 per cent
If convertible, fully or partially N/A N/A N/A Fully convertible Fully convertible Fully convertible
If convertible, conversion rate N/A N/A N/AGBP equivalent of Security
Prinipal multiplied by 2.12, in Ordinary Shares
GBP equivalent of Security Prinipal multiplied by 2.12, in
Ordinary Shares
GBP equivalent of Security Prinipal multiplied by 2.62, in
Ordinary SharesIf convertible, mandatory or optional conversion N/A N/A N/A Mandatory Conversion Mandatory Conversion Mandatory ConversionIf convertible, specify instrument type convertible into N/A N/A N/A Ordinary Share Ordinary Share Ordinary ShareIf convertible, specify issuer of instrument it converts into N/A N/A N/A RBC Europe Limited RBC Europe Limited RBC Europe LimitedWrite-down features No No Yes No No NoIf write-down, write-down trigger (s) N/A N/A N/A N/A N/A N/AIf write-down, full or partial N/A N/A N/A N/A N/A N/AIf write-down, permanent or temporary N/A N/A N/A N/A N/A N/AIf temporary write-down, description of write-up mechanism N/A N/A N/A N/A N/A N/APosition in subordination hierarchy in liquidation (specify instrument type immediately senior to instrument)
N/A N/A N/A N/A N/A N/A
Non-compliant transitioned features No No No No No NoIf yes, specify non-compliant features N/A N/A N/A N/A N/A N/A (1) 'N/A' inserted if the question is not applicable

14
3.2 COUNTERCYCLICAL CAPITAL BUFFER The UK implementation of CRD IV requires institutions to maintain an institution-specific countercyclical capital buffer based on regulatory determined buffer rates. This requirement follows closely the international approach of Basel III which introduced the countercyclical capital buffer to be implemented by national jurisdictions when excess aggregate credit growth is judged to be associated with a build-up of system-wide risk in each country the Company is exposed to.
As at 31 October 2019, the Company’s specific countercyclical capital buffer rate is 0.3693% (2018: 0.1679%) and the capital requirement is £30.3 million (2018: £13.4 million). The increase in the requirement is largely due to increased United Kingdom countercyclical buffer rate to 1% (2018: 0.5%), where 32.6% of relevant credit exposures are assigned (2018: 31.9%).
Detailed disclosure on the geographical distribution of credit exposure and the Company’s specific countercyclical buffer requirements is included in Appendix 2.
3.3 UNENCUMBERED ASSETS The connected templates have been prepared on a rolling quarterly median basis over the previous 12 months in accordance with the European Commission Delegated Regulation (EU) 2017/2295. Each quarter is calculated as a median of the previous 12 months’ four quarterly returns to the European Banking Authority and then a median of all 4 quarters is taken for disclosure. Each value and total on the disclosure has been derived in the same manner; totals are not a total of the rolling median values.
The Company defines the following assets as encumbered:
Assets which have been pledged as collateral; or
Assets which the Company believes it was restricted from using to secure funding, for legal or other reasons.
Asset encumbrance is an integral part of RBCEL’s liquidity, funding and collateral management processes. The majority of the Company’s encumbrance is driven by secured financing activities, predominantly transactions in collateral swaps and repo. This also includes shorts facilitation as part of its trading activities. These activities are carried out under industry standard contractual agreements (mostly Global Master Repurchase Agreements (GMRAs)). Where securities are borrowed or lent between the Company and RBC Group companies, this is done with arm’s length terms.
The level of over-collateralisation is dependent on specific trade details. The Company’s ratio of encumbered assets is relatively stable with a high turnover of assets available for encumbrance. Encumbrance will vary depending on the composition of the balance sheet, and there are no notable trends during the disclosure period.
A significant proportion of the assets included in other unencumbered assets of £45.8bn (2018: £36.4bn) relates to reverse repurchase transactions and the Company has rehypothecation rights over the underlying security collateral. The remainder comprises of derivative related assets and receivables that are not deemed to be available for encumbrance in the normal course of RBCELs business.
Table 7: Encumbered and unencumbered assets
As at 31 October 2019 Template A - Encumbered and unencumbered assets
of which notionally eligible EHQLA and HQLA
of which notionally eligible EHQLA and HQLA
of which EHQLA and HQLA
of which EHQLA and
HQLA
Assets of the reporting institution 3,822,685,480 2,472,842,477 48,260,489,728 4,417,114,301Equity instruments 6,536,766 3,077,891 64,431,974 0Debt securities 3,178,162,782 2,471,681,398 3,178,162,782 2,471,681,398 1,861,130,522 0 1,861,130,522 0
of which: covered bonds 100,097,801 100,097,801 100,097,801 100,097,801 12,801,419 0 12,801,419 0of which: asset-backed securities 18,874,028 280,415 18,874,028 280,415 64,123,273 0 64,123,273 0of which: issued by general governments 1,577,615,469 1,549,644,994 1,577,615,469 1,549,644,994 604,289,601 0 604,289,601 0of which: issued by financial corporations 790,977,175 271,440,306 790,977,175 271,440,306 0 0 0 0of which: issued by non-financial corporations 778,233,432 421,170,985 778,233,432 421,170,985 1,015,234,855 0 1,015,234,855 0
Other assets 1,707,211,368 0 45,845,984,993 0of which: Loans on demand 24,741,112 0 4,417,114,301 4,417,114,301of which: Loans and advances other than loans on demand 0 0 5,207,430,629 0
Fair value of unencumbered assets
Carrying amount of encumbered assets Fair value of encumbered assets Carrying amount of unencumbered
assets

15
Template B- Collateral received
of which notionally eligible EHQLA and HQLA
of which notionally eligible EHQLA and HQLA
of which EHQLA and HQLA
of which EHQLA and
HQLA
Assets of the reporting institution 3,822,685,480 2,472,842,477 48,260,489,728 4,417,114,301Equity instruments 6,536,766 3,077,891 64,431,974 0Debt securities 3,178,162,782 2,471,681,398 3,178,162,782 2,471,681,398 1,861,130,522 0 1,861,130,522 0
of which: covered bonds 100,097,801 100,097,801 100,097,801 100,097,801 12,801,419 0 12,801,419 0of which: asset-backed securities 18,874,028 280,415 18,874,028 280,415 64,123,273 0 64,123,273 0of which: issued by general governments 1,577,615,469 1,549,644,994 1,577,615,469 1,549,644,994 604,289,601 0 604,289,601 0of which: issued by financial corporations 790,977,175 271,440,306 790,977,175 271,440,306 0 0 0 0of which: issued by non-financial corporations 778,233,432 421,170,985 778,233,432 421,170,985 1,015,234,855 0 1,015,234,855 0
Other assets 1,707,211,368 0 45,845,984,993 0of which: Loans on demand 24,741,112 0 4,417,114,301 4,417,114,301of which: Loans and advances other than loans on demand 0 0 5,207,430,629 0
Fair value of unencumbered assets
Carrying amount of encumbered assets Fair value of encumbered assets Carrying amount of unencumbered
assets
Template C- Sources of encumbrance
Carrying amount of selected financial liabilities 20,407,409,193 20,432,941,371of which: Derivatives 575,812,229 575,812,229of which: Repurchase agreements 19,833,783,089 19,859,315,267
Other sources of encumbrance 32,981,054,567 32,981,054,567
Assets, collateral received and own
debt securities issued other than
covered bonds and ABSs
encumbered
Matching liabilities, contingent
liabilities or securities lent
The above information is prepared using median values of monthly data on a rolling basis over the previous twelve months as expected by PRA.
16
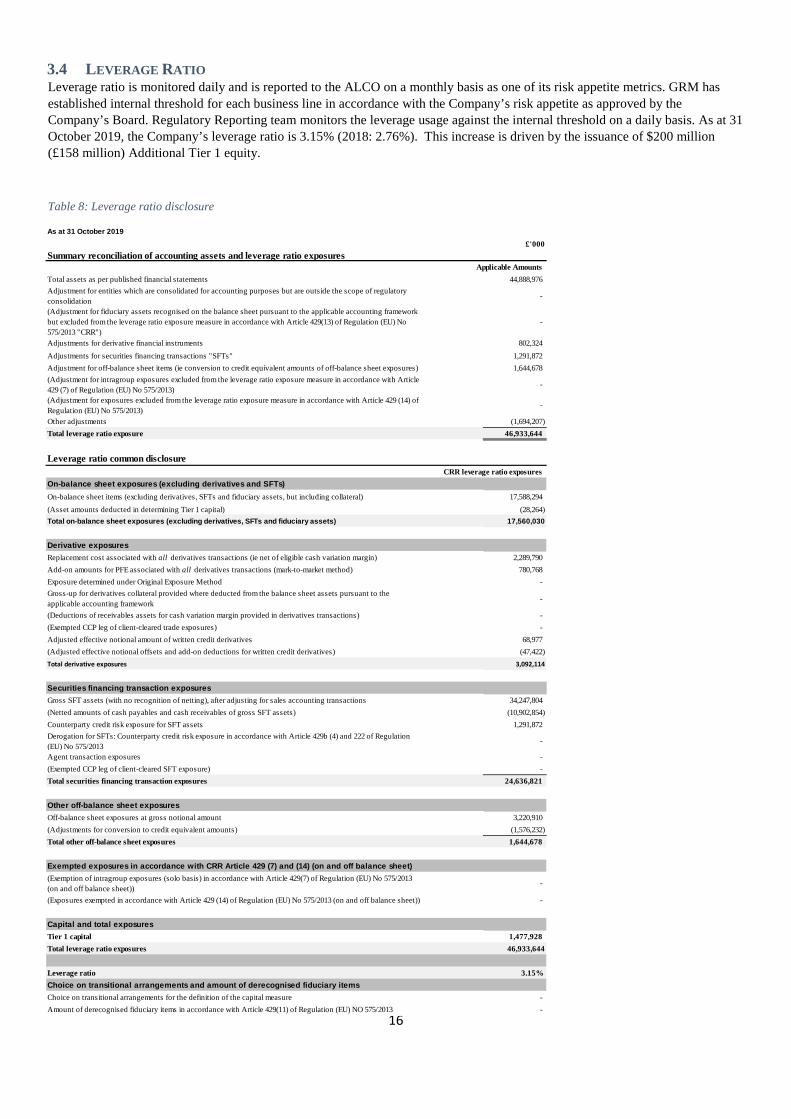
3.4 LEVERAGE RATIO Leverage ratio is monitored daily and is reported to the ALCO on a monthly basis as one of its risk appetite metrics. GRM has established internal threshold for each business line in accordance with the Company’s risk appetite as approved by the Company’s Board. Regulatory Reporting team monitors the leverage usage against the internal threshold on a daily basis. As at 31 October 2019, the Company’s leverage ratio is 3.15% (2018: 2.76%). This increase is driven by the issuance of $200 million (£158 million) Additional Tier 1 equity.
Table 8: Leverage ratio disclosure
As at 31 October 2019£'000
Summary reconciliation of accounting assets and leverage ratio exposuresApplicable Amounts
Total assets as per published financial statements 44,888,976Adjustment for entities which are consolidated for accounting purposes but are outside the scope of regulatory consolidation
-
(Adjustment for fiduciary assets recognised on the balance sheet pursuant to the applicable accounting framework but excluded from the leverage ratio exposure measure in accordance with Article 429(13) of Regulation (EU) No 575/2013 "CRR")
-
Adjustments for derivative financial instruments 802,324Adjustments for securities financing transactions "SFTs" 1,291,872Adjustment for off-balance sheet items (ie conversion to credit equivalent amounts of off-balance sheet exposures) 1,644,678(Adjustment for intragroup exposures excluded from the leverage ratio exposure measure in accordance with Article 429 (7) of Regulation (EU) No 575/2013)
-
(Adjustment for exposures excluded from the leverage ratio exposure measure in accordance with Article 429 (14) of Regulation (EU) No 575/2013)
-
Other adjustments (1,694,207)Total leverage ratio exposure 46,933,644
Leverage ratio common disclosureCRR leverage ratio exposures
On-balance sheet exposures (excluding derivatives and SFTs)On-balance sheet items (excluding derivatives, SFTs and fiduciary assets, but including collateral) 17,588,294(Asset amounts deducted in determining Tier 1 capital) (28,264)Total on-balance sheet exposures (excluding derivatives, SFTs and fiduciary assets) 17,560,030
Derivative exposuresReplacement cost associated with all derivatives transactions (ie net of eligible cash variation margin) 2,289,790Add-on amounts for PFE associated with all derivatives transactions (mark-to-market method) 780,768Exposure determined under Original Exposure Method -Gross-up for derivatives collateral provided where deducted from the balance sheet assets pursuant to the applicable accounting framework -
(Deductions of receivables assets for cash variation margin provided in derivatives transactions) -(Exempted CCP leg of client-cleared trade exposures) -Adjusted effective notional amount of written credit derivatives 68,977(Adjusted effective notional offsets and add-on deductions for written credit derivatives) (47,422)Total derivative exposures 3,092,114
Securities financing transaction exposuresGross SFT assets (with no recognition of netting), after adjusting for sales accounting transactions 34,247,804(Netted amounts of cash payables and cash receivables of gross SFT assets) (10,902,854)Counterparty credit risk exposure for SFT assets 1,291,872Derogation for SFTs: Counterparty credit risk exposure in accordance with Article 429b (4) and 222 of Regulation (EU) No 575/2013
-
Agent transaction exposures -(Exempted CCP leg of client-cleared SFT exposure) -Total securities financing transaction exposures 24,636,821
Other off-balance sheet exposuresOff-balance sheet exposures at gross notional amount 3,220,910(Adjustments for conversion to credit equivalent amounts) (1,576,232)Total other off-balance sheet exposures 1,644,678
Exempted exposures in accordance with CRR Article 429 (7) and (14) (on and off balance sheet)(Exemption of intragroup exposures (solo basis) in accordance with Article 429(7) of Regulation (EU) No 575/2013 (on and off balance sheet))
-
(Exposures exempted in accordance with Article 429 (14) of Regulation (EU) No 575/2013 (on and off balance sheet)) -
Capital and total exposuresTier 1 capital 1,477,928Total leverage ratio exposures 46,933,644
Leverage ratio 3.15%Choice on transitional arrangements and amount of derecognised fiduciary itemsChoice on transitional arrangements for the definition of the capital measure -Amount of derecognised fiduciary items in accordance with Article 429(11) of Regulation (EU) NO 575/2013 -

17
4 CAPITAL REQUIREMENTS Capital adequacy and capital ratios measured are monitored daily against internal thresholds by the Regulatory Reporting team in the Finance department. Any breaches would be escalated immediately. In addition ALCO receives monthly reports detailing capital requirements, while the Board and the RC are updated on a quarterly basis.
Analysis, monitoring and reporting of risk profiles and performance against risk appetite limits and tolerances are conducted by the relevant risk functions. Results are reported to the RC at least quarterly, with management committees updated on a more regular basis.
As at 31 October 2019, the Company’s minimum capital requirements are illustrated below, expressed in terms of risk-weighted exposure, as calculated by the approaches adopted by the Company to calculate the minimum capital resources requirements. Exposure classes not mentioned below were immaterial and are not shown separately.
Table 9: Risk exposure amount by risk type and calculation approach adopted
As at 31 October 2019
Risk-weighted Exposure
CET1 Capital requirement
@ 4.5%
Tier 1 Capital
requirement @ 6%
Total Capital requirement
@8%
£'000Risk-weighted exposure amounts for credit and counterparty credit risks
Calculated under the Standardised ApproachCentral governments or central banks 12,507 563 750 1,001Regional governments or local authorities 16,600 747 996 1,328Public sector entities 13,592 612 816 1,087Multilateral Development Banks - - - -Institutions 953,968 42,929 57,238 76,317Corporates 3,743,921 168,476 224,635 299,514Secured by mortgages on immovable property 196,517 8,843 11,791 15,721Equity 51,345 2,311 3,081 4,108Other items 12,761 574 766 1,021
5,001,211 225,055 300,073 400,097
Risk exposure amount for contributions to the default fund of a CCP 10,932 492 656 8755,012,144 225,546 300,729 400,972
Risk-weighted exposure amount settlement/delivery risk in the Trading book 2,618 118 157 209
Risk-weighted exposure amount for position, foreign exchange and commodities risksCalculated under the Standardised ApproachInterest Rate 2,208,253 99,371 132,495 176,660Equity 73,974 3,329 4,438 5,918Foreign Exchange 75,844 3,413 4,551 6,068Commodities 10,573 476 634 846
2,368,644 106,589 142,119 189,492
Risk-weighted exposure amount for operational risk Calculated under the Basic Indicator Approach 817,019 36,766 49,021 65,362
Risk-weighted exposure amount for credit valuation adjustment Calculated under the Standardised Method 8,495 382 510 680
Total 8,208,920 369,401 492,535 656,714
Surplus CET1 Capital over the minimum requirement 808,833Surplus Tier1 Capital over the minimum requirement 985,393Surplus Total Capital over the minimum requirement 898,536

18
5 CREDIT RISK
5.1 DEFINITION OF CREDIT RISK The Company defines credit risk as the risk of loss associated with a counterparty’s potential inability or unwillingness to fulfil its on- and off-balance sheet payment obligations. Credit risk may arise directly from the risk of default of a primary obligor (e.g., issuer, debtor, borrower or policyholder), or indirectly from a secondary obligor (e.g., guarantor, reinsurance) and/or through off-balance sheet exposures, contingent credit risk and/or transactional risk. Credit risk includes counterparty credit risk from both trading and non-trading activities. Exposure to credit risk occurs any time funds are extended, committed or invested through actual or implied contractual agreement.
5.2 GOVERNANCE AND FRAMEWORK Credit risk exposures across all lending and trading activities are aggregated and reported to the RC on a quarterly basis.
Individually, credit risk is controlled and reported as follows:
Banking Book Credit Risk
The loan credit risk profile is managed through the RC and more specifically the UKLMC and Wealth Management International Risk and Compliance Committee (WMI-RACC). The monitoring of Credit risk is a continual process. All borrowers are subject to a risk assessment and an exposure/limit review at least annually, with risk managed proactively on an ongoing basis. Borrowers that experience a material deterioration in credit quality and/or that may breach their covenants are added to a watch list which is monitored by the UKLMC, the WMI-RACC and senior management.
Risk appetite is managed and controlled through exposure limits defined across single names, country, industry sector and ratings. Single Name exposures across the Banking Book are limited to the lower of any RBC group limits and the Company’s Single Name Framework.
Ongoing monitoring and review processes undertaken by Group Risk Management Credit include:
Borrower Risk Rating (BRR) Regular Reviews – BRRs (measures probability of borrower default) are reviewed quarterly; Continuous Risk Assessment – The impact of new information on borrowers is assessed on an ongoing basis to adjust BRR
if appropriate; Borrower Classification Code (BCC) – Considers the probability of recovery of all monies due to the Company, and is
based on an assessment of the borrower’s current repayment capacity, including structure and collateral; and Limit monitoring – Exposures are monitored against single name limits.
Lending credit risk is mitigated through guarantees, collateral and/or the use of credit default swaps (CDS) where commercially feasible. As at 31 October 2019, none of the loans within the Company’s loan portfolio carried any CDS as the credit worthiness of the borrowers remains within the Company’s risk appetite (2018: nil).
Loan transactions are signed off by the Regulatory Reporting team for compliance with Regulatory Large Exposure Limits.
Trading Credit Risk
Each trading credit risk type is managed both separately as part of the RBC Group framework, and as part of a combined exposure metric specific to the Company, with exposure and limit usage reported daily to front office and senior management by GRM- Counterparty Credit Risk.
The Company’s Single Name Limit Framework is the primary constraint on the Trading Credit Exposure. The limits defined as part of this framework are directly related to the Company’s Risk Appetite Framework (RAF). This Framework is approved by the Board annually. The Managing Director of Credit Risk has the authority to approve temporary excesses. All operational limit excesses are reported to the UK Market Risk Management Committee (UKMRMC). Monthly exposure data is also reviewed by the UK Counterparty Credit Risk Management Committee (UKCCRMC), UKMRMC, and Risk Committee.
The Regulatory Reporting team also reports the overall capital requirement, including the capital requirement on credit risk, to the Company’s senior management on a daily basis.

19
Assigning Internal Capital and Credit Limits
The Company assigns credit risk ratings to its borrowers to reflect its assessment of the specific credit risk of each borrower over a medium term time horizon starting from the time of risk assessment or revision or confirmation.
The rating is determined through an assessment of factors, specific to the industry and/or product, that differentiate the riskiness of the borrowers and reflects the probability of default of the borrower over the time horizon. The rating is maintained through a process of continuous monitoring and periodic review. This internal rating will be used to determine internal economic capital allocation.
5.3 CREDIT RISK PROFILE The Company’s credit risk is derived from its banking and trading activities. The table below indicates the risk-weighted exposure amounts of credit and counterparty credit risk from these two activities.
Table 10: Risk exposure amounts by banking and trading activities
As at 31 October 2019£'000 Banking Trading TotalRisk-weighted exposure amounts for credit and counterparty credit risks
Calculated under the Standardised ApproachCentral governments or central banks - 12,507 12,507Regional governments or local authorities 16,600 - 16,600Public sector entities 10,400 3,192 13,592Institutions 178,082 775,886 953,968Corporates 2,393,921 1,350,000 3,743,921Secured by mortgages on immovable property 196,517 - 196,517Equity 51,345 - 51,345Other items 12,761 - 12,761
2,859,626 2,141,585 5,001,211
Risk exposure amount for contributions to the default fund of a CCP - 10,932 10,9322,859,626 2,152,518 5,012,144
Risk-weighted exposure amount settlement/delivery risk in the Trading book - 2,618 2,618
Total 2,859,626 2,155,136 5,014,762
5.3.1 Banking Book Credit Risk
The Capital Markets Banking Book credit profile is managed through monthly review of the UKLMC, with the Wealth Management lending portfolio monitored at the quarterly WMI-RACC. The combined banking book credit risk profile for the Company is reported to the RC on a quarterly basis. All borrowers are subject to a risk assessment at least annually, with risk managed proactively on an ongoing basis. Borrowers with material deterioration in credit quality which may breach their covenants are added to a watch list for monitoring, and action is taken as appropriate.
Credit risk is mitigated through guarantees and collateral where considered appropriate and commercially feasible.
As at 31 October 2019, the Company had total gross credit exposures2 of £13.2 billion (2018: £15.9 billion), and the average gross credit exposure is £13.4 billion over the year (2018: £16.4 billion). Detailed exposures by exposure class, residual maturity and geographic distribution are shown in the following tables.
2 Gross credit risk exposure is after accounting offsets, but without taking into account the effects of the credit risk mitigation. Final exposure is after the accounting offsets and the credit risk mitigation.

20
Table 11: Gross credit exposures within the banking book
As at 31 October 2019£'000Exposure amounts for credit risk in the banking book Gross
Exposure Credit Risk
ProvisionsFinal
Exposure
Risk-weighted Exposure
On balance sheet exposures Central governments or central banks 3,455,781 - 3,455,781 -Regional governments or local authorities 82,900 82,900 16,600Public sector entities 52,000 52,000 10,400Multilateral Development Banks 486,333 486,333 -Institutions 503,895 (15) 503,895 102,062Corporates 4,811,410 (2,013) 2,192,972 1,731,125Secured by mortgages on immovable property 512,430 499,581 188,830Equity 51,345 51,345 51,345Other items 11,339 11,339 12,761
9,967,433 (2,028) 7,336,147 2,113,123Off balance sheet exposures Central governments or central banks 86,200 (1) 43,100 -Regional governments or local authorities - - -Public sector entities - - -Multilateral Development Banks - - -Institutions 18,166 (.3) 377,123 76,021Corporates 3,051,702 (164) 743,951 662,796Secured by mortgages on immovable property 65,052 19,791 7,687Equity - - -Other items - - -
3,221,119 (165) 1,183,965 746,504
Total 13,188,553 (2,193) 8,520,112 2,859,626
Small and medium enterprises included in Corporates - - - -
Table 12: Average gross credit exposures within the banking book
As at 31 October 2019£'000
Gross Exposure
Final Exposure
Risk-weighted Exposure
On balance sheet exposures Central governments or central banks 4,068,954 4,068,954 2,775Regional governments or local authorities 100,162 100,162 20,041Public sector entities 76,221 76,221 20,238Multilateral development banks 573,730 573,730 -Institutions 512,940 490,373 99,310Corporates 4,085,506 1,919,459 1,536,311Secured by mortgages on immovable property 530,912 516,373 203,467Equity 48,692 32,592 32,592Other items 6,920 23,020 22,998
10,004,038 7,800,885 1,937,732Off balance sheet exposures Central governments or central banks 88,586 45,100 -Regional governments or local authorities - - -Public sector entities - - -Multilateral development banks - - -Institutions 22,831 340,453 68,895Corporates 3,236,806 868,270 762,624Secured by mortgages on immovable property 60,464 15,356 6,088Equity - - -Other items 10,215 5,108 ()
3,418,902 1,274,286 837,608
Total 13,422,940 9,075,171 2,775,340
Small and medium enterprises, included in Corporates - - -

21
As at 31 October 2019£'000Exposure amounts for credit risk in the banking book Conversion
FactorsGross
ExposureFinal
Exposure
Risk-weighted Exposure
Off balance sheet exposures Central governments or central banks 50% 86,200 43,100 -Institutions 0% - - -
20% - 153 3150% 3,888 362,692 73,134
100% 14,278 14,278 2,856Corporates 0% - - -
20% 766 - -50% 2,996,331 708,178 627,023
100% 54,605 35,773 35,773Secured by mortgages on immovable property 50% 65,052 19,791 7,687
Total 3,221,119 1,183,965 746,504
Table 13: Gross credit exposure by residual maturity
As at 31 October 2019£'000Gross exposure amounts for credit risk in the banking book Less than 1
month1 to 3
months3 to 12 months
1 to 5 years Greater than 5 years
Total
On balance sheet exposures Central governments or central banks 3,455,781 - - - - 3,455,781Regional governments or local authorities - - - 82,900 - 82,900Multilateral Development Banks - - - 486,333 - 486,333Public sector entities - - - 52,000 - 52,000Institutions 53,377 139,800 43,100 267,617 - 503,895Corporates 183,534 317,261 715,601 3,360,477 234,537 4,811,410Secured by mortgages on immovable property 98,943 41,698 54,811 316,227 751 512,430Equity - - - - 51,345 51,345Other items 11,339 - - - - 11,339
3,802,975 498,759 813,512 4,565,555 286,633 9,967,433Off balance sheet exposures Central governments or central banks - - - 86,200 - 86,200Institutions - - 12,701 5,465 - 18,166Corporates 5,304 41,876 130,293 2,597,220 277,008 3,051,702Secured by mortgages on immovable property 28,327 - 700 33,775 2,250 65,052Equity - - - - - -Other items - - - - - -
33,631 41,876 143,694 2,722,660 279,258 3,221,119
Total 3,836,606 540,635 957,206 7,288,214 565,891 13,188,553
Table 14: Final credit exposure by residual maturity
As at 31 October 2019£'000Final exposure amounts for credit risk in the banking book Less than 1
month1 to 3
months3 to 12 months
1 to 5 years Greater than 5 years
Total
On balance sheet exposures Central governments or central banks 3,455,781 - - - - 3,455,781Regional governments or local authorities - - - 82,900 - 82,900Multilateral Development Banks - - - 486,333 - 486,333Public sector entities - - - 52,000 - 52,000Institutions 53,377 139,800 43,100 267,617 - 503,895Corporates 64,532 255,309 168,353 1,482,736 222,042 2,192,972Secured by mortgages on immovable property 96,455 38,995 53,008 310,373 751 499,581Equity - - - - 51,345 51,345Other items 11,339 - - - - 11,339
3,681,485 434,104 264,461 2,681,959 274,138 7,336,147Off balance sheet exposures Central governments or central banks - - - 43,100 - 43,100Institutions 11,700 - 32,903 294,322 38,198 377,123Corporates 2,652 24,465 42,932 609,480 64,421 743,951Secured by mortgages on immovable property 2,430 - 350 15,923 1,088 19,791Equity - - - - - -Other items - - - - - -
16,782 24,465 76,186 962,826 103,707 1,183,965
Total 3,698,267 458,569 340,646 3,644,785 377,844 8,520,112
Table 15: Credit conversion factor for off balance sheet credit exposures

22
Table 16: Gross credit exposure by geographic distribution
As at 31 October 2019£'000Gross exposure amounts for credit risk in the banking book Asia-Pacific Caribbean EEA Europe
OtherMiddle East North
AmericaOthers Total
On balance sheet exposures Central governments or central banks - - 3,255,525 157 - 200,100 - 3,455,781Regional government or local authorities - - - - - 82,900 - 82,900Multilateral Development Banks 185,000 - 101,400 - - 197,600 2,333 486,333Public sector entities - - 52,000 - - - - 52,000Institutions 81 491,232 8,395 2 4,164 21 503,895Corporates 143,490 74,185 3,996,376 446,658 2,079 148,623 - 4,811,410Secured by mortgages on immovable property 6,760 - 344,396 15,736 34,900 107,511 3,126 512,430Equity - - 51,345 - - - - 51,345Other items - - 11,339 - - - - 11,339
335,331 74,185 8,303,613 470,945 36,981 740,899 5,479 9,967,433Off balance sheet exposures Central governments or central banks - - 86,200 - - - - 86,200Institutions - - 18,166 - - - - 18,166Corporates 42,478 88,132 2,398,785 94,254 309,400 98,311 20,341 3,051,702Secured by mortgages on immovable property - - 28,559 28,198 8,295 - - 65,052Equity - - - - - - - -Other items - - - - - - - -
42,478 88,132 2,531,711 122,451 317,695 98,311 20,341 3,221,119
Total 377,809 162,317 10,835,324 593,397 354,676 839,210 25,820 13,188,553
Table 17: Final credit exposure by geographic distribution
As at 31 October 2019£'000Final exposure amounts for credit risk in the banking book Asia-Pacific Caribbean EEA Europe
OtherMiddle East North
AmericaOthers Total
On balance sheet exposures Central governments or central banks - - 3,255,525 157 - 200,100 - 3,455,781Regional government or local authorities - - - - - 82,900 - 82,900Multilateral Development Banks 185,000 - 101,400 - - 197,600 2,333 486,333Public sector entities - - 52,000 - - - - 52,000Institutions 81 491,232 8,395 2 4,164 21 503,895Corporates 143,385 48,871 1,579,709 309,135 - 111,872 - 2,192,972Secured by mortgages on immovable property 6,643 - 336,653 15,289 31,419 106,711 2,865 499,581Equity - - 51,345 - - - - 51,345Other items - - 11,339 - - - - 11,339
335,109 48,871 5,879,203 332,975 31,421 703,347 5,219 7,336,147Off balance sheet exposures Central governments or central banks - - 43,100 - - - - 43,100Institutions - - 16,222 - - 360,901 - 377,123Corporates 14,556 17,211 587,445 30,953 50,280 40,116 3,390 743,951Secured by mortgages on immovable property - - 14,234 1,410 4,148 - - 19,791Equity - - - - - - - -Other items - - - - - - - -
14,556 17,211 661,001 32,363 54,427 401,017 3,390 1,183,965
Total 349,666 66,082 6,540,204 365,338 85,849 1,104,364 8,609 8,520,112
Further details on geographic distribution in relation to the EEA member states are shown below.
Table 18: Gross credit exposure by geographic distribution within the EEA
As at 31 October 2019£'000Gross exposure in relation to the EEA member states United
KingdomFrance Spain Germany Luxembourg Ireland Netherlands Others Total
On balance sheet exposures Central governments or central banks 490,247 2,740,078 - 25,200 - - - - 3,255,525Multilateral Development Banks - - - - 68,400 - - 33,000 101,400Public sector entities - - - - - - - 52,000 52,000Institutions 37,977 4 16 437,326 1 2,702 13,200 7 491,232Corporates 1,273,083 96,348 67,343 474,870 917,848 125,259 334,124 707,501 3,996,376Secured by mortgages on immovable property 333,807 2,285 - 1,559 - - 4,430 2,315 344,396Equity 51,345 - - - - - - - 51,345Other items 11,339 - - - - - - - 11,339
2,197,798 2,838,714 67,360 938,955 986,248 127,961 351,754 794,823 8,303,613Off balance sheet exposures Central governments or central banks - - - 86,200 - - - - 86,200Institutions - - - 1,591 - 3,874 12,701 - 18,166Corporates 556,534 101,406 386,895 749,612 160,079 158,532 165,245 120,482 2,398,785Secured by mortgages on immovable property 28,559 - - - - - - - 28,559Equity - - - - - - - - -Other items - - - - - - - - -
585,093 101,406 386,895 837,403 160,079 162,406 177,946 120,482 2,531,711
Total 2,782,891 2,940,120 454,255 1,776,358 1,146,327 290,367 529,700 915,305 10,835,324

23
Table 19: Final credit exposure by geographic distribution within the EEA
As at 31 October 2019£'000Final exposure in relation to the EEA member states United
KingdomFrance Spain Germany Luxembourg Ireland Netherlands Others Total
On balance sheet exposures Central governments or central banks 490,247 2,740,078 - 25,200 - - - - 3,255,525Multilateral Development Banks - - - - 68,400 - - 33,000 101,400Public sector entities - - - - - - - 52,000 52,000Institutions 37,977 4 16 437,326 1 2,702 13,200 7 491,232Corporates 668,591 16,903 52,843 378,809 206,142 65,993 70,086 120,342 1,579,709Secured by mortgages on immovable property 326,181 2,273 - 1,559 - - 4,353 2,287 336,653Equity 51,345 - - - - - - - 51,345Other items 11,339 - - - - - - - 11,339
1,585,680 2,759,257 52,860 842,894 274,542 68,695 87,639 207,636 5,879,203Off balance sheet exposures Central governments or central banks - - - 43,100 - - - - 43,100Institutions - - - 1,591 - 1,937 12,694 - 16,222Corporates 188,353 2,815 62,241 143,529 49,702 13,812 74,179 52,814 587,445Secured by mortgages on immovable property 14,234 - - - - - - - 14,234Equity - - - - - - - - -Other items - - - - - - - - -
202,586 2,815 62,241 188,220 49,702 15,749 86,873 52,814 661,001
Total 1,788,266 2,762,072 115,101 1,031,114 324,244 84,444 174,512 260,450 6,540,204
5.3.2 Credit Risk Adjustments The Company defines a credit risk adjustment as the amount of specific loan provision for credit losses that has been recognised in its financial statements in accordance with the International Financial Reporting Standards (IFRS).
An allowance for credit losses (ACL) is established for all financial instruments, except for financial assets classified or designated as fair value through P&L (FVTPL) and securities designated as fair value through other comprehensive income (FVOCI), which are not subject to impairment assessment. Assets subject to impairment assessment include certain loans, debt securities, accounts and accrued interest receivable.
Off-balance sheet items subject to impairment assessment include financial guarantees and undrawn loan commitments. For certain retail products, expected credit losses are measured based on the total exposure and are not attributable to the on- and off-balance sheet components. For these products, ACL is presented in Allowance for loan losses to the extent that ACL does not exceed the related loan balance. For all other off-balance sheet products subject to impairment assessment, ACL is separately calculated.
The Company measures the ACL on each balance sheet date according to a three-stage expected credit loss impairment model:
Performing financial assets
Stage 1 – From initial recognition of a financial asset to the date on which the asset has experienced a significant increase in credit risk relative to its initial recognition, a loss allowance is recognised equal to the credit losses expected to result from defaults occurring over the 12 months following the reporting date.
Stage 2 – Following a significant increase in credit risk relative to the initial recognition of the financial asset, a loss allowance is recognised equal to the credit losses expected over the remaining lifetime of the asset.
Impaired financial assets
Stage 3 – When a financial asset is considered to be credit-impaired, a loss allowance is recognised equal to credit losses expected over the remaining lifetime of the asset. Interest revenue is calculated based on the carrying amount of the asset, net of the loss allowance, rather than on its gross carrying amount.
The ACL is a discounted probability-weighted estimate of the cash shortfalls expected to result from defaults over the relevant time horizon. For loan commitments, credit loss estimates consider the portion of the commitment that is expected to be drawn over the relevant time period. For financial guarantees, credit loss estimates are based on the expected payments required under the guarantee contract.
Increases or decreases in the required ACL attributable to purchases and new originations, de-recognitions or maturities, and re-measurements due to changes in loss expectations or stage transfers are reported in the profit and loss account as Provision for credit losses. Write-offs and recoveries of amounts previously written off are recorded against ACL.
The ACL represents an unbiased estimate of expected credit losses on the financial assets as at the balance sheet date. Judgement is required in making assumptions and estimations when calculating the ACL, including movements between the three stages and the application of forward looking information. The underlying assumptions and estimates may result in changes to the provisions from period to period that significantly affect the Company’s results of operations.

24
Individually assessed loans (Stage 3)
When individually significant loans are identified as impaired, the Company reduces the carrying value of the loans to their estimated realizable value by recording an individually assessed ACL to cover identified credit losses. The individually assessed ACL reflects the expected amount of principal and interest calculated under the terms of the original loan agreement that will not be recovered, and the impact of time delays in collecting principal and/or interest (time value of money). The estimated realisable value for each individually significant loan is the present value of expected future cash flows discounted using the original effective interest rate for each loan. When the amounts and timing of future cash flows cannot be estimated with reasonable reliability, the estimated realisable amount may be determined using observable market prices for comparable loans, the fair value of collateral underlying the loans, and other reasonable and supported methods based on management judgement.
Individually-assessed allowances are established in consideration of a range of possible outcomes, which may include macroeconomic or non-macroeconomic scenarios, to the extent relevant to the circumstances of the specific borrower being assessed. Assumptions used in estimating expected future cash flows reflect current and expected future economic conditions and are generally consistent with those used in Stage 1 and Stage 2 measurement.
Significant judgement is required in assessing evidence of credit-impairment and estimation of the amount and timing of future cash flows when determining expected credit losses. Changes in the amount expected to be recovered would have a direct impact on the Provision for credit losses and may result in a change in the ACL.
Write-off of loans
Loans and the related ACL are written-off, either partially or in full, when there is no realistic prospect of recovery. Where loans are secured, they are generally written off after receipt of any proceeds from the realization of collateral. In circumstances where the net realizable value of any collateral has been determined and there is no reasonable expectation of further recovery, write off may be earlier.
Table 20: Reconciliation of provision for credit losses for all financial instruments
31 October 2019 31 October 2018£'000 £'000
Provisions brought forward 4,543 5,084Provisions raised during the year 6,678 1,495Net write-offs - (2,142)Exchange rate and other (17) 106Provisions as at year end 11,204 4,543
As at 31 October 2019, RBCEL had stage 3 impairments of £5.9 million (2018: nil).
5.3.3 Counterparty Credit Risk Trading book counterparty risk arises from exposure to the following:
Securities finance transactions (SFT), as part of Fixed Income, Central Funding Group and Equity Finance businesses. Derivatives, primarily through Exchange traded derivatives (ETD) and over-the-counter (OTC) derivatives.
Table 21: Trading credit risk
As at 31 October 2019£'000Counterparty credit risk exposure by products Gross
ExposureFinal
Exposure
Risk-weighted Exposure
Calculated under the Standardised Approach Exchange traded derivatives 957,117 592,827 73,637OTC derivatives 375,887 96,716 10,738SFTs 4,136,299 4,136,299 2,057,210Total 5,469,303 4,825,841 2,141,585

25
Each trading credit risk type is managed both separately as part of the RBC Group framework, and as part of a combined exposure metric specific to the Company, with exposure and limit usage reported daily to senior management by GRM Counterparty Credit Risk.
The Company’s Single Name Limit Framework is the primary constraint of the Company’s trading credit exposure. The limits defined as part of this framework are directly related to the Company’s risk appetite.
The Company’s counterparty credit risk profile is largely made up of equity securities finance / stock lending and fixed income repurchase transactions (repo). Counterparty credit risk is managed through increasing over-collateralisation margins on riskier counterparties with margins being actively managed and exchanged daily.
Cash margins are introduced once the market value of collateral is insufficient to cover the underlying amount of the repurchase agreement or securities borrowed or loaned. Collateral is an important mitigation of credit risk. The Company holds collateral mainly in the form of securities and has the ability to use CDSs in order to enhance credit protection.
Credit counterparty risk from derivatives is mitigated where possible through netting agreements whereby derivative assets and liabilities with the same counterparty can be offset. The Company requires all netting arrangement to be legally enforceable. Collateral and cash margins are also obtained as an important mitigation of credit risk.
The Company ensures that any collateral held is sufficiently liquid, legally effective, enforceable and regularly reassessed. Any collateral taken is generally subject to a valuation adjustment with a percentage applicable to each type of collateral, which will be largely based on liquidity and price volatility of the underlying security.
As at 31 October 2019, the Company had total gross credit exposures of £5.5 billion (2018: £4.8 billion), and the average gross credit exposure is £5.5 billion over the year (2018: £4.6 billion). Detailed exposures by products, exposure class, residual maturity and geographic distribution are shown in the tables below.
Table 22: Counterparty credit risk by exposure class
As at 31 October 2019£'000Exposure amounts for counterparty credit risk in trading book Gross
ExposureFinal
Exposure
Risk-weighted Exposure
Calculated under the Standardised Approach Central governments or central banks 190,579 190,579 12,507International organisations - - -Public sector entities 15,960 15,960 3,192Institutions 3,508,438 2,870,939 775,886Corporates 1,754,326 1,748,363 1,350,000Total 5,469,303 4,825,841 2,141,585
Small and medium enterprises, included in Corporates - - -
Table 23: Average counterparty credit risk exposure
For the year ended 31 October 2019£'000Exposure amounts for counterparty credit risk in trading book Gross
ExposureFinal
Exposure
Risk-weighted Exposure
Calculated under the Standardised Approach Central governments or central banks 148,931 148,931 2,937International organisations - - -Public sector entities 35,465 35,465 7,093Institutions 3,674,135 2,762,571 741,681Corporates 1,606,967 1,590,930 1,424,199Total 5,465,499 4,537,897 2,175,910
Small and medium enterprises, included in Corporates - - -

26
Table 24: Gross counterparty credit exposure by residual maturity
As at 31 October 2019£'000Gross exposure amounts for counterparty credit risk Less than 1
month1 to 3
months3 to 12 months
1 to 5 years Greater than 5 years
Total
Central governments or central banks 12,507 - - - - 12,507Public sector entities 3,192 - - - - 3,192Institutions 521,657 66,710 186,152 196 1,171 775,886Corporates 1,058,500 176,461 86,655 28,383 - 1,350,000
Total 1,595,856 243,172 272,807 28,579 1,171 2,141,585
Table 25: Final counterparty credit exposure by residual maturity
As at 31 October 2019£'000Final exposure amounts for counterparty credit risk Less than 1
month1 to 3
months3 to 12 months
1 to 5 years Greater than 5 years
Total
Central governments or central banks 176,626 9,911 4,042 - - 190,579Public sector entities 15,960 - - - - 15,960Institutions 2,085,608 291,598 428,910 6,261 58,563 2,870,939Corporates 1,231,286 213,426 115,559 188,091 - 1,748,363
Total 3,509,481 514,935 548,511 194,353 58,563 4,825,841
Table 26: Gross counterparty credit exposure by geographic distribution
As at 31 October 2019£'000Gross exposure amounts for counterparty credit risk Asia-Pacific Caribbean EEA Europe
OtherMiddle
EastNorth
AmericaOthers Total
Central governments or central banks 80,575 - 39,526 - 70,478 - - 190,579Public sector entities - - - - 15,960 - - 15,960Institutions 568,681 15,822 1,873,174 163,428 565 886,630 138 3,508,438Corporates 268,926 303,564 950,308 79,841 2 151,685 - 1,754,326
Total 918,181 319,386 2,863,008 243,269 87,005 1,038,316 138 5,469,303
Table 27: Final counterparty credit exposure by geographic distribution
As at 31 October 2019£'000Final exposure amounts for counterparty credit risk Asia-Pacific Caribbean EEA Europe
OtherMiddle
EastNorth
AmericaOthers Total
Central governments or central banks 80,575 - 39,526 - 70,478 - - 190,579Public sector entities - - - - 15,960 - - 15,960Institutions 568,673 15,822 1,834,314 163,428 565 288,000 138 2,870,939Corporates 268,926 303,564 945,307 78,879 2 151,685 - 1,748,363
Total 918,174 319,386 2,819,147 242,307 87,005 439,685 138 4,825,841
Further details on geographic distribution in relation to the EEA member states and North America are shown below.
Table 28: Gross credit exposure by geographic distribution within the EEA and North America
As at 31 October 2019£'000Gross exposure in relation to the EEA member states United
KingdomFrance Netherlands Germany Belgium Sweden Finland Spain Others Total
Central governments or central banks 14,388 304 - - - - - - 24,833 39,526Institutions 901,573 213,614 254,679 13,780 200,291 1 - 283 288,953 1,873,174Corporates 520,516 3,615 49,500 16,499 20,470 4,777 - 334,930 950,308
Total 1,436,478 217,534 304,179 30,279 200,291 20,471 4,777 283 648,716 2,863,008 As at 31 October 2019£'000Gross exposure in relation to North America Canada United
StatesBermuda Total
Central governments or central banks - - - -Public sector entities - - - -Institutions 573,894 312,736 - 886,630Corporates 22,598 127,917 1,170 151,685
Total 596,493 440,653 1,170 1,038,316

27
Table 29: Final credit exposure by geographic distribution within the EEA and North America
As at 31 October 2019£'000Final exposure in relation to the EEA member states United
KingdomFrance Netherlands Germany Belgium Sweden Finland Spain Others Total
Central governments or central banks 14,388 304 - - - - - - 24,833 39,526Institutions 863,086 213,241 254,679 13,780 200,291 1 - 283 288,953 1,834,314Corporates 519,560 2,471 49,500 16,499 20,470 4,777 - 332,030 945,307
Total 1,397,034 216,016 304,179 30,279 200,291 20,471 4,777 283 645,816 2,819,147 As at 31 October 2019£'000Final exposure in relation to North America Canada United
StatesBermuda Total
Central governments or central banks - - - -Public sector entities - - - -Institutions 64,092 223,908 - 288,000Corporates 22,598 127,917 1,170 151,685
Total 86,690 351,825 1,170 439,685
5.3.4 Wrong-Way Risk Exposures The Company has detailed policies and procedures in place to ensure that the wrong-way risk is closely monitored. General wrong-way risk exists when there is a positive correlation between the probability of default of counterparties to general market risk factors. GRM-Enterprise Market Risk monitors general wrong-way risk using a variety of counterparty risk metrics including geographically centered hypothetical and historical stress events and single risk factor stresses and sensitivities.
For securities financing transactions, specific wrong-way risk counterparty exposure is incurred when the Company enters into a securities financing transaction with a counterparty where the underlying collateral held by the Company includes securities issued by the counterparty or any affiliate of that counterparty. Where the risk to the collateral and the risk of default by the counterparty are potentially correlated, GRM will evaluate and perform ad hoc wrong-way risk analyses against potential scenarios, as appropriate.
For derivative transactions, specific wrong-way risk exists when the exposure to a particular counterparty is positively and highly correlated with the probability of default of the counterparty due to the nature of the transactions with the counterparty. Specific guidelines have been established to calculate the exposure as well as the internal approval process to be used. GRM-Market Risk and GRM-Counterparty Credit Risk are responsible for the monitoring of the wrong-way risk in derivative transactions.
5.3.5 Counterparty Credit Risk Arising from Derivative Transactions As at 31 October 2019, the final exposure arising from derivative transactions amounted to £416.3 million (2018: £761.6 million), excluding £270.1 million relating to the margin receivables (2018: £483.9 million). Refer to the previous section for detailed disclosure on exposures by product type.
Table 30: Counterparty credit risk for derivative transactions
As at 31 October 2019 Gross Positive Fair
Value
Gross PFCE*
Netting Benefits
Initial Exposure
Collateral Allocated**
Final Exposure**
*
Gross Notional
£'000Calculated under the Mark to Market MethodExchanged Traded Derivatives
Commodities 137,353 528,054 (364,431) 300,976 (155,379) 145,597 5,135,850Equities 33,696 301,655 (127,655) 207,697 (78,181) 129,515 4,535,876Interest Rate 30,318 373,628 (239,156) 164,789 (76,393) 88,396 178,435,812Foreign Exchange and Gold 292 46,282 (28,050) 18,525 (858) 17,667 4,622,909
201,659 1,249,619 (759,291) 691,987 (310,811) 381,176 192,730,447
Over-The-Counter DerivativesCommodities 41,841 4,693 10,977 57,511 (27,034) 30,477 46,926Credit Default Swaps 2,081 12,718 (8,515) 6,284 (6,284) - 133,643Equities - - - - - - -Foreign Exchange and Gold 61,344 284,149 (150,406) 195,087 (195,087) - 23,735,713Interest Rate 507,779 73,566 (529,653) 51,692 (47,066) 4,626 21,696,335
613,045 375,125 (677,597) 310,574 (275,471) 35,103 45,612,617
Total 814,704 1,624,745 (1,436,888) 1,002,561 (586,282) 416,279 238,343,064 *PFCE stands for potential future credit exposure. **Collateral allocated amount is the collateral mark to market value after appropriate volatility adjustments. ***The final exposure does not include margin receivable of £270.1million (2018: £483.9 million).
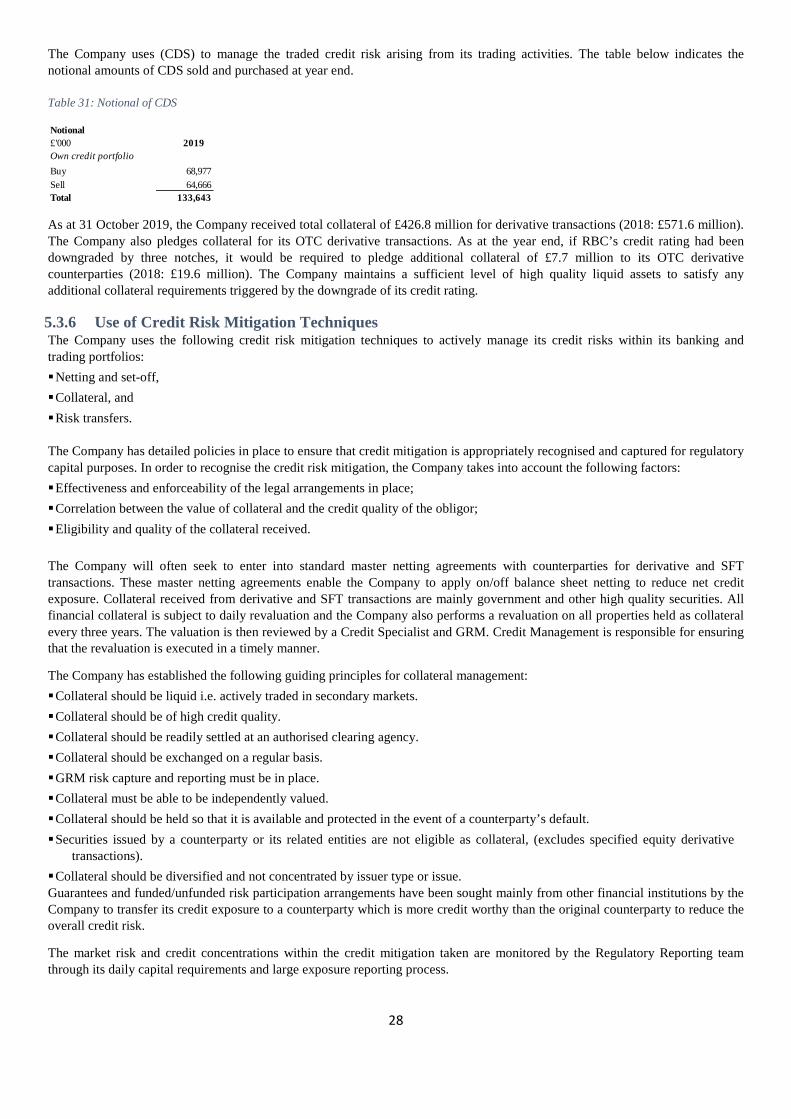
28
The Company uses (CDS) to manage the traded credit risk arising from its trading activities. The table below indicates the notional amounts of CDS sold and purchased at year end. Table 31: Notional of CDS
Notional£'000 2019Own credit portfolioBuy 68,977Sell 64,666Total 133,643
As at 31 October 2019, the Company received total collateral of £426.8 million for derivative transactions (2018: £571.6 million). The Company also pledges collateral for its OTC derivative transactions. As at the year end, if RBC’s credit rating had been downgraded by three notches, it would be required to pledge additional collateral of £7.7 million to its OTC derivative counterparties (2018: £19.6 million). The Company maintains a sufficient level of high quality liquid assets to satisfy any additional collateral requirements triggered by the downgrade of its credit rating.
5.3.6 Use of Credit Risk Mitigation Techniques The Company uses the following credit risk mitigation techniques to actively manage its credit risks within its banking and trading portfolios: Netting and set-off, Collateral, and Risk transfers. The Company has detailed policies in place to ensure that credit mitigation is appropriately recognised and captured for regulatory capital purposes. In order to recognise the credit risk mitigation, the Company takes into account the following factors: Effectiveness and enforceability of the legal arrangements in place; Correlation between the value of collateral and the credit quality of the obligor; Eligibility and quality of the collateral received.
The Company will often seek to enter into standard master netting agreements with counterparties for derivative and SFT transactions. These master netting agreements enable the Company to apply on/off balance sheet netting to reduce net credit exposure. Collateral received from derivative and SFT transactions are mainly government and other high quality securities. All financial collateral is subject to daily revaluation and the Company also performs a revaluation on all properties held as collateral every three years. The valuation is then reviewed by a Credit Specialist and GRM. Credit Management is responsible for ensuring that the revaluation is executed in a timely manner.
The Company has established the following guiding principles for collateral management: Collateral should be liquid i.e. actively traded in secondary markets. Collateral should be of high credit quality. Collateral should be readily settled at an authorised clearing agency. Collateral should be exchanged on a regular basis. GRM risk capture and reporting must be in place. Collateral must be able to be independently valued. Collateral should be held so that it is available and protected in the event of a counterparty’s default. Securities issued by a counterparty or its related entities are not eligible as collateral, (excludes specified equity derivative
transactions). Collateral should be diversified and not concentrated by issuer type or issue. Guarantees and funded/unfunded risk participation arrangements have been sought mainly from other financial institutions by the Company to transfer its credit exposure to a counterparty which is more credit worthy than the original counterparty to reduce the overall credit risk.
The market risk and credit concentrations within the credit mitigation taken are monitored by the Regulatory Reporting team through its daily capital requirements and large exposure reporting process.
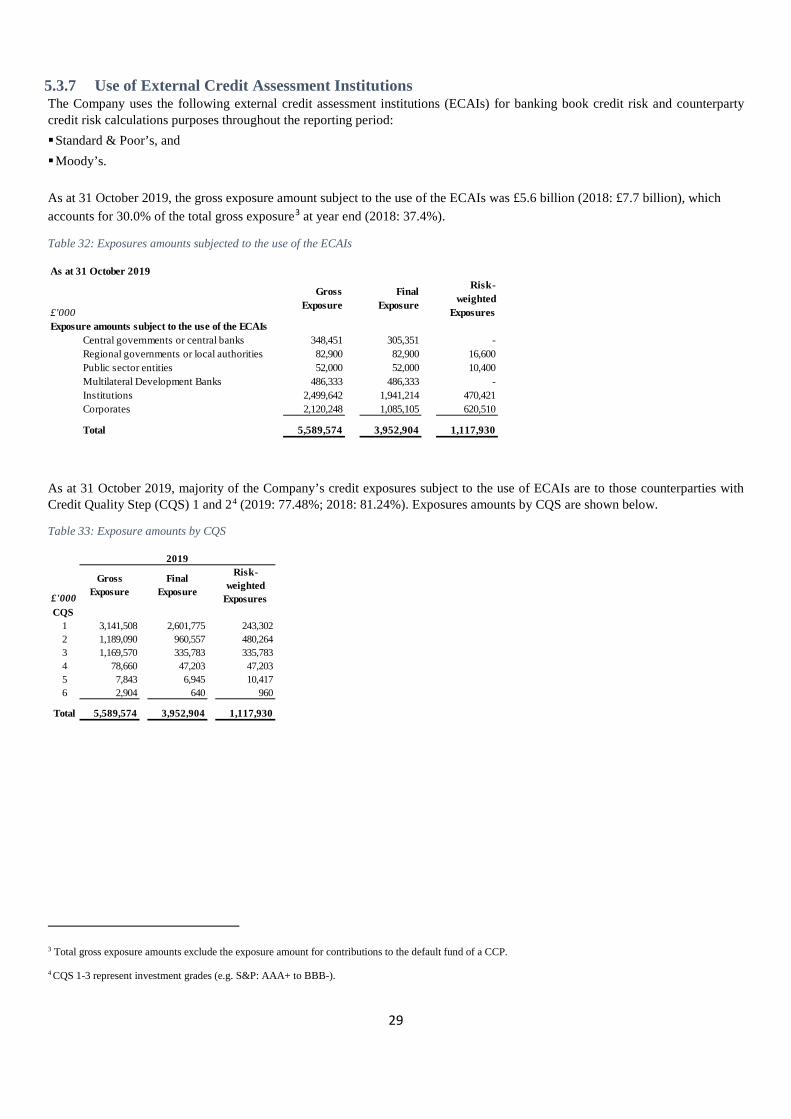
29
5.3.7 Use of External Credit Assessment Institutions The Company uses the following external credit assessment institutions (ECAIs) for banking book credit risk and counterparty credit risk calculations purposes throughout the reporting period: Standard & Poor’s, and Moody’s.
As at 31 October 2019, the gross exposure amount subject to the use of the ECAIs was £5.6 billion (2018: £7.7 billion), which accounts for 30.0% of the total gross exposure3 at year end (2018: 37.4%).
Table 32: Exposures amounts subjected to the use of the ECAIs
As at 31 October 2019
£'000
Gross Exposure
Final Exposure
Risk-weighted
Exposures Exposure amounts subject to the use of the ECAIs
Central governments or central banks 348,451 305,351 -Regional governments or local authorities 82,900 82,900 16,600Public sector entities 52,000 52,000 10,400Multilateral Development Banks 486,333 486,333 -Institutions 2,499,642 1,941,214 470,421Corporates 2,120,248 1,085,105 620,510
Total 5,589,574 3,952,904 1,117,930
As at 31 October 2019, majority of the Company’s credit exposures subject to the use of ECAIs are to those counterparties with Credit Quality Step (CQS) 1 and 24 (2019: 77.48%; 2018: 81.24%). Exposures amounts by CQS are shown below.
Table 33: Exposure amounts by CQS
£'000
Gross Exposure
Final Exposure
Risk-weighted
Exposures CQS
1 3,141,508 2,601,775 243,3022 1,189,090 960,557 480,2643 1,169,570 335,783 335,7834 78,660 47,203 47,2035 7,843 6,945 10,4176 2,904 640 960
Total 5,589,574 3,952,904 1,117,930
2019
3 Total gross exposure amounts exclude the exposure amount for contributions to the default fund of a CCP.
4 CQS 1-3 represent investment grades (e.g. S&P: AAA+ to BBB-).

30
6 MARKET RISK
6.1 DEFINITION OF MARKET RISK Market risk is defined as the risk of loss resulting from changes in market factors and the volatility of these factors. Market risk can be exacerbated by thinly-traded or illiquid markets. RBCEL considers market risk to fall into the following categories:
Credit Spread Risk: The risk of loss due to the change in credit spreads on all financial instruments whose accounting fair value depends on credit spreads. This includes securities, credit derivatives and fair value liabilities.
Interest Rate Risk: The risk of loss resulting from changes in interest rates.
Foreign Exchange Risk: The risk of loss resulting from changes in exchange rates.
Equity Risk: The risk of loss resulting from changes in equity prices and indices.
Commodity Risk: The risk of loss resulting from changes in commodity prices.
Underwriting Risk: The risk of loss resulting from (i) the failure to place or sell a particular security or bond concurrent with a negative market or credit risk event; and (ii) inadequate due diligence in connection with a securities offering.
6.2 GOVERNANCE AND FRAMEWORK Market Risk is managed through the Company’s Market Risk Framework which is governed and overseen by the Head of Market Risk Europe & APAC in London. The Company is also subject to the RBC Group policies laid out in the RBC Group Market Risk Framework and standing orders.
GRM Market Risk produces daily reports for the business and senior management detailing the Company’s exposure against limits, as well as monthly summary reports for the UKMRC and quarterly for the RC.
The Company's market risk appetite is set and reviewed by the Board. The Company has a range of limits in place covering the risk measurement metrics noted above. All limits set by the Company are consistent with the stated risk appetite. In addition to the Board approved limits, exposures are also limited by the RBC Group limit structure.
The Company uses a two tier market risk limit structure: Tactical limits are set and approved by the Board and are constrained by economic capital limits. Tactical limits are
designed so risk taken cannot exceed available financial resources. All tactical limit excesses and limit changes are reported to the UKMRC and the RC; and
Operational limits are approved by the Head of Market Risk Europe & APAC and reviewed as required by the UKMRC. Operational limits must always remain lower than tactical limits. All operational limit excesses and limit changes are reported to the UKMRC and the Conduct Committee.
The Regulatory Reporting team also reports the overall capital requirement, including capital requirement on market risk, to the Company’s senior management on a daily basis.
Additional information is provided in the Company’s Annual Accounts and Financial Statements.

31
6.3 RISK PROFILE As at 31 October 2019, the Company’s capital requirement in relation to market risk is £190 million (2018: £199 million).
Table 33: Market risk by risk type
As at 31 October 2019Risk-
weighted Exposure
Capital Requirement
£'000Interest rate risk 2,208,253 176,660 of which: Securitisation position risk 101,068 8,085Equity risk 73,974 5,918Foreign-exchange risk 75,844 6,068Settlement risk - -Commodities risk 10,573 846
2,368,644 189,492
The Company had £74 million (2018 £49 million) CIU trading book exposures (included in equity risk) as at the financial year-end.
The Company had no Underwriting risk as at the financial year-end.

32
7 SECURITISATIONS The Company defines securitisation as a transaction or scheme, whereby the credit risk associated with an exposure or pool of exposures is tranched, having both of the following characteristics:
payments in the transaction or scheme are dependent upon the performance of the exposure or pool of exposures; and
the subordination of tranches determines the distribution of losses during the ongoing life of the transaction or scheme.
Re-securitisation means securitisation where the risk associated with an underlying pool of exposures is tranched and at least one of the underlying exposures is a securitisation position.
A securitisation position can be either classified as: Traditional securitisation: a securitisation involving the economic transfer of the exposures being securitised. Synthetic securitisation: a securitisation where the transfer of risk is achieved by the use of credit derivatives or guarantees,
and the exposures being securitised remain exposures of the originator institution.
7.1.1 Objectives of Securitisation Activities The Company trades a range of European securitised products in the secondary market and is not engaged in any securitisation of its own originated assets or the securitisation of third party assets via special purpose vehicles.
The Company monitors the market and credit risks arising from its securitisation positions in the similar manner as those of non-securitisation trading positions. Refer to the Company’s risk governance and control framework discussion in the previous sections.
In addition, the Company adopts RBC’s Trading Book Securitisation Framework, which requires:
a comprehensive understanding of the risk characteristics of its individual securitisation exposures as well as the risk characteristics of the pools underlying its securitisation exposures;
access performance information on the underlying pools on an on-going basis in a timely manner, including exposure type, percentage of loans past due, default rate, prepayment rates, loans in foreclosure, property type, occupancy, average credit score or other measures of creditworthiness, average loan-to-value ratio and industry and geographic diversifications;
a thorough understanding of all structural features of a securitisation transaction that would materially impact the performance of the Company’s exposures to the transactions, such as the contractual waterfall and waterfall-related triggers, credit enhancement, liquidity enhancements, market value triggers, and deal-specific definitions of default.

33
7.1.2 Risk Profile As at 31 October 2019, the Company had a total exposure of £450 million in relation to the securitisation positions, resulting in own funds requirement of £8 million using the Standardised calculation. Detailed analysis on the securitisation trading and banking book positions are included in the tables below.
Table 34: Exposures by underlying exposure type
As at 31 October 2019£'000Exposure Type Exposure Risk-weighted
ExposureCapital
Requirement Traditional securitisationResidential mortgages 34,044 6,809 545Credit card receivables 63,804 12,761 1,021Consumer loans - - -Other assets 351,754 81,498 6,520
449,602 101,068 8,085
Table 35: Securitisation exposures by seniority
As at 31 October 2019£'000Tranche Exposure Risk-weighted
ExposureCapital
Requirement Senior 387,917 77,583 6,207Mezzanine 61,685 23,484 1,879First loss - - -
449,602 101,068 8,085
Table 36: Securitisation exposures by risk weighting
As at 31 October 2019£'000Risk Weighting Exposure Risk-weighted
ExposureCapital
Requirement Exposures rated by ECAIs
20% 412,444 82,489 6,59950% 37,158 18,579 1,486
100% - - -350% - - -
1250% - - -449,602 101,068 8,085
Exposures not rated by ECAIs1250% - - -
Total 449,602 101,068 8,085
The Company uses the following three ECAIs in assigning the appropriate risk weights for the securitisation positions held:
Standard & Poor’s, and Moody’s

34
8 Summary of Relevant Accounting Policies
Recognition and measurement of financial instruments
Trading securities include all securities that are classified as FVTPL by nature and securities designated as FVTPL. Obligations to deliver trading securities sold but not yet purchased are recorded as liabilities and carried at fair value. Realised and unrealised gains and losses on these securities are generally recorded as trading revenue in non-interest income. Dividends and interest income accrued on interest bearing and trading securities are recorded in interest income. Interest and dividends accrued on interest-bearing and equity securities sold short are recorded in interest expense.
Investment securities include all securities classified as FVOCI and amortised cost. All investment securities are initially recorded at fair value and subsequently measured according to the respective classification.
Investment securities carried at amortised cost are measured using the effective interest method, and are presented net of any allowance for credit losses, calculated in accordance with the Company’s policy for Allowance for credit losses, as described below. Interest income, including the amortisation of premiums and discounts on securities measured at amortised cost are recorded in net interest income. Impairment gains or losses recognised on amortised cost securities are recorded in Provision for credit losses. When a debt instrument measured at amortised cost is sold, the difference between the sale proceeds and the amortised cost of the security at the time of the sale is recorded as a net gains/(losses) on de-recognition of financial assets measured at amortised cost.
Debt securities carried at FVOCI are measured at fair value with unrealised gains and losses arising from changes in fair value included in Other components of equity. Impairment gains and losses are included in Provision for credit losses and correspondingly reduce the accumulated changes in fair value included in Other components of equity. When a debt instrument measured at FVOCI is sold, the cumulative gain or loss is reclassified from Other components of equity to Income Statement.
Equity securities carried at FVOCI are measured at fair value. Unrealised gains and losses arising from changes in fair value are recorded in Other components of equity and not subsequently reclassified to profit or loss when realised. Dividends from FVOCI equity securities are recognised in Interest income.
Loans are debt instruments recognised initially at fair value and are subsequently measured in accordance with the classification of financial assets policy provided above. The majority of the loans are carried at amortised cost using the effective interest method, which represents the gross carrying amount less allowance for credit losses.
Interest on loans is recognised in interest income using the effective interest method. The estimated future cash flows used in this calculation include those determined by the contractual term of the asset and all fees that are considered to be integral to the effective interest rate. Also included in this amount are transaction costs and all other premiums or discounts. Fees that relate to activities such as originating, restructuring or renegotiating loans are deferred and recognised as Interest income over the expected term of such loans using the effective interest method.
For loans carried at amortised cost or FVOCI, impairment losses are recognised at each balance sheet date in accordance with the three-stage impairment model outlined 5.3.2.
De-recognition of financial assets
Financial assets are derecognised from the Balance Sheet when the contractual rights to the cash flows from the assets have expired, when the Company retains the rights to receive the cash flows of the assets but assume an obligation to pay those cash flows to a third party subject to certain pass-through requirements or when the contractual rights to receive the cash flows and substantially all of the risk and rewards of the assets have been transferred. When the Company retains substantially all of the risks and rewards of the transferred assets, the transferred assets are not derecognised from the Balance Sheet and are accounted for as secured financing transactions. When the Company neither retains nor transfers substantially all risks and rewards of ownership of the assets, the Company derecognises the assets if control over the assets is relinquished. If the Company retains control over the transferred assets, the Company continues to recognise the transferred assets to the extent of its continuing involvement.
Management’s judgement is applied in determining whether the contractual rights to the cash flows from the transferred assets have expired or whether the Company retains the rights to receive cash flows on the assets but assumes an obligation to pay those cash flows. The Company derecognises transferred financial assets if it transfers substantially all the risk and rewards of ownerships assets.

35
When assessing whether it has transferred substantially all of the risk and rewards of the transferred assets, management considers the entity exposure before and after the transfer with the variability in the amount and timing of the net cash flows of the transferred assets. In transfers that the Company retains the servicing rights, management has applied judgement in assessing the benefits of servicing against market expectations. When the benefits of servicing are greater than fair market value, a servicing asset is recognised in Other assets in the Balance Sheet. When the benefits of servicing are less than fair market value, a servicing liability is recognised in Other liabilities in the Balance Sheet.
9 OPERATIONAL RISK The Company has adopted the Basic Indicator Approach to calculate the own funds requirement for operational risk. As at 31 October 2019, the own funds requirement for operational risk is £65.4 million (2018: £63.6 million).
10 NON-TRADING BOOK EQUITY EXPOSURES The Company holds a small equity portfolio within its non-trading book in order to maintain its memberships with a number of clearing houses and exchanges in Europe. The Company has no intention of actively trading these equities for short term profit making purposes.
This equity portfolio has been disclosed as Investments - Equity securities in the Company’s audited financial statements in according to IFRS. The Company measures this equity portfolio at fair value. Unrealised gains and losses arising from changes in fair value are included in Other components of equity. Changes in foreign exchange rates are recognised in Other components of equity. When the security is sold, the cumulative gain or loss recorded in Other components of equity is closed to Retained earnings. Dividend and interest income accruing on Investments – Equity securities are recorded in net interest income.
As at 31 October 2019, the Company had a total OCI reserve of £36.2 million (2018: £35.0 million) arising from the non-trading book equity exposures. This OCI reserve has been fully included in the Company’s CET1 Capital since 1 January 2015.
Table 37: Non-trading book equity exposures
2019
2018
£'000 Unlisted
Unlisted As at 1 November
Cost 925
925 Accumulated unrealised gains 45,313
44,532
46,238
45,457
Realised gains/(losses) -
- Unrealised gains/(losses) 2,171
781
48,409
46,238
Accumulated unrealised gains 47,484
45,313
Less: Deferred tax (11,243)
(10,298)* Reserve 36,241
35,015*
*Restated

36
11 INTEREST RATE RISK IN THE BANKING BOOK Interest Rate Risk in the Banking Book (IRRBB) arises from interest rate basis and duration mismatches between assets and liabilities.
RBCEL’s IRRBB is governed by Royal Bank of Canada’s interest rate risk policies which define the acceptable limits within which risks to Economic Value of Equity (EVE) and Net Interest Income (NII) over a 12-month time horizon are to be contained.
RBCEL’s limit framework is maintained by Corporate Treasury which sets maximum NII and EVE sensitivity on a business segment level basis. Reporting of IRRBB against this limit framework is owned by Financial Control.
RBCEL’s has limited tolerance for risks arising from Interest Rate Risk in the Banking Book (IRRBB). The majority of transactions are priced relative to short term interbank rates (resetting either monthly or quarterly). This can lead to some interest rate gaps in the very short end of the curve (1m v 3m) however RBCEL’s IRRBB risk remains negligible.
12 LIQUIDITY RISK
12.1 DEFINITION OF LIQUIDITY RISK Liquidity risk is the risk that the Company is unable to generate or obtain sufficient liquidity in a cost-effective manner to meet contractual and contingent commitments as they fall due. Liquidity management activities are designed to safeguard RBCEL against stresses, and to ensure the safety and soundness of the organisation.
Liquidity risk arises from mismatches in the timing and/or the value of on-balance sheet and off-balance sheet positions. Timing mismatches between the effective maturity of the Company’s assets and liabilities, or unexpected draws from on and off-balance sheet commitments, create liquidity, or cash flow gaps. Differences in values of assets in comparison to repayment obligations can also create cash flow gaps. If the sources of cash (liquid assets / funding) are not available to meet these cash flow requirements, there is potential for a liquidity event to adversely impact the Company.
External or internal stress events have the potential to amplify liquidity mismatches and create adverse liquidity outcomes. For example, losses from credit, market, or operational risk events that negatively impact the Company’s capital base can have an impact on the real or perceived credit quality of the Company, which can result in a loss of funding. Thus, liquidity risk is considered a “consequential” risk and must be managed in an integrated manner with credit, market, operational and other relevant risks.
12.2 GOVERNANCE AND FRAMEWORK Ultimate responsibility for managing liquidity risk resides with the Company’s Board. The Board is tasked with ensuring that an effective systems and controls framework is in place for business activity, risk management and capital and liquidity risk management.
The Board ensures that effective governance arrangement and control frameworks are in place for liquidity risk, enabling it to be adequately overseen, assessed and managed. The role of the Board for liquidity risk, alongside monitoring and oversight of the liquidity position of the Company, includes approval of:
Liquidity Risk Framework; Risk Appetite Statement and Metrics; Recovery Plan; and The annual Internal Liquidity Adequacy Assessment Process (ILAAP). Responsibility for the detailed management and oversight of liquidity risk is delegated to the RC and ALCO.
Within the Company, the risk tolerance statement is articulated through a series of limits, covering both internal and regulatory metrics. The Company’s risk appetite takes direction from RBC (the parent) and includes additional aspects designed to capture locally specific risks. At the lowest level the Company employs desk limits to govern individual business, markets, products or transactions.

37
Key risks for the Company include a withdrawal of intragroup funding and an inability to monetise high quality liquid assets in the secured funding markets. These risks are mitigated somewhat by the regular review and extension of term intragroup funding arrangements and maintaining large GBP and Euro cash deposits at central banks.
Corporate Treasury is responsible for all liquidity reporting, including ensuring completeness and accuracy of data. The Company primarily uses RBC Group strategic platforms for liquidity risk measurement and monitoring.
Reports produced by the Corporate Treasury-Liquidity Measurement Team include, but are not limited to, LCR, NSFR, Asset Encumbrance, PRA110, ALMM and several internally defined reports designed to complement the regulatory requirements.
On a monthly basis an overview of management information is presented to the ALCO, this is also presented to the RC on a quarterly basis.
12.3 RISK PROFILE The Company is comfortable with the level of liquidity risk within the entity and RBC enterprise. Throughout the financial year the Company remained within both internal risk appetite and regulatory limits.
The Company has in place a robust governance model with individuals empowered to make decisions that benefit the organisation without creating unnecessary risk.
At all times The Company maintains sufficient levels of short and long term funding and holds substantial high quality securities that are diverse in nature, prudently valued and regularly turned over as part of its trading activities.
Minimum liquid asset buffer requirements are defined internally through use of the Net Cash Flow Metric, an internally-defined metric that estimates net liquidity surpluses (or gaps) over specific short time horizons (7, 30, 60 days) for on-balance sheet and off-balance sheet transactions.
The metric measures the amount of potential liquidity and funding risk being taken after liquidity sources such as liquid assets have been factored in.
12.4 INDIVIDUAL LIQUIDITY ADEQUACY ASSESSMENT PROCESS The ILAAP is the Company’s internal attestation of the management and measurement of liquidity risk within the organisation, under both stressed and business as usual conditions. The ILAAP is a comprehensive document covering all aspects of liquidity risk. It is prepared annually, and approved by the Board.
Conclusions drawn from the ILAAP contribute to the risk management framework within the organisation.

38
13 REMUNERATION Remuneration disclosures are made in line with RBC Europe Limited’s (the “Company's”) application of the qualitative and quantitative remuneration disclosures requirement under the Pillar 3 framework and the requirements of Article 450 of the Capital Requirements Regulation (“CRR”)5. For enhanced disclosure on RBC’s enterprise-wide compensation practices, please refer to RBC’s proxy circular (published on March 7th, 20196).
A separate Pillar 3 disclosure is made in relation to RBC Holdings (UK) Limited.
13.1 CONSTITUTION AND ACTIVITIES OF THE UK HRC The Company has a Human Resources Committee (UK HRC) which is responsible for the application of the compensation principles, practices and processes within all of RBC’s operations on the UK mainland, except in relation to BlueBay Asset Management Ltd (which is managed separately and publishes a separate Pillar 3 report). The UK HRC reviews and approves the compensation policies which support the business objectives determined by the Board of Directors of the Company (the “Board”) and/or senior management and take into appropriate account sound risk management practices, including long-term and short-term risk.
Within the authority delegated by the Board, the UK HRC is responsible for approving compensation policy and, in doing so, takes into account the pay and benefits across our Company. This includes the terms of bonus plans, other incentive plans and the individual compensation packages of Executive Directors and Senior Managers, as well as oversight of compensation for other Material Risk Takers.
The UK HRC has a specific responsibility to ensure UK-applicable group-wide policies are compliant with UK Compensation regulations which apply to each respective UK group entity, including the Company.
Each of the members of the UK HRC is a Non-Executive Director, independent of day-to-day management as defined by the standards set out by the Board. No individual is involved in decisions relating to their own compensation.
Members (fiscal year) Meeting Attendance
Nicola Mumford (Chair) 6 out of 6 meetings
Jim Pettigrew 6 out of 6 meetings
Polly Williams 6 out of 6 meetings
Tim Wade7 4 out of 4 meetings
During the year, the UK HRC received advice from the Company’s Head of Human Resources, Head of Compliance, Chief Financial Officer and Chief Risk Officer, who provided advice on the implications of the compensation policy on risk and risk management, and on the adjustments that should be made to levels of variable compensation payable to staff, at both a pool and individual level, to take into account all relevant current and future risks.
In June 2019, the UK HRC completed its annual review of the Company’s policies, standards and protocols relating to compensation. In addition, in November 2019 the UK HRC approved the UK Regulated Group Remuneration Policy, which consolidated a number of existing remuneration related principles and practices into one document.
5 Regulation (EU) No 575/2013 6http://www.rbc.com/investorrelations/pdf/2019englishproxy.pdf
7 Tim Wade was appointed as Non-Executive Director on 3 May 2019 and attended all subsequent committee meetings

39
External Consultants
The UK HRC did not engage consultants independent of the company’s external advisers.
Role of the Relevant Stakeholders
The UK HRC takes full account of the Company’s strategic goals in applying its compensation policy and is mindful of its duties to shareholders and other stakeholders. The UK HRC seeks to preserve shareholder value by ensuring alignment of variable compensation payouts with risk and economic performance, as well as the successful retention, recruitment and motivation of employees.
13.2 CRITERIA FOR THE IDENTIFICATION OF MATERIAL RISK TAKERS The following criteria were applied to identify Material Risk Takers for the purposes of CRD IV, in line with the Regulatory Technical Standards set out in Commission Delegated Regulation (EU) No 604/2014 (RTS):
Employees captured by qualitative criteria include but are not limited to:
Senior management including individuals registered with the UK regulators as holding a Senior Manager Function (SMF) such as heads of business areas
Senior control function management including risk, compliance and internal audit and heads of human resources, information technology, legal and tax
Staff who have authority either individually or as members of a Committee to approve or veto new products or decisions that result in market or credit risk exposures that exceed specified thresholds as provided for in the RTS
Employees captured by quantitative criteria:
Employees awarded total compensation of €500,000 or more in the preceding financial year Employees within the top 0.3% of staff who have been awarded the highest total compensation in the preceding year Employees awarded compensation in the preceding financial year which was equal to or greater than the lowest total
compensation awarded to those meeting specified qualitative criteria In accordance with the RTS, employees identified under the quantitative criteria were then assessed to determine if the
professional activities of the employee had the potential to have a material impact on the risk profile of the Company. As required under the RTS, all regulatory notification and approval requirements on the outcomes of this assessment were completed in respect of 2019.
Additional RBC Material Risk Taker Identification Criteria:
In addition to the criteria set out in the RTS, the Company has identified Material Risk Takers on the basis of its own criteria based on its assessment of risks beyond those specifically identified in the RTS, taking into account prudential, operational, market, credit, conduct and reputational risks
13.3 DESIGN AND STRUCTURE OF COMPENSATION FOR MATERIAL RISK TAKERS Guided by our vision of being among the world’s most trusted and successful financial institutions and our purpose of helping clients thrive and communities prosper, our approach to compensation, including executive compensation, is based on the five guiding principles set out below. The UK HRC continually evaluates the policies and procedures applicable to the Company with a view to upholding these principles:
1. Compensation action aligns with shareholder interests Awards vary based on absolute performance of RBC Mid and long terms incentives vest and pay out over time, encouraging a longer term view of increasing shareholder value
2. Compensation aligns with sound risk management principles
Our risk management culture is reflected in our approach to compensation. Our compensation practices appropriately
balance risk and reward, and align with shareholder interests Performance of individuals, lines of business and RBC overall is assessed on a number of measures, including adherence to
risk management policies and guidelines.

40
3. Compensation rewards performance Our pay-for-performance approach rewards employees for their contributions to individual, business segment and
enterprise results relative to objectives that support our business strategies for sustainable growth over short, medium and long-term horizons, which are aligned with the risk appetite of RBC.
4. Compensation enables the Company to attract, engage and retain talent Talented and motivated employees are essential to building a sustainable future for RBC. We offer compensation that is
competitive within the markets where we operate and compete for talent. Compensation programs reward employees for high performance and their potential for future contribution.
5. Compensation rewards behaviours that align with RBC values and drive exceptional client experiences.
RBC values, embedded in our Code of Conduct, form the foundation of our culture and underpin our ongoing commitment
to put the needs of our clients first and deliver value to all of our stakeholders. Risk conduct and compliance with policies and procedures are considered in determining performance-based
compensation.
All the Company’s compensation policies and plans align with these principles and are approved by the UK HRC. The Company’s remuneration policies apply in the same way to all the branches of RBC Europe Limited.
Elements of Compensation
The employee package is made up of fixed remuneration and benefits (reward for fulfilling the job requirements) and incentive compensation designed to incentivise employees to demonstrate achievement in terms of results and behaviours, to reward them for that achievement, and to encourage them to remain with RBC.
For more highly paid employees, a proportion of an employee’s total remuneration is deferred over a minimum of 3 years with at least 50% reflecting the value of RBC shares over that period.
Incentive compensation awards are adjusted downwards or clawback is sought in cases where disciplinary action is taken for breaches of the RBC Code of Conduct.
Fixed Remuneration
All Material Risk Takers receive fixed remuneration, which is most commonly paid in the form of base salary, but which may include Role Based Pay meeting the conditions of EBA/Op/2014/10 for certain roles and which reflects the individual’s market value, skills, qualifications, relevant experience, responsibility and contribution to the Company.
Fixed pay is typically only changed to reflect a change to the role or responsibilities of the recipient or market conditions.
Variable Remuneration
All Material Risk Takers, other than the Independent Non-Executive Directors and overseas Board Directors, are eligible to participate in discretionary performance-based incentive schemes in respect of their role with the Company.
Performance-based annual discretionary incentives may be awarded based on the performance of the Company, the business, and the individual as detailed below. Annual incentives may consist of a mix of cash and share-linked instruments. Annual incentives for Material Risk Takers are subject to review by the Chief Risk Officer Europe to ensure they adequately reflect risk and performance, and are subject to review by the UK HRC.
As part of the year-end risk adjustment process, the CFO Europe reports to the UK HRC on UK-specific financial performance by reference to metrics including revenues, Net Income After Tax, entity profit, accounting profit, prudential valuation adjustment and enterprise and business economic profit. If business platform or business unit economic profit is negative or trend year over year is misaligned to the UK bonus pool trend year-over-year, additional strategic, financial and risk related factors are also considered.

41
The amount of variable compensation to be awarded to employees is appropriately adjusted for risk in accordance with the Company’s UK Compensation Risk and Performance Adjustment Process. Key considerations that are taken into account in the risk adjustment process include financial measures such as revenue, Net Income After Tax, Economic Profit and regulatory capital and non-financial risk factors such as conduct and credit, market and operational risk exposure against risk appetite. Upon completion of the review, adjustments for risk may be recommended for consideration in the approval of final variable compensation.
In October 2014 RBC Europe Limited obtained unanimous approval from its sole shareholder to operate a maximum ratio between the fixed and variable components of remuneration of 200% of the fixed component of the total remuneration for each individual as required under the UK remuneration rules and Article 91(1)(g) of CRD IV. At its meeting in September 2019, UK HRC resolved not to recommend a change to that ratio to the shareholder.
All compensation plans contain minimum compensation deferral requirements for Material Risk Takers in line with the UK remuneration rules and applicable European guidelines, as well as compensation risk and performance adjustment processes. Deferral requirements vary by plan and arrangements are typically based on the size of bonus, type of compensation plan and the individual’s role. Deferral requirements are summarised below:
All MRTs regardless of bonus plan
Minimum 40% deferral (60% deferral if total variable compensation is £500,000 or more)
RBC Capital Markets Compensation Plan
The Plan contains a grid of deferral requirements starting at 30% when the bonus exceeds £75,000 and rising to 65% if the bonus is £3mm or more.
RBC Investor and Treasury Services Incentive Programme
The Programme contains a grid of deferral requirements starting at 25% when the bonus is £50,000 and rising to 55% if the bonus is £1.5mm or more.
RBC Discretionary Plans These Plans award short-term incentives (STI) and mid-term incentives (MTI) which are equity-linked. The ratio of STI and MTI varies from individual to individual and is typically based on position level.
RBC Wealth Management Incentive Compensation Plan (British Isles)
For Executives and Senior Leaders, the Plan contains a grid of deferral requirements starting at 25% (for Position Level 5) to 50% (for the EVP level).
* Variable remuneration awarded to all Material Risk Takers is deferred at least 40% (60% where the variable component exceeds £500,000) unless the de minimis exemption criteria apply8. At least 50% of variable compensation is delivered in equity-linked awards which are subject to an appropriate post-vesting retention period of at least 12 months, in line with the EBA Guidelines on Sound Remuneration which apply to the Company for the first time this year (save in circumstances where the deferral period exceeds 5 years, where, in accordance with the EBA Guidelines, a retention period of no less than 6 months for the deferred part is permitted for non-senior managers). Depending on the compensation plan, deferred compensation will vest as follows, in line with UK remuneration rules:
Year 3 Year 4 Year 5 Year 6 Year 7
MRTs who perform a PRA Senior Manager Function 20% 20% 20% 20% 20%
8 Such criteria are that the individual’s: (i) variable remuneration is no more than 33% of their total remuneration; and (ii) total remuneration is no more than £500,000. In accordance with the FCA’s dual-regulated firm Remuneration Code at SYSC 19D and the Remuneration Part of the PRA Rule Book, Material Risk Takers meeting this criteria are not subject to the full scope of the Remuneration Rules, including the deferral requirements.

42
Year 1 Year 2 Year 3 Year 4 Year 5
MRTs who meet the criteria of Risk Managers 20% 20% 20% 20% 20%
Other MRTs – Capital Markets or Investor & Treasury Services
25% 25% 50% - -
Other MRTs – other Business Platforms - - 100% - -
Variable compensation for RBC Europe Limited is awarded through the following plans which each provide an annual cash bonus and a deferred component if the Company’s deferral requirements are met or deferral is otherwise required (e.g. for a Material Risk Taker):
RBC Capital Markets Compensation Plan RBC Investor and Treasury Services Incentive Programme RBC Discretionary Plans RBC Wealth Management Incentive Compensation Plan (British Isles) RBC Wealth Management UK Sales & Relationship Management Compensation Plan
Shareholding Requirement
RBC operates a Share Ownership Requirement which requires Managing Directors in Capital Markets to hold at least 1.5 times their 3-year average base salary in Royal Bank Common Shares.
Remuneration of Control Functions
RBC’s enterprise Policy on Compensation Risk Management states that performance measures for senior employees responsible for financial and risk control activities will be based on the achievements and objectives of the functions, and their compensation will be determined independently from the performance of the specific business areas they support, therefore avoiding any potential conflicts of interest. Employees who fall under this arrangement include senior employees in Compliance, CFO Group, Group Risk Management, Internal Audit and Human Resources. Global Function Heads and/or the Function Operating Committee Members will continue to review and approve the individual performance of these employees against established objectives, which are independent of the performance of the business areas that they oversee. Remuneration for employees engaged in control functions is reviewed regularly for market alignment to ensure that remuneration levels are competitive.
13.4 THE LINK BETWEEN PAY AND PERFORMANCE FOR MATERIAL RISK TAKERS Variable compensation plans reward employees on the basis of a number of factors, including individual, business and enterprise results relative to established performance objectives that are aligned with the risk appetite of RBC. A significant portion of performance-based pay is deferred in the form of equity incentive awards (linked to RBC’s share price) in order to align compensation with the risk time horizon and motivate employees to generate longer-term value for shareholders and remain accountable for decisions with long tail risk. To create a clear relationship between pay and performance, employees have an opportunity to earn higher compensation for outstanding performance, and conversely, earn less compensation when RBC, a business segment and/or individual performance falls below expectations.
Incentive awards take into account firm-wide, business unit and individual financial and non-financial factors. Financial factors include the performance of RBC, its global business segments and regional operating subsidiaries. Individual performance is assessed based on the employee’s contribution to the overall performance of their business or function, the achievement of individual performance objectives and performance against the Company’s Leadership Model and Code of Conduct. Where appropriate (e.g., where firm-wide or entity performance is weak or in a net loss position or in the case of a significant failure of risk management) bonus pools may be reduced to zero at the discretion of the RBC CEO, UK HRC and RBC Board of Directors.
When determining the size of the bonus pool, financial measures such as revenues, Net Income After Tax, the compensation ratio (total compensation as a percentage of revenues), regulatory and economic capital, and economic profit are considered depending on the plan and business area.

43
Non-financial measures considered in the discretionary bonus evaluation process include the following:
Adherence to our Code of Conduct. RBC’s Code of Conduct (Code) promotes standards of ethical behaviour that applies to all employees globally. Our Code fosters an open environment in which questions and concerns may be brought forward. It creates a frame of reference for dealing with sensitive and complex issues, and provides for accountability if standards of conduct are not upheld. All employees are expected to adhere to our Code, and failure to do so through unethical or non-compliant behaviours may result in a disciplinary sanction up to and including immediate termination of employment. All employees receive Code of Conduct training and testing on joining RBC and every year thereafter
Compliance with a full range of risk management policies specific to individual job requirements as outlined in employee Performance Management Documents
Assessment of key behaviours, which are part of the RBC Global Performance Management process, and typically include the obligation to:
- Abide by the letter and spirit of rules and procedures established by regulators - Follow all relevant internal policies and procedures including, but not limited to, trading and position limits and
standing orders - At all times, act in the best interests of RBC and its clients - Escalate, on a timely basis, any areas of material concern related to any of the above - Lead by example so that direct reports adopt similar high standards
Reports from control functions, including those from Internal Audit, Compliance (regulatory gaps, trades beyond excess
limits), and Group Risk Management regarding operational, market and credit risks, among others Assessment of accountabilities and detailed action plans to implement and monitor changes required to close the gaps identified
during risk management or internal audit reviews
Employees who are not meeting non-financial performance standards for their role are subject to a corrective action process, which can include either a significant reduction in bonus amounts or termination of employment.
Furthermore, prior to vesting, Material Risk Takers’ deferred compensation is subject to review under the Company’s risk and performance adjustment process whereby actual risk and performance outcomes are reviewed and if materially different from assessments made when deferred compensation was granted, or if misconduct has occurred, then deferred compensation may be reduced or forfeited in full.
All bonus awards made to Material Risk Takers under the Company’s variable compensation schemes are subject to malus and clawback under the RBC Forfeiture and Clawback Policy for Code Material Risk Takers. A reduction may be applied, in summary, in cases of misconduct, a material failure of risk management or if there is a material downturn in financial performance. Since January 2015, all variable compensation awards made to Material Risk Takers are subject to clawback for a seven year period from the date of award as required under UK remuneration rules. This can be extended to ten years in relation to PRA-designated Senior Management Functions where there is an outstanding internal or external investigation at the end of the seven year period which could result in the application of clawback. Clawback can be applied in cases of misconduct or a material failure of risk management.
Guaranteed variable remuneration is only awarded in exceptional circumstances, such as senior control functions roles, business critical roles and strategic hires and then only for the first 12 months of employment.
The Company provides severance payments to fulfil its statutory obligations and to support the transition of employees away from their employment with RBC, in circumstances where there is an early termination of their employment.

44
13.5 DISCLOSURES ON REMUNERATION During the year ended 31st October 2019, remuneration for staff employed by or seconded to the Company whose professional activities have a material impact on the risk profile of the business was as follows:
Table 38: Aggregate remuneration awarded
During the financial year to MRTs, split into cash, shares or other share-linked instruments and other forms of remuneration, and showing amounts deferred for the 2019 financial year.
£'000,000
Managerial Function
Supervisory Function
Number of employees 5 0 17 103 14 8 4
Total fixed remuneration
3.20 0.00 8.90 31.95 1.84 1.89 0.82
Of which: cash-based 3.20 0.00 8.90 31.95 1.84 1.89 0.82
Of which: deferred 0.00 0.00 0.00 0.00 0.00 0.00 0.00
Of which: shares or other share-linked
instruments0.00 0.00 0.00 0.00 0.00 0.00 0.00
Of which: deferred 0.00 0.00 0.00 0.00 0.00 0.00 0.00
Of which: other forms 0.00 0.00 0.00 0.00 0.00 0.00 0.00
Of which: deferred 0.00 0.00 0.00 0.00 0.00 0.00 0.00
Number of employees 3 0 17 82 13 8 2
Total variable remuneration
2.34 0.00 13.57 24.60 1.03 2.20 0.56
Of which: cash-based 0.95 0.00 5.46 11.66 0.54 1.01 0.28
Of which: deferred 0.56 0.00 3.10 4.81 0.19 0.47 0.11
Of which: shares or other share-linked
instruments1.40 0.00 8.11 12.94 0.49 1.19 0.28
Of which: deferred 0.56 0.00 3.08 4.73 0.19 0.47 0.11
Of which: other forms 0.00 0.00 0.00 0.00 0.00 0.00 0.00
Of which: deferred 0.00 0.00 0.00 0.00 0.00 0.00 0.00
Total remuneration 5.54 0.00 22.47 56.55 2.87 4.09 1.37
All Other Business Areas
Fixe
d re
mun
erat
ion
Var
iabl
e re
mun
erat
ion
Remuneration Amount
Management BodySenior
ManagementInvestment
BankingIndependent
Control FunctionsCorporate Functions
d

45
Table 39: Deferred Remuneration for MRTs
Split into vested and unvested portions and showing amounts paid out and reduced through performance adjustment
£'000,000
Deferred and retained
remuneration
Total amount of outstanding deferred remuneration
Of which: Total amount of outstanding deferred and
retained remuneration exposed to ex post explicit and/or implicit adjustment
Total amount of amendment
during the year due to ex post
explicit adjustments
Total amount of deferred
remuneration paid out in the financial
year vested unvested Total
Management Body 0.14 12.29 12.44 12.44 0.00 5.98
Cash 0.00 0.27 0.27 0.27 0.00 0.08
Shares 0.14 12.02 12.17 12.17 0.00 5.91 Cash-linked instruments 0.00 0.00 0.00 0.00 0.00 0.00
Other 0.00 0.00 0.00 0.00 0.00 0.00 Investment
Banking 6.81 46.57 53.38 53.38 0.00 13.31
Cash 1.41 6.03 7.43 7.43 0.00 1.56
Shares 5.40 40.55 45.95 45.95 0.00 11.75 Cash-linked instruments 0.00 0.00 0.00 0.00 0.00 0.00
Other 0.00 0.00 0.00 0.00 0.00 0.00
Independent Control Functions 0.01 2.58 2.58 2.58 0.00 0.86
Cash 0.00 0.50 0.50 0.50 0.00 0.17
Shares 0.01 2.07 2.08 2.08 0.00 0.69 Cash-linked instruments 0.00 0.00 0.00 0.00 0.00 0.00
Other 0.00 0.00 0.00 0.00 0.00 0.00 Corporate Functions 0.00 3.11 3.11 3.11 0.00 1.15
Cash 0.00 0.39 0.39 0.39 0.00 0.12
Shares 0.00 2.72 2.72 2.72 0.00 1.02 Cash-linked instruments 0.00 0.00 0.00 0.00 0.00 0.00
Other 0.00 0.00 0.00 0.00 0.00 0.00
All Other Business Areas 0.00 1.48 1.48 1.48 0.00 0.73
Cash 0.00 0.20 0.20 0.20 0.00 0.07
Shares 0.00 1.28 1.28 1.28 0.00 0.66 Cash-linked instruments 0.00 0.00 0.00 0.00 0.00 0.00
Other 0.00 0.00 0.00 0.00 0.00 0.00
Total 6.96 66.03 72.98 72.98 0.00 22.03
As at 31 October 2019. Includes outstanding deferred remuneration granted prior to acquiring MRT status

46
Table 40: Special Payments
£'000,000
Special payments
Guaranteed bonuses Sign-on awards Severance payments
Number of employees
Total amount
Number of employees
Total amount
Number of employees
Total amount
Management Body 0 0 1 0 0 0
Investment Banking 2 0.65 7 1.06 13 1.44 Independent Control
Functions 0 0 0 0 1 0
Corporate Functions 0 0 1 0 0 0
All Other Business Areas 0 0 0 0 1 0
Table 41: MRTs with Total Remuneration above One Million Euros
The number of MRTs with total compensation awarded for the financial year which was EUR 1 million or more, arranged by compensation band was as follows:
Total Compensation Band (EUR) Number of individuals
1,000,000 < 1,500,000 11
1,500,000 < 2,000,000 4
2,000,000 < 2,500,000 4
2,500,000 < 3,000,000 2
3,000,000 < 3,500,000 1
3,500,000 < 4,000,000 0
4,000,000 < 4,500,000 0
4,500,000 < 5,000,000 0
5,000,000 < 6,000,000 0

47
14 APPENDICES
14.1 APPENDIX 1: BOARD MEMBERSHIP Current Independent Non-Executive Directors
Director Role Biography
Number of Directorships
(excluding RBCEL)
Jim Pettigrew
(Residency: UK)
Resigned 31/12/19
Previously Chairman (since 16 March 2017) previously also Chair of Audit Committee and Risk Committee
Member of Nomination Committee, Audit Committee, Risk Committee and UK Human Resources Committee
Jim Pettigrew has over 30 years of experience as a chartered accountant, with extensive experience in a listed environment at Board and Executive management level, including as CEO and Chairman within financial services.
Mr Pettigrew’s executive career including CFO and CEO roles at UK listed companies. His non-executive career includes Board Chair, Audit, Risk and Remuneration Committee Chair experience at a wide variety of institutions including both private and public financial service organisations. Mr Pettigrew has also served on governmental advisory bodies providing financial services industry expertise.
0
Nicola Mumford
(Residency: UK)
Chair of UK Human Resources Committee and Nomination Committee
Member of Audit Committee and Risk Committee
Ms Mumford is a qualified solicitor who spent her executive career within private practice where she became the Senior Director and Managing Partner of the London Office of an international law firm. Her role as a Senior Litigation Partner in the Dispute Resolution Group including advising high profile entities including financial services organisations. As a non-executive, Ms Mumford has particular expertise in talent management and remuneration enabling her to assist RBC as Chair of the Human Resources Committee of RBC Europe Limited.
2
Polly Williams
(Residency: UK)
Interim Chair as of 31/12/19
Chair of Risk Committees.
Member of Audit, UK Human Resources Committee and Nomination Committee
Ms Williams is a chartered accountant and her executive career included becoming a partner of one of the “Big Four” consultancy practices in the financial sector practice. Following her executive career, Ms Williams has held a number of non-executive directorships in and out of the financial service industry including at both publicly listed and private organisations. She has accountancy and industry experience and particular expertise in chairing of Audit and Risk Committees.
5
Tim Wade
(Residency: UK)
Appointed 15 May 2019
Chair of Audit Committee
Member of Risk, Human Resources and Nomination Committees
Mr Wade is a chartered account. He has had a successful executive career in the financial services industry including as a partner at a large international consultancy practice and CEO and CFO roles in house at financial institutions. As a non-executive director Mr Wade has held a number of directorships at large publicly listed and private organisations within insurance and banking. He has particular expertise in chairing Audit and Risk Committees.
3
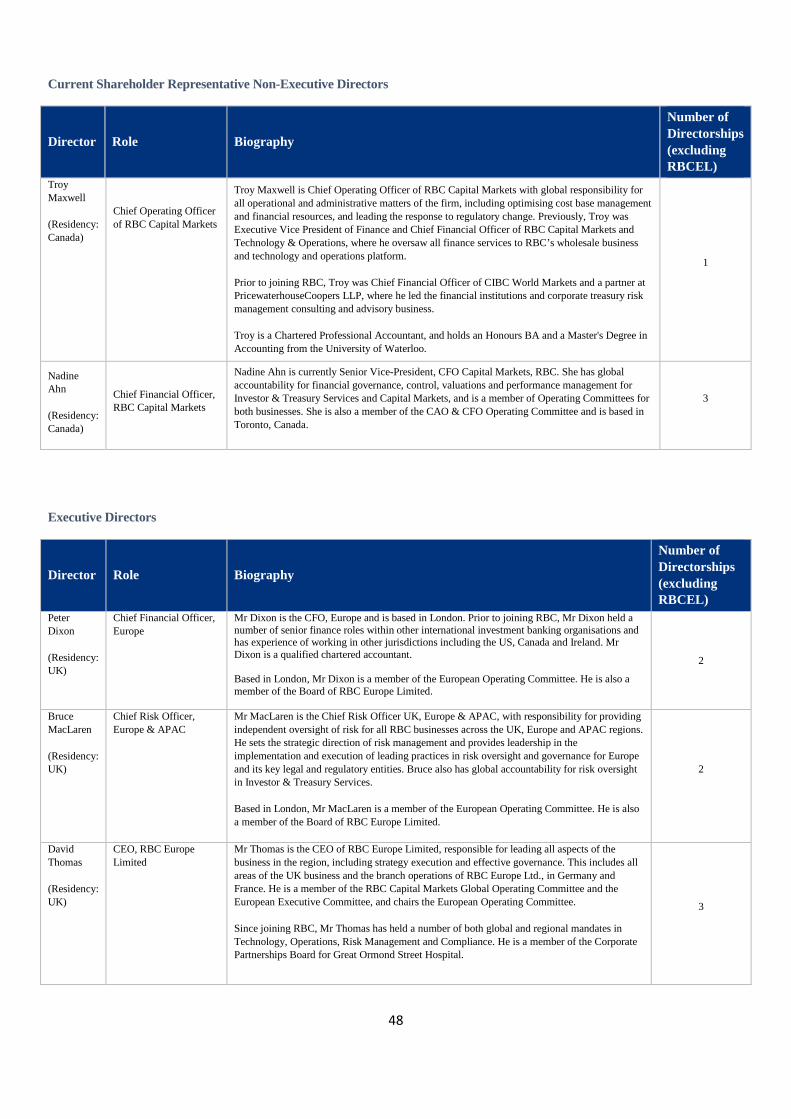
48
Current Shareholder Representative Non-Executive Directors
Director Role Biography
Number of Directorships (excluding RBCEL)
Troy Maxwell
(Residency: Canada)
Chief Operating Officer of RBC Capital Markets
Troy Maxwell is Chief Operating Officer of RBC Capital Markets with global responsibility for all operational and administrative matters of the firm, including optimising cost base management and financial resources, and leading the response to regulatory change. Previously, Troy was Executive Vice President of Finance and Chief Financial Officer of RBC Capital Markets and Technology & Operations, where he oversaw all finance services to RBC’s wholesale business and technology and operations platform.
Prior to joining RBC, Troy was Chief Financial Officer of CIBC World Markets and a partner at PricewaterhouseCoopers LLP, where he led the financial institutions and corporate treasury risk management consulting and advisory business.
Troy is a Chartered Professional Accountant, and holds an Honours BA and a Master's Degree in Accounting from the University of Waterloo.
1
Nadine Ahn
(Residency: Canada)
Chief Financial Officer, RBC Capital Markets
Nadine Ahn is currently Senior Vice-President, CFO Capital Markets, RBC. She has global accountability for financial governance, control, valuations and performance management for Investor & Treasury Services and Capital Markets, and is a member of Operating Committees for both businesses. She is also a member of the CAO & CFO Operating Committee and is based in Toronto, Canada.
3
Executive Directors
Director Role Biography
Number of Directorships (excluding RBCEL)
Peter Dixon
(Residency: UK)
Chief Financial Officer, Europe
Mr Dixon is the CFO, Europe and is based in London. Prior to joining RBC, Mr Dixon held a number of senior finance roles within other international investment banking organisations and has experience of working in other jurisdictions including the US, Canada and Ireland. Mr Dixon is a qualified chartered accountant. Based in London, Mr Dixon is a member of the European Operating Committee. He is also a member of the Board of RBC Europe Limited.
2
Bruce MacLaren
(Residency: UK)
Chief Risk Officer, Europe & APAC
Mr MacLaren is the Chief Risk Officer UK, Europe & APAC, with responsibility for providing independent oversight of risk for all RBC businesses across the UK, Europe and APAC regions. He sets the strategic direction of risk management and provides leadership in the implementation and execution of leading practices in risk oversight and governance for Europe and its key legal and regulatory entities. Bruce also has global accountability for risk oversight in Investor & Treasury Services.
Based in London, Mr MacLaren is a member of the European Operating Committee. He is also a member of the Board of RBC Europe Limited.
2
David Thomas
(Residency: UK)
CEO, RBC Europe Limited
Mr Thomas is the CEO of RBC Europe Limited, responsible for leading all aspects of the business in the region, including strategy execution and effective governance. This includes all areas of the UK business and the branch operations of RBC Europe Ltd., in Germany and France. He is a member of the RBC Capital Markets Global Operating Committee and the European Executive Committee, and chairs the European Operating Committee.
Since joining RBC, Mr Thomas has held a number of both global and regional mandates in Technology, Operations, Risk Management and Compliance. He is a member of the Corporate Partnerships Board for Great Ormond Street Hospital.
3
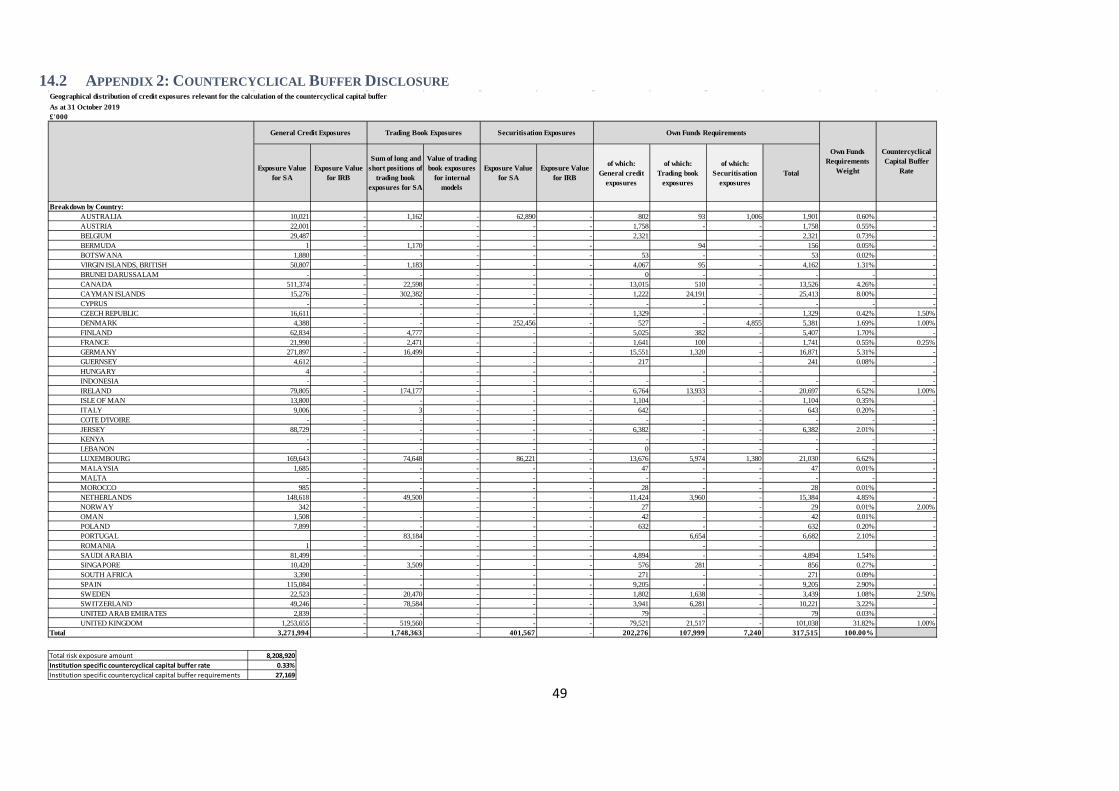
49
14.2 APPENDIX 2: COUNTERCYCLICAL BUFFER DISCLOSURE Geographical distribution of credit exposures relevant for the calculation of the countercyclical capital bufferAs at 31 October 2019£'000
Exposure Value for SA
Exposure Value for IRB
Sum of long and short positions of
trading book exposures for SA
Value of trading book exposures
for internal models
Exposure Value for SA
Exposure Value for IRB
of which: General credit
exposures
of which: Trading book
exposures
of which: Securitisation
exposuresTotal
Breakdown by Country:AUSTRALIA 10,021 - 1,162 - 62,890 - 802 93 1,006 1,901 0.60% -AUSTRIA 22,001 - - - - - 1,758 - - 1,758 0.55% -BELGIUM 29,487 - - - - 2,321 - 2,321 0.73% -BERMUDA 1 - 1,170 - - - 94 - 156 0.05% -BOTSWANA 1,880 - - - - - 53 - - 53 0.02% -VIRGIN ISLANDS, BRITISH 50,807 - 1,183 - - - 4,067 95 - 4,162 1.31% -BRUNEI DARUSSALAM - - - - - - 0 - - - - -CANADA 511,374 - 22,598 - - - 13,015 510 - 13,526 4.26% -CAYMAN ISLANDS 15,276 - 302,382 - - - 1,222 24,191 - 25,413 8.00% -CYPRUS - - - - - - - - - - - -CZECH REPUBLIC 16,611 - - - - - 1,329 - - 1,329 0.42% 1.50%DENMARK 4,388 - - - 252,456 - 527 - 4,855 5,381 1.69% 1.00%FINLAND 62,834 - 4,777 - - - 5,025 382 - 5,407 1.70% -FRANCE 21,990 - 2,471 - - - 1,641 100 - 1,741 0.55% 0.25%GERMANY 271,897 - 16,499 - - - 15,551 1,320 - 16,871 5.31% -GUERNSEY 4,612 - - - - 217 - 241 0.08% -HUNGARY 4 - - - - - - - -INDONESIA - - - - - - - - - - - -IRELAND 79,805 - 174,177 - - - 6,764 13,933 - 20,697 6.52% 1.00%ISLE OF MAN 13,800 - - - - - 1,104 - - 1,104 0.35% -ITALY 9,006 - 3 - - - 642 - 643 0.20% -COTE D'IVOIRE - - - - - - - - - - - -JERSEY 88,729 - - - - - 6,382 - - 6,382 2.01% -KENYA - - - - - - - - - - - -LEBANON - - - - - - 0 - - - - -LUXEMBOURG 169,643 - 74,648 - 86,221 - 13,676 5,974 1,380 21,030 6.62% -MALAYSIA 1,685 - - - - - 47 - - 47 0.01% -MALTA - - - - - - - - - - - -MOROCCO 985 - - - - - 28 - - 28 0.01% -NETHERLANDS 148,618 - 49,500 - - - 11,424 3,960 - 15,384 4.85% -NORWAY 342 - - - - 27 - 29 0.01% 2.00%OMAN 1,508 - - - - - 42 - - 42 0.01% -POLAND 7,899 - - - - - 632 - - 632 0.20% -PORTUGAL - 83,184 - - - 6,654 - 6,682 2.10% -ROMANIA 1 - - - - - - - -SAUDI ARABIA 81,499 - - - - - 4,894 - - 4,894 1.54% -SINGAPORE 10,420 - 3,509 - - - 576 281 - 856 0.27% -SOUTH AFRICA 3,390 - - - - - 271 - - 271 0.09% -SPAIN 115,084 - - - - - 9,205 - - 9,205 2.90% -SWEDEN 22,523 - 20,470 - - - 1,802 1,638 - 3,439 1.08% 2.50%SWITZERLAND 49,246 - 78,584 - - - 3,941 6,281 - 10,221 3.22% -UNITED ARAB EMIRATES 2,839 - - - - - 79 - - 79 0.03% -UNITED KINGDOM 1,253,655 - 519,560 - - - 79,521 21,517 - 101,038 31.82% 1.00%
Total 3,271,994 - 1,748,363 - 401,567 - 202,276 107,999 7,240 317,515 100.00%
Countercyclical Capital Buffer
Rate
General Credit Exposures Trading Book Exposures Securitisation Exposures Own Funds Requirements
Own Funds Requirements
Weight
Total risk exposure amount 8,208,920Institution specific countercyclical capital buffer rate 0.33%Institution specific countercyclical capital buffer requirements 27,169

50