pillar 3 disclosures 31 december 2017 - newcastle.co.uk · pillar 3 disclosures 6 3. executive...
TRANSCRIPT

Pillar 3 Disclosures
1
Pillar 3 Disclosures 31 December 2017
Approved by the Board: 27 February 2018

Pillar 3 Disclosures
2
Index
Table of Contents 1. Overview ........................................................................................................................... 3
2. Scope ................................................................................................................................ 5
3. Executive summary ........................................................................................................... 6
4. Risk Management ............................................................................................................. 7
5. Capital Resources ........................................................................................................... 20
6. Capital Adequacy ............................................................................................................ 25
7. Credit Risk Measurement, Mitigation and Reporting ........................................................ 28
8. Operational Risk .............................................................................................................. 38
9. Market Risk ..................................................................................................................... 39
10. Remuneration ................................................................................................................ 41
11. Encumbrance ................................................................................................................ 45
12. Basel III: leverage ratio and transition ............................................................................ 48
13. Capital instruments key features ................................................................................... 50
Glossary of Terms ............................................................................................................... 53
Contact Mark Robson – Technical Reporting Manager [email protected] 0191 244 2007 Newcastle Building Society Portland House New Bridge Street Newcastle NE1 8AL

Pillar 3 Disclosures
3
1. Overview
1.1 Background Basel III is a comprehensive set of reform measures in banking prudential regulation developed by the Basel Committee on Banking Supervision, to strengthen the regulation, supervision and risk management of the banking sector. In 2013, the European Union adopted a legislative package, the Capital Requirements Directive IV (CRD IV) to strengthen the regulation of the banking sector and to implement the Basel III agreement in the EU legal framework. CRD IV is made up of the Capital Requirements Directive (2013/36/EU) (CRD) which must be implemented through national law and the Capital Requirements Regulation (575/2013) (CRR), which is directly applicable to firms across the EU. Basel III, in the form of the new CRD IV came into force on 1 January 2014 and updates the three “pillars” of the Basel Framework which first came into force from 1 January 2008. Pillar 1 of the standards sets out the minimum capital requirements firms are required to meet for credit, market and operational risk. Under Pillar 2, firms and supervisors have to take a view on whether a firm should hold additional capital against risks not covered in Pillar 1, assess the suitability of Pillar 1 capital requirements and demonstrate their ability to manage their capital position through a severe stressed scenario. Pillar 3 aims to improve market discipline by requiring firms to publish key details of their risks, capital and risk management. Details of the impact the Basel III requirements have had on the Society and Group are shown in section 12.2, including in relation to transitional provisions. Through 2017 a handful of amendments to the CRR and consequent Pillar 3 reporting have been made, none of which have had a significant impact on the Group.
1.2 Future Developments The Basel Committee on Banking Supervision (BCBS) The BCBS issued Revised Pillar 3 disclosure requirements in January 2015 to promote more standardised, comparable and frequent Pillar 3 reporting. A further consultative document on Pillar 3 disclosure requirements considering a consolidated and enhanced framework was issued by the BCBS in March 2016. Initially expected to apply to the Newcastle Building Society’s (the Society) 2016 Pillar 3 disclosures, reporting under the new frameworks has been pushed back with guidelines for revised disclosures at the end of 2017 applicable only to globally and other systemically important institutions. Through 2017 the BCBS issued additional Pillar 3 disclosure requirements – “consolidated and enhanced framework”: the second phase of the Committee’s review of the Pillar 3 disclosure framework. At 31 December 2017 the requirements had not been adopted into European law. The BCBS also issued Basel III framework revisions in December 2017 “Basel III: Finalising post-crisis reforms”. The revisions aim to enhance the robustness and risk sensitivity of the standardised approaches for credit risk and operational risk (both applicable to the Society) and constrain the use of internally modelled approaches. Widely discussed under the banner of ‘Basel IV’ due to the significance of the changes, implementation is not expected until 2022. The European Banking Authority (EBA) The EBA launched a consultation on Guidelines on disclosure requirements in June 2016 clarifying an intention to implement the BCBS Pillar 3 recommendations though a ‘comprehensive review’ of the CRR. Globally and other systemically important institutions were recommended to implement a subset of the new disclosures in their 31 December 2016 reporting with focus towards expanded risk weighted

Pillar 3 Disclosures
4
asset disclosures. The Society is neither globally nor systemically important and has adopted the CRR’s standardised approach to credit risk, including the calculation of risk weighted assets, and has made no consequent early-adoption of the BCBS templates. The expected future trend remains towards disclosures that are more granular, more frequent and of significantly increased volume with the most significant revisions including a hierarchy of disclosures through the use of templates, accompanied by specific definitions. The Society continues to monitor the EBA’s implementation progress and proposals. CRD IV and CRR Long-running reviews of standardised credit risk and operational risk are yet to be concluded with the European Commission also proposing changes to the existing CRD IV and CRR frameworks. The Basel Committee on Banking Revisions aren’t expected to be concluded and applicable in advance of 2022 and the Society will monitor and engage with the process as these ‘Basel 4’ proposals are finalised. The Bank of England In December 2017 the Bank of England set its expectations that building societies will make public disclosure of their total capital requirements during 2018. The Society makes this disclosure in both its Annual Report and Accounts 2017 and also in this Pillar 3 Disclosures document. International Financial Reporting Standard 9 – Financial Instruments The CRR was amended in December 2017 to introduce transitional arrangements that reduce the capital impact of increased IFRS 9 provisions throughout a 5 year transitional period (2018-2022). The Society has elected to adopt the provisions and will include in subsequent Pillar 3 reporting both the transitional and fully loaded IFRS 9 capital positions, as required by the CRR amendment. The impact of IFRS 9 from 1 January 2018, and particularly its forward looking provisioning requirements that look at expected rather than incurred losses, is not expected to have a significant impact on the Society. For further detail, see the Society’s 2017 Annual Report and Accounts.
1.3 Policy This document has been prepared in accordance with the requirements of Part Eight (Articles 431 to 455) of Regulation (EU) No. 575/2013 of the European Parliament and of the Council. The Society adopts the standardised approach to credit and operational risk. These disclosures are on a standardised basis and unless otherwise stated, all figures are as at 31 December 2017 and based on the most recently published Annual Report and Accounts. This report will be prepared on an annual basis, or more frequently as applicable to any revised reporting frameworks (see 1.2 above). This report will be published on the Newcastle Building Society website (www.newcastle.co.uk), in line with publication of the Annual Report and Accounts. These disclosures are not subject to external audit, although where they are equivalent to those prepared under accounting requirements for inclusion in the Group’s audited Annual Report and Accounts, those disclosures in the Annual Report and Accounts have been subject to external audit. These disclosures do not constitute any form of financial statement and must not be relied upon in making any judgement on Newcastle Building Society or the Group (as defined in section 2). These disclosures were reviewed and approved by the Society’s Board on 27 February 2018.

Pillar 3 Disclosures
5
2. Scope The Pillar 3 reporting framework applies to Newcastle Building Society (the Society) and its subsidiary undertakings (the Group). The Society’s consolidation group for accounting purposes comprises the Society itself and the following principal subsidiaries:
Newcastle Financial Advisers Limited
Newcastle Strategic Solutions Limited
Newcastle Systems Management Limited
Newcastle Portland House Limited
Newcastle Mortgage Loans (Jersey) Limited All of the above subsidiary undertakings, except for Newcastle Mortgage Loans (Jersey) Limited, which is incorporated in and operates in Jersey, are incorporated in England and Wales and operate in the United Kingdom. For prudential and Pillar 3 reporting purposes, the Group presents its consolidated position as above. There are no current or foreseen legal impediments to the prompt transfer of capital resources or the repayment of liabilities within the Group. Further details of Group consolidation policies and the Group structure are given in Notes 1 and 13 of
the Group’s audited Annual Report and Accounts.

Pillar 3 Disclosures
6
3. Executive summary
The Society has continued to make good capital progress through 2017 with capital ratios strengthening over the 12 month period. The Society’s total available capital has improved to £225.2m at 31 December 2017 compared to £221.4m at 31 December 2016, with the net increase in reserves for the period being partially offset by the repayment and amortisation of subordinated debt. While the Society continues to reduce balance sheet risk through reduced holdings of higher risk commercial real estate this legacy divestment is significantly outpaced by new prime residential lending: net lending in excess of £142m was achieved during 2017. Due to the higher risk weighting attached to commercial loans the overall risk weighted assets held in relation to loans and advances to customers was broadly unchanged at just under £1bn. There was a slight increase in overall risk weighted assets to £1,193.0m from £1,186.2m, due mainly to the purchase of the Society’s Cobalt office building, which had previously been rented. The Society’s risk weighted assets are expected to grow in line with the balance sheet as prime residential lending balances increase. The Society sees its remaining subordinated debt erode in capital value from £9.6m to £nil between 31 December 2017 and its redemption date of 23 December 2019 – this is reflected in forward looking capital plans. The Society’s capital plans also assume that the £10m of Permanent Interest Bearing Shares with a call date in December 2018 are repaid, however this is subject to approval by the Prudential Regulation Authority. With aspirations for continued balance sheet growth, the Society recognises the ongoing need for robust
and effective risk management, mitigation and governance. The Society’s risk management framework
is designed to enable the Society to proactively identify and manage risks to support the achievement
of the Society’s objectives. It includes monitoring and controlling the significant risks to which the
Society is exposed to ensure the security and resilience of the Society. The Society’s ability to identify,
measure, monitor, report and control risks is key to delivering sustainable and resilient business
performance, including fair outcomes for Members and customers.
The five year trend for the Group’s capital ratios is shown in the table below and further details are
included on page 13 of the Annual Report and Accounts and in section 5 of this document.
The Group complied with PRA Individual Capital Guidance plus planning buffers throughout 2017 and
capital plans show the Group continuing to comply, with adequate headroom, over the 5 year planning
horizon.
11.912.7
13.6 14.315.3
14.1 14.6 15.3 15.816.6
17.818.6 18.7 18.7 18.9
0
5
10
15
20
2013 2014 2015 2016 2017
Common Equity Tier 1ratio
Tier 1 ratio
Total capital ratio

Pillar 3 Disclosures
7
4. Risk Management
4.1 Background
The Board is ultimately responsible for ensuring that adequate systems of risk management are in place, and that the Society’s strategy, risk appetite, and risk management are consistent. To assist the Board, the Society’s Group Risk Committee (GRC) oversees the management of risk across the Group and is supported by various sub-committees and the Group Risk department. The Group Risk department, which includes managers that cover Credit, Treasury, Operational and IT Risk, is responsible for ensuring that appropriate risk management is applied. This includes the provision of reports on risks, and risk management for the GRC and its sub-committees. The Strategy Planning and Risk Director provides formal updates on risk management to the Board, in relation to the Group, at least quarterly. The Society and Group risk management framework operates under the ‘three lines of defence’ principle.
The first line of defence is within departments, business units and subsidiaries where Executives, managers and staff have responsibility for risk management and ensuring adequate controls are in place to mitigate risk.
The second line of defence is provided by the GRC and supporting sub-committees together with oversight of the first line by the Group Risk department.
The third line of defence is provided by Internal Audit and the Audit Committee, which are responsible for reviewing the effectiveness of the first and second lines of defence.
The Group has detailed risk management policies for each principle risk area setting out how risk is managed across the Group, including specific risk appetite statements. The risk appetite statements outline for each principle risk area the basis on which risks are accepted or declined. This forms the basis for the various limits and key criteria, set out in policies, which must be followed in order to mitigate risk exposures. These limits are embedded into daily, weekly and monthly management and Board reporting in order to monitor compliance with the Society’s risk profile. Further details on risk appetite and risk management are given in the Risk Management Report on pages 32 to 35 of the Annual Report and Accounts.
4.2 Principal Types of Risk Credit Risk Credit risk is the risk that a treasury counterparty, debtor or borrower will not be able to meet their obligations as they fall due and the Society’s collateral is insufficient to meet the debt obligations. Credit risk arises primarily on retail and commercial loans, and on treasury assets held for liquidity purposes. Credit Risk – Lending The Group has comprehensive policies in place covering credit risk management that set out criteria that must be followed before funds are advanced and also incorporate limits for concentration risk arising from, inter alia, large exposures, geographical areas and lending types. Return on Capital Employed benchmarks are set to ensure reward is commensurate with the risk taken, once the risk is considered acceptable to the Society. Residential lending policies set out credit risk policies and prudent underwriting criteria for retail lending. Loans are underwritten individually based on affordability, credit score and credit history, acceptable collateral (including loan to value), and the Society’s lending criteria. In the first instance, the Society makes use of a tailored application scorecard to facilitate the assessment of credit risk at the application stage. The Society does not undertake subprime or self-certification lending.

Pillar 3 Disclosures
8
The Society’s lending policy is subject to review at least annually and the residential mortgage book is
subject to ongoing reporting in relation to its credit risk characteristics (including loan to value, loan to
income, arrears, credit score profile, early delinquencies, and arrears arising from cohorts of lending).
The Society has a Prudential Risk department that monitors and reports credit risk within the residential
mortgage portfolios, including stress testing. This team also monitors the performance of the
commercial and residential investment portfolios through annual reviews and key risk management
information, including borrower watchlists, arrears trends, breach reports and general market and sector
specific information.
Retail Credit Committee (RCC) RCC is responsible for credit risk across the Group arising from the retail mortgage portfolio including lending policy, underwriting, limit setting and monitoring, forbearance, possessions, affordability, scorecard effectiveness and efficiency, and residential stress testing. The Society has two committees established to oversee risk within the commercial portfolio: Commercial Credit Committee (CCC) and the Provisioning Committee CCC is responsible for credit risk across the Group’s non-retail mortgage portfolio including loan strategy, limit monitoring, risk indicators and stress factors, annual reviews and breach reports, loan renegotiations and restructures, monitoring risk trends on the portfolio, and stress testing. The Provisioning Committee’s remit is to consider recommendations in relation to provisions for commercial loans. A commercial approach to collections and recovery for commercial and buy to let (BTL) portfolio borrowers is taken by the Society featuring a more proactive and targeted response where difficulties are identified such as late payments, tenant failure, ratings downgrades and general negative market news. Credit risk – Treasury
The Group operates under a long established Treasury Policy which sets out the general principles of prudential management for its Treasury Operations. The policy incorporates the requirements of the Building Societies Act 1986, regulatory policy and International Accounting Standards and details operational limits and guidelines, the Society’s risk appetite statement and stress testing requirements. Treasury counterparty risk is monitored within the Prudential Risk department in accordance with the Treasury Policy. All treasury counterparty ratings, CDS spreads and market information are monitored in real time and prompt action is taken where volatile market conditions require a tightening of criteria. Credit risk on liquid assets is controlled via the operation of approved counterparty, sector, instrument, and country limits for treasury assets. Counterparty limits are set with regard to external ratings agency assessments with the Society investing only in highly rated financial institutions or other building societies with strong capital ratios. The Society supplements ratings agency information with more extensive credit assessment procedures for counterparty limits including market information and movement on credit default swap (CDS) spreads for countries and individual counterparties. The Society is also subject to market-investment risk across its liquidity portfolios, the risk that the value
of the Society’s investment falls and the Society is obliged to crystallise that fall in value. The Society
does not operate a trading book and mitigates exposure in accounting value swings (and the
corresponding liquidity risk of reduced value of liquidity investments) through the use of derivatives.
Throughout 2017 the Society has continued to make use of the London Clearing House (LCH) with the
LCH acting as the Society’s appointed central counterparty to treasury swaps originally undertaken with
institutional counterparties. Where possible, the Society’s derivative contracts are cleared via the LCH
however non-centrally cleared derivatives are still held with non-LCH counterparties. See section 7.7
for detail of the Society’s collateral policy with respect to derivative exposures. Derivatives are only used
by the Group in accordance with the Building Societies Act 1986. These instruments are not used for
trading or speculative purposes and their sole purpose is to mitigate risks arising from movement in

Pillar 3 Disclosures
9
interest rates or indices. The Society has a Credit Support Annex in place for all derivative
counterparties.
Investment risk Investment risk is the risk that the value of the Society’s investments fall and the Society is obliged to crystallise that fall in value. Investment risk is managed as part of the treasury risk process.
Liquidity Risk
Liquidity risk is the risk of loss or failure caused by the Group being unable to meet its liabilities or
commitments as they fall due, or to be able to do so only at excessive cost. The nature of the business
of a building society is to lend longer-term (typically up to 25 years) and fund with short term savings
accounts. This leads to a maturity mismatch between assets and liabilities.
The Group’s liquidity policy is to maintain sufficient liquid resources to cover cash flow imbalances and fluctuations in funding, and enable the Group to meet its financial obligations when they fall due. This is achieved by maintaining a prudent level of liquid assets and ensuring that funding and lending plans are in balance. The Society has complied with the Liquidity Coverage Ratio (“LCR”) requirements throughout 2017. LCR shows high quality liquid assets as a percentage of net cash outflows over a 30 day stress period. For further information see section 7.7 of this document. The Society has continued to maintain a significant level of high quality liquid assets throughout 2017,
as detailed in the Strategic Report on page 12 of the Annual Report and Accounts. The Society has
complied with its Individual Liquidity Guidance throughout 2017.
On a day to day basis liquidity risk is monitored within Treasury and the Prudential Risk department. The Group's liquidity risk is overseen by the Asset and Liability Committee (ALCO). ALCO reviews and approves the results of liquidity stress testing scenarios and cash-flow forecasts under base case and stressed scenarios. ALCO appraises long term funding plans and scenarios to ensure adequate liquid assets are in place to meet both regulatory and operational requirements following input by the Group Balance Sheet Management and Product Development departments. ALCO approves the Treasury Policy and the Individual Liquidity Adequacy Assessment Process. Conduct Risk Conduct risk is the risk of customer detriment arising from the Society’s activities, including poor consumer outcomes, resulting from poorly designed or targeted products, mis-selling of products, inadequate controls relating to fraud prevention and detection or to prevent money laundering. The Group has established a conduct risk framework including a Retail Conduct Risk Appetite statement supported by detailed policies relating to compliance, treating customers fairly, fraud, and anti-money laundering. Compliance with the Retail Conduct Risk Appetite statement is monitored by the Operational Risk Committee (ORC), reporting to the Executive Risk Committee (ERC) with oversight from the GRC. The Group has a product approval committee (Mortgages and Savings Committee, ‘MASC’) which approves all products. Included in the terms of reference for MASC is consideration of risks to consumer outcomes arising from products or services. In 2017 the Society established a Customer Outcomes department which sits in the first line of defence,
this is in addition to the Conduct Risk department in the second line of defence. The Society maintains
a Treating Customer Fairly dashboard, which looks at evidence supporting good customer outcomes
(or suggesting poor outcomes) and this is reviewed quarterly and reported to the Board. The Society
maintains an annual Compliance Plan, which is risk based, reporting to ERC with oversight from the
GRC. Over the course of 2018 the Society expects to further develop its framework for managing and
monitoring Conduct Risk across the business.

Pillar 3 Disclosures
10
Operational Risk
Operational risk is the risk of loss, resulting from inadequate or failed internal processes, people and systems, or from external events. For the Group this definition includes legal risk, strategic risk and reputational risk. The Group has an established operational risk framework, set out in the operational risk policy, detailing
the measurement and management of risk, operational risk appetite, use of scenario testing for
operational risk, tracking of risk events and operational losses, timescales for implementation of action
plans and escalation procedures for more serious risk events that require immediate action to mitigate
loss.
A key feature of the Group’s operational risk framework is that key risks and controls are identified for
all areas of the business ranging from the high level risks, discussed at Board level, down to the risks
within individual departments. Risk assessments remain the responsibility of the relevant departmental
managers and Executives, and are updated regularly for new risks, the results of risk events and
following internal audit reviews.
Risks are scored in terms of the impact and probability of the risk arising and are scored before and
after considering the impact of controls. The operational risk system is also utilised by Internal Audit
with the audit inspection plan based on high scoring risk areas or where there is significant reliance on
key controls to mitigate the impact of otherwise significant risks. Group corporate insurance policies are
also negotiated with full regard to the key risks within the Group requiring greater mitigation.
ORC oversees operational and conduct risk which is then overseen by GRC on a quarterly basis. Market Risk
Market risk is the risk of losses in on and off-balance sheet positions arising from adverse movements in market prices. The principal market risk to which the Group is exposed is interest rate risk. Interest rate risk in the
banking (or non-trading book) is covered further in section 9. The Group has no exposure to foreign
currency and a very small direct net exposure to equities through a small shareholding in Standard Life
arising from the de-mutualisation of the insurance company in 2006. At 31 December 2017 these
holdings were held on the balance sheet at £0.4m, a value that fairly reflects their market price. The
Group has an indirect exposure to the performance of equities through its defined benefit pension
scheme.
The Group’s treasury policy sets out processes and controls in place to manage and monitor interest rate risk.
Pillar 3 Disclosures
11
The Group's interest rate risk is managed by ALCO and the Balance Sheet Management department. ALCO monitors the use of interest rate derivatives used to manage interest rate risk, considers and agrees the Society’s interest rate view and monitors compliance with limits in the Treasury Policy. Concentration Risk Concentration risk is the risk arising from a single large exposure or a group of exposures where the potential for loss is connected. Concentration risk arises from operating in a particular geographical location, a particular industry sector or from large exposures in the form of large loans to single borrowers or treasury counterparties. The Society, whilst being a regional building society, has lending secured against residential property across the UK with no individual geographic concentrations in excess of a fifth of its residential mortgage book. For further detail see section 7.5 of this report. The Group has a comprehensive range of limits and controls in place which enable the Board and related sub-committees to measure and monitor concentration risk across the Society’s business and at a Group consolidated level. GRC has oversight of all relevant management information and is able to provide assurance and recommendations to the Board in relation to the management of any significant emerging risks. Commercial borrower activity is similarly monitored with large exposure to individual borrowers
considered as a source of potential concentration risk. GRC is satisfied at 31 December 2017 that no
exposure in any one risk concentration exceeds the Society’s risk appetite.
Pension Fund Obligation Risk The Group has funding obligations for a defined benefit scheme which is closed to new entrants. It was closed to future benefit accrual with effect from 30 November 2010. Pension risk is the risk that the value of the Scheme’s assets, together with any agreed employer contributions, will be insufficient to cover the projected obligations of the Scheme over time. The return on assets, which includes equities and bonds, will vary with movements in equity prices and interest rates. The projection of the Scheme’s obligations includes estimates of mortality and inflation, the actual out-turn of which may differ from estimates. The Scheme is also exposed to changes in pension legislation. To mitigate these risks the Trustees of the Scheme, in consultation with the Society, review reports prepared by the Scheme’s independent actuary on a quarterly basis and take appropriate actions including adjusting the investment strategy. The Group also performs stress testing on the pension scheme liabilities and assets as part of capital planning as set out in the Internal Capital Adequacy Assessment Process (ICAAP). The pension scheme assets are invested 60% in assets that “match” the liabilities and 40% in “growth” assets linked mainly to equities through a variety of funds including Diversified Growth Funds. The current level of hedging for interest rate risk and inflation risk is at 55% with the Society currently considering proposals by the Trustees to increase this further. Investments into the pension scheme are well diversified, such that the failure of any single investment would not have a material impact on the overall level of assets. However, the scheme is still exposed to significant market volatility, particularly in long term gilt rates and equities. The Society accounts for its defined benefits pension scheme in line with International Accounting
Standard No 19. Key assumptions made in calculating the year end obligation include assumed future
discount, RPI, CPI and mortality rates. For further detail see Note 28 to the 2017 Annual Report and
Accounts.
Solutions Business Risk The Society’s business model includes diversification via the Newcastle Strategic Solutions business, through the Group’s subsidiaries Newcastle Strategic Solutions Limited and Newcastle Systems Management Limited. This increases the exposure to operational risk, particularly in relation to IT systems capability and human error. The Society established the Newcastle Strategic Solutions business in 1997, whereby the Society provides outsourced services, such as internet banking, IT services, and savings account
Pillar 3 Disclosures
12
administration, to other financial institutions. There are various operational and strategic risks arising from the Solutions business including, inter alia:
Systems failures (mainframe, internet and telephony);
Breach of information security/Data Protection Act;
Failure of Society’s employees to follow third party procedures/basic human error;
Failure of a business partner; and
Poor service – resulting in failure to meet Service Level Agreements. The Society has systems and controls in place to address the risks in the Solutions area including
dedicated teams in IT, Finance, Compliance, Financial Crime Unit, technical departments and
dedicated relationship and service managers.
A separate Newcastle Strategic Solutions Board oversees third party contract risks, financial performance and operational matters that arise from Newcastle Strategic Solutions Limited. Similarly, the Newcastle Systems Management Limited Board oversees the strategic direction of information technology including risk monitoring, reporting and mitigation across both the Solutions business and the wider Group. The growth and potential impact of cybercrime is a challenge facing many businesses, not just in the
financial services sector. The Society takes this possible threat very seriously and has put in place
appropriate measures to safeguard members and the business clients of NSSL. However, given the
nature of the threat, this an area which remains under constant review utilising both internal and external
expertise to inform our strategy.
Deferred taxation The Group’s calculation of Common Equity Tier 1 Capital contains deductions for certain deferred taxation components. Under Basel III, the Group’s deferred tax assets that rely on future profitability, excluding those arising from temporary differences, must be deducted from Common Equity Tier 1 Capital, reducing both Tier 1 and Total Capital Available. The Group’s deferred tax asset recovery is conditional on future profits of the Group. The Society’s Audit Committee has assessed the deferred taxation position as at 31 December 2017 and is satisfied that the amount will be recovered through forecast future profits. Significant progress towards recovery of the Group’s deferred tax asset has been made in recent years. Amendments made to the Finance Act during 2017 will serve to slow the Society’s deferred tax asset recovery however there are no material uncertainties towards ultimate recovery of the deferred tax asset. This was most recently formally assessed and concluded satisfactorily on by the Group’s Board as part of the year-end Going Concern review. See section 12 for details of the impact of transition to the final Basel III position on the Group capital
position.
Capital risk
Capital risk is the risk that the Society is or becomes inadequately capitalised to address the risks to
which it is exposed. The Society updates its ICAAP on an annual basis reflecting a comprehensive
internal assessment of the level of capital needed in respect of both risks faced under ‘business as
usual’ and stressed scenarios. Capital adequacy is also monitored on a monthly basis by the Board.
See section 6 for further detail.
‘Brexit’ risk

Pillar 3 Disclosures
13
The UK vote to leave the European Union (EU) in June 2016 has been followed by periods of market
volatility, depreciation in the value of Sterling and ongoing uncertainty regarding the UK’s short-term
economic outlook. ‘Brexit’ results in uncertainty to the regulatory environment and economic
environment more generally.
The Group does not trade outside the UK, and does not rely on employees from the EU. As a UK
deposit taker and UK mortgage lender, the Group does not expect to be significantly impacted by the
consequences of the UK’s decision to leave the EU and will continue to monitor its exposure to risks
arising from ‘Brexit’ through its existing risk framework. Particular focus is expected towards the UK’s
regulatory environment through its current dependency on the EU regulations, including the ability of
EU firms to passport permissions into the UK.
‘Brexit’ risk influences many of the principal risks highlighted above therefore the position continues to
be kept under review within all lines of defence.
4.3 Risk Governance The Society has a well-developed risk and compliance structure with the Risk department supported by separate Compliance, Internal Audit and Financial Crime Units. The Society has extensive policies and procedures covering financial risk, credit risk and operational risk which are approved by the Board via sub-committees as appropriate. The risk governance structure is set out below. Risk Governance Structure

Pillar 3 Disclosures
14
Group Risk Committee (GRC) GRC reports to the Board and is responsible for all material risks, including both conduct and prudential risks. It is responsible for the Society’s risk framework, risk appetite statements and ensuring that these remain consistent with the Society’s strategic plan. Terms of reference for GRC are included on the Society’s website under governance (https://www.newcastle.co.uk/about-us/governance/our-committees/). The duties of GRC include:
Oversight of overall risk appetite, risk management strategy and framework, including oversight
of both prudential and conduct risk appetites;
Oversight of compliance with risk policies;
Oversight of the risk sub-committees (see below);
Review and assessment of the adequacy of risk management information to monitor and control risks;
Approval of risk management of new initiatives and projects, and in particular the risks those initiatives and projects expose the Group to;
Consideration and approval of the top risks for the Society and Group including low likelihood, high impact risks; and
Approval of stress testing and scenario testing.
The Committee normally meets at least four times a year and more frequently where required (During 2017 the Committee met five times). It is supported by five Executive committees that meet on a monthly basis, as follows:
The Retail Credit Committee (RCC) is responsible for credit risk across the Group arising from the retail mortgage portfolio (including residential, retail BTL and equity release) with key duties including:
Consideration, review and recommendations, at least annually, on the Society’s residential lending policy statement (including interest only policy) and arrears and possessions policy (Residential & Retail BTL);
Monitoring of controls in operation in relation to credit risk management and compliance with lending guidelines set out in SS20/15 (the Building Society Sourcebook);
Annual consideration of the appropriate lending approach for the Society (Traditional, Limited or Mitigated) in the light of the existing book, lending activities and the corporate plan;
Review of risk metrics and management information for the retail mortgage portfolio;
Review and approval of risks surrounding new types of mortgage products including assessing return on capital employed (ROCE) requirements;
Oversight and approval of six monthly stress testing of the Residential and Retail BTL lending books and quarterly stress testing of the Equity Release lending books, to assess the potential losses under a range of stressed scenarios;
Review of losses on possession sales to identify causal factors that should be considered for feeding back into lending policy;
Annual review of the Society’s valuation process including use of valuers and assessing the effectiveness of the panel and key valuers utilised during the year;
Annual recommendation of Mortgage Indemnity Guarantee (MIG) insurance cover proposals;
Consideration of new projects impacting credit risk across the Society including implementation of any major changes to the mortgage application or administration processes; and

Pillar 3 Disclosures
15
To review on annual basis the Society’s legal process including use of solicitors and assessing the effectiveness of the panel and key solicitors utilised during the year.
Through 2017, RCC met monthly.
The Commercial Credit Committee (CCC) is responsible for credit risk across the Group’s non-retail
mortgage portfolio with key duties including:
Consideration, review and recommendations, at least annually, on the Society’s Non-Standard lending policy;
Monitoring of controls in operation in relation to commercial credit risk management;
Oversight, review and approval of the annual review program for commercial loans, breach reports, maintenance of borrower watch lists, arrears and possessions cases, macro-economic data with regard to the commercial market, and pricing reviews;
Oversight and approval of annual stress testing to determine the potential losses in a stressed environment;
Consideration, review and approval of the write-off or recovery of shortfall debts; and
Consideration, challenge and recommendation in relation to legacy wind down strategy. Through 2017, CCC met quarterly. The Operational Risk Committee (ORC) supports GRC though provision of oversight of operational
risk with key duties including:
Review and approval of the Operational Risk Policy, Business Continuity Policy, Data Protection Policy, Records Management and Data Retention Policy, and Information Security Policy at least annually;
Oversight of reports to ensure adherence to the Operational Risk Policy; and
Review of risk indicators in risk dashboards including risk event trends across the business, actions being taken on significant risk events and any external impacts.
Through 2017, ORC met monthly.
The Asset and Liability Committee (ALCO) is responsible for all aspects of treasury risk management
including liquidity and funding risk, interest rate risk and hedging activity, treasury counterparty credit
risk and balance sheet management. Terms of reference for ALCO are included on the Society’s
website under governance (https://www.newcastle.co.uk/about-us/governance/our-committees/).

Pillar 3 Disclosures
16
Key duties of ALCO include:
Review of the Treasury Policy and compliance therewith alongside monitoring of activity and controls underpinning the Treasury Policy;
Consideration of treasury dealing strategy and holdings against the risk appetite set for treasury risk management;
Review of risk associated with changes to the Society’s balance sheet, including structural changes and consideration of policy or other actions appropriate to that risk assessment;
Consideration and agreement of the Society’s interest rate view, based on changes to the economic outlook and interest rate environment;
Annual review of the Society’s authorised list of treasury investment counterparties;
Oversight of funding risk including the management of funding and liquidity risk across stressed funding scenarios and agreement of contingency funding plans;
Review of the Society’s encumbrance levels;
Consideration of the impact from changes in the market value of liquid assets, derivatives and embedded derivatives under applicable accounting standards, including quarterly review of stressed interest rate scenarios;
Consideration to scenarios modelled as part of liquidity stress testing and identification of additional scenarios based on best practise and regulatory pronouncements.
Annual review of the Society’s ILAAP;
Review of compliance with specific guidelines issued by the PRA or FCA; and
Annual review of treasury and risk staff training.
Through 2017 ALCO met monthly.
The Executive Risk Committee (ERC) is responsible for conduct and fraud risk management with key
duties including:
Annual consideration, review and recommendation on the Retail Conduct Risk Appetite Statement, Conduct Rules Policy, Compliance Policy and Plan, Complaints Policy, and Whistle Blowing Policy;
Monitoring of activity and controls underpinning customer outcomes to ensure compliance with the Society’s risk appetite;
Review of causal factors and root cause analysis of complaints;
Review of the Retail Conduct Risk Outlook and consideration of the adequacy of any mitigation;
Review of monthly fraud risk management information, reports of the Money Laundering Reporting Officer, and annual Financial Crime Policy;
Consideration, review and consequent response to semi-annual stress testing of the Society’s vulnerabilities, including recession or other economic scenarios where balance sheet risks, business risks and credit risks may come together;
Consideration of aspects of the Group’s ICAAP not covered by ALCO, CCC or ORC including

Pillar 3 Disclosures
17
concentration risk, strategic and business risk, stress tests on Solutions and other Society subsidiaries’ incomes and the overall stress tests giving rise to the capital planning buffers; and
Consideration and recommendation on the Group’s Corporate Insurance Policy Statement.
Through 2017 ERC met monthly.
4.4 Other Governance Further details of the Society’s corporate governance arrangements are given on pages 20 to 24 of the
Annual Report and Accounts.
The Board The Board is responsible for agreeing the overall strategy for the Group including approval of the corporate strategy, with the responsibility for implementing it being delegated to the Executive team. The Board is responsible for monitoring operational and financial performance in pursuit of the strategy. The Board oversees and approves the Society’s recovery options and resolution pack. The Board is responsible for risk management, for governance, and for ensuring adequate internal controls. The Board delegates oversight of risk management to the Group Risk Committee, and oversight of internal controls to the Audit Committee. The Board retains the responsibility for approval of the Society’s ILAAP and ICAAP. The Board is responsible for approving the budgets and forecasts, the adequacy of capital and liquidity plans, the adequacy of the systems of internal control and major capital expenditure. In addition, the Board is responsible for final approval of the interim results and Annual Report and Accounts on a going concern basis. Further details are given on pages 20 to 21of the Annual Report and Accounts. The Board consider the Group’s governance structure, control environment, risk mitigation activities and risk monitoring sufficient to meet the Group’s ongoing profile and strategy. In addition to the GRC and sub-committees detailed above, the Board has six other committees which
are noted below.
Remuneration Committee
This Committee considers and makes recommendations on Executive Director and Executive
emoluments and contracts of employment. The Committee considers proposals from the Chief
Executive for changes to the level of fees for Non-Executive Directors including the fees for the
Chairman. The Committee’s report is included on pages 28 to 31 of the Annual Report and Accounts.
In addition, section 10 of this report sets out the remuneration disclosures as required under Article 450
of the CRR which have been approved by the Remuneration Committee.
Nominations Committee
The Committee is responsible for oversight of the composition of the Board and to lead the process for
Board appointments. The Committee advises on the structure, size, and composition of the Board which
includes succession planning, nominations to the Board and the ongoing membership of the Board.
The Committee also ensures that the Board has the appropriate balance of skills, diversity and
experience and reviews the membership of each of the Board Committees, in consultation with the
Chairs of the relevant Committees as appropriate, to make recommendations to the Board as to any
changes required to ensure that the Committees possess the necessary capabilities, experience,
knowledge and behaviours required to operate effectively.
The Committee also assists in the development and monitoring of induction, training and professional
development of all members of both the Society’s governing body and its senior management functions.

Pillar 3 Disclosures
18
Newcastle Strategic Solutions (NSSL) Board
NSSL’s Board oversee all aspects of the outsourcing savings management business including risks,
financial performance and operational matters. In addition it sanctions new third party contracts, in line
with its delegated authority, after considering the relevant financial model, contract obligations and full
project risk assessment. The NSSL Board establish and review a risk appetite statement for NSSL,
evaluate and monitor NSSL risk and compliance matters and consider and act upon the findings of any
external/ internal audits or reviews. Further details are given on page 22 of the Annual Report and
Accounts.
Newcastle Systems Management (NSML) Board
NSML’s Board oversee the strategic direction of Information Technology, property management, and
associated services, ensuring this is consistent with the Society’s agreed corporate strategy for ongoing
development and improvement in the business proposition. The NSML Board establish and review a
risk appetite statement for NSML, monitor developments in the area of cyber and other technological
risk mitigation, ensure that NSML complies with all relevant legislation and act upon the findings of any
external/ internal audits or reviews. Further details are given on pages 22 and 23 of the Annual Report
and Accounts.
Newcastle Financial Advisers (NFAL) Board (Previously Newcastle Financial Services)
NFAL’s Board oversee the strategic direction of the Group’s financial advice subsidiary, ensure
compliance with all relevant legislation and act upon the findings of any external/ internal audits or
reviews. Further details are given on page 23 of the Annual Report and Accounts.
Audit Committee This Committee considers all audit matters relating to the Group, the system of internal control, financial reporting and evaluation of first and second lines of defence for risk management. Reports from the Strategy, Planning and Risk Director, Head of Internal Audit Services and the external auditors provide input on key risks and uncertainties direct to the Audit Committee. The main responsibilities of the Committee as delegated by the Board are:
Financial reporting: monitoring of the integrity of the financial statements of the Group including the interim and annual reports, and any other formal announcements relating to the Group’s financial performance. This includes review of significant financial reporting judgements and offering advice to the Board on whether the Annual Report and Accounts, taken as a whole, are fair, balanced and understandable, providing the information necessary for Members to assess the performance, strategy and business model of the Group;
Effectiveness of internal control and risk management systems, including internal financial control: The Audit Committee works closely with the GRC to ensure that management and staff take appropriate responsibility for departmental, business unit and subsidiary risk mitigation and internal control. This includes review of the scope and effectiveness of the Group’s internal controls and risk management systems, including those for ensuring compliance with the regulatory environment in which the Group operates. The Committee also reviews the Group’s procedures for detecting fraud and irregularities ensuring arrangements are in place by which staff may, in confidence, raise concerns about possible improprieties in matters of financial reporting control or other matters and to ensure independent investigation and appropriate follow up of such matters is undertaken;
Internal audit: The Society’s internal audit function is carried out by the Internal Audit Services department and reflects the Audit Committee’s primary available resource. The Committee retains the authority to obtain outside legal or independent professional advice as it sees fit.

Pillar 3 Disclosures
19
The Committee approves and reviews the Internal Audit work programme and results and ensures the Internal Audit Services department maintains sufficient access to the Board, management and the books and records of the Society and its subsidiaries. This oversight allows the Audit Committee to monitor and assess the role and effectiveness of the Internal Audit function in the overall context of the Group’s internal control framework, ensure appropriate management responsiveness to audit findings and recommendations given and promote open communication between the Group’s Risk, Compliance, Finance, Internal Audit and External Audit functions.
External audit: The Audit Committee oversees the Group’s relationship with the external auditors, including appointment, re-appointment, removal and assessment of independence, objectivity, effectiveness and remuneration. The Society has established a policy on the use of the external auditors for non-audit work which is considered and approved annually by the Audit Committee. The principal purpose of this policy is to ensure the continued independence and objectivity of the external auditors.
Further details on the work of the Audit Committee are given in the Audit Committee Report included
on pages 25 to 27 of the Annual Report and Accounts.
4.5 Risk Appetite The Board approved risk appetite statements consider profitability in a stressed scenario, capital, liquidity, operational risk, credit risk, interest rate risk, the fair treatment of customers and conduct risk, and IT risk. They set out key limits and escalation triggers. The risk appetite statements, together with the risk position, are reported to the Board quarterly and
formally approved annually.

Pillar 3 Disclosures
20
5. Capital Resources The Group’s total capital requirement/individual capital guidance is communicated annually by the Prudential Regulation Authority and consists of minimum regulatory capital requirements (Pillar 1) plus additional, Society specific capital requirements for credit, market, operational, counterparty, credit concentration, interest rate and pension obligations risk (Pillar 2A). The Group’s total capital requirement at 31 December 2017 was £153.4m. For the avoidance of doubt, the Group’s total capital requirement, as defined above, is exclusive of regulatory buffer requirements. Note: Throughout the Pillar 3 disclosures, Group positions are presented. Differences between the Group and the Society capital positions arise through differences in available capital resource being:
Accumulated net losses in the Society’s subsidiary entities of £0.5m; and
Society holdings of intangible assets at £1.4m lower than the Group’s holding.
These combine to increase the Society’s available capital by c. £2.4m vs. the Group’s position.
Differences also arise through differences in risk weighted assets, being:
Society holdings of mortgage assets at £1.7m lower (RWA) than the Group’s holding;
Society holdings of tangible assets at £25.3m lower (RWA) than the Group’s holding;
Society holding of subsidiary share capital at £28.4m (RWA) (nil at a Group level); and
Society holding of subsidiary loan and other intercompany assets at £34.7m (RWA) (nil at Group level).
These combine to increase the Society’s risk weighted assets by c. £36.2m vs. the Group’s position.
Both the Society and Group have operated within the Individual Capital Guidance (ICG) issued by the PRA throughout 2017, including meeting capital buffer requirements.
The Group restated its closing defined benefit pension asset from £2.6m as at 31 December 2016 to
£nil during 2017. This reflects a retrospective restatement of the Group’s change in accounting policy
under IAS 19 to derecognise pension assets from the balance sheet. Volatility in asset and liability
valuations coupled with the uncertain future ability to withdraw funds from the pension scheme have
informed the Group’s revised policy. Were the policy not in effect, an IAS 19 pension surplus of £10.8m
would have been recognised at 31 December 2017.
From a capital perspective, the impact is negligible: pension surpluses are deducted from Common
Equity Tier 1 under the CRR (net of any deferred taxation impact). Common Equity Tier 1 is therefore
unaffected by the retrospective adjustment as while 2016’s closing reserves are reduced by £2.2m
(£2.6m pension asset net of £0.4m associated deferred taxation) the consequent deduction from CET
1, previously £2.2m, also falls to £nil. The composition of CET 1 is therefore impacted without impacting
the ultimate amount. Group risk weighted assets are similarly unaffected. The minor reduction in the
Group’s restated 2016 balance sheet size has no visible impact on the Group’s leverage ratio
calculation.
Figures throughout reflect these adjustments.

Pillar 3 Disclosures
21
5.1 Total Capital Available
An analysis of Total Capital Available (TCA) as at 31 December is set out in the following table:
Basel III Transitional End Point Basel III
Basel III Transitional
End Point Basel III
Group £m Group £m Group £m Group £m
31-Dec-17 31-Dec-17 31-Dec-16 31-Dec-16
Common Equity Tier 1 capital
Profit and loss reserves 185.0 185.0 175.7 175.7
Deferred tax assets that rely on future profitability excluding those arising from temporary differences~
(2.1) (2.1) (4.4) (4.4)
Defined benefit pension fund assets| - - - -
AFS reserve* 1.8 1.8 0.4 0.4
Additional valuation adjustments** (0.3) (0.3) (0.3) (0.3)
Intangible assets (1.9) (1.9) (1.6) (1.6)
Common Equity Tier 1 capital 182.5 182.5 169.8 169.8
Tier 1 Capital Permanent Interest Bearing Shares (PIBS)
30.0
30.0
30.0
30.0
PIBS Grandfathering to Tier 2 capital (15.0) (30.0) (12.0) (30.0)
Total Additional Tier 1 capital 15.0 - 18.0 -
Total Tier 1 capital 197.5 182.5 187.8 169.8
Tier 2 capital
Collective Impairment allowance 3.2 3.2 3.3 3.3
PIBS Grandfathering to Tier 2 capital 15.0 30.0 12.0 30.0
Subordinated debt 9.5 - 18.3 -
Total Tier 2 capital 27.7 33.2 33.6 33.3
Total Regulatory Capital 225.2 215.7 221.4 203.1
~Deferred tax assets relating to temporary timing differences of £1.3m are held on balance sheet at 31 December 2017 and are
not deducted from Common Equity Tier 1, in line with article 48 of the CRR.
|Defined benefit pension fund assets are presented net of associated deferred tax liabilities, in line with article 41 of the CRR.
*Net market values of the Society's Available For Sale debt security portfolio are included in Common Equity Tier 1 capital as
part of other reserves, net of any associated deferred taxation.
**Additional valuation adjustments are calculated under the simplified approach as the Group's gross value of assets and liabilities
held at fair value is less than €15bn.
The above includes full amortisation of the Group’s remaining subordinated debt over the Basel III transitional period and transitional grandfathering of the Society’s PIBS to Tier 2 Capital from Tier 1 but does not factor in accumulated Group profits over a similar period or other capital transactions that could be undertaken. It presents an end point Basel III position using the 31 December 2017 Group balance sheet only, assuming no other movement in reserves or other capital tier 1 and 2 items. The Society holds a £10m tranche of PIBS which feature an optional call date in December 2018. While these PIBS would transition from Tier 1 to Tier 2 capital in line with the CRR’s grandfathering provisions, and consequently feature in the tables above as both transitional and end-point capital, post 18 Jan 2018, these PIBS become ineffective for capital purposes and will not feature in the year ended 31 December 2018’s total capital available. The following table details the Group’s capital flows through 2017. Figures are presented under a Basel
III transitional basis.

Pillar 3 Disclosures
22
Basel III Transitional £m
Common Equity Tier 1 capital at 31 December 2016
169.8
Group profit after taxation for the financial year 2017 10.9
Other comprehensive (expense)/income:
Pensions (1.7)
Income tax on items that may be reclassified to the income statement
(0.3)
Income tax on items that will not be reclassified to the income statement
-
Other movements:
Decrease in deferred tax asset 2.3
Decrease in defined benefits pension fund assets -
Increase in intangible assets (0.3)
Increase in AFS reserve 1.8
Common Equity Tier 1 capital at 31 December 2017
182.5
Additional Tier 1 capital at 31 December 2016 18.0
PIBS Grandfathering to Tier 2 capital (3.0)
Additional Tier 1 capital at 31 December 2017 15.0
Tier 2 capital at 31 December 2016 33.6
Reduction in collective provision (0.1)
Amortisation of capital value of Subordinated debt (8.8)
PIBS Grandfathering to Tier 2 capital 3.0
Tier 2 capital at 31 December 2017 27.7
The above table illustrates that the core driver of the Society's Common Equity Tier 1 (CET1) capital
increase is the Group's profitability through 2017. Ongoing and improved profitability also drives a
meaningful decrease to the Group's on balance sheet deferred tax assets that rely on future profitability
to be utilised. This decreases correspondingly the deferred tax asset deduction to the Group's CET1.
With most of the Society's interest rate derivatives held in effective and formal fair value hedges
throughout 2017, the Society's additional valuation adjustments are not significant, primarily reflecting
un-hedged portions of the Society's available for sale debt securities held at fair value on balance sheet.
Improvement in the market value of the Society's available for sale debt securities portfolio, compared
to the amortised cost base of the underlying assets, has driven a small addition to the Group's CET1,
with the portfolio remaining ‘in the money’.
Grandfathering of Tier 1 PIBS into Tier 2 capital and Tier 2 amortisation of the capital value of
subordinated debt issued by the Society continues in line with the CRR's transitional arrangements.
The Society’s repayment of £25m of 7.19% Subordinated Debt on 2 October 2017 has not impacted
the available Tier 2 capital: as the capital value of the Subordinated Debt had already amortised to £nil
by the date of its repayment, in line with the provisions of the CRR.
The below table reconciles the Group balance sheet capital, reserves and subordinated liabilities to
their regulatory capital values.

Pillar 3 Disclosures
23
31-Dec-17
£m
Balance sheet reserves 186.8
Loss based deferred tax asset (capital impact) (2.1)
Defined benefit pension fund assets -
Intangible assets (1.9)
Additional valuation adjustment (0.3)
Other -
Regulatory Common Equity Tier 1 capital 182.5
Balance sheet Subscribed capital 30.0
Grandfathering of PIBS under Basel III (15.0)
Additional Tier 1 capital 15.0
Balance sheet subordinated liabilities 50.0
Amortisation of capital value of subordinated liabilities under Basel III
(40.5)
Collective impairment allowance 3.2
Grandfathering of PIBS under Basel III 15.0
Total Tier 2 capital 27.7
Total Regulatory Capital 225.2
5.2 Common Equity Tier 1 Capital Common Equity Tier 1 Capital primarily comprises profit and loss reserves being the accumulation of retained profits. Common Equity Tier 1 Capital is a key measure of focus under the capital regulations (see section 12). Under Basel III, deferred tax assets that rely on future profitability to be realised are to be excluded from Total Capital Available. The Group does not capitalise internally generated intangible assets but deducts from Common Equity Tier 1 capital externally purchased computer software meeting the IFRS definition of intangible assets. Additional Valuation Adjustments are also made in line with the CRR. For further detail of the transitional provisions of Basel III and their impact to the Group’s capital position see section 12.
5.3 Additional Tier 1 Capital Additional Tier 1 Capital consists of permanent interest bearing shares (PIBS). PIBS are unsecured deferred shares and rank behind the claims of all subordinated note holders, depositors, creditors and investing Members of Newcastle Building Society. Further details on PIBS are given in Note 25 of the Annual Report and Accounts. Under Basel III, the capital value of the Group’s PIBS move from Tier 1 capital to Tier 2 capital over a transitional period. For detail of the Society’s capital instruments’ key features, see section 13 of this report.

Pillar 3 Disclosures
24
5.4 Tier 2 Capital Tier 2 capital comprises subordinated debt, collective or ‘general’ impairment provisions held against the mortgage book and other balance sheet assets, and PIBS that have been moved from Tier 1 capital under Basel II to Tier 2 capital under Basel III. Fixed term subordinated debt is unsecured and ranks behind the claims of all note holders, depositors, creditors and investing Members of Newcastle Building Society. Further details on subordinated debt are given in Note 24 of the Annual Report and Accounts. Fixed term subordinated debt is amortised on a straight line basis down to £nil capital value over the final 5 years to maturity of the debt. The Society’s remaining £25m (book value) subordinated debt matures on 23 December 2019. Amortisation deductions of £15.5m have subsequently been made in the above Total Regulatory Capital calculations.

Pillar 3 Disclosures
25
6. Capital Adequacy
The Group adopts the standardised approach to credit and operational risk for the purposes of calculating the Pillar 1 minimum capital requirements. Pillar 1 capital is reported to the Board each month and to the PRA on a quarterly basis.
6.1 Internal Capital Adequacy Assessment Process (ICAAP) The Group assesses the overall capital requirement for current and future activities via the ICAAP. The ICAAP is updated on an annual basis, or more frequently where there is a significant change to the business strategy or a major change to the economic environment. The capital plan is updated in conjunction with the update to the Society’s five year strategic plan so that strategy and capital are always in alignment and that the risks arising in pursuit of the Society’s strategy are always fully incorporated into capital requirements. The ICAAP is presented to and approved by the Board on an annual basis. These disclosures include extracts from the ICAAP and are based on the final financial results of the Group contained in the 2017 Annual Report and Accounts. The ICAAP covers all material risks to determine the capital requirement over the planning horizon and includes stressed scenarios to satisfy regulatory requirements. Where Pillar 1 capital is deemed insufficient to cover stressed losses a supplementary Pillar 2 add-on is applied. The Group ICAAP is subject to review by internal audit and external advisors (as part of the three year audit cycle as set out in the internal audit inspection plan) in order to confirm that the Society’s approach to the ICAAP is robust, compliant and up to date with the requirements of the PRA Handbook. The Group’s ICAAP is subject to the Supervisory Review and Evaluation Process set by the PRA.
6.2 Minimum Capital Regulatory Requirement: Pillar I The table below shows the Group’s Pillar 1 Capital Resources Requirement (CRR) for each key risk area under the standardised approach (expressed as 8% of the risk weighted exposure amounts for each of the applicable standardised credit risk exposure classes) at 31 December:
2017 2016
Group Pillar 1 On Balance
sheet
Risk Weighted
Assets
Capital @ 8%
On Balance sheet
Risk Weighted
Assets
Capital @ 8%
£m £m £m £m £m £m
Mortgage Loans Credit Risk
2,707.3 995.9 79.7 2,563.8 999.4 80
Liquidity Credit Risk 789.8 45.5 3.6 776.5 54.6 4.4
Other Assets 53.9 51.6 4.1 38.7 34.2 2.7
Hedging Instruments - 9.8 0.8 - 12.3 1
Mortgage commitments - 8.3 0.7 - 8.9 0.7
Total Credit Risk (standardised)
- 1,111.1 88.9 - 1,109.4 88.8
Operational Risk (standardised)
- 81.9 6.5 - 76.8 6.1
Total Pillar 1 CRR 1,193.0 95.4 1,186.2 94.9
*Risk weighted assets are broadly derived from the following balance sheet categories:
Mortgage loans credit risk: Loans and advances to customers.
Liquidity credit risk: Cash and balances with the Bank of England, Loans and advances to banks, Debt securities and Assets pledged as collateral.
Other assets: Property, plant and equipment, deferred tax assets and other assets. ~Being Credit Valuation Adjustments of £5.4m and EADi adjustments of £4.4m.
Pillar 3 Disclosures
26
** Mortgage commitments are not held on balance sheet. Hedging instrument credit risk is derived in line with the standardised method for own funds requirements for credit valuation adjustment risk - not balance sheet derived.
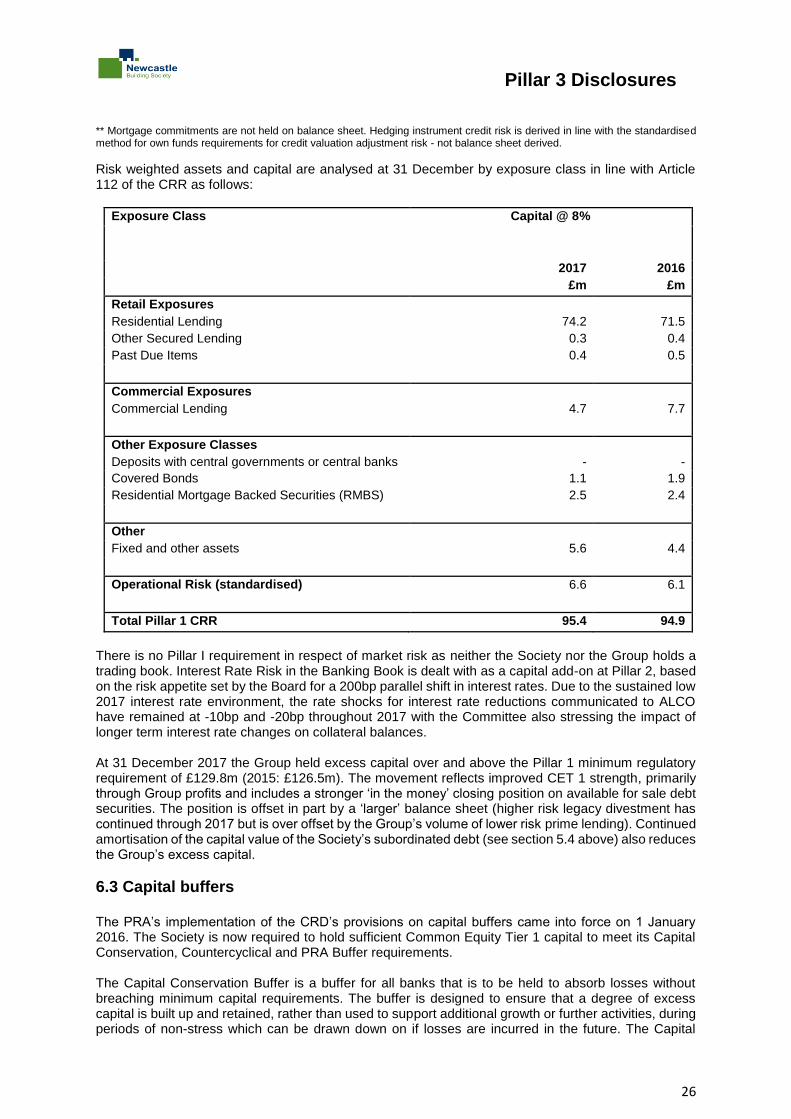
Risk weighted assets and capital are analysed at 31 December by exposure class in line with Article 112 of the CRR as follows:
Exposure Class Capital @ 8%
2017 2016
£m £m
Retail Exposures
Residential Lending 74.2 71.5
Other Secured Lending 0.3 0.4
Past Due Items 0.4 0.5
Commercial Exposures
Commercial Lending 4.7 7.7
Other Exposure Classes
Deposits with central governments or central banks - -
Covered Bonds 1.1 1.9
Residential Mortgage Backed Securities (RMBS) 2.5 2.4
Other
Fixed and other assets 5.6 4.4
Operational Risk (standardised) 6.6 6.1
Total Pillar 1 CRR 95.4 94.9
There is no Pillar I requirement in respect of market risk as neither the Society nor the Group holds a trading book. Interest Rate Risk in the Banking Book is dealt with as a capital add-on at Pillar 2, based on the risk appetite set by the Board for a 200bp parallel shift in interest rates. Due to the sustained low 2017 interest rate environment, the rate shocks for interest rate reductions communicated to ALCO have remained at -10bp and -20bp throughout 2017 with the Committee also stressing the impact of longer term interest rate changes on collateral balances. At 31 December 2017 the Group held excess capital over and above the Pillar 1 minimum regulatory requirement of £129.8m (2015: £126.5m). The movement reflects improved CET 1 strength, primarily through Group profits and includes a stronger ‘in the money’ closing position on available for sale debt securities. The position is offset in part by a ‘larger’ balance sheet (higher risk legacy divestment has continued through 2017 but is over offset by the Group’s volume of lower risk prime lending). Continued amortisation of the capital value of the Society’s subordinated debt (see section 5.4 above) also reduces the Group’s excess capital.
6.3 Capital buffers The PRA’s implementation of the CRD’s provisions on capital buffers came into force on 1 January 2016. The Society is now required to hold sufficient Common Equity Tier 1 capital to meet its Capital Conservation, Countercyclical and PRA Buffer requirements. The Capital Conservation Buffer is a buffer for all banks that is to be held to absorb losses without breaching minimum capital requirements. The buffer is designed to ensure that a degree of excess capital is built up and retained, rather than used to support additional growth or further activities, during periods of non-stress which can be drawn down on if losses are incurred in the future. The Capital

Pillar 3 Disclosures
27
Conservation Buffer is being phased-in in equal increments of 0.625% each year until its final level of 2.5% in 2019 from a starting point in 2016 of 0.625%. The Countercyclical Buffer is a buffer that can be varied over time. The primary objective of the Countercyclical Buffer is to ensure that the banking system is able to withstand stress without restricting essential services, such as the supply of credit, to the real economy. The Society has no material relevant exposures outside of the UK and consequently is subject to the UK’s published Countercyclical Buffer: currently set at 0%. The UK countercyclical buffer will increase to 0.5% on 27 June 2018 and to 1.0% on 28 November 2018. The Capital Conservation and Countercyclical Buffers combine to form the Society’s CRDIV Buffer. The Society is not a globally systemically important institution and therefore holds no systemic buffers. The Society also holds a specific PRA supervisory buffer, which is reduced by the CRDIV Buffer, where applicable, to ensure no duplication in capital requirements to cover the same risks. The Society is required to meet at least 56% of its ICG by post-buffer Common Equity Tier 1 and has operated satisfactorily to this requirement throughout 2017. The Society does not ‘double count’ Common Equity Tier 1: i.e. Common Equity Tier 1 assigned against buffer requirements is not also assigned against ICG.

Pillar 3 Disclosures
28
7. Credit Risk Measurement, Mitigation and Reporting For the purposes of Pillar 3 disclosures, credit risk is sub-divided into residential mortgages, other secured lending, commercial lending, and treasury credit risks. Risks arising from changes in credit quality and the recoverability of loans and amounts due from counterparties are inherent across most of the Group’s activities. Adverse changes in the credit quality of borrowers or a general deterioration in UK economic conditions could affect the recoverability and value of the Group’s assets and therefore its financial performance. Comprehensive risk management policies and processes have been established as part of the Society’s overall governance framework to measure, mitigate and manage credit risk within the Group’s risk appetite.
7.1 Exposures The gross credit risk exposures (based on the definitions for regulatory capital purposes, before credit risk mitigation) and the averages for the year are summarised below:
Average to As at As at
Dec-17 Dec-17 Dec-16
Mortgage Assets (before provisions) £m £m £m
Residential Mortgages
2,045.4
2,146.5
1,944.3
Housing Associations
509.3
498.0
520.5
Other secured lending
5.3
4.8
5.8
Commercial Real Estate Loans
64.9
47.7
82.1
Serviced Apartments
21.9
21.1
22.7
2,646.8
2,718.1
2,575.4
Treasury
Deposits with central governments or central banks
266.5
266.8
266.2
Cash collateral pledged to derivative counterparties
230.9
226.2
235.6
Covered bonds
128.6
138.1
119.1
RMBS
155.1
157.2
152.9
Legacy exposures (written down value)
0.2
0.1
0.2
Cash in hand and equivalent cash items
2.0
1.4
2.5
783.2
789.8
776.5
Total
3,429.9
3,507.9
3,351.9

Pillar 3 Disclosures
29
7.2 Retail Credit Risk The Group has comprehensive policies in place covering all aspects of credit risk management that set out strict criteria that must be followed before funds are advanced. Prospective customer eligibility for loans is controlled by underwriting using core credit score and affordability criteria. The Group risk appetite incorporates limits for concentration risk arising from, inter alia, larger loans, BTL, higher LTV and geographical exposures. These various limits combined with formal governance and policies reflect the Group’s view and appetite for risk in the retail mortgage portfolio. All limits and policies are reviewed annually by the Board and the Group Risk Committee and, in between reviews, the profile and profitability of mortgage completions and mortgage pipeline is reviewed in the context of underlying credit risk profile. An investigation is carried out in the event a loan goes into arrears within the first 12 months of completion to identify causal factors and inform policy generally. The key areas covered in lending policy are:
Limits on loan to value based on types of lending;
Limits on higher loan to value lending;
Approved broker requirements;
Valuation requirements including use of approved valuers;
Use of approved solicitor panels;
Clear mandates with a more senior level of approval required the riskier the loan;
Use of a detailed affordability model;
Loan to income limits by number of loans (also tracked by value);
Credit scoring to identify borrowers deemed a higher credit risk with automatic rejection or referral where appropriate;
Strict underwriting criteria on borrower credit performance;
Reporting of geographical concentration against guidelines;
Maximum loan sizes and large loan limit;
Strict valuation criteria driven by level of risk inherent within the loan to value;
The requirement for income validation in all cases;
Fraud and money laundering procedures including the use of fraud intelligence systems;
Mortgage indemnity insurance for higher loan to value lending to mitigate loss (> 80% LTV); and
Return on capital employed benchmark requirements.
In addition, all mortgage products are strictly controlled through the Group’s Mortgages and Savings Committee (MASC) approval, in line with ALCO agreed pricing limits, and subject to minimum benchmarks for Return on Capital Employed (the benchmarks vary according to the risk profile of the mortgage product with higher risk requiring a higher return). The Group does not offer and has never offered sub-prime or self-certified mortgages. Credit risk under Pillar 1 is calculated using the standardised methodology in line the CRR and CRD regulations. Non-defaulted retail mortgage assets up to 80% LTV attract a 35% risk weighting, whilst the proportion above 80% LTV attracts a 75% risk weighting. Mortgages in default attract a risk weighting of 100% if no provisions are held and LTV is less than or equal to 80%, and 150% where the LTV is greater than 80% and no provisions are held. While the Society has Mortgage Indemnity Guarantee insurance in place for lending greater than 80% LTV this is not included as mitigation within capital calculations.

Pillar 3 Disclosures
30
7.3 Loans to Housing Associations The Society has a large portfolio of loans to Housing Associations which is reducing over time. The Society has not undertaken any new lending of this type with balances falling by £22m in 2017, due to redemptions. There has been no loss experience on the portfolio since this area of business commenced and no Housing Association loans are past due or impaired.
7.4 Commercial Credit Risk Commercial lending is split between lending to low risk housing associations detailed above, residential investment lending (commercial Buy to Let) and commercial investment lending (secured on commercial real estate). An analysis of loans within the commercial lending book is given in note 30 of the Annual Report and Accounts. The Group has not undertaken commercial lending since 2008 but the Commercial Lending and Prudential Risk departments continue to monitor the performance of the portfolios through annual reviews, and key risk management information, including borrower watchlists, arrears trends and breach reports. The Society grants forbearance to commercial borrowers in exceptional circumstances in the form of extending the loan term on maturity, capitalising arrears as part of a wider exercise to get a borrower back on track with a revised debt repayment plan, and adjusting the interest rate to aid serviceability particularly where a fixed rate has expired. Generally the Society expects commercial investment loans to be repaid on maturity given the strategy of winding down the portfolio but will grant forbearance when this is also in the best interests of the Society e.g. providing the borrower with a little more time to sell the security property following a tenant renewal. Further details are given in Note 30 of the Annual Report and Accounts. The Society extended the loan term on four commercial loans during 2017 with total balances of £27.2m with £24m of the balances being repaid later in 2017. Forbearance granted ranged from term extensions on commercial terms to reduced preferential interest rates and agreements to reduce debt through the waiver of exit fees. Credit risk capital for the Society’s commercial lending under Pillar 1 is determined by reference to the Standardised methodology. Risk weights of 100% are applied to lending secured on commercial real estate and risk weights of 35% or 100%, depending on LTV, are applied to residential lending. Exposures to housing associations are risk weighted at 35% or 100% depending on LTV. The following table provides an analysis of commercial lending exposure by industry sector at 31 December for the Group:
Commercial lending 2017 2016
£m £m
Housing Associations 498.0 520.5
Serviced apartments 21.1 22.7
Loans secured on commercial real estate:
Retail 21.8 47.0
Office Industrial 4.8 13.9
Industrial 16.3 16.0
Hotel/leisure 4.4 4.7
Other 0.4 0.5
566.8 625.3

Pillar 3 Disclosures
31
7.5 Geographical Distribution
The geographical distribution of all mortgage assets at 31 December 2017 is as follows:
Residential Mortgages
Housing Associations
Other Secured Lending
Commercial Real Estate
Serviced Apartments
Total Balances
£m £m £m £m £m £m
UK 2,122.3
498.0 4.8 47.7 21.1
2,693.9
Jersey 4.3 - - - -
4.3
Gibraltar 19.9 - - - -
19.9
2,146.5
498.0 4.8 47.7 21.1
2,718.1
The Group’s Jersey and Gibraltar books are not material in size and considered to be of high credit quality. The Group’s geographic concentration across its residential lending and BTL lending is detailed below.
Geographical Book Exposure
Cumbria 1.6%
North East 15.5%
East Anglia 2.1%
East Midlands 6.8%
Gibraltar 1.0%
Greater London 12.8%
Jersey 0.2%
North West 9.6%
Northern Ireland 0.2%
Scotland 8.5%
South East 16.9%
South West 6.9%
Wales 2.8%
West Midlands 6.5%
Yorkshire 8.6%
7.6 Residual Maturity of Exposures by Asset Class
The following table shows residual maturity of exposures on a contractual basis as opposed to an expected basis. Where a loan is repayable by instalment, each instalment has been treated as a separate repayment in the maturity analysis set out below. The Group’s experience is that in many cases mortgages are redeemed before their scheduled maturity date. As a consequence, the maturity analysis illustrated below may not reflect actual experience. From liquidity and matching risk perspectives, the Society’s Balance Sheet Management department monitors and reports on expected, rather than contractual maturities to ALCO. Residual maturity of mortgage assets at 31 December 2017:
On demand < 12 months 1-5 years > 5 years Total
£m £m £m £m £m
Mortgage Assets 7.1 102.2 258.9 2,349.9 2,718.1

Pillar 3 Disclosures
32
7.7 Treasury Credit Risk The Group has exposures to banks, building societies, sovereigns and asset backed securities in its non-trading book treasury portfolio. The Group does not operate a trading book. Exposures in the treasury portfolio are held for liquidity purposes or in the case of fair value exposures on derivatives, for hedging purposes. The Group’s policy is to maintain overall high quality liquid assets in excess of regulatory requirements. The Board’s policy on managing credit risk relating to treasury exposures is set out in detail within the treasury policy. Credit limits are set for individual counterparties using external credit ratings which feed into the Society’s assessment of the credit risk. Institutions, including building societies which do not have external ratings, are individually assessed based mainly on the strength of their capital ratios. Counterparties are approved by ALCO and Group Risk Committee. The Society also uses market information and Credit Default Swap spreads to inform treasury dealing decisions and keep up to date on treasury counterparty credit risk. Limits are also in place for instrument types and countries to mitigate against concentration risk arising in the treasury portfolio. Where a counterparty is downgraded to a level below the acceptable rating then the counterparty and related limit is removed from the treasury dealing approved counterparty list. Where there are existing investments, the Treasurer will recommend to the Chief Executive (and in their absence to the Finance Director and Deputy Chief Executive) whether they should be sold, if possible, or allowed to run to maturity with ALCO and GRC to be notified of the decision. All limits are monitored against the sum of on and off-balance sheet exposures. The risk of a default from a derivative counterparty is minimised as all derivative exposures are covered by a Credit Support Annex (CSA) whereby, in the event of a positive mark-to-market valuation, the counterparty must post cash collateral to the Group. The Group similarly places cash collateral with its derivative counterparties in the event of a negative mark-to-market valuation. The Society does not hold an external credit rating and cash collateralisation of the Group’s exposures to and with counterparties mean there would be no impact to the cash collateral postings required at 31 December 2017 in the event of a perceived decrease in the Society’s credit worthiness. Continued use of the LCH to facilitate the Group’s derivative transactions through 2017 has continued to mitigate the credit risk associated with derivative transactions. Note 30 of the 2017 Annual Report and Accounts gives further details on fair value measurement and valuation of derivatives. The table below includes the Group derivative asset exposure to counterparties at 31 December 2017. The gross fair value presented in the balance sheet reflects the fair market value of the Group’s interest rate swap assets and are in line with the cost to replace the relevant contracts. Financial collateral received is cash collateral that the Group has received to mitigate its year end exposure to derivative counterparties.

Pillar 3 Disclosures
33
Gross fair value presented in the Balance
Sheet
Offsetting financial collateral
(received*)/pledged not meeting the
offsetting criteria of IAS32
Net Collateralised
Position
Net position under Master
Netting Agreements
not meeting the offsetting
requirements of IAS 32 (pre-
collateral)
Financial assets £m £m £m £m
Interest rate swaps 4.9 (0.1) 4.8 0.1
Financial liabilities
Interest rate swaps (210.2) 226.0 15.8 (208.2)
The future credit exposure of the Group’s derivative assets at 31 December 2017 is £2.7m, derived by applying a multiple based on the underlying contracts’ residual maturities to the notional value of the contract. The Group uses external credit assessments provided by Standards & Poor’s, Fitch, and Moody’s. These are recognised by the PRA as eligible external credit assessment institutions (ECAI’s) for the purpose of calculating credit risk requirements under the standardised approach. For all credit exposures that are assessed, the risk weight is dependent on the level of the assessment (i.e. the credit rating). An 8% capital requirement is then applied as per the standardised approach. The EBA published its Commission Implementing Regulation (EU) 2016/1799 laying down implementing technical standards with regard to the mapping of credit risk assessments of external credit assessment institutions for credit risk in October 2016. The EBA’s mapping with respect to Standard & Poor’s, Fitch, and Moody’s aligned with the PRA’s interim mapping of ECAIs’ credit assessments, as previously used by the Society for the purpose of assigning capital risk weightings (primarily to liquidity exposures to institutions). The Group’s Treasury Risk department monitors forthcoming regulatory standards pertaining to CRD IV: Liquidity closely. The Group monitors actual and forecast anticipated liquidity holdings over the planning horizon with cash-flow forecasts considered each month by ALCO. The CRD’s liquidity coverage requirements, designed to ensure that financial institutions hold sufficient highly liquid assets on hand to weather short term liquidity disruptions, are monitored routinely by Treasury Risk. The Group holds sufficient liquid assets, including high quality liquid assets required to cover Pillar 2 risks, throughout its forecast horizon to remain compliant with the Basel Committee on Banking Supervision’s Liquidity Coverage Ratio. At 31 December 2017 the Group held a Liquidity Coverage Ratio of 180%.This is in excess of the current minimum requirement of 90% set by regulators (rising to 100% from 1 January 2018). This is calculated with reference to a liquidity buffer of £453.6m and net liquidity outflows of £251.8m. The Basel Committee on Banking Supervision published the final standard on the calculation of the Net Stable Funding Ratio in October 2014. The Net Stable Funding Ratio is defined as the amount of available stable funding relative to the amount of required stable funding. The Group’s Net Stable Funding Ratio at 31 December 2017 was 143%, well in excess of the expected minimum holding of 100% The table below shows the Group’s credit risk exposures to Treasury counterparties at 31 December 2017.

Pillar 3 Disclosures
34
Risk Weighting (credit quality step) S&P rating and Fitch IBCA
Moody's Rating 2017 2016
£m £m
Central banks and Central Governments
0% AAA-AA- Aaa to Aa3 266.8 266.2
Cash collateral pledged to derivative counterparties
0% Cash collateral pledged to derivative counterparties only
226.1 235.6
Asset Backed Securities
20% AAA-AA- Aaa to Aa3 157.2 152.9
Covered Bonds
10%-20% AAA-AA- Aaa to Aa3 138.1 119.1
Central banks: Failed institutions
Legacy exposures - 150%
0.1 0.2
Cash in hand and equivalent cash items
Cash in hand and equivalent cash items 0%
1.4 2.5
The Group calculates an 8% capital requirement based on the risk weighted assets for the above treasury assets. There is no material difference between the Group’s exposures stated above and the Group’s exposure prior to credit mitigation. The geographical distribution of treasury exposures as at 31 December 2017 is set out in the table below. At 31 December 2017 the Society had no direct exposures to counterparties based in the Eurozone.
Treasury Exposures 2017 2016
£m £m
UK 789.8 764.1
Europe (excluding UK) 0.0 6.7
North America 0.0 5.7
789.8 776.5
The residual maturity of these treasury exposures at 31 December 2017 is as follows:
Treasury assets < 12 months 1-5 years 5-10 years Total
£m £m £m £m
Central banks and Central Government*
178.7
-
88.1
266.8
Cash collateral pledged to derivative counterparties
226.1
-
-
226.1
Other
0.2
-
-
0.2
Residential Mortgage Backed Securities
1.5
155.7
-
157.2
Covered Bonds 42.6
95.5
-
138.1
Cash in hand and equivalent cash items
1.4
-
-
1.4
450.5
251.2
88.1
789.8
*Includes UK Government Gilts at a fair value of £84.8m.

Pillar 3 Disclosures
35
7.8 Impairment Provisions
The Group assesses at each balance sheet date whether there is objective evidence that a financial asset or group of assets is impaired. An asset is impaired where an event has occurred which indicates the Group does not expect to collect all the contractual cash flows due, or expects to collect them later than they are contractually due. Impairment loss is calculated as the difference between the assets’ carrying value and the present value of the estimated cash flows from those assets. Objective evidence can be defined as one or more events occurring after initial recognition of the asset, that have a bearing on estimated future cash flows of the financial asset or group of assets. Objective evidence may include indications that the borrower or group of borrowers are experiencing significant financial difficulty, default or delinquency in interest or principal repayments, failure of the tenant, and other indicators of potential breach or future default. The Group first assesses whether objective evidence of impairment exists for financial assets. Assets that are separately significant are considered individually, and if there is no objective evidence of impairment, are grouped together with assets of similar credit risk characteristics and collectively assessed. Assets that are individually assessed for impairment, and for which an impairment loss is recognised, are not included in a collective assessment of impairment. Residential and commercial loans are assessed individually for impairment and those not individually impaired are assessed collectively in the light of information available. Note 1 of The Annual Report and Accounts shows the accounting policy adopted for impaired assets. The Group considers several factors when deciding if a commercial exposure is impaired including any missed payments, tenant failure, tenant voids and likelihood of re-letting and any other potential loan servicing issues arising from assessments or professional advice particularly where this provides evidence that a loan is or is unlikely to be fully serviced. The credit quality of the Society’s residential lending book is excellent and it continues to perform, with 3 month arrears remaining well below industry averages. Impairment of the residential book is considered collectively for loans with 3 months or more arrears based on an estimation of loss given default and probability of default based on individual loan circumstances. All properties entering possession are provided against specifically based on loan to value and anticipated disposal costs. A small collective provision arises from the Society’s roll-rate to possession modelling for loans with low arrears, previous arrears or where forbearance has previously been granted. Note: at 31 December 2017, the Group calculated its impairment provisions in line with IAS 39: Financial Instruments. IAS 39 was superseded on 1 January 2018 by IFRS 9: Financial instruments. While IFRS 9 introduces new requirements for the calculation of forward looking expected credit losses, the Group’s impairment provisions have not been significantly impacted in overall quantum. The Group’s capital position is consequently broadly unaffected by the direct implications of IFRS 9. Indirectly, a portion of the Group’s general provisions that are added back to Tier 2 capital at 31 December 2017 are no longer eligible for inclusion as Tier 2 capital from 1 January 2018 as they are classified as IFRS9 provisions. This indirect impact is not considered material to the Group’s capital position and does not impact internal assessments that the Group remains robustly capitalised both at 31 December 2017 and across the Group’s internal medium term planning horizons (5 years). For further detail of the Group’s application of IFRS 9, see note 30 of the Annual Report and Accounts.
7.9 Past Due and Impaired Loans
Past due is defined as loans where the borrowers’ contracted payments have not been received by the due date. The amounts shown as past due represent the full amount of the loan outstanding, and not just the amount that is past due. An analysis of loan portfolios, by past due and impaired status, is given below:

Pillar 3 Disclosures
36
Prime residential mortgage book
The prime residential mortgage book consists of traditional residential loans to homeowners. No sub-prime or self-certification lending has ever been undertaken.
2017 2017
£m %
Neither past due nor impaired 1,916.9 99.1
Past due up to 3 months but not impaired 11.3 0.6
Impaired and past due 3 to 6 months 3.1 0.2
Impaired and past due over 6 months 1.8 0.1
1,933.1 100.0
Retail BTL mortgage book
The Retail BTL mortgage book consists of buy-to-let individuals with balances < £1m (including legacy business).
2017 2017
£m %
Neither past due nor impaired 152.1 99.6
Impaired and past due over 6-months 0.3 0.2
LPA receivership - 0.1
In Possession 0.1 0.1
152.5 100.0
Specialist residential book The Specialist residential mortgage book consists of portfolio investor buy-to-let (including loans > £1m) and residential investment loans.
2017 2017
£m %
Neither past due nor impaired 47.5 81.7
Past due up to 3 months but not impaired 10.5 18.0
LPA receivership – impaired 0.2 0.3
58.2 100.0
Commercial lending book The commercial lending book comprises loans secured on commercial property and loans to Housing Associations. Loans secured on serviced apartments totalling £21.1m have been excluded from the table below as they reflect only small individual loans of a retail nature. Loans to Housing Associations totalling £498.0m have been excluded from the table below as no loans to Housing Association were past due or impaired at 31 December 2017.

Pillar 3 Disclosures
37
2017 2017
£m %
Neither past due nor impaired 32.7 68.6
Not past due but impaired 15.0 31.4
47.7 100.0
Allowance for losses on loans and advances to customers
Loans fully secured on residential property
Loans fully secured on land
Other loans Total
Individual Collective Individual Collective Individual Collective Individual Collective Total
£m £m £m £m £m £m £m £m £m
Balance at 1 January 2017 0.9 0.6 7.1 2.7 0.3 - 8.3 3.3 11.6
Charge/ (credit) for the year - 0.7 0.9 (1.4) - - 0.9 (0.7) 0.2
Utilised during the year (0.7) - (0.3) - - - (1.0) - (1.0)
Balance at 31 December 2017 0.2 1.3 7.7 1.3 0.3 - 8.2 2.6 10.8
7.10 Credit Risk Mitigation The Group’s core credit risk mitigation is to perform a full assessment of the borrower’s ability to service the mortgage and obtaining adequate security for the loan advanced. Residential Mortgages Residential property is the Group’s main source of collateral and means of mitigating credit risk inherent in its residential mortgage portfolio. All mortgage lending activities are supported by an appropriate form of valuation from the Society’s approved panel of valuers. All residential property must be insured to cover property risks and this may be done via a third party. Additional protection is also afforded to borrowers through optional income protection insurance. The Society has mortgage indemnity insurance in place for all new lending higher than 80% LTV, and for loans that fall outside of the standard lending policy.
Commercial Mortgages Commercial property is the Group’s main source of collateral and means of mitigating credit risk inherent in its commercial mortgage portfolio. Collateral for the majority of commercial loans comprises first legal charges over freehold and long leasehold property but guarantees and debentures may also be taken as security as well as cash on deposit. The Society will also seek assignment of rents from tenant covenants. Guarantees and other off-balance sheet security are not used in the calculation of Pillar 1 capital requirements therefore the exposure values before and after credit risk mitigation are identical. For property-based lending, supporting information such as professional valuations are an important tool to help determine the suitability of the security property and, in the case of investment lending, generating the cash to cover interest and repay the advance. All valuations are undertaken by members of an approved panel of external valuers with specialist experience where required. The Society has an in-house team working on the wind down of the commercial portfolio and this team is supplemented by the comprehensive use of external valuers and property experts that provide options analyses. The Society will pursue recovery of all shortfalls incurred where this is identified as being feasible and appropriate. The Society also ensures that appropriate insurance is taken out to protect security properties.
Pillar 3 Disclosures
38
8. Operational Risk Operational risk is defined on page 10. The Society calculates the Operational Risk Capital Requirement (ORCR), for Pillar I capital, under the standardised approach, as defined by the CRR. The ORCR is calculated by taking the Group’s three year average net interest and other income, split across discrete business lines, and applying percentages representing the regulators’ assumed risk inherent in these business lines. The Basel Committee on Banking Supervision is currently reviewing the adequacy of the capital requirements framework, with draft proposals to replace the previous Basic Indicator and Standardised Approach to calculating operational risk capital requirements with a new ‘revised standardised approach’. See section 1.2 for further detail.
8.1 Capital Requirement At 31 December 2017, the Group’s ORCR equated to 12.1% of net income (12.2% in 2016). The marginal reduction reflects the Group’s reducing commercial net interest income which attracts a higher operational risk weighting (15% weighting) than the Group’s growing ‘retail’ (residential) net interest income (12% weighting). The Group’s income has been split into 3 separate material business lines and the operational risk percentages as set out in Article 317 of the CRR applied to calculate the base ORCR. The ORCR provides the base for assessing the capital required for operational risk. A full assessment of the risks facing the Society and Group has been completed for the purposes of Pillar 2 and add-ons identified where it is felt that the Pillar 1 capital requirement is insufficient. The Group seeks to mitigate operational risk by implementing a strong control environment and ensuring adequate insurance cover is in place across all known high risk areas. For further detail see section 4 of this document, ‘Risk Management’.

Pillar 3 Disclosures
39
9. Market Risk
9.1 Market Risk Overview
The principal market risk to which the Group is exposed is interest rate risk.
9.2 Interest Rate Risk in the Non-trading Book
Interest Rate Risk arises on mortgages, savings and treasury instruments due to timing differences on
re-pricing of assets and liabilities and the imperfect matching on interest rates between different asset
and liability types. This risk is managed using financial instruments including derivatives. Natural
hedging strategies are also utilised e.g. matching two year fixed rate mortgages with two-year fixed rate
bonds.
The Group’s risk appetite for interest rate risk is documented in the treasury policy and includes limits
for the maximum adverse impact on net interest margin, maximum economic value at risk, basis risk,
as well as limits to minimise gaps in specific time buckets.
9.3 Use of Derivatives
Derivatives are only used to limit the extent to which the Group will be affected by changes in interest
rates or other indices which affect fair values or cash flows. Derivatives are therefore used exclusively
to hedge risk exposures although not all of the Society’s derivatives are designated as hedging
derivatives in formal accounting hedge relationships.
The principal derivatives used by the Group are interest rate exchange contracts, most commonly in
the form of interest rate swaps and basis risk swaps. The Group uses derivatives in accordance with
the Building Societies Act 1986. This means that such instruments are not used in trading activity or for
speculative purposes and, accordingly, they are used exclusively to reduce the risk of loss arising from
changes in interest rates. Note 30 of the Annual Report and Accounts gives details of the derivative
financial instruments held at 31 December 2017.
The Group’s treasury policy sets out processes and controls in place to manage interest rate risk,
including:
Monthly discussion and agreement at ALCO of the Group’s interest rate view;
Day to day review of exposures and market outlook by both the Treasury and Balance Sheet Management team and fine-tuning of ALCO’s view as appropriate;
All new mortgage and savings ranges are reviewed by the Balance Sheet Management team to assess the impact on interest margin and determine appropriate hedging activity;
Regular treasury strategy meetings to review hedging activity and assess the impact on sensitivity (both in terms of 200bp shock and margin impact for current year). Larger and non-parallel interest rate shifts incorporating behavioural assumptions are also undertaken quarterly and reported to both ALCO ad GRC;
Review of results of stress testing and resultant impact on annual profitability and overall value sensitivity;
Review of basis risk under static modelling scenarios; and
Monthly review of interest rate risk exposures and hedging by the Balance Sheet Management team, to review actual outcomes against plans for the month and allow hedging proposals to be formed.

Pillar 3 Disclosures
40
In assessing interest rate risk exposures relating to fixed-rate assets and liabilities it is necessary to
make assessments of likely prepayment rates. The risk of prepayment assumptions being inaccurate
is mitigated if too low, by additional unexpected early redemption charges, and if too high through
additional interest income or funding. The Group uses interest rate gap sensitivity analysis to assess
exposure to interest rate risk. This analysis shows the Group’s exposure to interest rate risk in terms of
the net risk after taking account of management action to hedge inherent exposures. The Group’s
Balance Sheet Management Department is responsible for reporting monthly the Group’s interest rate
risk exposure to ALCO.
The Group has established a risk appetite for sensitivity to a 200bp parallel shift in interest rates both
in terms of impact on reserves and annual net interest income. The impact for a 200bp parallel shift is
shown below:
+2% -2%
£m £m
At 31 December 2017
Next 12 months 2.6 -
Next 2 years 1.0 (1.0)
Next 3 years 2.2 (2.2)
Due to the low interest rate environment experienced over the last year, the rate shocks for interest rate reductions reported to ALCO are -10bp and -20bp. A hypothetical -200bp shock would not decrease the Society margin over the next 12 months. Details of the derivatives used to manage associated risks are given in the Risk Management Report in the Annual Report and Accounts and further details on the derivative financial instruments held at 31 December 2017 are given in note 30 of the Annual Report and Accounts. The Group has no material direct exposure to equity risk holding only a small portfolio of shares with a value of £0.4m at 31 December 2017.

Pillar 3 Disclosures
41
10. Remuneration
10.1 Remuneration Committee The Remuneration Committee has responsibility for ensuring compliance with the Regulators’ Remuneration Code and for approving disclosures included in this report in relation to remuneration. Further details are available within the Remuneration Committee Report on pages 28 to 31 of the Annual Report and Accounts. The Committee does not consult with the Society’s Members on its Executive remuneration policy but takes into account feedback given by Members. The Committee has for a number of years invited Members to vote on the annual remuneration report and Members have always voted in favour. In 2014, the Society voluntarily elected to adopt some of the changes to remuneration reporting that apply to UK listed companies and one of the factors that the Committee took into consideration was the opportunity to give Members a chance to vote on the Society’s remuneration policy. Members voted and gave their support (89.35% voted to approve the policy with 18,145 votes for, 2,163 against and 539 withheld) to the policy in April 2015 which took immediate effect. In accordance with the Code, the policy will be put forward for vote again in 2018. Member approval was given to the 31 December 2016 Directors’ Remuneration Report (90.99% approval with 16,143 votes for, 1,599 against and 329 withheld) in April 2017.
10.2 Code Staff Code Staff are currently defined as categories of staff including senior management, control functions
and any employee receiving total remuneration that takes them into the same remuneration bracket as
senior management, or whose professional activities have a material impact on the Group’s risk profile.
The table below shows the aggregate remuneration for Code Staff in relation to their services to the
Society and Group:

Pillar 3 Disclosures
42
Category Typical Functions
Number Fixed Variable Total
in Category Remuneration Remuneration Remuneration
During the
(Note 1)
Year £000 £000 £000
Executive Directors CEO, Finance Director
2017 4 781 19 800
& Deputy CEO, 2016 4 746 18 764
Strategy Planning &
Risk Director,
Customer Director
Senior Executives HR Director, 2017 3 290 9 299
MD NSML, 2016 6 500 13 513
MD NSSL
Control Functions Compliance, 2017 7 476 14 490
Underwriting, 2016 2 128 2 130
Internal Audit
Customer Outcomes,
Treasury,
Balance Sheet
Management and
Marketing
Total
2017 14 1,547 42 1,589
2016 12 1,374 33 1,407
Notes: 1. Variable remuneration reflects participation in the Group’s annual Corporate Bonus Scheme.
2. The Group has revised its interpretation of code staff during 2017 in line with the senior managers’ regime.
No introductory incentive payments were made during the financial year.
10.3 Decision Making Process for Determining the Remuneration Policy The Remuneration Committee considers and makes recommendations to the Board on Executive remuneration and conditions of employment, and also on the general framework of staff bonus schemes. The Committee met three times during 2017 and consists solely of Non-Executive directors; John Morris (Chairman), David Buffham and Karen Ingham. The Committee is responsible for the Society’s remuneration policy although, with the exception of Executive Directors, Executives and those designated as Code Staff, on a day to day basis the responsibility has been delegated to the Chief Executive for practical reasons. The Committee’s terms of reference are available online at https://www.newcastle.co.uk/about-us/governance/our-committees/ The Society’s remuneration policy is designed to provide competitive remuneration packages that
attract, retain and reward our senior team, to deliver business objectives in support of the Society’s
strategy whilst providing value for Members.

Pillar 3 Disclosures
43
10.4 Design Structure of the Remuneration System
Basic Salaries Remuneration packages are normally set at a level to attract, motivate and retain Executives, Officers and staff of the Society of the calibre necessary to oversee the operations of the Society. Basic salaries are normally set by taking into account salary levels within similar sized financial services organisations and the market as a whole, so as to attract and retain the skill levels that are appropriate to operate an organisation of the Society’s complexity. A 2.5% pay increase was received by all staff in April 2017. The Group commenced a ‘Pay and Grading Review’ exercise during 2017. The Pay and Grading Review was aligned with an extensive job evaluation exercise which was undertaken with external specialists, Willis Towers Watson. The review introduced a revised pay and grading structure helping to ensure fair remuneration, and competitive packages aligned to individual role profiles. The exercise was applied to each of the Group’s employees, except the Society’s Executive Directors. The Remuneration Committee has not yet implemented any change to Executive Director remuneration as a result of the exercise. No major structural decisions or changes relating to remuneration were made during 2017. Executive Directors, Executives and other Code Staff receive salaries. Non-Executive directors are paid fees set at a level appropriate to reflect the skills and time required to oversee the Society’s operations and progress. They receive a base fee and additional fees depending upon the Board Committees on which they sit or chair. Benefits All staff, including Executive Directors and Executives are eligible for membership of the Newcastle Building Society Group Personal Pension Scheme, which is a defined contribution scheme. All Code Staff receive a range of taxable benefits, which include a motor vehicle or cash equivalent, private health care, relocation benefits and the ability to participate in a concessionary mortgage scheme. No Executive participated in the concessionary mortgage scheme during the year. Life cover for a lump sum on death in service is also provided of four times basic salary.
10.5 Link Between Pay and Performance Performance Related Bonuses In recognition of the continued progress and achievements of the Society’s 2017 corporate key performance indicators (KPI’s), the Remuneration Committee approved a bonus payment under the Society’s Corporate Bonus Scheme at the end of 2017. The payment is to be made to all eligible staff. Determined against achievement of the current year’s KPIs, there is no consequent deferral of the bonus payment or vested element. Individual employee performance, as assessed though the Group’s annual appraisal process determines where in the eligible range individuals fall. The majority of staff received a 3% bonus with a small portion (15%) receiving an enhanced bonus payment of 6%. 4% of staff did not qualify for a bonus payment. Variable remuneration is limited to discretionary participation in the Society’s Corporate Bonus Scheme and none of the Society’s staff or Non-Executive Directors hold any interest in Shares or Options relating to the Group’s subsidiary companies. There is a requirement under Para 14 of the Society’s Rules to have deposits to the value of not less than £1,000 in a Society share account in order to qualify as a Director. This means all Directors are Members of the Society. There are no requirements for a Director to own shares in the Society’s Subsidiary companies. No formal approved ratio between fixed and variable remuneration is currently applicable to the Society’s Code staff. The KPI’s underpinning the Corporate Bonus Scheme include:

Pillar 3 Disclosures
44
• Financial performance covering Group profitability, capital, liquidity and credit risk; • Solutions business performance including complying with contract service level agreements; • Staff satisfaction and staff turnover; • Customer satisfaction and providing excellent service; and • Management, within risk appetite, of the Group’s top 10 risks. Progress against the corporate KPI’s is formally reviewed by the Remuneration Committee at the end of the financial year with progress being monitored by the Board on a monthly basis. Sales related incentive and bonus schemes were removed from the Society’s business in January 2013, with the exception of those staff employed by the Society’s subsidiary company Newcastle Financial Advisers Limited (NFAL). The bonus schemes which operate within NFAL are set in such a way as to ensure that they promote both good customer outcomes and the financial strength of the Group, do not reward failure and do not encourage any employee to take risks outwith the Society’s agreed risk appetite. The Remuneration Committee has monitored the operation of these bonus schemes throughout 2017 to ensure compliance with the Code and the Society’s remuneration policy statement. For further information around the Group’s management body including qualifications and experience, directorships held, recruitment and diversity policies, and committee representation, please refer to the 2017 Annual Report and Accounts available at https://www.newcastle.co.uk/about-us/media-centre/financial-results/.

Pillar 3 Disclosures
45
11. Encumbrance The European Banking Authority defines encumbrance to mean “pledging an asset or entering into any form of transaction to secure, collateralise or credit enhance any transaction from which it cannot be freely withdrawn.” The Group makes use of interest rate swaps to mitigate its exposure to interest rate risk as detailed in section 9 of this Pillar 3 report. Against the Group’s derivative liabilities cash collateral is pledged to the underlying counterparties to reduce their exposure to the Group. Similarly, cash collateral is received by the Group against its derivative assets to reduce the Group’s exposure to counterparties. Offsetting collateral is pledged in line with underlying Credit Support Annexes with the Group’s financial counterparties. Cash collateral pledged is considered to be encumbered as it is no longer under the legal ownership or control of the Group. Collateral posted is measured against counterparty mark-to-market values and may not reflect the Society's internal valuation of its financial instruments. The Group also makes use of repurchase agreements with banks in order to access funding. Non cash financial asset collateral, typically debt securities, is pledged to secure the funding with the assets pledged encumbered throughout the duration of the repurchase agreement in place. There were no debt securities pledged as collateral under repurchase agreements with banks that were considered to be encumbered at 31 December 2017 (2016: £nil at fair value). In the ordinary course of business, the Group may access market-wide facilities provided by central banks secured against non-cash collateral, including mortgage assets. Use of the facilities encumbers the assets pledged as collateral throughout the duration of the facility use. To secure funding, the Group enters into legal agreements where cash and other financial assets are pledged as collateral to reduce counterparty exposure to the Group. Counterparties are assigned primary legal charge over the agreed collateral assets in the unlikely event of a default. The Group’s encumbrance position as at 31 December 2017 is included in the following table. All figures are presented in £millions. The tables below present comparable information to the EBA Disclosure on asset encumbrance templates A and C. The following table is an extract of table F 32.01 – Assets of the reporting institution (AE-ASS):
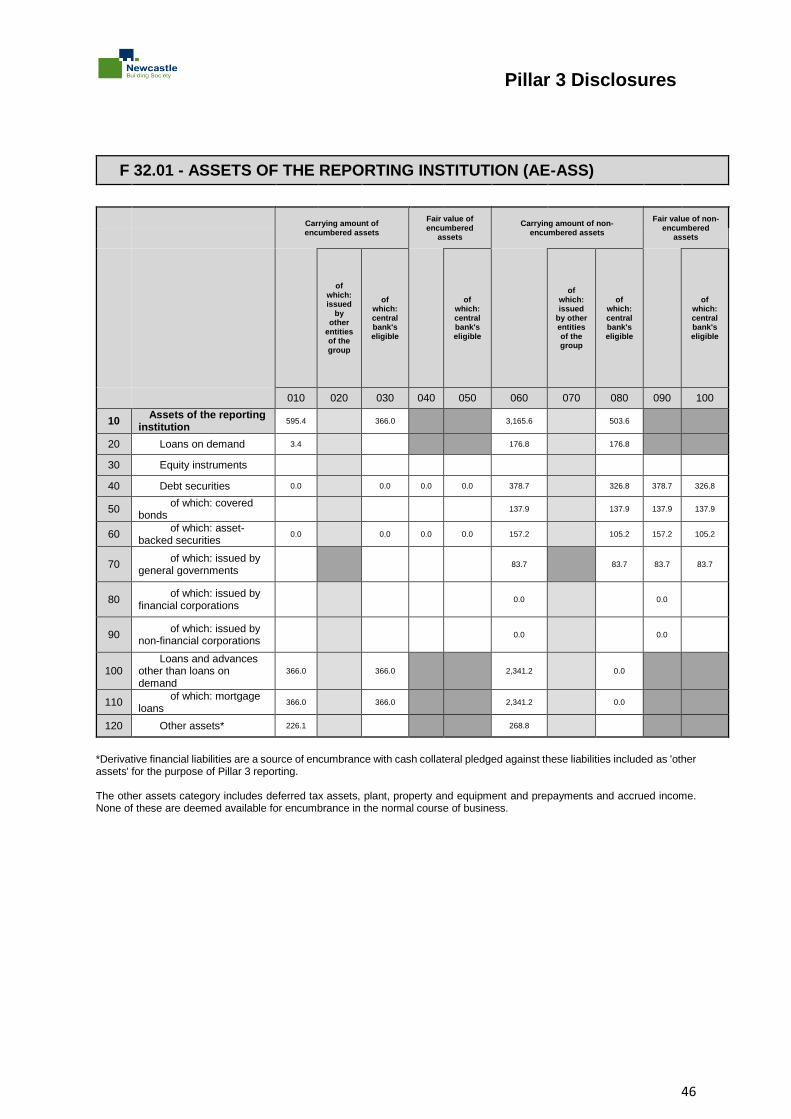
Pillar 3 Disclosures
46
F 32.01 - ASSETS OF THE REPORTING INSTITUTION (AE-ASS)
Carrying amount of encumbered assets
Fair value of encumbered
assets
Carrying amount of non-encumbered assets
Fair value of non-encumbered
assets
of which: issued
by other
entities of the group
of which: central bank's eligible
of which: central bank's eligible
of which: issued
by other entities of the group
of which: central bank's eligible
of which: central bank's eligible
010 020 030 040 050 060 070 080 090 100
10 Assets of the reporting
institution 595.4 366.0 3,165.6 503.6
20 Loans on demand 3.4 176.8 176.8
30 Equity instruments
40 Debt securities 0.0 0.0 0.0 0.0 378.7 326.8 378.7 326.8
50 of which: covered
bonds 137.9 137.9 137.9 137.9
60 of which: asset-
backed securities 0.0 0.0 0.0 0.0 157.2 105.2 157.2 105.2
70 of which: issued by
general governments 83.7 83.7 83.7 83.7
80 of which: issued by
financial corporations 0.0 0.0
90 of which: issued by
non-financial corporations 0.0 0.0
100 Loans and advances
other than loans on demand
366.0 366.0 2,341.2 0.0
110 of which: mortgage
loans 366.0 366.0 2,341.2 0.0
120 Other assets* 226.1 268.8
*Derivative financial liabilities are a source of encumbrance with cash collateral pledged against these liabilities included as 'other assets' for the purpose of Pillar 3 reporting. The other assets category includes deferred tax assets, plant, property and equipment and prepayments and accrued income. None of these are deemed available for encumbrance in the normal course of business.

Pillar 3 Disclosures
47
The following is an extract of table F 32.04- Sources of Encumbrance (AE-SOU):
F 32.04 - SOURCES OF ENCUMBRANCE (AE-SOU)
Matching liabilities,
contingent liabilities or securities lent
Assets, collateral received and own debt securities issued other than covered bonds
and ABSs encumbered
of which: from other entities of the group
of which: collateral
received re-used
of which: own debt securities
encumbered
010 020 030 040 050
10 Carrying amount of selected financial
liabilities 251.0 592.1
20 Derivatives 226.1
30 of which: Over-The-Counter
40 Deposits 251.0 366.0
50 Repurchase agreements 251.0 366.0
60 of which: central banks 251.0 366.0
70 Collateralised deposits other than
repurchase agreements
80 of which: central banks 0.0
90 Debt securities issued
100 of which: covered bonds issued
110 of which: asset-backed securities issued
120 Other sources of encumbrance 0.0 3.4
130 Nominal of loan commitments received
140 Nominal of financial guarantees received
150 Fair value of securities borrowed with non
cash-collateral
160 Other 3.4
170 TOTAL SOURCES OF ENCUMBRANCE 251.0 595.5
Encumbrance % at 31 December 2017: 15.8%
Pillar 3 Disclosures
48
12. Basel III: leverage ratio and transition
12.1 Leverage ratio An underlying feature of the financial crisis was the build-up of excessive on and off-balance sheet leverage in the banking system. In many cases, banks built up excessive leverage while maintaining their risk-based capital ratios. At the height of the crisis, the market forced the banking sector to reduce its leverage in a manner that amplified downward pressure on asset prices. This deleveraging process exacerbated the feedback loop between losses, falling bank capital, and shrinking credit availability. The Basel III reforms introduced a simple, transparent, non-risk based leverage ratio to act as a credible supplementary measure to the risk-based capital requirements. The leverage ratio is intended to:
restrict the build-up of leverage in the banking sector to avoid destabilising deleveraging processes that can damage the broader financial system and the economy; and
reinforce the risk-based requirements with a simple, non-risk-based backstop measure. The Basel Committee is of the view that:
a simple leverage ratio framework is critical and complementary to the risk-based capital framework; and
a credible leverage ratio is one that ensures broad and adequate capture of both on and off balance sheet leverage of banks.
The Society considers its leverage risk appetite on an annual basis with particular ratios agreed as appropriate across business as usual and stressed scenarios separately.
12.2 Transition Basel III came into force on 1 January 2014 alongside a number of transitional provisions. The table below shows the 31 December 2017 capital position under Basel III reporting including the existing transitional position and the end point position. The impact of Basel III on the Society is mainly in relation to Permanent Interest Bearing Shares (PIBS) which move from tier 1 to tier 2 capital over a transitional period. The un-wind of the Society’s subordinated debt under Basel III is similar to the position under Basel II. Other changes that have impacted the Society from 1 January 2014 include the deduction from Common Equity Tier 1 capital of deferred tax assets relating to trading losses, deductions in respect of intangible assets held on balance sheet and inclusion of the available for sale reserve in capital. The impact of Basel III has been reflected in the Group capital plans and the ICAAP. The Society makes use of natural hedging through matching funding against lending in place of structured derivative based interest rate risk mitigation wherever appropriate. With a consequently relatively muted holding of derivative financial instruments for risk purposes and no trading book, the Society limits its risk of excessive leverage through off-balance sheet holdings.

Pillar 3 Disclosures
49
Leverage ratio – Group 2017 2016
(Point in time at 31 December) (4) Transitional End point Transitional End point
Basel III £m Basel III £m Basel III £m Basel III £m
Common Equity Tier 1 capital (1) 182.5 182.5 169.8 169.8
Additional Tier 1 capital 15.0 - 18.0 -
Total Tier 1 capital 197.5 182.5 187.8 169.8
Additional Tier 2 capital (2) 27.7 33.2 33.6 33.3
Total capital 225.2 215.7 221.4 203.1
Total assets 3,551.0 3,551.0 3,381.2 3,381.2
Off balance sheet commitments 22.7 22.7 25.4 25.4
Potential future exposure (current exposure method, applying netting rules) – Derivatives 4.4 4.4 4.9 4.9
Fair value adjustments (3) 210.1 210.1 233.8 233.8
Total exposures 3,788.2 3, 788.2 3,643.1 3,643.1
Leverage ratio (Tier 1/Total exposures) 5.2% 4.7% 5.2% 4.7%
Capital ratios at 31 December
Total Risk Weighted Assets (RWA’s) 1, 193.0 1,193.0 1,186.2 1,186.2
Common Equity Tier 1 ratio 15.3% 15.3% 14.3% 14.3%
Tier 1 ratio 16.6% 15.3% 15.8% 14.3%
Solvency ratio (Total capital/RWA’s) 18.9% 18.1% 18.7% 17.1%
1. Deferred tax assets in respect of trading losses are expected to be zero at the Basel III end point. Also profits in respect
of future periods are not included in this figure – therefore the end point Basel III leverage ratio is expected to be higher than the figure disclosed above.
2. The above includes full amortisation of the subordinated debt over the Basel III transitional period but does not factor
in accumulated Group profits over a similar period or other capital transactions that could be undertaken. It presents an end point Basel III position using the 31 December 2016 Group balance sheet only assuming no movement in reserves or other capital tier 1 and 2 items.
3. Total assets above reflect the group’s total assets per the 2017 report and accounts excluding fair value adjustments
for hedged risk and the fair value of derivative assets held on the balance sheet.
4. The Group’s leverage ratio, calculated as the simple arithmetic mean of the monthly leverage ratio over a quarter, sits at 5.2% for the quarter to December 2017 under the Basel III transitional basis and at 4.7% under the fully loaded Basel III end point. The December 2017 leverage position is higher than the quarter to December average due to increasing Tier 1 capital through the year as verified profits become eligible for capital inclusion against a broadly stable risk weighted assets base.

Pillar 3 Disclosures
50
13. Capital instruments key features
Disclosure template for main features of regulatory capital instruments
Permanent Interest Bearing Shares (PIBS) Subordinated Debt
1 Issuer Newcastle Building Society
Newcastle Building Society
Newcastle Building Society
Newcastle Building Society
2
Unique identifier (e.g. CUSIP, ISIN, or Bloomberg identifier for private placement)
Private issue GB0006361371 GB0006371529 XS0178286901
3 Governing law(s) of the instrument
English English English English
Regulatory treatment
4 Transitional Basel III rules (1)
Additional Tier 1 / Tier 2
Additional Tier 1 / Tier 2
Additional Tier 1 / Tier 2
Tier 2
5 Post-transitional Basel III rules (2)
Tier 2 Tier 2 Tier 2 Tier 2
6 Eligible at solo/group/group & solo (3)
Group Group Group Group
7 Instrument type (types to be specified by each jurisdiction)
PIBS PIBS PIBS Subordinated Debt
8
Amount recognised in regulatory capital (Currency in millions, at of most recent reporting date)
10 10 10 14.6
9 Par value of instrument 10 10 10 25
9a Issue price 100.32% 100.45% 99.87%
10 Accounting classification Liability - amortised cost
Liability - amortised cost
Liability - amortised cost
Liability - amortised cost
11 Original date of issuance 18-Dec-08 22-Jun-93 15-Sep-92 31-Oct-03
12 Perpetual or dated Perpetual Perpetual Perpetual Dated
13 Original maturity date (4) No maturity No maturity No maturity 23-Dec-19
14 Issuer call subject to prior supervisory approval
Yes No No Yes
15 Optional call date, contingent call dates and redemption amount
Issuer call date 18 December 2018 (par)
No issuer call No issuer call Issuer call date 23 December 2014 (par)
16 Subsequent call dates, if applicable
On each subsequent interest payment date (30 June or 31 December)
n/a n/a n/a

Pillar 3 Disclosures
51
Coupons/dividends
17 Fixed or floating dividend/coupon
Fixed Fixed Fixed Fixed
18 Coupon rate and any related index
12.00% 10.75% 12.63% 3.85%
19 Existence of a dividend stopper Yes (5) Yes (6) Yes (6) No
20 Fully discretionary, partially discretionary or mandatory
Partially discretionary
Partially discretionary
Partially discretionary
Mandatory
21 Existence of a step up or other incentive to redeem
Yes (7) No No Yes (8)
22 Noncumulative or cumulative Noncumulative Noncumulative Noncumulative Noncumulative
23 Convertible or non-convertible Nonconvertible (9)
Nonconvertible Nonconvertible Nonconvertible
24 If convertible, conversion trigger(s)
n/a n/a n/a n/a
25 If convertible, fully or partially n/a n/a n/a n/a
26 If convertible, conversion rate n/a n/a n/a n/a
27 If convertible, mandatory or optional conversion
n/a n/a n/a n/a
28 If convertible, specify instrument type convertible into
n/a n/a n/a n/a
29 If convertible, specify issuer of instrument it converts into
n/a n/a n/a n/a
30 Write-down feature None contractual, statutory via bail-in
None contractual, statutory via bail-in
None contractual, statutory via bail-in
None contractual, statutory via bail-in
31 If write-down, write-down trigger(s)
n/a n/a n/a n/a
32 If write-down, full or partial n/a n/a n/a n/a
33 If write-down, permanent or temporary
n/a n/a n/a n/a
34 If temporary write-down, description of write-up mechanism
n/a n/a n/a n/a
35
Position in subordination hierarchy in liquidation (specify instrument type immediately senior to instrument)
Subordinated debt
Subordinated debt
Subordinated debt
Senior unsecured (10)
36 Non-compliant transitioned features
Yes No No Yes
37 If yes, specify non-compliant features
Step-up reset rate n/a n/a Step-up reset rate

Pillar 3 Disclosures
52
(1) PIBS transition out of AT1 capital into Tier 2 capital in line with the CRR's 'grandfathering' rules, falling fully to T2 capital instruments under fully implemented Basel III. (2) The capital values of the Society's subordinated debt issue is amortising straight line to nil over its remaining 5 years to maturity/call date. (3) The Newcastle Building Society accounting and regulatory groups are the same. (4) The 2008 PIBS issue can be called by the Society on 18 December 2018 by giving 30 to 60 days’ notice to the PIBS holders, subject to having gained regulatory consent in advance of sending the notices. (5) Should the Board pass a resolution delaying or requiring a reduction in the interest payment on an interest payment date and the Society is unable to issue Payment PIBS or Payment Successor securities, the Society shall not pay interest or dividend on any other class of Deferred Shares of the Society, other than any Mandatory PIBS, for a period of 12 months following the passing of such resolution. (6) Interest in respect of the PIBS shall not be paid or credited in respect of any interest period if the Society has at any time before the date for payment of the interest cancelled the payment of any interest or dividend upon any other shares of any class other than deferred shares, or any deposit (including subordinated debt) with the Society. (7) Step up 18 December 2018. (8) The Society's 2019 subordinated debt reached its optional reset date in 2014. (9) On 10 May 2010 the Society announced that a Capital Agreement (the Agreement) had been approved by holders of certain classes of the Society’s existing subordinated debt and permanent interest bearing shares. The Agreement involved adding a conversion feature such that the relevant instruments would convert into profit participating deferred shares (PPDS) should the Society’s core tier 1 capital ratio fall below 5%. In return for this feature an increase in coupon was agreed for each instrument. The Agreement further contained an upper trigger point for core tier I ratio whereby relevant instruments would cease to be convertible and the coupon uplift would fall away if the Society’s ratio exceeded 12%. In August 2014 the Society announced that it had exceeded the 12% Ceiling Trigger set out in the Capital Agreement. In accordance with the Agreement the instruments are no longer convertible and the coupon uplift has been removed, in addition the remaining unamortised capital exchange costs totalling £0.5m have been written off. (10) On a winding up, the subordinated notes rank behind the claims against the Society of all depositors, creditors and investing Members (other than holders of deferred shares i.e. PIBS) of the Society.

Pillar 3 Disclosures
53
Glossary of Terms
Arrears – A customer is in arrears when they are behind in their mortgage payments. A customer is 3 months in arrears when they have missed the equivalent of 3 monthly mortgage payments Basel III – The third of the Basel Accords, issued by the Basel Committee on Banking Supervision, which are a long term package of changes that will strengthen regulatory standards for capital and liquidity. The standards started to be phased in from 1 January 2014. Basel III became law in the EU Capital Requirements Directive, and was implemented in the UK via the PRA / FCA Handbooks. Capital Conservation Buffer is designed to ensure that a degree of excess capital is built up and retained, rather than used to support additional growth or further activities, during periods of non-stress which can be drawn down on if losses are incurred in the future. The Capital Conservation Buffer is being phased-in in equal increments of 0.625% each year until its final level of 2.5% in 2019 from a starting point in 2016 of 0.625%. Capital Planning Buffer – An amount of capital, calculated against a firm’s risk weighted assets that must be held in addition to the firm’s ICG. Designed to require excess capital to be held during non-stressed conditions that is then available in times of potential future loss. Common Equity Tier 1 Capital – Defined by the PRA as general reserves or qualifying capital instruments which for the Society is the accumulation of retained profits at 31 December 2016. Deferred taxation is deducted from the retained profits to calculate the final Common Equity Tier 1 Capital position. Countercyclical Buffer – An amount of capital, calculated against a firm’s risk weighted assets that must be held in addition to the firm’s ICG. Able to be varied over time to allow the ongoing provision of essential services, such as the supply of credit, to the real economy during times of stress. Counterparty Credit Risk – This is the risk that a counterparty to a transaction could default before final settlement of the transaction. Credit Risk - The risk that a customer or counterparty is unable to honour their repayment obligations as they fall due. CRR – Capital Resources Requirement, this is the minimum amount of capital resources that a financial institution must hold as set out in Basel III Pillar 1 rules. ICAAP – Internal Capital Adequacy Assessment Process. The Group’s own assessment of the levels of capital that it needs to hold in respect of the risks it faces under a business as usual scenario and a variety of stress scenarios. ICG – Individual Capital Guidance, guidance from the PRA on the minimum level of capital that must be held. This does not include capital buffers- against which the Group must also hold capital. Impaired loans – Loans where an event has occurred which indicates the Group does not expect to collect all the contractual cash flows due, or expects to collect them later than they are contractually due. Interest Rate Risk – This is the exposure to adverse movements in interest rates. Material – The CRR considers information in disclosures shall be regarded as material if its omission or misstatement could change or influence the assessment or decision of a user relying on that information for the purpose of making economic decisions. Operational Risk – The risk of loss arising from inadequate or failed internal processes, people and systems or from external events. Past due – Loans on which payments are overdue including those on which partial payments are being made.
Pillar 3 Disclosures
54
PIBS – Permanent Interest Bearing Shares, these are unsecured, deferred shares that are a form of Tier 1 and Tier 2 capital at 31 December 2016. PIBS rank behind the claims of all subordinated debt holders, depositors, payables and investing Members of the Newcastle Building Society. Pillar 1 – Pillar 1 of the Basel III framework addresses the total minimum capital requirements for Credit, Market and Operational Risks. Pillar 2 – This is the part of the Basel III framework which sets out the process by which financial institutions review their overall capital adequacy. Supervisors then evaluate how well financial institutions are assessing their risks and take appropriate actions in response to the assessments. This includes all risks, including Pillar 1 risks. The ICG is an outcome from Pillar 2. Pillar 3 – This is the part of the Basel III framework which sets out the disclosure requirements for firms to publish details of their risks, capital and risk management. This report is the outcome of the Pillar 3 process. Risk Weighted Assets (RWA) – The value of assets, after adjustment, under Basel III rules to reflect the degree of risk they represent. The Society measures RWA using the standardised approach. Standardised Approach – the basic method used to calculate credit risk capital requirements under Basel III. For Credit risk, the risk weights used in the calculation are based on the underlying risk and are determined by supervisory parameters. For operational risk, an average of three year historical net income is multiplied by a factor of 12-18%, depending on the underlying business being considered. Stress Testing – Various techniques used to gauge the potential vulnerability to exceptional but plausible events. Subordinated debt – A form of Tier 2 capital that is unsecured and ranks behind the claims of all depositors, creditors, and investing Members (other than holders of PIBS). Tier 1 Capital – Tier 1 capital is divided into Common Equity Tier 1 and Additional Tier 1 capital. Common Equity Tier 1 capital is defined above. Additional Tier 1 capital includes qualifying instruments such as PIBS. Tier 2 Capital – Comprises the Group’s qualifying subordinated debt and collective impairment allowance (for exposures treated on a Basel III standardised basis). Wrong way risk - Defined by the PRA as a situation where there is an adverse correlation between the counterparty’s probability of default and the mark-to-market value of an underlying transaction. The Society has no material exposure to wrong way risk as at 31 December 2017.