pilot evaluation of a prototype critical care blood glucose · pdf fileblood glucose monitor...
TRANSCRIPT
1233
Pilot Evaluation of a Prototype Critical Care Blood Glucose Monitor in Normal Volunteers
Marc C. Torjman, Ph.D.,1 Michael E. Goldberg, M.D.,1 Jeffrey J. Littman, M.D.,1 Robert A. Hirsh, M.D.,1 and Richard P. Dellinger, M.D.2
Author Affiliations: 1Department of Anesthesiology, Cooper University Hospital, The Robert Wood Johnson Medical School–UMDNJ, Camden, New Jersey; and 2Department of Medicine, Division of Critical Care Medicine, Cooper University Hospital, The Robert Wood Johnson Medical School, UMDNJ, Camden, New Jersey
Abbreviations: (ANOVA) analysis of variance, (BG) blood glucose, (BMI) body mass index, (FP) functional prototype, (IIT) intensive insulin therapy, (IV) intravenous, (MARD) mean absolute relative difference, (POCT) point-of-care testing, (YSI) Yellow Springs Instrument
Keywords: automated phlebotomy, glucose monitoring, glucose sampling, intensive care unit, intensive insulin therapy
Corresponding Author: Marc C. Torjman, Ph.D., Professor of Anesthesiology, The Robert Wood Johnson Medical School, UMDNJ, Director, Division of Research, Department of Anesthesiology, Cooper University Hospital, One Cooper Plaza , Camden, NJ 08103; email address [email protected]
Journal of Diabetes Science and Technology Volume 3, Issue 6, November 2009 © Diabetes Technology Society
SYMPOSIUM
AbstractBackground:Availability of a highly accurate in-hospital automated blood glucose (BG) monitor could facilitate implementation of intensive insulin therapy protocols through effective titration of insulin therapy, improved BG control, and avoidance of hypoglycemia. We evaluated a functional prototype BG monitor designed to perform frequent automated blood sampling for glucose monitoring.
Methods:Sixteen healthy adult volunteer subjects had intravenous catheter insertions in a forearm or hand vein and were studied for 8 hours. The prototype monitor consisted of an autosampling unit with a precise computer-controlled reversible syringe pump and a glucose analytical section. BG was referenced against a Yellow Springs Instrument (YSI) laboratory analyzer. Sampling errors for automated blood draws were assessed by calculating the percent of failed draws, and BG data were analyzed using the Bland and Altman technique.
Results:Out of 498 total sample draws, unsuccessful draws were categorized as follow: 11 (2.2%) were due to autosampler technical problems, 21 (4.2%) were due to catheter-related failures, and 37 (7.4%) were BG meter errors confirmed by a glucometer-generated error code. Blood draw difficulties or failures related to the catheter site (e.g., catheter occlusion or vein collapse) occurred in 6/15 (40%) subjects. Mean BG bias versus YSI was 0.20 ± 12.6 mg/dl, and mean absolute relative difference was 10.4%.
Conclusions:Automated phlebotomy can be performed in healthy subjects using this prototype BG monitor. The BG measurement technology had suboptimal accuracy based on a YSI reference. A more accurate BG point-of-care testing meter and strip technology have been incorporated into the future version of this monitor. Development of such a monitor could alleviate the burden of frequent BG testing and reduce the risk of hypoglycemia in patients on insulin therapy.
J Diabetes Sci Technol 2009;3(6):1233-1241
1234
Pilot Evaluation of a Prototype Critical Care Blood Glucose Monitor in Normal Volunteers Torjman
www.journalofdst.orgJ Diabetes Sci Technol Vol 3, Issue 6, November 2009
Introduction
Hyperglycemia and insulin resistance are common in critically ill and cardiac surgery patients, with or without diabetes. Since at least the 1980s, clinical studies have shown that normalization of blood glucose with intensive insulin therapy (IIT) may improve patient outcomes by reducing morbidity and mortality significantly.1–10 However, studies have reported controversial results in hospitalized patients maintained on various insulin protocols with reports of significant hypoglycemia.11–20 The untoward effects of hypoglycemia generated by glycemic control protocols may counterbalance, or even shift, potential benefits in the negative direction. This is more likely to occur with an aggressive target of 80–110 mg/dl (tight control). Although there is still a lack of consensus on a target blood glucose (BG) level in critically ill patients, some of the current recommendations advocate a less aggressive target of achieving BG levels around 140 mg/dl, with the caution that overtreatment of hyperglycemia is a major safety concern.21–26
Intensive insulin therapy protocols for surgical or intensive care unit patients typically recommend glucose testing at a frequency ranging from 30-minute intervals to every 4 hours, depending on the patient’s glucose level and other factors, such as insulin dosing, intraoperative events, or other conditions that might affect glucose metabolism. The most common technique for obtaining glucose measurements in patients on IIT is with point-of-care testing (POCT) BG meters. This technique requires frequent finger punctures for capillary sampling or the drawing of blood from an indwelling catheter. Regardless of which method is used, the process is labor-intensive27,28 and a recognized limitation to the practice of IIT.29–32 Availability of an in-hospital automated BG monitor could facilitate implementation of IIT protocols through more effective titration of insulin therapy, improved BG control, and avoidance of hypoglycemia.
We evaluated a functional prototype blood glucose monitor designed to perform frequent automated blood sampling for glucose monitoring. The blood samples can be obtained via an in-dwelling peripheral vein, or central access catheter. This first prototype (FP1) was developed by Glucon Inc. (now IntelliDx Inc., Santa Clara, CA) to assess the feasibility of automated phlebotomy in healthy volunteers. Examination focused on the operational aspects of the autosampler unit, feasibility of performing automated blood draws through a peripheral venous catheter, and BG measurement accuracy of this system.
Materials and Methods
Study DesignSixteen healthy adult volunteer subjects were recruited for this study following approval by the Cooper University Hospital Institutional Review Board. The device was approved for testing as a nonsignificant risk device in healthy volunteer subjects who received payment after completion of the study. All subjects had a preliminary interview with examination of both arms to assess venous access. The investigator selected subjects of various body sizes to determine the ability of the system to draw samples from smaller veins and catheters. Vein size was approximated and rated as <3 or ≥3 mm in diameter to differentiate smaller veins from average adult veins. The difficulty level of each catheter insertion was rated using a four-point scale by a single anesthesiologist who performed all intravenous (IV) cannulations. A zero (0) score was given for routine cannulation with no difficulty (single attempt); a score of 1 was assigned when some difficulty was encountered, such as having to redirect the catheter to find the vein; a 2 for difficult cannulations requiring a new skin puncture; and a 3 was scored after three failed attempts (discontinuation of the study subject). All IV catheter insertions were performed in a forearm or hand vein of the anesthesiologist’s choice. Assessment of vein size was obtained after tourniquet placement around the arm using a 15-cm transparent ruler. The IV catheter gauge (18, 20, or 22 gauge) was selected by the anesthesiologist based on routine clinical assessment of the venous access site. The catheters used were B. Braun Introcan Safety™ (B. Braun Medical Inc., Bethlehem, PA). Blood glucose levels were referenced against a Yellow Springs Instrument (YSI) 2300 (YSI Inc. Life Sciences, Yellow Springs, OH) glucose analyzer and a Prestige IQ BG meter (Home Diagnostics Inc., Ft. Lauderdale, FL). The FP1’s BG analytical technology is identical to that of the Prestige meter, therefore allowing direct comparison of this incorporated technology to the stand-alone meter. Recorded variables included BG concentrations, BG meter errors, blood draw failures, and autosampler failures.
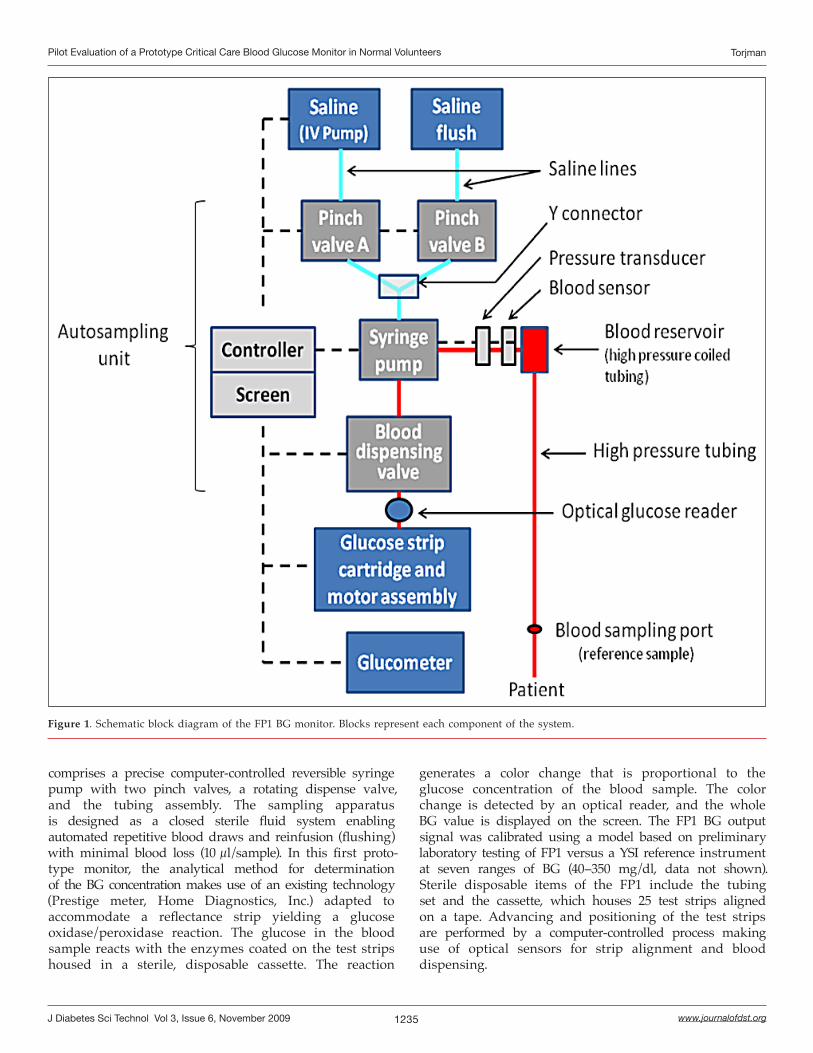
InstrumentationA functional research prototype labeled FP1 was used for this study (Figure 1). In brief, this glucose monitoring system consisted of an autosampling unit and a glucose analytical section encased in a metal housing designed to permit viewing of the blood path. The autosampler
1235
Pilot Evaluation of a Prototype Critical Care Blood Glucose Monitor in Normal Volunteers Torjman
www.journalofdst.orgJ Diabetes Sci Technol Vol 3, Issue 6, November 2009
comprises a precise computer-controlled reversible syringe pump with two pinch valves, a rotating dispense valve, and the tubing assembly. The sampling apparatus is designed as a closed sterile fluid system enabling automated repetitive blood draws and reinfusion (flushing) with minimal blood loss (10 µl/sample). In this first proto-type monitor, the analytical method for determination of the BG concentration makes use of an existing technology (Prestige meter, Home Diagnostics, Inc.) adapted to accommodate a reflectance strip yielding a glucose oxidase/peroxidase reaction. The glucose in the blood sample reacts with the enzymes coated on the test strips housed in a sterile, disposable cassette. The reaction
generates a color change that is proportional to the glucose concentration of the blood sample. The color change is detected by an optical reader, and the whole BG value is displayed on the screen. The FP1 BG output signal was calibrated using a model based on preliminary laboratory testing of FP1 versus a YSI reference instrument at seven ranges of BG (40–350 mg/dl, data not shown). Sterile disposable items of the FP1 include the tubing set and the cassette, which houses 25 test strips aligned on a tape. Advancing and positioning of the test strips are performed by a computer-controlled process making use of optical sensors for strip alignment and blood dispensing.
Figure 1. Schematic block diagram of the FP1 BG monitor. Blocks represent each component of the system.
1236
Pilot Evaluation of a Prototype Critical Care Blood Glucose Monitor in Normal Volunteers Torjman
www.journalofdst.orgJ Diabetes Sci Technol Vol 3, Issue 6, November 2009
The main unit of the FP1 system is positioned on a mobile pole close to the patient’s bed, similar to an infusion pump. The cassette is inserted into the main unit and is secured in place after system priming and calibration. The downstream end of the tubing set is connected to the subject’s vascular access site, while the upstream end is connected to two sterile nonheparinized saline (0.9%) fluid bags. One bag serves to deliver a slow infusion (15–20 ml/hr) in order to maintain patency of the intravenous tubing and catheter, while the second bag is used for flushing of the tubing after a sample is taken. A 4-ml saline flush was set for blood evacuation from the tubing. The sampling interval may be programmed at a frequency of ≥3 minutes, but for this study, sampling was initiated manually to obtain four samples per hour. This manual sampling technique was necessary to obtain a 600-µl reference blood sample by momentarily pausing the sampling cycle prior to initiation of the saline flush cycle. The reference sample was drawn manually from a needleless access port located 12 inches from the peripheral catheter site. Sample draw and flush cycles could be selected as continuous or variable rate using preprogrammed pump control algorithms. A draw pressure profile was generated online, allowing monitoring of draw and reinfuse pressures, as well as information on the blood-to-saline content of the sample received from an optical sensor positioned near the sample dispense valve (see Figure 1).
Testing ProceduresThe study was carried out in a dedicated area of the same day surgery unit at Cooper University Hospital. Subjects could ambulate as necessary and had access to food, water, and a television if so desired. A nurse and an attending anesthesiologist were responsible for the subject’s medical care.
The experiment began at approximately 7 a.m. after an overnight fast to obtain initial BG levels in the normal range. The three BG analyzers were calibrated within 1 hour of the subject’s arrival using appropriate control solutions purchased from the respective manufacturers. The subject was positioned on a hospital bed with the head of the bed raised to 45º. A 15-minute resting period allowed recording of vital signs (blood pressure, heart rate, respiratory rate, temperature) followed by intravenous catheter insertion. The FP1 was connected to the subject’s intravenous catheter and normal saline was infused for line flushing. Blood draws were performed at ~15-minute intervals for 8 hours, and both FP1 and Prestige were immediately referenced against a YSI 2300 BG analyzer. After approximately 1 hour of sampling, a breakfast meal was provided to the subject followed by lunch (noon) and a late afternoon snack (1500–1600 hour), respectively. Subjects were permitted to ambulate as necessary and use restroom
facilities after disconnecting and capping the patient’s intravenous port.
All reference measurements were obtained from a single draw with a 1-ml syringe from the sampling access port close to the intravenous catheter. The blood volume required by instrumentation was as follows: YSI, 300 µl; FP1, 10 µl; and Prestige, 10 µl.
Statistical AnalysesSampling errors for the automated blood draws were assessed by calculating the percent of failed draws classified into three categories: (1) autosampler technical errors, (2) occlusions at the catheter site, and (3) glucometer errors confirmed by meter error code. BG data were analyzed using the Bland and Altman technique to determine the BG accuracy of FP1, compared to the YSI reference, and the Prestige POCT BG meter. Mean absolute relative difference (MARD) was calculated to determine instruments’ errors versus the YSI reference. Correlation analysis was used to examine the relationships among FP1, Prestige, and YSI reference measurements. Blood glucose bias differences among instruments were analyzed by one- and two-way analysis of variance (ANOVA) with BG and instruments as independent factors in the statistical model. A power analysis was performed (ANOVA) to determine the sample size required to detect a mean BG difference of 2 mg/dl versus YSI BG (three groups). The within cell SD of differences was set at 15 mg/dl, yielding a total of 362 samples per cell (β = 0.80, α = 0.05). Data were reported as means ± SD with p < 0.05 considered statistically significant. Statistical analyses were performed using Systat Software version 11 (Systat Software Inc., Chicago, IL).
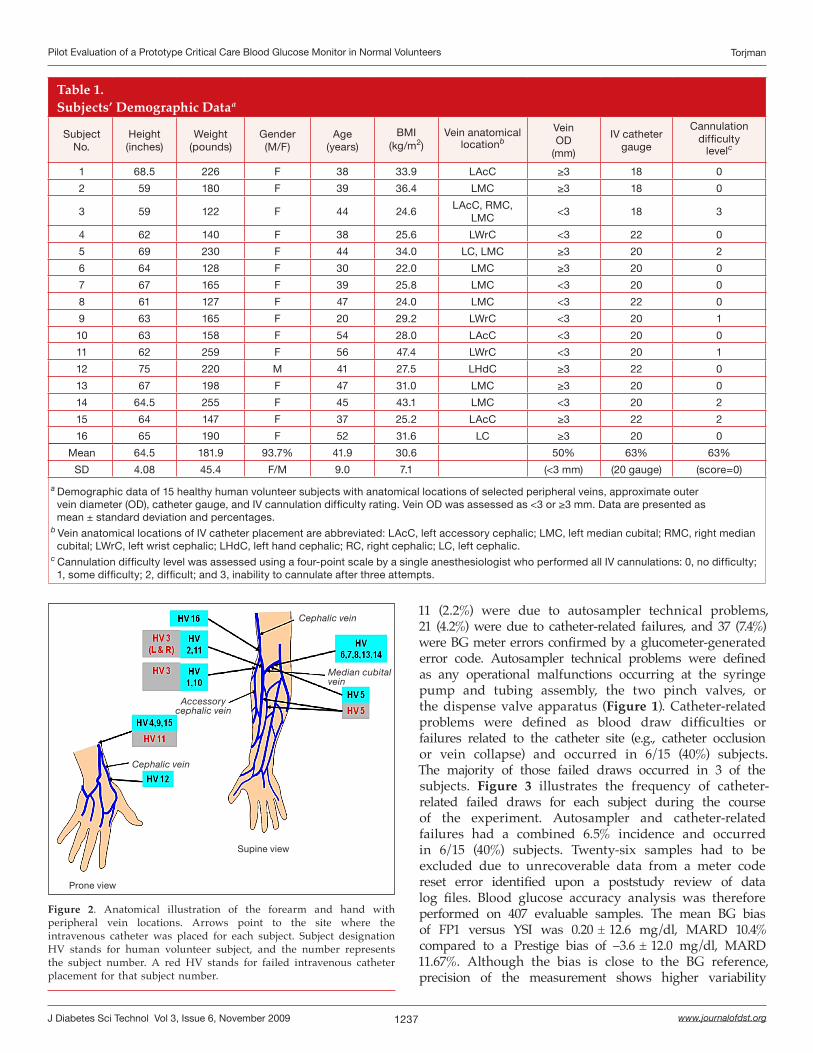
ResultsFifteen out of 16 subjects (1/15 male/female), aged 20–56 years (mean 41.9 ± 9.0), and body mass index (BMI) 22–36 kg/m2 (mean 30.6 ± 7.1) completed the 8-hour study protocol without any difficulty. One female subject had unsuccessful venous catheter insertion after three attempts and was withdrawn from the study. This subject was a petite female (height 59 inches, BMI 24.6 kg/m2) noted to have impalpable veins after tourniquet application. Subjects’ demographic data are presented in Table 1. Intravenous catheter anatomical locations and catheter sizes are shown in Figure 2.
Peripheral vein outer diameters were distributed evenly among subjects with 8/16 (50%) having veins <3 mm and the other 50% with veins ≥3 mm. The BG ranged from 60 to 150 mg/dl (mean 92 ± 24 mg/dl) based on the YSI whole blood glucose reference. Out of 498 total sample draws, unsuccessful draws were categorized as follows:
1237
Pilot Evaluation of a Prototype Critical Care Blood Glucose Monitor in Normal Volunteers Torjman
www.journalofdst.orgJ Diabetes Sci Technol Vol 3, Issue 6, November 2009
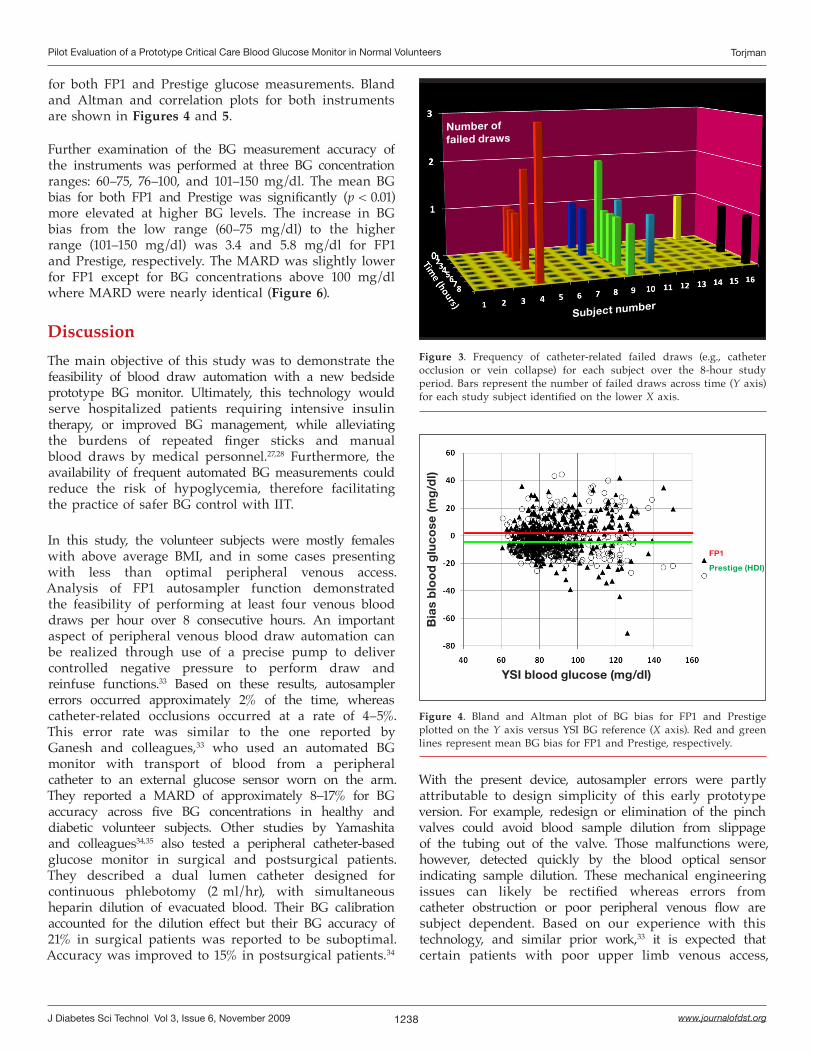
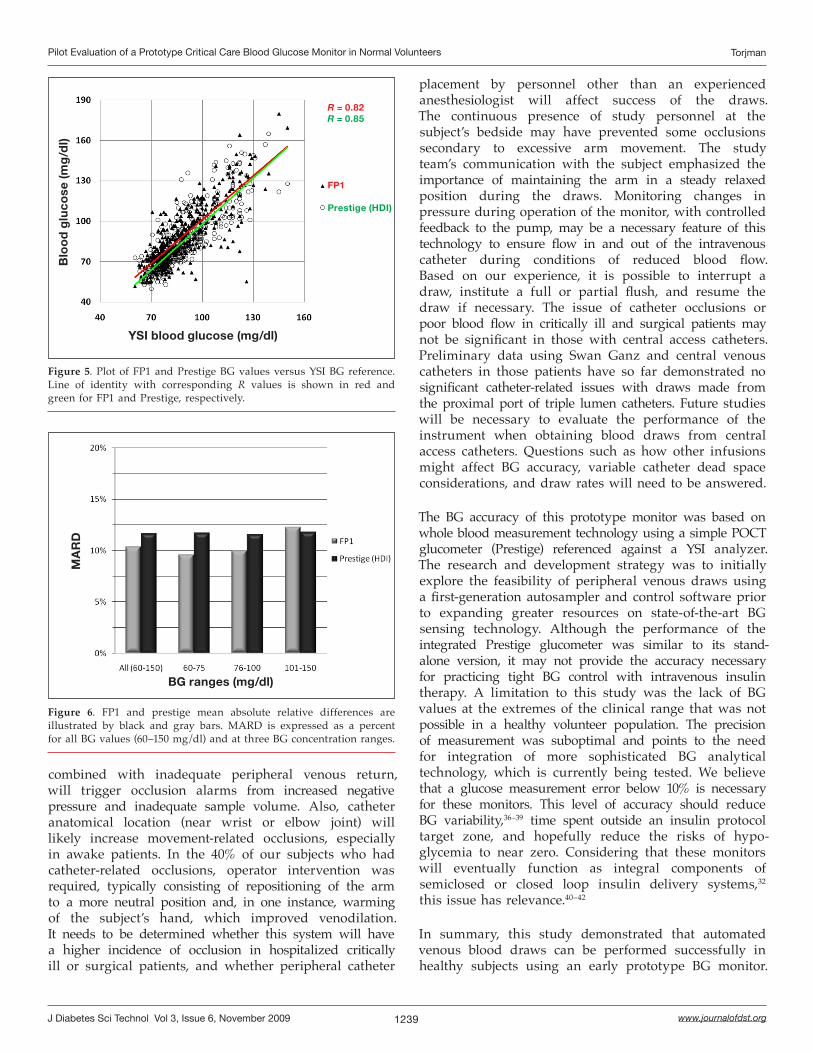
11 (2.2%) were due to autosampler technical problems, 21 (4.2%) were due to catheter-related failures, and 37 (7.4%) were BG meter errors confirmed by a glucometer-generated error code. Autosampler technical problems were defined as any operational malfunctions occurring at the syringe pump and tubing assembly, the two pinch valves, or the dispense valve apparatus (Figure 1). Catheter-related problems were defined as blood draw difficulties or failures related to the catheter site (e.g., catheter occlusion or vein collapse) and occurred in 6/15 (40%) subjects. The majority of those failed draws occurred in 3 of the subjects. Figure 3 illustrates the frequency of catheter-related failed draws for each subject during the course of the experiment. Autosampler and catheter-related failures had a combined 6.5% incidence and occurred in 6/15 (40%) subjects. Twenty-six samples had to be excluded due to unrecoverable data from a meter code reset error identified upon a poststudy review of data log files. Blood glucose accuracy analysis was therefore performed on 407 evaluable samples. The mean BG bias of FP1 versus YSI was 0.20 ± 12.6 mg/dl, MARD 10.4% compared to a Prestige bias of –3.6 ± 12.0 mg/dl, MARD 11.67%. Although the bias is close to the BG reference, precision of the measurement shows higher variability
Table 1.Subjects’ Demographic Dataa
Subject No.
Height (inches)
Weight (pounds)
Gender(M/F)
Age(years)
BMI(kg/m2)
Vein anatomical locationb
Vein OD
(mm)
IV cathetergauge
Cannulation difficulty
levelc
1 68.5 226 F 38 33.9 LAcC ≥3 18 0
2 59 180 F 39 36.4 LMC ≥3 18 0
3 59 122 F 44 24.6LAcC, RMC,
LMC<3 18 3
4 62 140 F 38 25.6 LWrC <3 22 0
5 69 230 F 44 34.0 LC, LMC ≥3 20 2
6 64 128 F 30 22.0 LMC ≥3 20 0
7 67 165 F 39 25.8 LMC <3 20 0
8 61 127 F 47 24.0 LMC <3 22 0
9 63 165 F 20 29.2 LWrC <3 20 1
10 63 158 F 54 28.0 LAcC <3 20 0
11 62 259 F 56 47.4 LWrC <3 20 1
12 75 220 M 41 27.5 LHdC ≥3 22 0
13 67 198 F 47 31.0 LMC ≥3 20 0
14 64.5 255 F 45 43.1 LMC <3 20 2
15 64 147 F 37 25.2 LAcC ≥3 22 2
16 65 190 F 52 31.6 LC ≥3 20 0
Mean 64.5 181.9 93.7% 41.9 30.6 50% 63% 63%
SD 4.08 45.4 F/M 9.0 7.1 (<3 mm) (20 gauge) (score=0)
a Demographic data of 15 healthy human volunteer subjects with anatomical locations of selected peripheral veins, approximate outer vein diameter (OD), catheter gauge, and IV cannulation difficulty rating. Vein OD was assessed as <3 or ≥3 mm. Data are presented as mean ± standard deviation and percentages.
b Vein anatomical locations of IV catheter placement are abbreviated: LAcC, left accessory cephalic; LMC, left median cubital; RMC, right median cubital; LWrC, left wrist cephalic; LHdC, left hand cephalic; RC, right cephalic; LC, left cephalic.
c Cannulation difficulty level was assessed using a four-point scale by a single anesthesiologist who performed all IV cannulations: 0, no difficulty; 1, some difficulty; 2, difficult; and 3, inability to cannulate after three attempts.
Figure 2. Anatomical illustration of the forearm and hand with peripheral vein locations. Arrows point to the site where the intravenous catheter was placed for each subject. Subject designation HV stands for human volunteer subject, and the number represents the subject number. A red HV stands for failed intravenous catheter placement for that subject number.
Cephalic vein
Median cubital vein
Accessory cephalic vein
Cephalic vein
Supine view
Prone view
1238
Pilot Evaluation of a Prototype Critical Care Blood Glucose Monitor in Normal Volunteers Torjman
www.journalofdst.orgJ Diabetes Sci Technol Vol 3, Issue 6, November 2009
With the present device, autosampler errors were partly attributable to design simplicity of this early prototype version. For example, redesign or elimination of the pinch valves could avoid blood sample dilution from slippage of the tubing out of the valve. Those malfunctions were, however, detected quickly by the blood optical sensor indicating sample dilution. These mechanical engineering issues can likely be rectified whereas errors from catheter obstruction or poor peripheral venous flow are subject dependent. Based on our experience with this technology, and similar prior work,33 it is expected that certain patients with poor upper limb venous access,
Figure 3. Frequency of catheter-related failed draws (e.g., catheter occlusion or vein collapse) for each subject over the 8-hour study period. Bars represent the number of failed draws across time (Y axis) for each study subject identified on the lower X axis.
Number of failed draws
Subject number
YSI blood glucose (mg/dl)
FP1
Prestige (HDI)
Bia
s b
loo
d g
luco
se (m
g/d
l)
Figure 4. Bland and Altman plot of BG bias for FP1 and Prestige plotted on the Y axis versus YSI BG reference (X axis). Red and green lines represent mean BG bias for FP1 and Prestige, respectively.
for both FP1 and Prestige glucose measurements. Bland and Altman and correlation plots for both instruments are shown in Figures 4 and 5.
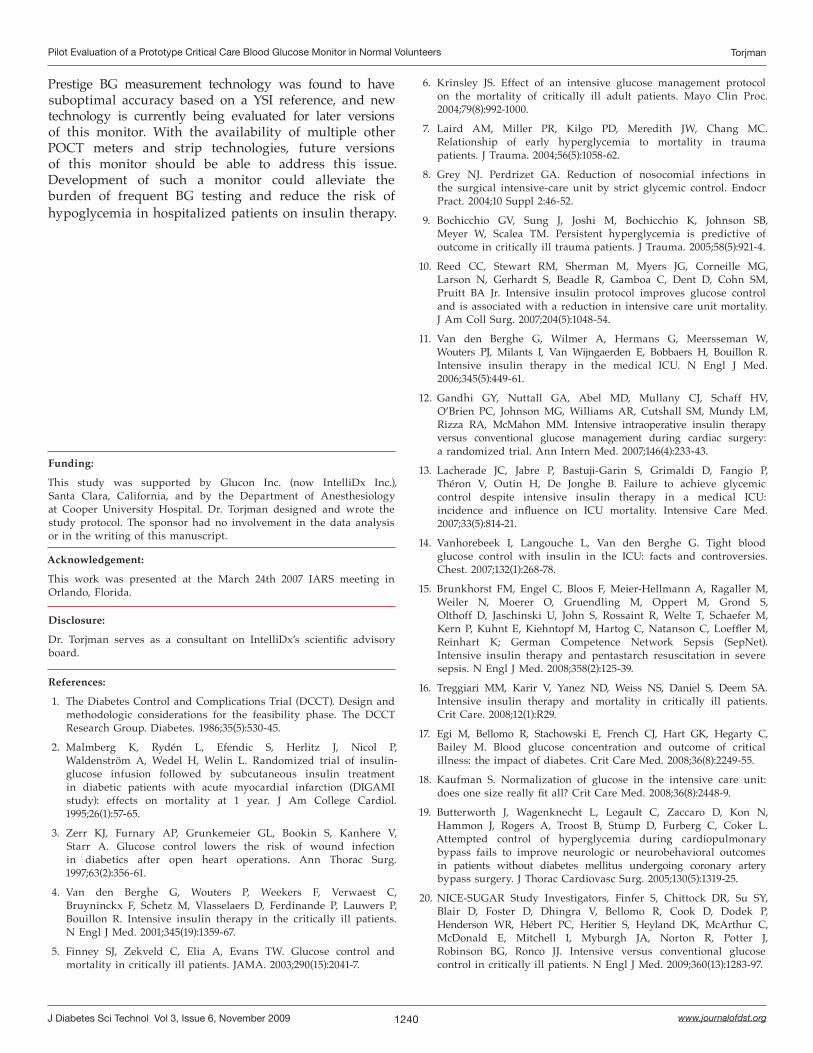
Further examination of the BG measurement accuracy of the instruments was performed at three BG concentration ranges: 60–75, 76–100, and 101–150 mg/dl. The mean BG bias for both FP1 and Prestige was significantly (p < 0.01) more elevated at higher BG levels. The increase in BG bias from the low range (60–75 mg/dl) to the higher range (101–150 mg/dl) was 3.4 and 5.8 mg/dl for FP1 and Prestige, respectively. The MARD was slightly lower for FP1 except for BG concentrations above 100 mg/dl where MARD were nearly identical (Figure 6).
DiscussionThe main objective of this study was to demonstrate the feasibility of blood draw automation with a new bedside prototype BG monitor. Ultimately, this technology would serve hospitalized patients requiring intensive insulin therapy, or improved BG management, while alleviating the burdens of repeated finger sticks and manual blood draws by medical personnel.27,28 Furthermore, the availability of frequent automated BG measurements could reduce the risk of hypoglycemia, therefore facilitating the practice of safer BG control with IIT.
In this study, the volunteer subjects were mostly females with above average BMI, and in some cases presenting with less than optimal peripheral venous access. Analysis of FP1 autosampler function demonstrated the feasibility of performing at least four venous blood draws per hour over 8 consecutive hours. An important aspect of peripheral venous blood draw automation can be realized through use of a precise pump to deliver controlled negative pressure to perform draw and reinfuse functions.33 Based on these results, autosampler errors occurred approximately 2% of the time, whereas catheter-related occlusions occurred at a rate of 4–5%. This error rate was similar to the one reported by Ganesh and colleagues,33 who used an automated BG monitor with transport of blood from a peripheral catheter to an external glucose sensor worn on the arm. They reported a MARD of approximately 8–17% for BG accuracy across five BG concentrations in healthy and diabetic volunteer subjects. Other studies by Yamashita and colleagues34,35 also tested a peripheral catheter-based glucose monitor in surgical and postsurgical patients. They described a dual lumen catheter designed for continuous phlebotomy (2 ml/hr), with simultaneous heparin dilution of evacuated blood. Their BG calibration accounted for the dilution effect but their BG accuracy of 21% in surgical patients was reported to be suboptimal. Accuracy was improved to 15% in postsurgical patients.34
1239
Pilot Evaluation of a Prototype Critical Care Blood Glucose Monitor in Normal Volunteers Torjman
www.journalofdst.orgJ Diabetes Sci Technol Vol 3, Issue 6, November 2009
combined with inadequate peripheral venous return, will trigger occlusion alarms from increased negative pressure and inadequate sample volume. Also, catheter anatomical location (near wrist or elbow joint) will likely increase movement-related occlusions, especially in awake patients. In the 40% of our subjects who had catheter-related occlusions, operator intervention was required, typically consisting of repositioning of the arm to a more neutral position and, in one instance, warming of the subject’s hand, which improved venodilation. It needs to be determined whether this system will have a higher incidence of occlusion in hospitalized critically ill or surgical patients, and whether peripheral catheter
placement by personnel other than an experienced anesthesiologist will affect success of the draws. The continuous presence of study personnel at the subject’s bedside may have prevented some occlusions secondary to excessive arm movement. The study team’s communication with the subject emphasized the importance of maintaining the arm in a steady relaxed position during the draws. Monitoring changes in pressure during operation of the monitor, with controlled feedback to the pump, may be a necessary feature of this technology to ensure flow in and out of the intravenous catheter during conditions of reduced blood flow. Based on our experience, it is possible to interrupt a draw, institute a full or partial flush, and resume the draw if necessary. The issue of catheter occlusions or poor blood flow in critically ill and surgical patients may not be significant in those with central access catheters. Preliminary data using Swan Ganz and central venous catheters in those patients have so far demonstrated no significant catheter-related issues with draws made from the proximal port of triple lumen catheters. Future studies will be necessary to evaluate the performance of the instrument when obtaining blood draws from central access catheters. Questions such as how other infusions might affect BG accuracy, variable catheter dead space considerations, and draw rates will need to be answered.
The BG accuracy of this prototype monitor was based on whole blood measurement technology using a simple POCT glucometer (Prestige) referenced against a YSI analyzer. The research and development strategy was to initially explore the feasibility of peripheral venous draws using a first-generation autosampler and control software prior to expanding greater resources on state-of-the-art BG sensing technology. Although the performance of the integrated Prestige glucometer was similar to its stand-alone version, it may not provide the accuracy necessary for practicing tight BG control with intravenous insulin therapy. A limitation to this study was the lack of BG values at the extremes of the clinical range that was not possible in a healthy volunteer population. The precision of measurement was suboptimal and points to the need for integration of more sophisticated BG analytical technology, which is currently being tested. We believe that a glucose measurement error below 10% is necessary for these monitors. This level of accuracy should reduce BG variability,36–39 time spent outside an insulin protocol target zone, and hopefully reduce the risks of hypo-glycemia to near zero. Considering that these monitors will eventually function as integral components of semiclosed or closed loop insulin delivery systems,32 this issue has relevance.40–42
In summary, this study demonstrated that automated venous blood draws can be performed successfully in healthy subjects using an early prototype BG monitor.
YSI blood glucose (mg/dl)
R = 0.82R = 0.85
FP1
Prestige (HDI)
Blo
od
glu
cose
(mg
/dl)
Figure 5. Plot of FP1 and Prestige BG values versus YSI BG reference. Line of identity with corresponding R values is shown in red and green for FP1 and Prestige, respectively.
BG ranges (mg/dl)
MA
RD
Figure 6. FP1 and prestige mean absolute relative differences are illustrated by black and gray bars. MARD is expressed as a percent for all BG values (60–150 mg/dl) and at three BG concentration ranges.
1240
Pilot Evaluation of a Prototype Critical Care Blood Glucose Monitor in Normal Volunteers Torjman
www.journalofdst.orgJ Diabetes Sci Technol Vol 3, Issue 6, November 2009
Prestige BG measurement technology was found to have suboptimal accuracy based on a YSI reference, and new technology is currently being evaluated for later versions of this monitor. With the availability of multiple other POCT meters and strip technologies, future versions of this monitor should be able to address this issue. Development of such a monitor could alleviate the burden of frequent BG testing and reduce the risk of hypoglycemia in hospitalized patients on insulin therapy.
Funding:
This study was supported by Glucon Inc. (now IntelliDx Inc.), Santa Clara, California, and by the Department of Anesthesiology at Cooper University Hospital. Dr. Torjman designed and wrote the study protocol. The sponsor had no involvement in the data analysis or in the writing of this manuscript.
Acknowledgement:
This work was presented at the March 24th 2007 IARS meeting in Orlando, Florida.
Disclosure:
Dr. Torjman serves as a consultant on IntelliDx’s scientific advisory board.
References:
1. The Diabetes Control and Complications Trial (DCCT). Design and methodologic considerations for the feasibility phase. The DCCT Research Group. Diabetes. 1986;35(5):530-45.
2. Malmberg K, Rydén L, Efendic S, Herlitz J, Nicol P, Waldenström A, Wedel H, Welin L. Randomized trial of insulin-glucose infusion followed by subcutaneous insulin treatment in diabetic patients with acute myocardial infarction (DIGAMI study): effects on mortality at 1 year. J Am College Cardiol. 1995;26(1):57-65.
3. Zerr KJ, Furnary AP, Grunkemeier GL, Bookin S, Kanhere V, Starr A. Glucose control lowers the risk of wound infection in diabetics after open heart operations. Ann Thorac Surg. 1997;63(2):356-61.
4. Van den Berghe G, Wouters P, Weekers F, Verwaest C, Bruyninckx F, Schetz M, Vlasselaers D, Ferdinande P, Lauwers P, Bouillon R. Intensive insulin therapy in the critically ill patients. N Engl J Med. 2001;345(19):1359-67.
5. Finney SJ, Zekveld C, Elia A, Evans TW. Glucose control and mortality in critically ill patients. JAMA. 2003;290(15):2041-7.
6. Krinsley JS. Effect of an intensive glucose management protocol on the mortality of critically ill adult patients. Mayo Clin Proc. 2004;79(8):992-1000.
7. Laird AM, Miller PR, Kilgo PD, Meredith JW, Chang MC. Relationship of early hyperglycemia to mortality in trauma patients. J Trauma. 2004;56(5):1058-62.
8. Grey NJ. Perdrizet GA. Reduction of nosocomial infections in the surgical intensive-care unit by strict glycemic control. Endocr Pract. 2004;10 Suppl 2:46-52.
9. Bochicchio GV, Sung J, Joshi M, Bochicchio K, Johnson SB, Meyer W, Scalea TM. Persistent hyperglycemia is predictive of outcome in critically ill trauma patients. J Trauma. 2005;58(5):921-4.
10. Reed CC, Stewart RM, Sherman M, Myers JG, Corneille MG, Larson N, Gerhardt S, Beadle R, Gamboa C, Dent D, Cohn SM, Pruitt BA Jr. Intensive insulin protocol improves glucose control and is associated with a reduction in intensive care unit mortality. J Am Coll Surg. 2007;204(5):1048-54.
11. Van den Berghe G, Wilmer A, Hermans G, Meersseman W, Wouters PJ, Milants I, Van Wijngaerden E, Bobbaers H, Bouillon R. Intensive insulin therapy in the medical ICU. N Engl J Med. 2006;345(5):449-61.
12. Gandhi GY, Nuttall GA, Abel MD, Mullany CJ, Schaff HV, O’Brien PC, Johnson MG, Williams AR, Cutshall SM, Mundy LM, Rizza RA, McMahon MM. Intensive intraoperative insulin therapy versus conventional glucose management during cardiac surgery: a randomized trial. Ann Intern Med. 2007;146(4):233-43.
13. Lacherade JC, Jabre P, Bastuji-Garin S, Grimaldi D, Fangio P, Théron V, Outin H, De Jonghe B. Failure to achieve glycemic control despite intensive insulin therapy in a medical ICU: incidence and influence on ICU mortality. Intensive Care Med. 2007;33(5):814-21.
14. Vanhorebeek I, Langouche L, Van den Berghe G. Tight blood glucose control with insulin in the ICU: facts and controversies. Chest. 2007;132(1):268-78.
15. Brunkhorst FM, Engel C, Bloos F, Meier-Hellmann A, Ragaller M, Weiler N, Moerer O, Gruendling M, Oppert M, Grond S, Olthoff D, Jaschinski U, John S, Rossaint R, Welte T, Schaefer M, Kern P, Kuhnt E, Kiehntopf M, Hartog C, Natanson C, Loeffler M, Reinhart K; German Competence Network Sepsis (SepNet). Intensive insulin therapy and pentastarch resuscitation in severe sepsis. N Engl J Med. 2008;358(2):125-39.
16. Treggiari MM, Karir V, Yanez ND, Weiss NS, Daniel S, Deem SA. Intensive insulin therapy and mortality in critically ill patients. Crit Care. 2008;12(1):R29.
17. Egi M, Bellomo R, Stachowski E, French CJ, Hart GK, Hegarty C, Bailey M. Blood glucose concentration and outcome of critical illness: the impact of diabetes. Crit Care Med. 2008;36(8):2249-55.
18. Kaufman S. Normalization of glucose in the intensive care unit: does one size really fit all? Crit Care Med. 2008;36(8):2448-9.
19. Butterworth J, Wagenknecht L, Legault C, Zaccaro D, Kon N, Hammon J, Rogers A, Troost B, Stump D, Furberg C, Coker L. Attempted control of hyperglycemia during cardiopulmonary bypass fails to improve neurologic or neurobehavioral outcomes in patients without diabetes mellitus undergoing coronary artery bypass surgery. J Thorac Cardiovasc Surg. 2005;130(5):1319-25.
20. NICE-SUGAR Study Investigators, Finfer S, Chittock DR, Su SY, Blair D, Foster D, Dhingra V, Bellomo R, Cook D, Dodek P, Henderson WR, Hébert PC, Heritier S, Heyland DK, McArthur C, McDonald E, Mitchell I, Myburgh JA, Norton R, Potter J, Robinson BG, Ronco JJ. Intensive versus conventional glucose control in critically ill patients. N Engl J Med. 2009;360(13):1283-97.

1241
Pilot Evaluation of a Prototype Critical Care Blood Glucose Monitor in Normal Volunteers Torjman
www.journalofdst.orgJ Diabetes Sci Technol Vol 3, Issue 6, November 2009
21. Malhotra A. Intensive insulin in intensive care. N Engl J Med. 2006;354(5):516-8.
22. Moghissi E, Korytkowski M, DiNardo M, Einhorn D, Hellman R, Hirsch IB, Inzucchi, SE, Ismail-Beigi F, Kirkman MS, Umpierrez GE; American Association of Clinical Endocrinologists; American Diabetes Association. American Association of Clinical Endocrinologists and American Diabetes Association consensus statement on inpatient glycemic control. Endocr Prac. 2009;15(4):353-69.
23. Dellinger RP, Levy MM, Carlet JM, Bion J, Parker MM, Jaeschke R, Reinhart K, Angus DC, Brun-Buisson C, Beale R, Calandra T, Dhainaut JF, Gerlach H, Harvey M, Marini JJ, Marshall J, Ranieri M, Ramsay G, Sevransky J, Thompson BT, Townsend S, Vender JS, Zimmerman JL, Vincent JL. Surviving Sepsis Campaign: international guidelines for management of severe sepsis and septic shock: 2008. Intensive Care Med. 2008;34(1):17-60.
24. Chaney M, Nikolov M, Blakeman P, Bakhos M. Attempting to maintain normoglcyemia during cardiopulmonary bypass with insulin may initiate postoperative hypoglycemia. Anesth Analg. 1999;89(5):1091-5.
25. Mechanick J, Handelsman Y, Bloomgarden Z. Hypoglycemia in the intensive care unit. Curr Opin Clin Nutr Metab Care. 2007;10(2):193-6.
26. Krinsley JS, Grover A. Severe hypoglycemia in critically ill patients: risk factors and outcomes. Crit Care Med. 2007;35(10):2262-7.
27. Aragon D. Evaluation of nursing work effort and perceptions about blood glucose testing in tight glycemic control. Am J Crit Care. 2006;15(4):370-7.
28. Sadhu AR, Ang AC, Ingram-Drake LA, Martinez DS, Hsueh WA, Ettner SL. Economic benefits of intensive insulin therapy in critically Ill patients: the targeted insulin therapy to improve hospital outcomes (TRIUMPH) project. Diabetes Care. 2008;31(8):1556-61.
29. Corstjens AM, Ligtenberg JJ, van der Horst IC, Spanjersberg R, Lind JS, Tulleken JE, Meertens JH, Zijlstra JG. Accuracy and feasibility of point-of-care and continuous blood glucose analysis in critically ill ICU patients. Crit Care. 2006;10(5):R135.
30. Brunkhorst FM. Wahl HG. Blood glucose measurements in the critically ill: more than just a blood draw. Crit Care. 2006;10(6):178.
31. Torjman MC, Goldberg ME, Hirsh RA, Littman J. Thinking like a pancreas: a look ahead at diabetes technology in the perioperative setting. Anesth Analg. 2007;105:(2):545.
32. Torjman MC, Dalal N, Goldberg ME. Glucose monitoring in acute care: technologies on the horizon. J Diabetes Sci Technol. 2008;2(2):178-81.
33. Ganesh A, Hipszer B, Loomba N, Simon B, Torjman M, Joseph J. Evaluation of the VIA blood chemistry monitor for glucose in healthy and diabetic volunteers. J Diabetes Sci Technol. 2008;2(2):182-93.
34. Yamashita K, Okabayashi T, Yokoyama T, Yatabe T, Maeda H, Manabe M, Hanazaki K. The accuracy of a continuous blood glucose monitor during surgery. Anesthesia Analgesia. 2008;106(1):160-3.
35. Yamashita K, Okabayashi T, Yokoyama T, Yatabe T, Maeda H, Manabe M, Hanazaki K. Accuracy and reliability of continuous blood glucose monitor in post-surgical patients. Acta Anaesthesiol Scand. 2009;53(1):66-71.
36. Hirsch IB, Brownlee M. Should minimal blood glucose variability become the gold standard of glycemic control? J Diabetes Complications. 2005;19(3):178-81.
37. Egi M, Bellomo R, Stachowski E, French CJ, Hart G. Variability of blood glucose concentration and short-term mortality in critically ill patients. Anesthesiology. 2006;105(2):244-52.
38. Ouattara A, Grimaldi A, Riou B. Blood glucose variability: a new paradigm in critical care? Anesthesiology. 2006;105(2):233-4.
39. Dossett LA, Cao H, Mowery NT, Dortch MJ, Morris JM Jr, May AK. Blood glucose variability is associated with mortality in the surgical intensive care unit. Am Surg. 2008;74(8):679-85.
40. Van den Berghe G. How to compare adequacy of algorithms to control blood glucose in the intensive care unit? Crit Care. 2004;8(3):151-2.
41. Hovorka R. Continuous glucose monitoring and closed-loop systems. Diabet Med. 2006;23(1):1-12.
42. Wilinska ME, Chassin LJ, Hovorka R. Automated glucose control in the ICU: effect of nutritional protocol and measurement error. Conf Proc IEEE Eng Med Biol Soc. 2006;1:67-70.