pilot testing for inactivation of non-indigenous seawater
TRANSCRIPT

1
Pilot Testing for Inactivation of Non-Indigenous Seawater Organisms by Ozonation and Ultraviolet Sterilization
Joel V. JohnsonTJP Engineering, Imperial Beach – San Diego, California
Angi HotzNautilus Environmental, San Diego, California
Jeremy LordBirch Aquarium at Scripps, La Jolla, California
Hi, I’m Joel Johnson and I’ll be presenting an engineering perspective on our paper… which studies killing exotic species so they are not released into the Ocean.

2
Introduction – Co-Authors
Angi HotzNautilus Environmental
Jeremy LordBirch Aquarium at Scripps
Also:Chris Stransky & Adrienne Cibor
Unfortunately my co-authors could not be here.
ANGI HOTZ and ADRIENNE CIBOR of Nautilus Environmental performed many test and collected tons of data. ANGI also authored the testing procedures and biological assessment parts of our paper. Angi also wanted me to mention Chris Stransky of Nautilus Environmental helped greatly in the design of the testing procedures.
JEREMY LORD of the Birch Aquarium set up the hydraulics of the pilot skid, kept things running smoothly, along with calibration of ozone outputs, UV intensity and water flow rates – as well and being a contributing editor.

3
Introduction – Site Location
Scripps Pier fromStephen Birch Aquarium
Seawater FlowSource from end of pier
Pumped up to Aquarium
Multiple uses at Aquarium
Exotic species may be discharged
Water flows back down to the Area of Special Biological Significants (ASBS)
The facility includes a seawater intake where ocean water is pumped from the Scripps pier up to the Birch Aquarium. At the Aquarium, the seawater is used in many public exhibit and back area tanks – some of which have species that were collected from non-local – or exotic – locations.
After use, the seawater is discharged from two beach outfalls and enters Area of Special Biological Significance number 31, also known as the San Diego-Scripps ASBS. Formerly known as the San Diego Marine Life Refuge.

4
Introduction – The Ocean Plan & ASBS #31
Ocean Plan circa 2001: Outfalls shall have a negligible risk for release of nuisance pollutants.
Our Goal: Negligible risk of the release of non-indigenous species (NIS) including foreign pathogens into the Ocean
Part of the fun has been changing regulations. When we started in 2004 the governing criteria was called out in the California Water Code and defined for this situation in the California Ocean Plan. The requirements were pretty loose and called for the “negligible release of nuisance pollutants.”

5
Two ways to comply with the Ocean Plan:
1) Cease all waste discharge into the ASBS.
2) Apply for and receive an Exception, which includes mitigating conditions that limit the composition and impacts of the discharge constituting “special protections” of the ASBS.
Introduction – The Ocean Plan & ASBS #31
The site has been designated an “Area of Special Biological Significance -- otherwise know as the ASBS – which is a special category of the Ocean Plan. The methods for compliance leave us with new choices: Either install a 2-mile long submarine pipe to divert the outfall past the ASBS or to apply of an Exception. The administration chose to go for the Exception which is described in detail by the Regional Water Quality Board for compliance by the Scripps Institute of Oceanography.---------------------------oo-------------------------o---------------------------oo-----------------------On July 22, 2004, Scripps Institution of Oceanography was granted an EXCEPTION covering all its discharges into the San Diego Marine Life Refuge ASBS. This exception included the strict conditions, and comprehensive monitoring requirements, to assure the protection of beneficial uses in the ASBS.At the same time, the San Diego Municipal Sewer District has requested zero increases in discharges to the sewer system.
6
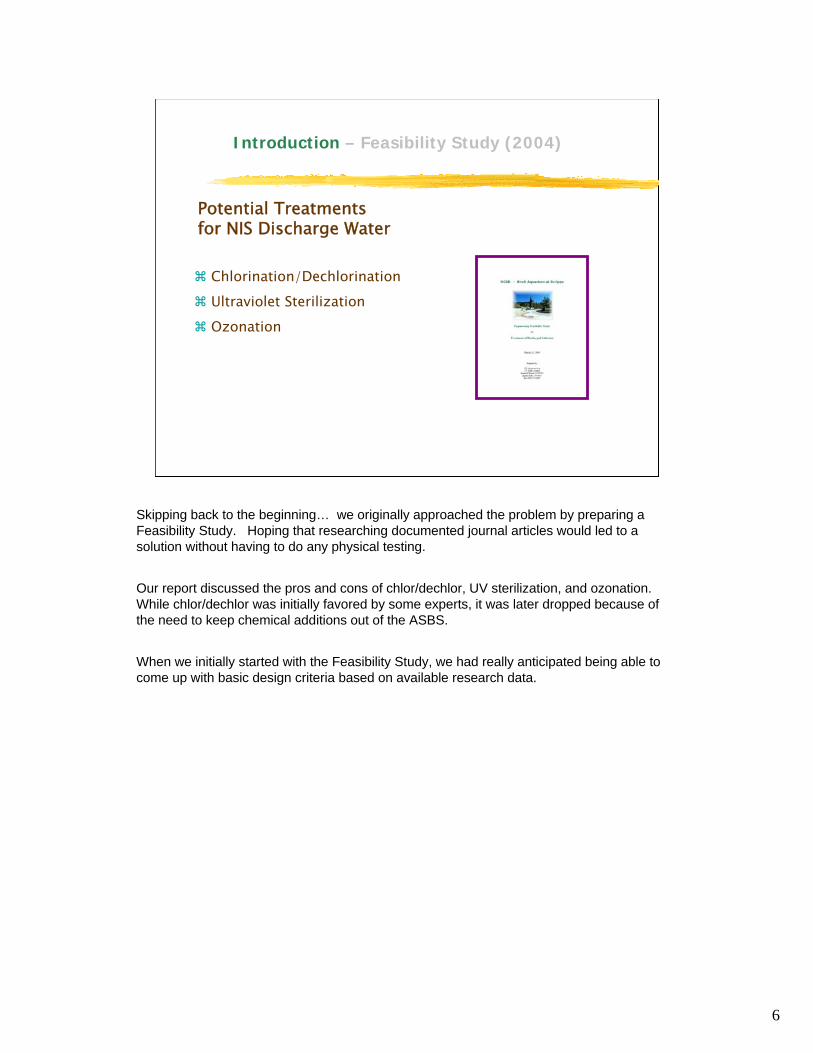
Introduction – Feasibility Study (2004)
Potential Treatments for NIS Discharge Water
Chlorination/Dechlorination
Ultraviolet Sterilization
Ozonation
Skipping back to the beginning… we originally approached the problem by preparing a Feasibility Study. Hoping that researching documented journal articles would led to a solution without having to do any physical testing.
Our report discussed the pros and cons of chlor/dechlor, UV sterilization, and ozonation. While chlor/dechlor was initially favored by some experts, it was later dropped because of the need to keep chemical additions out of the ASBS.
When we initially started with the Feasibility Study, we had really anticipated being able to come up with basic design criteria based on available research data.

7
Introduction – Feasibility Study (2004)
Conclusions
Inclusive for fish eggs and larvae
Recommended a pilot test program
Recommended testing on a surrogate group of organisms
Recommended testing in conjunction with California Department of Fish & Game
Literature was reviewed on the effects of Chlorination/Dechlorination, Ozonation, and Ultraviolet Sterilization on marine fish eggs and embryos.
While MICROscopic pathogenic organisms have been extensively researched and reported on – the MACROscopic organisms that we were interested in do not have conclusive results for dosages and kill rates. … so our Feasibility Report ended with a recommendation for a pilot test on a selected group of indicator organisms.

8
Introduction – Overall Goals
Rock and a Hard Place
No Discharge to ASBS
(without an “Exception”)
Zero Increase to Sewer
Conflicting Goals and Limitations
When moving into the Pilot Study, we were faced with a discovery of Conflicting Goals and Limitations from different regulating agencies.
In between meeting with the Department of Fish and Game about discharges to the ASBS, we also had meetings with the Metropolitan Sewer District. In meetings with the Sewer District, we were told that there needs to be ZERO INCREASE in sewer discharges with future expansions.
Our overall project goal became mitigation of the release of exotic organisms from the Birch Aquarium at Scripps (BAS) -- together with minimizing any increase in flows to the municipal sewer system.

9
Introduction – 5 Indicator Species for Pilot Test
BRINE SHRIMP NAUPLII(Artemia salina)
MARINE ROTIFERS (Brachionus plicatilis)
HETEROTROPHIC BACTERIA
MARINE GREEN ALGAE (Nannochloropsis spp) MUSSEL LARVAE
(Mytilus spp.)
Since no indicator organisms had been defined in the Ocean Plan, a crucial part of our work was to define acceptable test organisms for approval by the powers that be.A diversity of microscopic and macroscopic organisms were sought out for diversity in our pilot testing regime. As part of our work on the pilot treatment system we worked in collaboration with the BAS, SIO and DFG in developing the indicator organisms (shown in the slide).---------------------- o -------------------- o ---------------------nau·plii (in many crustaceans) a larval form with three pairs of appendages and a single median eye, occurring usually as the first stage of development after leaving the egg. Rotifer Any of various minute multicellular aquatic organisms of the phylum Rotifera, having at the anterior end a wheellike ring of cilia. All heterotrophs have an absolute dependence on the biological products of autotrophs for their sustenance--they have no other source of nourishment. Heterotrophic microorganisms mostly feed upon dead plants and animals, and are known as decomposers. And many are disease causing.

10
Introduction – Implementation
Treatment System Design Objectives
Mechanical Redundancy
Durable and Corrosion Resistant Materials
Prevention of Short-Circuiting
Effective During Start and Stop
Monitoring and Sample Ports
Effective and Sustainable Design
Limited Increase to Municipal Sewer
The above are objectives for the Final treatment system installation.
The treatment FINAL system design objectives include:1. Mechanical redundancy to cover elimination of NIS during normal PM and mechanical
breakdowns2. Durable and corrosion-resistant materials to reduce the chance of equipment failure3. Prevention of short-circuiting of microorganisms by having multiple treatment barriers4. Effective treatment during start/stop procedures 5. Monitoring devices and sample ports to measure treatment effectiveness6. Engineering for Efficiency and Sustainability built into the treatment system design7. … And… Limited or insignificant increased discharges to the municipal sewerThe items for the FINAL treatment system design are things that we wanted to keep in mind
for design of the Pilot Test – although not necessarily requirements for the Pilot Testing.
11
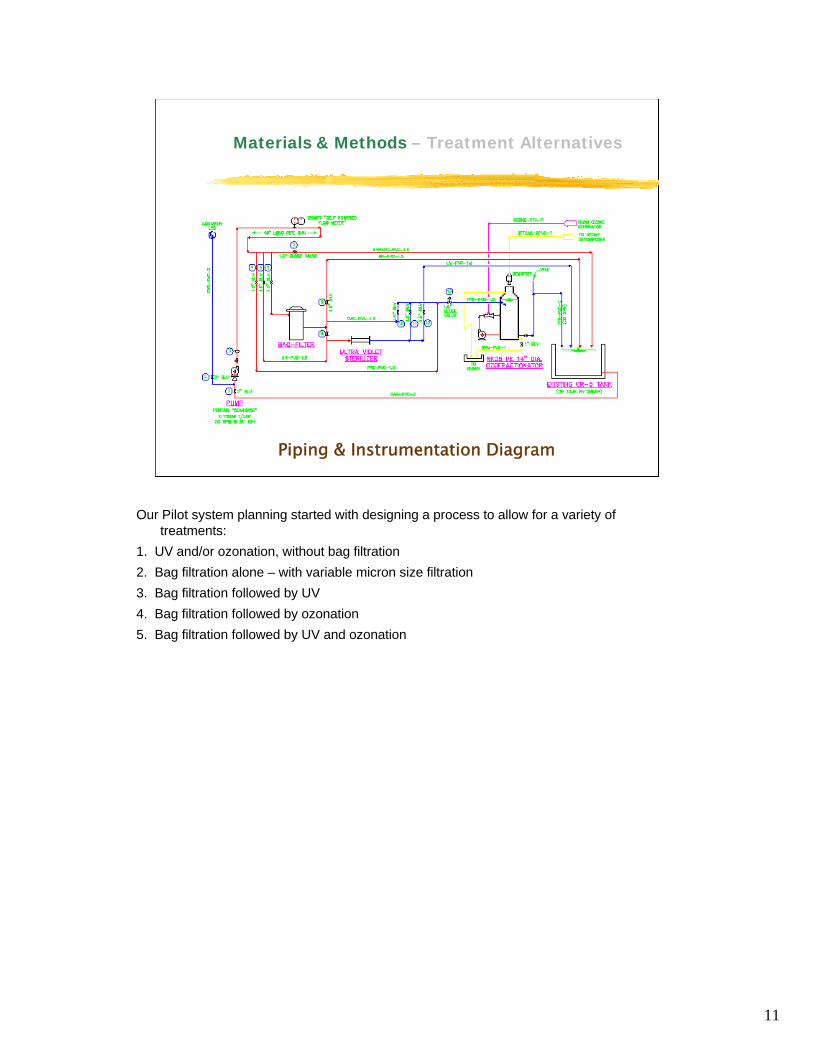
Materials & Methods – Treatment Alternatives
Piping & Instrumentation Diagram
Our Pilot system planning started with designing a process to allow for a variety of treatments:
1. UV and/or ozonation, without bag filtration2. Bag filtration alone – with variable micron size filtration3. Bag filtration followed by UV4. Bag filtration followed by ozonation5. Bag filtration followed by UV and ozonation

12
Materials & Methods – Pilot Skid Design
Scale Drawings for Fabrication
Scale drawings were made, along with product specifications, for securing a quotation for construction of the Pilot Skid.

13
Materials & Methods – Skid Fabrication
Built byOzone Water Systems
UV and/or Ozone with Bag Filt
Bag Filtration Alone
Bag Filtration and UV
Bag Filtration and Ozone
Bag Filt then UV then Ozone
The pilot test skid was built by Ozone Water Systems, in Phoenix Arizona, purchased by the University of California, San Diego, and shipped to the Birch Aquarium in La Jolla California.

14
Materials & Methods – Sources & Handling
ARTEMIABy Birch Aquarium
ROTIFERSFrom Reed MaricultureHETEROTROPs
From Aquarium Filter Backwash
NANNOCHLOROPSISBy Birch Aquarium
MUSSEL LARVAEMussels collected at Mission Bay and spawned at Nautilus Environmental
(BivalveEmbryo)
Our test organisms came from a variety of sources and each had there own special handling needs.* Brine shrimp nauplii (Artemia salina) were supplied by the Birch Aquarium’s staff. The Nauplii were used for testing at approximately 24 to 48 hours after hatching. * Marine rotifers (Brachionus plicatilis) were purchased from Reed Mariculture (in Campbell, CA). The rotifers were kept alive with aeration in holding tanks and were used for testing anywhere from 24 to 72 hours after hatching.•For the source of heterotrophic bacteria, we took samples from the backwash effluent of the BAS seawater filters. •Mussels were collected from Mission Bay, in San Diego, by Angi and Adrienne. And taken back to Nautilus Environmental, where heating was used to spawn the mussels and eggs were fertilized and allowed to develop into free-swimming veliger larvae prior to use in testing.

15
Materials & Methods – Testing Procedures
System ComponentsHayward 50 micron and 25
micron Bag Filters
Wedeco Low-Pressure High Output UV Sterilizer
AirSep Oxygen Concentrator and Ozotech Cold Plasma Ozone Generator
RK2 Fractionator (as the Ozone Contactor)
Signet ORP Meter
The Pilot Skid components consisted of:1. A Hayward bag filter housing with a 50 micron bag filter to start with, and later reduced to
25 micron.2. A Wedeco CHI-10 UV sterilizer, with one 80 Watt low-pressure high-output lamp. A UVA
sensor, was added by Jeremy, to monitor actual UV intensity. 3. The 6.6 g/hour ozone generating system, consisted of an AirSep AS-12 oxygen
separator, and an Ozotech “Big Tube Unit” cold plasma corona discharge ozone generator.
4. An RK2 foam fractionator was used for ozone contacting.5. ORP was measured using a Signet ORP sensor.--------------------------oo-----------------------------oo---------------------------------oo----------------------
-------Prior to sample addition: * The skid was rinsed/flushed with domestic freshwater and then with clean seawater.* Between test runs, the foam fractionator was drained, rinsed with freshwater, and then re-
circulated with freshwater.* No additional cleaning agents were used during testing, and there was no physical
scrubbing of equipment between runs. * The bag filters were cleaned using tap water (by spraying inside and out) and were
allowed to dry completely before re-use.

16
Materials & Methods – Initial Setup
Treatment Optimization
Goal to Narrow List of Variables
Brine Shrimp Initially Selected
99% Target Efficiency for Brine Shrimp, Rotifers, Mussel Larvae, and Green Algae
99.9% Target Efficiency for Heterotropic Bacteria
The required kill rates were established earlier when meeting with the California Department of Fish and Game.
The goal of our “Materials and Methods” phase of the study was to narrow the list of variables in the most cost and time efficient manner possible. Brine shrimp (Artemiasalina) were used to initially evaluate and refine treatment variables due to the ease of obtaining brine shrimp larvae for testing. Once an acceptable treatment/removal process was identified, the same treatment was performed using an another indicator species. Then the treatment variables were adjusted as necessary to achieve the target kill rate for that species.

17
Materials & Methods – Initial Setup
Baseline TestingClean seawater circulated prior to
addition of organisms
1 Liter baseline sample taken
Organisms added and agitated
1 Liter initial verification sample
Circulation thru system and back to pre-treatment tank to achieve uniform distribution
After treatment, samples taken from both pre- and post-treatment tanks
Prior to addition of organisms, 100-200 gallons of clean seawater were added to the pre-treatment tank and circulated through the system and back into the pre-treatment tank for ten minutes.* 1-Lilter sub-samples were collected for baseline data DURING circulation.* Organisms then were added to the pre-treatment tank, agitated to achieve a uniform density.* A 1-Liter sub-sample was collected to verify initial organism density.* Organisms then were circulated through the system and returned to the pre-treatment tank continuously for a period of ten minutes utilizing no active treatment to promote uniform distribution throughout the system.* Finally, with the selected treatment activated, six 125-ml samples were collected from both the pre- and post-treatment tanks at intervals over a period of time during treatments.

18
Materials & Methods – Pilot Treatment Setup
Piping & Instrumentation Diagram
Pre-
Post-
Here’s a how our final pilot test looked diagramatically. While missing from this diagram, we had the capability to recirculate water back to the Pre-Treatment tank while ramping up the test cycle and the switch to discharging into the Post-Treatment tank for collecting the final test data.
--------------------*----------------------*---------------------1. UV and/or ozonation, without bag filtration2. Bag filtration alone3. Bag filtration followed by UV4. Bag filtration followed by ozonation5. Bag filtration followed by UV then ozonation
19
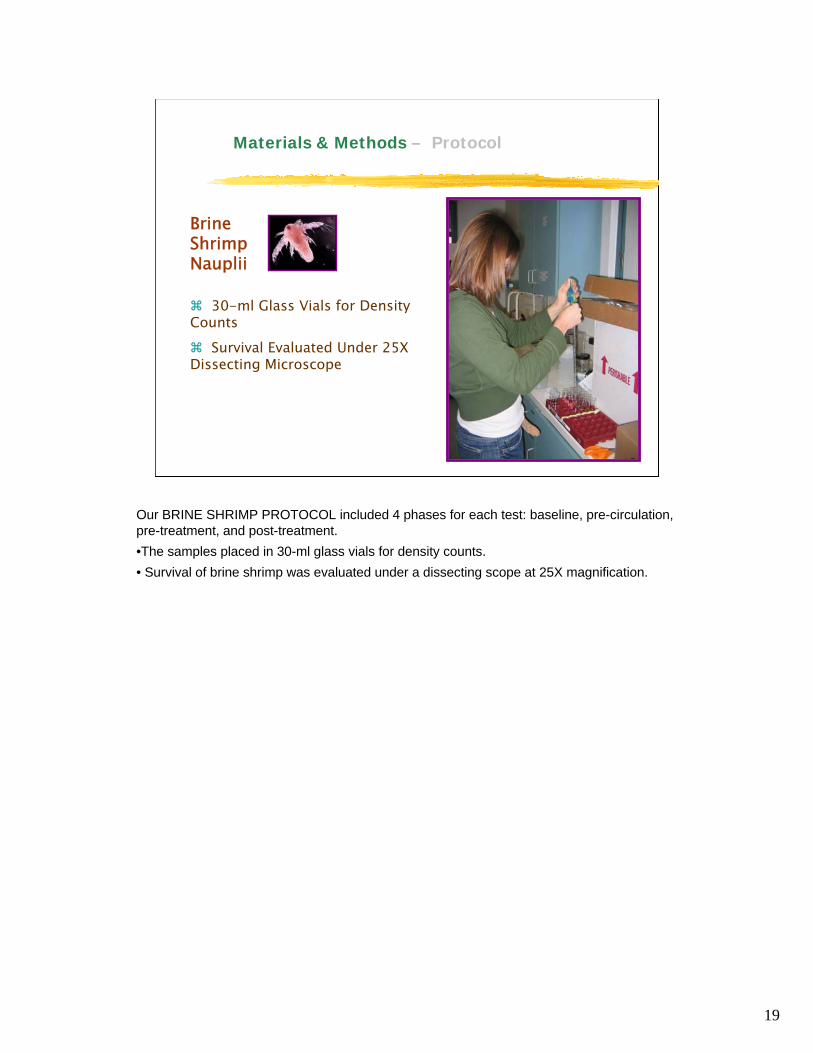
Materials & Methods – Protocol
Brine ShrimpNauplii
30-ml Glass Vials for Density Counts
Survival Evaluated Under 25X Dissecting Microscope
Our BRINE SHRIMP PROTOCOL included 4 phases for each test: baseline, pre-circulation, pre-treatment, and post-treatment.•The samples placed in 30-ml glass vials for density counts.• Survival of brine shrimp was evaluated under a dissecting scope at 25X magnification.

20
Materials & Methods – Protocol
MarineRotifers
30-ml Glass Vials for Density Counts
Survival by Counting Samples on a Sedgewick-Rafter Slide with Dissecting Microscope at 50X.
Our protocol for MARINE ROTIFERs also consisted of four phases during the test: baseline, pre-circulation, pre-treatment, and post-treatment.•The Samples placed in 30-ml glass vials for density counts.•Survival determined by counting the number of live rotifers in ten 1-ml sub-samples placed in a Sedgewick-Rafter slide under a dissecting microscope at 50X magnification.

21
Materials & Methods – Interpretive Analysis
Brine Shrimp & Marine Rotifers
Initial Density
Final Density
Survival
Final Survival
System Loss
System Efficiency
Interpretive analysis for Brine Shrimp & Marine Rotifers included the parameters shown on the slide. The definitions for all of these are given in our paper.
-----------oo---------------------oo------------------------------oo-----------------------Initial Density – Number of live organisms confirmed in the pre-treatment tank prior to any circulation
through the skid. Final Density – the number of organisms counted in each 25-ml sub-sample divided by the sample
volume.Survival – The number of live organisms counted divided by the total number of organisms counted.Final Survival – Because survival data were found to be slightly skewed due to the loss of dead
organisms that had broken apart during treatment, survival rates were applied to final density counts, and this product was then divided by the initial density to yield “final survival.” This number was used to determine treatment effectiveness and took into account any organisms that were caught up in the system, were not retained on the screen for survival determination, or were not alive at the time of organism addition to the system.
System Loss – This term applies to the organisms that were inherently lost in the system that could not be recovered or otherwise accounted for and is represented by the pre-treatment sample data. Calculating this parameter allows for greater understanding of the post-treatment data by defining what proportion of the kill rate was due to actual exposure to the treatment and what proportion to lack of recovery from the system.
System Efficiency – For pre-treatment sample data, system efficiency is equivalent to system loss. For post-treatment sample data, it is defined as kill rate plus system loss.

22
Materials & Methods – Protocol
Mussel Larvae (Bivalve Embryo)
30-ml Glass Vials for Density Counts
Viability Tests Evaluated Embryo-Larval Shell Development
Viable Veliger Mussel
Our protocol for MUSSEL LARVAE also included four test phases: baseline, pre-circulation, pre-treatment, and post-treatment sampling.•Samples were placed in 30-ml glass shell vials for density counts.•The testing was based on post-treatment viability since survival could not be determined visually.•Our viability tests evaluated embryo-larval shell development for 48 hours, at Nautilus’ lab facility, in accordance with US EPA methods.

23
Materials & Methods – Protocol
GreenAlgae
30-ml Glass Vials for Density Counts
Cultured and Evaluated Visually per ASTM Method
Our protocol for MARINE GREEN ALGAE PROTOCOL also had four test phases: baseline, pre-circulation, pre-treatment, and post-treatment samples:•We used 10-ml test tubes and determined density using a fluorometer programmed with a fluorescense standard curve.•The curve is constructed using counts performed under 100x magnification.•After being cultured for a period of 96 hours, following and ASTM method, the test system was based on post-treatment viability since survival could not be evaluated visually.

24
Materials & Methods – Protocol
HeterotropicBacteria
Post-Treatment Samples Collected at Mid-Depth
Immediately Placed in Cooler
Density Determined by City of San Diego Metropolitan Waste Water Department, Marine Microbiology Laboratory
Concentrations Determined Using Pour Plate Method Wastewater Laboratory
Mid-Depth Collection
For HETEROTROPIC BACTERIA, our test PROTOCOL started with verification of concentrations of heterotrophic bacteria in filter back-flush water.•Post-treatment samples were collected at mid-depth by submerging and opening pre-cleaned and autoclaved 250-ml bottles.•The samples were placed in a iced cooler after collection.•Density was determined by the “Marine Microbiology Laboratory” at the City of San Diego Metropolitan Wastewater Department.•Heterotrophic bacteria concentrations were measured in each sample by the City Lab using a pour plate method, as given in the “Standard Methods” handbook.
25
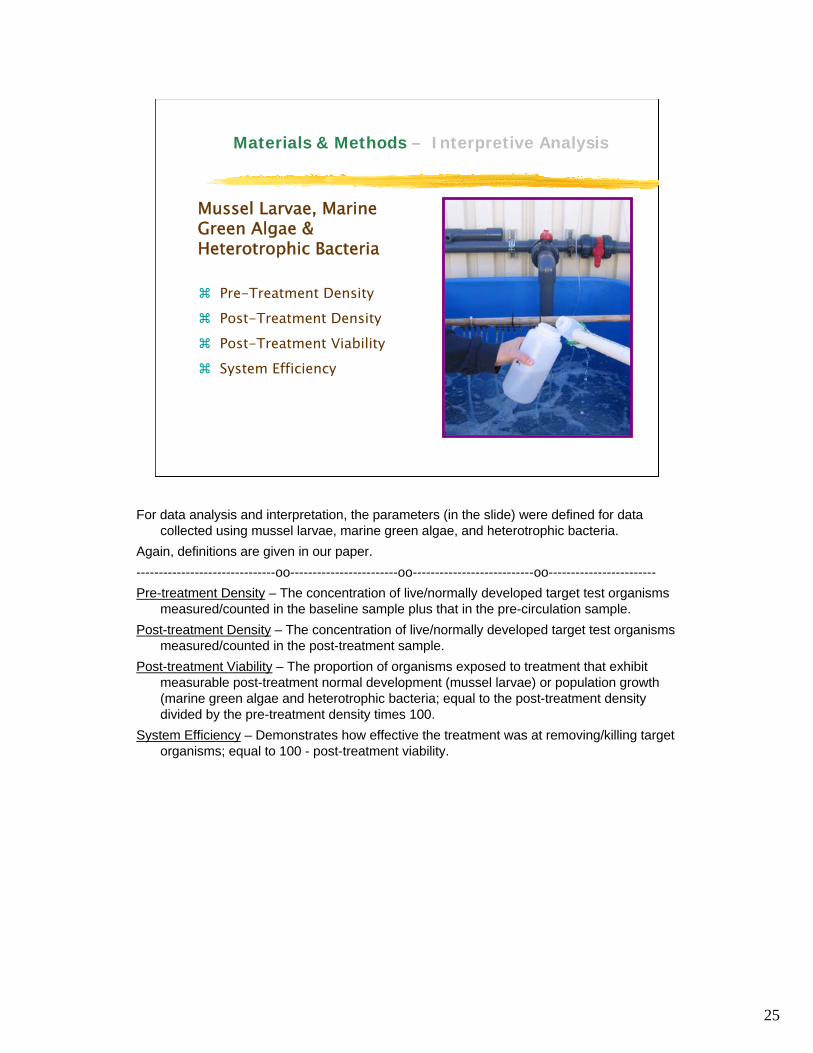
Materials & Methods – Interpretive Analysis
Mussel Larvae, Marine Green Algae & Heterotrophic Bacteria
Pre-Treatment Density
Post-Treatment Density
Post-Treatment Viability
System Efficiency
For data analysis and interpretation, the parameters (in the slide) were defined for data collected using mussel larvae, marine green algae, and heterotrophic bacteria.
Again, definitions are given in our paper.-------------------------------oo------------------------oo---------------------------oo------------------------Pre-treatment Density – The concentration of live/normally developed target test organisms
measured/counted in the baseline sample plus that in the pre-circulation sample. Post-treatment Density – The concentration of live/normally developed target test organisms
measured/counted in the post-treatment sample.Post-treatment Viability – The proportion of organisms exposed to treatment that exhibit
measurable post-treatment normal development (mussel larvae) or population growth (marine green algae and heterotrophic bacteria; equal to the post-treatment density divided by the pre-treatment density times 100.
System Efficiency – Demonstrates how effective the treatment was at removing/killing target organisms; equal to 100 - post-treatment viability.

26
ARTEMIA MORTALITY WITH NO FILTRATION .
0
100
200
300
400
500
600
700
800
900
1000
0 20 40 60 80 100 120
Percent Mortality .
UV
(mJ/
cm
UV OnlyUV & Ozone
First we tried UV and ozone treatments without any filtration. This was an attempt to appease the Sewer District’s request for “Zero increase in sewer discharges.”•Starting by treatment with UV only, at a dose of 227,000 µW-s/cm2 resulted in 89.6% kill rate of Brine Shrimp.•Then upping the UV dose to 454,000 µW-s/cm2 AND Ozonation at 11.6 mg/L Resulted in a 98.2% kill of brine shrimp… … still not good enough!•Finally without any filtration, we boosted the treatment to astronomical dosages of 908,000 µW-s/cm2 UV AND followed by 23.2 mg/L ozone. With a 100% kill rate.Later. I’ll be presenting out Toxicity Testing, and should mention at this time that this high OZONE dosage for the no-filtration setup would never be able to meet our toxicity restrictions.
27
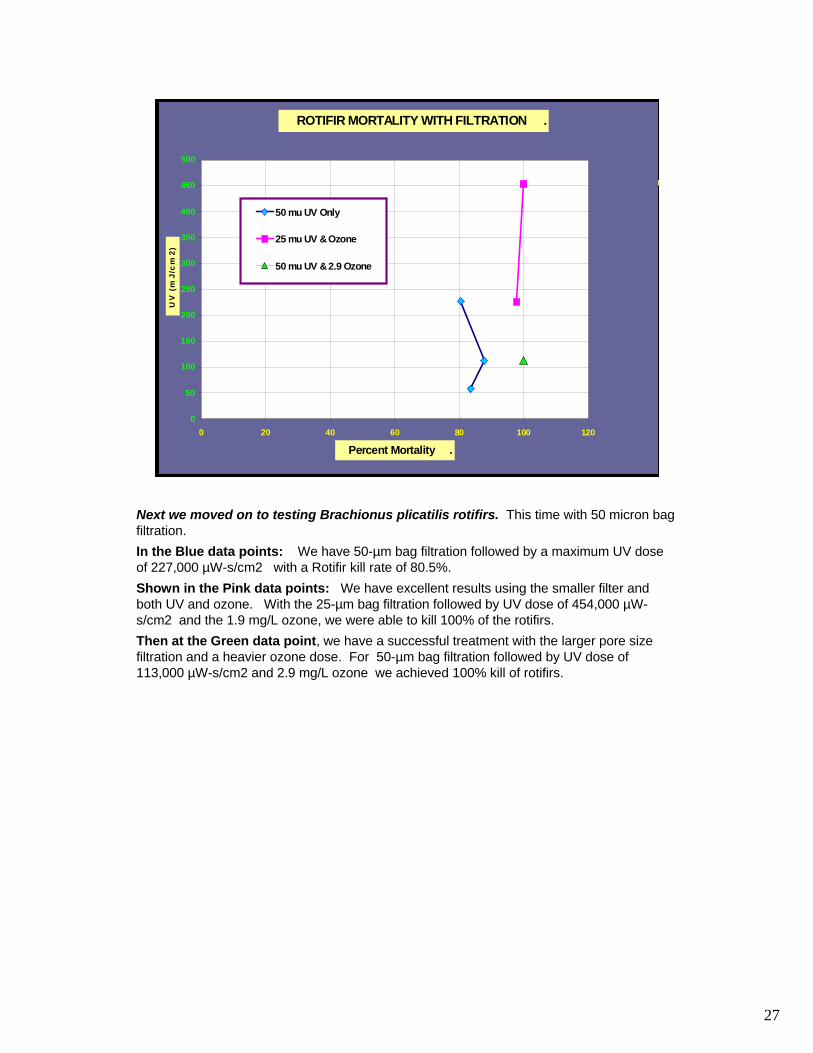
ROTIFIR MORTALITY WITH FILTRATION .
0
50
100
150
200
250
300
350
400
450
500
0 20 40 60 80 100 120
Percent Mortality .
U
V (
mJ/
cm
2)
50 mu UV Only
25 mu UV & Ozone
50 mu UV & 2.9 Ozone
Next we moved on to testing Brachionus plicatilis rotifirs. This time with 50 micron bag filtration.In the Blue data points: We have 50-µm bag filtration followed by a maximum UV dose of 227,000 µW-s/cm2 with a Rotifir kill rate of 80.5%.Shown in the Pink data points: We have excellent results using the smaller filter and both UV and ozone. With the 25-µm bag filtration followed by UV dose of 454,000 µW-s/cm2 and the 1.9 mg/L ozone, we were able to kill 100% of the rotifirs.Then at the Green data point, we have a successful treatment with the larger pore size filtration and a heavier ozone dose. For 50-µm bag filtration followed by UV dose of 113,000 µW-s/cm2 and 2.9 mg/L ozone we achieved 100% kill of rotifirs.
28
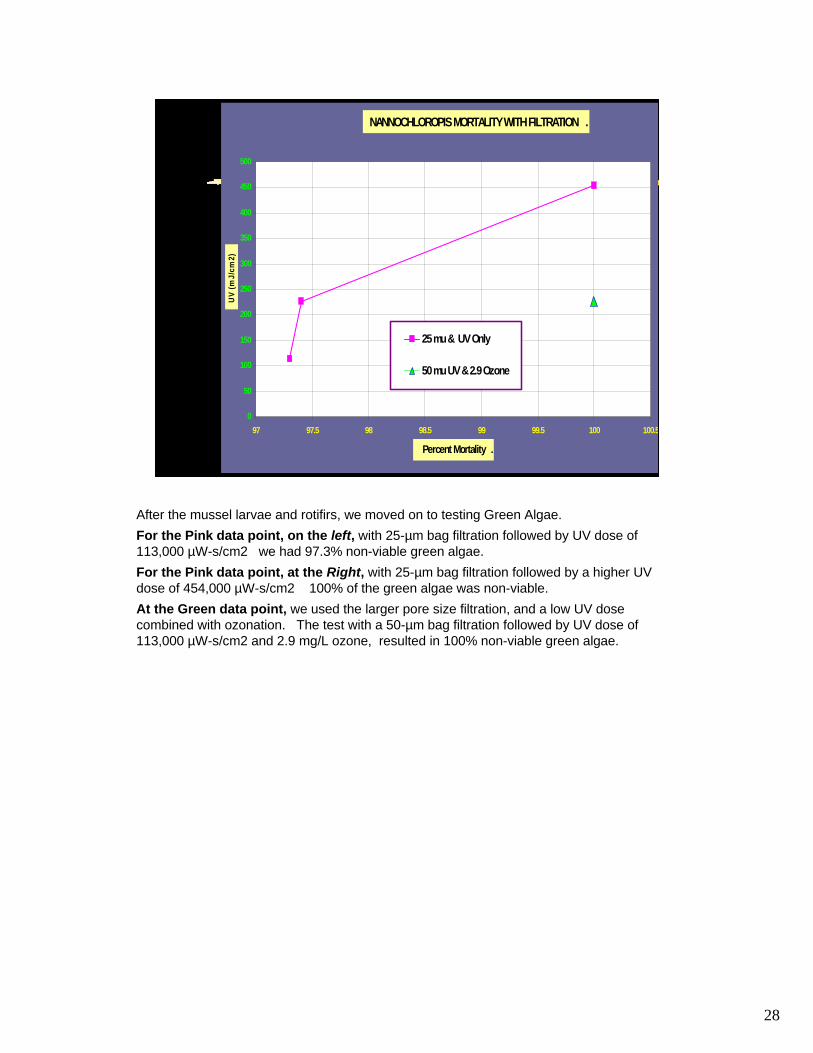
NANNOCHLOROPIS MORTALITY WITH FILTRATION .
0
50
100
150
200
250
300
350
400
450
500
97 97.5 98 98.5 99 99.5 100 100.5
Percent Mortality .
UV
(mJ/
cm2)
25 mu & UV Only
50 mu UV & 2.9 Ozone
After the mussel larvae and rotifirs, we moved on to testing Green Algae.For the Pink data point, on the left, with 25-µm bag filtration followed by UV dose of 113,000 µW-s/cm2 we had 97.3% non-viable green algae.For the Pink data point, at the Right, with 25-µm bag filtration followed by a higher UV dose of 454,000 µW-s/cm2 100% of the green algae was non-viable.At the Green data point, we used the larger pore size filtration, and a low UV dose combined with ozonation. The test with a 50-µm bag filtration followed by UV dose of 113,000 µW-s/cm2 and 2.9 mg/L ozone, resulted in 100% non-viable green algae.

29
MYTILUS & H. BACTERIA MORTALITY WITH 50-um FILTRATION .
0
20
40
60
80
100
120
98.2 98.4 98.6 98.8 99 99.2 99.4 99.6 99.8 100 100.2
Percent Mortality .
UV
(mJ/
cm2)
H. BACTERIA 50 mu UVOnly
MYTILUS 50 mu UV & 2.9Ozone
H. BACTERIA 50 mu UV &2.9 Ozone
In our last data slide in my presentation, we’re looking for killing 99.9% heterotrophic bacteria. And we have a check presented for killing off Mussel Larvae.At the Blue point: We seen that with only 50-µm bag filtration followed by UV dose of 113,000 µW-s/cm2 … we fell short with only 98.3% of heterotrophic bacteria being killed.At the Pink data point: With 50-µm bag filtration followed by UV dose of 113,000 µW-s/cm2 and 2.9 mg/L ozone. We succeeded in killing 99.9% heterotrophic bacteria.Then shown by the Green data point, we used the same treatment for testing Mussel Larvae. (50-µm bag filtration followed by UV dose of 113,000 µW-s/cm2 and 2.9 mg/L ozone ) And 100% of the mussel larvae were killed off.While the last two have the same treatment and we have achieved our goals -- we later found problems with this treatment resulting in a toxic discharge.

30
Toxicity Testing – 3 Marine Species
Giant Kelp (Macrocystis pyrifera)
Purple Sea Urchins (Strongylocentrotus purpuratus)
Pacific topsmelt(Atherinops affinins)
Post-Treatment water was evaluated for toxicity using three marine specie
In our next major phase with the pilot testing, we moved on to Toxicity Testing.You’ll recall that so far we achieve our goals with an ozone dose of 2.9 mg/L. However, the post-treatment sample was found to be toxic to purple sea urchins( in excess of the toxic unit limit in UCSD’s National Pollutant Discharge Elimination System (NPDES) permit.)

31
Toxicity Testing – per UCSD’s NPDES Permit
To allow a lower ozone dose
Smaller filtration pore size (25-µm) was confirmed to remove 99% of marine rotifers
Testing commenced with marine green algae, the species most likely to be UV-resistant
Dose of 454,000 µW-s/cm2 was required to achieve the target kill rate
Nannochloropsis testing
25-µm bag filtration
Results from the toxicity study showed that the treatment scheme had to be modified to yield a treatment that was effective at removing NIS and produced effluent that was non-toxic upon discharge to the Pacific Ocean. To allow for a lower ozone dose: * We moved to the smaller 25 micron filtration pore size.* Started testing with marine green algae -- since of the 5 indicator organisms, the green algae is the most resistant to UV treatment.* Our testing found that a dose of 454,000 µW-s/cm2 was required for 99% non-viable green algae.

32
0.00
0.07
0.54
0.82
0.94
0.000.05
0.99
0.00
0.20
0.40
0.60
0.80
1.00
1.20
1.40
0.00% 25.00% 50.00% 75.00% 100.00%
Ozone level (%)
Co
mb
ined
oxid
an
t le
vel
(pp
m)
10 GPM
5 GPM
At the beginning of Toxicity Testing, we established a standardization curve of ozone generator output versus total oxidant level. This was done using DPD free chlorine tests. And since Hypobromous acid is the most prevalent residual oxidant in ozonated seawater, and since DPD tests have been shown to be very accurate in measuring levels of HOBr in seawater , DPD was considered a reliable test in this scenario. This curve was generated to quantify the relationship between ozone dose and the residual toxicity of the effluent water.

33
Toxicity Testing – Hypobromous Acid
Primary Ozone Reaction in Seawater
O3 + Br - O2 + OBr -
Bromide Ion Concentration: 67mg/L
Ozone Reaction Rate: 160 M-1 s-1
Ozone Half-Life in Seawater: 5.3 seconds
HOBr/OBr– has pKa of 8.5
Seawater has pH from 7.9 to 8.3
O3 + Br - ÷ O2 + OBr -
In seawater there is a relatively high concentration of bromide ion of approximately 67 mg/L -- which has an ozone reaction rate constant of approximately 160 M-1 s-1. The reaction of ozone in “seawater” is fairly swift with a half-life of ozone of 5.3 seconds.
(Since HOBr/OBr- has a pKa of 8.5, and the range for pH of ocean waters is from 7.9 to 8.3, the hypobromous acid become the major byproduct oxidant and is measurable with the DPD test.)

34
Toxicity Testing – Toxicity Reduction Study
Reduce 2.9 mg O3/L Dose?
Smaller filtration pore size?
Can aeration remove toxic residual oxidants?
What effect does carbon filtration have on toxicity?
Adrienne Cibor of Nautilus
Purple Sea Urchins were found to be the most sensitive of the three test species.
Aeration and carbon filtration were not found to be effective in reducing toxicity with respect to Purple Sea Urchins.
We conducted a Toxicity Reduction study, asking the question “Can the 2.9 mg/L ozone dosed water could be rid of residual oxidants by carbon filtration And/or aeration?”The purpose of the Reduction study was to determine if the 2.9 mg/L ozone dosed water could be rid of residual oxidants through a combination of carbon filtration and aeration. Unfortunately, we found that Carbon Filtration and Aeration we not effective in reducing the toxicity of the ozonized seawater.

35
Toxicity Testing – Toxicity Threshold Testing
What Threshold O3 Dose?
Ozone dose of 1.2 mg O3/L was found as the threshold dose for Purple Sea Urchins
Compromises:The lower ozone dose will
require using the smaller filtration pore size
Higher UV Dose was required to achieve the target kill rate Purple Sea Urchin
We also conducted Toxicity Threshold Testing using purple sea urchins.
The purpose of the Threshold study was to determine the highest exposure concentration of ozone (and residual oxidants) that could be tolerated.
We found that 1.2 mg/L was the highest ozone dose that would yield a non-toxic effluent.

36
Final Results – Pilot Treatment Plant
Pilot Skid Proved Feasibility
Final treatment plant is envisioned to include drum screen filtration followed by ozonationthen UV treatments
Our pilot testing resulted in very useful results for the design of the Final Treatment Plant –which will be done in the near future.•Micron bag filtration proved that depth type media filtration will not be required. For the Final plant, we are looking at using Drum type microfiltration for limited backwash discharge to the sewer.•The Final NIS treatment plant will have pressure ozone contactor in lieu of foam fractionatorfor ozone contacting.•Also, for the Final NIS treatment plant will have UV following ozonation. And we hope that this sequence will promote Advanced Oxidation and a reduction in toxicity.

37
Results – Indicator Species Control
Particulate filtration of
25-µm pore size
Ozone dose of
1.2 mg O3/L
UV dose of
454,000 µW-s/cm2
ARTEMIA99% Reduction
MUSSEL LARVAE99% Reduction
ROTIFERS99% Reduction
NANNOCHLOROPSIS99% Reduction
HETEROTROPICBACTERIA99.9% Reduction
Required Treatments
The Pilot Test established minimum treatment requirements for reduction of five indicator organisms. (See slide!)
38
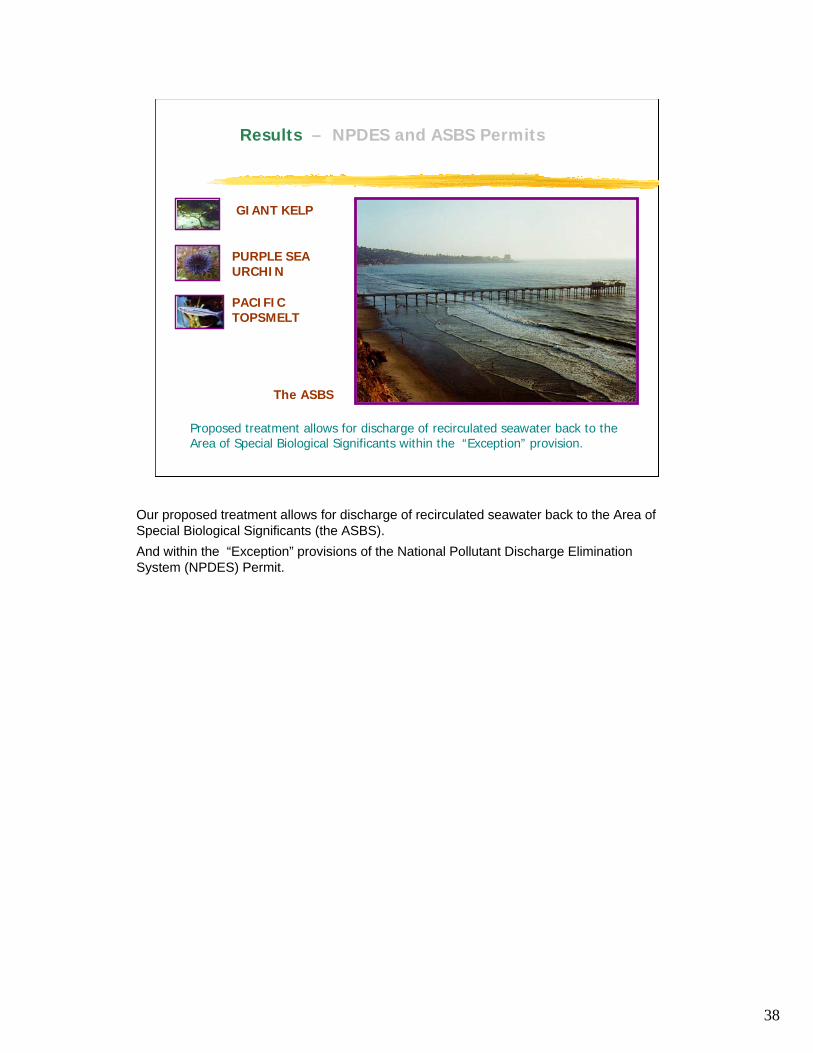
Results – NPDES and ASBS Permits
GIANT KELP
PURPLE SEA URCHIN
PACIFIC TOPSMELT
The ASBS
Proposed treatment allows for discharge of recirculated seawater back to the Area of Special Biological Significants within the “Exception” provision.
Our proposed treatment allows for discharge of recirculated seawater back to the Area of Special Biological Significants (the ASBS).And within the “Exception” provisions of the National Pollutant Discharge Elimination System (NPDES) Permit.

39
Acknowledgements
Nautilus Environmental• Adrienne Cibor• Chris Stransky
Birch Aquarium at Scripps•Bob Burhans•Nigella Hilgarth•Bruce Stewart
Department of Fish & Game• James Moore• Tom Moore• William Paznokas
Scripps Institute of Oceanography• Eddie Kisfaludy
University of California, San Diego• Kimberly O’Connell
Ozone Water Systems• John Overby
AcknowledgementsNautilus Environmental: * Adrienne CiborBirch Aquarium at Scripps:* Robert Burhans* Nigella Hillgarth* Bruce StewartCalifornia Department of Fish and Game* James Moore* Tom Moore* William PaznokasScripps Institution of Oceanography* Eddie KisfaludyUniversity of California, San Diego: Kimberly O'Connell
Ozone Water Systems: John Overby

40
Jeremy LordBirch Aquarium at Scripps, La Jolla, California
Angi HotzNautilus Environmental, San Diego, California
Joel V. JohnsonTJP Engineering, Imperial Beach – San Diego, California
Pilot Testing for Inactivation of Non-Indigenous Seawater Organisms by Ozonation and Ultraviolet Sterilization
---- The End -----