pinebridgedynamic asset allocation fund · the advisors’ inner circle fund iii pinebridgedynamic...
TRANSCRIPT

The Advisors’ Inner Circle Fund III
PineBridge Dynamic Asset Allocation Fund
SEMI-ANNUAL REPORT APRIL 30, 2018
Investment Adviser:PineBridge Investments LLC

THE ADVISORS’ INNER CIRCLE FUND III PINEBRIDGE DYNAMICASSET ALLOCATION FUNDAPRIL 30, 2018 (Unaudited)
TABLE OF CONTENTS
Schedule of Investments . . . . . . . . . . . . . . . . . . . . . . . . . . . . . . . . . . . . . . . . . . . . . . 1
Statement of Assets and Liabilities . . . . . . . . . . . . . . . . . . . . . . . . . . . . . . . . . . . . . .45
Statement of Operations . . . . . . . . . . . . . . . . . . . . . . . . . . . . . . . . . . . . . . . . . . . . . . .47
Statements of Changes in Net Assets . . . . . . . . . . . . . . . . . . . . . . . . . . . . . . . . . . . .48
Financial Highlights . . . . . . . . . . . . . . . . . . . . . . . . . . . . . . . . . . . . . . . . . . . . . . . . . .50
Notes to Financial Statements . . . . . . . . . . . . . . . . . . . . . . . . . . . . . . . . . . . . . . . . . .52
Disclosure of Fund Expenses . . . . . . . . . . . . . . . . . . . . . . . . . . . . . . . . . . . . . . . . . . .72
The Fund files its complete schedule of investments with the Securities andExchange Commission (“SEC”) for the first and third quarters of each fiscal year onForm N-Q within sixty days after period end. The Fund’s Form N-Q is available onthe SEC’s website at http://www.sec.gov, and may be reviewed and copied at theSEC’s Public Reference Room in Washington, DC. Information on the operation ofthe Public Reference Room may be obtained by calling 1-800-SEC-0330.
A description of the policies and procedures that the Fund uses to determine how tovote proxies relating to Fund securities, as well as information relating to how aFund voted proxies relating to fund securities during the most recent 12-monthperiod ended June 30, is available (i) without charge, upon request, by calling1-877-225-4164; and (ii) on the SEC’s website at http://www.sec.gov.

THE ADVISORS’ INNER CIRCLE FUND III PINEBRIDGE DYNAMICASSET ALLOCATION FUNDAPRIL 30, 2018 (Unaudited)
SECTOR WEIGHTINGS†
25.1% Financials
17.2% Information Technology
16.4% Asset-Backed Securities
7.7% Industrials
6.4% Consumer Discretionary
3.5% Registered Investment Companies
3.5% Health Care
3.4% Consumer Staples
3.2% Materials
2.9% U.S. Treasury Obligations
2.7% Sovereign Debt
2.5% Energy
2.0% Telecommunication Services
1.6% Real Estate
1.0% Exchange Traded Funds
0.6% Utilities
0.3% Preferred Stock
0.0% Rights
†Percentages are based on total investments.
SCHEDULE OF INVESTMENTS
COMMON STOCK — 61.0%
Shares Value
Austria — 0.1%
BUWOG . . . . . . . . . . . . . . . . . . . . . . . . . . . . . . . . . . . . . 1,782 $ 62,485Erste Group Bank . . . . . . . . . . . . . . . . . . . . . . . . . . . . . 2,089 102,412Raiffeisen Bank International . . . . . . . . . . . . . . . . . . . 888 30,052Wienerberger . . . . . . . . . . . . . . . . . . . . . . . . . . . . . . . . 1,867 47,108
242,057
Belgium — 0.3%
Ablynx * . . . . . . . . . . . . . . . . . . . . . . . . . . . . . . . . . . . . . 1,192 64,435Ackermans & van Haaren . . . . . . . . . . . . . . . . . . . . . . 672 121,257bpost . . . . . . . . . . . . . . . . . . . . . . . . . . . . . . . . . . . . . . . 1,555 34,066Cofinimmo ‡ . . . . . . . . . . . . . . . . . . . . . . . . . . . . . . . . . 328 43,491Colruyt . . . . . . . . . . . . . . . . . . . . . . . . . . . . . . . . . . . . . . 900 50,591Gimv . . . . . . . . . . . . . . . . . . . . . . . . . . . . . . . . . . . . . . . . 230 13,787KBC Group . . . . . . . . . . . . . . . . . . . . . . . . . . . . . . . . . . . 3,007 261,878Telenet Group Holding * . . . . . . . . . . . . . . . . . . . . . . . . 816 47,748
637,253
The accompanying notes are an integral part of the financial statements.
1
THE ADVISORS’ INNER CIRCLE FUND III PINEBRIDGE DYNAMICASSET ALLOCATION FUNDAPRIL 30, 2018 (Unaudited)
COMMON STOCK — continued
Shares Value
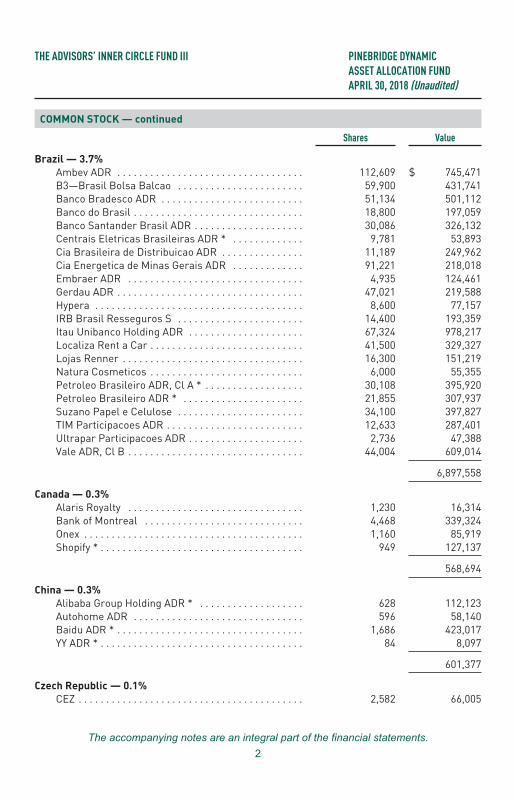
Brazil — 3.7%
Ambev ADR . . . . . . . . . . . . . . . . . . . . . . . . . . . . . . . . . . 112,609 $ 745,471B3—Brasil Bolsa Balcao . . . . . . . . . . . . . . . . . . . . . . . 59,900 431,741Banco Bradesco ADR . . . . . . . . . . . . . . . . . . . . . . . . . . 51,134 501,112Banco do Brasil . . . . . . . . . . . . . . . . . . . . . . . . . . . . . . . 18,800 197,059Banco Santander Brasil ADR . . . . . . . . . . . . . . . . . . . . 30,086 326,132Centrais Eletricas Brasileiras ADR * . . . . . . . . . . . . . 9,781 53,893Cia Brasileira de Distribuicao ADR . . . . . . . . . . . . . . . 11,189 249,962Cia Energetica de Minas Gerais ADR . . . . . . . . . . . . . 91,221 218,018Embraer ADR . . . . . . . . . . . . . . . . . . . . . . . . . . . . . . . . 4,935 124,461Gerdau ADR . . . . . . . . . . . . . . . . . . . . . . . . . . . . . . . . . . 47,021 219,588Hypera . . . . . . . . . . . . . . . . . . . . . . . . . . . . . . . . . . . . . . 8,600 77,157IRB Brasil Resseguros S . . . . . . . . . . . . . . . . . . . . . . . 14,400 193,359Itau Unibanco Holding ADR . . . . . . . . . . . . . . . . . . . . . 67,324 978,217Localiza Rent a Car . . . . . . . . . . . . . . . . . . . . . . . . . . . . 41,500 329,327Lojas Renner . . . . . . . . . . . . . . . . . . . . . . . . . . . . . . . . . 16,300 151,219Natura Cosmeticos . . . . . . . . . . . . . . . . . . . . . . . . . . . . 6,000 55,355Petroleo Brasileiro ADR, Cl A * . . . . . . . . . . . . . . . . . . 30,108 395,920Petroleo Brasileiro ADR * . . . . . . . . . . . . . . . . . . . . . . 21,855 307,937Suzano Papel e Celulose . . . . . . . . . . . . . . . . . . . . . . . 34,100 397,827TIM Participacoes ADR . . . . . . . . . . . . . . . . . . . . . . . . . 12,633 287,401Ultrapar Participacoes ADR . . . . . . . . . . . . . . . . . . . . . 2,736 47,388Vale ADR, Cl B . . . . . . . . . . . . . . . . . . . . . . . . . . . . . . . . 44,004 609,014
6,897,558
Canada — 0.3%
Alaris Royalty . . . . . . . . . . . . . . . . . . . . . . . . . . . . . . . . 1,230 16,314Bank of Montreal . . . . . . . . . . . . . . . . . . . . . . . . . . . . . 4,468 339,324Onex . . . . . . . . . . . . . . . . . . . . . . . . . . . . . . . . . . . . . . . . 1,160 85,919Shopify * . . . . . . . . . . . . . . . . . . . . . . . . . . . . . . . . . . . . . 949 127,137
568,694
China — 0.3%
Alibaba Group Holding ADR * . . . . . . . . . . . . . . . . . . . 628 112,123Autohome ADR . . . . . . . . . . . . . . . . . . . . . . . . . . . . . . . 596 58,140Baidu ADR * . . . . . . . . . . . . . . . . . . . . . . . . . . . . . . . . . . 1,686 423,017YY ADR * . . . . . . . . . . . . . . . . . . . . . . . . . . . . . . . . . . . . . 84 8,097
601,377
Czech Republic — 0.1%
CEZ . . . . . . . . . . . . . . . . . . . . . . . . . . . . . . . . . . . . . . . . . 2,582 66,005
The accompanying notes are an integral part of the financial statements.
2

THE ADVISORS’ INNER CIRCLE FUND III PINEBRIDGE DYNAMICASSET ALLOCATION FUNDAPRIL 30, 2018 (Unaudited)
COMMON STOCK — continued
Shares Value
Czech Republic — continued
Komercni banka as . . . . . . . . . . . . . . . . . . . . . . . . . . . . 1,196 $ 51,685
117,690
Denmark — 0.4%
Ambu, Cl B . . . . . . . . . . . . . . . . . . . . . . . . . . . . . . . . . . . 2,391 55,657Danske Bank . . . . . . . . . . . . . . . . . . . . . . . . . . . . . . . . . 4,729 165,115GN Store Nord . . . . . . . . . . . . . . . . . . . . . . . . . . . . . . . . 2,148 75,530H Lundbeck . . . . . . . . . . . . . . . . . . . . . . . . . . . . . . . . . . 981 57,036Jyske Bank . . . . . . . . . . . . . . . . . . . . . . . . . . . . . . . . . . 1,129 67,793Schouw . . . . . . . . . . . . . . . . . . . . . . . . . . . . . . . . . . . . . 290 28,609SimCorp . . . . . . . . . . . . . . . . . . . . . . . . . . . . . . . . . . . . . 647 46,987Sydbank . . . . . . . . . . . . . . . . . . . . . . . . . . . . . . . . . . . . . 1,117 41,380Tryg . . . . . . . . . . . . . . . . . . . . . . . . . . . . . . . . . . . . . . . . 1,919 45,484William Demant Holding * . . . . . . . . . . . . . . . . . . . . . . 1,726 67,396
650,987
Finland — 0.1%
Amer Sports . . . . . . . . . . . . . . . . . . . . . . . . . . . . . . . . . 1,883 57,573Kesko, Cl B . . . . . . . . . . . . . . . . . . . . . . . . . . . . . . . . . . 1,085 63,693Konecranes, Cl A . . . . . . . . . . . . . . . . . . . . . . . . . . . . . 1,065 43,499Metso . . . . . . . . . . . . . . . . . . . . . . . . . . . . . . . . . . . . . . . 1,702 60,687Outokumpu . . . . . . . . . . . . . . . . . . . . . . . . . . . . . . . . . . 5,102 33,095
258,547
France — 1.8%
Air France-KLM * . . . . . . . . . . . . . . . . . . . . . . . . . . . . . 4,487 43,932Altamir . . . . . . . . . . . . . . . . . . . . . . . . . . . . . . . . . . . . . . 930 15,643Altran Technologies . . . . . . . . . . . . . . . . . . . . . . . . . . . 2,729 42,094Amundi (A) . . . . . . . . . . . . . . . . . . . . . . . . . . . . . . . . . . . 782 66,380Atos . . . . . . . . . . . . . . . . . . . . . . . . . . . . . . . . . . . . . . . . 1,028 138,635BioMerieux . . . . . . . . . . . . . . . . . . . . . . . . . . . . . . . . . . 677 53,488BNP Paribas . . . . . . . . . . . . . . . . . . . . . . . . . . . . . . . . . 10,645 820,504Bollore . . . . . . . . . . . . . . . . . . . . . . . . . . . . . . . . . . . . . . 14,349 71,107Capgemini . . . . . . . . . . . . . . . . . . . . . . . . . . . . . . . . . . . 1,500 206,076Christian Dior . . . . . . . . . . . . . . . . . . . . . . . . . . . . . . . . 143 60,161Cie Plastic Omnium . . . . . . . . . . . . . . . . . . . . . . . . . . . 1,017 48,806Credit Agricole . . . . . . . . . . . . . . . . . . . . . . . . . . . . . . . 7,741 127,022Dassault Aviation . . . . . . . . . . . . . . . . . . . . . . . . . . . . . 36 71,811Eurazeo . . . . . . . . . . . . . . . . . . . . . . . . . . . . . . . . . . . . . 1,399 122,668Eutelsat Communications . . . . . . . . . . . . . . . . . . . . . . 2,194 47,479
The accompanying notes are an integral part of the financial statements.
3

THE ADVISORS’ INNER CIRCLE FUND III PINEBRIDGE DYNAMICASSET ALLOCATION FUNDAPRIL 30, 2018 (Unaudited)
COMMON STOCK — continued
Shares Value
France — continued
Fonciere Des Regions ‡ . . . . . . . . . . . . . . . . . . . . . . . . 549 $ 61,346ICADE ‡ . . . . . . . . . . . . . . . . . . . . . . . . . . . . . . . . . . . . . 500 49,735Imerys . . . . . . . . . . . . . . . . . . . . . . . . . . . . . . . . . . . . . . 518 47,224Ingenico Group . . . . . . . . . . . . . . . . . . . . . . . . . . . . . . . 1,995 173,947Ipsen . . . . . . . . . . . . . . . . . . . . . . . . . . . . . . . . . . . . . . . 724 117,351Lagardere SCA . . . . . . . . . . . . . . . . . . . . . . . . . . . . . . . 1,658 47,300Natixis . . . . . . . . . . . . . . . . . . . . . . . . . . . . . . . . . . . . . . 17,090 140,011Remy Cointreau . . . . . . . . . . . . . . . . . . . . . . . . . . . . . . 356 48,956Schneider Electric . . . . . . . . . . . . . . . . . . . . . . . . . . . . 1,819 165,044SEB . . . . . . . . . . . . . . . . . . . . . . . . . . . . . . . . . . . . . . . . . 390 74,742Societe BIC . . . . . . . . . . . . . . . . . . . . . . . . . . . . . . . . . . 414 42,197Societe Generale . . . . . . . . . . . . . . . . . . . . . . . . . . . . . . 6,428 351,709Sopra Steria Group . . . . . . . . . . . . . . . . . . . . . . . . . . . . 261 55,695Wendel . . . . . . . . . . . . . . . . . . . . . . . . . . . . . . . . . . . . . . 400 60,365
3,371,428
Germany — 1.2%
1&1 Drillisch . . . . . . . . . . . . . . . . . . . . . . . . . . . . . . . . . 750 54,281Aareal Bank . . . . . . . . . . . . . . . . . . . . . . . . . . . . . . . . . . 950 47,496Allianz . . . . . . . . . . . . . . . . . . . . . . . . . . . . . . . . . . . . . . 442 104,628Aroundtown . . . . . . . . . . . . . . . . . . . . . . . . . . . . . . . . . . 8,994 71,821AURELIUS Equity Opportunities & KGaA . . . . . . . . . . 540 40,907Aurubis . . . . . . . . . . . . . . . . . . . . . . . . . . . . . . . . . . . . . . 601 53,629Axel Springer . . . . . . . . . . . . . . . . . . . . . . . . . . . . . . . . . 737 60,242Bayer . . . . . . . . . . . . . . . . . . . . . . . . . . . . . . . . . . . . . . . 24 2,870Commerzbank . . . . . . . . . . . . . . . . . . . . . . . . . . . . . . . . 3,904 50,320Delivery Hero *(A) . . . . . . . . . . . . . . . . . . . . . . . . . . . . . 1,696 80,953Deutsche Bank . . . . . . . . . . . . . . . . . . . . . . . . . . . . . . . 17,511 239,558Deutsche Beteiligungs . . . . . . . . . . . . . . . . . . . . . . . . . 490 21,749Duerr . . . . . . . . . . . . . . . . . . . . . . . . . . . . . . . . . . . . . . . 392 38,906Fraport Frankfurt Airport Services Worldwide . . . . . 591 57,233Freenet . . . . . . . . . . . . . . . . . . . . . . . . . . . . . . . . . . . . . 2,034 64,534Fresenius & KGaA . . . . . . . . . . . . . . . . . . . . . . . . . . . . . 3,063 233,405Gerresheimer . . . . . . . . . . . . . . . . . . . . . . . . . . . . . . . . 498 40,541GRENKE . . . . . . . . . . . . . . . . . . . . . . . . . . . . . . . . . . . . . 404 47,608Hella GmbH & KGaA . . . . . . . . . . . . . . . . . . . . . . . . . . . 699 43,147HOCHTIEF . . . . . . . . . . . . . . . . . . . . . . . . . . . . . . . . . . . 289 52,887Rocket Internet *(A) . . . . . . . . . . . . . . . . . . . . . . . . . . . 1,060 30,936Scout24 (A) . . . . . . . . . . . . . . . . . . . . . . . . . . . . . . . . . . 1,541 79,715Siemens . . . . . . . . . . . . . . . . . . . . . . . . . . . . . . . . . . . . . 429 54,576Siltronic . . . . . . . . . . . . . . . . . . . . . . . . . . . . . . . . . . . . . 330 52,776
The accompanying notes are an integral part of the financial statements.
4
THE ADVISORS’ INNER CIRCLE FUND III PINEBRIDGE DYNAMICASSET ALLOCATION FUNDAPRIL 30, 2018 (Unaudited)
COMMON STOCK — continued
Shares Value
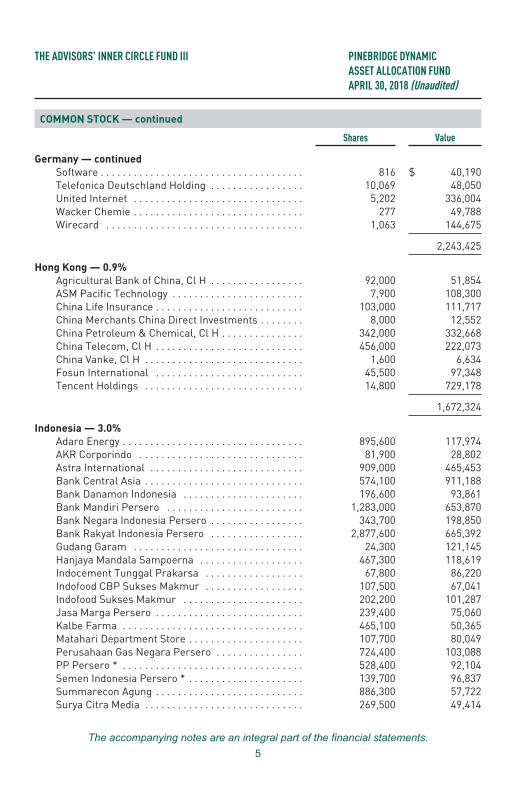
Germany — continued
Software . . . . . . . . . . . . . . . . . . . . . . . . . . . . . . . . . . . . . 816 $ 40,190Telefonica Deutschland Holding . . . . . . . . . . . . . . . . . 10,069 48,050United Internet . . . . . . . . . . . . . . . . . . . . . . . . . . . . . . . 5,202 336,004Wacker Chemie . . . . . . . . . . . . . . . . . . . . . . . . . . . . . . . 277 49,788Wirecard . . . . . . . . . . . . . . . . . . . . . . . . . . . . . . . . . . . . 1,063 144,675
2,243,425
Hong Kong — 0.9%
Agricultural Bank of China, Cl H . . . . . . . . . . . . . . . . . 92,000 51,854ASM Pacific Technology . . . . . . . . . . . . . . . . . . . . . . . . 7,900 108,300China Life Insurance . . . . . . . . . . . . . . . . . . . . . . . . . . . 103,000 111,717China Merchants China Direct Investments . . . . . . . . 8,000 12,552China Petroleum & Chemical, Cl H . . . . . . . . . . . . . . . 342,000 332,668China Telecom, Cl H . . . . . . . . . . . . . . . . . . . . . . . . . . . 456,000 222,073China Vanke, Cl H . . . . . . . . . . . . . . . . . . . . . . . . . . . . . 1,600 6,634Fosun International . . . . . . . . . . . . . . . . . . . . . . . . . . . 45,500 97,348Tencent Holdings . . . . . . . . . . . . . . . . . . . . . . . . . . . . . 14,800 729,178
1,672,324
Indonesia — 3.0%
Adaro Energy . . . . . . . . . . . . . . . . . . . . . . . . . . . . . . . . . 895,600 117,974AKR Corporindo . . . . . . . . . . . . . . . . . . . . . . . . . . . . . . 81,900 28,802Astra International . . . . . . . . . . . . . . . . . . . . . . . . . . . . 909,000 465,453Bank Central Asia . . . . . . . . . . . . . . . . . . . . . . . . . . . . . 574,100 911,188Bank Danamon Indonesia . . . . . . . . . . . . . . . . . . . . . . 196,600 93,861Bank Mandiri Persero . . . . . . . . . . . . . . . . . . . . . . . . . 1,283,000 653,870Bank Negara Indonesia Persero . . . . . . . . . . . . . . . . . 343,700 198,850Bank Rakyat Indonesia Persero . . . . . . . . . . . . . . . . . 2,877,600 665,392Gudang Garam . . . . . . . . . . . . . . . . . . . . . . . . . . . . . . . 24,300 121,145Hanjaya Mandala Sampoerna . . . . . . . . . . . . . . . . . . . 467,300 118,619Indocement Tunggal Prakarsa . . . . . . . . . . . . . . . . . . 67,800 86,220Indofood CBP Sukses Makmur . . . . . . . . . . . . . . . . . . 107,500 67,041Indofood Sukses Makmur . . . . . . . . . . . . . . . . . . . . . . 202,200 101,287Jasa Marga Persero . . . . . . . . . . . . . . . . . . . . . . . . . . . 239,400 75,060Kalbe Farma . . . . . . . . . . . . . . . . . . . . . . . . . . . . . . . . . 465,100 50,365Matahari Department Store . . . . . . . . . . . . . . . . . . . . . 107,700 80,049Perusahaan Gas Negara Persero . . . . . . . . . . . . . . . . 724,400 103,088PP Persero * . . . . . . . . . . . . . . . . . . . . . . . . . . . . . . . . . 528,400 92,104Semen Indonesia Persero * . . . . . . . . . . . . . . . . . . . . . 139,700 96,837Summarecon Agung . . . . . . . . . . . . . . . . . . . . . . . . . . . 886,300 57,722Surya Citra Media . . . . . . . . . . . . . . . . . . . . . . . . . . . . . 269,500 49,414
The accompanying notes are an integral part of the financial statements.
5

THE ADVISORS’ INNER CIRCLE FUND III PINEBRIDGE DYNAMICASSET ALLOCATION FUNDAPRIL 30, 2018 (Unaudited)
COMMON STOCK — continued
Shares Value
Indonesia — continued
Telekomunikasi Indonesia Persero . . . . . . . . . . . . . . 2,369,900 $ 649,982Tower Bersama Infrastructure . . . . . . . . . . . . . . . . . . 252,600 100,799Unilever Indonesia . . . . . . . . . . . . . . . . . . . . . . . . . . . . 77,900 259,022United Tractors . . . . . . . . . . . . . . . . . . . . . . . . . . . . . . . 87,700 214,436Waskita Karya Persero . . . . . . . . . . . . . . . . . . . . . . . . . 345,900 54,843Wijaya Karya Bangunan Gedung . . . . . . . . . . . . . . . . . 2,650,500 48,117XL Axiata * . . . . . . . . . . . . . . . . . . . . . . . . . . . . . . . . . . . 216,000 32,890
5,594,430
Ireland — 0.2%
AIB Group . . . . . . . . . . . . . . . . . . . . . . . . . . . . . . . . . . . 37,246 221,881Bank of Ireland Group . . . . . . . . . . . . . . . . . . . . . . . . . 16,645 149,307
371,188
Italy — 1.0%
A2A . . . . . . . . . . . . . . . . . . . . . . . . . . . . . . . . . . . . . . . . . 24,872 50,056Assicurazioni Generali . . . . . . . . . . . . . . . . . . . . . . . . . 4,295 86,782Azimut Holding . . . . . . . . . . . . . . . . . . . . . . . . . . . . . . . 1,760 37,052BPER Banca . . . . . . . . . . . . . . . . . . . . . . . . . . . . . . . . . 6,888 39,846Davide Campari-Milano . . . . . . . . . . . . . . . . . . . . . . . . 7,174 53,767Fiat Chrysler Automobiles * . . . . . . . . . . . . . . . . . . . . 3,069 67,630FinecoBank Banca Fineco . . . . . . . . . . . . . . . . . . . . . . 6,235 74,325Intesa Sanpaolo . . . . . . . . . . . . . . . . . . . . . . . . . . . . . . 136,018 517,352Intesa Sanpaolo RSP . . . . . . . . . . . . . . . . . . . . . . . . . . 27,613 109,378Italgas . . . . . . . . . . . . . . . . . . . . . . . . . . . . . . . . . . . . . . 7,768 50,240Moncler . . . . . . . . . . . . . . . . . . . . . . . . . . . . . . . . . . . . . 2,767 124,915Poste Italiane (A) . . . . . . . . . . . . . . . . . . . . . . . . . . . . . . 7,413 72,493Recordati . . . . . . . . . . . . . . . . . . . . . . . . . . . . . . . . . . . . 1,618 57,858Saipem * . . . . . . . . . . . . . . . . . . . . . . . . . . . . . . . . . . . . 9,135 34,988STMicroelectronics . . . . . . . . . . . . . . . . . . . . . . . . . . . . 3,505 76,416UniCredit . . . . . . . . . . . . . . . . . . . . . . . . . . . . . . . . . . . . 13,529 293,029Unione di Banche Italiane . . . . . . . . . . . . . . . . . . . . . . 14,729 75,908
1,822,035
Japan — 10.5%
Ai Holdings . . . . . . . . . . . . . . . . . . . . . . . . . . . . . . . . . . 7,600 202,693Asahi Group Holdings . . . . . . . . . . . . . . . . . . . . . . . . . . 6,100 308,913Bandai Namco Holdings . . . . . . . . . . . . . . . . . . . . . . . . 5,300 180,004Capcom . . . . . . . . . . . . . . . . . . . . . . . . . . . . . . . . . . . . . 17,400 333,465Casio Computer . . . . . . . . . . . . . . . . . . . . . . . . . . . . . . 11,900 178,768
The accompanying notes are an integral part of the financial statements.
6
THE ADVISORS’ INNER CIRCLE FUND III PINEBRIDGE DYNAMICASSET ALLOCATION FUNDAPRIL 30, 2018 (Unaudited)
COMMON STOCK — continued
Shares Value
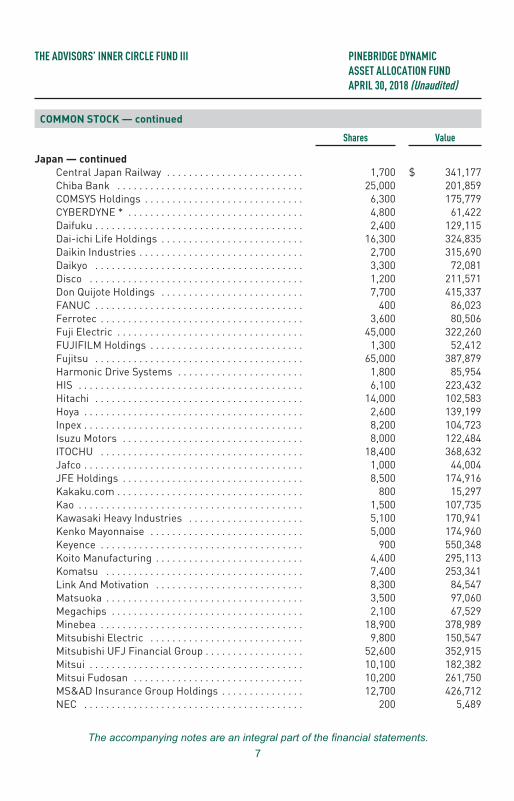
Japan — continued
Central Japan Railway . . . . . . . . . . . . . . . . . . . . . . . . . 1,700 $ 341,177Chiba Bank . . . . . . . . . . . . . . . . . . . . . . . . . . . . . . . . . . 25,000 201,859COMSYS Holdings . . . . . . . . . . . . . . . . . . . . . . . . . . . . . 6,300 175,779CYBERDYNE * . . . . . . . . . . . . . . . . . . . . . . . . . . . . . . . . 4,800 61,422Daifuku . . . . . . . . . . . . . . . . . . . . . . . . . . . . . . . . . . . . . . 2,400 129,115Dai-ichi Life Holdings . . . . . . . . . . . . . . . . . . . . . . . . . . 16,300 324,835Daikin Industries . . . . . . . . . . . . . . . . . . . . . . . . . . . . . . 2,700 315,690Daikyo . . . . . . . . . . . . . . . . . . . . . . . . . . . . . . . . . . . . . . 3,300 72,081Disco . . . . . . . . . . . . . . . . . . . . . . . . . . . . . . . . . . . . . . . 1,200 211,571Don Quijote Holdings . . . . . . . . . . . . . . . . . . . . . . . . . . 7,700 415,337FANUC . . . . . . . . . . . . . . . . . . . . . . . . . . . . . . . . . . . . . . 400 86,023Ferrotec . . . . . . . . . . . . . . . . . . . . . . . . . . . . . . . . . . . . . 3,600 80,506Fuji Electric . . . . . . . . . . . . . . . . . . . . . . . . . . . . . . . . . . 45,000 322,260FUJIFILM Holdings . . . . . . . . . . . . . . . . . . . . . . . . . . . . 1,300 52,412Fujitsu . . . . . . . . . . . . . . . . . . . . . . . . . . . . . . . . . . . . . . 65,000 387,879Harmonic Drive Systems . . . . . . . . . . . . . . . . . . . . . . . 1,800 85,954HIS . . . . . . . . . . . . . . . . . . . . . . . . . . . . . . . . . . . . . . . . . 6,100 223,432Hitachi . . . . . . . . . . . . . . . . . . . . . . . . . . . . . . . . . . . . . . 14,000 102,583Hoya . . . . . . . . . . . . . . . . . . . . . . . . . . . . . . . . . . . . . . . . 2,600 139,199Inpex . . . . . . . . . . . . . . . . . . . . . . . . . . . . . . . . . . . . . . . . 8,200 104,723Isuzu Motors . . . . . . . . . . . . . . . . . . . . . . . . . . . . . . . . . 8,000 122,484ITOCHU . . . . . . . . . . . . . . . . . . . . . . . . . . . . . . . . . . . . . 18,400 368,632Jafco . . . . . . . . . . . . . . . . . . . . . . . . . . . . . . . . . . . . . . . . 1,000 44,004JFE Holdings . . . . . . . . . . . . . . . . . . . . . . . . . . . . . . . . . 8,500 174,916Kakaku.com . . . . . . . . . . . . . . . . . . . . . . . . . . . . . . . . . . 800 15,297Kao . . . . . . . . . . . . . . . . . . . . . . . . . . . . . . . . . . . . . . . . . 1,500 107,735Kawasaki Heavy Industries . . . . . . . . . . . . . . . . . . . . . 5,100 170,941Kenko Mayonnaise . . . . . . . . . . . . . . . . . . . . . . . . . . . . 5,000 174,960Keyence . . . . . . . . . . . . . . . . . . . . . . . . . . . . . . . . . . . . . 900 550,348Koito Manufacturing . . . . . . . . . . . . . . . . . . . . . . . . . . . 4,400 295,113Komatsu . . . . . . . . . . . . . . . . . . . . . . . . . . . . . . . . . . . . 7,400 253,341Link And Motivation . . . . . . . . . . . . . . . . . . . . . . . . . . . 8,300 84,547Matsuoka . . . . . . . . . . . . . . . . . . . . . . . . . . . . . . . . . . . . 3,500 97,060Megachips . . . . . . . . . . . . . . . . . . . . . . . . . . . . . . . . . . . 2,100 67,529Minebea . . . . . . . . . . . . . . . . . . . . . . . . . . . . . . . . . . . . . 18,900 378,989Mitsubishi Electric . . . . . . . . . . . . . . . . . . . . . . . . . . . . 9,800 150,547Mitsubishi UFJ Financial Group . . . . . . . . . . . . . . . . . . 52,600 352,915Mitsui . . . . . . . . . . . . . . . . . . . . . . . . . . . . . . . . . . . . . . . 10,100 182,382Mitsui Fudosan . . . . . . . . . . . . . . . . . . . . . . . . . . . . . . . 10,200 261,750MS&AD Insurance Group Holdings . . . . . . . . . . . . . . . 12,700 426,712NEC . . . . . . . . . . . . . . . . . . . . . . . . . . . . . . . . . . . . . . . . 200 5,489
The accompanying notes are an integral part of the financial statements.
7
THE ADVISORS’ INNER CIRCLE FUND III PINEBRIDGE DYNAMICASSET ALLOCATION FUNDAPRIL 30, 2018 (Unaudited)
COMMON STOCK — continued
Shares Value
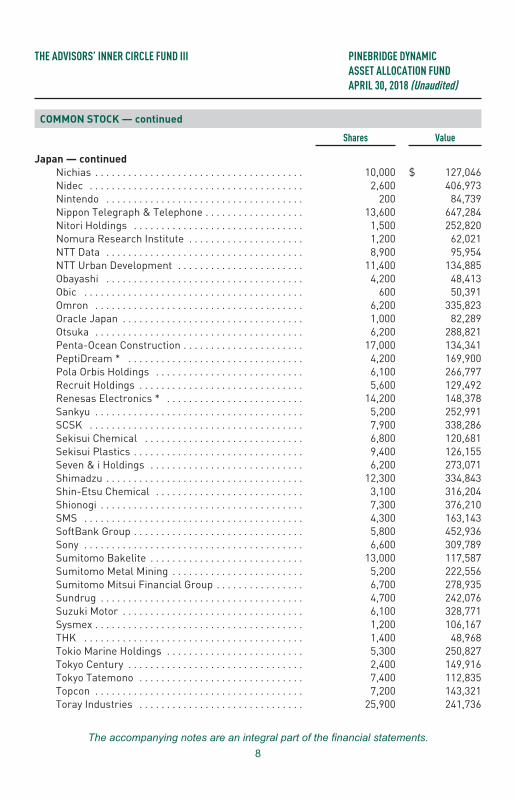
Japan — continued
Nichias . . . . . . . . . . . . . . . . . . . . . . . . . . . . . . . . . . . . . . 10,000 $ 127,046Nidec . . . . . . . . . . . . . . . . . . . . . . . . . . . . . . . . . . . . . . . 2,600 406,973Nintendo . . . . . . . . . . . . . . . . . . . . . . . . . . . . . . . . . . . . 200 84,739Nippon Telegraph & Telephone . . . . . . . . . . . . . . . . . . 13,600 647,284Nitori Holdings . . . . . . . . . . . . . . . . . . . . . . . . . . . . . . . 1,500 252,820Nomura Research Institute . . . . . . . . . . . . . . . . . . . . . 1,200 62,021NTT Data . . . . . . . . . . . . . . . . . . . . . . . . . . . . . . . . . . . . 8,900 95,954NTT Urban Development . . . . . . . . . . . . . . . . . . . . . . . 11,400 134,885Obayashi . . . . . . . . . . . . . . . . . . . . . . . . . . . . . . . . . . . . 4,200 48,413Obic . . . . . . . . . . . . . . . . . . . . . . . . . . . . . . . . . . . . . . . . 600 50,391Omron . . . . . . . . . . . . . . . . . . . . . . . . . . . . . . . . . . . . . . 6,200 335,823Oracle Japan . . . . . . . . . . . . . . . . . . . . . . . . . . . . . . . . . 1,000 82,289Otsuka . . . . . . . . . . . . . . . . . . . . . . . . . . . . . . . . . . . . . . 6,200 288,821Penta-Ocean Construction . . . . . . . . . . . . . . . . . . . . . . 17,000 134,341PeptiDream * . . . . . . . . . . . . . . . . . . . . . . . . . . . . . . . . 4,200 169,900Pola Orbis Holdings . . . . . . . . . . . . . . . . . . . . . . . . . . . 6,100 266,797Recruit Holdings . . . . . . . . . . . . . . . . . . . . . . . . . . . . . . 5,600 129,492Renesas Electronics * . . . . . . . . . . . . . . . . . . . . . . . . . 14,200 148,378Sankyu . . . . . . . . . . . . . . . . . . . . . . . . . . . . . . . . . . . . . . 5,200 252,991SCSK . . . . . . . . . . . . . . . . . . . . . . . . . . . . . . . . . . . . . . . 7,900 338,286Sekisui Chemical . . . . . . . . . . . . . . . . . . . . . . . . . . . . . 6,800 120,681Sekisui Plastics . . . . . . . . . . . . . . . . . . . . . . . . . . . . . . . 9,400 126,155Seven & i Holdings . . . . . . . . . . . . . . . . . . . . . . . . . . . . 6,200 273,071Shimadzu . . . . . . . . . . . . . . . . . . . . . . . . . . . . . . . . . . . . 12,300 334,843Shin-Etsu Chemical . . . . . . . . . . . . . . . . . . . . . . . . . . . 3,100 316,204Shionogi . . . . . . . . . . . . . . . . . . . . . . . . . . . . . . . . . . . . . 7,300 376,210SMS . . . . . . . . . . . . . . . . . . . . . . . . . . . . . . . . . . . . . . . . 4,300 163,143SoftBank Group . . . . . . . . . . . . . . . . . . . . . . . . . . . . . . . 5,800 452,936Sony . . . . . . . . . . . . . . . . . . . . . . . . . . . . . . . . . . . . . . . . 6,600 309,789Sumitomo Bakelite . . . . . . . . . . . . . . . . . . . . . . . . . . . . 13,000 117,587Sumitomo Metal Mining . . . . . . . . . . . . . . . . . . . . . . . . 5,200 222,556Sumitomo Mitsui Financial Group . . . . . . . . . . . . . . . . 6,700 278,935Sundrug . . . . . . . . . . . . . . . . . . . . . . . . . . . . . . . . . . . . . 4,700 242,076Suzuki Motor . . . . . . . . . . . . . . . . . . . . . . . . . . . . . . . . . 6,100 328,771Sysmex . . . . . . . . . . . . . . . . . . . . . . . . . . . . . . . . . . . . . . 1,200 106,167THK . . . . . . . . . . . . . . . . . . . . . . . . . . . . . . . . . . . . . . . . 1,400 48,968Tokio Marine Holdings . . . . . . . . . . . . . . . . . . . . . . . . . 5,300 250,827Tokyo Century . . . . . . . . . . . . . . . . . . . . . . . . . . . . . . . . 2,400 149,916Tokyo Tatemono . . . . . . . . . . . . . . . . . . . . . . . . . . . . . . 7,400 112,835Topcon . . . . . . . . . . . . . . . . . . . . . . . . . . . . . . . . . . . . . . 7,200 143,321Toray Industries . . . . . . . . . . . . . . . . . . . . . . . . . . . . . . 25,900 241,736
The accompanying notes are an integral part of the financial statements.
8

THE ADVISORS’ INNER CIRCLE FUND III PINEBRIDGE DYNAMICASSET ALLOCATION FUNDAPRIL 30, 2018 (Unaudited)
COMMON STOCK — continued
Shares Value
Japan — continued
Toyota Motor . . . . . . . . . . . . . . . . . . . . . . . . . . . . . . . . . 7,300 $ 478,930Trend Micro . . . . . . . . . . . . . . . . . . . . . . . . . . . . . . . . . . 4,100 246,007Yamaha Motor . . . . . . . . . . . . . . . . . . . . . . . . . . . . . . . . 7,000 224,129Yaskawa Electric . . . . . . . . . . . . . . . . . . . . . . . . . . . . . . 1,200 48,763Yokogawa Electric . . . . . . . . . . . . . . . . . . . . . . . . . . . . . 12,800 282,551Zenkoku Hosho . . . . . . . . . . . . . . . . . . . . . . . . . . . . . . . 3,900 161,087
19,539,209
Luxembourg — 0.0%
RTL Group . . . . . . . . . . . . . . . . . . . . . . . . . . . . . . . . . . . 611 50,647
Mexico — 0.0%
Grupo Financiero Banorte, Cl O . . . . . . . . . . . . . . . . . 12,300 76,922
Netherlands — 0.9%
Aalberts Industries . . . . . . . . . . . . . . . . . . . . . . . . . . . . 1,523 74,982ABN AMRO Group (A) . . . . . . . . . . . . . . . . . . . . . . . . . . 5,978 185,543ASM International . . . . . . . . . . . . . . . . . . . . . . . . . . . . . 745 44,434ASR Nederland . . . . . . . . . . . . . . . . . . . . . . . . . . . . . . . 2,335 110,312BE Semiconductor Industries . . . . . . . . . . . . . . . . . . . 603 41,534Boskalis Westminster . . . . . . . . . . . . . . . . . . . . . . . . . 1,332 39,474Euronext (A) . . . . . . . . . . . . . . . . . . . . . . . . . . . . . . . . . . 846 60,642Galapagos * . . . . . . . . . . . . . . . . . . . . . . . . . . . . . . . . . . 701 63,337Gemalto . . . . . . . . . . . . . . . . . . . . . . . . . . . . . . . . . . . . . 1,234 74,330IMCD . . . . . . . . . . . . . . . . . . . . . . . . . . . . . . . . . . . . . . . 836 51,458ING Groep . . . . . . . . . . . . . . . . . . . . . . . . . . . . . . . . . . . 37,737 634,680Koninklijke Philips . . . . . . . . . . . . . . . . . . . . . . . . . . . . 1,414 59,869Koninklijke Vopak . . . . . . . . . . . . . . . . . . . . . . . . . . . . . 1,053 51,849Philips Lighting (A) . . . . . . . . . . . . . . . . . . . . . . . . . . . . 1,612 49,054SBM Offshore . . . . . . . . . . . . . . . . . . . . . . . . . . . . . . . . 2,775 46,575
1,588,073
Norway — 0.2%
Aker BP . . . . . . . . . . . . . . . . . . . . . . . . . . . . . . . . . . . . . 1,716 56,361DNB . . . . . . . . . . . . . . . . . . . . . . . . . . . . . . . . . . . . . . . . 7,584 141,893Gjensidige Forsikring . . . . . . . . . . . . . . . . . . . . . . . . . . 2,998 47,425Schibsted, Cl A . . . . . . . . . . . . . . . . . . . . . . . . . . . . . . . 1,268 36,954Storebrand . . . . . . . . . . . . . . . . . . . . . . . . . . . . . . . . . . . 7,429 63,960Subsea 7 . . . . . . . . . . . . . . . . . . . . . . . . . . . . . . . . . . . . 4,091 57,386TGS NOPEC Geophysical . . . . . . . . . . . . . . . . . . . . . . . 1,626 51,567
455,546
The accompanying notes are an integral part of the financial statements.
9

THE ADVISORS’ INNER CIRCLE FUND III PINEBRIDGE DYNAMICASSET ALLOCATION FUNDAPRIL 30, 2018 (Unaudited)
COMMON STOCK — continued
Shares Value
Poland — 0.2%
Cyfrowy Polsat . . . . . . . . . . . . . . . . . . . . . . . . . . . . . . . 41,921 $ 305,755
Portugal — 0.0%
Banco Comercial Portugues, Cl R * . . . . . . . . . . . . . . 143,032 47,943
South Africa — 0.1%
AngloGold Ashanti . . . . . . . . . . . . . . . . . . . . . . . . . . . . 4,070 36,808Barclays Africa Group . . . . . . . . . . . . . . . . . . . . . . . . . 630 9,218Brait * . . . . . . . . . . . . . . . . . . . . . . . . . . . . . . . . . . . . . . . 7,992 27,721Zeder Investments . . . . . . . . . . . . . . . . . . . . . . . . . . . . 52,240 25,937
99,684
South Korea — 0.3%
Kakao . . . . . . . . . . . . . . . . . . . . . . . . . . . . . . . . . . . . . . . 1,790 185,798NAVER . . . . . . . . . . . . . . . . . . . . . . . . . . . . . . . . . . . . . . 368 246,513Samsung Electronics . . . . . . . . . . . . . . . . . . . . . . . . . . 85 210,083
642,394
Spain — 1.3%
Amadeus IT Group, Cl A . . . . . . . . . . . . . . . . . . . . . . . . 4,502 328,375Banco Bilbao Vizcaya Argentaria . . . . . . . . . . . . . . . . . 54,596 442,443Banco de Sabadell . . . . . . . . . . . . . . . . . . . . . . . . . . . . 48,422 94,858Banco Santander . . . . . . . . . . . . . . . . . . . . . . . . . . . . . 150,210 970,433Bolsas y Mercados Espanoles SHMSF . . . . . . . . . . . . 1,167 41,015CaixaBank . . . . . . . . . . . . . . . . . . . . . . . . . . . . . . . . . . . 21,678 105,271Cellnex Telecom (A) . . . . . . . . . . . . . . . . . . . . . . . . . . . 2,427 65,023Distribuidora Internacional de Alimentacion . . . . . . . 8,401 38,941Mapfre . . . . . . . . . . . . . . . . . . . . . . . . . . . . . . . . . . . . . . 15,790 54,809Merlin Properties Socimi ‡ . . . . . . . . . . . . . . . . . . . . . 5,797 89,591Siemens Gamesa Renewable Energy . . . . . . . . . . . . . 3,561 61,135Viscofan . . . . . . . . . . . . . . . . . . . . . . . . . . . . . . . . . . . . . 621 41,153
2,333,047
Sweden — 1.0%
BillerudKorsnas . . . . . . . . . . . . . . . . . . . . . . . . . . . . . . 2,809 41,286Bure Equity . . . . . . . . . . . . . . . . . . . . . . . . . . . . . . . . . . 850 9,139Castellum . . . . . . . . . . . . . . . . . . . . . . . . . . . . . . . . . . . 4,338 70,244Fabege . . . . . . . . . . . . . . . . . . . . . . . . . . . . . . . . . . . . . . 4,448 51,456Fastighets Balder, Cl B * . . . . . . . . . . . . . . . . . . . . . . . 1,557 40,156Getinge, Cl B . . . . . . . . . . . . . . . . . . . . . . . . . . . . . . . . . 3,543 32,980Hexagon, Cl B . . . . . . . . . . . . . . . . . . . . . . . . . . . . . . . . 2,698 156,660
The accompanying notes are an integral part of the financial statements.
10

THE ADVISORS’ INNER CIRCLE FUND III PINEBRIDGE DYNAMICASSET ALLOCATION FUNDAPRIL 30, 2018 (Unaudited)
COMMON STOCK — continued
Shares Value
Sweden — continued
Hexpol . . . . . . . . . . . . . . . . . . . . . . . . . . . . . . . . . . . . . . 4,047 $ 41,928Husqvarna, Cl B . . . . . . . . . . . . . . . . . . . . . . . . . . . . . . 6,577 63,319ICA Gruppen . . . . . . . . . . . . . . . . . . . . . . . . . . . . . . . . . 5,988 186,229Kindred Group . . . . . . . . . . . . . . . . . . . . . . . . . . . . . . . . 3,653 47,278Kinnevik . . . . . . . . . . . . . . . . . . . . . . . . . . . . . . . . . . . . . 126 4,549L E Lundbergforetagen, Cl B . . . . . . . . . . . . . . . . . . . . 587 39,790Lifco, Cl B . . . . . . . . . . . . . . . . . . . . . . . . . . . . . . . . . . . 710 25,884Loomis, Cl B . . . . . . . . . . . . . . . . . . . . . . . . . . . . . . . . . 1,141 41,655Lundin Petroleum * . . . . . . . . . . . . . . . . . . . . . . . . . . . 2,934 81,082Nibe Industrier, Cl B . . . . . . . . . . . . . . . . . . . . . . . . . . . 5,373 54,804Nordea Bank . . . . . . . . . . . . . . . . . . . . . . . . . . . . . . . . . 18,847 192,018Ratos, Cl B . . . . . . . . . . . . . . . . . . . . . . . . . . . . . . . . . . . 6,330 25,099Saab, Cl B . . . . . . . . . . . . . . . . . . . . . . . . . . . . . . . . . . . 1,061 43,466Skandinaviska Enskilda Banken, Cl A . . . . . . . . . . . . . 19,622 184,518Svenska Handelsbanken, Cl A . . . . . . . . . . . . . . . . . . . 13,877 155,090Swedbank, Cl A . . . . . . . . . . . . . . . . . . . . . . . . . . . . . . . 4,698 102,334Swedish Orphan Biovitrum * . . . . . . . . . . . . . . . . . . . . 2,618 56,385Tele2, Cl B . . . . . . . . . . . . . . . . . . . . . . . . . . . . . . . . . . . 5,566 72,422
1,819,771
Switzerland — 0.8%
ABB * . . . . . . . . . . . . . . . . . . . . . . . . . . . . . . . . . . . . . . . 6,856 160,294Aryzta . . . . . . . . . . . . . . . . . . . . . . . . . . . . . . . . . . . . . . . 1,477 31,280Barry Callebaut . . . . . . . . . . . . . . . . . . . . . . . . . . . . . . . 36 64,710Bucher Industries . . . . . . . . . . . . . . . . . . . . . . . . . . . . . 104 38,189Cembra Money Bank . . . . . . . . . . . . . . . . . . . . . . . . . . 448 38,041Credit Suisse Group . . . . . . . . . . . . . . . . . . . . . . . . . . . 16,567 279,669DKSH Holding . . . . . . . . . . . . . . . . . . . . . . . . . . . . . . . . 502 40,330dormakaba Holding . . . . . . . . . . . . . . . . . . . . . . . . . . . 48 37,227Flughafen Zurich . . . . . . . . . . . . . . . . . . . . . . . . . . . . . . 299 62,571OC Oerlikon . . . . . . . . . . . . . . . . . . . . . . . . . . . . . . . . . . 3,074 49,781Pargesa Holding . . . . . . . . . . . . . . . . . . . . . . . . . . . . . . 603 56,526Partners Group Holding . . . . . . . . . . . . . . . . . . . . . . . . 150 109,767Sunrise Communications Group (A) . . . . . . . . . . . . . . 502 39,530UBS Group . . . . . . . . . . . . . . . . . . . . . . . . . . . . . . . . . . . 27,184 458,251VAT Group (A) . . . . . . . . . . . . . . . . . . . . . . . . . . . . . . . . 344 50,908
1,517,074
Taiwan — 0.1%
Advantech . . . . . . . . . . . . . . . . . . . . . . . . . . . . . . . . . . . 20,000 137,715Chicony Electronics . . . . . . . . . . . . . . . . . . . . . . . . . . . 19,000 46,820
The accompanying notes are an integral part of the financial statements.
11

THE ADVISORS’ INNER CIRCLE FUND III PINEBRIDGE DYNAMICASSET ALLOCATION FUNDAPRIL 30, 2018 (Unaudited)
COMMON STOCK — continued
Shares Value
Taiwan — continued
CTBC Financial Holding . . . . . . . . . . . . . . . . . . . . . . . . 120,000 $ 85,874
270,409
United Kingdom — 0.5%
3i Group . . . . . . . . . . . . . . . . . . . . . . . . . . . . . . . . . . . . . 7,780 100,581Allied Minds * . . . . . . . . . . . . . . . . . . . . . . . . . . . . . . . . 8,950 14,531BAE Systems . . . . . . . . . . . . . . . . . . . . . . . . . . . . . . . . . 18,600 156,077Barratt Developments . . . . . . . . . . . . . . . . . . . . . . . . . 7,748 59,477BT Group, Cl A . . . . . . . . . . . . . . . . . . . . . . . . . . . . . . . . 48,558 166,277Carnival . . . . . . . . . . . . . . . . . . . . . . . . . . . . . . . . . . . . . 615 39,693Experian . . . . . . . . . . . . . . . . . . . . . . . . . . . . . . . . . . . . . 6,305 144,494Glanbia . . . . . . . . . . . . . . . . . . . . . . . . . . . . . . . . . . . . . . 3,219 54,574IP Group * . . . . . . . . . . . . . . . . . . . . . . . . . . . . . . . . . . . 17,530 32,294Legal & General Group . . . . . . . . . . . . . . . . . . . . . . . . . 1,517 5,623Melrose Industries . . . . . . . . . . . . . . . . . . . . . . . . . . . . 17,650 55,275
828,896
United States — 31.7%
Consumer Discretionary — 2.4%
Abercrombie & Fitch, Cl A . . . . . . . . . . . . . . . . . . . . . . 3,813 97,689Amazon.com * . . . . . . . . . . . . . . . . . . . . . . . . . . . . . . . . 56 87,703American Axle & Manufacturing Holdings * . . . . . . . 5,068 77,743American Public Education * . . . . . . . . . . . . . . . . . . . . 1,370 55,211Asbury Automotive Group * . . . . . . . . . . . . . . . . . . . . . 1,122 75,230AutoZone * . . . . . . . . . . . . . . . . . . . . . . . . . . . . . . . . . . . 5 3,123Belmond, Cl A * . . . . . . . . . . . . . . . . . . . . . . . . . . . . . . . 5,284 56,539Best Buy . . . . . . . . . . . . . . . . . . . . . . . . . . . . . . . . . . . . . 105 8,036BJ’s Restaurants . . . . . . . . . . . . . . . . . . . . . . . . . . . . . 1,149 64,172Booking Holdings * . . . . . . . . . . . . . . . . . . . . . . . . . . . . 14 30,492BorgWarner . . . . . . . . . . . . . . . . . . . . . . . . . . . . . . . . . . 514 25,155Buckle . . . . . . . . . . . . . . . . . . . . . . . . . . . . . . . . . . . . . . 1,926 44,394Caleres . . . . . . . . . . . . . . . . . . . . . . . . . . . . . . . . . . . . . . 2,830 92,626Callaway Golf . . . . . . . . . . . . . . . . . . . . . . . . . . . . . . . . . 451 7,784Capella Education . . . . . . . . . . . . . . . . . . . . . . . . . . . . . 65 5,964Career Education * . . . . . . . . . . . . . . . . . . . . . . . . . . . . 347 4,501Carnival . . . . . . . . . . . . . . . . . . . . . . . . . . . . . . . . . . . . . 1,127 71,069Cavco Industries * . . . . . . . . . . . . . . . . . . . . . . . . . . . . . 45 7,666Charter Communications, Cl A * . . . . . . . . . . . . . . . . . 41 11,123Chico’s FAS . . . . . . . . . . . . . . . . . . . . . . . . . . . . . . . . . . 7,857 78,020Children’s Place . . . . . . . . . . . . . . . . . . . . . . . . . . . . . . 383 48,852
The accompanying notes are an integral part of the financial statements.
12

THE ADVISORS’ INNER CIRCLE FUND III PINEBRIDGE DYNAMICASSET ALLOCATION FUNDAPRIL 30, 2018 (Unaudited)
COMMON STOCK — continued
Shares Value
United States — continued
Consumer Discretionary — continued
Comcast, Cl A . . . . . . . . . . . . . . . . . . . . . . . . . . . . . . . . 1,302 $ 40,870Cooper-Standard Holdings * . . . . . . . . . . . . . . . . . . . . 825 102,135Core-Mark Holding . . . . . . . . . . . . . . . . . . . . . . . . . . . . 2,736 56,389Crocs * . . . . . . . . . . . . . . . . . . . . . . . . . . . . . . . . . . . . . . 347 5,483Dave & Buster’s Entertainment * . . . . . . . . . . . . . . . . 182 7,733Delphi Automotive * . . . . . . . . . . . . . . . . . . . . . . . . . . . 59 4,990Dine Brands Global . . . . . . . . . . . . . . . . . . . . . . . . . . . . 698 55,379DISH Network, Cl A * . . . . . . . . . . . . . . . . . . . . . . . . . . 75 2,516Dollar General . . . . . . . . . . . . . . . . . . . . . . . . . . . . . . . . 19 1,834Dollar Tree * . . . . . . . . . . . . . . . . . . . . . . . . . . . . . . . . . 39 3,740Dorman Products * . . . . . . . . . . . . . . . . . . . . . . . . . . . . 801 51,472DSW, Cl A . . . . . . . . . . . . . . . . . . . . . . . . . . . . . . . . . . . . 4,311 96,135Ethan Allen Interiors . . . . . . . . . . . . . . . . . . . . . . . . . . 1,722 37,970EW Scripps, Cl A . . . . . . . . . . . . . . . . . . . . . . . . . . . . . . 2,023 22,516Express * . . . . . . . . . . . . . . . . . . . . . . . . . . . . . . . . . . . . 5,030 39,435Fiesta Restaurant Group * . . . . . . . . . . . . . . . . . . . . . . 2,711 56,931Finish Line, Cl A . . . . . . . . . . . . . . . . . . . . . . . . . . . . . . 2,663 36,137Fossil Group * . . . . . . . . . . . . . . . . . . . . . . . . . . . . . . . . 2,918 43,624Fox Factory Holding * . . . . . . . . . . . . . . . . . . . . . . . . . . 165 5,486Gannett . . . . . . . . . . . . . . . . . . . . . . . . . . . . . . . . . . . . . 7,006 67,748Gap . . . . . . . . . . . . . . . . . . . . . . . . . . . . . . . . . . . . . . . . . 24 702Garmin . . . . . . . . . . . . . . . . . . . . . . . . . . . . . . . . . . . . . . 79 4,635GCI Liberty * . . . . . . . . . . . . . . . . . . . . . . . . . . . . . . . . . 503 22,434Genesco * . . . . . . . . . . . . . . . . . . . . . . . . . . . . . . . . . . . 1,275 54,506Gentherm * . . . . . . . . . . . . . . . . . . . . . . . . . . . . . . . . . . 1,757 59,387Genuine Parts . . . . . . . . . . . . . . . . . . . . . . . . . . . . . . . . 46 4,063G-III Apparel Group * . . . . . . . . . . . . . . . . . . . . . . . . . . 2,390 87,211Group 1 Automotive . . . . . . . . . . . . . . . . . . . . . . . . . . . 1,083 70,774Guess? . . . . . . . . . . . . . . . . . . . . . . . . . . . . . . . . . . . . . . 3,556 82,819H&R Block . . . . . . . . . . . . . . . . . . . . . . . . . . . . . . . . . . . 95 2,627Haverty Furniture . . . . . . . . . . . . . . . . . . . . . . . . . . . . . 2,058 37,353Hilton Grand Vacations * . . . . . . . . . . . . . . . . . . . . . . . 104 4,472Hilton Worldwide Holdings . . . . . . . . . . . . . . . . . . . . . 356 28,067Home Depot . . . . . . . . . . . . . . . . . . . . . . . . . . . . . . . . . . 505 93,324Installed Building Products * . . . . . . . . . . . . . . . . . . . . 93 5,366International Game Technology . . . . . . . . . . . . . . . . . 17 481iRobot * . . . . . . . . . . . . . . . . . . . . . . . . . . . . . . . . . . . . . 114 6,653JC Penney * . . . . . . . . . . . . . . . . . . . . . . . . . . . . . . . . . . 17,503 50,934Kohl’s . . . . . . . . . . . . . . . . . . . . . . . . . . . . . . . . . . . . . . . 149 9,256La-Z-Boy, Cl Z . . . . . . . . . . . . . . . . . . . . . . . . . . . . . . . . 1,723 49,622
The accompanying notes are an integral part of the financial statements.
13

THE ADVISORS’ INNER CIRCLE FUND III PINEBRIDGE DYNAMICASSET ALLOCATION FUNDAPRIL 30, 2018 (Unaudited)
COMMON STOCK — continued
Shares Value
United States — continued
Consumer Discretionary — continued
LCI Industries . . . . . . . . . . . . . . . . . . . . . . . . . . . . . . . . 93 $ 8,863Lear . . . . . . . . . . . . . . . . . . . . . . . . . . . . . . . . . . . . . . . . 272 50,856LGI Homes * . . . . . . . . . . . . . . . . . . . . . . . . . . . . . . . . . 79 5,467Lithia Motors, Cl A . . . . . . . . . . . . . . . . . . . . . . . . . . . . 753 72,183Lowe’s . . . . . . . . . . . . . . . . . . . . . . . . . . . . . . . . . . . . . . 170 14,013M/I Homes * . . . . . . . . . . . . . . . . . . . . . . . . . . . . . . . . . 1,611 49,103Marriott Vacations Worldwide . . . . . . . . . . . . . . . . . . . 82 10,054McDonald’s . . . . . . . . . . . . . . . . . . . . . . . . . . . . . . . . . . 47 7,870MDC Holdings . . . . . . . . . . . . . . . . . . . . . . . . . . . . . . . . 1,653 47,954Meritage Homes * . . . . . . . . . . . . . . . . . . . . . . . . . . . . . 1,316 58,562Michael Kors Holdings * . . . . . . . . . . . . . . . . . . . . . . . 117 8,005Monro . . . . . . . . . . . . . . . . . . . . . . . . . . . . . . . . . . . . . . . 1,740 97,353Netflix * . . . . . . . . . . . . . . . . . . . . . . . . . . . . . . . . . . . . . 26 8,124New Media Investment Group . . . . . . . . . . . . . . . . . . . 3,883 64,380Nutrisystem . . . . . . . . . . . . . . . . . . . . . . . . . . . . . . . . . . 151 4,379Ollie’s Bargain Outlet Holdings * . . . . . . . . . . . . . . . . 179 11,134Omnicom Group . . . . . . . . . . . . . . . . . . . . . . . . . . . . . . 934 68,798O’Reilly Automotive * . . . . . . . . . . . . . . . . . . . . . . . . . . 9 2,305Oxford Industries . . . . . . . . . . . . . . . . . . . . . . . . . . . . . 1,036 79,813Penn National Gaming * . . . . . . . . . . . . . . . . . . . . . . . . 325 9,851Ralph Lauren, Cl A . . . . . . . . . . . . . . . . . . . . . . . . . . . . 95 10,436Red Robin Gourmet Burgers * . . . . . . . . . . . . . . . . . . . 856 53,372Regis * . . . . . . . . . . . . . . . . . . . . . . . . . . . . . . . . . . . . . . 2,363 36,910Rent-A-Center, Cl A . . . . . . . . . . . . . . . . . . . . . . . . . . . 3,393 34,303RH * . . . . . . . . . . . . . . . . . . . . . . . . . . . . . . . . . . . . . . . . 76 7,254Ross Stores . . . . . . . . . . . . . . . . . . . . . . . . . . . . . . . . . . 262 21,183Royal Caribbean Cruises . . . . . . . . . . . . . . . . . . . . . . . 3,055 330,520Scholastic . . . . . . . . . . . . . . . . . . . . . . . . . . . . . . . . . . . 1,752 72,533Shutterfly * . . . . . . . . . . . . . . . . . . . . . . . . . . . . . . . . . . 833 67,406Sleep Number * . . . . . . . . . . . . . . . . . . . . . . . . . . . . . . 181 5,130Sonic . . . . . . . . . . . . . . . . . . . . . . . . . . . . . . . . . . . . . . . 240 6,218Standard Motor Products . . . . . . . . . . . . . . . . . . . . . . . 1,159 52,561Steven Madden . . . . . . . . . . . . . . . . . . . . . . . . . . . . . . . 1,423 68,660Strayer Education . . . . . . . . . . . . . . . . . . . . . . . . . . . . . 463 48,647Sturm Ruger . . . . . . . . . . . . . . . . . . . . . . . . . . . . . . . . . 737 40,719Superior Industries International . . . . . . . . . . . . . . . . 2,106 27,694Tailored Brands . . . . . . . . . . . . . . . . . . . . . . . . . . . . . . 1,755 55,370Target . . . . . . . . . . . . . . . . . . . . . . . . . . . . . . . . . . . . . . . 315 22,869Time Warner . . . . . . . . . . . . . . . . . . . . . . . . . . . . . . . . . 590 55,932TJX . . . . . . . . . . . . . . . . . . . . . . . . . . . . . . . . . . . . . . . . . 73 6,194
The accompanying notes are an integral part of the financial statements.
14

THE ADVISORS’ INNER CIRCLE FUND III PINEBRIDGE DYNAMICASSET ALLOCATION FUNDAPRIL 30, 2018 (Unaudited)
COMMON STOCK — continued
Shares Value
United States — continued
Consumer Discretionary — continued
Toll Brothers . . . . . . . . . . . . . . . . . . . . . . . . . . . . . . . . . 434 $ 18,297TopBuild * . . . . . . . . . . . . . . . . . . . . . . . . . . . . . . . . . . . 124 9,883Twenty-First Century Fox . . . . . . . . . . . . . . . . . . . . . . 548 19,766Twenty-First Century Fox, Cl A . . . . . . . . . . . . . . . . . . 306 11,187Universal Electronics * . . . . . . . . . . . . . . . . . . . . . . . . . 1,032 47,782Vista Outdoor * . . . . . . . . . . . . . . . . . . . . . . . . . . . . . . . 3,295 55,191Visteon * . . . . . . . . . . . . . . . . . . . . . . . . . . . . . . . . . . . . 13 1,618Walt Disney . . . . . . . . . . . . . . . . . . . . . . . . . . . . . . . . . . 851 85,381Wingstop . . . . . . . . . . . . . . . . . . . . . . . . . . . . . . . . . . . . 140 6,840Winnebago Industries . . . . . . . . . . . . . . . . . . . . . . . . . . 133 5,041Wolverine World Wide . . . . . . . . . . . . . . . . . . . . . . . . . 5,220 156,391World Wrestling Entertainment, Cl A . . . . . . . . . . . . . 165 6,565Wyndham Worldwide . . . . . . . . . . . . . . . . . . . . . . . . . . 104 11,878Wynn Resorts . . . . . . . . . . . . . . . . . . . . . . . . . . . . . . . . 22 4,096
4,509,195
Consumer Staples — 1.1%
Altria Group . . . . . . . . . . . . . . . . . . . . . . . . . . . . . . . . . . 5,270 295,700Andersons . . . . . . . . . . . . . . . . . . . . . . . . . . . . . . . . . . . 1,733 56,582Avon Products * . . . . . . . . . . . . . . . . . . . . . . . . . . . . . . 2,013 5,093B&G Foods . . . . . . . . . . . . . . . . . . . . . . . . . . . . . . . . . . . 1,373 31,236Cal-Maine Foods * . . . . . . . . . . . . . . . . . . . . . . . . . . . . 1,261 61,411Campbell Soup . . . . . . . . . . . . . . . . . . . . . . . . . . . . . . . 4,904 199,985Central Garden & Pet, Cl A * . . . . . . . . . . . . . . . . . . . . 219 7,775Church & Dwight . . . . . . . . . . . . . . . . . . . . . . . . . . . . . . 244 11,273Coca-Cola . . . . . . . . . . . . . . . . . . . . . . . . . . . . . . . . . . . 642 27,741Conagra Brands . . . . . . . . . . . . . . . . . . . . . . . . . . . . . . 10,897 403,952Costco Wholesale . . . . . . . . . . . . . . . . . . . . . . . . . . . . . 166 32,729Darling Ingredients * . . . . . . . . . . . . . . . . . . . . . . . . . . 4,886 83,746Dr Pepper Snapple Group . . . . . . . . . . . . . . . . . . . . . . 34 4,079General Mills . . . . . . . . . . . . . . . . . . . . . . . . . . . . . . . . . 1,280 55,987Hershey . . . . . . . . . . . . . . . . . . . . . . . . . . . . . . . . . . . . . 314 28,869J&J Snack Foods . . . . . . . . . . . . . . . . . . . . . . . . . . . . . 334 45,895JM Smucker . . . . . . . . . . . . . . . . . . . . . . . . . . . . . . . . . 13 1,483Kellogg . . . . . . . . . . . . . . . . . . . . . . . . . . . . . . . . . . . . . . 229 13,488Kimberly-Clark . . . . . . . . . . . . . . . . . . . . . . . . . . . . . . . 592 61,296Kraft Heinz . . . . . . . . . . . . . . . . . . . . . . . . . . . . . . . . . . . 750 42,285Monster Beverage * . . . . . . . . . . . . . . . . . . . . . . . . . . . 220 12,100PepsiCo . . . . . . . . . . . . . . . . . . . . . . . . . . . . . . . . . . . . . 268 27,052Philip Morris International . . . . . . . . . . . . . . . . . . . . . . 191 15,662
The accompanying notes are an integral part of the financial statements.
15

THE ADVISORS’ INNER CIRCLE FUND III PINEBRIDGE DYNAMICASSET ALLOCATION FUNDAPRIL 30, 2018 (Unaudited)
COMMON STOCK — continued
Shares Value
United States — continued
Consumer Staples — continued
Procter & Gamble . . . . . . . . . . . . . . . . . . . . . . . . . . . . . 1,974 $ 142,799SpartanNash . . . . . . . . . . . . . . . . . . . . . . . . . . . . . . . . . 2,499 45,432Spectrum Brands Holdings . . . . . . . . . . . . . . . . . . . . . 96 6,922SUPERVALU * . . . . . . . . . . . . . . . . . . . . . . . . . . . . . . . . 2,155 37,734Sysco . . . . . . . . . . . . . . . . . . . . . . . . . . . . . . . . . . . . . . . 1,205 75,361Universal . . . . . . . . . . . . . . . . . . . . . . . . . . . . . . . . . . . . 1,482 69,728Walgreens Boots Alliance . . . . . . . . . . . . . . . . . . . . . . 1,612 107,117Walmart . . . . . . . . . . . . . . . . . . . . . . . . . . . . . . . . . . . . . 416 36,799WD-40 . . . . . . . . . . . . . . . . . . . . . . . . . . . . . . . . . . . . . . 49 6,463
2,053,774
Energy — 1.1%
Anadarko Petroleum . . . . . . . . . . . . . . . . . . . . . . . . . . 58 3,905Apache . . . . . . . . . . . . . . . . . . . . . . . . . . . . . . . . . . . . . . 342 14,005Archrock . . . . . . . . . . . . . . . . . . . . . . . . . . . . . . . . . . . . 3,703 39,992Bristow Group . . . . . . . . . . . . . . . . . . . . . . . . . . . . . . . . 1,762 28,280C&J Energy Services * . . . . . . . . . . . . . . . . . . . . . . . . . 259 7,734Carrizo Oil & Gas * . . . . . . . . . . . . . . . . . . . . . . . . . . . . 4,016 80,601Chevron . . . . . . . . . . . . . . . . . . . . . . . . . . . . . . . . . . . . . 1,423 178,032CNX Resources * . . . . . . . . . . . . . . . . . . . . . . . . . . . . . 1,031 15,321ConocoPhillips . . . . . . . . . . . . . . . . . . . . . . . . . . . . . . . 101 6,616CONSOL Energy * . . . . . . . . . . . . . . . . . . . . . . . . . . . . . 117 3,680Denbury Resources * . . . . . . . . . . . . . . . . . . . . . . . . . . 21,595 71,048Exterran * . . . . . . . . . . . . . . . . . . . . . . . . . . . . . . . . . . . 2,336 68,421Exxon Mobil . . . . . . . . . . . . . . . . . . . . . . . . . . . . . . . . . . 2,720 211,480Green Plains . . . . . . . . . . . . . . . . . . . . . . . . . . . . . . . . . 2,509 46,667Halliburton . . . . . . . . . . . . . . . . . . . . . . . . . . . . . . . . . . 237 12,559Helix Energy Solutions Group * . . . . . . . . . . . . . . . . . . 7,616 58,796HighPoint Resources * . . . . . . . . . . . . . . . . . . . . . . . . . 5,376 37,148Marathon Oil . . . . . . . . . . . . . . . . . . . . . . . . . . . . . . . . . 362 6,607Marathon Petroleum . . . . . . . . . . . . . . . . . . . . . . . . . . 1,165 87,270Matrix Service * . . . . . . . . . . . . . . . . . . . . . . . . . . . . . . . 2,282 35,143McDermott International * . . . . . . . . . . . . . . . . . . . . . . 14,973 98,822National Oilwell Varco . . . . . . . . . . . . . . . . . . . . . . . . . 63 2,436Newpark Resources * . . . . . . . . . . . . . . . . . . . . . . . . . 6,007 63,074Noble * . . . . . . . . . . . . . . . . . . . . . . . . . . . . . . . . . . . . . . 14,247 66,533Oceaneering International . . . . . . . . . . . . . . . . . . . . . . 605 12,850Oil States International * . . . . . . . . . . . . . . . . . . . . . . . 2,772 99,653PDC Energy * . . . . . . . . . . . . . . . . . . . . . . . . . . . . . . . . . 3,346 179,145ProPetro Holding * . . . . . . . . . . . . . . . . . . . . . . . . . . . . 259 4,740
The accompanying notes are an integral part of the financial statements.
16

THE ADVISORS’ INNER CIRCLE FUND III PINEBRIDGE DYNAMICASSET ALLOCATION FUNDAPRIL 30, 2018 (Unaudited)
COMMON STOCK — continued
Shares Value
United States — continued
Energy — continued
REX American Resources * . . . . . . . . . . . . . . . . . . . . . 453 $ 33,875Ring Energy * . . . . . . . . . . . . . . . . . . . . . . . . . . . . . . . . 1,896 31,701SEACOR Holdings * . . . . . . . . . . . . . . . . . . . . . . . . . . . 989 54,237SRC Energy * . . . . . . . . . . . . . . . . . . . . . . . . . . . . . . . . . 12,214 134,843Unit * . . . . . . . . . . . . . . . . . . . . . . . . . . . . . . . . . . . . . . . 2,816 63,867US Silica Holdings . . . . . . . . . . . . . . . . . . . . . . . . . . . . . 4,241 127,697Valero Energy . . . . . . . . . . . . . . . . . . . . . . . . . . . . . . . . 972 107,824Whiting Petroleum * . . . . . . . . . . . . . . . . . . . . . . . . . . . 47 1,919Williams . . . . . . . . . . . . . . . . . . . . . . . . . . . . . . . . . . . . . 136 3,499
2,100,020
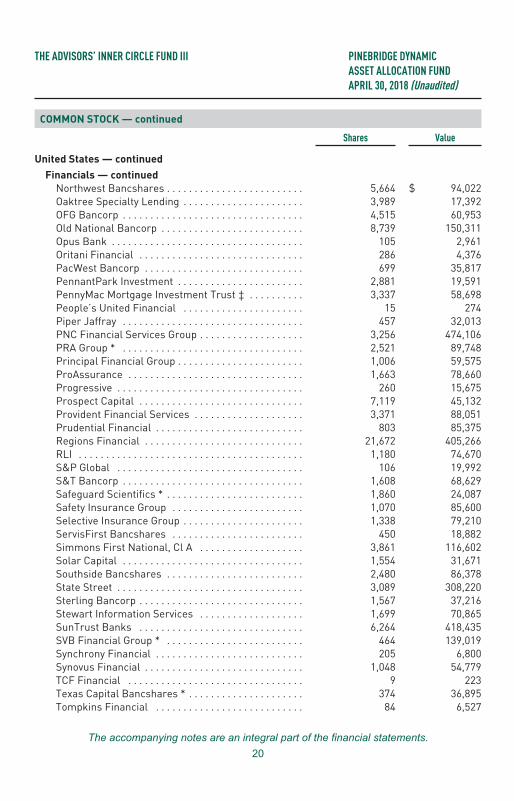
Financials — 10.9%
Affiliated Managers Group . . . . . . . . . . . . . . . . . . . . . . 188 30,994Aflac . . . . . . . . . . . . . . . . . . . . . . . . . . . . . . . . . . . . . . . . 1,802 82,117Allstate . . . . . . . . . . . . . . . . . . . . . . . . . . . . . . . . . . . . . . 961 94,005American Equity Investment Life Holding . . . . . . . . . 4,943 149,279Ameriprise Financial . . . . . . . . . . . . . . . . . . . . . . . . . . 530 74,311Ameris Bancorp . . . . . . . . . . . . . . . . . . . . . . . . . . . . . . 1,039 53,716AMERISAFE . . . . . . . . . . . . . . . . . . . . . . . . . . . . . . . . . . 120 7,116Apollo Commercial Real Estate Finance ‡ . . . . . . . . . 2,848 51,321Apollo Investment . . . . . . . . . . . . . . . . . . . . . . . . . . . . . 2,503 13,441Arch Capital Group * . . . . . . . . . . . . . . . . . . . . . . . . . . . 279 22,356Ares Capital . . . . . . . . . . . . . . . . . . . . . . . . . . . . . . . . . . 4,047 64,914ARMOUR Residential REIT ‡ . . . . . . . . . . . . . . . . . . . . 1,685 38,132Associated Banc-Corp . . . . . . . . . . . . . . . . . . . . . . . . . 1,463 38,696Athene Holding, Cl A * . . . . . . . . . . . . . . . . . . . . . . . . . 3,805 186,445Banc of California . . . . . . . . . . . . . . . . . . . . . . . . . . . . . 2,599 49,901BancorpSouth Bank . . . . . . . . . . . . . . . . . . . . . . . . . . . 402 13,286Bank of America . . . . . . . . . . . . . . . . . . . . . . . . . . . . . . 58,571 1,752,443Bank of Hawaii . . . . . . . . . . . . . . . . . . . . . . . . . . . . . . . 375 31,579Bank of New York Mellon . . . . . . . . . . . . . . . . . . . . . . . 8,860 482,958Bank of the Ozarks . . . . . . . . . . . . . . . . . . . . . . . . . . . . 598 27,986Banner . . . . . . . . . . . . . . . . . . . . . . . . . . . . . . . . . . . . . . 1,101 63,197BB&T . . . . . . . . . . . . . . . . . . . . . . . . . . . . . . . . . . . . . . . 8,279 437,131Berkshire Hathaway, Cl B * . . . . . . . . . . . . . . . . . . . . . 569 110,232BlackRock, Cl A . . . . . . . . . . . . . . . . . . . . . . . . . . . . . . . 29 15,124BlackRock Capital Investment . . . . . . . . . . . . . . . . . . . 2,141 13,510BofI Holding * . . . . . . . . . . . . . . . . . . . . . . . . . . . . . . . . 704 28,357Boston Private Financial Holdings . . . . . . . . . . . . . . . 5,932 95,209Brookline Bancorp . . . . . . . . . . . . . . . . . . . . . . . . . . . . 411 6,823
The accompanying notes are an integral part of the financial statements.
17

THE ADVISORS’ INNER CIRCLE FUND III PINEBRIDGE DYNAMICASSET ALLOCATION FUNDAPRIL 30, 2018 (Unaudited)
COMMON STOCK — continued
Shares Value
United States — continued
Financials — continued
Capital One Financial . . . . . . . . . . . . . . . . . . . . . . . . . . 5 $ 453Capstead Mortgage ‡ . . . . . . . . . . . . . . . . . . . . . . . . . . 10,182 89,602Cathay General Bancorp . . . . . . . . . . . . . . . . . . . . . . . 311 12,443Central Pacific Financial . . . . . . . . . . . . . . . . . . . . . . . 511 14,860Chemical Financial . . . . . . . . . . . . . . . . . . . . . . . . . . . . 404 22,176Chubb . . . . . . . . . . . . . . . . . . . . . . . . . . . . . . . . . . . . . . . 5 678Citigroup . . . . . . . . . . . . . . . . . . . . . . . . . . . . . . . . . . . . 20,366 1,390,386Citizens Financial Group . . . . . . . . . . . . . . . . . . . . . . . 8,988 372,912City Holding . . . . . . . . . . . . . . . . . . . . . . . . . . . . . . . . . . 33 2,362CNA Financial . . . . . . . . . . . . . . . . . . . . . . . . . . . . . . . . 97 4,895Columbia Banking System . . . . . . . . . . . . . . . . . . . . . . 2,077 83,516Comerica . . . . . . . . . . . . . . . . . . . . . . . . . . . . . . . . . . . . 1,939 183,391Community Bank System . . . . . . . . . . . . . . . . . . . . . . . 2,428 136,575Cullen . . . . . . . . . . . . . . . . . . . . . . . . . . . . . . . . . . . . . . . 479 54,822Customers Bancorp * . . . . . . . . . . . . . . . . . . . . . . . . . . 1,550 44,671CVB Financial . . . . . . . . . . . . . . . . . . . . . . . . . . . . . . . . 2,841 62,928Dime Community Bancshares . . . . . . . . . . . . . . . . . . . 609 12,028Discover Financial Services . . . . . . . . . . . . . . . . . . . . . 60 4,275Donnelley Financial Solutions * . . . . . . . . . . . . . . . . . 2,597 47,785E*TRADE Financial * . . . . . . . . . . . . . . . . . . . . . . . . . . 1,270 77,064East West Bancorp . . . . . . . . . . . . . . . . . . . . . . . . . . . . 1,247 83,075Employers Holdings . . . . . . . . . . . . . . . . . . . . . . . . . . . 1,544 63,150Encore Capital Group * . . . . . . . . . . . . . . . . . . . . . . . . . 873 38,936Enova International * . . . . . . . . . . . . . . . . . . . . . . . . . . 1,993 58,395Everest Re Group . . . . . . . . . . . . . . . . . . . . . . . . . . . . . 12 2,792EZCORP, Cl A * . . . . . . . . . . . . . . . . . . . . . . . . . . . . . . . 2,238 30,661Fidelity Southern . . . . . . . . . . . . . . . . . . . . . . . . . . . . . . 2,721 61,848Fifth Third Bancorp . . . . . . . . . . . . . . . . . . . . . . . . . . . . 10,371 344,006Financial Engines . . . . . . . . . . . . . . . . . . . . . . . . . . . . . 1,897 84,701First BanCorp * . . . . . . . . . . . . . . . . . . . . . . . . . . . . . . . 11,301 81,593First Commonwealth Financial . . . . . . . . . . . . . . . . . . 1,250 18,925First Financial Bancorp . . . . . . . . . . . . . . . . . . . . . . . . 3,436 106,344First Financial Bankshares . . . . . . . . . . . . . . . . . . . . . 1,475 73,086First Midwest Bancorp . . . . . . . . . . . . . . . . . . . . . . . . . 5,294 128,697FirstCash . . . . . . . . . . . . . . . . . . . . . . . . . . . . . . . . . . . . 152 13,178FS Investment . . . . . . . . . . . . . . . . . . . . . . . . . . . . . . . . 5,740 43,624Fulton Financial . . . . . . . . . . . . . . . . . . . . . . . . . . . . . . 635 10,732Glacier Bancorp . . . . . . . . . . . . . . . . . . . . . . . . . . . . . . 1,749 64,765Goldman Sachs Group . . . . . . . . . . . . . . . . . . . . . . . . . 1,430 340,812Great Western Bancorp . . . . . . . . . . . . . . . . . . . . . . . . 3,101 127,575
The accompanying notes are an integral part of the financial statements.
18

THE ADVISORS’ INNER CIRCLE FUND III PINEBRIDGE DYNAMICASSET ALLOCATION FUNDAPRIL 30, 2018 (Unaudited)
COMMON STOCK — continued
Shares Value
United States — continued
Financials — continued
Green Dot, Cl A * . . . . . . . . . . . . . . . . . . . . . . . . . . . . . . 162 $ 9,851Hancock Holding . . . . . . . . . . . . . . . . . . . . . . . . . . . . . . 239 11,675Hanmi Financial . . . . . . . . . . . . . . . . . . . . . . . . . . . . . . 469 12,944Hercules Capital . . . . . . . . . . . . . . . . . . . . . . . . . . . . . . 2,733 33,889Home BancShares . . . . . . . . . . . . . . . . . . . . . . . . . . . . 1,037 24,100HomeStreet * . . . . . . . . . . . . . . . . . . . . . . . . . . . . . . . . 2,029 51,740Hope Bancorp . . . . . . . . . . . . . . . . . . . . . . . . . . . . . . . . 7,116 123,036Horace Mann Educators . . . . . . . . . . . . . . . . . . . . . . . . 2,438 108,979Huntington Bancshares . . . . . . . . . . . . . . . . . . . . . . . . 9,425 140,527Independent Bank . . . . . . . . . . . . . . . . . . . . . . . . . . . . . 755 54,587Infinity Property & Casualty . . . . . . . . . . . . . . . . . . . . . 786 103,752International Bancshares . . . . . . . . . . . . . . . . . . . . . . 348 13,850International. FCStone * . . . . . . . . . . . . . . . . . . . . . . . 1,348 60,417Invesco . . . . . . . . . . . . . . . . . . . . . . . . . . . . . . . . . . . . . . 235 6,808Invesco Mortgage Capital ‡ . . . . . . . . . . . . . . . . . . . . . 3,644 59,142Investment Technology Group . . . . . . . . . . . . . . . . . . . 2,509 50,732JPMorgan Chase . . . . . . . . . . . . . . . . . . . . . . . . . . . . . . 23,000 2,501,939KeyCorp . . . . . . . . . . . . . . . . . . . . . . . . . . . . . . . . . . . . . 9,419 187,626LegacyTexas Financial Group . . . . . . . . . . . . . . . . . . . 320 13,142LendingTree * . . . . . . . . . . . . . . . . . . . . . . . . . . . . . . . . 64 15,258Leucadia National . . . . . . . . . . . . . . . . . . . . . . . . . . . . . 3,699 88,924Lincoln National . . . . . . . . . . . . . . . . . . . . . . . . . . . . . . 43 3,038Loews . . . . . . . . . . . . . . . . . . . . . . . . . . . . . . . . . . . . . . . 1,780 93,379M&T Bank . . . . . . . . . . . . . . . . . . . . . . . . . . . . . . . . . . . 2,493 454,399Maiden Holdings . . . . . . . . . . . . . . . . . . . . . . . . . . . . . . 4,538 34,716Main Street Capital . . . . . . . . . . . . . . . . . . . . . . . . . . . . 1,570 59,283MB Financial . . . . . . . . . . . . . . . . . . . . . . . . . . . . . . . . . 520 22,162Medley Capital . . . . . . . . . . . . . . . . . . . . . . . . . . . . . . . . 1,903 8,316Mercury General . . . . . . . . . . . . . . . . . . . . . . . . . . . . . . 38 1,738MetLife . . . . . . . . . . . . . . . . . . . . . . . . . . . . . . . . . . . . . . 176 8,390Morgan Stanley . . . . . . . . . . . . . . . . . . . . . . . . . . . . . . . 8,649 446,461Nasdaq . . . . . . . . . . . . . . . . . . . . . . . . . . . . . . . . . . . . . . 169 14,926National Bank Holdings, Cl A . . . . . . . . . . . . . . . . . . . . 387 13,615Navigators Group . . . . . . . . . . . . . . . . . . . . . . . . . . . . . 1,319 74,524NBT Bancorp . . . . . . . . . . . . . . . . . . . . . . . . . . . . . . . . . 2,652 96,904New Mountain Finance . . . . . . . . . . . . . . . . . . . . . . . . . 1,567 21,155New York Community Bancorp . . . . . . . . . . . . . . . . . . 13,846 164,490NMI Holdings, Cl A * . . . . . . . . . . . . . . . . . . . . . . . . . . . 306 4,238Northern Trust . . . . . . . . . . . . . . . . . . . . . . . . . . . . . . . 759 81,023Northfield Bancorp . . . . . . . . . . . . . . . . . . . . . . . . . . . . 911 14,430
The accompanying notes are an integral part of the financial statements.
19
THE ADVISORS’ INNER CIRCLE FUND III PINEBRIDGE DYNAMICASSET ALLOCATION FUNDAPRIL 30, 2018 (Unaudited)
COMMON STOCK — continued
Shares Value
United States — continued
Financials — continued
Northwest Bancshares . . . . . . . . . . . . . . . . . . . . . . . . . 5,664 $ 94,022Oaktree Specialty Lending . . . . . . . . . . . . . . . . . . . . . . 3,989 17,392OFG Bancorp . . . . . . . . . . . . . . . . . . . . . . . . . . . . . . . . . 4,515 60,953Old National Bancorp . . . . . . . . . . . . . . . . . . . . . . . . . . 8,739 150,311Opus Bank . . . . . . . . . . . . . . . . . . . . . . . . . . . . . . . . . . . 105 2,961Oritani Financial . . . . . . . . . . . . . . . . . . . . . . . . . . . . . . 286 4,376PacWest Bancorp . . . . . . . . . . . . . . . . . . . . . . . . . . . . . 699 35,817PennantPark Investment . . . . . . . . . . . . . . . . . . . . . . . 2,881 19,591PennyMac Mortgage Investment Trust ‡ . . . . . . . . . . 3,337 58,698People’s United Financial . . . . . . . . . . . . . . . . . . . . . . 15 274Piper Jaffray . . . . . . . . . . . . . . . . . . . . . . . . . . . . . . . . . 457 32,013PNC Financial Services Group . . . . . . . . . . . . . . . . . . . 3,256 474,106PRA Group * . . . . . . . . . . . . . . . . . . . . . . . . . . . . . . . . . 2,521 89,748Principal Financial Group . . . . . . . . . . . . . . . . . . . . . . . 1,006 59,575ProAssurance . . . . . . . . . . . . . . . . . . . . . . . . . . . . . . . . 1,663 78,660Progressive . . . . . . . . . . . . . . . . . . . . . . . . . . . . . . . . . . 260 15,675Prospect Capital . . . . . . . . . . . . . . . . . . . . . . . . . . . . . . 7,119 45,132Provident Financial Services . . . . . . . . . . . . . . . . . . . . 3,371 88,051Prudential Financial . . . . . . . . . . . . . . . . . . . . . . . . . . . 803 85,375Regions Financial . . . . . . . . . . . . . . . . . . . . . . . . . . . . . 21,672 405,266RLI . . . . . . . . . . . . . . . . . . . . . . . . . . . . . . . . . . . . . . . . . 1,180 74,670S&P Global . . . . . . . . . . . . . . . . . . . . . . . . . . . . . . . . . . 106 19,992S&T Bancorp . . . . . . . . . . . . . . . . . . . . . . . . . . . . . . . . . 1,608 68,629Safeguard Scientifics * . . . . . . . . . . . . . . . . . . . . . . . . . 1,860 24,087Safety Insurance Group . . . . . . . . . . . . . . . . . . . . . . . . 1,070 85,600Selective Insurance Group . . . . . . . . . . . . . . . . . . . . . . 1,338 79,210ServisFirst Bancshares . . . . . . . . . . . . . . . . . . . . . . . . 450 18,882Simmons First National, Cl A . . . . . . . . . . . . . . . . . . . 3,861 116,602Solar Capital . . . . . . . . . . . . . . . . . . . . . . . . . . . . . . . . . 1,554 31,671Southside Bancshares . . . . . . . . . . . . . . . . . . . . . . . . . 2,480 86,378State Street . . . . . . . . . . . . . . . . . . . . . . . . . . . . . . . . . . 3,089 308,220Sterling Bancorp . . . . . . . . . . . . . . . . . . . . . . . . . . . . . . 1,567 37,216Stewart Information Services . . . . . . . . . . . . . . . . . . . 1,699 70,865SunTrust Banks . . . . . . . . . . . . . . . . . . . . . . . . . . . . . . 6,264 418,435SVB Financial Group * . . . . . . . . . . . . . . . . . . . . . . . . . 464 139,019Synchrony Financial . . . . . . . . . . . . . . . . . . . . . . . . . . . 205 6,800Synovus Financial . . . . . . . . . . . . . . . . . . . . . . . . . . . . . 1,048 54,779TCF Financial . . . . . . . . . . . . . . . . . . . . . . . . . . . . . . . . 9 223Texas Capital Bancshares * . . . . . . . . . . . . . . . . . . . . . 374 36,895Tompkins Financial . . . . . . . . . . . . . . . . . . . . . . . . . . . 84 6,527
The accompanying notes are an integral part of the financial statements.
20
THE ADVISORS’ INNER CIRCLE FUND III PINEBRIDGE DYNAMICASSET ALLOCATION FUNDAPRIL 30, 2018 (Unaudited)
COMMON STOCK — continued
Shares Value
United States — continued
Financials — continued
Triangle Capital . . . . . . . . . . . . . . . . . . . . . . . . . . . . . . . 741 $ 8,588TrustCo Bank NY . . . . . . . . . . . . . . . . . . . . . . . . . . . . . . 8,883 75,950Trustmark . . . . . . . . . . . . . . . . . . . . . . . . . . . . . . . . . . . 147 4,603UMB Financial . . . . . . . . . . . . . . . . . . . . . . . . . . . . . . . . 235 17,996Umpqua Holdings . . . . . . . . . . . . . . . . . . . . . . . . . . . . . 1,023 24,102United Bankshares . . . . . . . . . . . . . . . . . . . . . . . . . . . . 671 22,780United Community Banks . . . . . . . . . . . . . . . . . . . . . . 1,935 61,785United Fire Group . . . . . . . . . . . . . . . . . . . . . . . . . . . . . 1,782 89,617Universal Insurance Holdings . . . . . . . . . . . . . . . . . . . 188 6,101Unum Group . . . . . . . . . . . . . . . . . . . . . . . . . . . . . . . . . 928 44,897US Bancorp . . . . . . . . . . . . . . . . . . . . . . . . . . . . . . . . . . 17,929 904,517Valley National Bancorp . . . . . . . . . . . . . . . . . . . . . . . . 2,035 25,539Virtus Investment Partners . . . . . . . . . . . . . . . . . . . . . 460 53,061Waddell & Reed Financial, Cl A . . . . . . . . . . . . . . . . . . 4,831 97,779Walker & Dunlop . . . . . . . . . . . . . . . . . . . . . . . . . . . . . . 341 19,475Washington Federal . . . . . . . . . . . . . . . . . . . . . . . . . . . 737 23,400Webster Financial . . . . . . . . . . . . . . . . . . . . . . . . . . . . . 12 722Wells Fargo . . . . . . . . . . . . . . . . . . . . . . . . . . . . . . . . . . 26,641 1,384,265Westamerica Bancorporation . . . . . . . . . . . . . . . . . . . 1,683 93,928Wintrust Financial . . . . . . . . . . . . . . . . . . . . . . . . . . . . . 198 17,711WisdomTree Investments . . . . . . . . . . . . . . . . . . . . . . 3,820 40,377World Acceptance * . . . . . . . . . . . . . . . . . . . . . . . . . . . 338 34,645
20,273,935
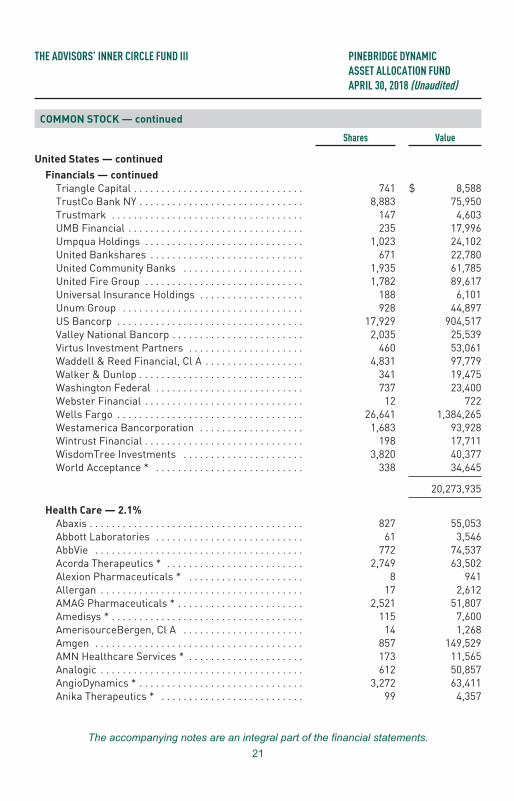
Health Care — 2.1%
Abaxis . . . . . . . . . . . . . . . . . . . . . . . . . . . . . . . . . . . . . . . 827 55,053Abbott Laboratories . . . . . . . . . . . . . . . . . . . . . . . . . . . 61 3,546AbbVie . . . . . . . . . . . . . . . . . . . . . . . . . . . . . . . . . . . . . . 772 74,537Acorda Therapeutics * . . . . . . . . . . . . . . . . . . . . . . . . . 2,749 63,502Alexion Pharmaceuticals * . . . . . . . . . . . . . . . . . . . . . 8 941Allergan . . . . . . . . . . . . . . . . . . . . . . . . . . . . . . . . . . . . . 17 2,612AMAG Pharmaceuticals * . . . . . . . . . . . . . . . . . . . . . . . 2,521 51,807Amedisys * . . . . . . . . . . . . . . . . . . . . . . . . . . . . . . . . . . . 115 7,600AmerisourceBergen, Cl A . . . . . . . . . . . . . . . . . . . . . . 14 1,268Amgen . . . . . . . . . . . . . . . . . . . . . . . . . . . . . . . . . . . . . . 857 149,529AMN Healthcare Services * . . . . . . . . . . . . . . . . . . . . . 173 11,565Analogic . . . . . . . . . . . . . . . . . . . . . . . . . . . . . . . . . . . . . 612 50,857AngioDynamics * . . . . . . . . . . . . . . . . . . . . . . . . . . . . . . 3,272 63,411Anika Therapeutics * . . . . . . . . . . . . . . . . . . . . . . . . . . 99 4,357
The accompanying notes are an integral part of the financial statements.
21

THE ADVISORS’ INNER CIRCLE FUND III PINEBRIDGE DYNAMICASSET ALLOCATION FUNDAPRIL 30, 2018 (Unaudited)
COMMON STOCK — continued
Shares Value
United States — continued
Health Care — continued
Anthem . . . . . . . . . . . . . . . . . . . . . . . . . . . . . . . . . . . . . 225 $ 53,098Baxter International . . . . . . . . . . . . . . . . . . . . . . . . . . . 164 11,398Biogen * . . . . . . . . . . . . . . . . . . . . . . . . . . . . . . . . . . . . . 83 22,709BioTelemetry * . . . . . . . . . . . . . . . . . . . . . . . . . . . . . . . 160 6,112Bristol-Myers Squibb . . . . . . . . . . . . . . . . . . . . . . . . . . 247 12,876Cambrex * . . . . . . . . . . . . . . . . . . . . . . . . . . . . . . . . . . . 855 45,272Celgene * . . . . . . . . . . . . . . . . . . . . . . . . . . . . . . . . . . . . 167 14,546Centene * . . . . . . . . . . . . . . . . . . . . . . . . . . . . . . . . . . . . 96 10,424Cerner * . . . . . . . . . . . . . . . . . . . . . . . . . . . . . . . . . . . . . 217 12,640Chemed . . . . . . . . . . . . . . . . . . . . . . . . . . . . . . . . . . . . . 52 16,027Cigna . . . . . . . . . . . . . . . . . . . . . . . . . . . . . . . . . . . . . . . 279 47,938Community Health Systems * . . . . . . . . . . . . . . . . . . . 6,732 25,447Computer Programs & Systems . . . . . . . . . . . . . . . . . 1,742 51,999CONMED . . . . . . . . . . . . . . . . . . . . . . . . . . . . . . . . . . . . 1,188 77,256Cooper . . . . . . . . . . . . . . . . . . . . . . . . . . . . . . . . . . . . . . 26 5,946Corcept Therapeutics * . . . . . . . . . . . . . . . . . . . . . . . . 388 6,472CVS Health . . . . . . . . . . . . . . . . . . . . . . . . . . . . . . . . . . . 6,716 468,978DaVita * . . . . . . . . . . . . . . . . . . . . . . . . . . . . . . . . . . . . . 121 7,598Diplomat Pharmacy * . . . . . . . . . . . . . . . . . . . . . . . . . . 2,773 60,424Edwards Lifesciences * . . . . . . . . . . . . . . . . . . . . . . . . 77 9,807Eli Lilly . . . . . . . . . . . . . . . . . . . . . . . . . . . . . . . . . . . . . . 124 10,053Emergent BioSolutions * . . . . . . . . . . . . . . . . . . . . . . . 143 7,416Enanta Pharmaceuticals * . . . . . . . . . . . . . . . . . . . . . . 64 5,955Ensign Group . . . . . . . . . . . . . . . . . . . . . . . . . . . . . . . . . 247 6,884Express Scripts Holding * . . . . . . . . . . . . . . . . . . . . . . 1,469 111,203Haemonetics * . . . . . . . . . . . . . . . . . . . . . . . . . . . . . . . . 1,301 101,530HealthEquity * . . . . . . . . . . . . . . . . . . . . . . . . . . . . . . . . 200 13,134HMS Holdings * . . . . . . . . . . . . . . . . . . . . . . . . . . . . . . . 2,976 53,598Humana . . . . . . . . . . . . . . . . . . . . . . . . . . . . . . . . . . . . . 109 32,066Impax Laboratories * . . . . . . . . . . . . . . . . . . . . . . . . . . 2,452 46,098Innoviva * . . . . . . . . . . . . . . . . . . . . . . . . . . . . . . . . . . . . 299 4,336Inogen * . . . . . . . . . . . . . . . . . . . . . . . . . . . . . . . . . . . . . 65 9,138Integer Holdings * . . . . . . . . . . . . . . . . . . . . . . . . . . . . . 123 6,753Integra LifeSciences Holdings * . . . . . . . . . . . . . . . . . 1,455 89,672Intuitive Surgical * . . . . . . . . . . . . . . . . . . . . . . . . . . . . 366 161,325Invacare . . . . . . . . . . . . . . . . . . . . . . . . . . . . . . . . . . . . . 2,355 42,861Johnson & Johnson . . . . . . . . . . . . . . . . . . . . . . . . . . . 1,202 152,041Kindred Healthcare * . . . . . . . . . . . . . . . . . . . . . . . . . . 4,806 42,773Laboratory Corp of America Holdings * . . . . . . . . . . . 7 1,195LHC Group * . . . . . . . . . . . . . . . . . . . . . . . . . . . . . . . . . 125 9,303
The accompanying notes are an integral part of the financial statements.
22

THE ADVISORS’ INNER CIRCLE FUND III PINEBRIDGE DYNAMICASSET ALLOCATION FUNDAPRIL 30, 2018 (Unaudited)
COMMON STOCK — continued
Shares Value
United States — continued
Health Care — continued
Ligand Pharmaceuticals * . . . . . . . . . . . . . . . . . . . . . . 81 $ 12,543Luminex . . . . . . . . . . . . . . . . . . . . . . . . . . . . . . . . . . . . . 324 6,917Magellan Health * . . . . . . . . . . . . . . . . . . . . . . . . . . . . . 1,260 105,651McKesson . . . . . . . . . . . . . . . . . . . . . . . . . . . . . . . . . . . 35 5,467Medicines * . . . . . . . . . . . . . . . . . . . . . . . . . . . . . . . . . . 2,210 66,499Medtronic . . . . . . . . . . . . . . . . . . . . . . . . . . . . . . . . . . . . 376 30,129Merck . . . . . . . . . . . . . . . . . . . . . . . . . . . . . . . . . . . . . . . 1,435 84,478Meridian Bioscience . . . . . . . . . . . . . . . . . . . . . . . . . . . 381 5,563Merit Medical Systems * . . . . . . . . . . . . . . . . . . . . . . . 199 9,652MiMedx Group * . . . . . . . . . . . . . . . . . . . . . . . . . . . . . . 515 4,228Momenta Pharmaceuticals * . . . . . . . . . . . . . . . . . . . . 357 7,426Myriad Genetics * . . . . . . . . . . . . . . . . . . . . . . . . . . . . . 271 7,667Natus Medical * . . . . . . . . . . . . . . . . . . . . . . . . . . . . . . . 173 5,718Neogen * . . . . . . . . . . . . . . . . . . . . . . . . . . . . . . . . . . . . 196 13,357Omnicell * . . . . . . . . . . . . . . . . . . . . . . . . . . . . . . . . . . . 158 6,810OraSure Technologies * . . . . . . . . . . . . . . . . . . . . . . . . 284 5,035Patterson . . . . . . . . . . . . . . . . . . . . . . . . . . . . . . . . . . . . 608 14,154Perrigo . . . . . . . . . . . . . . . . . . . . . . . . . . . . . . . . . . . . . . 42 3,282Pfizer . . . . . . . . . . . . . . . . . . . . . . . . . . . . . . . . . . . . . . . 4,820 176,460Premier, Cl A * . . . . . . . . . . . . . . . . . . . . . . . . . . . . . . . 102 3,365Repligen * . . . . . . . . . . . . . . . . . . . . . . . . . . . . . . . . . . . 174 6,438Select Medical Holdings * . . . . . . . . . . . . . . . . . . . . . . 3,197 57,706Spectrum Pharmaceuticals * . . . . . . . . . . . . . . . . . . . 2,240 35,661Supernus Pharmaceuticals * . . . . . . . . . . . . . . . . . . . . 200 9,380Tivity Health * . . . . . . . . . . . . . . . . . . . . . . . . . . . . . . . . 146 5,249UnitedHealth Group . . . . . . . . . . . . . . . . . . . . . . . . . . . 523 123,637Varex Imaging * . . . . . . . . . . . . . . . . . . . . . . . . . . . . . . . 1,261 45,383Varian Medical Systems * . . . . . . . . . . . . . . . . . . . . . . 55 6,357Veeva Systems, Cl A * . . . . . . . . . . . . . . . . . . . . . . . . . . 3,985 279,468Vertex Pharmaceuticals * . . . . . . . . . . . . . . . . . . . . . . 8 1,225Waters * . . . . . . . . . . . . . . . . . . . . . . . . . . . . . . . . . . . . . 10 1,884WellCare Health Plans * . . . . . . . . . . . . . . . . . . . . . . . 1,326 272,042
3,833,717
Industrials — 3.0%
AAR . . . . . . . . . . . . . . . . . . . . . . . . . . . . . . . . . . . . . . . . . 1,975 85,518ABM Industries . . . . . . . . . . . . . . . . . . . . . . . . . . . . . . . 2,774 86,355Actuant, Cl A . . . . . . . . . . . . . . . . . . . . . . . . . . . . . . . . . 2,125 50,044Acuity Brands . . . . . . . . . . . . . . . . . . . . . . . . . . . . . . . . 58 6,947Aegion, Cl A * . . . . . . . . . . . . . . . . . . . . . . . . . . . . . . . . 2,426 55,046
The accompanying notes are an integral part of the financial statements.
23

THE ADVISORS’ INNER CIRCLE FUND III PINEBRIDGE DYNAMICASSET ALLOCATION FUNDAPRIL 30, 2018 (Unaudited)
COMMON STOCK — continued
Shares Value
United States — continued
Industrials — continued
Aerojet Rocketdyne Holdings * . . . . . . . . . . . . . . . . . . 284 $ 7,935Aerovironment * . . . . . . . . . . . . . . . . . . . . . . . . . . . . . . 96 5,232Albany International, Cl A . . . . . . . . . . . . . . . . . . . . . . 109 6,447Allegiant Travel, Cl A . . . . . . . . . . . . . . . . . . . . . . . . . . 285 45,671Allison Transmission Holdings . . . . . . . . . . . . . . . . . . 4,163 162,315American Airlines Group . . . . . . . . . . . . . . . . . . . . . . . 87 3,735American Woodmark * . . . . . . . . . . . . . . . . . . . . . . . . . 59 4,850AMETEK . . . . . . . . . . . . . . . . . . . . . . . . . . . . . . . . . . . . . 492 34,342Apogee Enterprises . . . . . . . . . . . . . . . . . . . . . . . . . . . 143 5,879Applied Industrial Technologies . . . . . . . . . . . . . . . . . 2,046 130,842ArcBest . . . . . . . . . . . . . . . . . . . . . . . . . . . . . . . . . . . . . 1,517 48,696ASGN * . . . . . . . . . . . . . . . . . . . . . . . . . . . . . . . . . . . . . . 177 14,272Astec Industries . . . . . . . . . . . . . . . . . . . . . . . . . . . . . . 1,021 56,727Atlas Air Worldwide Holdings * . . . . . . . . . . . . . . . . . . 1,410 89,394Axon Enterprise * . . . . . . . . . . . . . . . . . . . . . . . . . . . . . 203 8,522AZZ . . . . . . . . . . . . . . . . . . . . . . . . . . . . . . . . . . . . . . . . . 1,206 53,727Barnes Group . . . . . . . . . . . . . . . . . . . . . . . . . . . . . . . . 159 8,829Boeing . . . . . . . . . . . . . . . . . . . . . . . . . . . . . . . . . . . . . . 1,475 492,000Brady, Cl A . . . . . . . . . . . . . . . . . . . . . . . . . . . . . . . . . . . 1,402 51,033Briggs & Stratton . . . . . . . . . . . . . . . . . . . . . . . . . . . . . 3,087 55,659Carlisle . . . . . . . . . . . . . . . . . . . . . . . . . . . . . . . . . . . . . 1,004 108,161Caterpillar . . . . . . . . . . . . . . . . . . . . . . . . . . . . . . . . . . . 77 11,116Chart Industries * . . . . . . . . . . . . . . . . . . . . . . . . . . . . . 1,676 95,096CIRCOR International . . . . . . . . . . . . . . . . . . . . . . . . . . 1,117 47,327Clean Harbors * . . . . . . . . . . . . . . . . . . . . . . . . . . . . . . 238 10,900Comfort Systems USA . . . . . . . . . . . . . . . . . . . . . . . . . 157 6,625CSX . . . . . . . . . . . . . . . . . . . . . . . . . . . . . . . . . . . . . . . . . 255 15,144Cubic . . . . . . . . . . . . . . . . . . . . . . . . . . . . . . . . . . . . . . . 904 55,822Cummins . . . . . . . . . . . . . . . . . . . . . . . . . . . . . . . . . . . . 174 27,816Delta Air Lines . . . . . . . . . . . . . . . . . . . . . . . . . . . . . . . . 1,288 67,259Dover . . . . . . . . . . . . . . . . . . . . . . . . . . . . . . . . . . . . . . . 190 17,613DXP Enterprises * . . . . . . . . . . . . . . . . . . . . . . . . . . . . . 1,095 39,749Eaton . . . . . . . . . . . . . . . . . . . . . . . . . . . . . . . . . . . . . . . 311 23,334Echo Global Logistics * . . . . . . . . . . . . . . . . . . . . . . . . 1,596 43,571Encore Wire . . . . . . . . . . . . . . . . . . . . . . . . . . . . . . . . . . 1,395 73,447EnPro Industries . . . . . . . . . . . . . . . . . . . . . . . . . . . . . . 78 5,862ESCO Technologies . . . . . . . . . . . . . . . . . . . . . . . . . . . . 104 5,808Essendant . . . . . . . . . . . . . . . . . . . . . . . . . . . . . . . . . . . 3,557 26,464Expeditors International of Washington . . . . . . . . . . . 23 1,469Exponent . . . . . . . . . . . . . . . . . . . . . . . . . . . . . . . . . . . . 90 7,776
The accompanying notes are an integral part of the financial statements.
24

THE ADVISORS’ INNER CIRCLE FUND III PINEBRIDGE DYNAMICASSET ALLOCATION FUNDAPRIL 30, 2018 (Unaudited)
COMMON STOCK — continued
Shares Value
United States — continued
Industrials — continued
Federal Signal . . . . . . . . . . . . . . . . . . . . . . . . . . . . . . . . 2,947 $ 63,832Fluor . . . . . . . . . . . . . . . . . . . . . . . . . . . . . . . . . . . . . . . . 168 9,904Forward Air . . . . . . . . . . . . . . . . . . . . . . . . . . . . . . . . . . 118 6,371Franklin Electric . . . . . . . . . . . . . . . . . . . . . . . . . . . . . . 1,176 48,216FTI Consulting * . . . . . . . . . . . . . . . . . . . . . . . . . . . . . . 1,987 116,041General Cable . . . . . . . . . . . . . . . . . . . . . . . . . . . . . . . . 2,732 81,004General Dynamics . . . . . . . . . . . . . . . . . . . . . . . . . . . . . 55 11,072General Electric . . . . . . . . . . . . . . . . . . . . . . . . . . . . . . 2,609 36,709Gibraltar Industries * . . . . . . . . . . . . . . . . . . . . . . . . . . 1,606 56,451Greenbrier . . . . . . . . . . . . . . . . . . . . . . . . . . . . . . . . . . . 1,532 67,178Harris . . . . . . . . . . . . . . . . . . . . . . . . . . . . . . . . . . . . . . . 7 1,095Harsco * . . . . . . . . . . . . . . . . . . . . . . . . . . . . . . . . . . . . . 322 6,585Hawaiian Holdings . . . . . . . . . . . . . . . . . . . . . . . . . . . . 2,757 113,588Hillenbrand . . . . . . . . . . . . . . . . . . . . . . . . . . . . . . . . . . 1,387 64,287Honeywell International . . . . . . . . . . . . . . . . . . . . . . . . 557 80,587Hub Group, Cl A * . . . . . . . . . . . . . . . . . . . . . . . . . . . . . 1,929 84,780Huntington Ingalls Industries . . . . . . . . . . . . . . . . . . . 56 13,620Ingersoll-Rand . . . . . . . . . . . . . . . . . . . . . . . . . . . . . . . 381 31,962Insperity . . . . . . . . . . . . . . . . . . . . . . . . . . . . . . . . . . . . . 135 10,834Interface, Cl A . . . . . . . . . . . . . . . . . . . . . . . . . . . . . . . . 267 5,874John Bean Technologies . . . . . . . . . . . . . . . . . . . . . . . 107 11,529Johnson Controls International . . . . . . . . . . . . . . . . . . 36 1,219Kaman . . . . . . . . . . . . . . . . . . . . . . . . . . . . . . . . . . . . . . 1,703 103,270Kansas City Southern . . . . . . . . . . . . . . . . . . . . . . . . . . 245 26,124KAR Auction Services . . . . . . . . . . . . . . . . . . . . . . . . . . 569 29,582Kelly Services, Cl A . . . . . . . . . . . . . . . . . . . . . . . . . . . . 2,144 62,733Korn . . . . . . . . . . . . . . . . . . . . . . . . . . . . . . . . . . . . . . . . 211 11,280L3 Technologies . . . . . . . . . . . . . . . . . . . . . . . . . . . . . . 640 125,363Lindsay . . . . . . . . . . . . . . . . . . . . . . . . . . . . . . . . . . . . . . 510 44,809Lockheed Martin . . . . . . . . . . . . . . . . . . . . . . . . . . . . . . 156 50,051LSC Communications . . . . . . . . . . . . . . . . . . . . . . . . . . 2,343 40,956Lydall * . . . . . . . . . . . . . . . . . . . . . . . . . . . . . . . . . . . . . . 115 5,129ManpowerGroup . . . . . . . . . . . . . . . . . . . . . . . . . . . . . . 1,047 100,219Marten Transport . . . . . . . . . . . . . . . . . . . . . . . . . . . . . 1,645 32,078Matson . . . . . . . . . . . . . . . . . . . . . . . . . . . . . . . . . . . . . . 2,539 74,215Matthews International, Cl A . . . . . . . . . . . . . . . . . . . . 1,763 86,651Mercury Systems * . . . . . . . . . . . . . . . . . . . . . . . . . . . . 183 5,871Mobile Mini . . . . . . . . . . . . . . . . . . . . . . . . . . . . . . . . . . 1,572 66,024Moog, Cl A . . . . . . . . . . . . . . . . . . . . . . . . . . . . . . . . . . . 1,048 85,905Mueller Industries . . . . . . . . . . . . . . . . . . . . . . . . . . . . 3,161 85,916
The accompanying notes are an integral part of the financial statements.
25

THE ADVISORS’ INNER CIRCLE FUND III PINEBRIDGE DYNAMICASSET ALLOCATION FUNDAPRIL 30, 2018 (Unaudited)
COMMON STOCK — continued
Shares Value
United States — continued
Industrials — continued
Navigant Consulting * . . . . . . . . . . . . . . . . . . . . . . . . . . 2,887 $ 61,753Nielsen Holdings . . . . . . . . . . . . . . . . . . . . . . . . . . . . . . 733 23,053Norfolk Southern . . . . . . . . . . . . . . . . . . . . . . . . . . . . . 43 6,169PACCAR . . . . . . . . . . . . . . . . . . . . . . . . . . . . . . . . . . . . . 143 9,105Patrick Industries * . . . . . . . . . . . . . . . . . . . . . . . . . . . . 100 5,690Powell Industries . . . . . . . . . . . . . . . . . . . . . . . . . . . . . 158 4,748Proto Labs * . . . . . . . . . . . . . . . . . . . . . . . . . . . . . . . . . 86 10,247Quanex Building Products . . . . . . . . . . . . . . . . . . . . . . 288 4,939Raven Industries . . . . . . . . . . . . . . . . . . . . . . . . . . . . . . 174 6,368Regal Beloit . . . . . . . . . . . . . . . . . . . . . . . . . . . . . . . . . . 85 6,052Republic Services, Cl A . . . . . . . . . . . . . . . . . . . . . . . . . 1,313 84,925Robert Half International . . . . . . . . . . . . . . . . . . . . . . . 82 4,982Rockwell Automation . . . . . . . . . . . . . . . . . . . . . . . . . . 406 66,799Roper Technologies . . . . . . . . . . . . . . . . . . . . . . . . . . . 9 2,378Saia * . . . . . . . . . . . . . . . . . . . . . . . . . . . . . . . . . . . . . . . 604 39,894Simpson Manufacturing . . . . . . . . . . . . . . . . . . . . . . . . 143 7,819SkyWest . . . . . . . . . . . . . . . . . . . . . . . . . . . . . . . . . . . . . 2,750 156,475Snap-on . . . . . . . . . . . . . . . . . . . . . . . . . . . . . . . . . . . . . 3 436Southwest Airlines . . . . . . . . . . . . . . . . . . . . . . . . . . . . 60 3,170SPX * . . . . . . . . . . . . . . . . . . . . . . . . . . . . . . . . . . . . . . . 2,501 79,132SPX FLOW * . . . . . . . . . . . . . . . . . . . . . . . . . . . . . . . . . . 2,253 101,385Standex International . . . . . . . . . . . . . . . . . . . . . . . . . . 68 6,593Team * . . . . . . . . . . . . . . . . . . . . . . . . . . . . . . . . . . . . . . 2,118 35,900Tennant . . . . . . . . . . . . . . . . . . . . . . . . . . . . . . . . . . . . . 714 52,836Tetra Tech . . . . . . . . . . . . . . . . . . . . . . . . . . . . . . . . . . . 1,222 59,145Titan International . . . . . . . . . . . . . . . . . . . . . . . . . . . . 2,721 28,026Toro . . . . . . . . . . . . . . . . . . . . . . . . . . . . . . . . . . . . . . . . 10 584Trex * . . . . . . . . . . . . . . . . . . . . . . . . . . . . . . . . . . . . . . . 109 11,323Triumph Group . . . . . . . . . . . . . . . . . . . . . . . . . . . . . . . 2,757 65,203TrueBlue * . . . . . . . . . . . . . . . . . . . . . . . . . . . . . . . . . . . 2,544 67,798UniFirst . . . . . . . . . . . . . . . . . . . . . . . . . . . . . . . . . . . . . 388 62,313Union Pacific . . . . . . . . . . . . . . . . . . . . . . . . . . . . . . . . . 616 82,316United Rentals * . . . . . . . . . . . . . . . . . . . . . . . . . . . . . . 50 7,500Universal Forest Products . . . . . . . . . . . . . . . . . . . . . . 1,526 48,649US Ecology . . . . . . . . . . . . . . . . . . . . . . . . . . . . . . . . . . . 91 4,850Viad . . . . . . . . . . . . . . . . . . . . . . . . . . . . . . . . . . . . . . . . . 113 5,735Wabash National . . . . . . . . . . . . . . . . . . . . . . . . . . . . . . 2,007 40,260WageWorks * . . . . . . . . . . . . . . . . . . . . . . . . . . . . . . . . . 159 6,622Watts Water Technologies, Cl A . . . . . . . . . . . . . . . . . 831 61,910
The accompanying notes are an integral part of the financial statements.
26
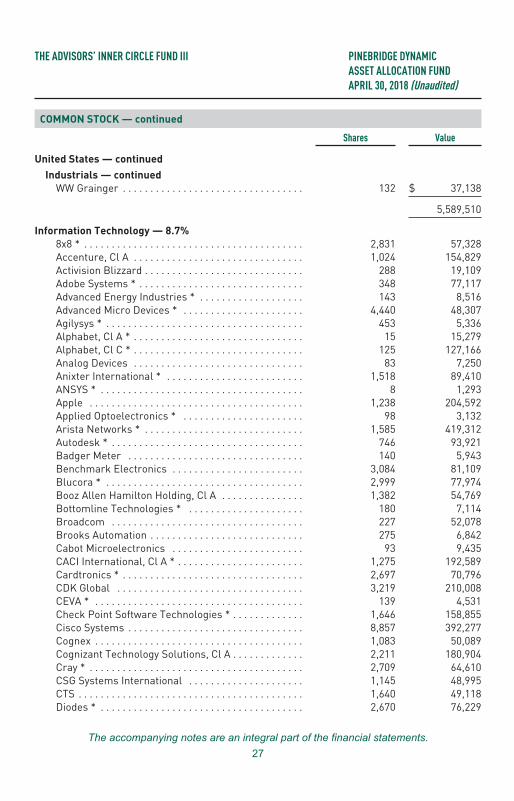
THE ADVISORS’ INNER CIRCLE FUND III PINEBRIDGE DYNAMICASSET ALLOCATION FUNDAPRIL 30, 2018 (Unaudited)
COMMON STOCK — continued
Shares Value
United States — continued
Industrials — continued
WW Grainger . . . . . . . . . . . . . . . . . . . . . . . . . . . . . . . . . 132 $ 37,138
5,589,510
Information Technology — 8.7%
8x8 * . . . . . . . . . . . . . . . . . . . . . . . . . . . . . . . . . . . . . . . . 2,831 57,328Accenture, Cl A . . . . . . . . . . . . . . . . . . . . . . . . . . . . . . . 1,024 154,829Activision Blizzard . . . . . . . . . . . . . . . . . . . . . . . . . . . . . 288 19,109Adobe Systems * . . . . . . . . . . . . . . . . . . . . . . . . . . . . . . 348 77,117Advanced Energy Industries * . . . . . . . . . . . . . . . . . . . 143 8,516Advanced Micro Devices * . . . . . . . . . . . . . . . . . . . . . . 4,440 48,307Agilysys * . . . . . . . . . . . . . . . . . . . . . . . . . . . . . . . . . . . . 453 5,336Alphabet, Cl A * . . . . . . . . . . . . . . . . . . . . . . . . . . . . . . . 15 15,279Alphabet, Cl C * . . . . . . . . . . . . . . . . . . . . . . . . . . . . . . . 125 127,166Analog Devices . . . . . . . . . . . . . . . . . . . . . . . . . . . . . . . 83 7,250Anixter International * . . . . . . . . . . . . . . . . . . . . . . . . . 1,518 89,410ANSYS * . . . . . . . . . . . . . . . . . . . . . . . . . . . . . . . . . . . . . 8 1,293Apple . . . . . . . . . . . . . . . . . . . . . . . . . . . . . . . . . . . . . . . 1,238 204,592Applied Optoelectronics * . . . . . . . . . . . . . . . . . . . . . . 98 3,132Arista Networks * . . . . . . . . . . . . . . . . . . . . . . . . . . . . . 1,585 419,312Autodesk * . . . . . . . . . . . . . . . . . . . . . . . . . . . . . . . . . . . 746 93,921Badger Meter . . . . . . . . . . . . . . . . . . . . . . . . . . . . . . . . 140 5,943Benchmark Electronics . . . . . . . . . . . . . . . . . . . . . . . . 3,084 81,109Blucora * . . . . . . . . . . . . . . . . . . . . . . . . . . . . . . . . . . . . 2,999 77,974Booz Allen Hamilton Holding, Cl A . . . . . . . . . . . . . . . 1,382 54,769Bottomline Technologies * . . . . . . . . . . . . . . . . . . . . . 180 7,114Broadcom . . . . . . . . . . . . . . . . . . . . . . . . . . . . . . . . . . . 227 52,078Brooks Automation . . . . . . . . . . . . . . . . . . . . . . . . . . . . 275 6,842Cabot Microelectronics . . . . . . . . . . . . . . . . . . . . . . . . 93 9,435CACI International, Cl A * . . . . . . . . . . . . . . . . . . . . . . . 1,275 192,589Cardtronics * . . . . . . . . . . . . . . . . . . . . . . . . . . . . . . . . . 2,697 70,796CDK Global . . . . . . . . . . . . . . . . . . . . . . . . . . . . . . . . . . 3,219 210,008CEVA * . . . . . . . . . . . . . . . . . . . . . . . . . . . . . . . . . . . . . . 139 4,531Check Point Software Technologies * . . . . . . . . . . . . . 1,646 158,855Cisco Systems . . . . . . . . . . . . . . . . . . . . . . . . . . . . . . . . 8,857 392,277Cognex . . . . . . . . . . . . . . . . . . . . . . . . . . . . . . . . . . . . . . 1,083 50,089Cognizant Technology Solutions, Cl A . . . . . . . . . . . . . 2,211 180,904Cray * . . . . . . . . . . . . . . . . . . . . . . . . . . . . . . . . . . . . . . . 2,709 64,610CSG Systems International . . . . . . . . . . . . . . . . . . . . . 1,145 48,995CTS . . . . . . . . . . . . . . . . . . . . . . . . . . . . . . . . . . . . . . . . . 1,640 49,118Diodes * . . . . . . . . . . . . . . . . . . . . . . . . . . . . . . . . . . . . . 2,670 76,229
The accompanying notes are an integral part of the financial statements.
27

THE ADVISORS’ INNER CIRCLE FUND III PINEBRIDGE DYNAMICASSET ALLOCATION FUNDAPRIL 30, 2018 (Unaudited)
COMMON STOCK — continued
Shares Value
United States — continued
Information Technology — continued
DXC Technology . . . . . . . . . . . . . . . . . . . . . . . . . . . . . . 1,649 $ 169,946Ebix . . . . . . . . . . . . . . . . . . . . . . . . . . . . . . . . . . . . . . . . . 84 6,510Electronics For Imaging * . . . . . . . . . . . . . . . . . . . . . . 2,540 70,358ePlus * . . . . . . . . . . . . . . . . . . . . . . . . . . . . . . . . . . . . . . 67 5,350EVERTEC . . . . . . . . . . . . . . . . . . . . . . . . . . . . . . . . . . . . 2,106 38,435ExlService Holdings * . . . . . . . . . . . . . . . . . . . . . . . . . . 134 7,747Extreme Networks * . . . . . . . . . . . . . . . . . . . . . . . . . . . 509 5,446F5 Networks * . . . . . . . . . . . . . . . . . . . . . . . . . . . . . . . . 1,477 240,884Fabrinet * . . . . . . . . . . . . . . . . . . . . . . . . . . . . . . . . . . . . 2,181 61,526Facebook, Cl A * . . . . . . . . . . . . . . . . . . . . . . . . . . . . . . 2,018 347,096FARO Technologies * . . . . . . . . . . . . . . . . . . . . . . . . . . 84 4,242Fidelity National Information Services . . . . . . . . . . . . 261 24,787Finisar * . . . . . . . . . . . . . . . . . . . . . . . . . . . . . . . . . . . . . 451 7,027First Solar * . . . . . . . . . . . . . . . . . . . . . . . . . . . . . . . . . . 1,700 120,547FLIR Systems . . . . . . . . . . . . . . . . . . . . . . . . . . . . . . . . 1,065 57,031FormFactor * . . . . . . . . . . . . . . . . . . . . . . . . . . . . . . . . . 380 4,361Fortinet * . . . . . . . . . . . . . . . . . . . . . . . . . . . . . . . . . . . . 10,384 574,857GoDaddy, Cl A * . . . . . . . . . . . . . . . . . . . . . . . . . . . . . . . 4,763 307,499Guidewire Software * . . . . . . . . . . . . . . . . . . . . . . . . . . 2,615 221,281Hewlett Packard Enterprise . . . . . . . . . . . . . . . . . . . . 12 205HP . . . . . . . . . . . . . . . . . . . . . . . . . . . . . . . . . . . . . . . . . . 8,396 180,430IAC * . . . . . . . . . . . . . . . . . . . . . . . . . . . . . . . . . . . . . . . . 510 82,691II-VI * . . . . . . . . . . . . . . . . . . . . . . . . . . . . . . . . . . . . . . . 203 7,734Insight Enterprises * . . . . . . . . . . . . . . . . . . . . . . . . . . 2,172 76,997Intel . . . . . . . . . . . . . . . . . . . . . . . . . . . . . . . . . . . . . . . . 1,767 91,213International Business Machines . . . . . . . . . . . . . . . . 920 133,363Intuit . . . . . . . . . . . . . . . . . . . . . . . . . . . . . . . . . . . . . . . . 2,446 451,996IPG Photonics * . . . . . . . . . . . . . . . . . . . . . . . . . . . . . . . 390 83,082Itron * . . . . . . . . . . . . . . . . . . . . . . . . . . . . . . . . . . . . . . . 1,115 72,921Juniper Networks . . . . . . . . . . . . . . . . . . . . . . . . . . . . . 8,971 220,597KEMET * . . . . . . . . . . . . . . . . . . . . . . . . . . . . . . . . . . . . . 210 3,616KLA-Tencor . . . . . . . . . . . . . . . . . . . . . . . . . . . . . . . . . . 87 8,851Kulicke & Soffa Industries * . . . . . . . . . . . . . . . . . . . . 287 6,569Lam Research . . . . . . . . . . . . . . . . . . . . . . . . . . . . . . . . 83 15,360Leidos Holdings . . . . . . . . . . . . . . . . . . . . . . . . . . . . . . 2,337 150,106LogMeIn . . . . . . . . . . . . . . . . . . . . . . . . . . . . . . . . . . . . . 2,003 220,731Lumentum Holdings * . . . . . . . . . . . . . . . . . . . . . . . . . 1,513 76,331ManTech International, Cl A . . . . . . . . . . . . . . . . . . . . 1,741 102,876Marvell Technology Group . . . . . . . . . . . . . . . . . . . . . . 6,725 134,904Mastercard, Cl A . . . . . . . . . . . . . . . . . . . . . . . . . . . . . . 1,871 333,543
The accompanying notes are an integral part of the financial statements.
28

THE ADVISORS’ INNER CIRCLE FUND III PINEBRIDGE DYNAMICASSET ALLOCATION FUNDAPRIL 30, 2018 (Unaudited)
COMMON STOCK — continued
Shares Value
United States — continued
Information Technology — continued
Maxim Integrated Products . . . . . . . . . . . . . . . . . . . . . 130 $ 7,085MaxLinear, Cl A * . . . . . . . . . . . . . . . . . . . . . . . . . . . . . 262 5,850Methode Electronics . . . . . . . . . . . . . . . . . . . . . . . . . . . 1,202 47,960Microchip Technology . . . . . . . . . . . . . . . . . . . . . . . . . . 97 8,115Micron Technology * . . . . . . . . . . . . . . . . . . . . . . . . . . . 7,204 331,240Microsemi * . . . . . . . . . . . . . . . . . . . . . . . . . . . . . . . . . . 2,093 135,396Microsoft . . . . . . . . . . . . . . . . . . . . . . . . . . . . . . . . . . . . 1,601 149,726MicroStrategy, Cl A * . . . . . . . . . . . . . . . . . . . . . . . . . . 387 49,327Monotype Imaging Holdings . . . . . . . . . . . . . . . . . . . . 236 5,227MTS Systems . . . . . . . . . . . . . . . . . . . . . . . . . . . . . . . . . 1,165 59,182National Instruments . . . . . . . . . . . . . . . . . . . . . . . . . . 3,168 129,540NetApp . . . . . . . . . . . . . . . . . . . . . . . . . . . . . . . . . . . . . . 92 6,125NETGEAR * . . . . . . . . . . . . . . . . . . . . . . . . . . . . . . . . . . 1,673 92,517NIC . . . . . . . . . . . . . . . . . . . . . . . . . . . . . . . . . . . . . . . . . 396 5,881NVIDIA . . . . . . . . . . . . . . . . . . . . . . . . . . . . . . . . . . . . . . 432 97,157NXP Semiconductors * . . . . . . . . . . . . . . . . . . . . . . . . . 2,064 216,514Oclaro * . . . . . . . . . . . . . . . . . . . . . . . . . . . . . . . . . . . . . 5,140 40,709ON Semiconductor * . . . . . . . . . . . . . . . . . . . . . . . . . . . 4,470 98,698Oracle . . . . . . . . . . . . . . . . . . . . . . . . . . . . . . . . . . . . . . . 1,028 46,949OSI Systems * . . . . . . . . . . . . . . . . . . . . . . . . . . . . . . . . 755 48,335Palo Alto Networks * . . . . . . . . . . . . . . . . . . . . . . . . . . 1,251 240,830Park Electrochemical . . . . . . . . . . . . . . . . . . . . . . . . . . 2,992 50,954PayPal Holdings * . . . . . . . . . . . . . . . . . . . . . . . . . . . . . 111 8,282Perficient * . . . . . . . . . . . . . . . . . . . . . . . . . . . . . . . . . . 3,362 83,142Plexus * . . . . . . . . . . . . . . . . . . . . . . . . . . . . . . . . . . . . . 2,007 110,064Power Integrations . . . . . . . . . . . . . . . . . . . . . . . . . . . . 789 53,494Progress Software . . . . . . . . . . . . . . . . . . . . . . . . . . . . 178 6,574PTC * . . . . . . . . . . . . . . . . . . . . . . . . . . . . . . . . . . . . . . . 693 57,069Qorvo * . . . . . . . . . . . . . . . . . . . . . . . . . . . . . . . . . . . . . . 677 45,630QUALCOMM . . . . . . . . . . . . . . . . . . . . . . . . . . . . . . . . . . 136 6,937Qualys * . . . . . . . . . . . . . . . . . . . . . . . . . . . . . . . . . . . . . 120 9,234Rambus * . . . . . . . . . . . . . . . . . . . . . . . . . . . . . . . . . . . . 475 6,413Red Hat * . . . . . . . . . . . . . . . . . . . . . . . . . . . . . . . . . . . . 122 19,893Rogers * . . . . . . . . . . . . . . . . . . . . . . . . . . . . . . . . . . . . . 69 7,362salesforce.com * . . . . . . . . . . . . . . . . . . . . . . . . . . . . . . 6,151 744,208Sanmina * . . . . . . . . . . . . . . . . . . . . . . . . . . . . . . . . . . . 4,089 120,626ScanSource * . . . . . . . . . . . . . . . . . . . . . . . . . . . . . . . . . 1,692 58,036Semtech * . . . . . . . . . . . . . . . . . . . . . . . . . . . . . . . . . . . 1,815 71,330ServiceNow * . . . . . . . . . . . . . . . . . . . . . . . . . . . . . . . . . 3,936 653,926Shopify, Cl A * . . . . . . . . . . . . . . . . . . . . . . . . . . . . . . . . 1,026 137,104
The accompanying notes are an integral part of the financial statements.
29

THE ADVISORS’ INNER CIRCLE FUND III PINEBRIDGE DYNAMICASSET ALLOCATION FUNDAPRIL 30, 2018 (Unaudited)
COMMON STOCK — continued
Shares Value
United States — continued
Information Technology — continued
SINA * . . . . . . . . . . . . . . . . . . . . . . . . . . . . . . . . . . . . . . 5,210 $ 497,762Skyworks Solutions . . . . . . . . . . . . . . . . . . . . . . . . . . . 1,020 88,495SolarEdge Technologies * . . . . . . . . . . . . . . . . . . . . . . 132 6,950Splunk * . . . . . . . . . . . . . . . . . . . . . . . . . . . . . . . . . . . . . 1,733 177,892SPS Commerce * . . . . . . . . . . . . . . . . . . . . . . . . . . . . . 102 6,994Stamps.com * . . . . . . . . . . . . . . . . . . . . . . . . . . . . . . . . 60 13,665Super Micro Computer * . . . . . . . . . . . . . . . . . . . . . . . 2,131 37,719Sykes Enterprises * . . . . . . . . . . . . . . . . . . . . . . . . . . . 2,644 76,041Symantec . . . . . . . . . . . . . . . . . . . . . . . . . . . . . . . . . . . . 5,208 144,730Tableau Software, Cl A * . . . . . . . . . . . . . . . . . . . . . . . 1,132 96,277Teradyne . . . . . . . . . . . . . . . . . . . . . . . . . . . . . . . . . . . . 3,345 108,880Texas Instruments . . . . . . . . . . . . . . . . . . . . . . . . . . . . 442 44,832TiVo . . . . . . . . . . . . . . . . . . . . . . . . . . . . . . . . . . . . . . . . . 6,167 87,263Travelport Worldwide . . . . . . . . . . . . . . . . . . . . . . . . . . 6,990 119,809Trimble * . . . . . . . . . . . . . . . . . . . . . . . . . . . . . . . . . . . . 1,526 52,800TTM Technologies * . . . . . . . . . . . . . . . . . . . . . . . . . . . 384 5,353Twitter * . . . . . . . . . . . . . . . . . . . . . . . . . . . . . . . . . . . . . 1,945 58,953Tyler Technologies * . . . . . . . . . . . . . . . . . . . . . . . . . . . 908 198,779Ultimate Software Group * . . . . . . . . . . . . . . . . . . . . . . 1,150 275,908Veeco Instruments * . . . . . . . . . . . . . . . . . . . . . . . . . . . 2,808 43,384Viavi Solutions * . . . . . . . . . . . . . . . . . . . . . . . . . . . . . . 6,201 58,599Virtusa * . . . . . . . . . . . . . . . . . . . . . . . . . . . . . . . . . . . . . 134 6,451Visa, Cl A . . . . . . . . . . . . . . . . . . . . . . . . . . . . . . . . . . . . 3,331 422,637VMware, Cl A * . . . . . . . . . . . . . . . . . . . . . . . . . . . . . . . 5,007 667,232Western Digital . . . . . . . . . . . . . . . . . . . . . . . . . . . . . . . 764 60,196Workday, Cl A * . . . . . . . . . . . . . . . . . . . . . . . . . . . . . . . 4,464 557,285Xilinx . . . . . . . . . . . . . . . . . . . . . . . . . . . . . . . . . . . . . . . . 925 59,422Xperi . . . . . . . . . . . . . . . . . . . . . . . . . . . . . . . . . . . . . . . . 1,972 43,384Zebra Technologies, Cl A * . . . . . . . . . . . . . . . . . . . . . . 1,116 150,470
16,096,011
Materials — 1.3%
A Schulman . . . . . . . . . . . . . . . . . . . . . . . . . . . . . . . . . . 1,629 69,884AdvanSix * . . . . . . . . . . . . . . . . . . . . . . . . . . . . . . . . . . . 1,228 43,987AK Steel Holding * . . . . . . . . . . . . . . . . . . . . . . . . . . . . 16,781 77,025Balchem . . . . . . . . . . . . . . . . . . . . . . . . . . . . . . . . . . . . . 830 73,239Boise Cascade . . . . . . . . . . . . . . . . . . . . . . . . . . . . . . . . 2,340 97,344Century Aluminum * . . . . . . . . . . . . . . . . . . . . . . . . . . . 2,757 48,165CF Industries Holdings . . . . . . . . . . . . . . . . . . . . . . . . . 9,093 352,808Clearwater Paper * . . . . . . . . . . . . . . . . . . . . . . . . . . . . 1,060 25,069
The accompanying notes are an integral part of the financial statements.
30
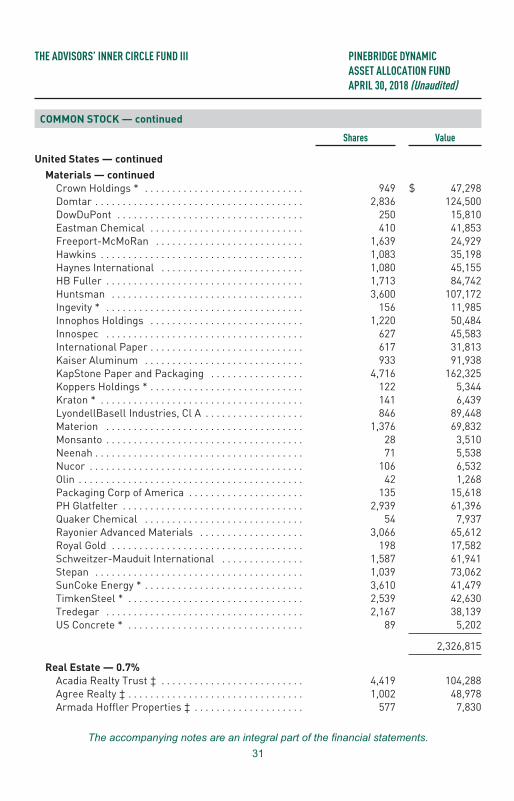
THE ADVISORS’ INNER CIRCLE FUND III PINEBRIDGE DYNAMICASSET ALLOCATION FUNDAPRIL 30, 2018 (Unaudited)
COMMON STOCK — continued
Shares Value
United States — continued
Materials — continued
Crown Holdings * . . . . . . . . . . . . . . . . . . . . . . . . . . . . . 949 $ 47,298Domtar . . . . . . . . . . . . . . . . . . . . . . . . . . . . . . . . . . . . . . 2,836 124,500DowDuPont . . . . . . . . . . . . . . . . . . . . . . . . . . . . . . . . . . 250 15,810Eastman Chemical . . . . . . . . . . . . . . . . . . . . . . . . . . . . 410 41,853Freeport-McMoRan . . . . . . . . . . . . . . . . . . . . . . . . . . . 1,639 24,929Hawkins . . . . . . . . . . . . . . . . . . . . . . . . . . . . . . . . . . . . . 1,083 35,198Haynes International . . . . . . . . . . . . . . . . . . . . . . . . . . 1,080 45,155HB Fuller . . . . . . . . . . . . . . . . . . . . . . . . . . . . . . . . . . . . 1,713 84,742Huntsman . . . . . . . . . . . . . . . . . . . . . . . . . . . . . . . . . . . 3,600 107,172Ingevity * . . . . . . . . . . . . . . . . . . . . . . . . . . . . . . . . . . . . 156 11,985Innophos Holdings . . . . . . . . . . . . . . . . . . . . . . . . . . . . 1,220 50,484Innospec . . . . . . . . . . . . . . . . . . . . . . . . . . . . . . . . . . . . 627 45,583International Paper . . . . . . . . . . . . . . . . . . . . . . . . . . . . 617 31,813Kaiser Aluminum . . . . . . . . . . . . . . . . . . . . . . . . . . . . . 933 91,938KapStone Paper and Packaging . . . . . . . . . . . . . . . . . 4,716 162,325Koppers Holdings * . . . . . . . . . . . . . . . . . . . . . . . . . . . . 122 5,344Kraton * . . . . . . . . . . . . . . . . . . . . . . . . . . . . . . . . . . . . . 141 6,439LyondellBasell Industries, Cl A . . . . . . . . . . . . . . . . . . 846 89,448Materion . . . . . . . . . . . . . . . . . . . . . . . . . . . . . . . . . . . . 1,376 69,832Monsanto . . . . . . . . . . . . . . . . . . . . . . . . . . . . . . . . . . . . 28 3,510Neenah . . . . . . . . . . . . . . . . . . . . . . . . . . . . . . . . . . . . . . 71 5,538Nucor . . . . . . . . . . . . . . . . . . . . . . . . . . . . . . . . . . . . . . . 106 6,532Olin . . . . . . . . . . . . . . . . . . . . . . . . . . . . . . . . . . . . . . . . . 42 1,268Packaging Corp of America . . . . . . . . . . . . . . . . . . . . . 135 15,618PH Glatfelter . . . . . . . . . . . . . . . . . . . . . . . . . . . . . . . . . 2,939 61,396Quaker Chemical . . . . . . . . . . . . . . . . . . . . . . . . . . . . . 54 7,937Rayonier Advanced Materials . . . . . . . . . . . . . . . . . . . 3,066 65,612Royal Gold . . . . . . . . . . . . . . . . . . . . . . . . . . . . . . . . . . . 198 17,582Schweitzer-Mauduit International . . . . . . . . . . . . . . . 1,587 61,941Stepan . . . . . . . . . . . . . . . . . . . . . . . . . . . . . . . . . . . . . . 1,039 73,062SunCoke Energy * . . . . . . . . . . . . . . . . . . . . . . . . . . . . . 3,610 41,479TimkenSteel * . . . . . . . . . . . . . . . . . . . . . . . . . . . . . . . . 2,539 42,630Tredegar . . . . . . . . . . . . . . . . . . . . . . . . . . . . . . . . . . . . 2,167 38,139US Concrete * . . . . . . . . . . . . . . . . . . . . . . . . . . . . . . . . 89 5,202
2,326,815
Real Estate — 0.7%
Acadia Realty Trust ‡ . . . . . . . . . . . . . . . . . . . . . . . . . . 4,419 104,288Agree Realty ‡ . . . . . . . . . . . . . . . . . . . . . . . . . . . . . . . . 1,002 48,978Armada Hoffler Properties ‡ . . . . . . . . . . . . . . . . . . . . 577 7,830
The accompanying notes are an integral part of the financial statements.
31

THE ADVISORS’ INNER CIRCLE FUND III PINEBRIDGE DYNAMICASSET ALLOCATION FUNDAPRIL 30, 2018 (Unaudited)
COMMON STOCK — continued
Shares Value
United States — continued
Real Estate — continued
AvalonBay Communities ‡ . . . . . . . . . . . . . . . . . . . . . . 7 $ 1,141CareTrust ‡ . . . . . . . . . . . . . . . . . . . . . . . . . . . . . . . . . . 475 6,275CBL & Associates Properties ‡ . . . . . . . . . . . . . . . . . . 9,852 41,181CBRE Group, Cl A * . . . . . . . . . . . . . . . . . . . . . . . . . . . . 267 12,098Cedar Realty Trust ‡ . . . . . . . . . . . . . . . . . . . . . . . . . . 1,450 5,641Chatham Lodging Trust ‡ . . . . . . . . . . . . . . . . . . . . . . 3,463 65,970Chesapeake Lodging Trust ‡ . . . . . . . . . . . . . . . . . . . . 3,192 94,292Community Healthcare Trust ‡ . . . . . . . . . . . . . . . . . . 2,373 60,512CoreCivic ‡ . . . . . . . . . . . . . . . . . . . . . . . . . . . . . . . . . . 217 4,375DiamondRock Hospitality ‡ . . . . . . . . . . . . . . . . . . . . . 9,768 107,936EastGroup Properties ‡ . . . . . . . . . . . . . . . . . . . . . . . . 80 7,182Essex Property Trust ‡ . . . . . . . . . . . . . . . . . . . . . . . . . 7 1,678Extra Space Storage ‡ . . . . . . . . . . . . . . . . . . . . . . . . . 16 1,433Franklin Street Properties ‡ . . . . . . . . . . . . . . . . . . . . 7,813 60,785Government Properties Income Trust ‡ . . . . . . . . . . . 5,817 72,654Hersha Hospitality Trust, Cl A ‡ . . . . . . . . . . . . . . . . . 3,384 63,552HFF, Cl A . . . . . . . . . . . . . . . . . . . . . . . . . . . . . . . . . . . . 126 4,428Host Hotels & Resorts ‡ . . . . . . . . . . . . . . . . . . . . . . . 607 11,873Independence Realty Trust ‡ . . . . . . . . . . . . . . . . . . . . 7,029 66,073Iron Mountain ‡ . . . . . . . . . . . . . . . . . . . . . . . . . . . . . . . 10 339Kite Realty Group Trust ‡ . . . . . . . . . . . . . . . . . . . . . . . 5,468 80,489Lexington Realty Trust ‡ . . . . . . . . . . . . . . . . . . . . . . . 825 6,633LTC Properties ‡ . . . . . . . . . . . . . . . . . . . . . . . . . . . . . . 1,126 40,705Pennsylvania Real Estate Investment Trust ‡ . . . . . . 5,115 49,513Prologis ‡ . . . . . . . . . . . . . . . . . . . . . . . . . . . . . . . . . . . 132 8,568PS Business Parks ‡ . . . . . . . . . . . . . . . . . . . . . . . . . . 27 3,113Public Storage ‡ . . . . . . . . . . . . . . . . . . . . . . . . . . . . . . 9 1,816Ramco-Gershenson Properties Trust ‡ . . . . . . . . . . . 478 5,712RE/MAX Holdings, Cl A . . . . . . . . . . . . . . . . . . . . . . . . . 1,405 76,081Retail Opportunity Investments ‡ . . . . . . . . . . . . . . . . 3,270 56,244Simon Property Group ‡ . . . . . . . . . . . . . . . . . . . . . . . 737 115,223Summit Hotel Properties ‡ . . . . . . . . . . . . . . . . . . . . . 496 7,182Urstadt Biddle Properties, Cl A ‡ . . . . . . . . . . . . . . . . 3,112 61,835Weyerhaeuser ‡ . . . . . . . . . . . . . . . . . . . . . . . . . . . . . . 39 1,434Whitestone, Cl B ‡ . . . . . . . . . . . . . . . . . . . . . . . . . . . . 536 5,816
1,370,878
Telecommunication Services — 0.2%
AT&T . . . . . . . . . . . . . . . . . . . . . . . . . . . . . . . . . . . . . . . 5,406 176,776Cogent Communications Holdings . . . . . . . . . . . . . . . 153 7,214
The accompanying notes are an integral part of the financial statements.
32

THE ADVISORS’ INNER CIRCLE FUND III PINEBRIDGE DYNAMICASSET ALLOCATION FUNDAPRIL 30, 2018 (Unaudited)
COMMON STOCK — continued
Shares/Face Amount Value
United States — continued
Telecommunication Services — continued
Frontier Communications . . . . . . . . . . . . . . . . . . . . . 487 $ 4,042Sprint * . . . . . . . . . . . . . . . . . . . . . . . . . . . . . . . . . . . . 1,093 6,132T-Mobile US * . . . . . . . . . . . . . . . . . . . . . . . . . . . . . . . 324 19,605Verizon Communications . . . . . . . . . . . . . . . . . . . . . . 1,539 75,950Vonage Holdings * . . . . . . . . . . . . . . . . . . . . . . . . . . . 900 10,062
299,781
Utilities — 0.2%
AES . . . . . . . . . . . . . . . . . . . . . . . . . . . . . . . . . . . . . . . . 6,248 76,476American Electric Power . . . . . . . . . . . . . . . . . . . . . . 244 17,075American States Water . . . . . . . . . . . . . . . . . . . . . . . 181 10,085Avista . . . . . . . . . . . . . . . . . . . . . . . . . . . . . . . . . . . . . . 239 12,395CenterPoint Energy . . . . . . . . . . . . . . . . . . . . . . . . . . 2,784 70,519El Paso Electric . . . . . . . . . . . . . . . . . . . . . . . . . . . . . . 173 8,832Entergy . . . . . . . . . . . . . . . . . . . . . . . . . . . . . . . . . . . . 316 25,782FirstEnergy . . . . . . . . . . . . . . . . . . . . . . . . . . . . . . . . . 2,630 90,472NRG Energy . . . . . . . . . . . . . . . . . . . . . . . . . . . . . . . . . 93 2,883South Jersey Industries . . . . . . . . . . . . . . . . . . . . . . . 362 11,186Spire . . . . . . . . . . . . . . . . . . . . . . . . . . . . . . . . . . . . . . . 172 12,410
338,115
58,791,751
TOTAL COMMON STOCK(Cost $103,759,234) . . . . . . . . . . . . . . . . . . . . . . . . . . 113,416,114
ASSET-BACKED SECURITIES — 13.6%
Automotive — 3.2%
BMW Vehicle Lease Trust, Ser 2017-2, Cl A3Callable 05/20/2018 @ $1002.070%, 10/20/2020 . . . . . . . . . . . . . . . . . . . . . . . . $ 325,000 321,387
Ford Credit Floorplan Master Owner Trust,Ser 2017-1, Cl A12.070%, 05/15/2022 . . . . . . . . . . . . . . . . . . . . . . . . 1,500,000 1,473,619
Honda Auto Receivables Owner Trust, Ser 2016-2,Cl A4Callable 07/15/2019 @ $1001.620%, 08/15/2022 . . . . . . . . . . . . . . . . . . . . . . . . 1,555,000 1,534,911
The accompanying notes are an integral part of the financial statements.
33

THE ADVISORS’ INNER CIRCLE FUND III PINEBRIDGE DYNAMICASSET ALLOCATION FUNDAPRIL 30, 2018 (Unaudited)
ASSET-BACKED SECURITIES — continued
Face Amount Value
Automotive — continued
Nissan Auto Receivables Owner Trust, Ser 2017-A,Cl A3Callable 02/15/2021 @ $1001.740%, 08/16/2021 . . . . . . . . . . . . . . . . . . . . . . . . $ 1,000,000 $ 986,063
Toyota Auto Receivables Owner Trust, Ser 2017-D,Cl A4Callable 06/15/2021 @ $1002.120%, 02/15/2023 . . . . . . . . . . . . . . . . . . . . . . . . 1,500,000 1,464,024
Toyota Auto Receivables Owner Trust, Ser 2018-A,Cl A3Callable 09/15/2021 @ $1002.350%, 05/16/2022 . . . . . . . . . . . . . . . . . . . . . . . . 225,000 222,738
6,002,742
Credit Cards — 3.2%
American Express Credit Account Master Trust,Ser 2017-1, Cl A1.930%, 09/15/2022 . . . . . . . . . . . . . . . . . . . . . . . . 1,000,000 984,490
American Express Credit Account Master Trust,Ser 2017-6, Cl A2.040%, 05/15/2023 . . . . . . . . . . . . . . . . . . . . . . . . 1,500,000 1,468,704
Capital One Multi-Asset Execution Trust,Ser 2017-A4, Cl A41.990%, 07/17/2023 . . . . . . . . . . . . . . . . . . . . . . . . 1,500,000 1,469,402
Citibank Credit Card Issuance Trust, Ser 2017-A3,Cl A31.920%, 04/07/2022 . . . . . . . . . . . . . . . . . . . . . . . . 1,000,000 982,968
Citibank Credit Card Issuance Trust, Ser 2017-A8,Cl A81.860%, 08/08/2022 . . . . . . . . . . . . . . . . . . . . . . . . 100,000 97,778
Citibank Credit Card Issuance Trust, Ser 2018-A1,Cl A12.490%, 01/20/2023 . . . . . . . . . . . . . . . . . . . . . . . . 1,000,000 988,083
5,991,425
Other Asset-Backed Securities — 7.2%
AIMCO CLO, Ser 2018-AA, Cl B3.241%, 04/17/2031 . . . . . . . . . . . . . . . . . . . . . . . . 750,000 741,736
The accompanying notes are an integral part of the financial statements.
34

THE ADVISORS’ INNER CIRCLE FUND III PINEBRIDGE DYNAMICASSET ALLOCATION FUNDAPRIL 30, 2018 (Unaudited)
ASSET-BACKED SECURITIES — continued
Face Amount Value
Other Asset-Backed Securities — continued
Atrium XII, Ser 2017-12A, Cl DRCallable 07/22/2018 @ $1005.162%, VAR ICE LIBOR USD 3 Month+2.800%,04/22/2027 (A) . . . . . . . . . . . . . . . . . . . . . . . . . . . . . $ 582,000 $ 583,887
Benefit Street Partners CLO VIII, Ser 2018-8A,Cl CR5.109%, VAR ICE LIBOR USD 3 Month+2.750%,01/20/2031 (A) . . . . . . . . . . . . . . . . . . . . . . . . . . . . . 313,000 307,962
CBAM CLO, Ser 2018-5A, Cl B13.702%, VAR ICE LIBOR USD 3 Month+1.400%,04/17/2031 (A) . . . . . . . . . . . . . . . . . . . . . . . . . . . . . 780,000 771,447
Dryden 57 CLO, Ser 2018-57A, Cl CCallable 05/15/2020 @ $1003.590%, VAR ICE LIBOR USD 3 Month+1.700%,05/15/2031 (A) . . . . . . . . . . . . . . . . . . . . . . . . . . . . . 608,000 600,438
Elm CLO, Ser 2014-1A, Cl CR Callable04/17/2019 @ $1005.303%, VAR ICE LIBOR USD 3 Month+2.950%,01/17/2029 (A) . . . . . . . . . . . . . . . . . . . . . . . . . . . . . 825,000 831,875
Greenwood Park CLO, Ser 2018-1A, Cl CCallable 04/15/2020 @ $1003.725%, VAR ICE LIBOR USD 3 Month+1.700%,04/15/2031 (A) . . . . . . . . . . . . . . . . . . . . . . . . . . . . . 250,000 246,796
Greenwood Park CLO, Ser 2018-1A, Cl DCallable 04/15/2020 @ $1004.525%, VAR ICE LIBOR USD 3 Month+2.500%,04/15/2031 (A) . . . . . . . . . . . . . . . . . . . . . . . . . . . . . 375,000 367,471
Kingsland VIII, Ser 2018-8A, Cl A2.955%, VAR ICE LIBOR USD 3 Month+1.120%,04/20/2031 (A) . . . . . . . . . . . . . . . . . . . . . . . . . . . . . 1,200,000 1,199,371
Kingsland VIII, Ser 2018-8A, Cl B3.315%, VAR ICE LIBOR USD 3 Month+1.480%,04/20/2031 (A) . . . . . . . . . . . . . . . . . . . . . . . . . . . . . 1,425,000 1,409,537
Kingsland VIII, Ser 2018-8A, Cl C3.735%, VAR ICE LIBOR USD 3 Month+1.900%,04/20/2031 (A) . . . . . . . . . . . . . . . . . . . . . . . . . . . . . 750,000 740,777
Madison Park Funding XI, Ser 2017-11A, Cl ARCallable 07/23/2018 @ $1003.522%, VAR ICE LIBOR USD 3 Month+1.160%,07/23/2029 (A) . . . . . . . . . . . . . . . . . . . . . . . . . . . . . 607,000 607,182
The accompanying notes are an integral part of the financial statements.
35

THE ADVISORS’ INNER CIRCLE FUND III PINEBRIDGE DYNAMICASSET ALLOCATION FUNDAPRIL 30, 2018 (Unaudited)
ASSET-BACKED SECURITIES — continued
Face Amount Value
Other Asset-Backed Securities — continued
Madison Park Funding XXX, Ser 2018-30A, Cl C4.039%, VAR ICE LIBOR USD 3 Month+1.700%,04/15/2029 (A) . . . . . . . . . . . . . . . . . . . . . . . . . . . . . $ 275,000 $ 275,000
Madison Park Funding XXX, Ser 2018-30A, Cl D4.839%, VAR ICE LIBOR USD 3 Month+2.500%,04/15/2029 (A) . . . . . . . . . . . . . . . . . . . . . . . . . . . . . 525,000 525,000
Mariner CLO, Ser 2015-1A, Cl CRCallable 04/20/2019 @ $1004.859%, VAR ICE LIBOR USD 3 Month+2.500%,04/20/2029 (A) . . . . . . . . . . . . . . . . . . . . . . . . . . . . . 500,000 502,452
Mariner CLO, Ser 2018-5A, Cl A3.324%, VAR ICE LIBOR USD 3 Month+1.110%,04/25/2031 (A) . . . . . . . . . . . . . . . . . . . . . . . . . . . . . 250,000 250,100
Mariner CLO, Ser 2018-5A, Cl C4.014%, VAR ICE LIBOR USD 3 Month+1.800%,04/25/2031 (A) . . . . . . . . . . . . . . . . . . . . . . . . . . . . . 415,000 409,893
Mariner CLO, Ser 2018-5A, Cl D4.864%, VAR ICE LIBOR USD 3 Month+2.650%,04/25/2031 (A) . . . . . . . . . . . . . . . . . . . . . . . . . . . . . 400,000 392,015
TCW CLO, Ser 2018-1A, Cl D5.265%, VAR ICE LIBOR USD 3 Month+2.910%,04/25/2031 (A) . . . . . . . . . . . . . . . . . . . . . . . . . . . . . 750,000 742,500
Voya CLO, Ser 2018-1A, Cl BCallable 04/19/2020 @ $1004.143%, VAR ICE LIBOR USD 3 Month+1.800%,04/19/2031 (A) . . . . . . . . . . . . . . . . . . . . . . . . . . . . . 450,000 447,543
York CLO, Ser 2017-1A, Cl ARCallable 01/22/2020 @ $1003.512%, VAR ICE LIBOR USD 3 Month+1.150%,01/22/2031 (A) . . . . . . . . . . . . . . . . . . . . . . . . . . . . . 837,000 843,814
York CLO, Ser 2017-1A, Cl CRCallable 01/22/2020 @ $1004.212%, VAR ICE LIBOR USD 3 Month+1.850%,01/22/2031 (A) . . . . . . . . . . . . . . . . . . . . . . . . . . . . . 310,000 309,689
York CLO, Ser 2017-1A, Cl DRCallable 01/22/2020 @ $1004.962%, VAR ICE LIBOR USD 3 Month+2.600%,01/22/2031 (A) . . . . . . . . . . . . . . . . . . . . . . . . . . . . . 250,000 244,988
13,351,473
TOTAL ASSET-BACKED SECURITIES(Cost $25,514,408) . . . . . . . . . . . . . . . . . . . . . . . . . . . 25,345,640
The accompanying notes are an integral part of the financial statements.
36
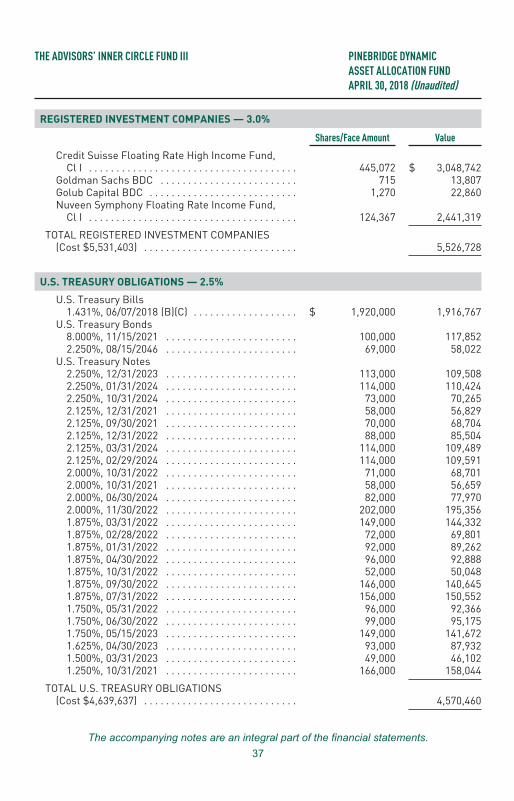
THE ADVISORS’ INNER CIRCLE FUND III PINEBRIDGE DYNAMICASSET ALLOCATION FUNDAPRIL 30, 2018 (Unaudited)
REGISTERED INVESTMENT COMPANIES — 3.0%
Shares/Face Amount Value
Credit Suisse Floating Rate High Income Fund,Cl I . . . . . . . . . . . . . . . . . . . . . . . . . . . . . . . . . . . . . . 445,072 $ 3,048,742
Goldman Sachs BDC . . . . . . . . . . . . . . . . . . . . . . . . . 715 13,807Golub Capital BDC . . . . . . . . . . . . . . . . . . . . . . . . . . . 1,270 22,860Nuveen Symphony Floating Rate Income Fund,
Cl I . . . . . . . . . . . . . . . . . . . . . . . . . . . . . . . . . . . . . . 124,367 2,441,319
TOTAL REGISTERED INVESTMENT COMPANIES(Cost $5,531,403) . . . . . . . . . . . . . . . . . . . . . . . . . . . . 5,526,728
U.S. TREASURY OBLIGATIONS — 2.5%
U.S. Treasury Bills1.431%, 06/07/2018 (B)(C) . . . . . . . . . . . . . . . . . . . $ 1,920,000 1,916,767
U.S. Treasury Bonds8.000%, 11/15/2021 . . . . . . . . . . . . . . . . . . . . . . . . 100,000 117,8522.250%, 08/15/2046 . . . . . . . . . . . . . . . . . . . . . . . . 69,000 58,022
U.S. Treasury Notes2.250%, 12/31/2023 . . . . . . . . . . . . . . . . . . . . . . . . 113,000 109,5082.250%, 01/31/2024 . . . . . . . . . . . . . . . . . . . . . . . . 114,000 110,4242.250%, 10/31/2024 . . . . . . . . . . . . . . . . . . . . . . . . 73,000 70,2652.125%, 12/31/2021 . . . . . . . . . . . . . . . . . . . . . . . . 58,000 56,8292.125%, 09/30/2021 . . . . . . . . . . . . . . . . . . . . . . . . 70,000 68,7042.125%, 12/31/2022 . . . . . . . . . . . . . . . . . . . . . . . . 88,000 85,5042.125%, 03/31/2024 . . . . . . . . . . . . . . . . . . . . . . . . 114,000 109,4892.125%, 02/29/2024 . . . . . . . . . . . . . . . . . . . . . . . . 114,000 109,5912.000%, 10/31/2022 . . . . . . . . . . . . . . . . . . . . . . . . 71,000 68,7012.000%, 10/31/2021 . . . . . . . . . . . . . . . . . . . . . . . . 58,000 56,6592.000%, 06/30/2024 . . . . . . . . . . . . . . . . . . . . . . . . 82,000 77,9702.000%, 11/30/2022 . . . . . . . . . . . . . . . . . . . . . . . . 202,000 195,3561.875%, 03/31/2022 . . . . . . . . . . . . . . . . . . . . . . . . 149,000 144,3321.875%, 02/28/2022 . . . . . . . . . . . . . . . . . . . . . . . . 72,000 69,8011.875%, 01/31/2022 . . . . . . . . . . . . . . . . . . . . . . . . 92,000 89,2621.875%, 04/30/2022 . . . . . . . . . . . . . . . . . . . . . . . . 96,000 92,8881.875%, 10/31/2022 . . . . . . . . . . . . . . . . . . . . . . . . 52,000 50,0481.875%, 09/30/2022 . . . . . . . . . . . . . . . . . . . . . . . . 146,000 140,6451.875%, 07/31/2022 . . . . . . . . . . . . . . . . . . . . . . . . 156,000 150,5521.750%, 05/31/2022 . . . . . . . . . . . . . . . . . . . . . . . . 96,000 92,3661.750%, 06/30/2022 . . . . . . . . . . . . . . . . . . . . . . . . 99,000 95,1751.750%, 05/15/2023 . . . . . . . . . . . . . . . . . . . . . . . . 149,000 141,6721.625%, 04/30/2023 . . . . . . . . . . . . . . . . . . . . . . . . 93,000 87,9321.500%, 03/31/2023 . . . . . . . . . . . . . . . . . . . . . . . . 49,000 46,1021.250%, 10/31/2021 . . . . . . . . . . . . . . . . . . . . . . . . 166,000 158,044
TOTAL U.S. TREASURY OBLIGATIONS(Cost $4,639,637) . . . . . . . . . . . . . . . . . . . . . . . . . . . . 4,570,460
The accompanying notes are an integral part of the financial statements.
37

THE ADVISORS’ INNER CIRCLE FUND III PINEBRIDGE DYNAMICASSET ALLOCATION FUNDAPRIL 30, 2018 (Unaudited)
SOVEREIGN DEBT — 2.3%
Face Amount(1) Value
Australia Government International Bond4.250%, 04/21/2026 . . . . . . . . . . . . . . . . . . . . . AUD 71,000 $ 59,3773.000%, 03/21/2047 . . . . . . . . . . . . . . . . . . . . . AUD 42,000 29,8522.750%, 04/21/2024 . . . . . . . . . . . . . . . . . . . . . AUD 78,000 59,3562.250%, 05/21/2028 . . . . . . . . . . . . . . . . . . . . . AUD 87,000 62,471
Bundesrepublik Deutschland Bundesanleihe4.750%, 07/04/2040 . . . . . . . . . . . . . . . . . . . . . EUR 59,000 123,2773.250%, 07/04/2042 . . . . . . . . . . . . . . . . . . . . . EUR 10,000 17,539
Canadian Government International Bond5.750%, 06/01/2033 . . . . . . . . . . . . . . . . . . . . . CAD 10,000 11,1385.000%, 06/01/2037 . . . . . . . . . . . . . . . . . . . . . CAD 25,000 27,2453.250%, 06/01/2021 . . . . . . . . . . . . . . . . . . . . . CAD 44,000 35,5252.750%, 06/01/2022 . . . . . . . . . . . . . . . . . . . . . CAD 49,000 39,1582.500%, 06/01/2024 . . . . . . . . . . . . . . . . . . . . . CAD 54,000 42,7712.250%, 06/01/2025 . . . . . . . . . . . . . . . . . . . . . CAD 51,000 39,7661.500%, 06/01/2023 . . . . . . . . . . . . . . . . . . . . . CAD 55,000 41,5071.500%, 06/01/2026 . . . . . . . . . . . . . . . . . . . . . CAD 52,000 38,2341.000%, 09/01/2022 . . . . . . . . . . . . . . . . . . . . . CAD 45,000 33,4630.750%, 09/01/2020 . . . . . . . . . . . . . . . . . . . . . CAD 90,000 68,2260.750%, 03/01/2021 . . . . . . . . . . . . . . . . . . . . . CAD 54,000 40,6320.750%, 09/01/2021 . . . . . . . . . . . . . . . . . . . . . CAD 59,000 44,0590.500%, 03/01/2022 . . . . . . . . . . . . . . . . . . . . . CAD 59,000 43,309
Finland Government International Bond2.625%, 07/04/2042(A) . . . . . . . . . . . . . . . . . . . EUR 18,000 28,219
French Government Bond OAT4.500%, 04/25/2041 . . . . . . . . . . . . . . . . . . . . . EUR 33,000 64,113
French Republic Government Bond OAT4.000%, 10/25/2038 . . . . . . . . . . . . . . . . . . . . . EUR 17,000 30,410
Indonesia Treasury Bond8.375%, 03/15/2024 . . . . . . . . . . . . . . . . . . . . . IDR 11,200,000,000 863,1438.375%, 09/15/2026 . . . . . . . . . . . . . . . . . . . . . IDR 6,000,000,000 466,4158.250%, 07/15/2021 . . . . . . . . . . . . . . . . . . . . . IDR 9,150,000,000 690,5668.250%, 05/15/2036 . . . . . . . . . . . . . . . . . . . . . IDR 1,300,000,000 100,1227.000%, 05/15/2022 . . . . . . . . . . . . . . . . . . . . . IDR 1,500,000,000 109,434
Ireland Government International Bond2.000%, 02/18/2045 . . . . . . . . . . . . . . . . . . . . . EUR 35,000 44,9411.700%, 05/15/2037 . . . . . . . . . . . . . . . . . . . . . EUR 21,000 26,069
Italy Buoni Poliennali Del Tesoro6.500%, 11/01/2027 . . . . . . . . . . . . . . . . . . . . . EUR 23,000 39,5036.000%, 05/01/2031 . . . . . . . . . . . . . . . . . . . . . EUR 31,000 53,9335.250%, 11/01/2029 . . . . . . . . . . . . . . . . . . . . . EUR 15,000 24,2375.000%, 09/01/2040 . . . . . . . . . . . . . . . . . . . . . EUR 23,000 38,517
The accompanying notes are an integral part of the financial statements.
38
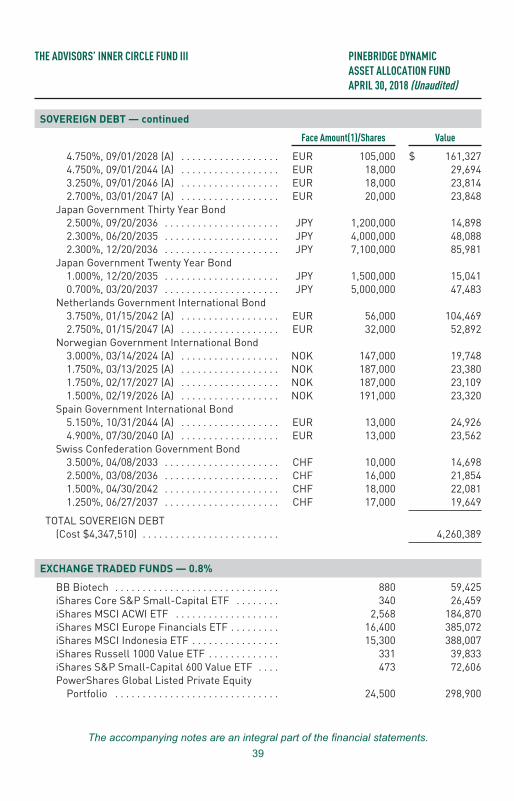
THE ADVISORS’ INNER CIRCLE FUND III PINEBRIDGE DYNAMICASSET ALLOCATION FUNDAPRIL 30, 2018 (Unaudited)
SOVEREIGN DEBT — continued
Face Amount(1)/Shares Value
4.750%, 09/01/2028 (A) . . . . . . . . . . . . . . . . . . EUR 105,000 $ 161,3274.750%, 09/01/2044 (A) . . . . . . . . . . . . . . . . . . EUR 18,000 29,6943.250%, 09/01/2046 (A) . . . . . . . . . . . . . . . . . . EUR 18,000 23,8142.700%, 03/01/2047 (A) . . . . . . . . . . . . . . . . . . EUR 20,000 23,848
Japan Government Thirty Year Bond2.500%, 09/20/2036 . . . . . . . . . . . . . . . . . . . . . JPY 1,200,000 14,8982.300%, 06/20/2035 . . . . . . . . . . . . . . . . . . . . . JPY 4,000,000 48,0882.300%, 12/20/2036 . . . . . . . . . . . . . . . . . . . . . JPY 7,100,000 85,981
Japan Government Twenty Year Bond1.000%, 12/20/2035 . . . . . . . . . . . . . . . . . . . . . JPY 1,500,000 15,0410.700%, 03/20/2037 . . . . . . . . . . . . . . . . . . . . . JPY 5,000,000 47,483
Netherlands Government International Bond3.750%, 01/15/2042 (A) . . . . . . . . . . . . . . . . . . EUR 56,000 104,4692.750%, 01/15/2047 (A) . . . . . . . . . . . . . . . . . . EUR 32,000 52,892
Norwegian Government International Bond3.000%, 03/14/2024 (A) . . . . . . . . . . . . . . . . . . NOK 147,000 19,7481.750%, 03/13/2025 (A) . . . . . . . . . . . . . . . . . . NOK 187,000 23,3801.750%, 02/17/2027 (A) . . . . . . . . . . . . . . . . . . NOK 187,000 23,1091.500%, 02/19/2026 (A) . . . . . . . . . . . . . . . . . . NOK 191,000 23,320
Spain Government International Bond5.150%, 10/31/2044 (A) . . . . . . . . . . . . . . . . . . EUR 13,000 24,9264.900%, 07/30/2040 (A) . . . . . . . . . . . . . . . . . . EUR 13,000 23,562
Swiss Confederation Government Bond3.500%, 04/08/2033 . . . . . . . . . . . . . . . . . . . . . CHF 10,000 14,6982.500%, 03/08/2036 . . . . . . . . . . . . . . . . . . . . . CHF 16,000 21,8541.500%, 04/30/2042 . . . . . . . . . . . . . . . . . . . . . CHF 18,000 22,0811.250%, 06/27/2037 . . . . . . . . . . . . . . . . . . . . . CHF 17,000 19,649
TOTAL SOVEREIGN DEBT(Cost $4,347,510) . . . . . . . . . . . . . . . . . . . . . . . . . 4,260,389
EXCHANGE TRADED FUNDS — 0.8%
BB Biotech . . . . . . . . . . . . . . . . . . . . . . . . . . . . . . 880 59,425iShares Core S&P Small-Capital ETF . . . . . . . . 340 26,459iShares MSCI ACWI ETF . . . . . . . . . . . . . . . . . . . 2,568 184,870iShares MSCI Europe Financials ETF . . . . . . . . . 16,400 385,072iShares MSCI Indonesia ETF . . . . . . . . . . . . . . . . 15,300 388,007iShares Russell 1000 Value ETF . . . . . . . . . . . . . 331 39,833iShares S&P Small-Capital 600 Value ETF . . . . 473 72,606PowerShares Global Listed Private Equity
Portfolio . . . . . . . . . . . . . . . . . . . . . . . . . . . . . . 24,500 298,900
The accompanying notes are an integral part of the financial statements.
39
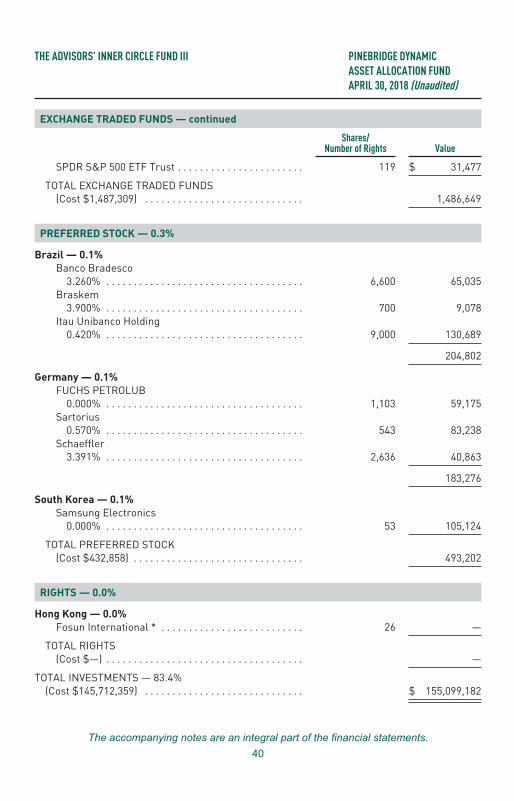
THE ADVISORS’ INNER CIRCLE FUND III PINEBRIDGE DYNAMICASSET ALLOCATION FUNDAPRIL 30, 2018 (Unaudited)
EXCHANGE TRADED FUNDS — continued
Shares/Number of Rights Value
SPDR S&P 500 ETF Trust . . . . . . . . . . . . . . . . . . . . . . . 119 $ 31,477
TOTAL EXCHANGE TRADED FUNDS(Cost $1,487,309) . . . . . . . . . . . . . . . . . . . . . . . . . . . . . 1,486,649
PREFERRED STOCK — 0.3%
Brazil — 0.1%
Banco Bradesco3.260% . . . . . . . . . . . . . . . . . . . . . . . . . . . . . . . . . . . . 6,600 65,035
Braskem3.900% . . . . . . . . . . . . . . . . . . . . . . . . . . . . . . . . . . . . 700 9,078
Itau Unibanco Holding0.420% . . . . . . . . . . . . . . . . . . . . . . . . . . . . . . . . . . . . 9,000 130,689
204,802
Germany — 0.1%
FUCHS PETROLUB0.000% . . . . . . . . . . . . . . . . . . . . . . . . . . . . . . . . . . . . 1,103 59,175
Sartorius0.570% . . . . . . . . . . . . . . . . . . . . . . . . . . . . . . . . . . . . 543 83,238
Schaeffler3.391% . . . . . . . . . . . . . . . . . . . . . . . . . . . . . . . . . . . . 2,636 40,863
183,276
South Korea — 0.1%
Samsung Electronics0.000% . . . . . . . . . . . . . . . . . . . . . . . . . . . . . . . . . . . . 53 105,124
TOTAL PREFERRED STOCK(Cost $432,858) . . . . . . . . . . . . . . . . . . . . . . . . . . . . . . . 493,202
RIGHTS — 0.0%
Hong Kong — 0.0%
Fosun International * . . . . . . . . . . . . . . . . . . . . . . . . . . 26 —
TOTAL RIGHTS(Cost $—) . . . . . . . . . . . . . . . . . . . . . . . . . . . . . . . . . . . . —
TOTAL INVESTMENTS — 83.4%(Cost $145,712,359) . . . . . . . . . . . . . . . . . . . . . . . . . . . . . $ 155,099,182
The accompanying notes are an integral part of the financial statements.
40

THE ADVISORS’ INNER CIRCLE FUND III PINEBRIDGE DYNAMICASSET ALLOCATION FUNDAPRIL 30, 2018 (Unaudited)
Percentages are based on Net Assets of $185,772,679.
* Non-income producing security.(1) In U.S. dollars unless otherwise indicated.(A) Securities sold within terms of a private placement memorandum, exempt from
registration under Section 144A of the Securities Act of 1933, as amended, and may besold only to dealers in that program or other “accredited investors”. The total value ofsuch securities as of April 30, 2018 was $13,953,222 and represents 7.51% of Net Assets.
(B) Zero coupon security. The rate reported on the Schedule of Investments is the effectiveyield at time of purchase.
(C) Security has been pledged as collateral on open futures contracts.‡ Real Estate Investment Trust
ACWI — All Country World IndexADR — American Depositary ReceiptAUD — Australian DollarBDC — Business Development CompanyCAD — Canadian DollarCHF— Swiss FrancCl — ClassCLO — Collateralized Loan ObligationEAFE — Europe, Australasia and Far EastETF — Exchange Traded FundEUR — EuroGBP — British PoundICE — Intercontinental ExchangeIDR — Indonesian RupiahINR — Indian RupeeJPY — Japanese YenLIBOR — London Interbank Offered RateMSCI — Morgan Stanley Capital InternationalNOK — Norwegian KroneOAT — Obligations Assimilables du TresorS&P — Standard & Poor’sS&P CNX Nifty — National Stock Exchange of IndiaSer — SeriesSGX — Singapore Exchange LimitedSPDR — Standard & Poor’s Depositary ReceiptTOPIX — Tokyo Stock Price IndexUSD — United States DollarVAR — Variable Rate
The accompanying notes are an integral part of the financial statements.
41

THE ADVISORS’ INNER CIRCLE FUND III PINEBRIDGE DYNAMICASSET ALLOCATION FUNDAPRIL 30, 2018 (Unaudited)
A list of the outstanding forward foreign currency contracts held by the Fund at April 30, 2018,is as follows:
CounterpartySettlement
DateCurrency to
DeliverCurrency
to Receive
UnrealizedAppreciation
(Depreciation)
Morgan Stanley 06/20/18 USD 9,890,878 EUR 7,980,000 $(215,547)Morgan Stanley 06/20/18 CAD 654,200 USD 500,578 (9,573)Morgan Stanley 06/20/18 AUD 284,500 USD 219,285 5,066Morgan Stanley 06/20/18 GBP 27,200 USD 38,102 560Morgan Stanley 06/20/18 USD 4,699,993 JPY 496,523,000 (141,703)Morgan Stanley 06/20/18 USD 7,488,320 INR 492,080,000 (132,956)Morgan Stanley 06/20/18 JPY 23,240,700 USD 220,859 7,500Morgan Stanley 06/20/18 EUR 785,200 USD 971,721 19,707Morgan Stanley 06/20/18 USD 2,699 CAD 3,400 (48)Morgan Stanley 06/20/18 USD 3,033 AUD 3,900 (96)Morgan Stanley 06/20/18 CHF 77,900 USD 82,243 3,274Morgan Stanley 06/20/18 NOK 716,500 USD 92,990 3,508Morgan Stanley 06/20/18 USD 38,249 GBP 27,200 (708)
$(461,016)
The open futures contracts held by the Fund at April 30, 2018, are as follows:
Type of Contract
Number ofContracts
Long (Short)Expiration
DateNotionalAmount Value
UnrealizedAppreciation
(Depreciation)
MSCI EAFE Index E-MINI (32) Jun-2018 (3,252,073) (3,242,400) $ 9,673MSCI Emerging Markets
E-MINI (22) Jun-2018 (1,343,324) (1,267,420) 75,904Russell 1000 Value Index
E-MINI 99 Jun-2018 6,082,443 5,856,345 (226,098)Russell 2000 Index
E-MINI 113 Jun-2018 9,046,169 8,722,470 (323,699)S&P 500 Index E-MINI (68) Jun-2018 (9,443,132) (8,999,800) 443,332SGX S&P CNX Nifty Index 362 May-2018 7,671,684 7,808,340 136,656TOPIX Index 10 Jun-2018 1,604,414 1,627,790 69,498
$10,366,181 $10,505,325 $ 185,266
The accompanying notes are an integral part of the financial statements.
42

THE ADVISORS’ INNER CIRCLE FUND III PINEBRIDGE DYNAMICASSET ALLOCATION FUNDAPRIL 30, 2018 (Unaudited)
The following table summarizes the inputs used as of April 30, 2018, in valuing the Fund’sinvestments and other financial instruments carried at value:
Investment in Securities Level 1 Level 2 Level 3 Total
Common StockAustria $ — $ 242,057 $ — $ 242,057Belgium — 637,253 — 637,253Brazil 6,897,558 — — 6,897,558Canada 568,694 — — 568,694China 601,377 — — 601,377Czech Republic — 117,690 — 117,690Denmark — 650,987 — 650,987Finland — 258,547 — 258,547France — 3,371,428 — 3,371,428Germany — 2,243,425 — 2,243,425Hong Kong — 1,672,324 — 1,672,324Indonesia — 5,594,430 — 5,594,430Ireland — 371,188 — 371,188Italy — 1,822,035 — 1,822,035Japan — 19,539,209 — 19,539,209Luxembourg 50,647 — 50,647Mexico 76,922 — — 76,922Netherlands 137,667 1,450,406 — 1,588,073Norway — 455,546 — 455,546Poland — 305,755 — 305,755Portugal — 47,943 — 47,943South Africa — 99,684 — 99,684South Korea — 642,394 — 642,394Spain — 2,333,047 — 2,333,047Sweden 51,456 1,768,315 — 1,819,771Switzerland — 1,517,074 — 1,517,074Taiwan — 270,409 — 270,409United Kingdom — 828,896 — 828,896United States 58,791,751 — — 58,791,751
Total Common Stock 67,125,425 46,290,689 — 113,416,114
Asset-Backed Securities — 25,345,640 — 25,345,640Registered Investments
Companies 5,526,728 — — 5,526,728U.S. Treasury Obligations — 4,570,460 — 4,570,460Sovereign Debt — 4,260,389 — 4,260,389Exchange Traded Funds 1,427,224 59,425 — 1,486,649
The accompanying notes are an integral part of the financial statements.
43

THE ADVISORS’ INNER CIRCLE FUND III PINEBRIDGE DYNAMICASSET ALLOCATION FUNDAPRIL 30, 2018 (Unaudited)
Investment in Securities Level 1 Level 2 Level 3 Total
Preferred StockBrazil $ 204,802 $ — $ — $ 204,802Germany 183,276 — — 183,276South Korea 105,124 — — 105,124
Total Preferred Stock 493,202 — — 493,202
Rights — — — —
Total Investment inSecurities $74,572,579 $80,526,603 $ — $155,099,182
Other Financial Instruments Level 1 Level 2 Level 3 Total
Forward Contracts *Unrealized
Appreciation $ — $ 39,615 $ — $ 39,615Unrealized
Depreciation — (500,631) — (500,631)Futures Contracts *
UnrealizedAppreciation 735,063 — — 735,063
UnrealizedDepreciation (549,797) — — (549,797)
Total Investments inSecurities $ 185,266 $(461,016) $ — $(275,750)
* Futures contracts and forward contracts are valued at the unrealized appreciation(depreciation) on the instrument
Amounts designated as “— “ are $0.
For the six months ended April 30, 2018, there were transfers between Level 1 and Level 2assets and liabilities due to market closures in the amount of $28,247,971. For the six monthsended April 30, 2018, there were no Level 3 securities.
The accompanying notes are an integral part of the financial statements.
44

THE ADVISORS’ INNER CIRCLE FUND III PINEBRIDGE DYNAMICASSET ALLOCATION FUNDAPRIL 30, 2018 (Unaudited)
STATEMENT OF ASSETS AND LIABILITIES
Assets:
Investments, at Value (Cost $145,712,359) . . . . . . . . . . . . . . . . . . . . . . . . . . . . . $155,099,182Foreign Currency, at Value (Cost $60,340) . . . . . . . . . . . . . . . . . . . . . . . . . . . . . 73,124Cash and Cash Equivalents . . . . . . . . . . . . . . . . . . . . . . . . . . . . . . . . . . . . . . . . . . 24,893,424Receivable for Capital Shares Sold . . . . . . . . . . . . . . . . . . . . . . . . . . . . . . . . . . . 5,125,621Cash Pledged as Collateral for Forward Foreign Currency Contracts . . . . . . . 2,120,000Dividend and Interest Receivable . . . . . . . . . . . . . . . . . . . . . . . . . . . . . . . . . . . . . 370,986Cash Pledged as Collateral for Futures Contracts . . . . . . . . . . . . . . . . . . . . . . . 166,873Receivable for Investment Securities Sold . . . . . . . . . . . . . . . . . . . . . . . . . . . . . 146,695Reclaim Receivable . . . . . . . . . . . . . . . . . . . . . . . . . . . . . . . . . . . . . . . . . . . . . . . . 43,313Unrealized Appreciation on Forward Foreign Currency Contracts . . . . . . . . . . 39,615Unrealized Appreciation on Foreign Spot Currency Contracts . . . . . . . . . . . . . 470Other Prepaid Expenses . . . . . . . . . . . . . . . . . . . . . . . . . . . . . . . . . . . . . . . . . . . . 21,870
Total Assets . . . . . . . . . . . . . . . . . . . . . . . . . . . . . . . . . . . . . . . . . . . . . . . . . . . . . . 188,101,173
Liabilities:
Payable for Investment Securities Purchased . . . . . . . . . . . . . . . . . . . . . . . . . . 1,664,188Unrealized Depreciation on Forward Foreign Currency Contracts . . . . . . . . . . 500,631Payable due to Investment Adviser . . . . . . . . . . . . . . . . . . . . . . . . . . . . . . . . . . . 57,920Payable due to Administrator . . . . . . . . . . . . . . . . . . . . . . . . . . . . . . . . . . . . . . . . 17,908Accrued Foreign Capital Gains Tax on Appreciated Securities . . . . . . . . . . . . . 15,386Payable for Capital Shares Redeemed . . . . . . . . . . . . . . . . . . . . . . . . . . . . . . . . . 10,667Chief Compliance Officer Fees Payable . . . . . . . . . . . . . . . . . . . . . . . . . . . . . . . . 2,300Shareholder Servicing Fees Payable . . . . . . . . . . . . . . . . . . . . . . . . . . . . . . . . . . 637Unrealized Depreciation on Foreign Spot Currency Contracts . . . . . . . . . . . . . 550Payable due to Trustees . . . . . . . . . . . . . . . . . . . . . . . . . . . . . . . . . . . . . . . . . . . . 423Other Accrued Expenses and Other Payables . . . . . . . . . . . . . . . . . . . . . . . . . . . 57,884
Total Liabilities . . . . . . . . . . . . . . . . . . . . . . . . . . . . . . . . . . . . . . . . . . . . . . . . . . . 2,328,494
Net Assets . . . . . . . . . . . . . . . . . . . . . . . . . . . . . . . . . . . . . . . . . . . . . . . . . . . . . . . $185,772,679
The accompanying notes are an integral part of the financial statements.
45

THE ADVISORS’ INNER CIRCLE FUND III PINEBRIDGE DYNAMICASSET ALLOCATION FUNDAPRIL 30, 2018 (Unaudited)
STATEMENT OF ASSETS AND LIABILITIES
NET ASSETS CONSIST OF:
Paid-in Capital . . . . . . . . . . . . . . . . . . . . . . . . . . . . . . . . . . . . . . . . . . . . . . . . . . . . . . $172,307,335Undistributed Net Investment Income . . . . . . . . . . . . . . . . . . . . . . . . . . . . . . . . . . . 49,134Accumulated Net Realized Gain on Investments, Futures Contracts and
Foreign Currency Transactions . . . . . . . . . . . . . . . . . . . . . . . . . . . . . . . . . . . . . . 4,310,674Net Unrealized Appreciation on Investments . . . . . . . . . . . . . . . . . . . . . . . . . . . . . 9,386,823Net Unrealized Appreciation on Futures Contracts . . . . . . . . . . . . . . . . . . . . . . . . 185,266Net Unrealized Depreciation on Forward Contracts, Foreign Currency
Transactions and Translation of Other Assets and Liabilities Denominated inForeign Currencies . . . . . . . . . . . . . . . . . . . . . . . . . . . . . . . . . . . . . . . . . . . . . . . . (451,167)
Accrued Foreign Capital Gains Tax on Appreciated Securities . . . . . . . . . . . . . . . (15,386)
Net Assets . . . . . . . . . . . . . . . . . . . . . . . . . . . . . . . . . . . . . . . . . . . . . . . . . . . . . . . $185,772,679
Institutional Shares:
Net Assets . . . . . . . . . . . . . . . . . . . . . . . . . . . . . . . . . . . . . . . . . . . . . . . . . . . . . . . . $182,969,103Outstanding Shares of beneficial interest (unlimited authorization — no par
value) . . . . . . . . . . . . . . . . . . . . . . . . . . . . . . . . . . . . . . . . . . . . . . . . . . . . . . . . . . 16,259,797Net Asset Value, Offering and Redemption Price Per Share . . . . . . . . . . . . . . . $11.25
Investor Servicing Shares:
Net Assets . . . . . . . . . . . . . . . . . . . . . . . . . . . . . . . . . . . . . . . . . . . . . . . . . . . . . . . . $ 2,803,576Outstanding Shares of beneficial interest (unlimited authorization — no par
value) . . . . . . . . . . . . . . . . . . . . . . . . . . . . . . . . . . . . . . . . . . . . . . . . . . . . . . . . . . 249,019Net Asset Value, Offering and Redemption Price Per Share . . . . . . . . . . . . . . . $11.26
The accompanying notes are an integral part of the financial statements.
46
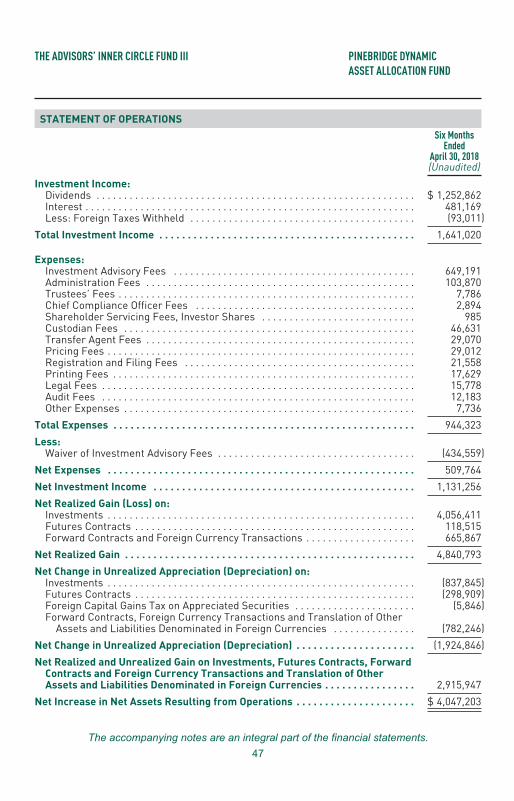
THE ADVISORS’ INNER CIRCLE FUND III PINEBRIDGE DYNAMICASSET ALLOCATION FUND
STATEMENT OF OPERATIONS
Six MonthsEnded
April 30, 2018(Unaudited)
Investment Income:Dividends . . . . . . . . . . . . . . . . . . . . . . . . . . . . . . . . . . . . . . . . . . . . . . . . . . . . . . . . . . $ 1,252,862Interest . . . . . . . . . . . . . . . . . . . . . . . . . . . . . . . . . . . . . . . . . . . . . . . . . . . . . . . . . . . . 481,169Less: Foreign Taxes Withheld . . . . . . . . . . . . . . . . . . . . . . . . . . . . . . . . . . . . . . . . . (93,011)
Total Investment Income . . . . . . . . . . . . . . . . . . . . . . . . . . . . . . . . . . . . . . . . . . . . . 1,641,020
Expenses:Investment Advisory Fees . . . . . . . . . . . . . . . . . . . . . . . . . . . . . . . . . . . . . . . . . . . . 649,191Administration Fees . . . . . . . . . . . . . . . . . . . . . . . . . . . . . . . . . . . . . . . . . . . . . . . . . 103,870Trustees’ Fees . . . . . . . . . . . . . . . . . . . . . . . . . . . . . . . . . . . . . . . . . . . . . . . . . . . . . . 7,786Chief Compliance Officer Fees . . . . . . . . . . . . . . . . . . . . . . . . . . . . . . . . . . . . . . . . 2,894Shareholder Servicing Fees, Investor Shares . . . . . . . . . . . . . . . . . . . . . . . . . . . . 985Custodian Fees . . . . . . . . . . . . . . . . . . . . . . . . . . . . . . . . . . . . . . . . . . . . . . . . . . . . . 46,631Transfer Agent Fees . . . . . . . . . . . . . . . . . . . . . . . . . . . . . . . . . . . . . . . . . . . . . . . . . 29,070Pricing Fees . . . . . . . . . . . . . . . . . . . . . . . . . . . . . . . . . . . . . . . . . . . . . . . . . . . . . . . . 29,012Registration and Filing Fees . . . . . . . . . . . . . . . . . . . . . . . . . . . . . . . . . . . . . . . . . . 21,558Printing Fees . . . . . . . . . . . . . . . . . . . . . . . . . . . . . . . . . . . . . . . . . . . . . . . . . . . . . . . 17,629Legal Fees . . . . . . . . . . . . . . . . . . . . . . . . . . . . . . . . . . . . . . . . . . . . . . . . . . . . . . . . . 15,778Audit Fees . . . . . . . . . . . . . . . . . . . . . . . . . . . . . . . . . . . . . . . . . . . . . . . . . . . . . . . . . 12,183Other Expenses . . . . . . . . . . . . . . . . . . . . . . . . . . . . . . . . . . . . . . . . . . . . . . . . . . . . . 7,736
Total Expenses . . . . . . . . . . . . . . . . . . . . . . . . . . . . . . . . . . . . . . . . . . . . . . . . . . . . . 944,323
Less:Waiver of Investment Advisory Fees . . . . . . . . . . . . . . . . . . . . . . . . . . . . . . . . . . . . (434,559)
Net Expenses . . . . . . . . . . . . . . . . . . . . . . . . . . . . . . . . . . . . . . . . . . . . . . . . . . . . . . 509,764
Net Investment Income . . . . . . . . . . . . . . . . . . . . . . . . . . . . . . . . . . . . . . . . . . . . . . 1,131,256
Net Realized Gain (Loss) on:Investments . . . . . . . . . . . . . . . . . . . . . . . . . . . . . . . . . . . . . . . . . . . . . . . . . . . . . . . . 4,056,411Futures Contracts . . . . . . . . . . . . . . . . . . . . . . . . . . . . . . . . . . . . . . . . . . . . . . . . . . . 118,515Forward Contracts and Foreign Currency Transactions . . . . . . . . . . . . . . . . . . . . 665,867
Net Realized Gain . . . . . . . . . . . . . . . . . . . . . . . . . . . . . . . . . . . . . . . . . . . . . . . . . . . 4,840,793
Net Change in Unrealized Appreciation (Depreciation) on:Investments . . . . . . . . . . . . . . . . . . . . . . . . . . . . . . . . . . . . . . . . . . . . . . . . . . . . . . . . (837,845)Futures Contracts . . . . . . . . . . . . . . . . . . . . . . . . . . . . . . . . . . . . . . . . . . . . . . . . . . . (298,909)Foreign Capital Gains Tax on Appreciated Securities . . . . . . . . . . . . . . . . . . . . . . (5,846)Forward Contracts, Foreign Currency Transactions and Translation of Other
Assets and Liabilities Denominated in Foreign Currencies . . . . . . . . . . . . . . . (782,246)
Net Change in Unrealized Appreciation (Depreciation) . . . . . . . . . . . . . . . . . . . . . (1,924,846)
Net Realized and Unrealized Gain on Investments, Futures Contracts, ForwardContracts and Foreign Currency Transactions and Translation of OtherAssets and Liabilities Denominated in Foreign Currencies . . . . . . . . . . . . . . . . 2,915,947
Net Increase in Net Assets Resulting from Operations . . . . . . . . . . . . . . . . . . . . . $ 4,047,203
The accompanying notes are an integral part of the financial statements.
47

THE ADVISORS’ INNER CIRCLE FUND III PINEBRIDGE DYNAMICASSET ALLOCATION FUND
STATEMENTS OF CHANGES IN NET ASSETS
Six MonthsEnded
April 30, 2018(Unaudited)
Year EndedOctober 31, 2017
Operations:Net Investment Income . . . . . . . . . . . . . . . . . . . . . . . . . . . . . . . $ 1,131,256 $ 2,271,471Net Realized Gain on Investments, Futures Contracts and
Foreign Currency Transactions . . . . . . . . . . . . . . . . . . . . . . . 4,840,793 6,272,251Net Change in Unrealized Appreciation (Depreciation) on
Investments, Futures Contracts Forward Contracts,Foreign Currency Transactions and Translation of OtherAssets, Foreign Capital Gains Tax on AppreciatedSecurities and Liabilities Denominated in ForeignCurrencies . . . . . . . . . . . . . . . . . . . . . . . . . . . . . . . . . . . . . . . . (1,924,846) 8,789,857
Net Increase in Net Assets Resulting From Operations . . . . . . 4,047,203 17,333,579
Dividends and Distributions:Net Investment Income:
Institutional Shares . . . . . . . . . . . . . . . . . . . . . . . . . . . . . . . . . (3,021,305) (1,726,220)Investor Servicing Shares . . . . . . . . . . . . . . . . . . . . . . . . . . . (10,095) (1,303)
Net Realized Gains:Institutional Shares . . . . . . . . . . . . . . . . . . . . . . . . . . . . . . . . . (6,192,267) (1,388,838)Investor Servicing Shares . . . . . . . . . . . . . . . . . . . . . . . . . . . (21,120) (1,053)
Total Dividends and Distributions . . . . . . . . . . . . . . . . . . . . . . . (9,244,787) (3,117,414)
Capital Share Transactions:Institutional Shares
Issued . . . . . . . . . . . . . . . . . . . . . . . . . . . . . . . . . . . . . . . . . . . . 27,224,876 57,446,606Reinvestment of Distributions . . . . . . . . . . . . . . . . . . . . . . . . 8,648,189 3,115,058Redeemed . . . . . . . . . . . . . . . . . . . . . . . . . . . . . . . . . . . . . . . . (5,239,269) (19,008,284)
Net Institutional Shares Transactions . . . . . . . . . . . . . . . . . . . . 30,633,796 41,553,380
Investor Servicing SharesIssued . . . . . . . . . . . . . . . . . . . . . . . . . . . . . . . . . . . . . . . . . . . . 2,242,328 412,500Reinvestment of Distributions . . . . . . . . . . . . . . . . . . . . . . . . 31,216 2,356
Net Investor Servicing Shares Transactions . . . . . . . . . . . . . . . 2,273,544 414,856
Net Increase in Net Assets From Capital ShareTransactions . . . . . . . . . . . . . . . . . . . . . . . . . . . . . . . . . . . . . . 32,907,340 41,968,236
Total Increase in Net Assets . . . . . . . . . . . . . . . . . . . . . . . . . . . . 27,709,756 56,184,401
Net Assets:Beginning of Period/Year . . . . . . . . . . . . . . . . . . . . . . . . . . . . . . 158,062,923 101,878,522
End of Period/Year (including Undistributed Net InvestmentIncome of $49,134 and $1,949,278, respectively) . . . . . . . . $185,772,679 $158,062,923
The accompanying notes are an integral part of the financial statements.
48

THE ADVISORS’ INNER CIRCLE FUND III PINEBRIDGE DYNAMICASSET ALLOCATION FUND
STATEMENTS OF CHANGES IN NET ASSETS
Six MonthsEnded
April 30, 2018(Unaudited)
Year EndedOctober 31, 2017
Shares Transactions:
Institutional SharesIssued . . . . . . . . . . . . . . . . . . . . . . . . . . . . . . . . . . . . . . . . . . . . . . 2,360,692 5,414,843Reinvestment of Distributions . . . . . . . . . . . . . . . . . . . . . . . . . . 759,259 302,047Redeemed . . . . . . . . . . . . . . . . . . . . . . . . . . . . . . . . . . . . . . . . . . (451,178) (1,807,178)
Total Institutional Shares Transactions . . . . . . . . . . . . . . . . . . . . 2,668,773 3,909,712
Investor Servicing SharesIssued . . . . . . . . . . . . . . . . . . . . . . . . . . . . . . . . . . . . . . . . . . . . . . 198,710 37,331Reinvestment of Distributions . . . . . . . . . . . . . . . . . . . . . . . . . . 2,740 228
Total Investor Servicing Shares Transactions . . . . . . . . . . . . . . . 201,450 37,559
Net Increase in Shares Outstanding From Share
Transactions . . . . . . . . . . . . . . . . . . . . . . . . . . . . . . . . . . . . . . . . 2,870,223 3,947,271
The accompanying notes are an integral part of the financial statements.
49

THE ADVISORS’ INNER CIRCLE FUND III PINEBRIDGE DYNAMICASSET ALLOCATION FUND
FINANCIAL HIGHLIGHTS
Selected Per Share Date & RatiosFor a Share Outstanding
Throughout Each Period/Year
Institutional Shares
Six MonthsEnded
April 30, 2018(Unaudited)
Year EndedOctober 31, 2017
Period EndedOctober 31, 2016(1)
Net Asset Value, Beginning of Period/Year . . . . . . . . $ 11.59 $ 10.51 $ 10.00
Income (Loss) from Investment Operations:Net Investment Income* . . . . . . . . . . . . . . . . . . . . . . . 0.07 0.18 0.14Net Realized and Unrealized Gain . . . . . . . . . . . . . . . . 0.24 1.14 0.37
Total from Investment Operations . . . . . . . . . . . . . 0.31 1.32 0.51
Dividends and Distributions:Net Investment Income . . . . . . . . . . . . . . . . . . . . . . . . (0.21) (0.13) —Net Realized Gains . . . . . . . . . . . . . . . . . . . . . . . . . . . . (0.44) (0.11) —
Total Dividends and Distributions . . . . . . . . . . . . . . (0.65) (0.24) —
Net Asset Value, End of Period/Year . . . . . . . . . . . . . . $ 11.25 $ 11.59 $ 10.51
Total Return† . . . . . . . . . . . . . . . . . . . . . . . . . . . . . . . 2.70%‡ 12.79% 5.10%‡
Ratios and Supplemental Data
Net Assets, End of Period/Year (Thousands) . . . . . . . $182,969 $157,511 $101,773Ratio of Expenses to Average Net Assets . . . . . . . . . . 0.59%†† 0.50% 0.50%††Ratio of Expenses to Average Net Assets (Excluding
Waivers and Reimbursements) . . . . . . . . . . . . . . . . 1.09%†† 1.17% 1.48%††Ratio of Net Investment Income to Average Net
Assets . . . . . . . . . . . . . . . . . . . . . . . . . . . . . . . . . . . . 1.31%†† 1.66% 2.10%††Portfolio Turnover Rate . . . . . . . . . . . . . . . . . . . . . . . . 59%‡ 124% 90%‡
Amounts designated as “—” are either not applicable, $0 or have been rounded to $0.(1) The Fund commenced operations on March 2, 2016.* Per share calculations were performed using average shares for the period.† Returns shown do not reflect the deductions of taxes that a shareholder would pay on Fund
distributions or the redemption of Fund shares.†† Annualized‡ Portfolio turnover and total return is for the period indicated and has not been annualized.
The accompanying notes are an integral part of the financial statements.
50

THE ADVISORS’ INNER CIRCLE FUND III PINEBRIDGE DYNAMICASSET ALLOCATION FUND
FINANCIAL HIGHLIGHTS
Selected Per Share Date & RatiosFor a Share Outstanding
Throughout Each Period/Year
Investor Servicing Shares
Six MonthsEnded
April 30, 2018(Unaudited)
Year EndedOctober 31, 2017
Period EndedOctober 31, 2016(1)
Net Asset Value, Beginning of Period/Year . . . . . $ 11.60 $10.53 $ 10.00
Income (Loss) from Investment Operations:Net Investment Income* . . . . . . . . . . . . . . . . . . . . 0.07 0.17 0.14Net Realized and Unrealized Gain . . . . . . . . . . . . 0.23 1.14 0.39
Total from Investment Operations . . . . . . . . . . 0.30 1.31 0.53
Dividends and Distributions: . . . . . . . . . . . . . . . . .Net Investment Income . . . . . . . . . . . . . . . . . . . . . (0.20) (0.13) —Net Realized Gains . . . . . . . . . . . . . . . . . . . . . . . . . (0.44) (0.11) —
Total Dividends and Distributions . . . . . . . . . . . (0.64) (0.24) —
Net Asset Value, End of Period/Year . . . . . . . . . . $ 11.26 $11.60 $ 10.53
Total Return† . . . . . . . . . . . . . . . . . . . . . . . . . . . . 2.66%‡ 12.67% 5.30%‡
Ratios and Supplemental Data
Net Assets, End of Period/Year (Thousands) . . . . $2,804 $ 552 $ 106Ratio of Expenses to Average Net Assets . . . . . . 0.80%†† 0.56% 0.50%††Ratio of Expenses to Average Net Assets
(Excluding Waivers and Reimbursements) . . . 1.26%†† 1.16% 1.48%††Ratio of Net Investment Income to Average Net
Assets . . . . . . . . . . . . . . . . . . . . . . . . . . . . . . . . . 1.25%†† 1.55% 2.08%††Portfolio Turnover Rate . . . . . . . . . . . . . . . . . . . . . 59%‡ 124% 90%‡
Amounts designated as “—” are either not applicable, $0 or have been rounded to $0.(1) The Fund commenced operations on March 2, 2016.* Per share calculations were performed using average shares for the period.† Returns shown do not reflect the deductions of taxes that a shareholder would pay on Fund
distributions or the redemption of Fund shares.†† Annualized‡ Portfolio turnover and total return is for the period indicated and has not been annualized.
The accompanying notes are an integral part of the financial statements.
51
THE ADVISORS’ INNER CIRCLE FUND III PINEBRIDGE DYNAMICASSET ALLOCATION FUNDAPRIL 30, 2018
NOTES TO FINANCIAL STATEMENTS (Unaudited)
1. Organization:
The Advisors’ Inner Circle Fund III (the “Trust”) is organized as a Delaware statutorytrust under a Declaration of Trust dated December 4, 2013. The Trust is registeredunder the Investment Company Act of 1940, as amended, as an open-endmanagement investment company with 20 funds. The financial statements hereinare those of the PineBridge Dynamic Asset Allocation Fund (the “Fund”). Theinvestment objective of the Fund is to seek absolute return. The Fund is classified asa diversified investment company. PineBridge Investments LLC serves as the Fund’sinvestment adviser (the “Adviser”). The Fund currently offers Institutional Sharesand Investor Servicing Shares. The Fund commenced operations on March 2, 2016.The financial statements of the remaining funds of the Trust are presentedseparately. The assets of each fund are segregated, and a shareholder’s interest islimited to the fund in which shares are held.
2. Significant Accounting Policies:
The following are significant accounting policies, which are consistently followed inthe preparation of the financial statements of the Fund. The Fund is an investmentcompany that applies the accounting and reporting guidance issued in Topic 946 bythe U.S. Financial Accounting Standards Board (“FASB”).
Use of Estimates — The preparation of financial statements in conformity withU.S. GAAP requires management to make estimates and assumptions thataffect the fair value of assets and liabilities and disclosure of contingent assetsand liabilities at the date of the financial statements and the reported amountsof revenues and expenses during the reporting period. Actual results coulddiffer from those estimates and such differences could be material.
Security Valuation — Securities listed on a securities exchange, market orautomated quotation system for which quotations are readily available (exceptfor securities traded on NASDAQ), including securities traded over the counter,are valued at the last quoted sale price on an exchange or market (foreign ordomestic) on which they are traded on valuation date (or at approximately4:00 pm Eastern Standard Time if a security’s primary exchange is normallyopen at that time), or, if there is no such reported sale on the valuation date, atthe most recent quoted bid price. For securities traded on NASDAQ, theNASDAQ Official Closing Price will be used. If available, debt securities arepriced based upon valuations provided by independent, third-party pricingagents. Such values generally reflect the last reported sales price if thesecurity is actively traded. The third-party pricing agents may also value debtsecurities at an evaluated bid price by employing methodologies that utilizeactual market transactions, broker supplied valuations, or other methodologies
52
THE ADVISORS’ INNER CIRCLE FUND III PINEBRIDGE DYNAMICASSET ALLOCATION FUNDAPRIL 30, 2018
designed to identify the market value for such securities. Such methodologiesgenerally consider such factors as security prices, yields, maturities, callfeatures, ratings and developments relating to specific securities in arriving atvaluations. On the first day a new debt security purchase is recorded, if a priceis not available on the automated pricing feeds from our primary and secondarypricing vendors nor is it available from an independent broker, the security maybe valued at its purchase price. Each day thereafter, the debt security will bevalued according to the Trusts’ Fair Value Procedures until an independentsource can be secured. Debt obligations with remaining maturities of sixty daysor less may be valued at their amortized cost, which approximates marketvalue provided that it is determined the amortized cost continues toapproximate fair value. Should existing credit, liquidity or interest rateconditions in the relevant markets and issuer specific circumstances suggestthat amortized cost does not approximate fair value, then the amortized costmethod may not be used. The prices for foreign securities are reported in localcurrency and converted to U.S. dollars using currency exchange rates.
Securities for which market prices are not “readily available” are valued inaccordance with “Fair Value Procedures” established by the Fund’s Board ofTrustees (the “Board”). The Fund’s Fair Value Procedures are implementedthrough a Fair Value Committee (the “Committee”) designated by the Board.Some of the more common reasons that may necessitate that a security bevalued using Fair Value Procedures include: the security’s trading has beenhalted or suspended; the security has been de-listed from a national exchange;the security’s primary trading market is temporarily closed at a time whenunder normal conditions it would be open; the security has not been traded foran extended period of time; the security’s primary pricing source is not able orwilling to provide a price; or trading of the security is subject to localgovernment imposed restrictions. When a security is valued in accordance withthe Fair Value Procedures, the Committee will determine the value after takinginto consideration relevant information reasonably available to the Committee.
Futures contracts that are traded on an exchange are valued at their lastreported sales price as of the valuation date.
For securities that principally trade on a foreign market or exchange, asignificant gap in time can exist between the time of a particular security’s lasttrade and the time at which the Fund calculates its net asset value. The closingprices of such securities may no longer reflect their market value at the timethe Fund calculates its net asset value if an event that could materially affectthe value of those securities (a “Significant Event”) has occurred between thetime of the security’s last close and the time that the Fund calculates net assetvalue. A Significant Event may relate to a single issuer or to an entire marketsector. If the Adviser of the Fund becomes aware of a Significant Event that has
53

THE ADVISORS’ INNER CIRCLE FUND III PINEBRIDGE DYNAMICASSET ALLOCATION FUNDAPRIL 30, 2018
occurred with respect to a security or group of securities after the closing ofthe exchange or market on which the security or securities principally trade,but before the time at which the Fund calculates its net asset value, it mayrequest that a Committee meeting be called.
The Fund uses MarkIt Fair Value (“MarkIt”) as a third party fair valuationvendor. MarkIt provides a fair value for foreign securities in the Fund based oncertain factors and methodologies (involving, generally, tracking valuationcorrelations between the U.S. market and each non-U.S. security) applied byMarkIt in the event that there is a movement in the U.S. market that exceeds aspecific threshold established by the Committee. The Committee establishes“confidence interval” which is used to determine the level of correlationbetween the value of a foreign security and movements in the U.S. marketbefore a particular security is fair valued when the threshold is exceeded. In theevent that the threshold established by the Committee is exceeded on a specificday, the Fund values its non-U.S. securities that exceed the applicable“confidence interval” based upon the fair values provided by MarkIt. In suchevent, it is not necessary to hold a Committee meeting. In the event that theAdviser believes that the fair values provided by MarkIt are not reliable, theAdviser contacts the Administrator and can request that a meeting of theCommittee be held.
If a local market in which the Fund owns securities is closed for one or moredays, the Fund shall value all securities held in that corresponding currencybased on the fair value prices provided by MarkIt using the predeterminedconfidence interval discussed above.
In accordance with U.S. GAAP, the Fund discloses fair value of its investmentsin a hierarchy that prioritizes the inputs to valuation techniques used tomeasure the fair value. The objective of a fair value measurement is todetermine the price that would be received to sell an asset or paid to transfer aliability in an orderly transaction between market participants at themeasurement date (an exit price). Accordingly, the fair value hierarchy givesthe highest priority to quoted prices (unadjusted) in active markets for identicalassets or liabilities (Level 1) and the lowest priority to unobservable inputs(Level 3). The three levels of the fair value hierarchy are described below:
• Level 1 — Unadjusted quoted prices in active markets for identical,unrestricted assets or liabilities that the Fund has the ability to access atthe measurement date
• Level 2 — Other significant observable inputs (includes quoted prices forsimilar securities, interest rates, prepayment speeds, credit risk,referenced indices, quoted prices in inactive markets, adjusted quoted
54

THE ADVISORS’ INNER CIRCLE FUND III PINEBRIDGE DYNAMICASSET ALLOCATION FUNDAPRIL 30, 2018
prices in active markets, adjusted quoted prices on foreign equitysecurities that were adjusted in accordance with pricing proceduresapproved by the Board, etc.); and
• Level 3 — Prices, inputs or exotic modeling techniques which are bothsignificant to the fair value measurement and unobservable (supported bylittle or no market activity).
Investments are classified within the level of the lowest significant inputconsidered in determining fair value. Investments classified within Level 3whose fair value measurement considers several inputs may include Level 1 orLevel 2 inputs as components of the overall fair value measurement.
For the six month period ended April 30, 2018, there have been no significantchanges to the Fund’s fair valuation methodology.
Federal Income Taxes — It is the Fund’s intention to qualify as a regulatedinvestment company for Federal income tax purposes by complying with theappropriate provisions of Subchapter M of the Internal Revenue Code of 1986,as amended. Accordingly, no provisions for Federal income taxes have beenmade in the financial statements.
The Fund evaluates tax positions taken or expected to be taken in the course ofpreparing the Fund’s tax returns to determine whether it is “more-likelythan-not” (i.e., greater than 50-percent) that each tax position will be sustainedupon examination by a taxing authority based on the technical merits of theposition. Tax positions not deemed to meet the more-likely-than-not thresholdare recorded as a tax benefit or expense in the current year. The Fund did notrecord any tax provision in the current period. However, management’sconclusions regarding tax positions taken may be subject to review andadjustment at a later date based on factors including, but not limited to,examination by tax authorities (i.e., from commencement of operations, asapplicable), on-going analysis of and changes to tax laws, regulations andinterpretations thereof.
As of and during the six month period ended April 30, 2018, the Fund did nothave a liability for any unrecognized tax benefits. The Fund recognizes interestand penalties, if any, related to unrecognized tax benefits as income taxexpense in the Statement of Operations. During the six month period endedApril 30, 2018, the Fund did not incur any significant interest or penalties.
Security Transactions and Investment Income — Security transactions areaccounted for on trade date. Costs used in determining realized gains andlosses on the sale of investment securities are based on the specificidentification method. Dividend income and expense are recorded on theex-dividend date. Interest income is recognized on the accrual basis from
55

THE ADVISORS’ INNER CIRCLE FUND III PINEBRIDGE DYNAMICASSET ALLOCATION FUNDAPRIL 30, 2018
settlement date and includes the amortization of premiums and the accretion ofdiscount. Certain dividends from foreign securities will be recorded as soon asthe Fund is informed of the dividend if such information is obtained subsequentto the ex-dividend date. Discounts and premiums on fixed income securities areaccreted and amortized using the effective interest method. Realized gains(losses) on paydowns of mortgage-backed and asset-backed securities arerecorded as an adjustment to interest income.
Foreign Currency Translation — The books and records of the Fund aremaintained in U.S. dollars. Investment securities and other assets andliabilities denominated in a foreign currency are translated into U.S. dollars onthe date of valuation. The Fund does not isolate that portion of realized orunrealized gains and losses resulting from changes in the foreign exchangerate from fluctuations arising from changes in the market prices of thesecurities. These gains and losses are included in net realized and unrealizedgains and losses on investments on the Statement of Operations. Net realizedand unrealized gains and losses on foreign currency transactions represent netforeign exchange gains or losses from foreign currency exchange contracts,disposition of foreign currencies, currency gains or losses realized betweentrade and settlement dates on securities transactions and the differencebetween the amount of the investment income and foreign withholding taxesrecorded on the Fund’s books and the U.S. dollar equivalent of the amountsactually received or paid.
Forward Foreign Currency Exchange Contracts — The Fund enters into forwardforeign currency exchange contracts to protect the value of securities held andrelated receivables and payables against changes in future foreign exchangerates. A forward currency contract is an agreement between two parties to buyand sell currency at a set price on a future date. The market value of thecontract will fluctuate with changes in currency exchange rates. The contract ismarked-to-market daily using the current forward rate and the change inmarket value is recorded by the Fund as unrealized gain or loss. The Fundrecognizes realized gains or losses when the contract is closed, equal to thedifference between the value of the contract at the time it was opened and thevalue at the time it was closed. Any realized or unrealized appreciation(depreciation) during the period are presented on the Statements of Operations.Risks may arise from unanticipated movements in the value of a foreigncurrency relative to the U.S. dollar. Risks may also arise upon entering intothese contracts from the potential inability of counterparties to meet the termsof their contracts and are generally limited to the amount of unrealized gain onthe contracts at the date of default. Refer to the Fund’s Schedule ofInvestments for details regarding open forward foreign currency contracts as ofApril 30, 2018, if applicable.
56

THE ADVISORS’ INNER CIRCLE FUND III PINEBRIDGE DYNAMICASSET ALLOCATION FUNDAPRIL 30, 2018
For the six month period ended April 30, 2018, the average balances of forwardforeign currency exchange contracts were as follows:
Average Monthly Notional Contracts Purchased $24,098,491Average Monthly Notional Contracts Sold $ 8,040,405
Futures Contracts — The Fund utilized futures contracts during the six monthperiod ended April 30, 2018. To the extent consistent with its investmentobjective and strategies, the Fund may use futures contracts for tacticalhedging purposes as well as to enhance the Fund’s returns. Initial margindeposits of cash or securities are made upon entering into futures contracts.The futures contracts are valued at the settlement price established each dayby the board of exchange on which they are traded. The futures contracts aremarked to market daily and the resulting changes in value are accounted for asunrealized gains and losses. Variation margin payments are paid or received,depending upon whether unrealized gains or losses are incurred. When thefutures contract is closed, the Fund records a realized gain or loss equal to thedifference between the proceeds from (or cost of) the closing transaction andthe amount invested in the futures contract.
Risks of entering into futures contracts include the possibility that there will bean imperfect price correlation between the futures and the underlyingsecurities. Second, it is possible that a lack of liquidity for futures contractscould exist in the secondary market, resulting in an inability to close a positionprior to its maturity date. Third, the futures contract involves the risk that aFund could lose more than the original margin deposit required to initiate afutures transaction.
Finally, the risk exists that losses could exceed amounts disclosed on theStatements of Assets and Liabilities. Refer to the Fund’s Schedule ofInvestments for details regarding open futures contracts as of April 30, 2018.
For the six month period ended April 30, 2018, the average notional amount offutures contracts held were as follows:
Average Monthly Notional Balance Long $25,378,482Average Monthly Notional Balance Short $12,978,840
Investments in Real Estate Investment Trusts (“REITs”) — Dividend income fromREITs is recorded based on the income included in distributions received fromthe REIT investments using published REIT reclassifications, including somemanagement estimates when actual amounts are not available. Distributionsreceived in excess of this estimated amount are recorded as a reduction of thecost of investments or reclassified to capital gains. The actual amounts ofincome, return of capital, and capital gains are only determined by each REITafter its fiscal year-end, and may differ from the estimated amounts.
57

THE ADVISORS’ INNER CIRCLE FUND III PINEBRIDGE DYNAMICASSET ALLOCATION FUNDAPRIL 30, 2018
Expenses — Most expenses of the Trust can be directly attributed to a particularfund. Expenses which cannot be directly attributed to a particular fund areapportioned among the funds of the Trust based on the number of funds and/orrelative net assets.
Cash Equivalents — Idle cash may be swept into various time deposit accountsand is classified as cash equivalents on the Statements of Assets andLiabilities. The Fund maintains cash in bank deposit accounts which, at timesmay exceed United States federally insured limits. Amounts invested areavailable on the same business day.
Dividends and Distributions to Shareholders — The Fund distributes substantiallyall of its net investment income annually. Any net realized capital gains aredistributed annually. All distributions are recorded on ex-dividend date.
3. Derivative Transactions:
The following tables include the Fund’s exposure by type of risk on derivatives heldthroughout the period.
The fair value of derivative instruments as of April 30, 2018, was as follows:
Asset Derivatives Liability DerivativesStatement of Assets
and Liability Location Fair ValueStatement of Assets
and Liability Location Fair Value
Derivatives not accounted for as hedging instruments:
Equitycontracts
Net Assets — Unrealizedappreciation on futurescontracts $735,063*
Net Assets — Unrealizeddepreciation on futurescontracts $ 549,797*
Foreignexchangecontracts
Net Assets — Unrealizedappreciation on forwardforeign currencycontracts 39,615*
Net Assets — Unrealizeddepreciation on forwardforeign currencycontracts 500,631*
Total Derivatives not accounted for ashedging instruments $774,678 $1,050,428
* Includes cumulative appreciation (depreciation) of futures and forward contacts as reportedin the Schedule of Investments
The effective of derivative instruments on the Statement of Operations for the sixmonth period ended April 30, 2018, was as follows:
58

THE ADVISORS’ INNER CIRCLE FUND III PINEBRIDGE DYNAMICASSET ALLOCATION FUNDAPRIL 30, 2018
The amount of realized gain (loss) on derivatives recognized in income:
Derivatives Not Accounted for as Hedging InstrumentsFutures
Contracts
ForwardForeign
CurrencyContracts Total
Foreign exchange contracts . . . . . . . . . . . . . . . . $ — $564,917 $564,917Equity contracts . . . . . . . . . . . . . . . . . . . . . . . . . . 118,515 — 118,515
Total . . . . . . . . . . . . . . . . . . . . . . . . . . . . . . . . . . $118,515 $564,917 $683,432
Change in unrealized appreciation (depreciation) on derivatives recognized inincome:
Derivatives Not Accounted for as Hedging InstrumentsFutures
Contracts
ForwardForeign
CurrencyContracts Total
Foreign exchange contracts . . . . . . . . . . . . . $ — $(779,235) $ (779,235)Equity contracts . . . . . . . . . . . . . . . . . . . . . . . (298,909) — (298,909)
Total . . . . . . . . . . . . . . . . . . . . . . . . . . . . . . $(298,909) $(779,235) $(1,078,144)
4. Offsetting Assets and Liabilities:
The Fund is subject to various netting arrangements with select counterparties(“Master Agreements”). Master Agreements govern the terms of certaintransactions, and reduce the counterparty risk associated with relevant transactionsby specifying credit protection mechanisms and providing standardization thatimproves legal certainty. Since different types of transactions have differentmechanics and are sometimes traded out of different legal entities of a particularcounterparty organization, each type of transaction may be covered by a differentMaster Agreement, resulting in the need for multiple agreements with a singlecounterparty. As the Master Agreements are specific to unique operations ofdifferent asset types, they allow a Fund to close out and net its total exposure to aspecific counterparty entity in the event of a default with respect to all thetransactions governed under a single agreement with a specific counterparty entity.
Master Agreements can also help limit counterparty risk by specifying collateralposting arrangements at pre-arranged exposure levels. Under the MasterAgreements, collateral is routinely transferred if the total net exposure to certaintransactions (net of existing collateral already in place) governed under the relevantMaster Agreement with a counterparty in a given account exceeds a specifiedthreshold, which typically ranges from zero to $250,000 depending on thecounterparty and the type of Master Agreement. United States Treasury Securitiesand U.S. dollar cash are generally the preferred forms of collateral. Securities and
59

THE ADVISORS’ INNER CIRCLE FUND III PINEBRIDGE DYNAMICASSET ALLOCATION FUNDAPRIL 30, 2018
cash pledged as collateral are reflected as assets on the Statement of Assets andLiabilities as either a component of investments at value (securities) or cashpledged as collateral for futures contracts (cash). The market value of anysecurities received as collateral is not reflected as a component of net asset value.A Fund’s overall exposure to counterparty risk can change substantially within ashort period, as it is affected by each transaction subject to the relevant MasterAgreement.
The following is a summary by derivative type of the value of over the counter(“OTC”) financial derivative instruments and collateral (received)/pledged bycounterparty of the Fund as of April 30, 2018:
Counterparty
Gross AssetsRecognized in the
Statement of Assetsand Liabilities
Gross LiabilitiesRecognized in the
Statement of Assetsand Liabilities
NetAmount
Availableto be
Offset
CollateralPledged or
(Received)† Net AmountForward Foreign
Currency Contracts
Morgan Stanley . . $39,615 $(500,631) $(461,016) $— $(461,016)
† Collateral pledged is limited to the net outstanding amount due to/from the counterparty.The actual collateral amounts pledged may exceed these amounts and may fluctuate invalue.
International Swaps and Derivatives Association, Inc. Master Agreements and CreditSupport Annexes (“ISDA Master Agreements”) govern OTC financial derivativetransactions entered into by a Fund and select counterparties. ISDA MasterAgreements maintain provisions for general obligations, representations,agreements, collateral and events of default or termination. Events of terminationinclude conditions that may entitle counterparties to elect to terminate early andcause settlement of all outstanding transactions under the applicable ISDA MasterAgreement. Any election to terminate early could be material to the financialstatements. In limited circumstances, the ISDA Master Agreement may containadditional provisions that add additional counterparty protection beyond coverage ofexisting daily exposure if the counterparty has a decline in credit quality below apredefined level. These amounts, if any, may be segregated with a third partycustodian.
5. Transactions with Affiliates:
Certain officers of the Trust are also employees of SEI Investments Global FundsServices (the “Administrator”), a wholly owned subsidiary of SEI InvestmentsCompany, and/or SEI Investments Distribution Co. (the “Distributor”). Such officersare paid no fees by the Trust, other than the Chief Compliance Officer (“CCO”) asdescribed below, for serving as officers of the Trust.
60

THE ADVISORS’ INNER CIRCLE FUND III PINEBRIDGE DYNAMICASSET ALLOCATION FUNDAPRIL 30, 2018
The services provided by the (“CCO”) and his staff are paid for by the Trust asincurred. The services include regulatory oversight of the Trust’s Advisors andservice providers as required by SEC regulations. The CCO’s services and fees havebeen approved by and are reviewed by the Board.
6. Administration, Distribution, Shareholder Servicing, Custodian and Transfer
Agent Agreements:
The Fund and the Administrator are parties to an Administration Agreement underwhich the Administrator provides administration services to the Fund. For theseservices, the Administrator is paid an asset based fee, which will vary depending onthe number of share classes and the average daily net assets of the Fund. For thesix month period ended April 30, 2018, the Fund paid $103,870 for these services.
The Fund has adopted a shareholder servicing plan (the “Service Plan”) under whicha shareholder servicing fee of up to 0.15% of average daily net assets of InvestorServicing Shares of the Fund will be paid to other service providers. Under theService Plan, other service providers may perform, or may compensate otherservice providers for performing certain shareholder and administrative services.
Brown Brothers Harriman & Co. acts as custodian (the “Custodian”) for the Fund.The Custodian plays no role in determining the investment policies of the Fund orwhich securities are to be purchased or sold by the Fund.
Atlantic Fund Services, LLC, serves as the transfer agent and dividend disbursingagent for the Fund under a transfer agency agreement with the Trust.
7. Investment Advisory Agreement:
Under the terms of an investment advisory agreement, the Adviser providesinvestment advisory services to the Fund at a fee calculated at an annual rate of0.75% of the Fund’s average daily net assets. The Adviser has contractually agreedto reduce fees and/or reimburse expenses to the extent necessary to keep totalannual Fund operating expenses after fee reductions and/or expensereimbursements (excluding any class specific expenses, dividend and interestexpenses on securities sold short, interest, taxes, acquired fund fee expenses andnon-routine expenses (collectively, “excluded expenses”)) from exceeding 0.50% ofthe average daily net assets of the Fund’s Investor Servicing Shares and InstitutionalShares until February 28, 2018 (the “Expense Limitation”). In addition, the Adviserhas contractually agreed to waive fees and/or to reimburse expenses to the extentnecessary to keep Total Annual Fund Operating Expenses (not including excludedexpenses) from exceeding 0.75% of the average daily net assets of the Fund’sInstitutional Shares and Investor Servicing Shares during the period from March 1,2018 through February 28, 2019. The Adviser may recover all or a portion of its feereductions or expense reimbursements, up to the expense cap in place at the timethe expenses were waived, within a three-year period from the year in which it
61

THE ADVISORS’ INNER CIRCLE FUND III PINEBRIDGE DYNAMICASSET ALLOCATION FUNDAPRIL 30, 2018
reduced its fee or reimbursed expenses if the Fund’s total annual fund operatingexpenses are below the Expense Limitation. This agreement may be terminated bythe Board for any reason at any time, or by the Adviser, upon ninety (90) days’ priorwritten notice to the Trust, effective as of the close of business on February 28,2019. As of April 30, 2018, the fees which were previously waived and/or reimbursedto the Fund by the Adviser, which may be subject to possible future reimbursement,up to the expense cap in place at the time the expenses were waived andreimbursed to the Fund, to the Adviser were $531,029, $910,931 and $434,559expiring in 2019, 2020 and 2021, respectively.
8. Investment Transactions:
The cost of security purchases and the proceeds from security sales other thanshort-term securities, for the six month period ended April 30, 2018, were asfollows:
Purchases
U.S. Government . . . . . . . . . . . . . . . . . . . $ 2,036,890Other . . . . . . . . . . . . . . . . . . . . . . . . . . . . . 101,672,862
Sales
U.S. Government . . . . . . . . . . . . . . . . . . . $ 1,386,834Other . . . . . . . . . . . . . . . . . . . . . . . . . . . . . 81,185,656
9. Federal Tax Information:
The amount and character of income and capital gain distributions to be paid, if any,are determined in accordance with Federal income tax regulations, which may differfrom U.S. GAAP. As a result, net investment income (loss) and net realized gain(loss) on investment transactions for a reporting period may differ significantly fromdistributions during such period. These book/tax differences may be temporary orpermanent. Permanent differences are reclassified among capital accounts in thefinancial statements to reflect their tax character. Temporary differences arisewhen certain items of income, expense, gain, or loss are recognized in differentperiods for financial statement and tax purposes; these differences will reverse atsome time in the future. Differences in classification may also result from thetreatment of short-term gains as ordinary income for tax purposes. To the extentthese differences are permanent in nature, they are charged or credited toundistributed net investment income (loss), accumulated net realized gain (loss) orpaid-in capital, as appropriate, in the period that the differences arise.
The tax character of dividends or distributions declared during the year endedOctober 31, 2017.
OrdinaryIncome
Long-TermCapital Gain Total
2017 $3,069,852 $47,562 $3,117,414
62

THE ADVISORS’ INNER CIRCLE FUND III PINEBRIDGE DYNAMICASSET ALLOCATION FUNDAPRIL 30, 2018
As October 31, 2017 of the components of distributable earnings on a tax basis wereas follows:
Undistributed Ordinary Income . . . . . . . . . . . . . . . . . . . . . . . . . . . . . . . . . $ 6,340,126Undistributed Long-Term Capital Gains . . . . . . . . . . . . . . . . . . . . . . . . . 2,236,732Unrealized Appreciation . . . . . . . . . . . . . . . . . . . . . . . . . . . . . . . . . . . . . . 10,134,667Other Temporary Differences . . . . . . . . . . . . . . . . . . . . . . . . . . . . . . . . . . (48,597)
Total Distributable Earnings . . . . . . . . . . . . . . . . . . . . . . . . . . . . . . . . . . . $18,662,928
For Federal income tax purposes, the difference between Federal tax cost and bookcost are primarily due to PFIC and MLPs, which cannot be used for Federal incometax purposes in the current year and have been deferred for use in future years.
The Federal tax cost and aggregate gross unrealized appreciation and depreciationfor the investments held by the Fund at April 30, 2018, were as follows:
Federal Tax Cost
Aggregate GrossUnrealized
Appreciation
Aggregate GrossUnrealized
Depreciation
NetUnrealized
Appreciation
$180,529,527 $14,257,633 $(5,424,760) $8,832,873
10. Concentration of Risks:
As with all management investment companies, a shareholder of the Fund issubject to the risk that his or her investment could lose money. The Fund is subjectto the principal risks noted below, any of which may adversely affect the Fund’s netasset value (“NAV”) and ability to meet its investment objective.
Active Trading Risk — The Fund may actively trade which may result in highertransaction costs to the Fund. Active trading tends to be more pronounced duringperiods of increased market volatility.
Affiliated Fund Risk — Due to its own financial interest or other businessconsiderations, the Adviser may have an incentive to invest a portion of the Fund’sassets in pooled investment vehicles sponsored or managed by the Adviser or itsaffiliates in lieu of investments directly in portfolio securities, or in lieu ofinvestments in pooled investment vehicles sponsored or managed by others.Similarly, the Adviser may have an incentive to delay or decide against the sale ofinterests held by the Fund in pooled investment vehicles sponsored or managed bythe Adviser or its affiliates.
Asset Allocation Risk — The Fund is subject to asset allocation risk, which is the riskthat the Adviser’s allocation of the Fund’s assets among various asset classes willcause the Fund to underperform other funds with a similar investment objectiveand/or underperform the markets in which the Fund invests.
63
THE ADVISORS’ INNER CIRCLE FUND III PINEBRIDGE DYNAMICASSET ALLOCATION FUNDAPRIL 30, 2018
Asset-Backed Securities Risk — Payment of principal and interest on asset backedsecurities is dependent largely on the cash flows generated by the assets backingthe securities, and asset-backed securities may not have the benefit of any securityinterest in the related assets.
Bank Loans Risk — Investments in bank loans (through both assignments andparticipations) are generally subject to the same risks as investments in other typesof debt instruments, including, in many cases, investments in junk bonds. Theremay be limited public information available regarding bank loans and bank loansmay be difficult to value. If the Fund holds a bank loan through another financialinstitution, or relies on a financial institution to administer the loan, its receipt ofprincipal and interest on the loan may be subject to the credit risk of that financialinstitution. It is possible that any collateral securing a loan may be insufficient orunavailable to the Fund, and that the Fund’s rights to collateral may be limited bybankruptcy or insolvency laws. In addition, the secondary market for bank loansmay be subject to irregular trading activity, wide bid/ask spreads, and extendedtrade settlement periods, which may cause the Fund to be unable to realize the fullvalue of its investment in a bank loan.
Bank loans may not be considered “securities,” and purchasers, such as the Fund,therefore may not be entitled to rely on the anti-fraud protections of the federalsecurities laws.
Bank Obligations Risk — The Fund’s investments in bank obligations are subject torisks generally applicable to debt securities, as well as to the risk of negative eventsaffecting the banking industry. Obligations of foreign banks and foreign branches ofU.S. banks are subject to additional risks, including negative political and economicdevelopments in the country in which the bank or branch is located and actions by aforeign government that might adversely affect the payment of principal andinterest on such obligations, such as the seizure or nationalization of foreigndeposits. Additionally, U.S. and state banking laws and regulations may not apply toforeign branches of U.S. banks, and generally do not apply to foreign banks.
Convertible Securities Risk — The value of a convertible security is influenced bychanges in interest rates (with investment value declining as interest rates increaseand increasing as interest rates decline) and the credit standing of the issuer. Theprice of a convertible security will also normally vary in some proportion to changesin the price of the underlying common stock because of the conversion or exercisefeature.
Corporate Fixed Income Securities Risk — Corporate fixed income securities respondto economic developments, especially changes in interest rates, as well asperceptions of the creditworthiness and business prospects of individual issuers.
Credit Risk — The credit rating or financial condition of an issuer may affect thevalue of a fixed income security. Generally, the lower the credit quality of a security,
64
THE ADVISORS’ INNER CIRCLE FUND III PINEBRIDGE DYNAMICASSET ALLOCATION FUNDAPRIL 30, 2018
the greater the perceived risk that the issuer will fail to pay interest fully and returnprincipal in a timely manner. If an issuer defaults or becomes unable to honor itsfinancial obligations, the security may lose some or all of its value.
Derivatives Risk — The Fund’s use of futures contracts, forward contracts, options orswaps is subject to market risk, leverage risk, correlation risk, liquidity risk andhedging risk. Market risk is the risk that the market value of an investment maymove up and down, sometimes rapidly and unpredictably. Leverage risk is the riskthat since derivatives may be purchased for a fraction of their value, a relativelysmall price movement in a derivative may result in an immediate and substantialloss or gain for the Fund, and may also cause the Fund to liquidate portfoliopositions when it would not be advantageous to do so in order to satisfy itsobligations. Correlation risk is the risk that changes in the value of the derivativemay not correlate perfectly or at all with the underlying asset, rate or index.Liquidity risk is the risk that certain securities may be difficult or impossible to sellat the time and the price that the Fund would like. Hedging risk is the risk thatderivatives instruments used for hedging purposes may also limit any potential gainthat may result from the increase in value of the hedged asset. To the extent thatthe Fund engages in hedging strategies, there can be no assurance that suchstrategy will be effective or that there will be a hedge in place at any given time. TheFund’s use of forwards and swaps is also subject to credit risk and valuation risk.Credit risk is the risk that the counterparty to a derivative contract will default orotherwise become unable to honor a financial obligation. Valuation risk is the riskthat the derivative may be difficult to value. Each of these risks could cause theFund to lose more than the principal amount invested in a derivative instrument.
Emerging Markets Securities Risk — The Fund’s investments in emerging marketssecurities are considered speculative and subject to heightened risks in addition tothe general risks of investing in foreign securities. Unlike more establishedmarkets, emerging markets may have governments that are less stable, marketsthat are less liquid and economies that are less developed. In addition, thesecurities markets of emerging market countries may consist of companies withsmaller market capitalizations and may suffer periods of relative illiquidity;significant price volatility; restrictions on foreign investment; and possiblerestrictions on repatriation of investment income and capital. Furthermore, foreigninvestors may be required to register the proceeds of sales, and future economic orpolitical crises could lead to price controls, forced mergers, expropriation orconfiscatory taxation, seizure, nationalization or creation of governmentmonopolies.
Equity Risk — Since it purchases equity securities, the Fund is subject to the riskthat stock prices may fall over short or extended periods of time. Historically, theequity market has moved in cycles, and the value of the Fund’s securities mayfluctuate from day to day. Individual companies may report poor results or be
65

THE ADVISORS’ INNER CIRCLE FUND III PINEBRIDGE DYNAMICASSET ALLOCATION FUNDAPRIL 30, 2018
negatively affected by industry and/or economic trends and developments. Theprices of securities issued by such companies may suffer a decline in response.
Foreign Company Risk — Investing in foreign companies, including directinvestments and investments through depositary receipts, poses additional riskssince political and economic events unique to a country or region will affect thosemarkets and their issuers. These risks will not necessarily affect the U.S. economyor similar issuers located in the U.S. Securities of foreign companies may not beregistered with the U.S. Securities and Exchange Commission (the “SEC”) andforeign companies are generally not subject to the regulatory controls imposed onU.S. issuers and, as a consequence, there is generally less publically availableinformation about foreign securities than is available about domestic securities.Income from foreign securities owned by the Fund may be reduced by a withholdingtax at the source, which tax would reduce income received from the securitiescomprising the portfolio. Foreign securities may also be more difficult to value thansecurities of U.S. issuers. While depositary receipts provide an alternative to directlypurchasing the underlying foreign securities in their respective national marketsand currencies, investments in depositary receipts continue to be subject to many ofthe risks associated with investing directly in foreign securities.
Foreign Currency Risk — As a result of the Fund’s investments in securitiesdenominated in, and/or receiving revenues in, foreign currencies, the Fund will besubject to currency risk. Currency risk is the risk that foreign currencies will declinein value relative to the U.S. dollar, in which case, the dollar value of an investment inthe Fund would be adversely affected.
Foreign Sovereign Debt Securities Risk — The Fund’s investments in foreignsovereign debt securities are subject to the risks that: (i) the governmental entitythat controls the repayment of sovereign debt may not be willing or able to repay theprincipal and/or interest when it becomes due, due to factors such as debt serviceburden, political constraints, cash flow problems and other national economicfactors; (ii) governments may default on their debt securities, which may requireholders of such securities to participate in debt rescheduling or additional lending todefaulting governments; and (iii) there is no bankruptcy proceeding by whichdefaulted sovereign debt may be collected in whole or in part.
High Yield Bond Risk — High yield, or “junk,” bonds are debt securities rated belowinvestment grade. High yield bonds are speculative, involve greater risks of default,downgrade, or price declines and are more volatile and tend to be less liquid thaninvestment-grade securities. Companies issuing high yield bonds are lessfinancially strong, are more likely to encounter financial difficulties, and are morevulnerable to adverse market events and negative sentiments than companies withhigher credit ratings.
66

THE ADVISORS’ INNER CIRCLE FUND III PINEBRIDGE DYNAMICASSET ALLOCATION FUNDAPRIL 30, 2018
Interest Rate Risk — As with most funds that invest in fixed income securities,changes in interest rates could affect the value of your investment. Rising interestrates tend to cause the prices of fixed income securities (especially those withlonger maturities and lower credit qualities) and the Fund’s share price to fall.Risks associated with rising interest rates are heightened given that interest ratesin the U.S. are at, or near, historic lows.
Money Market Instruments Risk — The value of money market instruments may beaffected by changing interest rates and by changes in the credit ratings of theinvestments. An investment in a money market fund is not a bank deposit and is notinsured or guaranteed by any bank, the FDIC or any other government agency. Amoney market fund’s sponsor has no legal obligation to provide financial support tothe fund, and there should be no expectation that the sponsor will provide financialsupport to the fund at any time. Certain money market funds float their net assetvalue (“NAV”) while others seek to preserve the value of investments at a stable NAV(typically, $1.00 per share). An investment in a money market fund, even aninvestment in a fund seeking to maintain a stable NAV per share, is not guaranteedand it is possible for the Fund to lose money by investing in these and other types ofmoney market funds. If the liquidity of a money market fund’s portfolio deterioratesbelow certain levels, the money market fund may suspend redemptions (i.e., imposea redemption gate) and thereby prevent the Fund from selling its investment in themoney market fund or impose a fee of up to 2% on amounts the Fund redeems fromthe money market fund (i.e., impose a liquidity fee). These measures may result inan investment loss or prohibit the Fund from redeeming shares when the Adviserwould otherwise redeem shares. Money market funds and the securities they investin are subject to comprehensive regulations. The enactment of new legislation orregulations, as well as changes in interpretation and enforcement of current laws,may affect the manner of operation, performance and/or yield of money marketfunds.
Mortgage-Backed Securities Risk — Mortgage-backed securities are affected by,among other things, interest rate changes and the possibility of prepayment of theunderlying mortgage loans. Mortgage-backed securities are also subject to the riskthat underlying borrowers will be unable to meet their obligations.
Portfolio Turnover Risk — The Fund is subject to portfolio turnover risk since it maybuy and sell investments frequently. Such a strategy often involves higher expenses,including brokerage commissions, and may increase the amount of capital gains (inparticular, short term gains) realized by the Fund. Shareholders may pay tax onsuch capital gains.
Preferred Stocks Risk — Preferred stocks are sensitive to interest rate changes, andare also subject to equity risk, which is the risk that stock prices will fall over shortor extended periods of time. The rights of preferred stocks on the distribution of a
67

THE ADVISORS’ INNER CIRCLE FUND III PINEBRIDGE DYNAMICASSET ALLOCATION FUNDAPRIL 30, 2018
company’s assets in the event of a liquidation are generally subordinate to the rightsassociated with a company’s debt securities.
Prepayment and Extension Risk — When interest rates fall, issuers of high interestdebt obligations may pay off the debts earlier than expected (prepayment risk), andthe Fund may have to reinvest the proceeds at lower yields. When interest ratesrise, issuers of lower interest debt obligations may pay off the debts later thanexpected (extension risk), thus keeping the Fund’s assets tied up in lower interestdebt obligations.
REITs Risk — REITs are pooled investment vehicles that own, and usually operate,income-producing real estate. REITs are susceptible to the risks associated withdirect ownership of real estate, such as the following: declines in property values;increases in property taxes, operating expenses, interest rates or competition;overbuilding; zoning changes; and losses from casualty or condemnation. REITstypically incur fees that are separate from those of the Fund. Accordingly, theFund’s investments in REITs will result in the layering of expenses such thatshareholders will indirectly bear a proportionate share of the REITs’ operatingexpenses, in addition to paying Fund expenses.
Repurchase Agreements Risk — Under a repurchase agreement, the seller of asecurity to the Fund agrees to repurchase the security at a mutually agreed-upontime and price. If the seller in a repurchase agreement transaction defaults on itsobligation under the agreement, the Fund may suffer delays and incur costs or losemoney in exercising its rights under the agreement.
Reverse Repurchase Agreements Risk — Reverse repurchase agreements involve thesale of securities held by the Fund with an agreement to repurchase the securitiesat an agreed-upon time and price. Reverse repurchase agreements involve the riskthat the other party may fail to return the securities in a timely manner or at all. TheFund could lose money if it is unable to recover the securities and the value of thecollateral held by the Fund, including the value of the investments made with cashcollateral, is less than the value of the securities.
Rights and Warrants Risk — Investments in rights or warrants involve the risk of lossof the purchase value of a right or warrant if the right to subscribe to additionalshares is not exercised prior to the right’s or warrant’s expiration. Also, thepurchase of rights and/or warrants involves the risk that the effective price paid forthe right and/or warrant added to the subscription price of the underlying securitymay exceed the market price of the underlying security in instances such as thosewhere there is no movement in the price of the underlying security.
68

THE ADVISORS’ INNER CIRCLE FUND III PINEBRIDGE DYNAMICASSET ALLOCATION FUNDAPRIL 30, 2018
Risks of Investing in Other Investment Companies — To the extent the Fund invests inother investment companies, such as open-end funds, closed-end funds and ETFs,the Fund will be subject to substantially the same risks as those associated with thedirect ownership of the securities held by such other investment companies. As ashareholder of another investment company, the Fund relies on that investmentcompany to achieve its investment objective. If the investment company fails toachieve its objective, the value of the Fund’s investment could decline, which couldadversely affect the Fund’s performance. By investing in another investmentcompany, Fund shareholders indirectly bear the Fund’s proportionate share of thefees and expenses of the other investment company, in addition to the fees andexpenses that Fund shareholders directly bear in connection with the Fund’s ownoperations.
Because ETFs and certain closed-end funds are listed on national stock exchangesand are traded like stocks listed on an exchange, their shares potentially may tradeat a discount or premium. Investments in ETFs and certain closed-end funds arealso subject to brokerage and other trading costs, which could result in greaterexpenses to the Fund. In addition, because the value of ETF and certain closed-endfund shares depends on the demand in the market, the Adviser may not be able toliquidate the Fund’s holdings at the most optimal time, which could adversely affectFund performance.
Securities Lending Risk — Securities lending involves the risk that the Fund may losemoney because the borrower of the loaned securities fails to return the securities ina timely manner or at all. The Fund could also lose money in the event of a declinein the value of the collateral provided for loaned securities or a decline in the valueof any investments made with cash collateral. These events could also triggeradverse tax consequences for the Fund.
Short Sales Risk — A short sale involves the sale of a security that the Fund does notown in the expectation of purchasing the same security (or a security exchangeabletherefore) at a later date at a lower price. Short sales expose the Fund to the riskthat it will be required to buy the security sold short (also known as “covering” theshort position) at a time when the security has appreciated in value, thus resultingin a loss to the Fund. Investment in short sales may also cause the Fund to incurexpenses related to borrowing securities. Reinvesting proceeds received from shortselling may create leverage which can amplify the effects of market volatility on theFund and, therefore, the Fund’s share price. Theoretically, uncovered short saleshave the potential to expose the Fund to unlimited losses.
Small- and Mid-Capitalization Company Risk — Small- and mid-capitalizationcompanies may be more vulnerable to adverse business or economic events thanlarger, more established companies. In particular, investments in these small- andmid-sized companies may pose additional risks, including liquidity risk, because
69
THE ADVISORS’ INNER CIRCLE FUND III PINEBRIDGE DYNAMICASSET ALLOCATION FUNDAPRIL 30, 2018
these companies tend to have limited product lines, markets and financialresources, and may depend upon a relatively small management group. Therefore,small- and mid-cap stocks may be more volatile than those of larger companies.These securities may be traded over-the-counter or listed on an exchange.
Unregistered Funds Risk — Investments in unregistered funds are subject toadditional risks beyond those associated with investments in registered investmentcompanies, because investments in unregistered funds do not have the benefit ofthe protections afforded by the 1940 Act to investors in registered investmentcompanies. In addition, investments in unregistered funds are often illiquid anddifficult to value, their marketability may be restricted and the realization ofinvestments from them may take considerable time and/or be costly, in particularbecause they may have restrictions that allow redemptions only at specificinfrequent dates with considerable notice periods and apply lock-ups and/orredemption fees.
U.S. Government Securities Risk — The Fund’s investment in U.S. governmentobligations may include securities issued or guaranteed as to principal and interestby the U.S. government, or its agencies or instrumentalities. Payment of principaland interest on U.S. government obligations may be backed by the full faith andcredit of the United States or may be backed solely by the issuing or guaranteeingagency or instrumentality itself. There can be no assurance that the U.S.government would provide financial support to its agencies or instrumentalities(including government-sponsored enterprises) where it is not obligated to do so. Inaddition, U.S. government securities are not guaranteed against price movementsdue to changing interest rates.
11. Other:
At April 30, 2018, the percentage of total shares outstanding held by shareholdersfor the Fund, which are comprised of individual shareholders and omnibus accountsthat are held on behalf of various individual shareholders was as follows:
No. ofShareholders
%Ownership
PineBridge Dynamic Asset Allocation Fund
Institutional Shares . . . . . . . . . . . . . . . . . . . . . . . . . . . . . . . . . . 5 72%Investor Servicing Shares . . . . . . . . . . . . . . . . . . . . . . . . . . . . . 1 96%
In the normal course of business, the Fund enters into contracts that provide generalindemnifications. The Fund’s maximum exposure under these arrangements isdependent on future claims that may be made against the Fund and, therefore,cannot be established; however, based on experience, the risk of loss from suchclaim is considered remote.
70

THE ADVISORS’ INNER CIRCLE FUND III PINEBRIDGE DYNAMICASSET ALLOCATION FUNDAPRIL 30, 2018
12. Change in Independent Registered Public Accounting Firm:
The Fund has selected Ernst & Young LLP (“EY”) to serve as the Fund’s independentregistered public accounting firm for the Fund’s fiscal year ended October 31, 2018.The decision to select EY was recommended by the Fund’s Audit Committee andwas approved by the Fund’s Board of Trustees on March 29, 2018. During the fiscalyears ended October 31, 2016 and October 31, 2017, neither the Fund, nor anyone onits behalf, consulted with EY on items which: (i) concerned the application ofaccounting principles to a specified transaction, either completed or proposed, orthe type of audit opinion that might be rendered on the Fund’s financial statements;or (ii) concerned the subject of a disagreement (as defined in paragraph (a)(1)(iv) ofItem 304 of Regulation S-K) or reportable events (as described in paragraph(a)(1)(iv) of said Item 304). The selection of EY does not reflect any disagreementswith or dissatisfaction by the Fund or the Fund’s Board of Trustees with theperformance of the Fund’s prior independent registered public accounting firm,PricewaterhouseCoopers LLP (“PwC”), for the fiscal years ended October 31, 2016and October 31, 2017. On March 29, 2018, PwC resigned as the IndependentRegistered Public Accounting Firm for the Fund. PwC’s report on the Fund’sfinancial statements for fiscal years ended October 31, 2016 and October 31, 2017contained no adverse opinion or disclaimer of opinion, nor were they qualified ormodified as to uncertainty, audit scope, or accounting principles. During the Fund’sfiscal years ended October 31, 2016 and October 31, 2017 and the subsequentinterim period through March 29, 2018 (i) there were no disagreements with PwC onany matter of accounting principles or practices, financial statement disclosure, orauditing scope or procedure, which disagreements, if not resolved to thesatisfaction of PwC, would have caused them to make reference to the subjectmatter of the disagreements in connection with their reports on the Funds’ financialstatements for such years; and (ii) there were no “reportable events” of the kinddescribed in Item 304(a)(1)(v) of Regulation S-K.
The Fund has requested that PwC furnish it with a letter addressed to the Securitiesand Exchange Commission stating whether or not it agrees with the abovestatements. A copy of such letter is filed as an Exhibit herein.
13. Subsequent Events:
The Fund has evaluated the need for additional disclosures and/or adjustmentsresulting from subsequent events through the date the financial statements wereissued. Based on this evaluation, no additional disclosures and/or adjustments wererequired to the financial statements as of April 30, 2018.
71
THE ADVISORS’ INNER CIRCLE FUND III PINEBRIDGE DYNAMICASSET ALLOCATION FUNDAPRIL 30, 2018
DISCLOSURE OF FUND EXPENSES (Unaudited)
All mutual funds have operating expenses. As a shareholder of a mutual fund, yourinvestment is affected by these ongoing costs, which include (among others) costsfor Fund management, administrative services, and shareholder reports like thisone. It is important for you to understand the impact of these costs on yourinvestment returns.
Operating expenses such as these are deducted from the mutual fund’s grossincome and directly reduce your final investment return. These expenses areexpressed as a percentage of the mutual fund’s average net assets; this percentageis known as the mutual fund’s expense ratio.
The following examples use the expense ratio and are intended to help youunderstand the ongoing costs (in dollars) of investing in your Fund and to comparethese costs with those of other mutual funds. The examples are based on aninvestment of $1,000 made at the beginning of the period shown and held for theentire period from November 1, 2017 to April 30, 2018.
The table on the next page illustrates your Fund’s costs in two ways:
Š Actual Fund Return. This section helps you to estimate the actual expenses afterfee waivers that your Fund incurred over the period. The “Expenses Paid DuringPeriod” column shows the actual dollar expense cost incurred by a $1,000investment in the Fund, and the “Ending Account Value” number is derived fromdeducting that expense cost from the Fund’s gross investment return.
You can use this information, together with the actual amount you invested in theFund, to estimate the expenses you paid over that period. Simply divide your endingstarting account value by $1,000 to arrive at a ratio (for example, an $8,600 accountvalue divided by $1,000 = 8.6), then multiply that ratio by the number shown for yourFund under “Expenses Paid During Period.”
Š Hypothetical 5% Return. This section helps you compare your Fund’s costs withthose of other mutual funds. It assumes that the Fund had an annual 5% returnbefore expenses during the year, but that the expense ratio (Column 3) for theperiod is unchanged. This example is useful in making comparisons because theSecurities and Exchange Commission requires all mutual funds to make this 5%calculation. You can assess your Fund’s comparative cost by comparing thehypothetical result for your Fund in the “Expense Paid During Period” column withthose that appear in the same charts in the shareholder reports for other mutualfunds.
72

THE ADVISORS’ INNER CIRCLE FUND III PINEBRIDGE DYNAMICASSET ALLOCATION FUNDAPRIL 30, 2018
DISCLOSURE OF FUND EXPENSES (Unaudited) — concluded
Note: Because the return is set at 5% for comparison purposes — NOT your Fund’sactual return — the account values shown may not apply to your specificinvestment.
Beginning AccountValue 11/01/17
Ending AccountValue 4/30/18
AnnualizedExpense Ratios
Expenses PaidDuring Period*
PineBridge Dynamic Asset Allocation Fund — Institutional
Actual Portfolio Return $1,000.00 $1,027.00 0.59% $2.97Hypothetical 5% Return 1,000.00 1,021.87 0.59 2.96PineBridge Dynamic Asset Allocation Fund — Investor Servicing
Actual Portfolio Return $1,000.00 $1,026.60 0.80% 4.02Hypothetical 5% Return 1,000.00 1,020.83 0.80 4.01
* Expenses are equal to the Funds’ annualized expense ratio multiplied by the average accountvalue over the period, multiplied by 181/365 (to reflect the one-half year period shown.)
73
PineBridge Dynamic Asset Allocation Fund
P.O. Box 588Portland, ME 04112
1- 877-225-4164
Investment Adviser:
PineBridge Investments LLC399 Park Avenue, 4th Floor
New York, NY 10022
Administrator:
SEI Investments Global Funds ServicesOne Freedom Valley Drive
Oaks, PA 19456
Distributor:
SEI Investments Distribution Co.One Freedom Valley Drive
Oaks, PA 19456
Legal Counsel:
Morgan, Lewis & Bockius LLP1701 Market Street
Philadelphia, PA 19103
This information must be preceded or accompanied by a current prospectus for theFund described.
PBI-SA-001-0300