pinelands biodiversity study - the official web site for ... · pinelands biodiversity study daniel...
TRANSCRIPT
Pinelands Biodiversity Study
Daniel Hernandez, Ronald Hutchinson, Ekaterina Sedia
School of Natural Sciences and Mathematics
The Richard Stockton College of New Jersey
Pomona, New Jersey
Submitted to:
New Jersey Department of Environmental Protection
Division of Science, Research and Technology
July 2008
2
Introduction
Although Pinelands habitats occur throughout the northeastern United States, the largest
and most uniform area of such habitat is the New Jersey Pinelands (Forman 1998). The New
Jersey Pinelands Area is 1,449 square miles, approximately 19% of the total area of New Jersey
(New Jersey Pinelands Commission 2008). Within the New Jersey Pinelands, there occurs 299
species of birds, 28 of which are listed as State-Threatened or State-Endangered, and 850 species
of plants (New Jersey Pinelands Commission 2008).
The New Jersey Pinelands is a unique pine-and oak-dominated ecosystem, situated on
very sandy and acidic soils. Frequent burning, along with poor soils, acidity, and drought
susceptibility shape this ecosystem. Despite the relatively low diversity, the Pinelands have the
unmistakable character of a boreal, pine-dominated system: the pine and oak canopy is very
open, allowing enough light to support the lush shrub layer, consisting of many ericaceous shrubs
(Vaccinium corymbosum, V. pallidum, Gaylussacia baccata, etc.) and Hudsonia ericoides. Open
patches are often colonized by sedges and grasses; some areas are dominated by mosses
(Polytrichum juniperum) and lichens (several species of Cladonia) (Boerner1981; Ehrenfeld et al.
1995; Sedia and Ehrenfeld 2003).
The distribution of vegetation and the presence of large unbroken stretches of the forest
create a habitat for many bird species, such as the ubiquitous Carolina Chickadee (Parus
carolinensis) and the rare and endangered Loggerhead Shrike (Lanius ludovicianus). The native
plants are well-adapted to the nutrient-poor condition and high acidity. Human disturbance and
deforestation, along with sand mining as well as natural disturbance (fire) are hypothesized to
affect the diversity of the native plants and animal species, along with promoting the invasion by
non-native species.
Past land use and natural disturbance events have shaped the Pinelands and has lead to its
unique flora and fauna. One of the most pressing ecological questions currently facing this region
is what effect existing landuse practices are having on biodiversity and rare species.
Development, forestry, and prescribed burning are among the most common landuse activities
carried out in the Pinelands today. While it is clear that development has a negative impact on
most natural communities (Saunders et al. 1991, Lovejoy 1997), forestry and prescribed burning

3
can often be beneficial plant and animal communities (Whelan 1995, Summerville et al. 2004),
especially in disturbance-driven ecosystems. Some studies have found that stands managed by
selective cutting or prescribed burning have a higher biodiversity compared to other clear cut or
unmanaged stands (Nummelin and Hanski 1989, Intachat et al. 1997, Summerville and Crist
2002). In a recent study, Thomas (2002) found that geometrid moth communities exhibited their
lowest abundance, but highest species richness in forest stands with moderate harvest levels
(equivalent to 30% bole removal). Unlogged and clear-cut stands had a significantly lower number
of species. These findings are consistent with the intermediate disturbance hypothesis proposed
by Connell (1978), which suggests that species diversity will be highest at intermediate levels of
disturbance.
Forest management techniques, including those described above, can have dramatic,
though often idiosyncratic, effects on avian biodiversity and habitat use (Dickson et al. 1983;
Nappi et al. 2003; Haskell et al. 2006; Legrand et al. 2007). For example, snag retention in some
clear-cut areas significantly increases species richness, bird abundance, bird species diversity and
evenness (Dickson et al. 1983; Nappi et al. 2003). Another study, however, suggested that over-
creation of shelterwoods can decrease species diversity at the landscape scale by selecting against
mature forest and clear-cut specialists (King and DeGraaf 1999). Other management techniques,
such as creation of tree plantations for bird habitat, have shown to, perhaps unexpectedly, lower
biodiversity when compared to exurban areas (Haskell et al. 2006). Post-management factors
such as tree-stand age, for instance, may also contribute to changes in avian biodiversity by
favoring late-successional species in older stands over early-successional species and vice-versa
(Legrand et al. 2007).
The New Jersey Pinelands, by virtue of being located along a major flyway, the Atlantic
Flyway, can have very high seasonal avian biodiversity during the Spring and Fall migratory
periods. Additionally, nearly half of the bird species that occur in North America can be found in
New Jersey (approximately 450 of 914) (Leck 1984). Despite the relatively high migratory
biodiversity, the biodiversity of the Pinelands is lower in the breeding season and lowest during
the winter (Brush 1989).
Two state-endangered/threatened birds occur in the New Jersey Pinelands, the Redheaded
4
Woodpecker (Melanerpes erythrocephalus) and the Barred Owl (Strix varia), although they are
both relatively uncommon (Walsh et al. 1999). Within New Jersey, the Barred Owl is found in
particularly low densities in the Pinelands despite a moderate overall increase statewide (Sutton
1988; Walsh et al. 1999). The Red-headed Woodpecker displays the opposite distribution
pattern: it is rare throughout the rest of the state, though more common within the Pinelands
(Wander and Brady 1980; Walsh et al. 1999).
We undertook this study, therefore, to assess the effects of different forest management
practices on the plant and avian biodiversity in the New Jersey Pinelands. Many plant and
animal communities in the Pinelands are globally rare. One consequence of this rarity is that little
research has been conducted to document how these communities respond to forestry activities,
and yet forestry activities are commonly carried out in this region. The primary objective of this
study was to assess the diversity of birds and plants (vascular) in stands with and without
historic forestry activities.
5
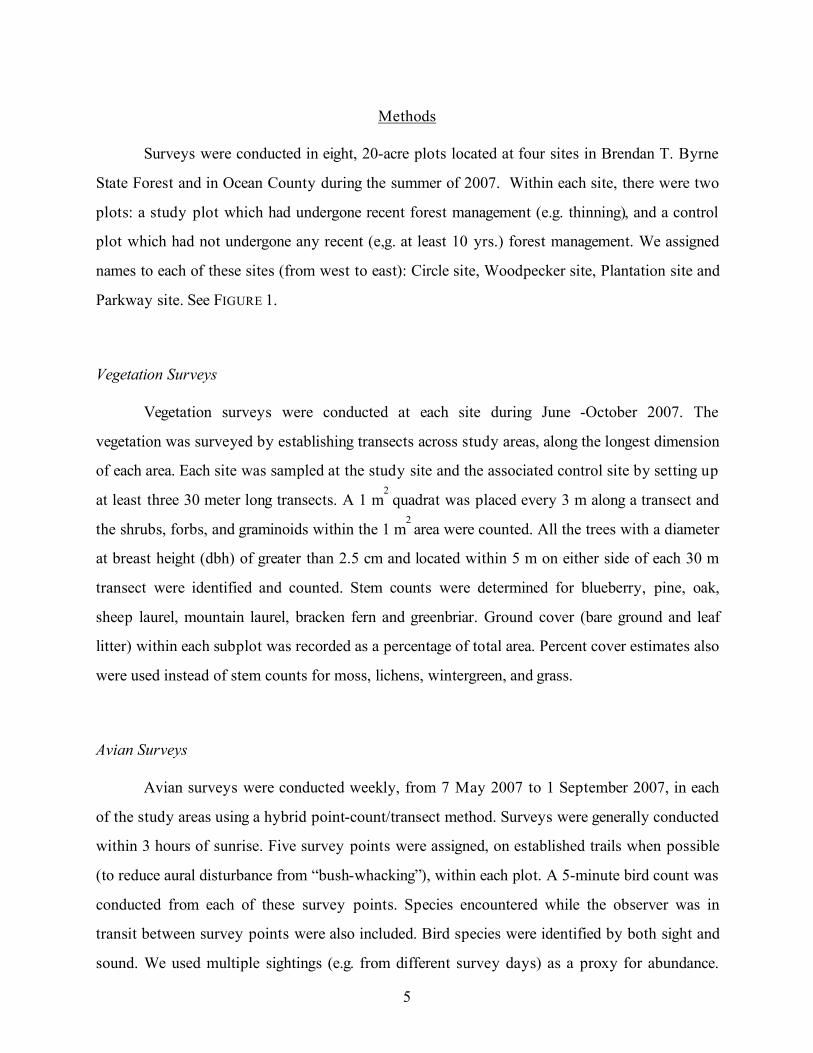
Methods
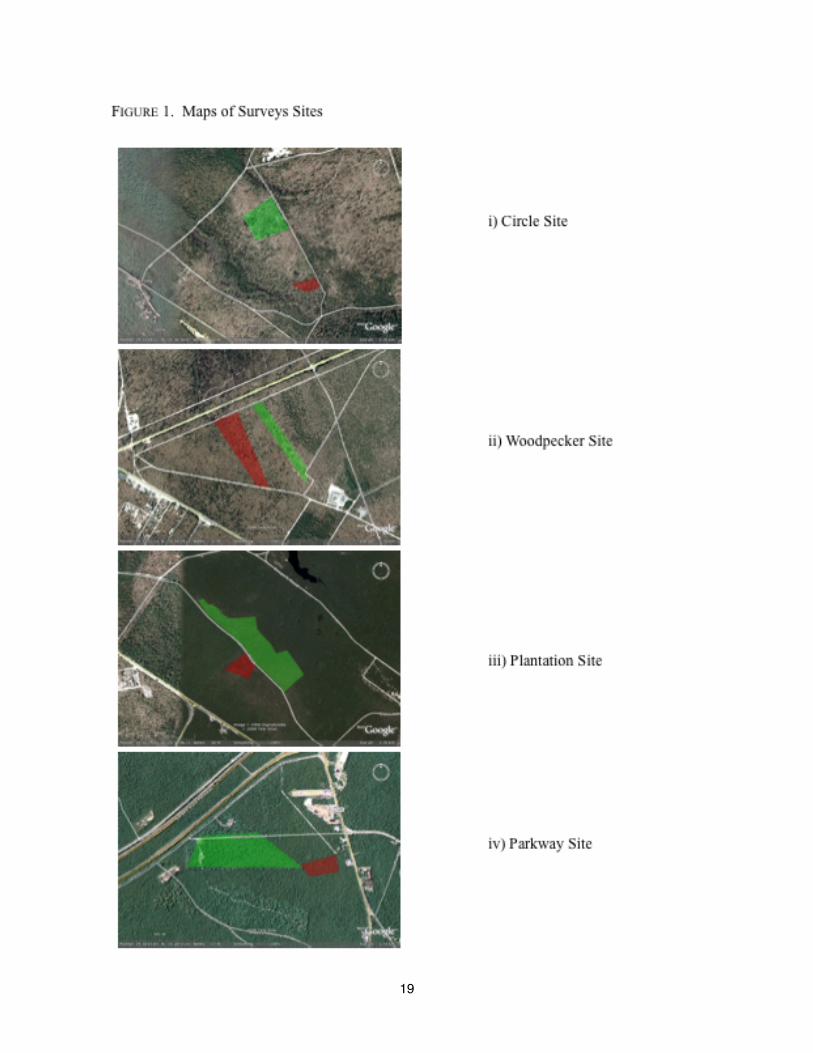
Surveys were conducted in eight, 20-acre plots located at four sites in Brendan T. Byrne
State Forest and in Ocean County during the summer of 2007. Within each site, there were two
plots: a study plot which had undergone recent forest management (e.g. thinning), and a control
plot which had not undergone any recent (e,g. at least 10 yrs.) forest management. We assigned
names to each of these sites (from west to east): Circle site, Woodpecker site, Plantation site and
Parkway site. See FIGURE 1.
Vegetation Surveys
Vegetation surveys were conducted at each site during June -October 2007. The
vegetation was surveyed by establishing transects across study areas, along the longest dimension
of each area. Each site was sampled at the study site and the associated control site by setting up
at least three 30 meter long transects. A 1 m2
quadrat was placed every 3 m along a transect and
the shrubs, forbs, and graminoids within the 1 m2 area were counted. All the trees with a diameter
at breast height (dbh) of greater than 2.5 cm and located within 5 m on either side of each 30 m
transect were identified and counted. Stem counts were determined for blueberry, pine, oak,
sheep laurel, mountain laurel, bracken fern and greenbriar. Ground cover (bare ground and leaf
litter) within each subplot was recorded as a percentage of total area. Percent cover estimates also
were used instead of stem counts for moss, lichens, wintergreen, and grass.
Avian Surveys
Avian surveys were conducted weekly, from 7 May 2007 to 1 September 2007, in each
of the study areas using a hybrid point-count/transect method. Surveys were generally conducted
within 3 hours of sunrise. Five survey points were assigned, on established trails when possible
(to reduce aural disturbance from “bush-whacking”), within each plot. A 5-minute bird count was
conducted from each of these survey points. Species encountered while the observer was in
transit between survey points were also included. Bird species were identified by both sight and
sound. We used multiple sightings (e.g. from different survey days) as a proxy for abundance.
6
Additionally, we recorded bird vocalizations on several occasions.
In addition to the general surveys, we conducted specific surveys for the Red-headed
Woodpecker (Melanerpes erythrocephalus) and Barred Owl (Strix varia), both of which are listed
as threatened in New Jersey. These surveys used standard play-callback procedures, which
entails playing prerecorded vocalizations of each species and then monitoring the area for return
vocalizations from the target species. Play-callbacks for Red-headed Woodpeckers was done in
the mornings (within 3 hours of sunrise) and in the evenings (dusk) for barred owls. We also
specifically recorded vocalizations of red-headed woodpeckers for analysis of habitat use.
Data Analysis
Bird Surveys
Survey data for birds were pooled into “habitat complexes,” consisting of data from the
study and control plots at each of the sites. This was necessary because birds were moving freely
and actively between plots during the surveys. We calculated several standard measures of
biodiversity for birds at each of the sites. These measures include: alpha-, beta-, and gamma-
diversity, relative abundance, Shannon Indices and evenness.
Alpha-diversity is synonymous with species richness, or the total number of species
which occur within a given area (each study site). Gamma-diversity is also synonymous with
species richness, though at a larger spatial scale (the entire region encompassing all study sites).
Beta-diversity is a measure of change in species richness across different sites thus allowing
direct comparison between sites (Whittaker 1960).
Relative abundance is simply a measure of species abundance that corrects for the
contribution each species makes relative to the total abundance for all species. The Shannon
Index,
, is defined by the formula:
7
Where S is the species richness (or alpha-diversity) and pi is the relative abundance of each
species (Shannon 1948). Finally, evenness, E, a measure of abundance/species equity is defined
by the formula:
Where max = ln S, or the theoretical maximum species diversity, which occurs when all
species are present in equal numbers.
Plant Surveys
The data obtained from the vegetation surveys was separated into managed-study and
control groups for each of the four study sites. One-way ANOVA’s, comparing the managed
sites to the respective control site, were performed using SAS 9.1. Data were not normally
distributed by symmetrical, so no transformation was necessary. Bar graphs were generated
comparing Blueberry, grass, bare ground, litter, moss, pine, and oak. In the circle site and
plantation site, data for lichen and high bush blueberry is also presented. F-values and P-values
were determined for each plant type in each of the four sites. Additionally, we performed a
Principal Component Analysis for the plant data.
8
Results
Bird Surveys
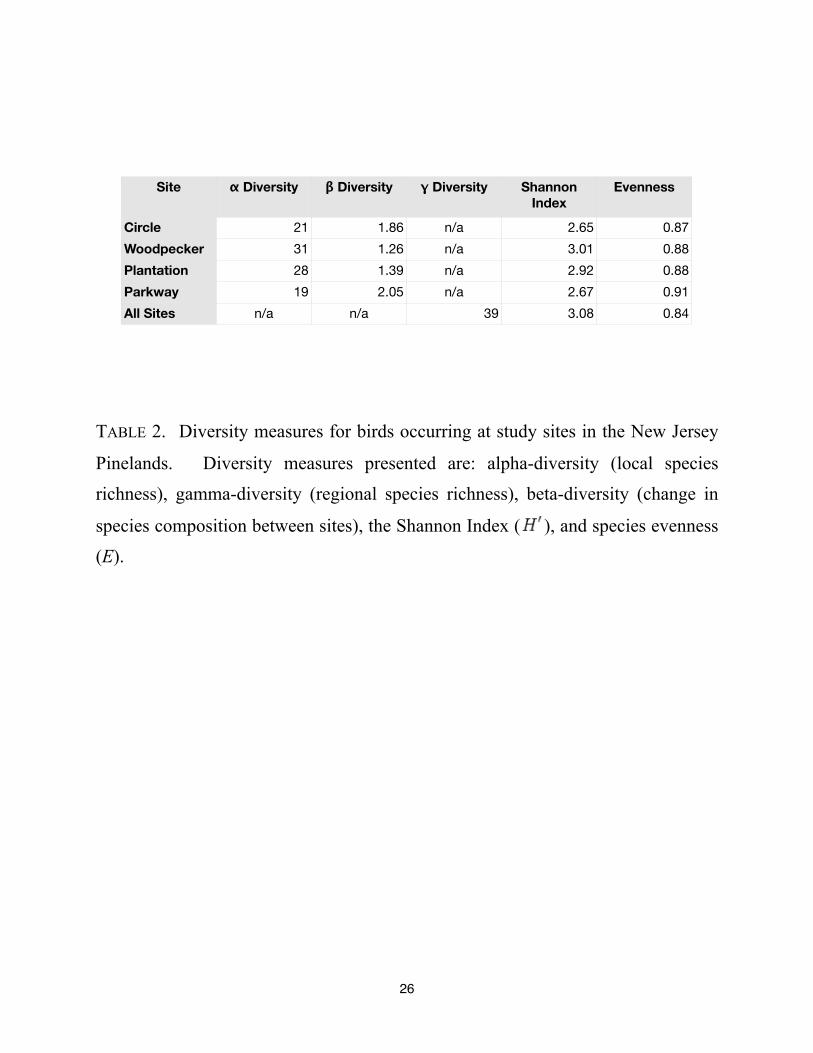
We found a total of 39 bird species across all study sites. The Shannon Index across all
sites was 3.08 with a theoretical maximum ( max) of 3.66. The Circle site and the Parkway site
had the lowest bird diversity (Shannon Indices of 2.65 and 2.67, respectively), while the
Woodpecker and the Plantation site had the highest (Shannon Indices of 3.01 and 2.92,
respectively). The mean species richness (alpha-diversity) across all sites was 25 species. The
site with the greatest species richness, 31 species, was the Woodpecker site. The site with the
lowest species richness, 19 species, was the Parkway site which had just 61% of the species
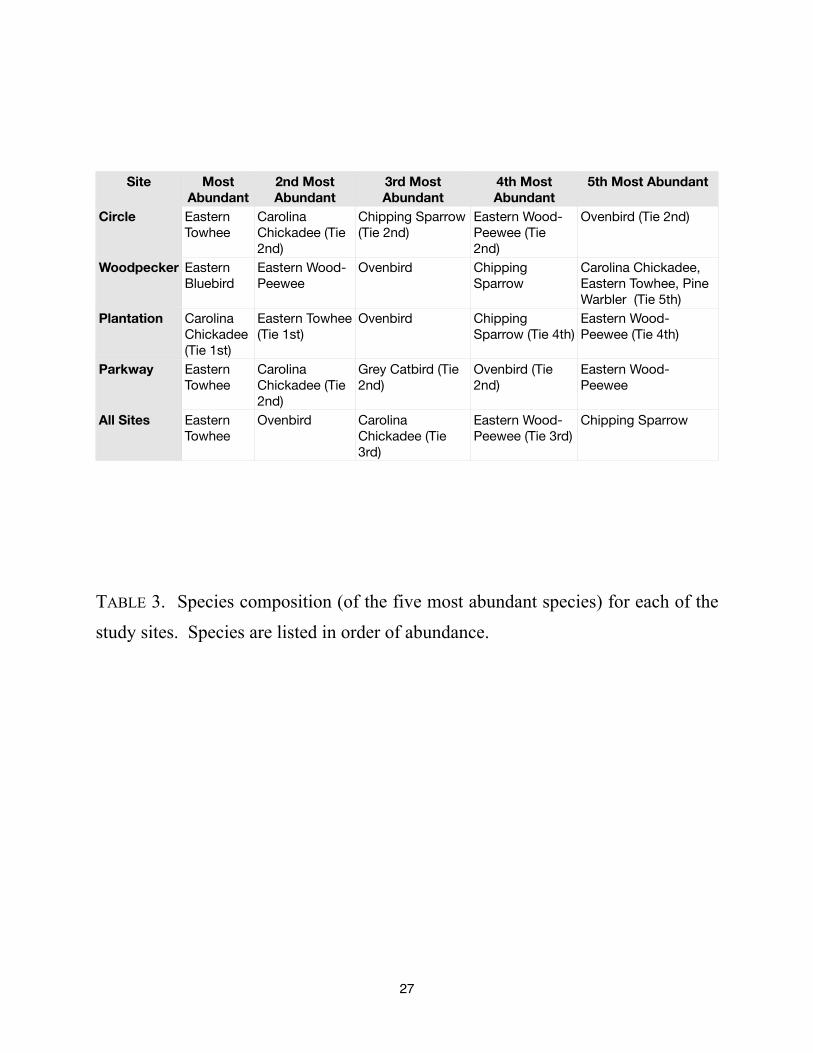
richness of the Woodpecker site. See TABLE 2. The most abundant bird at the Circle site was the
Eastern Towhee. The most abundant bird at the Woodpecker site was the Eastern Bluebird. The
most abundant bird at the Plantation site was the Carolina Chickadee. The most abundant bird at
the Parkway site was the Eastern Towhee. The most abundant birds across all sites were (in
order of relative abundance): Eastern Towhee, Ovenbird, Carolina Chickadee, (Tie 3rd), Eastern
Wood-Peewee (Tie 3rd), and Chipping Sparrow. See TABLE 3.
The play-callback surveys for Barred Owl and Red-headed Woodpecker had mixed
results. No Barred Owls were observed during the study at any site. Red-headed Woodpeckers
were observed only at the Woodpecker site. Analysis of vocalization recordings indicated a
breeding pair of red-headed woodpeckers using the Woodpecker site. See APPENDIX 2.
Plant Surveys
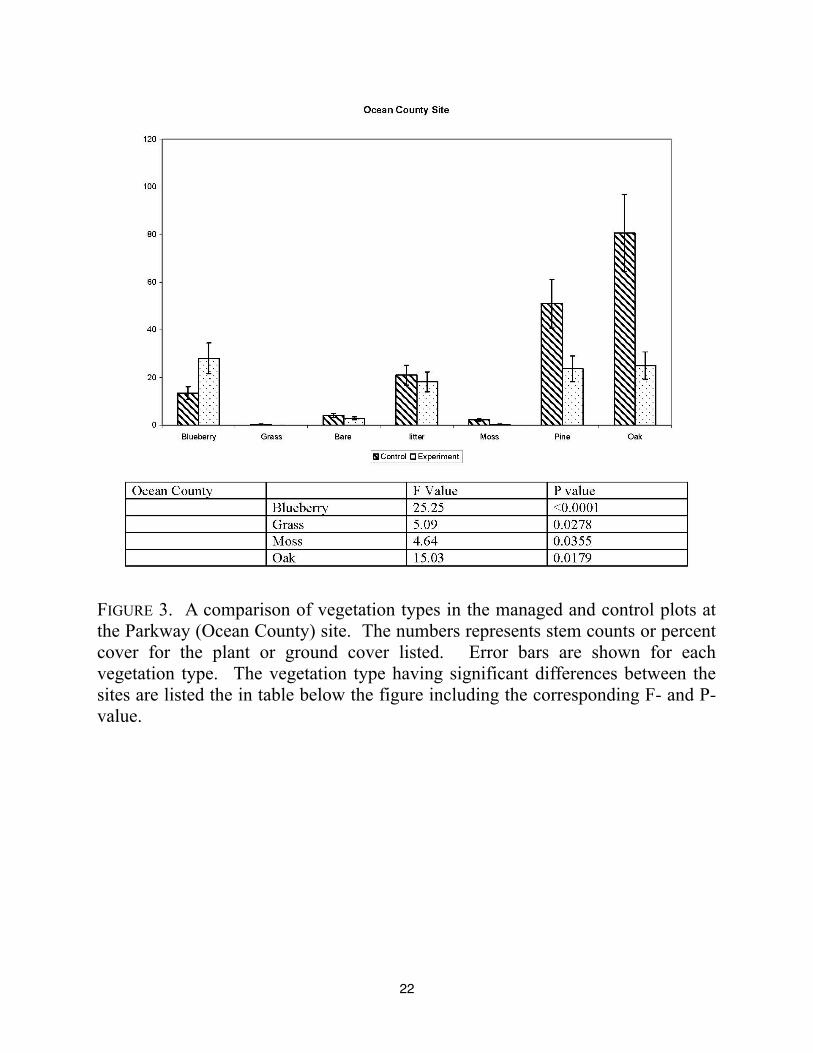
There were clearly differences between the control and managed sites (FIGURES 3 -6) at
each of the four locations. For the Parkway site, blueberry stem densities were higher in the
experimentally manipulated plot (FIGURE 3). The site was also characterized by having
significantly less grass, moss, and oak in the experimental site (FIGURE 3). There is also less pine
present in this site, as well as slightly less leaf litter and bare ground. This site is in the early
stages of regeneration, and it should be noted that this site contained a large number of small oak
and pine seedlings. This relatively open site would be expected to have higher blueberry
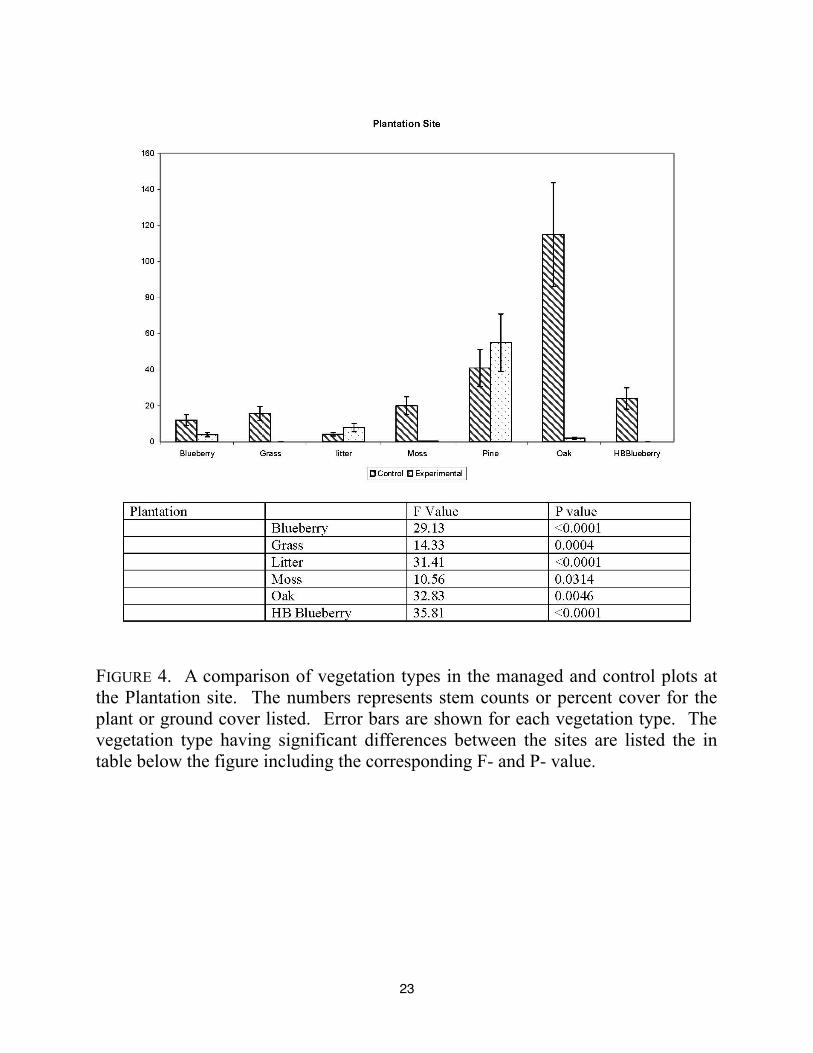
densities. The Plantation site (FIGURE 4) was characterized by having significant differences in
9
the blueberry, grass, litter, moss, oak, and high bush blueberry. The experimental site lacked even
small amounts of grass, moss, and high bush blueberry. The number of pine trees and amount of
leaf litter was higher in the experimental plot. These differences might be attributed to the low
lying aspect, and therefore more moisture present, in the control site. Moss promotes
establishment of vascular plants (Sedia and Ehrenfeld 2003), so its lack could contribute to lack
of the understory in the plantation site, along with closed canopy.
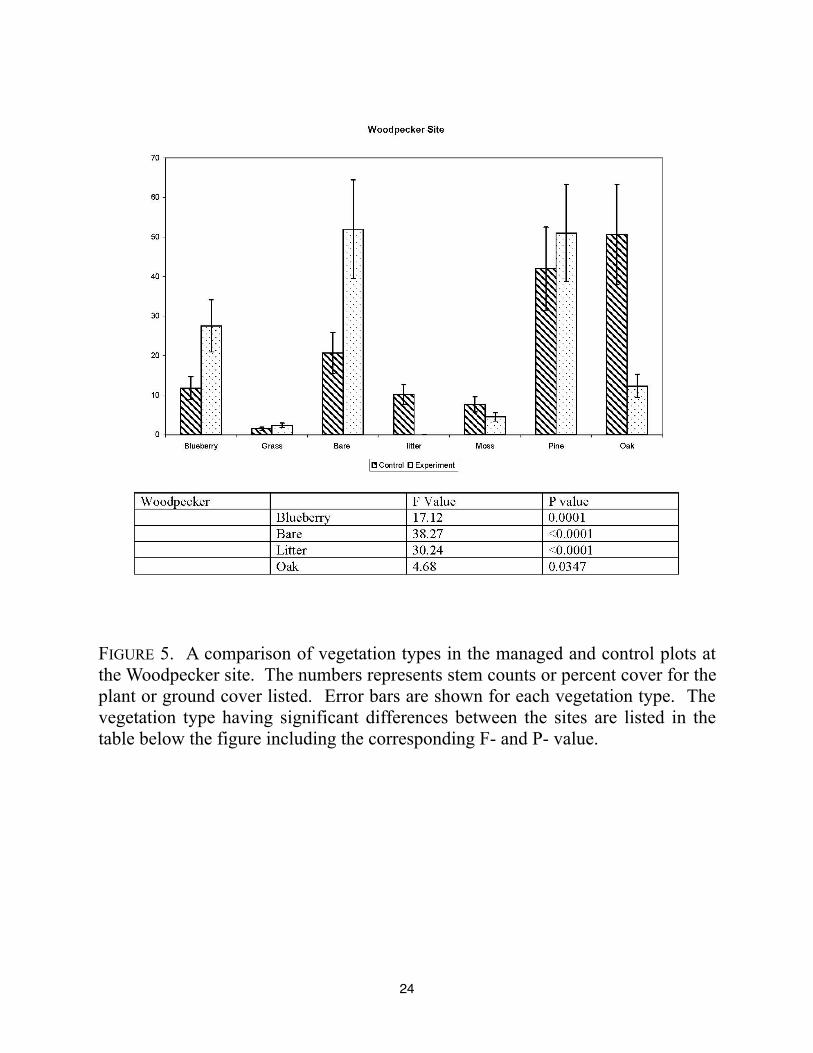
The Woodpecker Woods site showed significant differences in blueberry, bare ground,
leaf litter, and oak. The management in this plot reduced the amount of leaf litter and nearly
doubled the amount of bare ground present. Tree removal and girdling of trees has occurred
recently in this plot and probably contributed to the increased bare ground. It is also important to
note that management plan has resulted in higher numbers of dead snags in the pine and oak
counts for the experimental site. The control site contained more scrub oaks than the managed
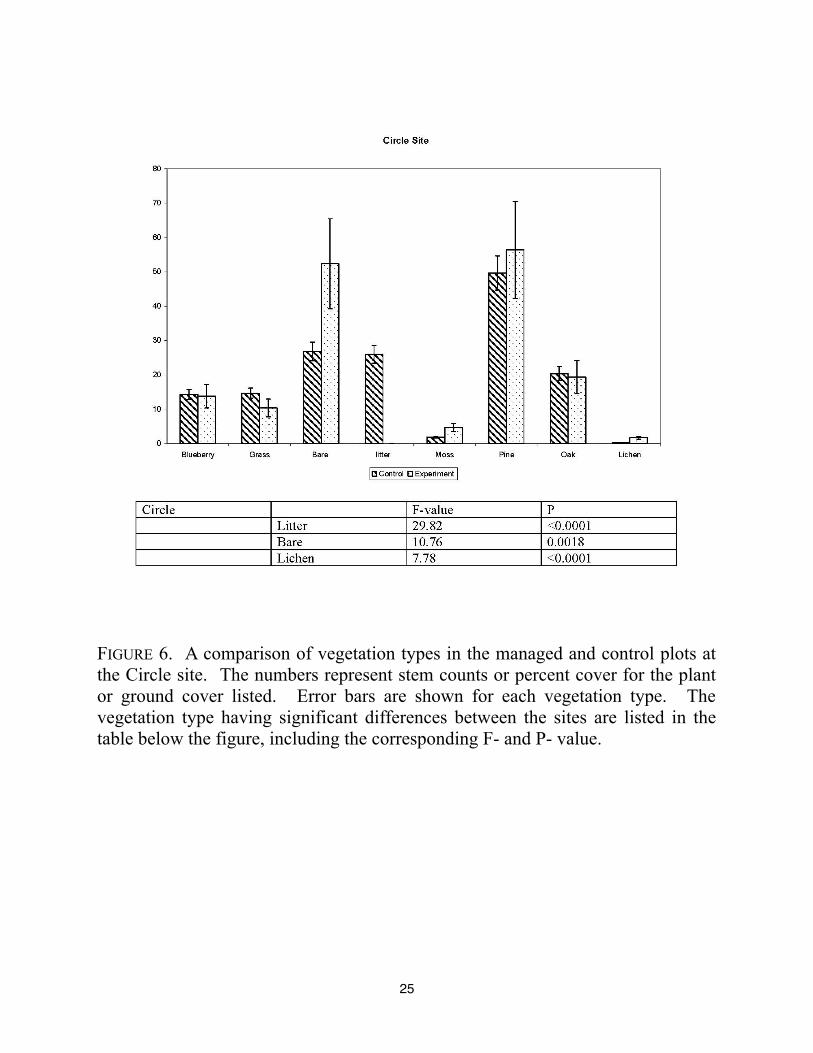
site. The Circle site also had greater amounts of bare ground and decreased leaf litter in the
experimental plots. In addition, there was a significant increase in the percent cover of lichen in
the experimental site. These differences could be explained by recent logging activity at the
experimental site. It is important to note that there is little evidence of dead snags at Circle site, in
contrast to the Woodpecker woods site; yet, the patterns of vegetation cover are similar.
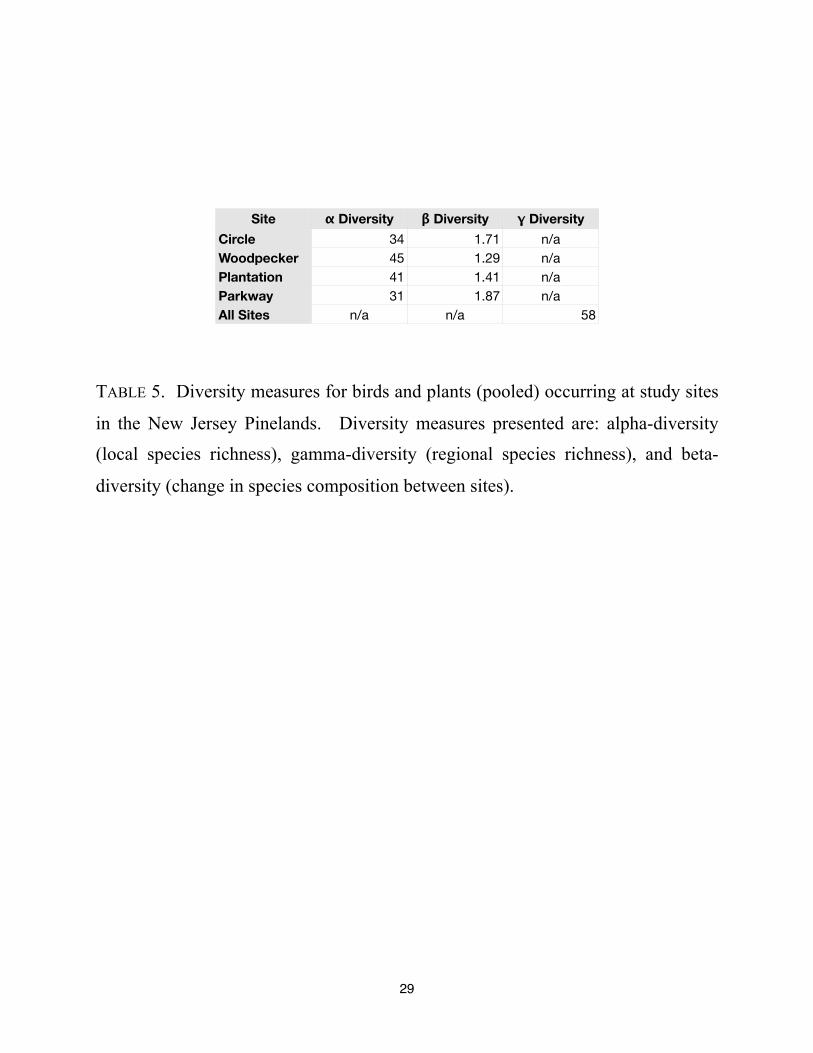
We also pooled the results of the plant and bird surveys to determine the overall (both
plant and bird diversity) of each site. Our results indicate that the Woodpecker site was the most
diverse, with an alpha-diversity of 45, followed closely by the Plantation site, with an alpha-
diversity of 41. The Circle and Parkway sites had noticeably lower diversity, with alpha-
diversity values of 34 and 31, respectively. See TABLE 5. Lists of all plants and birds seen across
all sites is presented in APPENDIX 1.
10
Discussion
In general, the amount of bare ground increased in the experimental plots, in particular the
Woodpecker and Circle site. These sites both have had recent management including selective
harvest and burn. Both of these would serve to open the canopy allowing more light penetration.
It would be interesting to see the soil bacterial community response to these changes, as these
communities are known to change in response to fire and timber harvest (Smith et al. 2008). Pine
counts were similar among all four sites. It is interesting to recall that there were no significant
differences between pine abundance between control and experimental treatments in any of the
sites (see results section). This seems to indicate that management strategies are not creating areas
where pine are unable to survive, an issue that could have the potential to create a shift in the
ecosystem (Lawrence et al, 2007). Oak counts were highest in the control areas of the Plantation
and Parkway sites. Both of these sites have not had any recent history of disturbance.
The Principal Component Analysis of plant data achieved a good separation of the sites
(See FIGURE 2). Principal component 1 (PC1) was most important in separating Circle, Parkway,
and Woodpecker sites, while Principal component 2 (PC 2) separated Plantation site from the
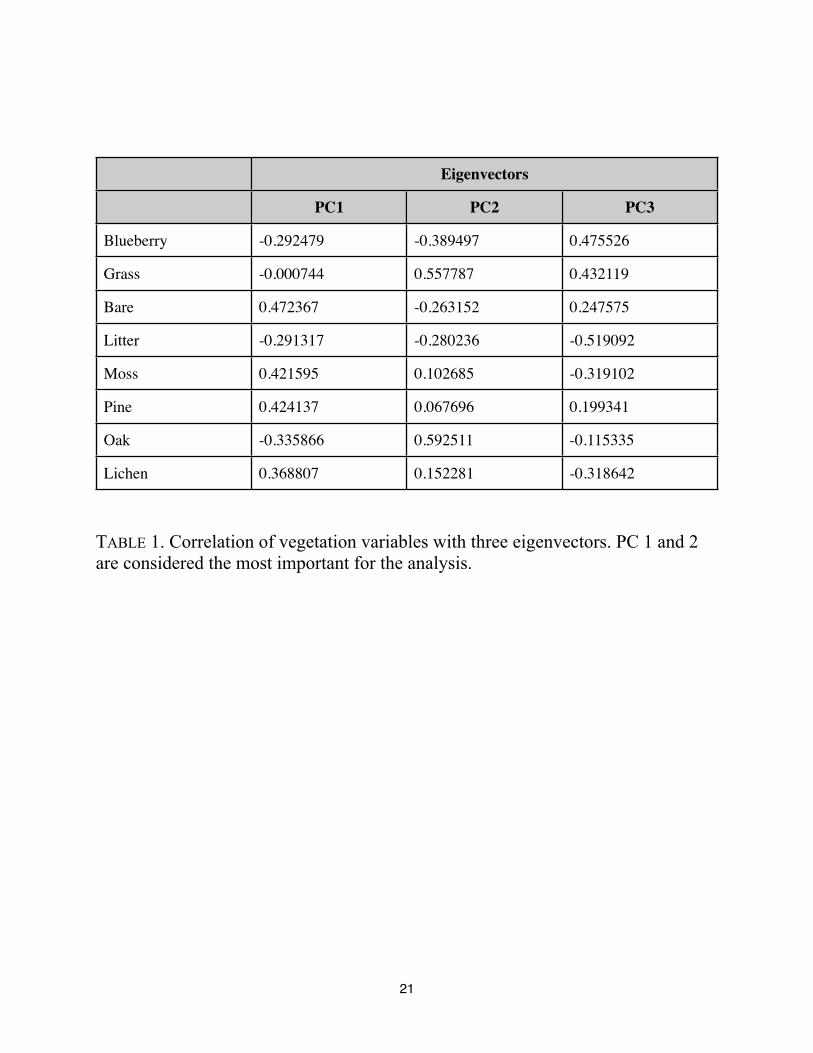
rest. Looking at the loading of the principal components (TABLE 1), it appears that moss, pine
and bare ground are positively and highly correlated with the PC 1, while oak is negatively
correlated with it. PC 2 shows high positive correlation with grass and oak, and negative
correlation with blueberry. This pattern indicates that the main differences we see between the
managed sites also reflect the same variables as seen for within the sites ANOVAs --that is, the
same vegetation components that most consistently differed between managed areas and controls
also differed between the managed sites. This would indicate that management strategies affected
primarily scrub oak, blueberry, litter accumulation and lichen-moss mats.
Comparisons to other studies: forest matrices (control sites) are similar to the sites
described in Ehrenfeld et al. (1995, 1997) – many openings, spatial variation between dense
stands of pine and scrub oak versus open areas dominated by ericoid shrubs. The revegetation
after a disturbance occurs fairly quickly (Sedia and Ehrenfeld 2003, 2005, 2006), unless there is a
specific management program in place.
We noticed that several of the sites looked fairly similar to the controls and the
11
undisturbed sites, with the exception of the Woodpecker site and the Plantation site – both
looked markedly different from the undisturbed area. Woodpecker site had a much more open
character due to the site's management for Red-headed Woodpecker habitat (most standing trees
were dead snags). Meanwhile, the Plantation site featured a high density of pine trees and created
a closed canopy character which excluded the subcanopy of scrub oaks and ericoid shrubs we
have observed in control sites.
For the purposes of comparison, site descriptions from Sedia and Ehrenfeld (2006) might
be useful: All the experiments were conducted in the New Jersey Pinelands, a region of fire-
maintained pitch pine (Pinus rigida Mills.)-dominated forests (Forman 1998). The soils
(Lakewood and Lakehurst series, Spodic and Aquodic Quartzipsamments, respectively) are
derived from the Cohansey Formation, a Miocene deposit of fine to coarse sands which produce
very sandy soils. Mor humus horizons develop, with accumulations of 1 -3 cm (Ehrenfeld et al.
1995, 1997), and A horizons are usually 1-3 cm thick. The E horizon soils are very nutrient-poor
(organic C <1%, Total Kjeldahl nitrogen (TKN) <0.1%, cation exchange capacity (CEC) <0.2
molc / kg soil) and acidic (pH 3.5-4.0). The open pine canopy has an understory of Vaccinium
pallidum Ait., Gaylussacia baccata (Wang) K. Koch., and other ericads. Areas that have been
subjected to hot wildfires have frequent open patches with little or no tree canopy, sparse
grasses (mostly Schizachyrium scoparium Nash. and Panicum virgatum Linn.), large patches of
lichens, mosses and mixtures of the two cryptogams, and areas of bare soil. The lichen mats are
composed of Cladonia uncialis (L.) F. H. Wigg., Cladonia subtenuis (Abbayes) Mattick,
Cladonia mitis Sandst. and Cladonia alpestris (L.) Nyl. (taxonomy following Esslinger 1997). All
lichens have green algae as phycobionts, and are not known to be nitrogen-fixing. Moss mats
were composed of Polytrichum juniperinum Hedw. Cyanobacteria are not prominent components
of these mats (Belnap 2007, pers. comm.) These openings are also characterized by the absence
of O horizons, and reduced or buried A horizons (Ehrenfeld et al. 1995).
Results from our bird diversity studies are similar to results obtained from previous
studies on avian diversity and distribution in the New Jersey Pinelands. Brady (1980) found that
breeding-bird species diversity in Pine-Oak habitats was 34 and 40 in Oak-Pine habitats. Our
species diversity (alpha-diversity) on a landscape-scale (e.g. the entire region containing all study
sites), 39, was very similar to the previously published value. It is important to note that the
12
time span between the surveys is approximately 30 years. During that time, many bird species
have experienced declining numbers due to factors such as: habitat destruction/degradation,
pollution and climate change, increased competition from invasives, etc. The New Jersey
Pinelands, however, is relatively insulated from such factors by strict regulations. In effect, the
Pinelands have been spared much of the habitat destruction that has been rampant elsewhere.
On a smaller scale (e.g. each site), we did observe differences in diversity between the
sites, with a range of alpha-diversity values between 19 and 31. We found it was necessary to
pool data between the managed and control areas within each site. This was due to several
unavoidable factors, 1) birds were flushed into adjacent habitats by observers, 2) many of the
observations were made by sound (e.g. bird vocalizations) that were difficult or impossible to
definitively assign to either control or managed areas, 3) we observed birds preferentially using
the edges created between the control and managed sites. The birds’ preferential use of edges was
consistent with previously published accounts; Yahner (1987) found that species richness was
higher in edges than interiors of even-aged stands.
Despite having to pool the bird data, we observed some interesting differences between
the sites. The Woodpecker site was, appropriately, the only site in which we observed
Redheaded woodpeckers (see APPENDIX 2). The Parkway site was the most depauperate site for
both plants (12 species) and birds (19 species). Beta-diversity values among the sites also
differed. The Woodpecker site had approximately 60% less species turnover than did the
Parkway site when both were compared to the overall regional diversity (e.g. Gamma diversity).
As described above, there were substantial differences in bird habitat between the sites (as
expressed by differences in plant community structure). These differences were primarily due to
differences in management practices among the sites. For instance, there were differences in stand
ages, size and composition of shelterwoods (for the purposes of bird studies, this term is
synonymous with other similar practices/terms - e.g., partial retention timer harvesting), as well
as in the structure of stands adjacent to the managed sites (thus the aforementioned designation of
these areas as “habitat complexes”). These differences can help explain the observed differences
in avian biodiversity.
Lance and Phinney (2001 ??), for example, found that partial retention harvesting in sub-
boreal conifer forests increased total bird diversity. Results from more detailed studies, however,
13
are not so clear cut. Donald et al. (1998 ??) found that in the mixed forests of western England
forest age was the most important variable in explaining avian diversity. Specifically, they found
that tree size and tree species composition were positively correlated with alpha-diversity and
overall abundance. DeGraaf et al. (1998 ??), however, found that stand size-class and forest
cover-type were less important than forest structure (e.g. total foliage volume of large and
midsize deciduous trees, density of mid-size trees, total woody stem density, total deciduous
understory volume and total volume of large conifers) in northern New England managed forests.
Another study done in the northern Rocky Mountains (Stuart-Smith et al. 2006) found that in
managed stands (! 7 years post-disturbance), changes in diversity between logged and burned
stands were mainly due to differences in abundance not community composition. Furthermore,
they suggest that management can influence the abundance of some species by manipulating the
type and density of residual trees. The upshot of all these previous studies is that the results of
forest management (with respect to birds) are highly idiosyncratic, with the possible exception of
shelterwoods creation, and/or selective logging which are important predictors of avian species
diversity (King and DeGraaf 1999; Heltzel and Leberg 2006). This is particularly valuable when
integrated into larger landscape-scale management programs.
Perhaps not surprisingly, the site with the most biological diversity (plants and birds)
was also the Woodpecker site. This site has been managed such that habitat complexity has been
retained (e.g. creation of open areas with snags). The next most biodiverse site was the Plantation
site. The study plot at the Plantation site was similar to that of the Circle site with the exception
of the large plantation adjacent to it. We hypothesize that the habitat type (e.g. a relatively
closed canopy in the plantation) and proximity (e.g. adjacent, across the road) of the surrounding
areas (the “habitat complexes”) were important factors contributing the increased biodiversity of
this site. Similarly, the least diverse site, the Parkway Site was adjacent to many suburban
structures (e.g. the Garden State Parkway, homes, other roads, etc.) and was highly fragmented.
We recommend that future studies focus on the landscape ecology of these habitat
complexes on a larger scale (e.g. > 100 acres). We also recommend additional studies of habitat
use of Red-headed Woodpeckers in the Woodpecker Site. Specifically, factors such as breeding
success, foraging behavior, and phenology should be studied in a more detailed study.
14
References
Belnap, J. 2007. Personal Communication. Dept. of Interior, Southwest Biological Sciences
Center, Moab, UT
Boerner, R. E. J. 1981. Forest structure dynamics following wildfire and prescribed burning in
the New Jersey Pine Barrens. Am. Midl. Nat. 105: 321-333.
Brady, S.A. 1980. An assessment of the birdlife of the Pinelands National Reserve/Pinelands
Area. Prepared for the New Jersey Pinelands Commission, New Lisbon, NJ.
Brush. T. 1989. Habitat use by birds wintering in the New Jersey Pine Barrens. New Jersey
Audubon Society Records of New Jersey Birds 14(4):67-71.
Cornell, J.H. 1978. Diversity in tropical rainforests and coral reefs. Science 199: 1302-1310.
DeGraaf, RM, Hestbeck JB, Yamasaki M. 1998. Associations between breeding bird abundance
and stand structure in the White Mountains, New Hampshire and Maine, USA. Forest
Ecology and Management. 103:217-233
Dickson, J. G., R. N. Conner and J. H. Williamson. 1983. Snag retention increases bird use of a
clear-cut. J. Wildl. Manage. 47: 799–804.
Donald, PF, Fuller RJ, Evans AD, Gough SJ. 1998. Effects of forest management and grazing on
breeding bird communities in plantations of broadleaved and coniferous trees in western
England. Biological Conservation. 85:183-197
Ehrenfeld JG, Zhu W, Parsons WFJ. 1995. Above-and below-ground characteristics of persistent
forest openings in the New Jersey Pinelands. Bull Torrey Bot Club 122: 298-305.
Ehrenfeld JG, Han XH, Parsons WFJ, Zhu W. 1997. On the nature of environmental gradients:
Temporal and Spatial variability of soils and vegetation in the New Jersey Pinelands. J
Ecol 85: 785-798.
Esslinger TL. 1997. A cumulative checklist for the lichen-forming, lichenicolous, and allied
fungi of the continental United States and Canada. North Dakota State University Press,
Fargo N.D.
Forman, R.T.T. 1998. Pine Barrens: ecosystems and landscapes. Rutgers University Press, New
Brunswick, New Jersey.
15
Haskell, D.G., Evans, J.P., Pelkey, N.W. 2006. Depauperate Avifauna in Plantations Compared
to Forests and Exurban Areas. PLoS ONE 1(1): e63 p.1-10
Heltzel, JM and Leberg, PL. 2006. Effects of Selective Logging on Breeding Bird Communities
in Bottomland Hardwood Forests in Louisiana. Journal of Wildlife Management. 70(5):
1416-1424
Intachat, J., Holloway, J.D., and Speight, M.R. 1997. The effects of different forest management
practices on geometrid moth populations and their diversity in peninsular Malaysia.
Journal of Tropical Forest Science 9: 411-430.
King, DI and DeGraaf RM. 1999. Bird species diversity and nesting success in mature, clearcut
and shelterwood forest in northern New Hampshire, USA. Forest Ecology and
Management. 129: 227-235
Lance, AN and Phinney M. 2001. Bird responses to partial retention timber harvesting in central
interior British Columbia. Forest Ecology and Management. 142:267-280
Lawrence, D., D’Odorico, P., Diekmann, L., DeLonge, M., Das, R., and Eaton, J. 2007.
Ecological feedbacks following deforestation create the potential for a catastrophic
ecosystem shift in tropical dry forest PNAS 104(52) p. 20696–20701.
Leck, C. F. 1984. The status and distribution of New Jersey’s birds. Rutgers Univ. Press, New
Brunswick, NJ.
Legrand, HG, Chamberlain MJ, Moser EB. 2007. Diversity and Abundance of Breeding Birds in
a Managed Loblolly Pine Forest in Louisiana. American Midland Naturalist. 157:329-344
Lovejoy, T.E. 1997. Biodiversity: what is it? Pages 7-14. – in Reaka-Kudla, M.L. Wilson D.E,
and Wilson, E.O. editors. Biodiversity II. Joseph Henry Press, Washington D.C.
Nappi A, Drapeau P, Giroux JF, Savard JPL. 2003. Snag use by foraging black-backed
woodpeckers (Picoides arcticus) in a recently burned eastern boreal forest. The Auk.
120(5):505-511
New Jersey Pinelands Commission. 2008. http://www.state.nj.us/pinelands
Website accessed on 30 April 2008.
Nummelin, M. and Hanski, I. 1989. Dung beetles of Kibale forest, Uganda: comparison between
16
virgin and managed forests. Journal of Tropical Ecology 5: 349-352.
Saunders, D.A, Hobbs, R.J and Margules, C.R. 1991. Biological consequences of ecosystem
fragmentation: a review. Conservation Biology 5: 18-32.
Sedia, E. G. and Ehrenfeld J. G. 2003. Lichens and mosses promote alternate stable communities
in the New Jersey Pinelands. Oikos 100: 447-458.
Sedia E.G. and Ehrenfeld J. G. 2005. Soil respiration and potential nitrogen mineralization in
lichen-, moss –and grass-dominated areas of the New Jersey Pinelands. Oecologia 144:
137-147.
Sedia, E.G. and Ehrenfeld J. G. 2006. Extracellular enzyme activities and decomposition rates in
lichen and moss mats of the New Jersey Pinelands. Biology and Fertility of Soils 43: 177-
189
Shannon, C.E. 1948. A mathematical theory of communication. Bell System Technical Journal
27: 379–423 and 623–656.
Smith, N.R., Kishchuk, B.E., and Mohn, W. W. 2008. Effects of Wildfire and Harvest
Disturbances on Forest Soil Bacterial Communities. APPLIED AND
ENVIRONMENTAL MICROBIOLOGY, 74(1) 216–224.
Stuart-Smith, AK, Hayes, JP, Schieck J. 2006. The influence of wildfire, logging and residual
tree density on bird communities in the northern Rocky Mountains. Forest Ecology and
Management. 231:1-17
Summerville, K.S. and Crist, T.O. 2002. Effects of timber harvest on forest lepioptera:
community, guild, and species responses. Ecological Applications 12: 820-835.
Summerville, K.S., Ritter, L.M., and Crist, T.O. 2004. Forest moth taxa as indicators of
lepidopteran richness and habitat disturbance: a preliminary assessment. Biological
Conservation 116: 9-18.
Sutton, C.C. 1988. Barred owl survey of south Jersey, 1987. New Jersey Audubon Society
Records of New Jersey Birds 14(1):2-5.
Thomas, A.W. 2002. Moth diversity in a northeastern North American, red spruce forest II. The
effect of silvicultural practices on geometrid diversity. Information Report M-X-213E,
Canadian Forest Service.
17
Walsh J., Elia V, Kane R, Halliwell T. 1999. Birds of New Jersey. New Jersey Audubon Society.
Bernardsville, NJ
Wander, W. and S.A. Brady. 1980. Summer tanager and red-headed woodpecker in the
Pinelands. New Jersey Audubon Society Records of New Jersey Birds 6(3):34-37.
Whelan, R.J. 1995. The Ecology of Fire. Cambridge University Press, New York, New York.
Whittaker, R.H. 1960. Vegetation of the Siskiyou Mountains, Oregon and California. Ecol.
Mono. 30:279-338.
Yahner RH. 1987. Use of even-aged stands by winter and spring songbird communities. Wilson
Bulletin. 99(2):218-232

18
Figures
19
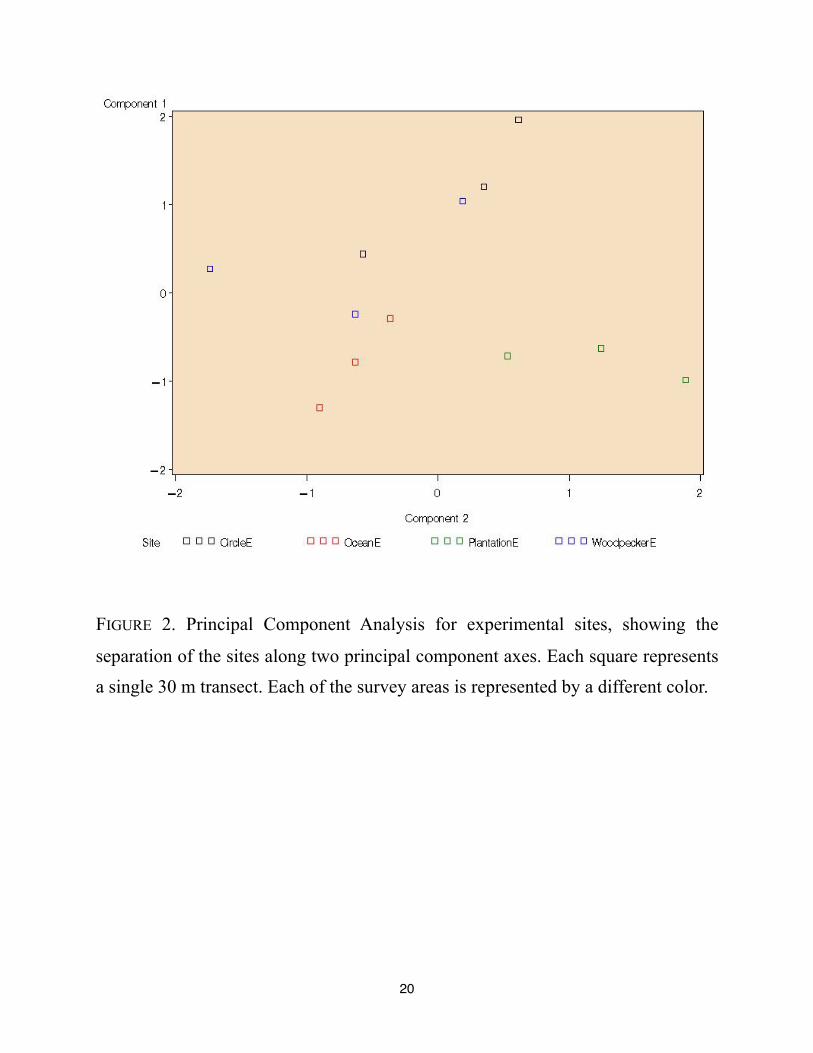
FIGURE 2. Principal Component Analysis for experimental sites, showing the
separation of the sites along two principal component axes. Each square represents
a single 30 m transect. Each of the survey areas is represented by a different color.
20
Eigenvectors
PC1 PC2 PC3
Blueberry -0.292479 -0.389497 0.475526
Grass -0.000744 0.557787 0.432119
Bare 0.472367 -0.263152 0.247575
Litter -0.291317 -0.280236 -0.519092
Moss 0.421595 0.102685 -0.319102
Pine 0.424137 0.067696 0.199341
Oak -0.335866 0.592511 -0.115335
Lichen 0.368807 0.152281 -0.318642
TABLE 1. Correlation of vegetation variables with three eigenvectors. PC 1 and 2
are considered the most important for the analysis.
21
22
FIGURE 3. A comparison of vegetation types in the managed and control plots at
the Parkway (Ocean County) site. The numbers represents stem counts or percent
cover for the plant or ground cover listed. Error bars are shown for each
vegetation type. The vegetation type having significant differences between the
sites are listed the in table below the figure including the corresponding F- and P-
value.
23
FIGURE 4. A comparison of vegetation types in the managed and control plots at
the Plantation site. The numbers represents stem counts or percent cover for the
plant or ground cover listed. Error bars are shown for each vegetation type. The
vegetation type having significant differences between the sites are listed the in
table below the figure including the corresponding F- and P- value.
24
FIGURE 5. A comparison of vegetation types in the managed and control plots at
the Woodpecker site. The numbers represents stem counts or percent cover for the
plant or ground cover listed. Error bars are shown for each vegetation type. The
vegetation type having significant differences between the sites are listed in the
table below the figure including the corresponding F- and P- value.
25
FIGURE 6. A comparison of vegetation types in the managed and control plots at
the Circle site. The numbers represent stem counts or percent cover for the plant
or ground cover listed. Error bars are shown for each vegetation type. The
vegetation type having significant differences between the sites are listed in the
table below the figure, including the corresponding F- and P- value.
Site ! Diversity " Diversity # Diversity Shannon
Index
Evenness
Circle
Woodpecker
Plantation
Parkway
All Sites
21 1.86 n/a 2.65 0.87
31 1.26 n/a 3.01 0.88
28 1.39 n/a 2.92 0.88
19 2.05 n/a 2.67 0.91
n/a n/a 39 3.08 0.84
TABLE 2. Diversity measures for birds occurring at study sites in the New Jersey
Pinelands. Diversity measures presented are: alpha-diversity (local species
richness), gamma-diversity (regional species richness), beta-diversity (change in
species composition between sites), the Shannon Index ( ), and species evenness
(E).
26
Site Most
Abundant
2nd Most
Abundant
3rd Most
Abundant
4th Most
Abundant
5th Most Abundant
Circle
Woodpecker
Plantation
Parkway
All Sites
Eastern
Towhee
Carolina
Chickadee (Tie
2nd)
Chipping Sparrow
(Tie 2nd)
Eastern Wood-
Peewee (Tie
2nd)
Ovenbird (Tie 2nd)
Eastern
Bluebird
Eastern Wood-
Peewee
Ovenbird Chipping
Sparrow
Carolina Chickadee,
Eastern Towhee, Pine
Warbler (Tie 5th)
Carolina
Chickadee
(Tie 1st)
Eastern Towhee
(Tie 1st)
Ovenbird Chipping
Sparrow (Tie 4th)
Eastern Wood-
Peewee (Tie 4th)
Eastern
Towhee
Carolina
Chickadee (Tie
2nd)
Grey Catbird (Tie
2nd)
Ovenbird (Tie
2nd)
Eastern Wood-
Peewee
Eastern
Towhee
Ovenbird Carolina
Chickadee (Tie
3rd)
Eastern Wood-
Peewee (Tie 3rd)
Chipping Sparrow
TABLE 3. Species composition (of the five most abundant species) for each of the
study sites. Species are listed in order of abundance.
27
Site ! Diversity " Diversity # Diversity
Circle 13 1.46 n/a
Woodpecker 14 1.36 n/a
Plantation 13 1.46 n/a
Parkway 12 1.58 n/a
All Sites n/a n/a 19
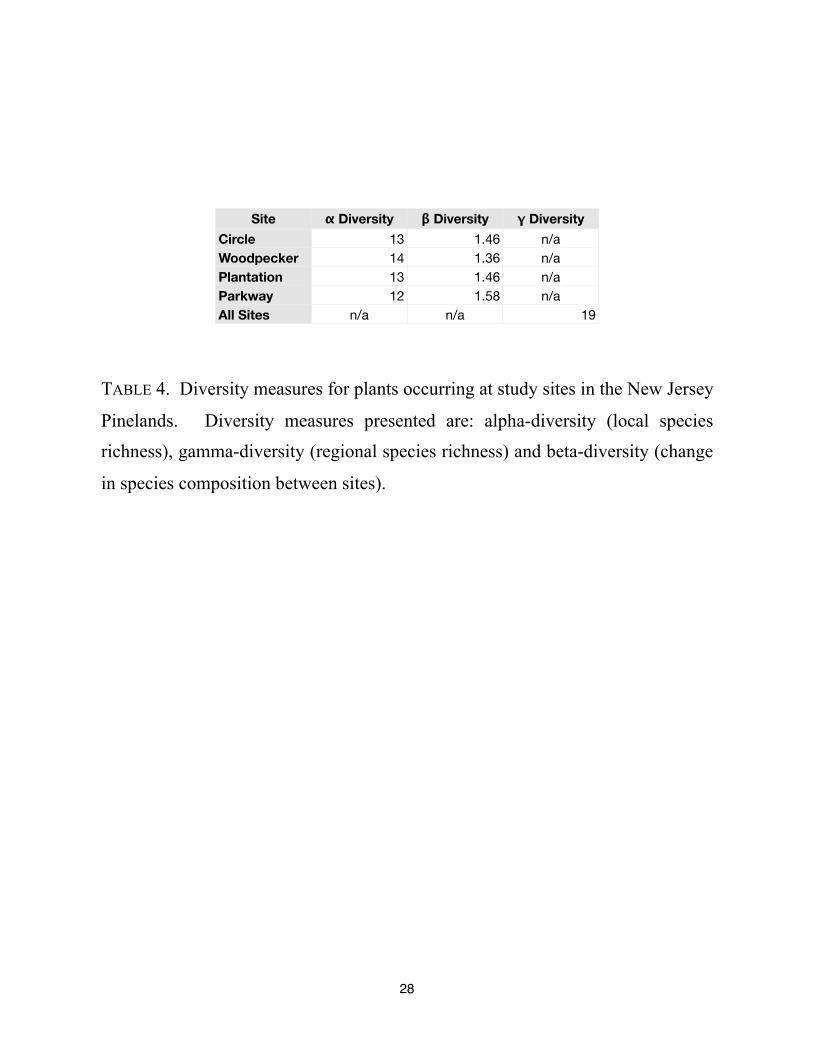
TABLE 4. Diversity measures for plants occurring at study sites in the New Jersey
Pinelands. Diversity measures presented are: alpha-diversity (local species
richness), gamma-diversity (regional species richness) and beta-diversity (change
in species composition between sites).
28
Site ! Diversity " Diversity # Diversity
Circle
Woodpecker
Plantation
Parkway
All Sites
34 1.71 n/a
45 1.29 n/a
41 1.41 n/a
31 1.87 n/a
n/a n/a 58
TABLE 5. Diversity measures for birds and plants (pooled) occurring at study sites
in the New Jersey Pinelands. Diversity measures presented are: alpha-diversity
(local species richness), gamma-diversity (regional species richness), and beta-
diversity (change in species composition between sites).
29
Species Abundance Relative Abundance Shannon Index
American Robin
Blue Jay
Carolina Chickadee
Chipping Sparrow
Downy Woodpecker
Eastern Bluebird
Eastern Phoebe
Eastern Towhee
Eastern Wood-Peewee
Finch
Goldfinch
Grey Catbird
Mourning Dove
Ovenbird
Pine Warbler
Red-Bellied Woodpecker
Tufted titmouse
Turkey Vulture
Whippoorwill
White-Breasted Nuthatch
Wood Thrush
21
5 0.06 -0.17
7 0.09 -0.21
9 0.11 -0.25
9 0.11 -0.25
1 0.01 -0.05
1 0.01 -0.05
1 0.01 -0.05
10 0.13 -0.26
9 0.11 -0.25
1 0.01 -0.05
1 0.01 -0.05
1 0.01 -0.05
2 0.03 -0.09
9 0.11 -0.25
6 0.08 -0.19
1 0.01 -0.05
2 0.03 -0.09
1 0.01 -0.05
1 0.01 -0.05
1 0.01 -0.05
2 0.03 -0.09
80 1.00 2.65
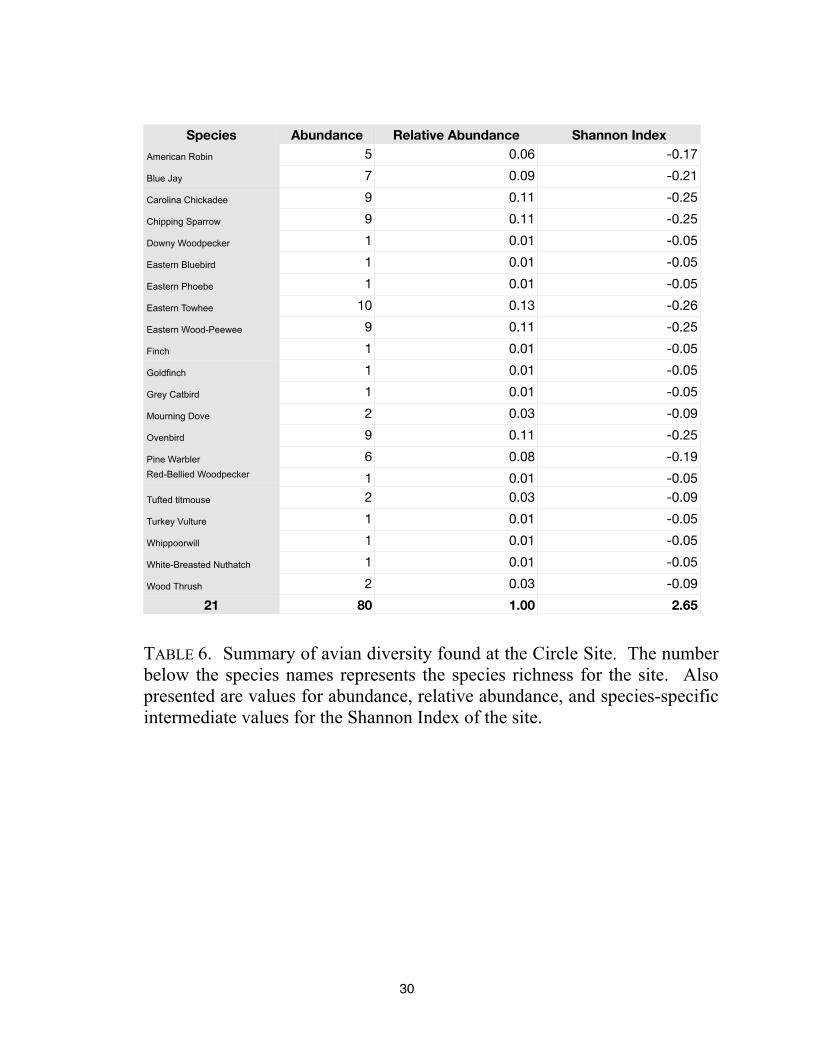
TABLE 6. Summary of avian diversity found at the Circle Site. The number
below the species names represents the species richness for the site. Also
presented are values for abundance, relative abundance, and species-specific
intermediate values for the Shannon Index of the site.
30
Species abundance relative abundance Shannon Index
American Crow
American Robin
Back and White Warbler
Black Vulture
Blue Jay
Brown-Headed Cowbird
Carolina Chickadee
Chipping Sparrow
Downy Woodpecker
Eastern Bluebird
Eastern Phoebe
Eastern Towhee
Eastern Wood-Peewee
Finch
Goldfinch
House Finch
Northern Cardinal
Northern Flicker
Northern Oriole
Ovenbird
Pine Warbler
Red-Bellied Woodpecker
Red-Headed Woodpecker
Red-Tailed Hawk
Ruby-throated hummingbird
Summer tanager
Tufted titmouse
Turkey Vulture
Warbler
Whippoorwill
White-Breasted Nuthatch
31
2 0.01 -0.06
4 0.03 -0.10
3 0.02 -0.08
1 0.01 -0.03
3 0.02 -0.08
3 0.02 -0.08
10 0.07 -0.19
12 0.08 -0.21
2 0.01 -0.06
13 0.09 -0.22
2 0.01 -0.06
10 0.07 -0.19
13 0.09 -0.22
1 0.01 -0.03
2 0.01 -0.06
1 0.01 -0.03
1 0.01 -0.03
7 0.05 -0.15
1 0.01 -0.03
13 0.09 -0.22
10 0.07 -0.19
9 0.06 -0.17
9 0.06 -0.17
1 0.01 -0.03
1 0.01 -0.03
1 0.01 -0.03
2 0.01 -0.06
1 0.01 -0.03
1 0.01 -0.03
1 0.01 -0.03
2 0.01 -0.06
142 1.00 3.01
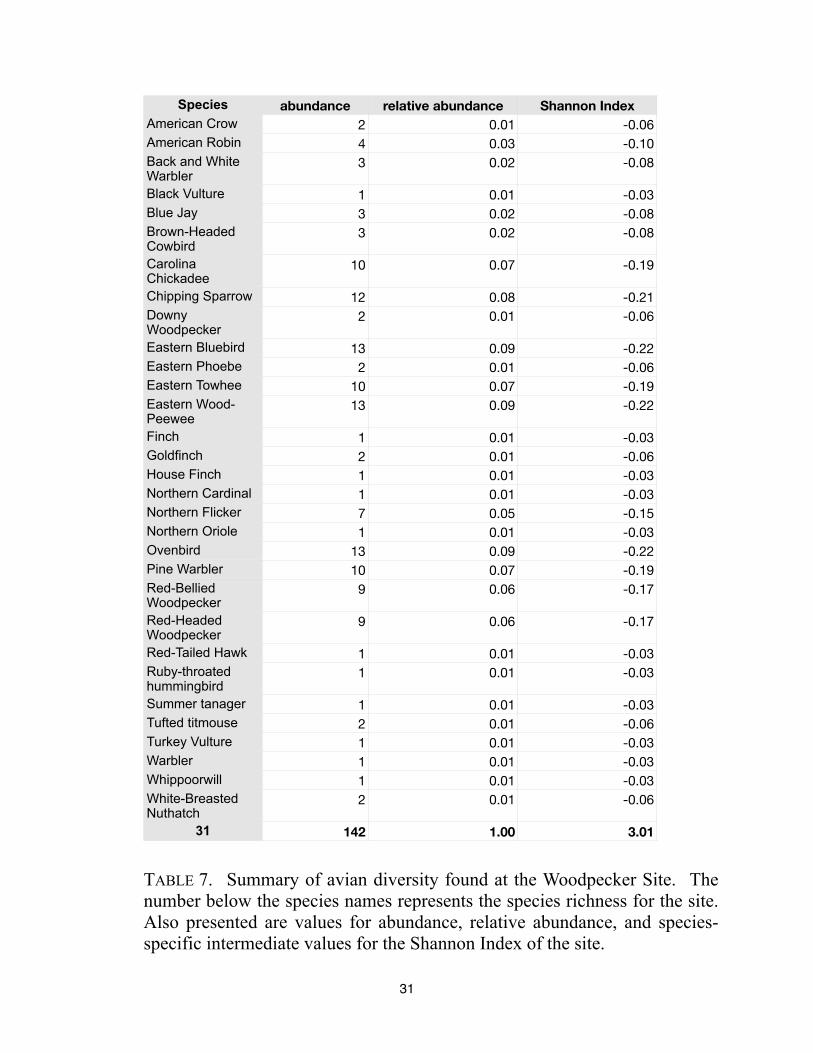
TABLE 7. Summary of avian diversity found at the Woodpecker Site. The
number below the species names represents the species richness for the site.
Also presented are values for abundance, relative abundance, and species-
specific intermediate values for the Shannon Index of the site.
31
Species Abundance Relative Abundance Shannon Index
American Crow
American Robin
Back and White Warbler
Blue Jay
Carolina Chickadee
Chipping Sparrow
Common Yellowthroat
Downy Woodpecker
Eastern Phoebe
Eastern Towhee
Eastern Wood-Peewee
Finch
Goldfinch
Grey Catbird
Hermit Thrush
Mourning Dove
Northern Cardinal
Ovenbird
Pine Warbler
Prairie Warbler
Prothonotary warbler
Red-Tailed Hawk
Ruby-throated hummingbird
Tufted titmouse
Turkey Vulture
Warbler
White-Breasted Nuthatch
Wood Thrush
28
3 0.03 -0.10
8 0.07 -0.19
1 0.01 -0.04
3 0.03 -0.10
12 0.11 -0.25
10 0.09 -0.22
1 0.01 -0.04
1 0.01 -0.04
2 0.02 -0.07
12 0.11 -0.25
10 0.09 -0.22
2 0.02 -0.07
3 0.03 -0.10
1 0.01 -0.04
2 0.02 -0.07
3 0.03 -0.10
4 0.04 -0.12
11 0.10 -0.23
6 0.06 -0.16
1 0.01 -0.04
1 0.01 -0.04
1 0.01 -0.04
1 0.01 -0.04
1 0.01 -0.04
3 0.03 -0.10
1 0.01 -0.04
2 0.02 -0.07
1 0.01 -0.04
107 1.00 2.92
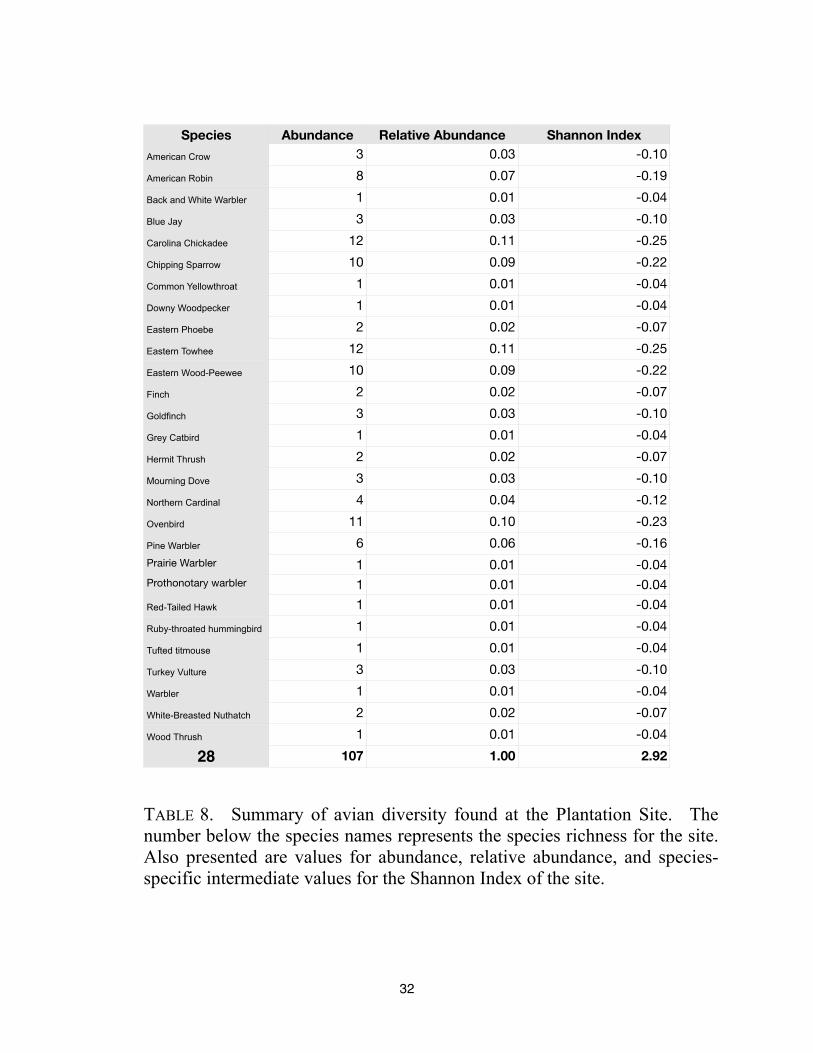
TABLE 8. Summary of avian diversity found at the Plantation Site. The
number below the species names represents the species richness for the site.
Also presented are values for abundance, relative abundance, and species-
specific intermediate values for the Shannon Index of the site.
32
Species Abundance Relative Abundance Shannon Index
American Crow
American Robin
Back and White Warbler
Blue Jay
Carolina Chickadee
Chipping Sparrow
Downy Woodpecker
Eastern Towhee
Eastern Wood-Peewee
European Starling
Goldfinch
Grey Catbird
Mourning Dove
Ovenbird
Pine Warbler
Ruby-throated hummingbird
Turkey Vulture
Warbler
White-Breasted Nuthatch
19
3 0.03 -0.12
7 0.08 -0.20
1 0.01 -0.05
3 0.03 -0.12
9 0.10 -0.23
7 0.08 -0.20
1 0.01 -0.05
11 0.13 -0.26
8 0.09 -0.22
1 0.01 -0.05
2 0.02 -0.09
9 0.10 -0.23
5 0.06 -0.16
9 0.10 -0.23
5 0.06 -0.16
1 0.01 -0.05
2 0.02 -0.09
1 0.01 -0.05
2 0.02 -0.09
87 1.00 2.67
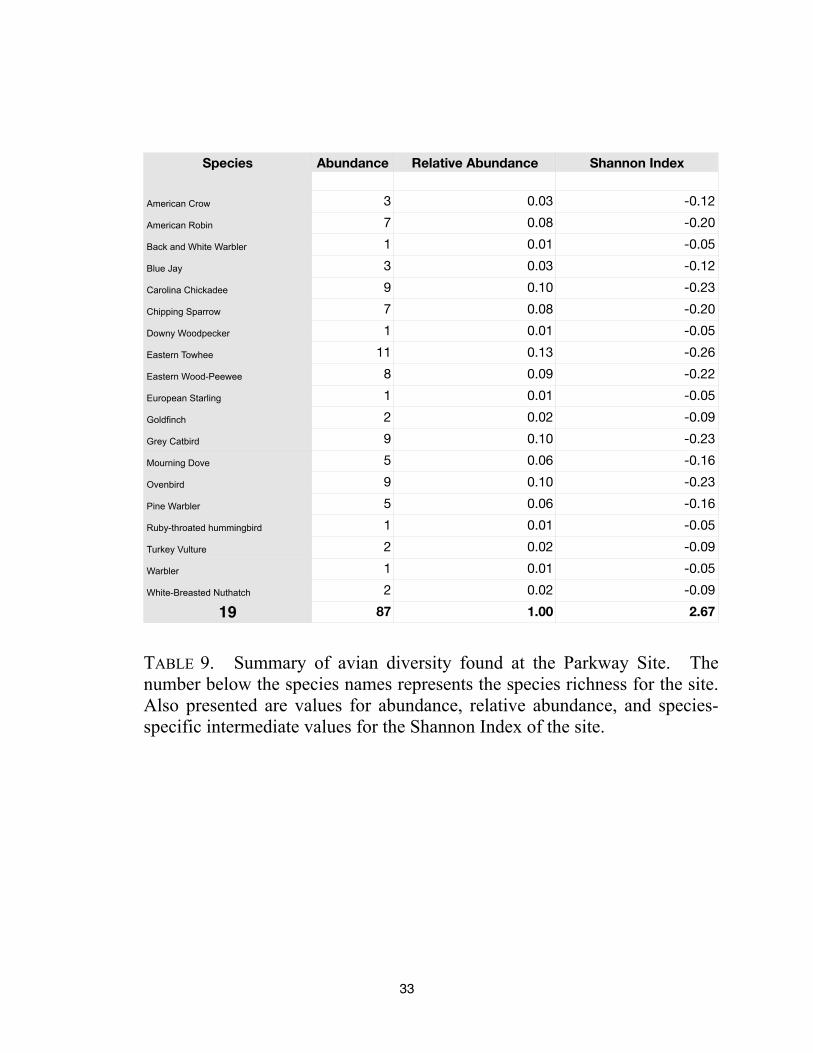
TABLE 9. Summary of avian diversity found at the Parkway Site. The
number below the species names represents the species richness for the site.
Also presented are values for abundance, relative abundance, and species-
specific intermediate values for the Shannon Index of the site.
33
Species Abundance Relative
Abundance
Shannon Index
American Crow
American Robin
Back and White Warbler
Black Vulture
Blue Jay
Brown-Headed Cowbird
Carolina Chickadee
Chipping Sparrow
Common Yellowthroat
Downy Woodpecker
Eastern Bluebird
Eastern Phoebe
Eastern Towhee
Eastern Wood-Peewee
European Starling
Finch
Goldfinch
Grey Catbird
Hermit Thrush
House Finch
Mourning Dove
Northern Cardinal
Northern Flicker
Northern Oriole
Ovenbird
Pine Warbler
Prairie Warbler
Prothonotary warbler
Red-Bellied Woodpecker
Red-Headed Woodpecker
Red-Tailed Hawk
Ruby-throated hummingbird
Summer tanager
Tufted titmouse
Turkey Vulture
Warbler
Whippoorwill
White-Breasted Nuthatch
Wood Thrush
39
8 0.02 -0.08
24 0.06 -0.16
5 0.01 -0.05
1 0.00 -0.01
16 0.04 -0.13
3 0.01 -0.04
40 0.10 -0.23
38 0.09 -0.22
1 0.00 -0.01
5 0.01 -0.05
14 0.03 -0.11
5 0.01 -0.05
43 0.10 -0.23
40 0.10 -0.23
1 0.00 -0.01
4 0.01 -0.04
8 0.02 -0.08
11 0.03 -0.10
2 0.00 -0.03
1 0.00 -0.01
10 0.02 -0.09
5 0.01 -0.05
7 0.02 -0.07
1 0.00 -0.01
42 0.10 -0.23
27 0.06 -0.18
1 0.00 -0.01
1 0.00 -0.01
10 0.02 -0.09
9 0.02 -0.08
2 0.00 -0.03
3 0.01 -0.04
1 0.00 -0.01
5 0.01 -0.05
7 0.02 -0.07
3 0.01 -0.04
2 0.00 -0.03
7 0.02 -0.07
3 0.01 -0.04
416 1.00 3.08
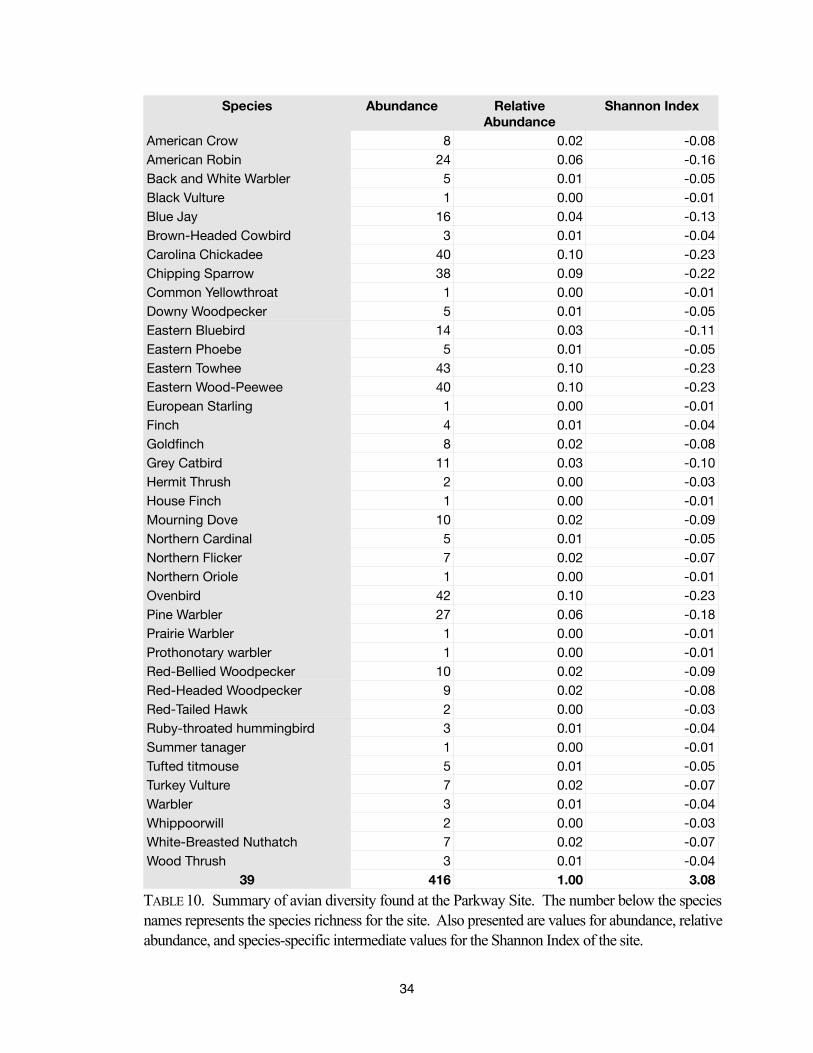
TABLE 10. Summary of avian diversity found at the Parkway Site. The number below the species
names represents the species richness for the site. Also presented are values for abundance, relative
abundance, and species-specific intermediate values for the Shannon Index of the site.
34

Appendices
35
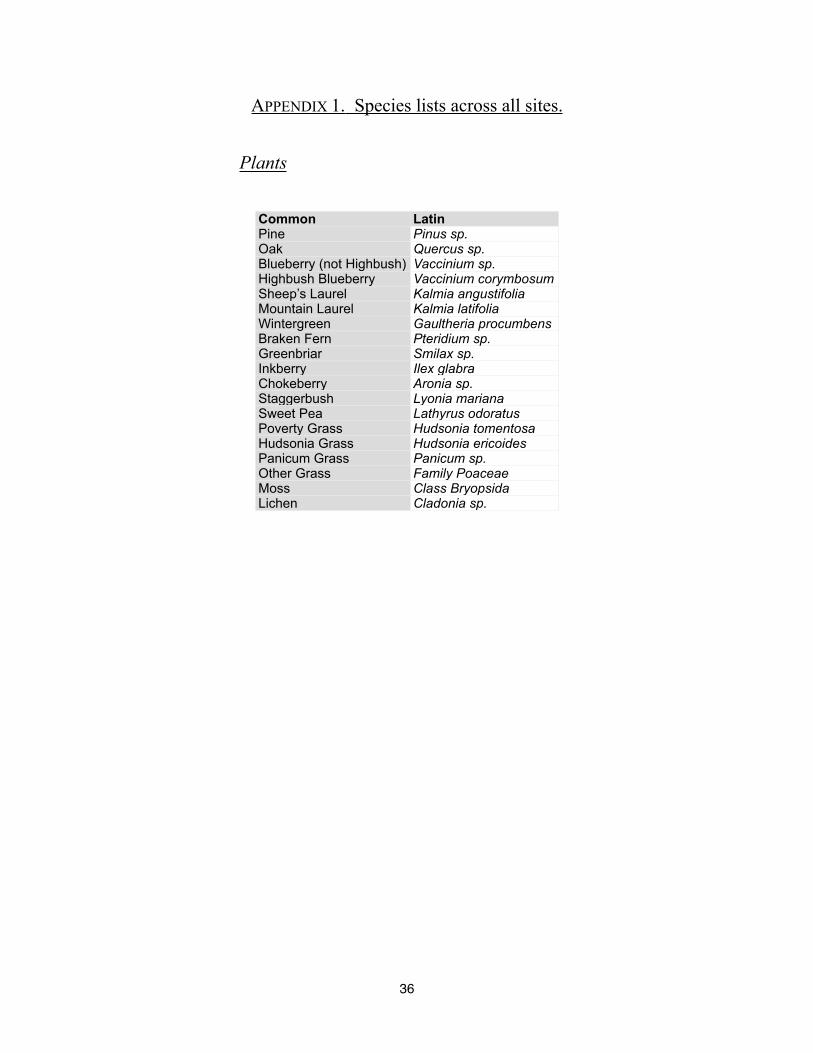
APPENDIX 1. Species lists across all sites.
Plants
Common LatinPine Pinus sp.Oak Quercus sp.Blueberry (not Highbush) Vaccinium sp.Highbush Blueberry Vaccinium corymbosumSheep’s Laurel Kalmia angustifoliaMountain Laurel Kalmia latifoliaWintergreen Gaultheria procumbensBraken Fern Pteridium sp.Greenbriar Smilax sp.Inkberry Ilex glabraChokeberry Aronia sp.Staggerbush Lyonia marianaSweet Pea Lathyrus odoratusPoverty Grass Hudsonia tomentosaHudsonia Grass Hudsonia ericoidesPanicum Grass Panicum sp.Other Grass Family PoaceaeMoss Class BryopsidaLichen Cladonia sp.
36
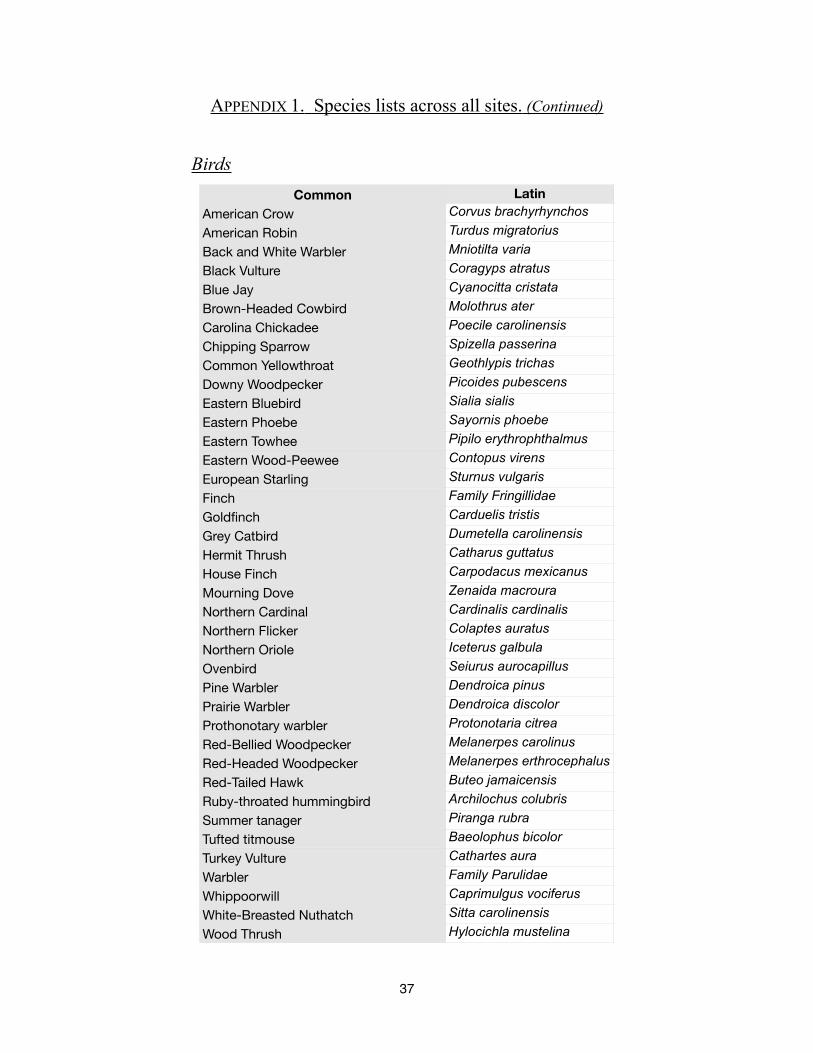
APPENDIX 1. Species lists across all sites. (Continued)
Birds
Common Latin
American Crow
American Robin
Back and White Warbler
Black Vulture
Blue Jay
Brown-Headed Cowbird
Carolina Chickadee
Chipping Sparrow
Common Yellowthroat
Downy Woodpecker
Eastern Bluebird
Eastern Phoebe
Eastern Towhee
Eastern Wood-Peewee
European Starling
Finch
Goldfinch
Grey Catbird
Hermit Thrush
House Finch
Mourning Dove
Northern Cardinal
Northern Flicker
Northern Oriole
Ovenbird
Pine Warbler
Prairie Warbler
Prothonotary warbler
Red-Bellied Woodpecker
Red-Headed Woodpecker
Red-Tailed Hawk
Ruby-throated hummingbird
Summer tanager
Tufted titmouse
Turkey Vulture
Warbler
Whippoorwill
White-Breasted Nuthatch
Wood Thrush
Corvus brachyrhynchos
Turdus migratorius
Mniotilta varia
Coragyps atratus
Cyanocitta cristata
Molothrus ater
Poecile carolinensis
Spizella passerina
Geothlypis trichas
Picoides pubescens
Sialia sialis
Sayornis phoebe
Pipilo erythrophthalmus
Contopus virens
Sturnus vulgaris
Family Fringillidae
Carduelis tristis
Dumetella carolinensis
Catharus guttatus
Carpodacus mexicanus
Zenaida macroura
Cardinalis cardinalis
Colaptes auratus
Iceterus galbula
Seiurus aurocapillus
Dendroica pinus
Dendroica discolor
Protonotaria citrea
Melanerpes carolinus
Melanerpes erthrocephalus
Buteo jamaicensis
Archilochus colubris
Piranga rubra
Baeolophus bicolor
Cathartes aura
Family Parulidae
Caprimulgus vociferus
Sitta carolinensis
Hylocichla mustelina
37
38
APPENDIX 2: Student paper on Red-Headed Woodpecker
Red-Headed Woodpecker Study
Matthew Niepielko
Supervised by: Daniel Hernandez, Ph.D.
Abstract
Research on the breeding phenology of the Red-headed Woodpecker (Melanerpes erthocephalus)
was conducted during the summer of 2007. This study was designed to assess whether active
conservation efforts for the New Jersey-Threatened Red-headed Woodpecker were succeeding at the
Brendan T. Byrne State Forest Red-Headed Woodpecker Preserve. The objectives of this study were:
finding the Red-headed Woodpecker, recording its vocalization, and analyzing the vocalizations and
behaviors observed during the summer breeding season. By evaluating multiple sound spectrograms and
observed visual behaviors, we concluded that a pair of Red-headed Woodpeckers was nesting and that
current conservation efforts seemed to be successful.
39
Introduction
A study was conducted from May 7th
2007 to August 29th
2007 involving the survey and
observations of birds in different woodland regions located at four sites. The main bird species actively
searched for was the Red-headed Woodpecker. The Red-headed woodpecker was specifically searched for
by playing its distinct calls through a loud speaker in hopes of a response. Red-headed Woodpecker
responses were recorded for further comparative data analysis. Random recordings were also conducted
during every visit in every region. Some questions to be answered from this study included: Are there any
Red-headed woodpeckers at any site? Are Redheaded Woodpeckers selecting specific areas? What actions
the Red-headed Woodpeckers taking? Is active wildlife management working in certain areas? Is the Red-
headed woodpecker conservation effort working? Is nesting taking place?
Field Research and Data Collection
All four sites were visited at least once a week from May 7th to August 29th during morning
hours. A walk-through was conducted in two regions at each site for every visit. This walk-through was
used to randomly collect sound samples of the Red-headed Woodpecker, record responses from imitated
calls, and observe Red-headed Woodpecker behavior. These visual and sound observations were to be
further analyzed to determine the success of actively managing a site specifically to conserve the Red-
headed Woodpecker.
Red-Headed Woodpecker Observations
The Red-headed Woodpecker was only observed at one site, the actively managed Red-Headed
Woodpecker Site located within Brendan T. Byrne Forest. The Red-headed Woodpecker was first
observed on May 29th
as a single individual responding to the imitated call note, and was last seen on
August 16th
as an individual. During each encounter with one individual, the Redheaded woodpecker was
observed perched mid height on a dead oak or pine tree repeating its call note loud and frequently.
40
Distinct drumming was recorded on July 12th
. Two Red-headed woodpeckers were observed calling and
responding to each other on July 2nd
and July 21st
; one distinctly louder and more frequent than the other.
Both were also observed perching and flying with one another from one side of the forest edge to the
other side.
Data Analysis
All field recorded Red-headed Woodpecker sounds were recorded onto a computer for evaluation.
All Red-headed Woodpecker sounds were isolated and amplified from surrounding sounds to the best of
my ability using a program called “Raven Lite 1.0.” By using this program, I was able to create a visual
spectrogram for each collected sound. These spectrograms allowed for the comparison of sound both
visually as well as audibly. Sounds collected from the field were compared to known sounds. Known
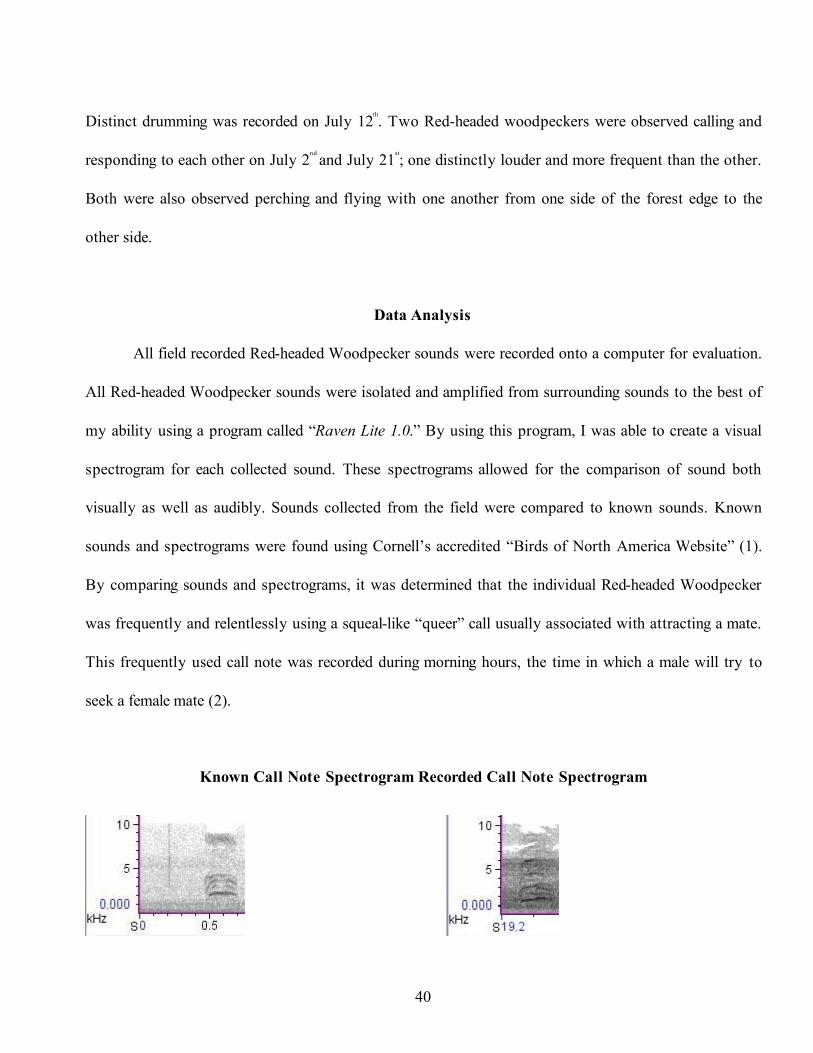
sounds and spectrograms were found using Cornell’s accredited “Birds of North America Website” (1).
By comparing sounds and spectrograms, it was determined that the individual Red-headed Woodpecker
was frequently and relentlessly using a squeal-like “queer” call usually associated with attracting a mate.
This frequently used call note was recorded during morning hours, the time in which a male will try to
seek a female mate (2).
Known Call Note Spectrogram Recorded Call Note Spectrogram
41
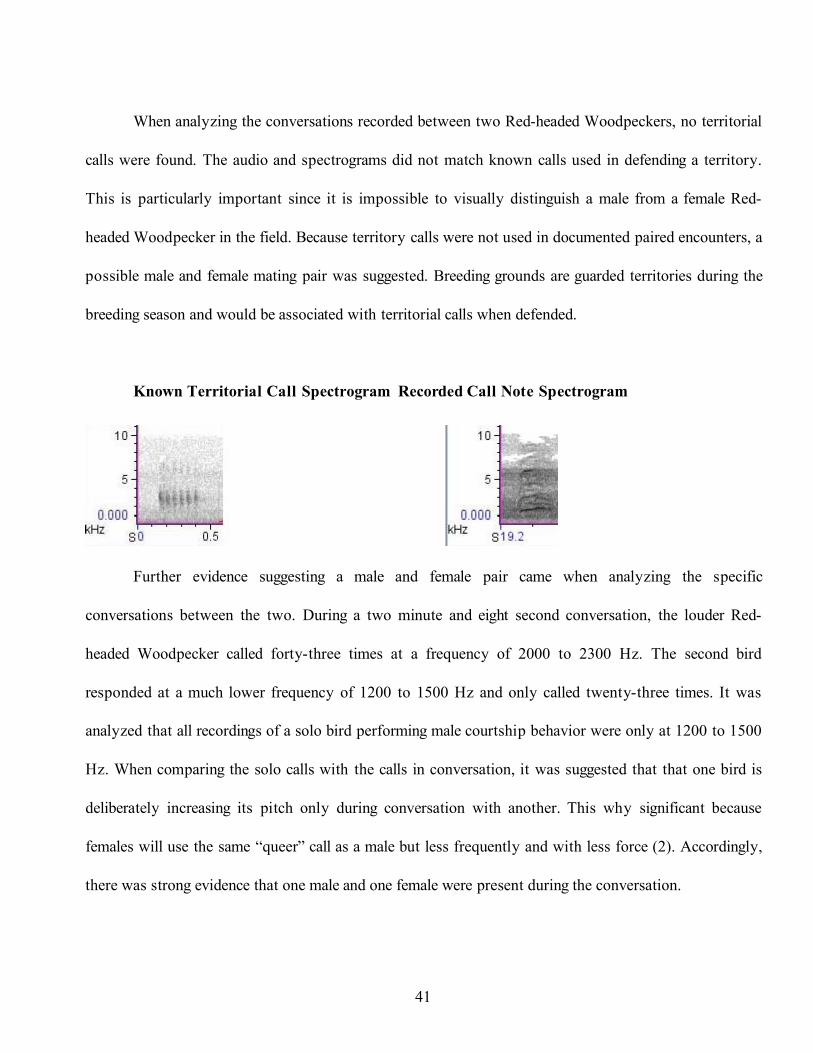
When analyzing the conversations recorded between two Red-headed Woodpeckers, no territorial
calls were found. The audio and spectrograms did not match known calls used in defending a territory.
This is particularly important since it is impossible to visually distinguish a male from a female Red-
headed Woodpecker in the field. Because territory calls were not used in documented paired encounters, a
possible male and female mating pair was suggested. Breeding grounds are guarded territories during the
breeding season and would be associated with territorial calls when defended.
Known Territorial Call Spectrogram Recorded Call Note Spectrogram
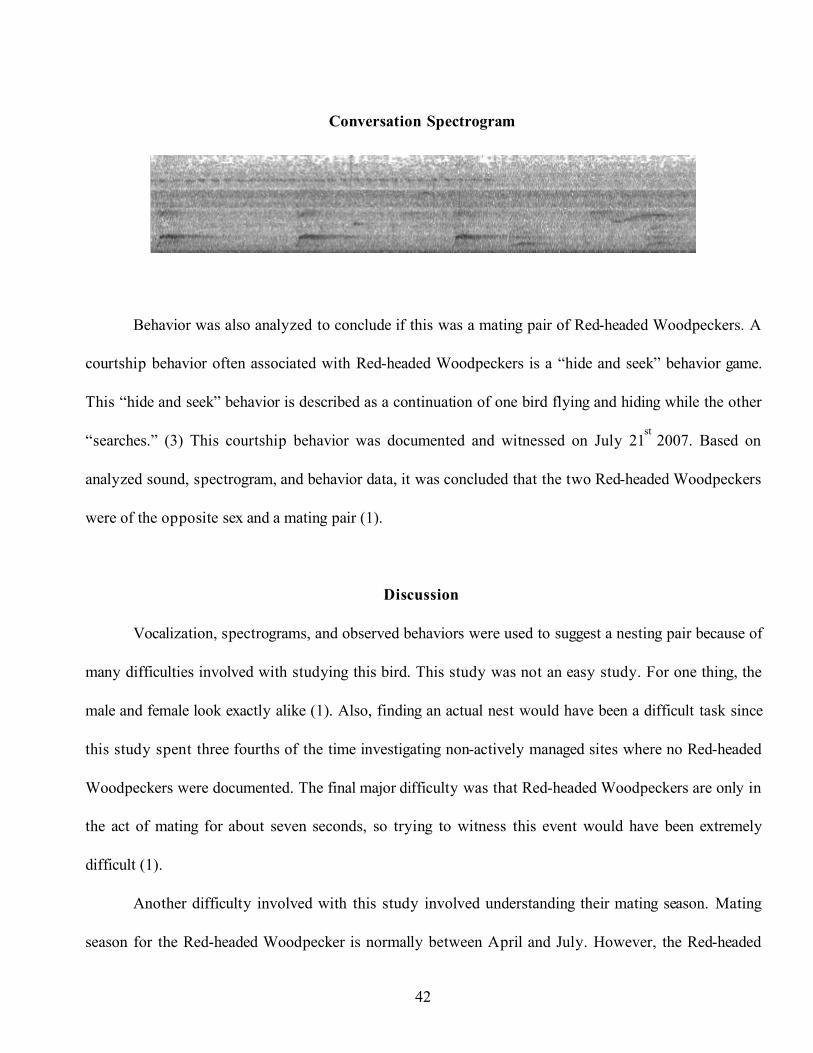
Further evidence suggesting a male and female pair came when analyzing the specific
conversations between the two. During a two minute and eight second conversation, the louder Red-
headed Woodpecker called forty-three times at a frequency of 2000 to 2300 Hz. The second bird
responded at a much lower frequency of 1200 to 1500 Hz and only called twenty-three times. It was
analyzed that all recordings of a solo bird performing male courtship behavior were only at 1200 to 1500
Hz. When comparing the solo calls with the calls in conversation, it was suggested that that one bird is
deliberately increasing its pitch only during conversation with another. This why significant because
females will use the same “queer” call as a male but less frequently and with less force (2). Accordingly,
there was strong evidence that one male and one female were present during the conversation.
42
Conversation Spectrogram
Behavior was also analyzed to conclude if this was a mating pair of Red-headed Woodpeckers. A
courtship behavior often associated with Red-headed Woodpeckers is a “hide and seek” behavior game.
This “hide and seek” behavior is described as a continuation of one bird flying and hiding while the other
“searches.” (3) This courtship behavior was documented and witnessed on July 21st
2007. Based on
analyzed sound, spectrogram, and behavior data, it was concluded that the two Red-headed Woodpeckers
were of the opposite sex and a mating pair (1).
Discussion
Vocalization, spectrograms, and observed behaviors were used to suggest a nesting pair because of
many difficulties involved with studying this bird. This study was not an easy study. For one thing, the
male and female look exactly alike (1). Also, finding an actual nest would have been a difficult task since
this study spent three fourths of the time investigating non-actively managed sites where no Red-headed
Woodpeckers were documented. The final major difficulty was that Red-headed Woodpeckers are only in
the act of mating for about seven seconds, so trying to witness this event would have been extremely
difficult (1).
Another difficulty involved with this study involved understanding their mating season. Mating
season for the Red-headed Woodpecker is normally between April and July. However, the Red-headed
43
Woodpecker is known for raising one nest while laying another nest. Furthermore, Red-headed
Woodpeckers are known to mate again if a nest fails. This type of survival behavior can complicate,
change, and extend the breeding season from one year to another year, and had to be taken in to
consideration when studying this species(2).
Other difficulties in this study included the act of woodland birding. Unlike other types of birding
such as shore birding, woodland birding consists of multiple obstacles that had to be overcome. Such
obstacles include echoed sounds on trees, the frustration from the constant moving of birds from one tree
to the other, finding birds in trees through dense canopy, and the ability to follow a bird from all parts of
the forest including canopy, understory, and forest floor.
Conclusion
The Red-headed Woodpecker was only found in one site out of the four. This suggests that
something is attracting them to that site. Due to the specific qualities found, The Red-Headed
Woodpecker Site in Brendan T. Byrne State Forest is actively managed for that specific species; wildlife
management here can be deemed successful thus far. But are conservation efforts successful? In order for
conservation efforts to be successful the species must be breeding. After analyzing the data, a male and
female were found to be at the site, at the same time, on different occasions, during mating season,
performing behavior associated with courtship. Drumming was also recorded suggesting possible nest
building. Based on the evidence it can be concluded that there was at least one nesting pair of Red-headed
Woodpeckers at the Red-Headed Woodpecker Site in Brendan T. Byrne forest during the summer of
2007. This nesting pair suggests that a conservation effort of the threatened Red-headed Woodpecker is
working.
Future Studies
44
Another study should be conducted during the breeding season in 2008. More time should be
devoted to the actual managed site although other “potential” areas should still be studied. Time should be
devoted to looking for nests and there should be close observations of possible population increases.
Bibliography
1 “Birds of North America”, http://bna.birds.cornell.edu/bna/species/518/articles/behavior (accessed
2008) This website was used to understand the Red-headed Woodpeckers calls, spectrograms, and a
variety of information.
2 “Red-Headed Woodpecker Breeding Resource”, http://elibrary.unm.edu/sora/Auk/v094n02/
p0231-p0239.pdf (accessed 2008) This article was used to understand the different breading behaviors of
the Red-headed Woodpecker.
3 “Red-Headed Woodpecker information Site, http://www.birds.cornell.edu/bfl/speciesaccts/
rehwoo.html (accessed 2008) This website was used to understand courtship behaviors of the Red-
headed Woodpecker.