pininfarina group interim financial report at 30 september ... · interim financial report at 30...
TRANSCRIPT

1
(Translation from the Italian original which remains the definitive version)
PININFARINA GROUP
Interim financial report at 30 September 2018
Pininfarina S.p.A. - Share capital €54,287,128 fully paid-up - Registered office in Turin, Via Bruno Buozzi 6
Tax Code and Turin Company Registration no. 00489110015
2
The Board of Directors approved this interim financial report at 30 September 2018 on 13 November
2018.
3
Board of Directors
Chairman * Paolo Pininfarina (4)
Chief Executive Officer Silvio Pietro Angori (4)
Directors Manoj Bhat
Romina Guglielmetti (2) (3)
Chander Prakash Gurnani
Jay Itzkowitz (1) (2) (3)
Licia Mattioli (1) (2)
Sara Miglioli (3)
Antony Sheriff (1)
(1) Member of the Nomination and Remuneration Committee
(2) Member of the Control and Risk Committee
(3) Member of the Committee for Transactions with Related Parties
(4) Responsible for the Internal Control and Risk Management System
Board of Statutory Auditors
Chairman Massimo Miani
Standing Statutory Auditors Antonia Di Bella
Alain Devalle
Alternate Statutory Auditors Luciana Dolci
Fausto Piccinini
Secretary to the Board of Directors and Manager in charge of financial reporting Gianfranco Albertini
Independent Auditors KPMG S.p.A.
*Powers Pursuant to article 22 of the bylaws, the Chairman is the parent’s legal representative vis-à-vis third parties and in court proceedings.

4
5
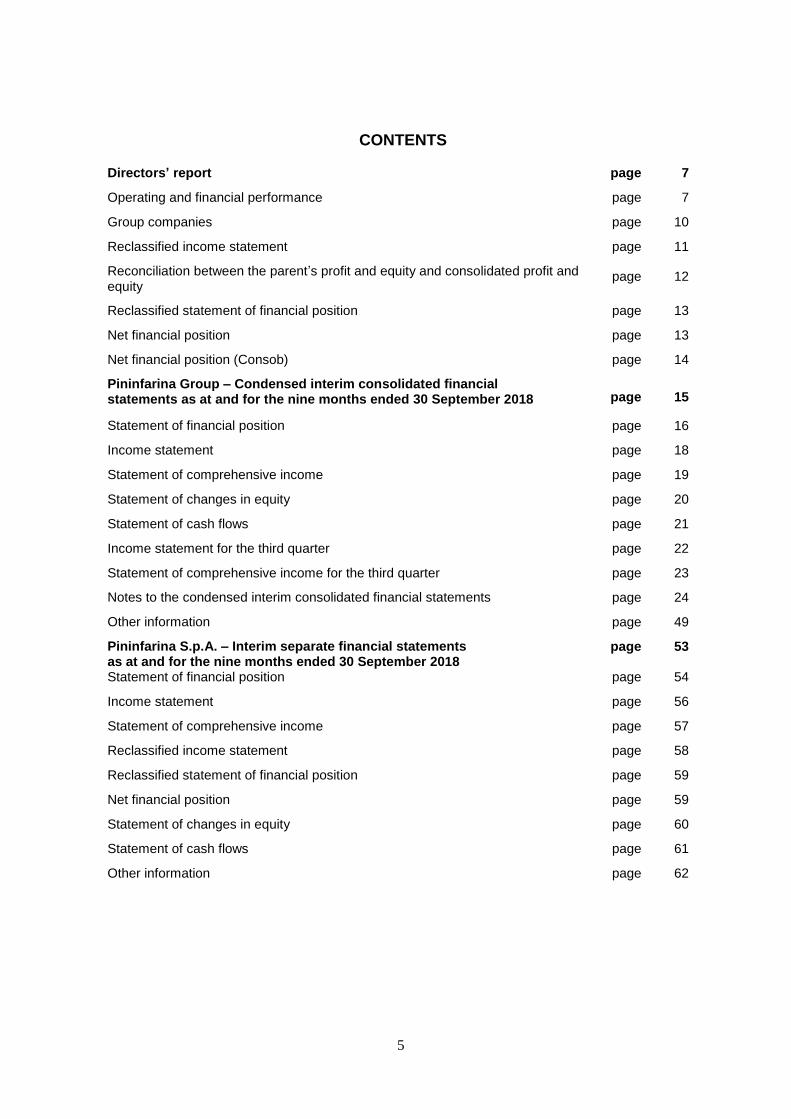
CONTENTS
Directors’ report page 7
Operating and financial performance page 7
Group companies page 10
Reclassified income statement page 11
Reconciliation between the parent’s profit and equity and consolidated profit and equity
page 12
Reclassified statement of financial position page 13
Net financial position page 13
Net financial position (Consob) page 14
Pininfarina Group – Condensed interim consolidated financial statements as at and for the nine months ended 30 September 2018 page 15
Statement of financial position page 16
Income statement page 18
Statement of comprehensive income page 19
Statement of changes in equity page 20
Statement of cash flows
page 21
Income statement for the third quarter
page 22
Statement of comprehensive income for the third quarter page 23
Notes to the condensed interim consolidated financial statements page 24
Other information page 49
Pininfarina S.p.A. – Interim separate financial statements as at and for the nine months ended 30 September 2018
page 53
Statement of financial position page 54
Income statement page 56
Statement of comprehensive income page 57
Reclassified income statement page 58
Reclassified statement of financial position page 59
Net financial position page 59
Statement of changes in equity page 60
Statement of cash flows page 61
Other information page 62

6
7
Pininfarina Group
Directors’ report
Operating and financial performance
The most significant issues arising from the comparison between the consolidated figures for the
first nine months of 2018 and those for the corresponding period of the previous year are
summarised below:
- revenue increased by 26% boosted by the larger contribution of the design, prototyping and
limited series manufacturing activities;
- the gross operating profit and operating profit were both very satisfactory and show a
significant jump on the corresponding period of 2017;
- compared to the first nine months of 2017, the Group’s Italian automotive operations show
an increase in profits while the German subsidiaries recorded a decrease in revenue and,
hence, operating losses. The industrial design segment’s contribution was stable while the
Chinese operations’ business volumes and profitability continue to grow;
- the profit for the period is more than five times that for the corresponding period of 2017
thanks to the Group’s satisfactory operating performance;
- the Group’s net financial position at 30 September 2018 decreased compared to 31
December 2017 mainly due to changes in its working capital. Equity includes the profit for
the period and is roughly 6% greater than that at 31 December 2017.
Specifically, revenue came to €78 million for the reporting period compared to €62.1 million for the
corresponding period of 2017 (+26%).
The gross operating profit rose by 74% to €8 million, compared to €4.6 million for the first nine
months of 2017. The operating profit increased to €5.4 million from €2.3 million in the corresponding
period of the previous year.
Net financial expense rose to €1.7 million from €1.4 million for the first nine months of 2017. The
increase is mainly due to the interest expense relating to the amortised-cost measurement of
liabilities arising from an advisory services agreement in connection with a long-term engineering
contract which was not in force in the corresponding period of the previous year.
The profit before taxes amounts to €3.6 million compared to €0.9 million for the nine months ended
30 September 2017, while the profit for the period came to €2.7 million, compared to €0.5 million in
the corresponding period of the previous year.
The net financial position decreased to €9.6 million from €12 million at 31 December 2017 (€14.1
million at 30 September 2017).
Equity of €62.1 million shows an increase of €3.3 million, or 6%, on 31 December 2017 (€58.8
million), mostly as a result of the profit for the period.

8
The headcount increased by 4.5% (27 units) from 605 at 30 September 2017 to 632, principally
involving the parent and the Chinese subsidiary.
On 14 May 2018, the parent, Pininfarina S.p.A., incorporated Pininfarina Engineering S.r.l., which it
wholly owns, manages and coordinates. The two companies signed a business unit transfer
agreement on 25 June 2018, which became effective on 1 July 2018, whereby the parent
transferred its “Engineering” business unit, consisting of the engineering activities partly carried out
directly by it and partly by its subsidiary Pininfarina Deutschland GmbH, which was included in the
transfer, to its wholly-owned subsidiary.
In its order of 13 September 2018, the Supreme Court of Cassation definitely ruled in the parent’s
favour with respect to its appeal against the 2002 and 2003 tax notices about the alleged non-
payment of VAT on the sale of goods to the Peugeot-Citroen Group. The amount claimed was
roughly €29.4 million plus interest.
Performance by business segment
Operations segment
In addition to the revenue on the sale of spare parts for cars manufactured in previous years,
royalties for the use of the trademark in the automotive segment and business lease income, this
segment bears the costs of the support and property management functions of the parent,
Pininfarina S.p.A.. Segment revenue came to €5.3 million compared to €8 million for the first nine
months of 2017. The reduction is mostly due to the smaller sales of spare parts and the recognition
of gains on the one-off sale of rights to a concept car in the corresponding period.
Despite the large contraction in revenue, the segment’s operating loss of €3.5 million is in line with
that for the first nine months of 2017 (€3.4 million), mainly thanks to the smaller costs incurred.
Services segment
This segment, comprising the design and engineering businesses, recognised revenue of €72.7
million, up 34% compared to the first nine months of 2017 (€54.1 million), boosted by the growth of
all services.
The segment’s operating profit increased to €8.8 million compared to €5.7 million in the
corresponding period of the previous year.

9
Information required by Consob (the Italian Commission for listed companies and the stock
exchange) pursuant to article 114.5 of Legislative decree no. 58/98
1) The net financial position of the Pininfarina Group and Pininfarina S.p.A., with separate
classification of current and non-current items, is respectively shown on pages 13 and 59
hereof.
2) The Group has no past-due liabilities (of a commercial, financial, tax or social security nature).
No actions against the Group have been filed by creditors.
3) The Group’s and parent’s related party transactions are respectively detailed on pages 49 and
62 hereof.
4) Under the existing Rescheduling Agreement, there is just one financial covenant, to be checked
annually beginning from 31 March 2018: consolidated equity at a minimum level of €30,000,000.
It had been complied with at the first verification date.
5) The parent’s debt restructuring plan is proceeding in accordance with the current agreements.
6) Implementation of the business plan approved by the board of directors on 27 November 2015
continues as forecast.
Events after the reporting period
There are no significant events that occurred after the reporting date.
Outlook for 2017
Consolidated revenue and the operating profit are expected to improve in 2018 compared to the previous year, while the Group expects a decrease in its net financial position unlike the previous forecasts.
13 November 2018
Chairman of the Board of Directors (Paolo Pininfarina)
10
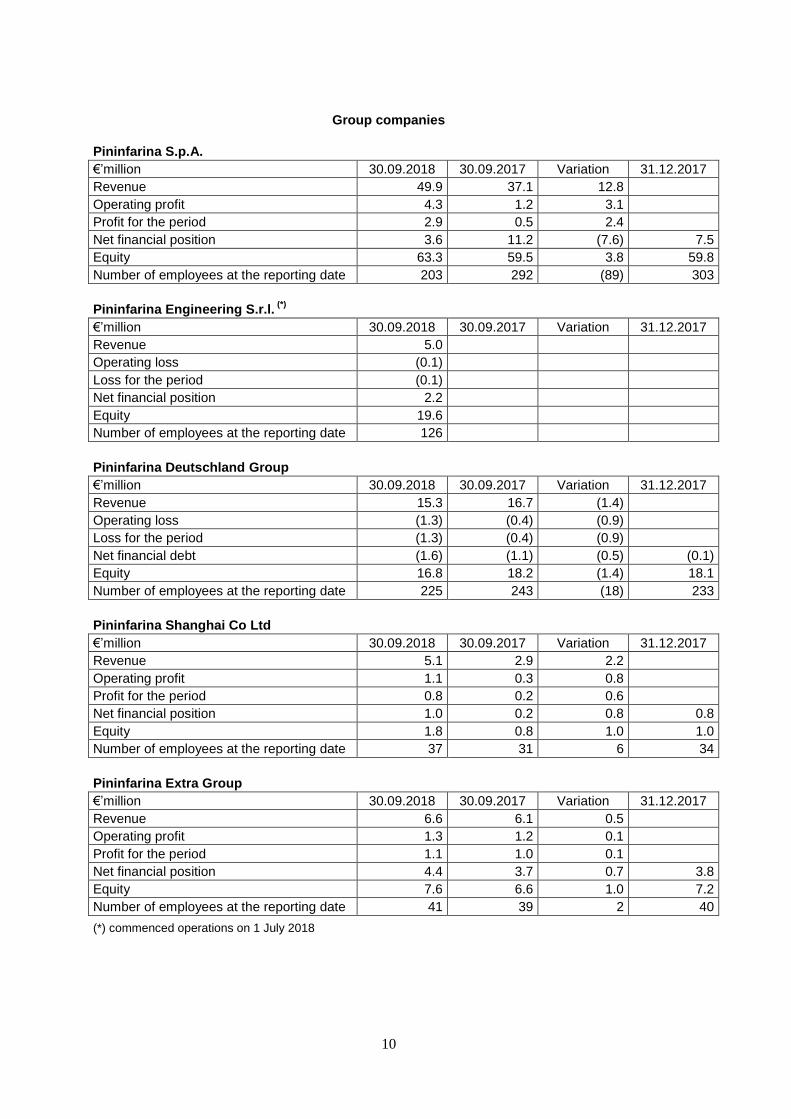
Group companies
Pininfarina S.p.A.
€’million 30.09.2018 30.09.2017 Variation 31.12.2017
Revenue 49.9 37.1 12.8
Operating profit 4.3 1.2 3.1
Profit for the period 2.9 0.5 2.4
Net financial position 3.6 11.2 (7.6) 7.5
Equity 63.3 59.5 3.8 59.8
Number of employees at the reporting date 203 292 (89) 303
Pininfarina Engineering S.r.l. (*)
€’million 30.09.2018 30.09.2017 Variation 31.12.2017
Revenue 5.0
Operating loss (0.1)
Loss for the period (0.1)
Net financial position 2.2
Equity 19.6
Number of employees at the reporting date 126
Pininfarina Deutschland Group
€’million 30.09.2018 30.09.2017 Variation 31.12.2017
Revenue 15.3 16.7 (1.4)
Operating loss (1.3) (0.4) (0.9)
Loss for the period (1.3) (0.4) (0.9)
Net financial debt (1.6) (1.1) (0.5) (0.1)
Equity 16.8 18.2 (1.4) 18.1
Number of employees at the reporting date 225 243 (18) 233
Pininfarina Shanghai Co Ltd
€’million 30.09.2018 30.09.2017 Variation 31.12.2017
Revenue 5.1 2.9 2.2
Operating profit 1.1 0.3 0.8
Profit for the period 0.8 0.2 0.6
Net financial position 1.0 0.2 0.8 0.8
Equity 1.8 0.8 1.0 1.0
Number of employees at the reporting date 37 31 6 34
Pininfarina Extra Group
€’million 30.09.2018 30.09.2017 Variation 31.12.2017
Revenue 6.6 6.1 0.5
Operating profit 1.3 1.2 0.1
Profit for the period 1.1 1.0 0.1
Net financial position 4.4 3.7 0.7 3.8
Equity 7.6 6.6 1.0 7.2
Number of employees at the reporting date 41 39 2 40
(*) commenced operations on 1 July 2018

11
Reclassified income statement
(€’000)
(*) Materials and services are net of utilisations of the provisions for product warranty and risks (€1.3 thousand and €2.9 thousand for the first nine months of 2017 and 2018, respectively). (**) Labour cost is net of utilisations of the restructuring provision (€6.9 thousand and €42.4 thousand for the first nine months of 2017 and 2018, respectively). As required by Consob resolution no. DEM/6064293 of 28 July 2006, a reconciliation of the data in the condensed interim consolidated financial statements with those in the reclassified schedules is provided below: - Materials and services include raw materials and components, other variable production costs, external variable
engineering services, exchange rate gains and losses and other expenses. - Amortisation and depreciation comprise amortisation of intangible assets and depreciation of property, plant and
equipment and investment property. - (Additions to)/utilisation of provisions and impairment losses include additions to/utilisation of provisions, impairment
losses and inventory write-downs. - Net financial expense comprises net financial expense and dividends.
30.09.2018 % 30.09.2017 % Variation 2017
Revenue from sales and services 69,456 89.04 55,212 88.91 14,244 79,642
Change in inventories and contract work in progress 2,752 3.53 1,343 2.16 1,409 50
Other revenue and income 5,797 7.43 5,546 8.93 251 7,410
Revenue 78,005 100.00 62,101 100.00 15,904 87,102
Net gains on the sale of non-current assets 184 0.24 1 - 183 137
Materials and services (*) (32,915) (42.20) (24,554) (39.54) (8,361) (35,245)
Change in raw materials 65 0.08 69 0.11 (4) 85
Value added 45,339 58.12 37,617 60.57 7,722 52,079
Labour cost (**) (37,305) (47.82) (33,023) (53.18) (4,282) (44,596)
Gross operating profit 8,034 10.30 4,594 7.39 3,440 7,483
Amortisation and depreciation (2,655) (3.41) (2,281) (3.67) (374) (3,023)
(Additions to)/utilisation of provisions and impairment losses (2) 0.00 (12) (0.02) 10 (232)
Operating profit 5,377 6.89 2,301 3.70 3,076 4,228
Net financial expense (1,748) (2.24) (1,396) (2.25) (352) (2,107)
Gain on the extinguishment of financial liabilities - - - 0.00 - -
Share of profit (loss) of equity-accounted investees (50) (0.06) 10 0.02 (60) 12
Profit before taxes 3,579 4.59 915 1.47 2,664 2,133
Income taxes (868) (1.11) (419) (0.67) (449) (821)
Profit for the period/year 2,711 3.48 496 0.80 2,215 1,312- - - - -
Nine months ended
12
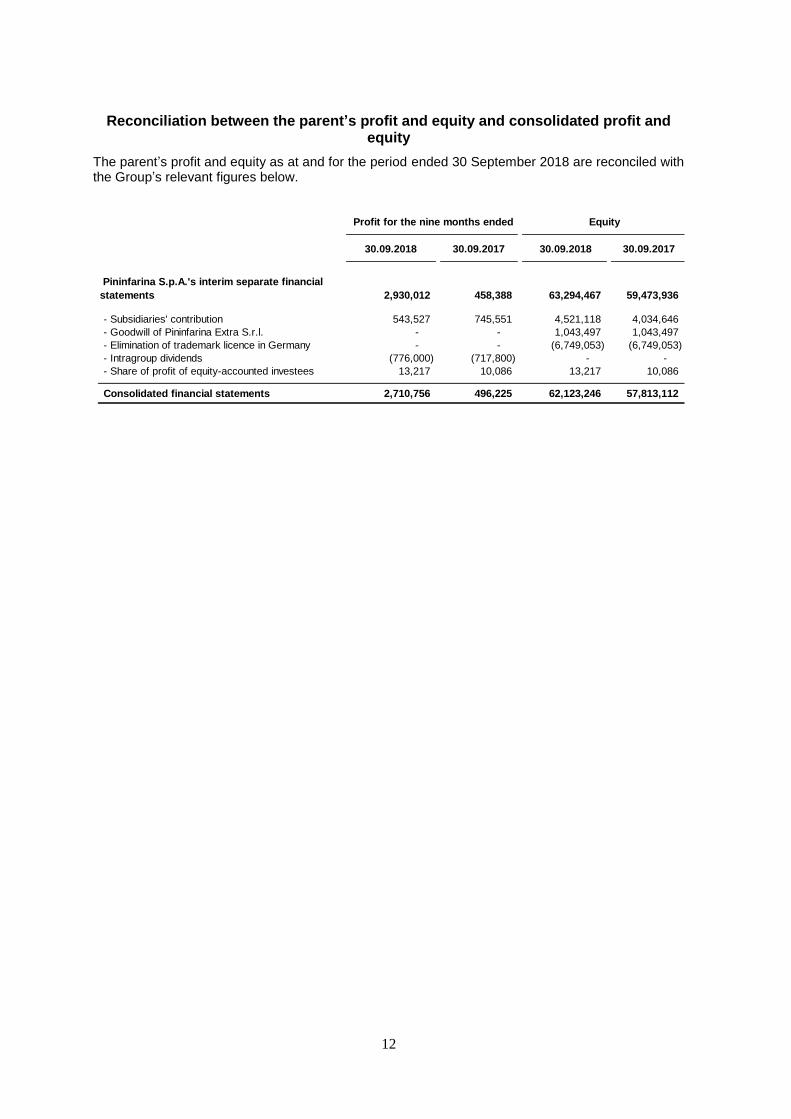
Reconciliation between the parent’s profit and equity and consolidated profit and equity
The parent’s profit and equity as at and for the period ended 30 September 2018 are reconciled with the Group’s relevant figures below.
30.09.2018 30.09.2017 30.09.2018 30.09.2017
Pininfarina S.p.A.'s interim separate financial
statements 2,930,012 458,388 63,294,467 59,473,936
- Subsidiaries' contribution 543,527 745,551 4,521,118 4,034,646
- Goodwill of Pininfarina Extra S.r.l. - - 1,043,497 1,043,497
- Elimination of trademark licence in Germany - - (6,749,053) (6,749,053)
- Intragroup dividends (776,000) (717,800) - -
- Share of profit of equity-accounted investees 13,217 10,086 13,217 10,086
Consolidated financial statements 2,710,756 496,225 62,123,246 57,813,112
Profit for the nine months ended Equity
13
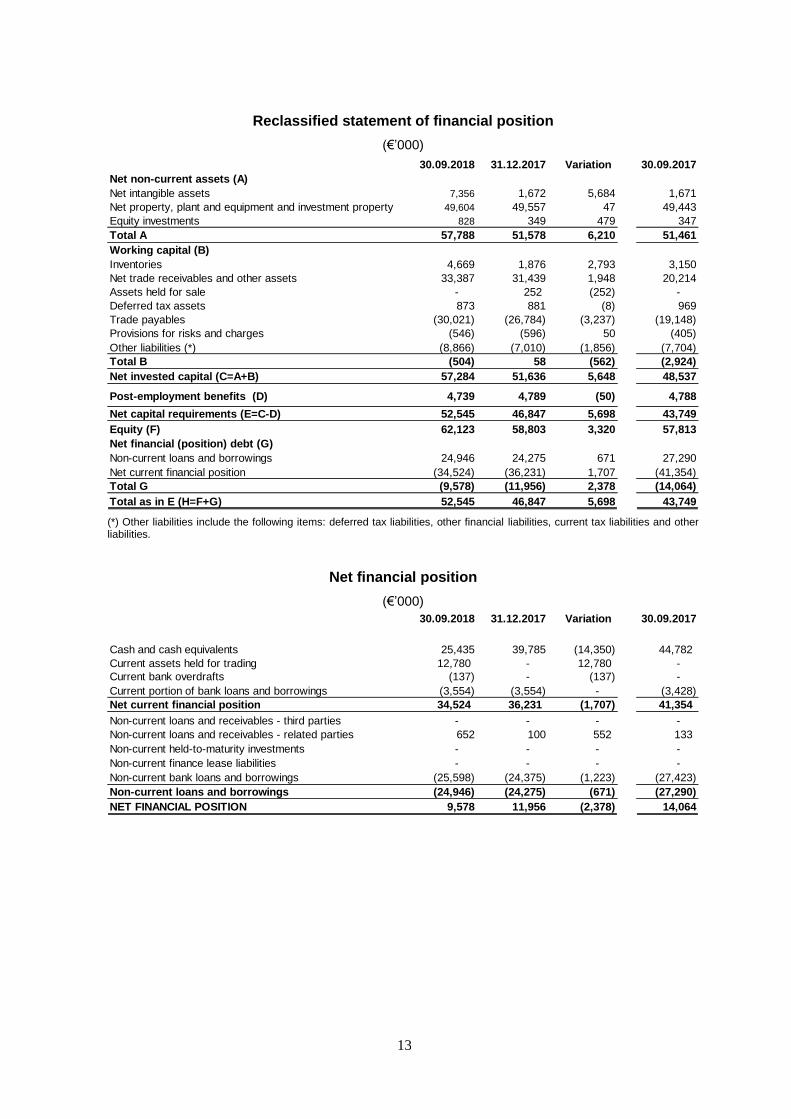
Reclassified statement of financial position
(€’000)
(*) Other liabilities include the following items: deferred tax liabilities, other financial liabilities, current tax liabilities and other liabilities.
Net financial position
(€’000)
30.09.2018 31.12.2017 Variation 30.09.2017
Net non-current assets (A)
Net intangible assets 7,356 1,672 5,684 1,671
Net property, plant and equipment and investment property 49,604 49,557 47 49,443
Equity investments 828 349 479 347
Total A 57,788 51,578 6,210 51,461
Working capital (B)
Inventories 4,669 1,876 2,793 3,150
Net trade receivables and other assets 33,387 31,439 1,948 20,214
Assets held for sale - 252 (252) -
Deferred tax assets 873 881 (8) 969
Trade payables (30,021) (26,784) (3,237) (19,148)
Provisions for risks and charges (546) (596) 50 (405)
Other liabilities (*) (8,866) (7,010) (1,856) (7,704)
Total B (504) 58 (562) (2,924)
Net invested capital (C=A+B) 57,284 51,636 5,648 48,537
Post-employment benefits (D) 4,739 4,789 (50) 4,788
Net capital requirements (E=C-D) 52,545 46,847 5,698 43,749
Equity (F) 62,123 58,803 3,320 57,813
Net financial (position) debt (G)
Non-current loans and borrowings 24,946 24,275 671 27,290
Net current financial position (34,524) (36,231) 1,707 (41,354)
Total G (9,578) (11,956) 2,378 (14,064)
Total as in E (H=F+G) 52,545 46,847 5,698 43,749
30.09.2018 31.12.2017 Variation 30.09.2017
Cash and cash equivalents 25,435 39,785 (14,350) 44,782
Current assets held for trading 12,780 - 12,780 -
Current bank overdrafts (137) - (137) -
Current portion of bank loans and borrowings (3,554) (3,554) - (3,428)
Net current financial position 34,524 36,231 (1,707) 41,354
Non-current loans and receivables - third parties - - - -
Non-current loans and receivables - related parties 652 100 552 133
Non-current held-to-maturity investments - - - -
Non-current finance lease liabilities - - - -
Non-current bank loans and borrowings (25,598) (24,375) (1,223) (27,423)
Non-current loans and borrowings (24,946) (24,275) (671) (27,290)
NET FINANCIAL POSITION 9,578 11,956 (2,378) 14,064

14
Net financial position (Consob) (CESR recommendations no. 05-04b – EU Regulation no. 809/2004)
(€’000)
The “Net financial position” set out above is presented in accordance with the format recommended by Consob in Communication DEM no. 6064293 of 28 July 2006, implementing CESR (now ESMA) recommendation no. 05-04b. Because the purpose of this table is to show “Net financial debt”, assets are shown with a minus sign and liabilities with a plus sign. On the contrary, in the “Net financial position” table provided on the previous page, assets are shown with a plus sign and liabilities with a minus sign. The reason for the difference between the amount of the “Net financial position” on the previous page and on this page is that the latter does not include non-current loan assets. The total amount of these differences at the relevant reporting dates is shown below:
- At 30 September 2018: €652 thousand - At 31 December 2017: €100 thousand - At 30 September 2017: €133 thousand
30.09.2018 31.12.2017 Variation 30.09.2017
A. Cash (25,435) (39,785) 14,350 (44,782)
B. Other cash equivalents - - - -
C. Securities held for trading (12,780) - (12,780) -
D. Total cash and cash equivalents (A.)+(B.)+(C.) (38,215) (39,785) 1,570 (44,782)
E. Current loan assets - - - -
F. Current bank loans and borrowings 137 - 137 -
Current portion of secured bank loans 60 60 - 60
Current portion of unsecured bank loans 3,494 3,494 - 3,368
G. Current portion of non-current debt 3,554 3,554 - 3,428
H. Other current loans and borrowings - - - -
I. Current financial debt (F.)+(G.)+(H.) 3,691 3,554 137 3,428
J. Net current financial position (34,524) (36,231) 1,707 (41,354)
Non-current portion of secured bank loans 105 150 (45) 165
Non-current portion of unsecured bank loans 25,493 24,225 1,268 27,258
K. Non-current bank loans and borrowings 25,598 24,375 1,223 27,423
L. Bonds issued - - - -
M. Other non-current loans and borrowings - - - -
N. Net non-current financial debt (K.)+(L.)+(M.) 25,598 24,375 1,223 27,423
O. Net financial position (J+N) (8,926) (11,856) 2,930 (13,931)

15
Pininfarina Group
Condensed interim consolidated financial statements
as at and for the nine months ended 30 September 2018

16
Statement of financial position
Note 30.09.2018 31.12.2017
Land and buildings 1 33,977,736 34,629,271
Land 7,655,314 7,655,314
Buildings 26,322,422 26,973,957
Leased property - -
Plant and machinery 1 5,197,158 4,806,912
Machinery 1,688,581 1,425,392
Plant 3,508,577 3,381,520
Leased machinery and equipment - -
Furniture, fixtures and other assets 1 2,692,813 2,120,014
Furniture and fixtures 899,011 886,083
Hardware and software 1,189,561 700,913
Other assets, including vehicles 604,241 533,018
Assets under construction 257,704 248,803
Property, plant and equipment 42,125,411 41,805,000
Investment property 2 7,478,640 7,751,920
Goodwill 3 1,043,495 1,043,495
Licences and trademarks 3 701,560 554,097
Other 3 5,610,870 74,653
Intangible assets 7,355,925 1,672,245
Associates 4 576,121 96,694
Joint ventures - -
Other companies 5 252,017 252,017
Equity investments 828,138 348,711
Deferred tax assets 17 873,703 880,553
Held-to-maturity investments - -
Loans and receivables 6 652,138 100,470
Third parties - -
Related parties 652,138 100,470
Available-for-sale financial assets - -
Non-current financial assets 652,138 100,470
TOTAL NON-CURRENT ASSETS 59,313,955 52,558,899
Raw materials 265,803 200,895
Work in progress - -
Finished goods 211,369 191,854
Inventories 7 477,172 392,749
Contract work in progress 8 4,191,753 1,483,347
Assets held for trading 9 12,779,511 -
Loans and receivables - -
Third parties - -
Related parties - -
Available-for-sale financial assets - -
Current financial assets 12,779,511 -
Derivatives - -
Trade receivables 10 24,106,378 17,988,325
Third parties 18,243,342 17,366,866
Related parties 5,863,036 621,459
Other assets 11 9,280,923 13,450,528
Trade receivables and other assets 33,387,301 31,438,853
Cash in hand and cash equivalents 14,842 17,254
Short-term bank deposits 25,420,635 39,767,360
Cash and cash equivalents 12 25,435,477 39,784,614
TOTAL CURRENT ASSETS 76,271,214 73,099,563
Assets held for sale - 252,426
TOTAL ASSETS 135,585,169 125,910,888
17
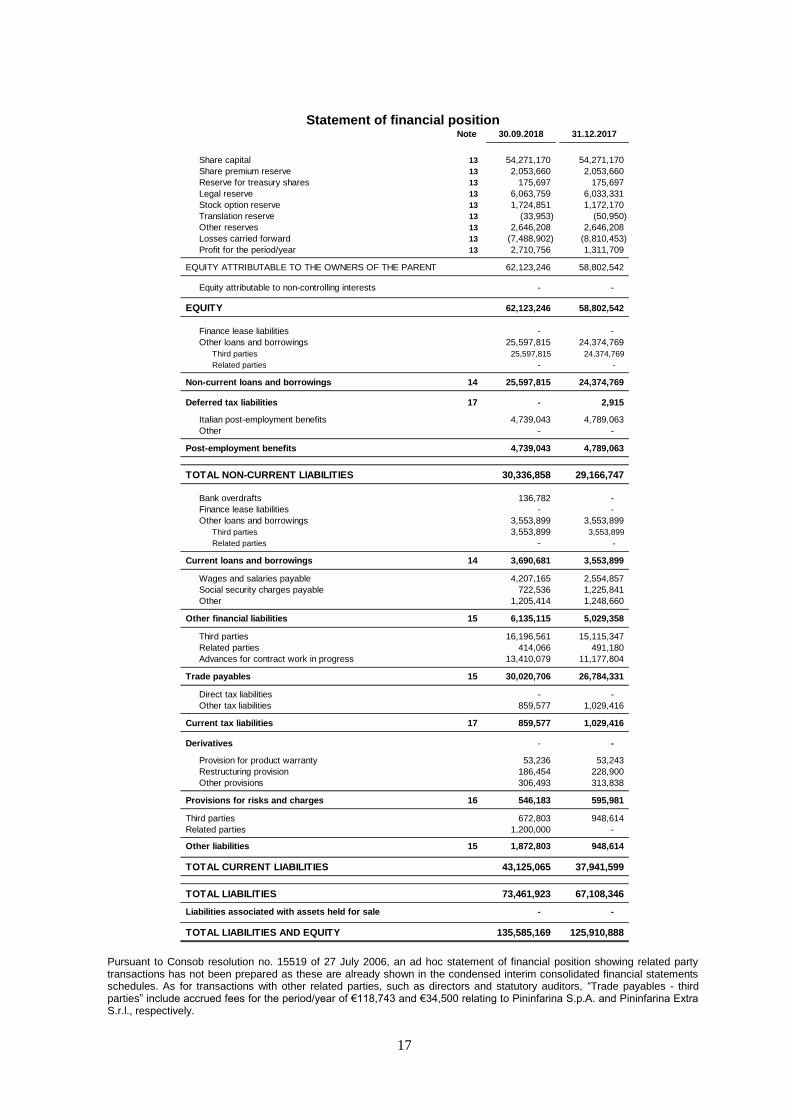
Statement of financial position
Pursuant to Consob resolution no. 15519 of 27 July 2006, an ad hoc statement of financial position showing related party transactions has not been prepared as these are already shown in the condensed interim consolidated financial statements schedules. As for transactions with other related parties, such as directors and statutory auditors, “Trade payables - third parties” include accrued fees for the period/year of €118,743 and €34,500 relating to Pininfarina S.p.A. and Pininfarina Extra S.r.l., respectively.
Note 30.09.2018 31.12.2017
Share capital 13 54,271,170 54,271,170
Share premium reserve 13 2,053,660 2,053,660
Reserve for treasury shares 13 175,697 175,697
Legal reserve 13 6,063,759 6,033,331
Stock option reserve 13 1,724,851 1,172,170
Translation reserve 13 (33,953) (50,950)
Other reserves 13 2,646,208 2,646,208
Losses carried forward 13 (7,488,902) (8,810,453)
Profit for the period/year 13 2,710,756 1,311,709
EQUITY ATTRIBUTABLE TO THE OWNERS OF THE PARENT 62,123,246 58,802,542
Equity attributable to non-controlling interests - -
EQUITY 62,123,246 58,802,542
Finance lease liabilities - -
Other loans and borrowings 25,597,815 24,374,769
Third parties 25,597,815 24,374,769
Related parties - -
Non-current loans and borrowings 14 25,597,815 24,374,769
Deferred tax liabilities 17 - 2,915
Italian post-employment benefits 4,739,043 4,789,063
Other - -
Post-employment benefits 4,739,043 4,789,063
TOTAL NON-CURRENT LIABILITIES 30,336,858 29,166,747
Bank overdrafts 136,782 -
Finance lease liabilities - -
Other loans and borrowings 3,553,899 3,553,899
Third parties 3,553,899 3,553,899
Related parties - -
Current loans and borrowings 14 3,690,681 3,553,899
Wages and salaries payable 4,207,165 2,554,857
Social security charges payable 722,536 1,225,841
Other 1,205,414 1,248,660
Other financial liabilities 15 6,135,115 5,029,358
Third parties 16,196,561 15,115,347
Related parties 414,066 491,180
Advances for contract work in progress 13,410,079 11,177,804
Trade payables 15 30,020,706 26,784,331
Direct tax liabilities - -
Other tax liabilities 859,577 1,029,416
Current tax liabilities 17 859,577 1,029,416
Derivatives - -
Provision for product warranty 53,236 53,243
Restructuring provision 186,454 228,900
Other provisions 306,493 313,838
Provisions for risks and charges 16 546,183 595,981
Third parties 672,803 948,614
Related parties 1,200,000 -
Other liabilities 15 1,872,803 948,614
TOTAL CURRENT LIABILITIES 43,125,065 37,941,599
TOTAL LIABILITIES 73,461,923 67,108,346
Liabilities associated with assets held for sale - -
TOTAL LIABILITIES AND EQUITY 135,585,169 125,910,888
18
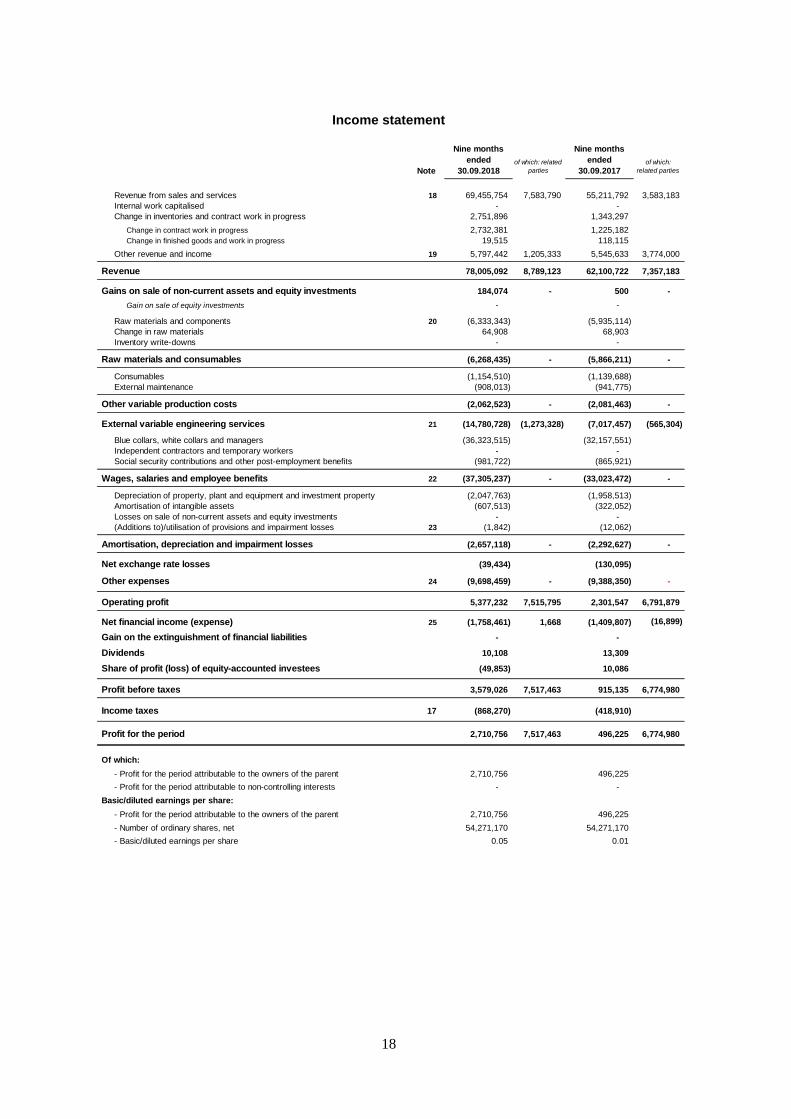
Income statement
Note
Nine months
ended
30.09.2018of which: related
parties
Nine months
ended
30.09.2017of which:
related parties
Revenue from sales and services 18 69,455,754 7,583,790 55,211,792 3,583,183
Internal work capitalised - -
Change in inventories and contract work in progress 2,751,896 1,343,297
Change in contract work in progress 2,732,381 1,225,182
Change in finished goods and work in progress 19,515 118,115
Other revenue and income 19 5,797,442 1,205,333 5,545,633 3,774,000 - -
Revenue 78,005,092 8,789,123 62,100,722 7,357,183 -
Gains on sale of non-current assets and equity investments 184,074 - 500 - -
Gain on sale of equity investments - -
Raw materials and components 20 (6,333,343) (5,935,114)
Change in raw materials 64,908 68,903
Inventory write-downs - - - -
Raw materials and consumables (6,268,435) - (5,866,211) - - -
Consumables (1,154,510) (1,139,688)
External maintenance (908,013) (941,775) - -
Other variable production costs (2,062,523) - (2,081,463) -
External variable engineering services 21 (14,780,728) (1,273,328) (7,017,457) (565,304)
Blue collars, white collars and managers (36,323,515) (32,157,551)
Independent contractors and temporary workers - -
Social security contributions and other post-employment benefits (981,722) (865,921) - -
Wages, salaries and employee benefits 22 (37,305,237) - (33,023,472) - - -
Depreciation of property, plant and equipment and investment property (2,047,763) (1,958,513)
Amortisation of intangible assets (607,513) (322,052)
Losses on sale of non-current assets and equity investments - -
(Additions to)/utilisation of provisions and impairment losses 23 (1,842) (12,062) - -
Amortisation, depreciation and impairment losses (2,657,118) - (2,292,627) - -
Net exchange rate losses (39,434) (130,095)
Other expenses 24 (9,698,459) - (9,388,350) - -
Operating profit 5,377,232 7,515,795 2,301,547 6,791,879
Net financial income (expense) 25 (1,758,461) 1,668 (1,409,807) (16,899)
Gain on the extinguishment of financial liabilities - - - -
Dividends 10,108 13,309
Share of profit (loss) of equity-accounted investees (49,853) 10,086
Profit before taxes 3,579,026 7,517,463 915,135 6,774,980
Income taxes 17 (868,270) (418,910)
Profit for the period 2,710,756 7,517,463 496,225 6,774,980
Of which:
- Profit for the period attributable to the owners of the parent 2,710,756 496,225 -
- Profit for the period attributable to non-controlling interests - -
Basic/diluted earnings per share:
- Profit for the period attributable to the owners of the parent 2,710,756 496,225
- Number of ordinary shares, net 54,271,170 54,271,170
- Basic/diluted earnings per share 0.05 0.01

19
Statement of comprehensive income
Pursuant to Consob resolution no. 15519 of 27 July 2006, the effects of related party transactions on the income statement of the Pininfarina Group are shown in the table provided above and in the “Other Information” section of the notes.
Nine months
ended
30.09.2018
Nine months
ended
30.09.2017
Profit for the period 2,710,756 496,225
Other comprehensive income (expense):
Items that will not be reclassified to profit or loss:
- Actuarial gains on defined benefit plans - IAS 19 46,633 8,242
- Income taxes (6,363) (269)
- Other - -
Total items of other comprehensive income (expense) that will not be
reclassified to profit or loss, net of tax effect:
Items that will or may be subsequently reclassified
to profit or loss:
- Gains (losses) from translation of financial statements of foreign operations - IAS 21 16,997 (157,514)
- Other - -
Total items of other comprehensive income (expense) that will be subsequently
reclassified to profit or loss, net of tax effect:
Total other comprehensive income (expense), net of tax effect 57,267 (149,541)
Comprehensive income 2,768,023 346,684
Of which:
- Comprehensive income attributable to the owners of the parent 2,768,023 346,684
- Comprehensive income attributable to non-controlling interests - -
Of which:
- Comprehensive income from continuing operations 2,768,023 346,684
- Comprehensive income from discontinued operations - -
40,270 7,973
16,997 (157,514)
20
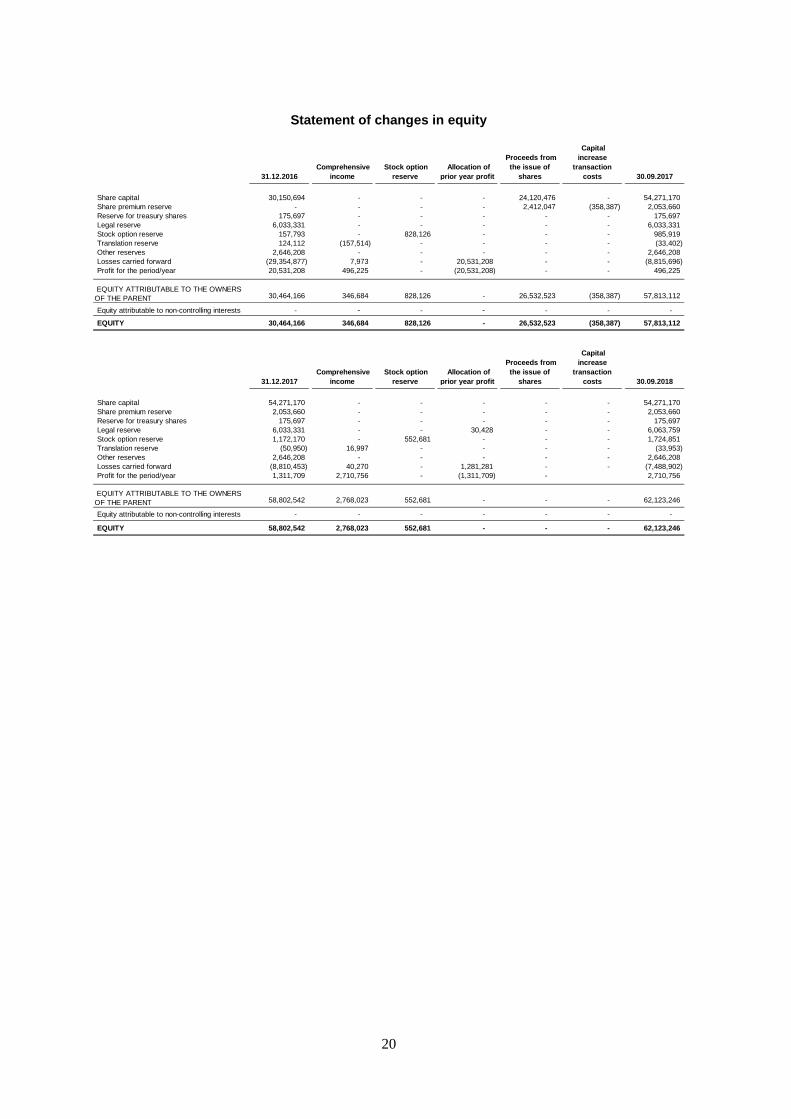
Statement of changes in equity
31.12.2016
Comprehensive
income
Stock option
reserve
Allocation of
prior year profit
Proceeds from
the issue of
shares
Capital
increase
transaction
costs 30.09.2017
Share capital 30,150,694 - - - 24,120,476 - 54,271,170
Share premium reserve - - - - 2,412,047 (358,387) 2,053,660
Reserve for treasury shares 175,697 - - - - - 175,697
Legal reserve 6,033,331 - - - - - 6,033,331
Stock option reserve 157,793 - 828,126 - - - 985,919
Translation reserve 124,112 (157,514) - - - - (33,402)
Other reserves 2,646,208 - - - - - 2,646,208
Losses carried forward (29,354,877) 7,973 - 20,531,208 - - (8,815,696)
Profit for the period/year 20,531,208 496,225 - (20,531,208) - - 496,225
30,464,166 346,684 828,126 - 26,532,523 (358,387) 57,813,112
Equity attributable to non-controlling interests - - - - - - -
EQUITY 30,464,166 346,684 828,126 - 26,532,523 (358,387) 57,813,112
31.12.2017
Comprehensive
income
Stock option
reserve
Allocation of
prior year profit
Proceeds from
the issue of
shares
Capital
increase
transaction
costs 30.09.2018
Share capital 54,271,170 - - - - - 54,271,170
Share premium reserve 2,053,660 - - - - - 2,053,660
Reserve for treasury shares 175,697 - - - - - 175,697
Legal reserve 6,033,331 - - 30,428 - - 6,063,759
Stock option reserve 1,172,170 - 552,681 - - - 1,724,851
Translation reserve (50,950) 16,997 - - - - (33,953)
Other reserves 2,646,208 - - - - - 2,646,208
Losses carried forward (8,810,453) 40,270 - 1,281,281 - - (7,488,902)
Profit for the period/year 1,311,709 2,710,756 - (1,311,709) - 2,710,756
58,802,542 2,768,023 552,681 - - - 62,123,246 -
Equity attributable to non-controlling interests - - - - - - -
EQUITY 58,802,542 2,768,023 552,681 - - - 62,123,246
EQUITY ATTRIBUTABLE TO THE OWNERS
OF THE PARENT
EQUITY ATTRIBUTABLE TO THE OWNERS
OF THE PARENT
21
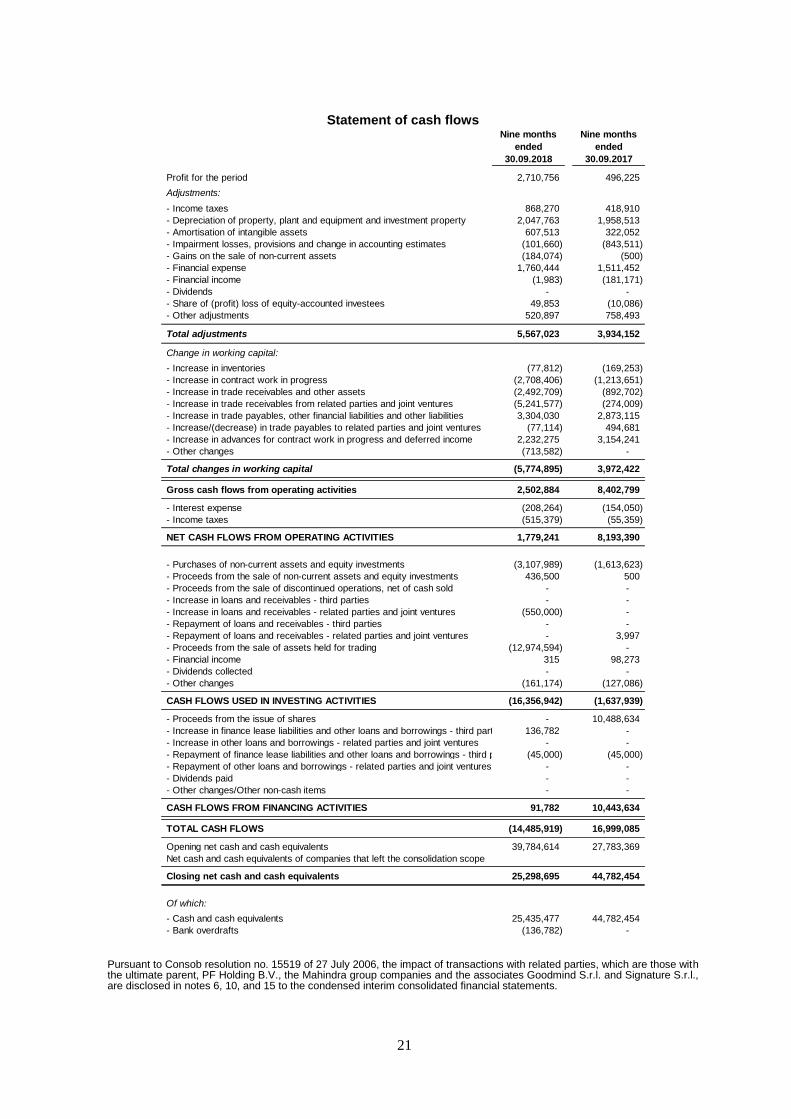
Statement of cash flows
Pursuant to Consob resolution no. 15519 of 27 July 2006, the impact of transactions with related parties, which are those with the ultimate parent, PF Holding B.V., the Mahindra group companies and the associates Goodmind S.r.l. and Signature S.r.l., are disclosed in notes 6, 10, and 15 to the condensed interim consolidated financial statements.
Nine months
ended
30.09.2018
Nine months
ended
30.09.2017
Profit for the period 2,710,756 496,225
Adjustments:
- Income taxes 868,270 418,910
- Depreciation of property, plant and equipment and investment property 2,047,763 1,958,513
- Amortisation of intangible assets 607,513 322,052
- Impairment losses, provisions and change in accounting estimates (101,660) (843,511)
- Gains on the sale of non-current assets (184,074) (500)
- Financial expense 1,760,444 1,511,452
- Financial income (1,983) (181,171)
- Dividends - -
- Share of (profit) loss of equity-accounted investees 49,853 (10,086)
- Other adjustments 520,897 758,493
Total adjustments 5,567,023 3,934,152
Change in working capital:
- Increase in inventories (77,812) (169,253)
- Increase in contract work in progress (2,708,406) (1,213,651)
- Increase in trade receivables and other assets (2,492,709) (892,702)
- Increase in trade receivables from related parties and joint ventures (5,241,577) (274,009)
- Increase in trade payables, other financial liabilities and other liabilities 3,304,030 2,873,115
- Increase/(decrease) in trade payables to related parties and joint ventures (77,114) 494,681
- Increase in advances for contract work in progress and deferred income 2,232,275 3,154,241
- Other changes (713,582) -
Total changes in working capital (5,774,895) 3,972,422
Gross cash flows from operating activities 2,502,884 8,402,799
- Interest expense (208,264) (154,050)
- Income taxes (515,379) (55,359)
NET CASH FLOWS FROM OPERATING ACTIVITIES 1,779,241 8,193,390
- Purchases of non-current assets and equity investments (3,107,989) (1,613,623)
- Proceeds from the sale of non-current assets and equity investments 436,500 500
- Proceeds from the sale of discontinued operations, net of cash sold - -
- Increase in loans and receivables - third parties - -
- Increase in loans and receivables - related parties and joint ventures (550,000) -
- Repayment of loans and receivables - third parties - -
- Repayment of loans and receivables - related parties and joint ventures - 3,997
- Proceeds from the sale of assets held for trading (12,974,594) -
- Financial income 315 98,273
- Dividends collected - -
- Other changes (161,174) (127,086)
CASH FLOWS USED IN INVESTING ACTIVITIES (16,356,942) (1,637,939)
- Proceeds from the issue of shares - 10,488,634
- Increase in finance lease liabilities and other loans and borrowings - third parties 136,782 -
- Increase in other loans and borrowings - related parties and joint ventures - -
- Repayment of finance lease liabilities and other loans and borrowings - third parties (45,000) (45,000)
- Repayment of other loans and borrowings - related parties and joint ventures - -
- Dividends paid - -
- Other changes/Other non-cash items - -
CASH FLOWS FROM FINANCING ACTIVITIES 91,782 10,443,634
TOTAL CASH FLOWS (14,485,919) 16,999,085
Opening net cash and cash equivalents 39,784,614 27,783,369
Net cash and cash equivalents of companies that left the consolidation scope
Closing net cash and cash equivalents 25,298,695 44,782,454
Of which:
- Cash and cash equivalents 25,435,477 44,782,454
- Bank overdrafts (136,782) -
22
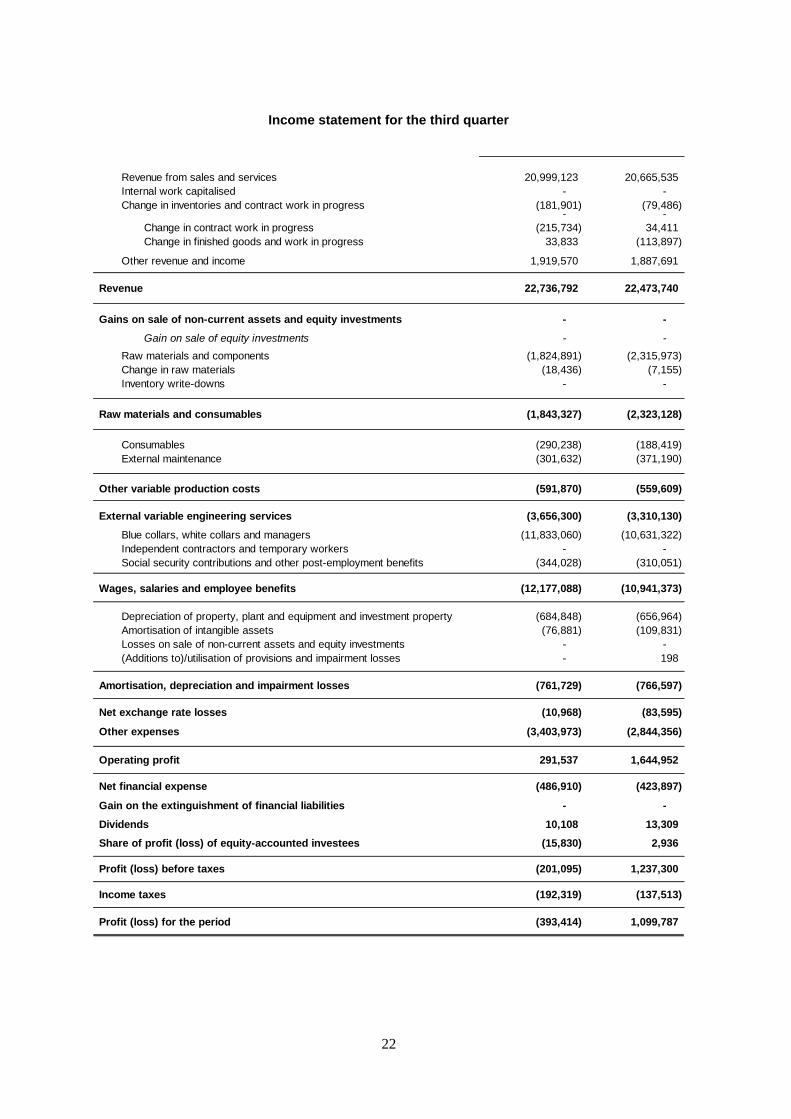
Income statement for the third quarter
Revenue from sales and services 20,999,123 20,665,535
Internal work capitalised - -
Change in inventories and contract work in progress (181,901) (79,486) - -
Change in contract work in progress (215,734) 34,411
Change in finished goods and work in progress 33,833 (113,897) - -
Other revenue and income 1,919,570 1,887,691
Revenue 22,736,792 22,473,740
Gains on sale of non-current assets and equity investments - -
Gain on sale of equity investments - -
Raw materials and components (1,824,891) (2,315,973)
Change in raw materials (18,436) (7,155)
Inventory write-downs - -
Raw materials and consumables (1,843,327) (2,323,128)
Consumables (290,238) (188,419)
External maintenance (301,632) (371,190)
Other variable production costs (591,870) (559,609)
External variable engineering services (3,656,300) (3,310,130)
Blue collars, white collars and managers (11,833,060) (10,631,322)
Independent contractors and temporary workers - -
Social security contributions and other post-employment benefits (344,028) (310,051)
Wages, salaries and employee benefits (12,177,088) (10,941,373)
Depreciation of property, plant and equipment and investment property (684,848) (656,964)
Amortisation of intangible assets (76,881) (109,831)
Losses on sale of non-current assets and equity investments - -
(Additions to)/utilisation of provisions and impairment losses - 198
Amortisation, depreciation and impairment losses (761,729) (766,597)
Net exchange rate losses (10,968) (83,595)
Other expenses (3,403,973) (2,844,356)
Operating profit 291,537 1,644,952
Net financial expense (486,910) (423,897)
Gain on the extinguishment of financial liabilities - -
Dividends 10,108 13,309
Share of profit (loss) of equity-accounted investees (15,830) 2,936
Profit (loss) before taxes (201,095) 1,237,300
Income taxes (192,319) (137,513)
Profit (loss) for the period (393,414) 1,099,787 - -

23
Statement of comprehensive income for the third quarter
Q3 2018 Q3 2017
Profit (loss) for the period (393,414) 1,099,787
Other comprehensive expense:
Items that will not be reclassified to profit or loss:
- Actuarial gains (losses) on defined benefit plans - IAS 19 25,068 (37,076)
- Income taxes (1,914) 2,985
- Other - -
Total items of other comprehensive expense that will not be 23,154 (34,091)
reclassified to profit or loss, net of tax effect:
Items that will or may be subsequently reclassified
to profit or loss:
- Losses from translation of financial statements of foreign operations - IAS 21 (32,265) (43,650)
- Other - -
Total items of other comprehensive expense that will be subsequently (32,265) (43,650)
reclassified to profit or loss, net of tax effect:
Total other comprehensive expense, net of tax effect (9,111) (77,741)
Comprehensive income (expense) (402,525) 1,022,046
Of which:
- Comprehensive income (expense) attributable to the owners of the parent (402,525) 1,022,046
- Comprehensive income (expense) attributable to non-controlling interests - -
Of which:
- Comprehensive income (expense) from continuing operations (402,525) 1,022,046
- Comprehensive income (expense) from discontinued operations - -

24
Notes to the condensed interim consolidated financial statements GENERAL INFORMATION Foreword The core business of the Pininfarina Group (the “Group”) is based on the establishment of comprehensive partnerships with carmakers. Operating as a global partner enables it to work with customers through the entire process of developing new products, including design, planning, development, industrialisation and manufacturing, or to provide support separately during any one of these phases with the utmost flexibility. Pininfarina S.p.A., the Group’s parent, is listed on the Italian Stock Exchange. Its registered office is in Via Bruno Buozzi 6, Turin. Market investors own 23.82% of its share capital, with the remaining 76.18% held by the following shareholders:
PF Holdings BV 76.15%;
treasury shares held by Pininfarina S.p.A. 0.03%.
A list of the group companies, with their complete name and address, is provided later on. The condensed interim consolidated financial statements are presented in Euros, the functional and presentation currency of the parent, where most of the activities and consolidated revenue are concentrated, and its main subsidiaries. All amounts are presented in Euros, unless stated otherwise. The Board of Directors approved these condensed interim consolidated financial statements on 13 November 2018. They were authorised for publication within the legal terms. Basis of presentation In accordance with IAS 1 - Presentation of Financial Statements, the condensed interim consolidated financial statements are the same as those of the parent. They include the following schedules:
statement of financial position, in which current and non-current assets and liabilities are classified separately;
income statement and statement of comprehensive income, shown as two separate schedules in which costs are classified by nature;
statement of cash flows, presented in accordance with the indirect method, as allowed by IAS 7 - Statement of cash flows;
statement of changes in equity. These schedules present the corresponding prior year annual or interim figures for comparative purposes. In accordance with IAS 34 - Interim Financial Reporting, the notes to the condensed interim consolidated financial statements are presented in a condensed format and do not include all the disclosure required for annual financial statements, since they cover only those items that, because of their amount, composition or change, are deemed essential to understand the Group’s financial performance, financial position and cash flows. Consequently, these condensed interim consolidated financial statements should be read in conjunction with the 2017 annual consolidated financial statements.

25
Moreover, as required by Consob resolution no. 15519 of 28 July 2006, the Group presents the following information in separate schedules:
net financial position, with a breakdown of the main components and balances with related parties (page 13 of the directors’ report);
the effects of non-recurring events or transactions, i.e., those transactions or events that are not repeated frequently in the normal course of business (pages 51 and 52).
Related party transactions are not presented in separate schedules because they are listed as separate items in the statement of financial position (pages 16 and 17). Basis of preparation These condensed interim consolidated financial statements are prepared on a going concern basis, which the directors deemed appropriate. They comply with the International Financial Reporting Standards (“IFRS”) issued by the International Accounting Standards Board (“IASB”) and endorsed by the European Union. They are also consistent with the regulations enacted to implement article 9 of Legislative decree no. 38/2005. The term IFRS includes the International Financial Reporting Standards, the International Accounting Standards (“IAS”) and all interpretations of the International Financial Reporting Interpretations Committee (“IFRIC”), previously called the Standing Interpretations Committee (“SIC”), endorsed by the European Commission as of the date of the Board of Directors’ meeting convened to approve the condensed interim consolidated financial statements and listed in the applicable regulations published by the European Union as of the above-mentioned date. These condensed interim consolidated financial statements are prepared in accordance with the general principle of historical cost, except for those items that, pursuant to the IFRS, are measured at fair value, as explained in the “Accounting policies” section. The accounting policies adopted to prepare these condensed interim consolidated financial statements at 30 September 2018 are the same as those used in the 2017 annual consolidated financial statements, except as noted in the following section. As part of the process of preparing these condensed interim consolidated financial statements, management was required to make estimates and assumptions, based on the information available as of the date hereof, which have an impact on the carrying amounts of revenue, expenses, assets and liabilities. Should actual circumstances prove to be different from those upon which the estimates and assumptions are based, the accounting effects of the resulting revisions will be recognised in the reporting period when the actual circumstances occur. Moreover, generally speaking, non-current assets are fully tested for impairment only in connection with the preparation of the annual financial statements, unless there are impairment indicators. Post-employment benefits at 30 September 2018 have been measured prospectively.

26
Standards, amendments and interpretations applicable from 1 January 2018 Listed below are the new standards or amendments to existing standards applicable to annual periods beginning on or after 1 January 2018: IFRS 15 - Revenue from contracts with customers IFRS 15 provides a single model to establish if, when and to what extent an entity shall recognise revenue. It replaces the recognition requirements set out in IAS 18 - Revenue, IAS 11 - Construction contracts and IFRIC 13 - Customer loyalty programmes. IFRS 15 is applicable to annual periods beginning on or after 1 January 2018. The Group has applied it from 1 January 2018. It has not had a significant impact on the condensed interim consolidated financial statements. IFRS 9 - Financial instruments The IASB published the definitive version of IFRS 9 - Financial instruments in July 2014. IFRS 9 is applicable to annual periods beginning on or after 1 January 2018. The Group has applied it from 1 January 2018. It has not had a significant impact on the condensed interim consolidated financial statements. New standards published but not yet adopted IFRS 16 - Leases IFRS 16 introduces a single model for recognising leases in lessees’ financial statements, whereby lessees shall recognise an asset representing their right of use to the leased asset and a liability for its obligation to make lease payments. Exemptions are provided for short-term and low value leases. The recognition model for lessors is substantially unchanged from that currently applied, i.e., they continue to classify leases as operating or finance. IFRS 16 supersedes the current requirements for leases, including IAS 17 - Leases, IFRIC 4 - Determining whether an arrangement contains a lease, SIC-15 - Operating leases - Incentives and SIC-27 - Evaluating the substance of transactions involving the legal form of a lease. IFRS 16 will be applicable to annual periods beginning on or after 1 January 2019. Earlier adoption is allowed for entities that apply IFRS 15 at the first adoption date of IFRS 16 or that have already applied it. The Group will apply it from 1 January 2019. The Group is currently assessing the impact of application of the new standard. ACCOUNTING POLICIES Condensed interim consolidated financial statements The condensed interim consolidated financial statements include the interim financial statements of all subsidiaries from the date the Group acquires control until such control ceases to exist. Joint ventures (if any) and associates are measured using the equity method. Intragroup expenses, revenue, receivables, payables, gains and losses are eliminated in the consolidation process. When necessary, the accounting policies of subsidiaries, associates and joint ventures are amended to make them consistent with those of the parent.
27
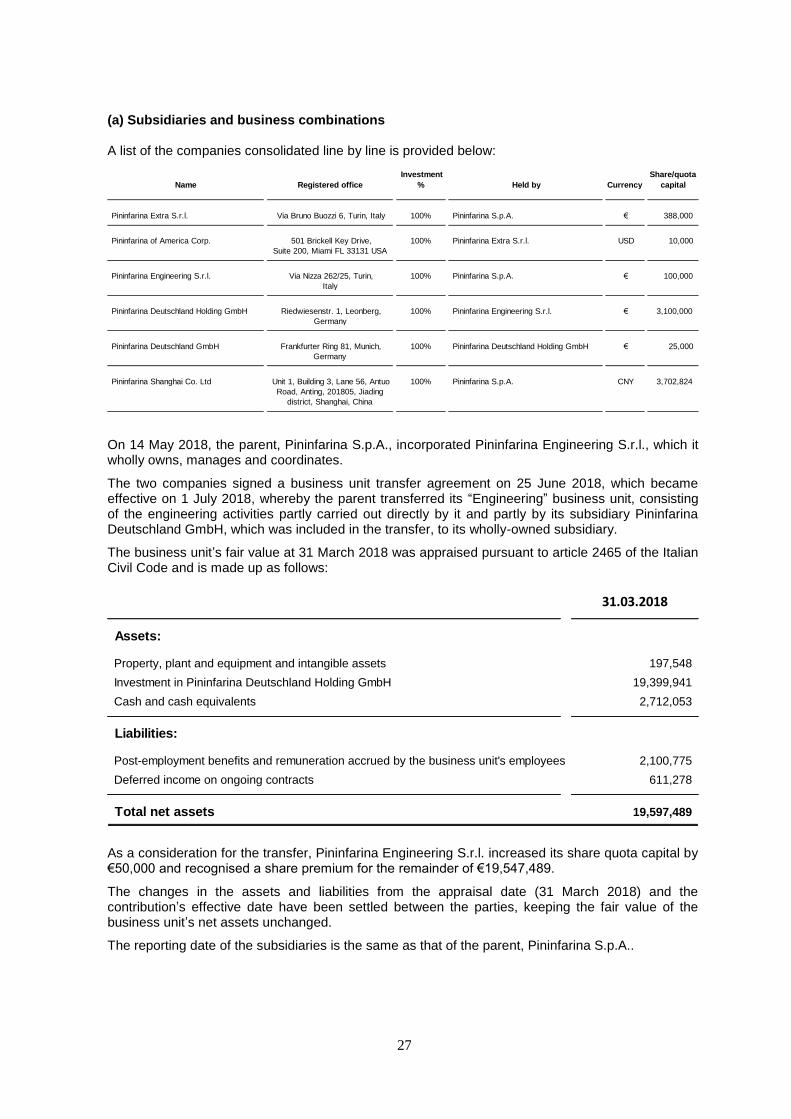
(a) Subsidiaries and business combinations A list of the companies consolidated line by line is provided below:
On 14 May 2018, the parent, Pininfarina S.p.A., incorporated Pininfarina Engineering S.r.l., which it wholly owns, manages and coordinates.
The two companies signed a business unit transfer agreement on 25 June 2018, which became effective on 1 July 2018, whereby the parent transferred its “Engineering” business unit, consisting of the engineering activities partly carried out directly by it and partly by its subsidiary Pininfarina Deutschland GmbH, which was included in the transfer, to its wholly-owned subsidiary.
The business unit’s fair value at 31 March 2018 was appraised pursuant to article 2465 of the Italian Civil Code and is made up as follows:
As a consideration for the transfer, Pininfarina Engineering S.r.l. increased its share quota capital by €50,000 and recognised a share premium for the remainder of €19,547,489.
The changes in the assets and liabilities from the appraisal date (31 March 2018) and the contribution’s effective date have been settled between the parties, keeping the fair value of the business unit’s net assets unchanged.
The reporting date of the subsidiaries is the same as that of the parent, Pininfarina S.p.A..
Name Registered office
Investment
% Held by
Currency
Share/quota
capital
Pininfarina Extra S.r.l. Via Bruno Buozzi 6, Turin, Italy 100% Pininfarina S.p.A. € 388,000
Pininfarina of America Corp. 501 Brickell Key Drive,
Suite 200, Miami FL 33131 USA
100% Pininfarina Extra S.r.l. USD 10,000
Pininfarina Engineering S.r.l. Via Nizza 262/25, Turin,
Italy
100% Pininfarina S.p.A. € 100,000
Pininfarina Deutschland Holding GmbH Riedwiesenstr. 1, Leonberg,
Germany
100% Pininfarina Engineering S.r.l. € 3,100,000
Pininfarina Deutschland GmbH Frankfurter Ring 81, Munich,
Germany
100% Pininfarina Deutschland Holding GmbH € 25,000
Pininfarina Shanghai Co. Ltd Unit 1, Building 3, Lane 56, Antuo
Road, Anting, 201805, Jiading
district, Shanghai, China
100% Pininfarina S.p.A. CNY 3,702,824
31.03.2018
Assets:
Property, plant and equipment and intangible assets 197,548
Investment in Pininfarina Deutschland Holding GmbH 19,399,941
Cash and cash equivalents 2,712,053
Liabilities:
Post-employment benefits and remuneration accrued by the business unit's employees 2,100,775
Deferred income on ongoing contracts 611,278
Total net assets 19,597,489
28
(b) Acquisition/sale of investments subsequent to the acquisition of control
Acquisitions and sales of investments subsequent to the acquisition of control that do not result in a loss of control are accounted for as owner transactions.
In the case of acquisitions, the difference between the consideration paid and the pro rata interest in the carrying amount of the net assets acquired is recognised in equity. In the case of sales, the resulting gain or loss is also recognised directly in equity.
If the Group loses control or significant influence, the remaining non-controlling interest is remeasured at fair value and any positive or negative difference between its carrying amount and fair value is recognised in profit or loss.
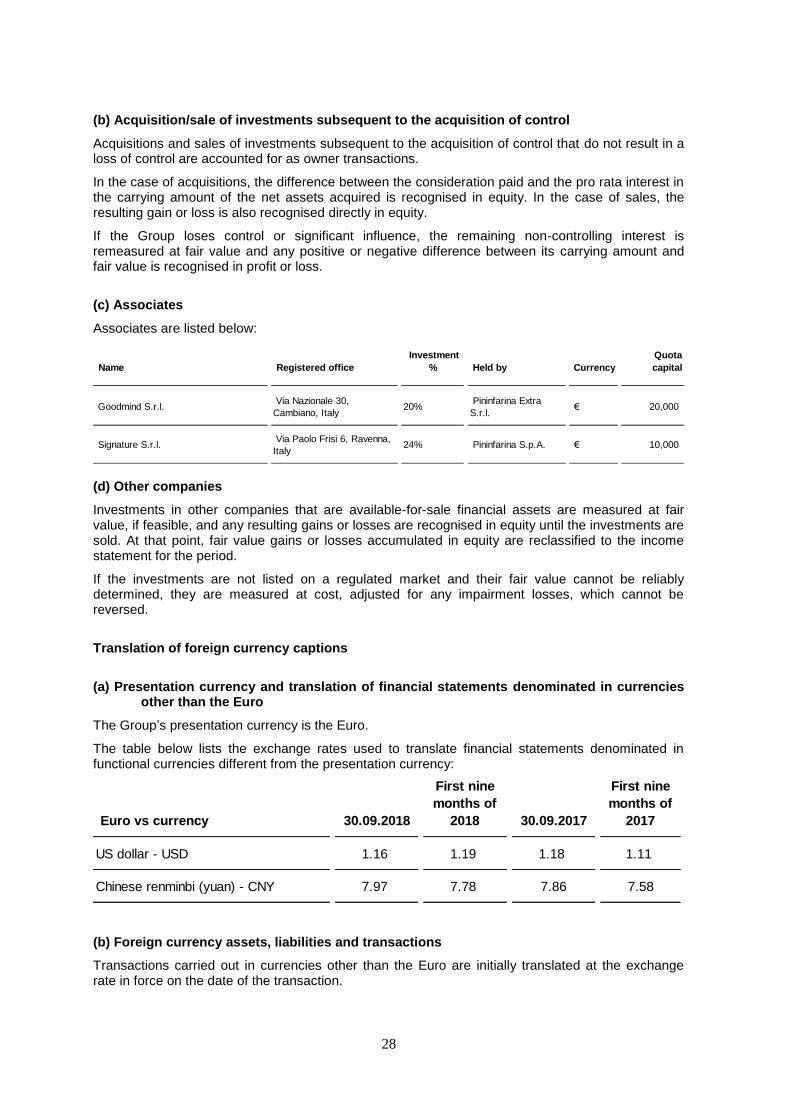
(c) Associates
Associates are listed below:
(d) Other companies
Investments in other companies that are available-for-sale financial assets are measured at fair value, if feasible, and any resulting gains or losses are recognised in equity until the investments are sold. At that point, fair value gains or losses accumulated in equity are reclassified to the income statement for the period.
If the investments are not listed on a regulated market and their fair value cannot be reliably determined, they are measured at cost, adjusted for any impairment losses, which cannot be reversed.
Translation of foreign currency captions
(a) Presentation currency and translation of financial statements denominated in currencies other than the Euro
The Group’s presentation currency is the Euro.
The table below lists the exchange rates used to translate financial statements denominated in functional currencies different from the presentation currency:
(b) Foreign currency assets, liabilities and transactions
Transactions carried out in currencies other than the Euro are initially translated at the exchange rate in force on the date of the transaction.
Name Registered office
Investment
% Held by
Currency
Quota
capital
Goodmind S.r.l. Via Nazionale 30,
Cambiano, Italy 20%
Pininfarina Extra
S.r.l. € 20,000
Signature S.r.l. Via Paolo Frisi 6, Ravenna,
Italy 24% Pininfarina S.p.A. € 10,000
Euro vs currency 30.09.2018
First nine
months of
2018 30.09.2017
First nine
months of
2017
US dollar - USD 1.16 1.19 1.18 1.11
Chinese renminbi (yuan) - CNY 7.97 7.78 7.86 7.58
29
At the reporting date, monetary assets and liabilities denominated in foreign currencies are retranslated into Euros at the closing rate. All resulting exchange rate gains and losses are recognised in profit or loss, except for those stemming from foreign currency loans that hedge investments in foreign operations. Any such gains or losses, net of the related tax effects, are recognised directly in equity. When the equity investment is sold, the accumulated translation differences are reclassified to profit or loss.
Non-monetary items that are carried at historical cost are translated into Euros at the exchange rate in force when the underlying transaction was initially recognised. Non-monetary items that are carried at fair value are translated into Euros at the exchange rate in force on the measurement date.
None of the group companies operate in a hyperinflationary economy.
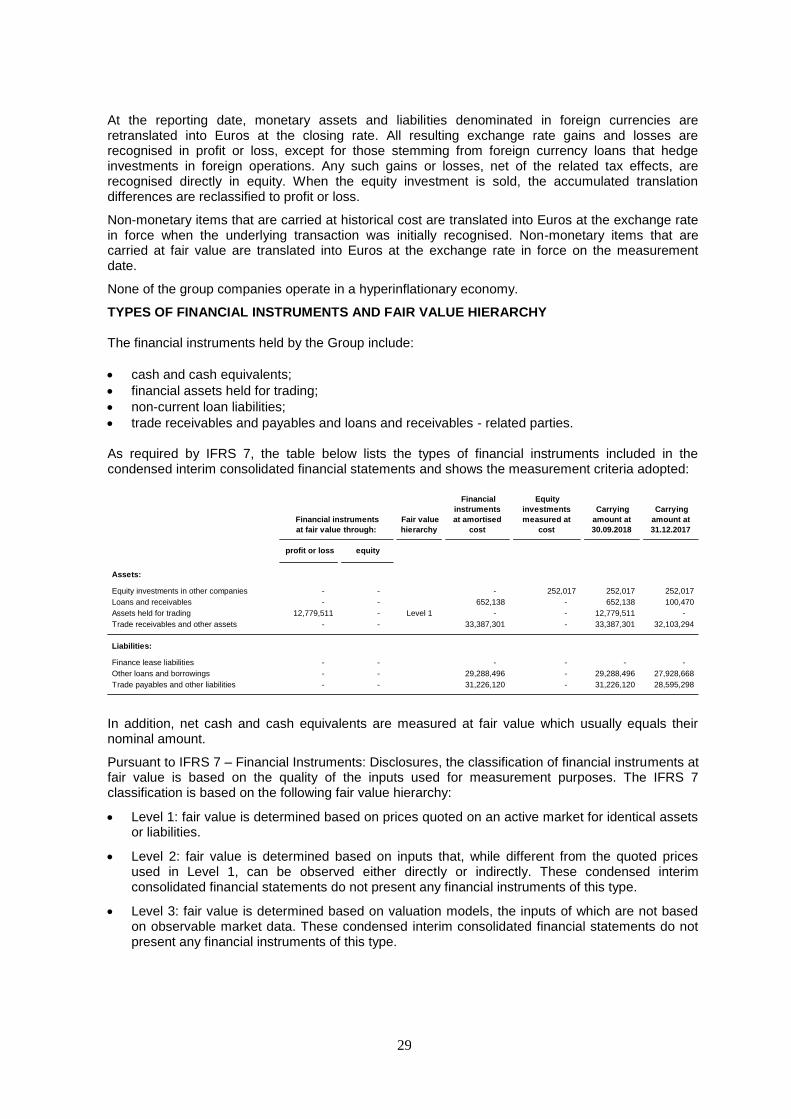
TYPES OF FINANCIAL INSTRUMENTS AND FAIR VALUE HIERARCHY The financial instruments held by the Group include:
cash and cash equivalents;
financial assets held for trading;
non-current loan liabilities;
trade receivables and payables and loans and receivables - related parties. As required by IFRS 7, the table below lists the types of financial instruments included in the condensed interim consolidated financial statements and shows the measurement criteria adopted:
In addition, net cash and cash equivalents are measured at fair value which usually equals their nominal amount.
Pursuant to IFRS 7 – Financial Instruments: Disclosures, the classification of financial instruments at fair value is based on the quality of the inputs used for measurement purposes. The IFRS 7 classification is based on the following fair value hierarchy:
Level 1: fair value is determined based on prices quoted on an active market for identical assets or liabilities.
Level 2: fair value is determined based on inputs that, while different from the quoted prices used in Level 1, can be observed either directly or indirectly. These condensed interim consolidated financial statements do not present any financial instruments of this type.
Level 3: fair value is determined based on valuation models, the inputs of which are not based on observable market data. These condensed interim consolidated financial statements do not present any financial instruments of this type.
Fair value
hierarchy
Financial
instruments
at amortised
cost
Equity
investments
measured at
cost
Carrying
amount at
30.09.2018
Carrying
amount at
31.12.2017
profit or loss equity
Assets:
Equity investments in other companies - - - 252,017 252,017 252,017
Loans and receivables - - 652,138 - 652,138 100,470
Assets held for trading 12,779,511 - Level 1 - - 12,779,511 -
Trade receivables and other assets - - 33,387,301 - 33,387,301 32,103,294
Liabilities:
Finance lease liabilities - - - - - -
Other loans and borrowings - - 29,288,496 - 29,288,496 27,928,668
Trade payables and other liabilities - - 31,226,120 - 31,226,120 28,595,298
Financial instruments
at fair value through:
30
FINANCIAL RISK MANAGEMENT Financial risk factors, as identified in IFRS 7 – Financial Instruments: Disclosures, are described below:
Market risk: the risk that the fair value or the future cash flows of a financial instrument could fluctuate as a result of changes in market prices. Market risk includes the following other types of risk: currency risk, interest rate risk and price risk.
Currency risk: the risk that the fair value or the future cash flows of a financial instrument could fluctuate as a result of changes in exchange rates.
Interest rate risk: the risk that the fair value or the future cash flows of a financial instrument could fluctuate as a result of changes in interest rates.
Price risk: the risk that the fair value or the future cash flows of a financial instrument could fluctuate as a result of changes in market prices (other than changes covered by the interest rate and currency risks), irrespective as to whether such fluctuations are determined by factors specific to the financial instrument or its issuer or by factors that affect all similar market-traded financial instruments.
Credit risk: the risk that one of the parties causes the other party to incur a financial loss by failing to fulfil an obligation.
Liquidity risk: the risk that an entity may be unable to fulfil obligations associated with financial liabilities.
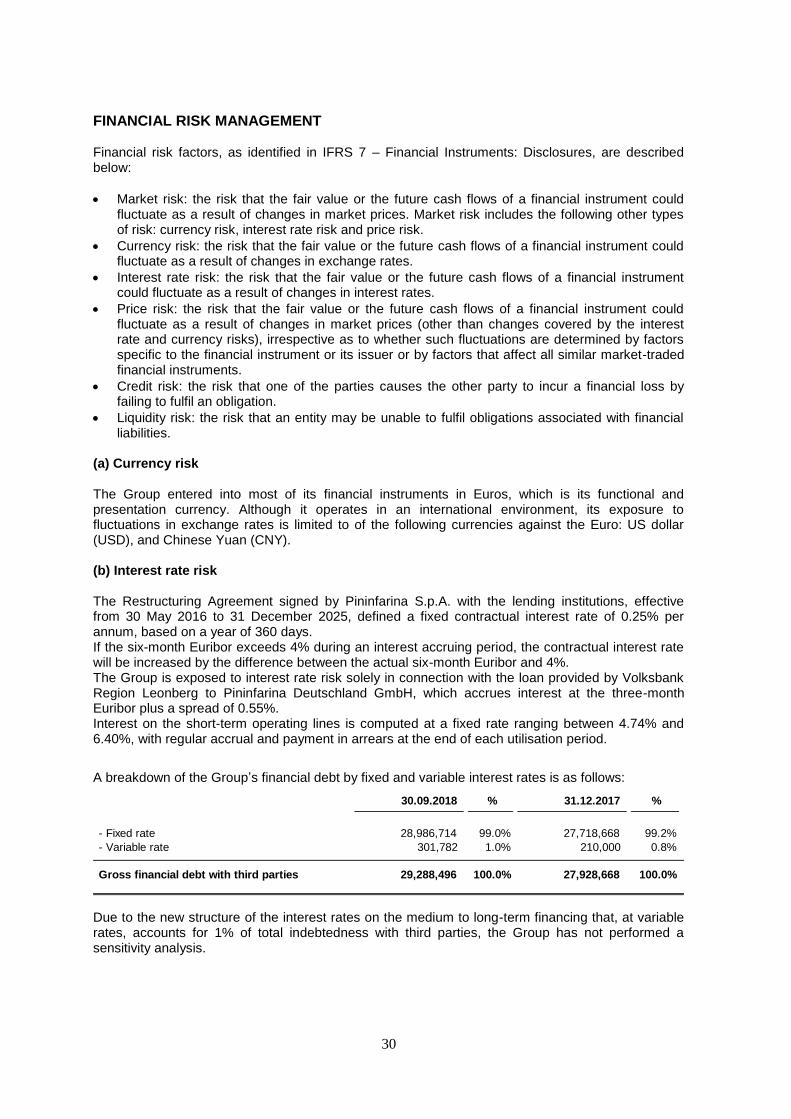
(a) Currency risk The Group entered into most of its financial instruments in Euros, which is its functional and presentation currency. Although it operates in an international environment, its exposure to fluctuations in exchange rates is limited to of the following currencies against the Euro: US dollar (USD), and Chinese Yuan (CNY). (b) Interest rate risk The Restructuring Agreement signed by Pininfarina S.p.A. with the lending institutions, effective from 30 May 2016 to 31 December 2025, defined a fixed contractual interest rate of 0.25% per annum, based on a year of 360 days. If the six-month Euribor exceeds 4% during an interest accruing period, the contractual interest rate will be increased by the difference between the actual six-month Euribor and 4%. The Group is exposed to interest rate risk solely in connection with the loan provided by Volksbank Region Leonberg to Pininfarina Deutschland GmbH, which accrues interest at the three-month Euribor plus a spread of 0.55%. Interest on the short-term operating lines is computed at a fixed rate ranging between 4.74% and 6.40%, with regular accrual and payment in arrears at the end of each utilisation period.
A breakdown of the Group’s financial debt by fixed and variable interest rates is as follows:
Due to the new structure of the interest rates on the medium to long-term financing that, at variable rates, accounts for 1% of total indebtedness with third parties, the Group has not performed a sensitivity analysis.
30.09.2018 % 31.12.2017 %
- Fixed rate 28,986,714 99.0% 27,718,668 99.2%
- Variable rate 301,782 1.0% 210,000 0.8%
Gross financial debt with third parties 29,288,496 100.0% 27,928,668 100.0%

31
(c) Price risk Because the Group primarily operates within the Eurozone, its exposure to the risk of fluctuations in commodity prices is currently immaterial. (d) Credit risk
Styling and engineering contracts, which are the Group’s primary revenue source, are agreed with
highly rated customers located both inside and outside the European Union. In order to minimise the
credit risk from non-EU customers, the Group seeks to align both progress billings and their
collection with the relevant contract’s stage of completion. The Group did not carry out transactions involving the derecognition of financial assets, such as the factoring of trade receivables without recourse. (e) Liquidity risk In brief, the Rescheduling Agreement effective as of 30 May 2016 entailed: - settlement and extinguishment of 56.74% of the nominal amount of the parent’s debt with the
lending institutions that accepted this option, in addition to the interest accrued up to the effective date;
- the rescheduling of the nominal amount of the debt with the lending institutions that accepted this option, totalling €41.5 million, from 2016 to 2025;
- the application of a fixed interest rate of 0.25% per annum, based on a year of 360 days, increased by the difference between this rate and the six-month Euribor, should the latter exceed 4%.
The cash flows of the above-mentioned agreement have been determined on the basis of the 2016-2025 business and financial plan that ensures the parent’s and the Group’s financial stability. Consequently, over the medium to long term, the liquidity risk is directly correlated to the achievement of the business plan targets. A breakdown of the contractual amount of the Group’s financial debt is set out below.
The Group holds net cash and cash equivalents and assets held for trading in its portfolio totalling €38.1 million. Consequently, it is not exposed to liquidity risk in the foreseeable future. (f) Risk of default and debt covenants This risk relates to the possibility that the new Rescheduling Agreement between Pininfarina S.p.A. and the lending institutions that came into force on 30 May 2016 may include acceleration clauses that would give rise to liquidity risk.
The Rescheduling Agreement requires that, as of the verification date of 31 March of each year, the financial covenant shall be at least equal to the minimum consolidated equity, i.e., €30 million. The covenant will be checked until the expiry of the loan in 2025.
The Mahindra Group granted a first demand surety to the lending institutions that is enforceable if Pininfarina S.p.A. fails to meet its obligations.
Carrying
amount
30.09.2018
Contractual
cash flows
Of which:
due within one
year
Of which:
due from one to
five years
Of which:
due after five
years
Term financing 29,288,496 38,110,955 3,690,681 17,995,445 16,424,829
Other loans and borrowings - third
parties 29,288,496 38,110,955 3,690,681 17,995,445 16,424,829

32
SEGMENT REPORTING
Operating segments are identified in accordance with paragraphs 5 to 10 of IFRS 8 – Operating
segments. In the Operations business segment, the operating segments coincide with a series of
activities mainly involving the supply of spare parts for cars manufactured by Pininfarina S.p.A., the
lease of the business for the production of electric cars for the car sharing service and support
functions.
Financial income and expense and income taxes are not allocated to the reporting segments
because management makes the relevant decisions on an aggregate segment basis. Intra-segment
transactions are carried out at market conditions. In accordance with IFRS 8.4, the Group presents
segment reporting in its consolidated financial statements only.
The Group’s business segments are not affected by seasonal factors.
Segment reporting as at and for the nine months ended 30 September 2018 and 2016 is set out
below. Amounts are in thousands of Euros.
Reference should be made to the directors’ report for an analysis of the operating segments.
Sales are broken down by geographical segment below:
Operations
Design
&
engineering Total Operations
Design
&
engineering Total
A B A + B A B A + B
Revenue 6,744 74,529 81,273 8,306 54,443 62,749
(Intra-segment revenue) (1,484) (1,784) (3,268) (266) (382) (648)
Revenue - third parties 5,260 72,745 78,005 8,040 54,061 62,101
Operating profit (loss) (3,462) 8,839 5,377 (3,391) 5,692 2,301
Net financial expense (1,748) (1,396)
Provento da cancellazione passività finanziaria - -
Dividends - -
Share of profit (loss) of equity-accounted investees - (50) (50) - 10 10
Profit before taxes - - 3,579 - - 915
Income taxes - - (868) - - (419)
Profit from continuing operations - - 2,711 - - 496
Other information required by IFRS 8:
- Amortisation and depreciation (1,234) (1,421) (2,655) (1,240) (1,041) (2,281)
- Impairment losses - (6) (6) - (20) (20)
- Provisions/change in accounting estimates - 4 4 - 8 8
- Net gains on the sale of non-current assets 181 3 184 - 1 1
Nine months ended 30 September 2018 Nine months ended 30 September 2017
Italy 11,742 10,506
EU 18,532 20,230
Non-EU countries 39,182 24,476
Revenue from sales and services 69,456 55,212
30.09.2018 30.09.2017Nine months ended
33
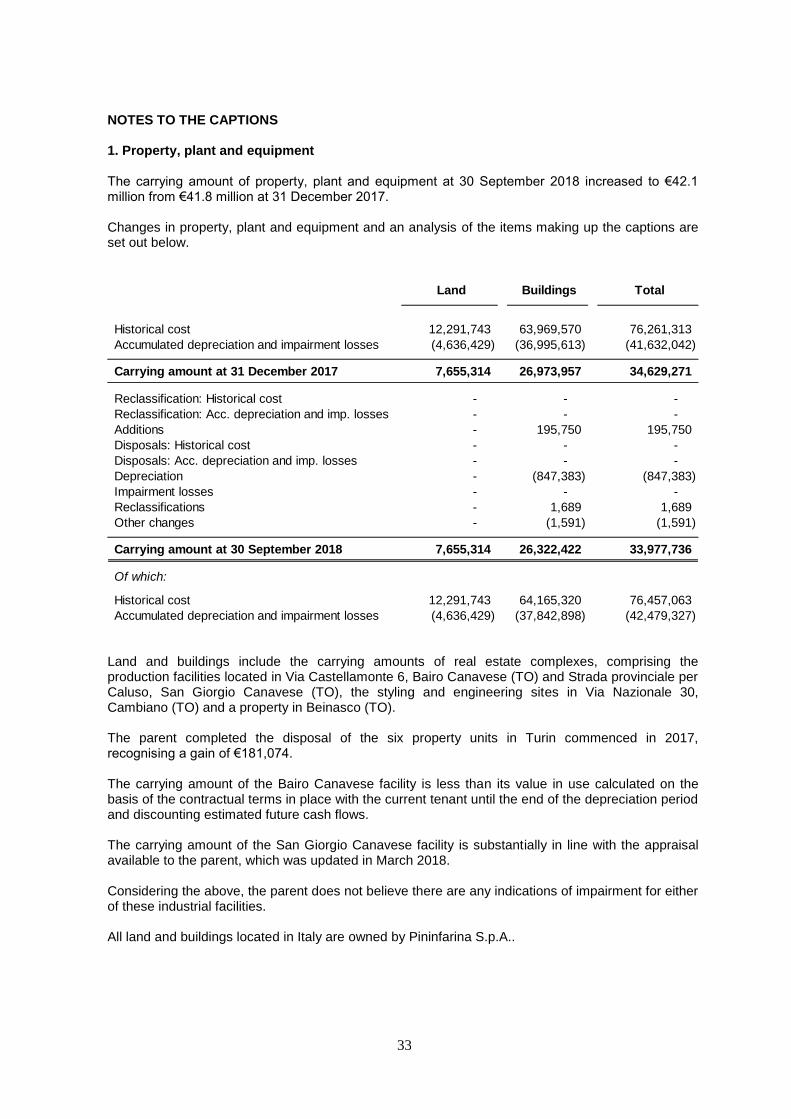
NOTES TO THE CAPTIONS 1. Property, plant and equipment The carrying amount of property, plant and equipment at 30 September 2018 increased to €42.1 million from €41.8 million at 31 December 2017. Changes in property, plant and equipment and an analysis of the items making up the captions are set out below.
Land and buildings include the carrying amounts of real estate complexes, comprising the production facilities located in Via Castellamonte 6, Bairo Canavese (TO) and Strada provinciale per Caluso, San Giorgio Canavese (TO), the styling and engineering sites in Via Nazionale 30, Cambiano (TO) and a property in Beinasco (TO). The parent completed the disposal of the six property units in Turin commenced in 2017, recognising a gain of €181,074. The carrying amount of the Bairo Canavese facility is less than its value in use calculated on the basis of the contractual terms in place with the current tenant until the end of the depreciation period and discounting estimated future cash flows. The carrying amount of the San Giorgio Canavese facility is substantially in line with the appraisal available to the parent, which was updated in March 2018. Considering the above, the parent does not believe there are any indications of impairment for either of these industrial facilities. All land and buildings located in Italy are owned by Pininfarina S.p.A..
Land Buildings Total
Historical cost 12,291,743 63,969,570 76,261,313
Accumulated depreciation and impairment losses (4,636,429) (36,995,613) (41,632,042)
Carrying amount at 31 December 2017 7,655,314 26,973,957 34,629,271
Reclassification: Historical cost - - -
Reclassification: Acc. depreciation and imp. losses - - -
Additions - 195,750 195,750
Disposals: Historical cost - - -
Disposals: Acc. depreciation and imp. losses - - -
Depreciation - (847,383) (847,383)
Impairment losses - - -
Reclassifications - 1,689 1,689
Other changes - (1,591) (1,591)
Carrying amount at 30 September 2018 7,655,314 26,322,422 33,977,736
Of which:
Historical cost 12,291,743 64,165,320 76,457,063
Accumulated depreciation and impairment losses (4,636,429) (37,842,898) (42,479,327)
34
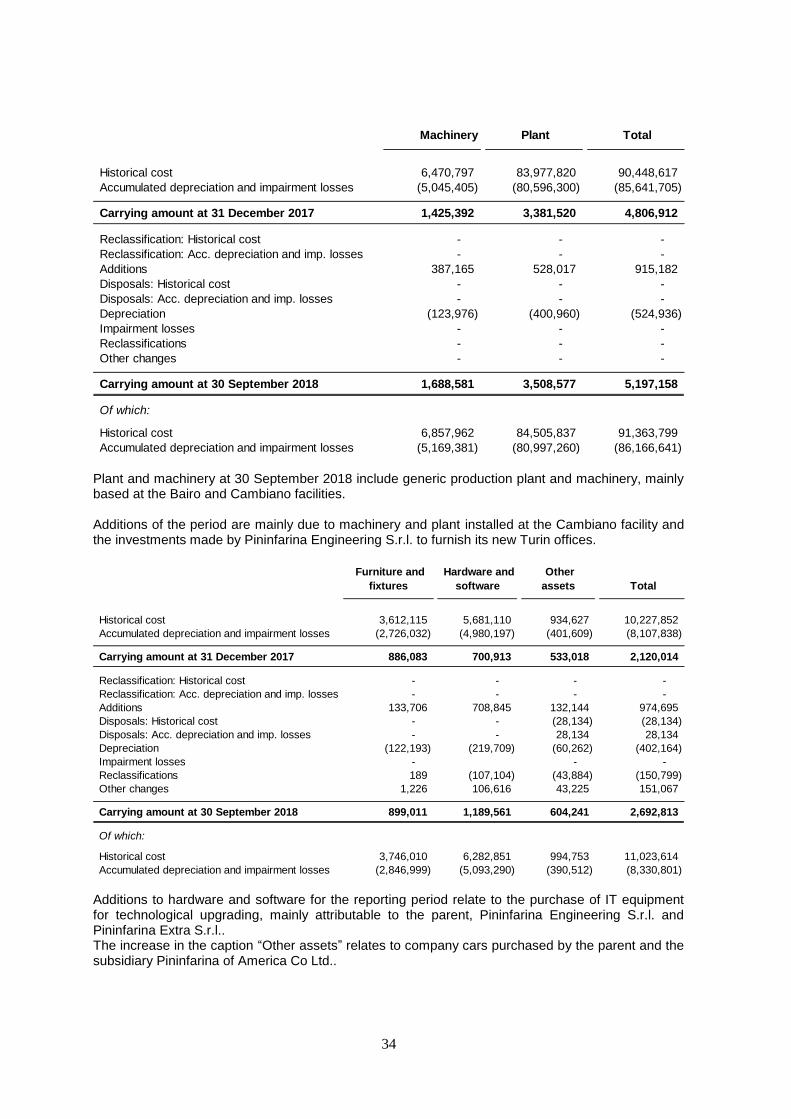
Plant and machinery at 30 September 2018 include generic production plant and machinery, mainly based at the Bairo and Cambiano facilities. Additions of the period are mainly due to machinery and plant installed at the Cambiano facility and the investments made by Pininfarina Engineering S.r.l. to furnish its new Turin offices.
Additions to hardware and software for the reporting period relate to the purchase of IT equipment for technological upgrading, mainly attributable to the parent, Pininfarina Engineering S.r.l. and Pininfarina Extra S.r.l.. The increase in the caption “Other assets” relates to company cars purchased by the parent and the subsidiary Pininfarina of America Co Ltd..
Machinery Plant Total
Historical cost 6,470,797 83,977,820 90,448,617
Accumulated depreciation and impairment losses (5,045,405) (80,596,300) (85,641,705)
Carrying amount at 31 December 2017 1,425,392 3,381,520 4,806,912
Reclassification: Historical cost - - -
Reclassification: Acc. depreciation and imp. losses - - -
Additions 387,165 528,017 915,182
Disposals: Historical cost - - -
Disposals: Acc. depreciation and imp. losses - - -
Depreciation (123,976) (400,960) (524,936)
Impairment losses - - -
Reclassifications - - -
Other changes - - -
Carrying amount at 30 September 2018 1,688,581 3,508,577 5,197,158
Of which:
Historical cost 6,857,962 84,505,837 91,363,799
Accumulated depreciation and impairment losses (5,169,381) (80,997,260) (86,166,641)
Furniture and
fixtures
Hardware and
software
Other
assets Total
Historical cost 3,612,115 5,681,110 934,627 10,227,852
Accumulated depreciation and impairment losses (2,726,032) (4,980,197) (401,609) (8,107,838)
Carrying amount at 31 December 2017 886,083 700,913 533,018 2,120,014
Reclassification: Historical cost - - - -
Reclassification: Acc. depreciation and imp. losses - - - -
Additions 133,706 708,845 132,144 974,695
Disposals: Historical cost - - (28,134) (28,134)
Disposals: Acc. depreciation and imp. losses - - 28,134 28,134
Depreciation (122,193) (219,709) (60,262) (402,164)
Impairment losses - - -
Reclassifications 189 (107,104) (43,884) (150,799)
Other changes 1,226 106,616 43,225 151,067
Carrying amount at 30 September 2018 899,011 1,189,561 604,241 2,692,813
Of which:
Historical cost 3,746,010 6,282,851 994,753 11,023,614
Accumulated depreciation and impairment losses (2,846,999) (5,093,290) (390,512) (8,330,801)

35
2. Investment property The Group’s investment property consists of buildings owned by Pininfarina Deutschland Holding GmbH in Renningen, near Stuttgart, Germany, which are leased to third parties. They are mortgaged to secure a loan received by the German subsidiary (€165,000). The market value of property, calculated in the appraisal available to the parent, exceeds its carrying amount.
3. Intangible assets The carrying amount of intangible assets at 30 September 2018 increased to €7.4 million from €1.7 million at 31 December 2017.
Land Buildings Total
Historical cost 5,807,378 12,226,555 18,033,933
Accumulated depreciation and impairment losses - (10,282,013) (10,282,013)
Carrying amount at 31 December 2017 5,807,378 1,944,542 7,751,920
Reclassification: Historical cost - - -
Reclassification: Acc. depreciation and imp. losses - - -
Additions - - -
Disposals: Historical cost - - -
Disposals: Acc. depreciation and imp. losses - - -
Depreciation - (273,280) (273,280)
Impairment losses - - -
Reclassifications - - -
Other changes - - -
Carrying amount at 30 September 2018 5,807,378 1,671,262 7,478,640
Of which:
Historical cost 5,807,378 12,226,555 18,033,933
Accumulated depreciation and impairment losses - (10,555,293) (10,555,293)
Goodwill Licences Other Total
Historical cost 1,043,495 6,101,968 2,182,947 9,328,410
Accumulated amortisation and impairment losses - (5,547,871) (2,108,293) (7,656,164)
Carrying amount at 31 December 2017 1,043,495 554,097 74,654 1,672,246
Reclassification: Historical cost - - - -
Reclassification: Acc. amortisation and imp. losses - - - -
Additions - 379,035 105,146 484,181
Disposals: Historical cost - - - -
Disposals: Acc. amortisation and imp. losses - - - -
Amortisation - (231,572) (375,941) (607,513)
Impairment losses - - - -
Reclassifications - - 5,807,011 5,807,011
Other changes - - - -
Carrying amount at 30 September 2018 1,043,495 701,560 5,610,870 7,355,925
Of which:
Historical cost 1,043,495 6,481,003 8,095,104 15,619,602
Accumulated amortisation and impairment losses - (5,779,443) (2,484,234) (8,263,677)

36
The Group’s only intangible asset with an indefinite useful life, goodwill of €1,043,495, originates from the consolidation of Pininfarina Extra S.r.l.. The Pininfarina Extra subgroup, which is comprised of Pininfarina Extra S.r.l., Pininfarina of America Corp. and the associate Goodmind S.r.l., engages in styling activities that are not related to the automotive industry. Consequently, it constitutes a separate cash generating unit. The increase in “Other” is due to the reclassification, made to comply with IFRS 15, of the prepayment recognised in 2017 related to an advisory services agreement that Pininfarina S.p.A. signed in connection with a long-term engineering contract. The asset was recognised at the amount of the liability with the supplier (see note 15) discounted on the basis of the payment plan agreed with the supplier. It is amortised in line with the stage of completion of the engineering contract. Before the adoption of IFRS 15, the Group would have recognised the same effect as a cost for services in profit or loss rather than amortisation. 4. Investments in associates They include:
Goodmind S.r.l., incorporated in July 2012, provides communication services to companies and public sector entities. The Group’s share of its profit for the period is €13,217. The associate had eight employees at the reporting date. Signature S.r.l., incorporated in February 2018, mainly operates in the stationery sector. The parent has a 24% interest therein. The investment’s carrying amount equals its acquisition cost of €329,280 plus the injection of €200,000 for the future capital increase and the Group’s share of the associate’s loss for the period (€63,070). 5. Equity investments in other companies Equity investments in other companies did not change from the previous year end and are as follows:
30.09.2018
31.12.2017
Goodmind S.r.l. 109,911 96,694
Signature S.r.l. 466,210 -
Investments in associates 576,121 96,694
30.09.2018
Midi Plc 251,072
Idroenergia Soc. Cons. a.r.l. 516
Volksbank Region Leonberg 300
Unionfidi S.c.r.l.p.A. Turin 129
Equity investments in other companies 252,017

37
6. Loans and receivables Changes in loans and receivables are set out below:
The amount due from the associate Goodmind S.r.l. shows the loan provided by Pininfarina Extra S.r.l. to finance its activities. The amount due from the associate Signature S.r.l. refers to the loan granted by Pininfarina S.p.A. to fund its start-up phase. 7. Inventories
Raw materials mainly consist of various materials used for the production of cars and prototypes at
the Cambiano facility. Finished goods mainly comprise car spare parts manufactured by the Group,
which are sold to carmakers. The table below shows a breakdown of inventories and the allowance for inventory write-down:
The allowance for raw material write-down reflects the risk of obsolete and slow-moving items.
31.12.2017 Increase
Interest
income
Collection 30.09.2018
Goodmind S.r.l. 100,470 - 1,668 - 102,138
Signature S.r.l.* - 550,000 - - 550,000
Loans and receivables - related parties 100,470 550,000 1,668 - 652,138
* non-interest bearing
30.09.2018 31.12.2017
Raw materials 619,380 561,083
Allowance for inventory write-down (353,577) (360,188)
Finished goods 211,369 191,854
Allowance for inventory write-down - -
Inventories 477,172 392,749
Allowance for raw
materials write-
down
Allowance for
finished goods
write-down
Allowance for
raw materials
write-down
Allowance for
finished goods
write-down
Opening balance 360,188 - 377,954 -
Additions - - - -
Utilisations (6,611) - (17,766) -
Other changes - - - -
Nominal amount at 30 September 353,577 - 360,188 -
2018 2017

38
8. Contract work in progress Contract work in progress shows the balance of gross contract work in progress less progress payments and advances. The change for the period is due to the progress of certain styling and engineering contracts from customers inside and outside the European Union. 9. Assets held for trading Assets held for trading, which totalled €12.8 million at 30 September 2018, are measured at fair value. As they mainly consist of government bonds (investment grade), are traded in regulated markets and have low risk profiles, the price risk presented by these assets is deemed to be limited. A breakdown of these assets by nature is provided below:
The fair value loss for the period has been recognised in profit or loss as a financial expense (see note 25). 10. Trade receivables - third and related parties The following table shows trade receivables at 30 September 2018 and 31 December 2014:
The Group’s main counterparties are top carmakers with a high credit rating. Since there are no
insurance contracts on receivables, the Group’s maximum exposure to credit risk is equal to the
carrying amount of the receivables less the loss allowance. The Group did not factor any
receivables. Trade receivables are mostly denominated in Euros.
30.09.2018 %
Italian government or government-guaranteed bonds 410,996 3.32
Foreign government or government-guaranteed bonds 210,801 1.67
Bank and insurance bonds 7,277,045 55.82
Other bonds 4,880,669 39.19
Assets held for trading 12,779,511 100.00
30.09.2018 31.12.2017
Italy 1,939,978 3,578,663
EU 4,231,814 4,770,572
Non-EU countries 12,507,186 9,474,440
(Loss allowance) (435,636) (456,809)
Third parties 18,243,342 17,366,866
Signature S.r.l. 57,452 -
Mahindra&Mahindra Group 3,265,864 464,031
Tech Mahindra Group 33,433 157,428
Automobili Pininfarina GmbH 2,506,287 -
Related parties 5,863,036 621,459
Trade receivables 24,106,378 17,988,325

39
The increase in trade receivables from third parties is in line with the increase in revenue compared
to the corresponding period of the previous year, while the rise in trade receivables from related
parties is substantially related to the receivables from the Mahindra & Mahindra Group and
Automobili Pininfarina GmbH. Changes in the loss allowance are set out below:
11. Other assets The following table shows other assets at 30 September 2018 and 31 December 2017:
The decrease in prepayments and accrued income is due to the reclassification to intangible assets
(see note 3).
The VAT asset is mainly attributable to the parent, which received the partial reimbursement of the VAT assets that arose in 2017 in July 2018 (€3,600,000). 12. Cash and cash equivalents The table below shows a breakdown of this caption and a comparison with the previous year-end corresponding figures:
30.09.2018 31.12.2017
Opening balance 456,809 1,119,529
Additions 6,197 13,760
Utilisations (27,370) (676,480)
Other changes - -
Closing balance 435,636 456,809
30.09.2018 31.12.2017
VAT 4,467,124 3,716,864
Withholding taxes 3,534,243 2,948,090
Prepayments and accrued income 720,349 6,477,454
Advances to suppliers 136,988 41,800
Amounts due from INAIL (the Italian Workers'
Compensation Authority) and INPS (the Italian
social security institution) 70,080 4,475
Amounts due from employees 9,550 40,147
Other 342,589 221,698
Other assets 9,280,923 13,450,528
30.09.2018 31.12.2017
Cash in hand and cash equivalents 14,842 17,254
Short-term bank deposits 25,420,635 39,767,360
Cash and cash equivalents 25,435,477 39,784,614
(Bank overdrafts) (136,782) -
Net cash and cash equivalents 25,298,695 39,784,614

40
The decrease is mainly due to cash of €12.8 million invested in current financial assets held for trading and working capital trends. The bank overdrafts relate to the credit facilities drawn down by Pininfarina Deutschland GmbH.
Reference should be made to the statement of cash flows on page 21 for details of the cash flows for the period. 13. Equity (a) Share capital
The parent’s share capital is comprised of 54,287,128 ordinary shares, with a unit nominal amount of €1. There are no other classes of shares. Treasury shares are held in accordance with the limits imposed by article 2357 of the Italian Civil Code. Detailed information about the parent’s shareholders is provided in the “General information” section of these notes. (b) Share premium reserve This reserve is unchanged from the previous year end. (c) Reserve for treasury shares This reserve of €175,697, unchanged from the previous year end, is recognised in accordance with the provisions of article 2357 of the Italian Civil Code. (d) Legal reserve The legal reserve of €6,063,759 increased by €30,428 from the previous year end, as provided for by the resolution for the allocation of the profit for the previous year. Pursuant to the provisions of article 2430 of the Italian Civil Code, is available to cover any losses. (e) Stock option reserve Pursuant to article 114-bis of the Consolidated Finance Act, on 21 November 2016, the shareholders approved a stock option plan that provides for the free assignment of options for the subscription of ordinary shares to the parent’s employees. The ratio is one share for each option. The plan aims at incentivising attainment of the parent’s objectives and retaining employees. The plan provides that the maximum number of shares to be assigned to the beneficiaries is 2,225,925 and that the option’s exercise price is €1.10 for each share. The plan term is seven years (2016-2023). The reserve increased by the plan cost pertaining to the period.
Nominal
amount No.
Nominal
amount No.
Ordinary shares 54,287,128 54,287,128 54,287,128 54,287,128
(Treasury shares) (15,958) (15,958) (15,958) (15,958)
Share capital 54,271,170 54,271,170 54,271,170 54,271,170
30.09.2018 31.12.2017
41
The options are measured using the Black-Scholes valuation approach, whose assumptions are as follows:
1. Volatility: 80% (three year average)
2. Risk-free rate: -0.41% (the average of the three instalments considered)
3. Dividends: no dividends are expected during the plan term
4. Average share price: €1.10
5. Vesting conditions: permanence of the employment agreement
6. Settlement method: equity instruments
7. Cost for the year: €552,681
8. Carrying amount at the reporting date: €1,724,851
(f) Translation reserve The translation reserve reflects the cumulative differences from the translation of financial statements of companies with functional currencies other than the Euro, which is the Group’s presentation currency. These companies are Pininfarina Automotive Engineering (Shanghai) Co Ltd. and Pininfarina of America Corp.. (g) Other reserves Other reserves are unchanged from the previous year end. (h) Losses carried forward Losses carried forward totalled €7,488,902 at the reporting date, down by €1,321,551 from the 31 December 2017 figure. The decrease is due to the profit for 2017 of €1,311,709, net of the allocation to the legal reserve of €30,428, and the effect for the period of the adoption of IAS 19 (revised), quantified at €40,270. The table reconciling the parent’s profit and equity as at and for the period ended 30 September 2018 with the Group’s relevant figures is provided in the directors’ report, to which reference is made. 14. Loans and borrowings
Rescheduling Agreement
(a) Rescheduling Agreement
The new Rescheduling Agreement (the “Agreement”) between Pininfarina S.p.A. and its lending
institutions became effective on 30 May 2016. Its effects are summarised below:
- settlement and extinguishment of 56.74% of the nominal amount of the parent’s debt with the
lending institutions that accepted this option, in addition to the interest accrued up to the effective date;
- the rescheduling of the nominal amount of the debt with the lending institutions that accepted
this option, totalling €41.5 million, to 2025;
- the application of a fixed interest rate of 0.25% per annum, based on a year of 360 days, increased by the difference between this rate and the six-month Euribor, should the latter exceed 4%.
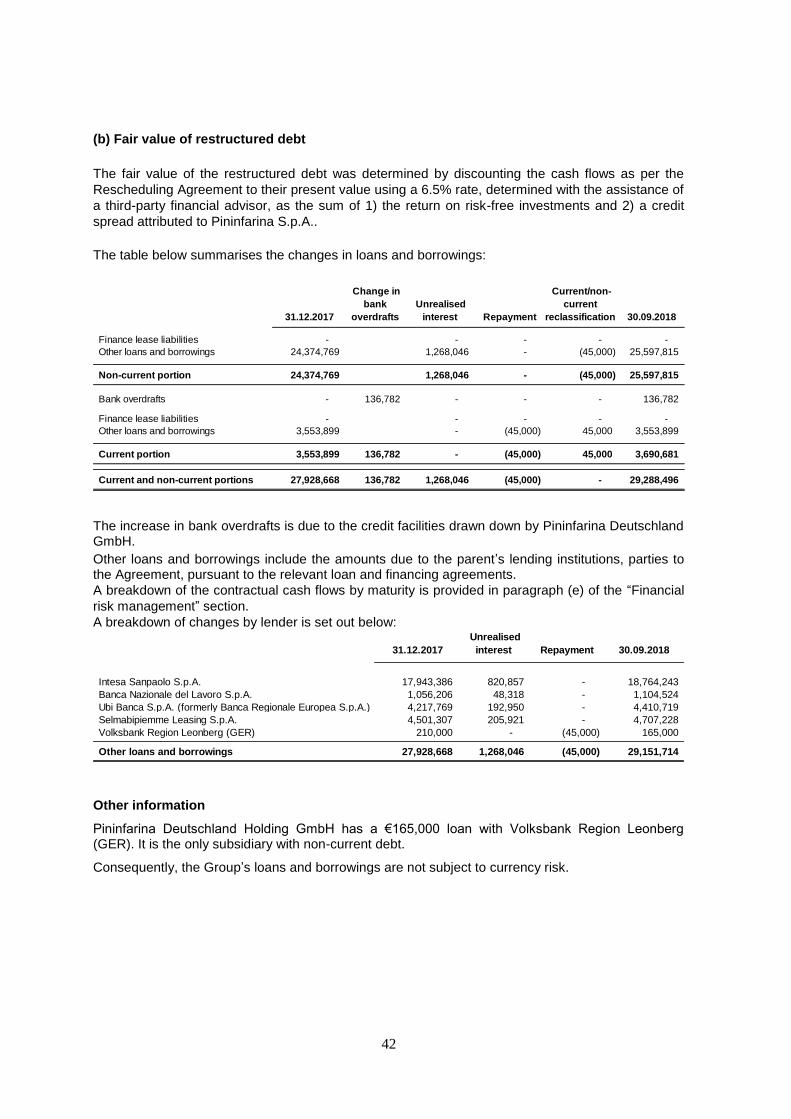
42
(b) Fair value of restructured debt
The fair value of the restructured debt was determined by discounting the cash flows as per the
Rescheduling Agreement to their present value using a 6.5% rate, determined with the assistance of
a third-party financial advisor, as the sum of 1) the return on risk-free investments and 2) a credit
spread attributed to Pininfarina S.p.A..
The table below summarises the changes in loans and borrowings:
The increase in bank overdrafts is due to the credit facilities drawn down by Pininfarina Deutschland GmbH.
Other loans and borrowings include the amounts due to the parent’s lending institutions, parties to the Agreement, pursuant to the relevant loan and financing agreements.
A breakdown of the contractual cash flows by maturity is provided in paragraph (e) of the “Financial
risk management” section.
A breakdown of changes by lender is set out below:
Other information
Pininfarina Deutschland Holding GmbH has a €165,000 loan with Volksbank Region Leonberg (GER). It is the only subsidiary with non-current debt.
Consequently, the Group’s loans and borrowings are not subject to currency risk.
31.12.2017
Change in
bank
overdrafts
Unrealised
interest Repayment
Current/non-
current
reclassification 30.09.2018
Finance lease liabilities - - - - -
Other loans and borrowings 24,374,769 1,268,046 - (45,000) 25,597,815
Non-current portion 24,374,769 1,268,046 - (45,000) 25,597,815
Bank overdrafts - 136,782 - - - 136,782
Finance lease liabilities - - - - -
Other loans and borrowings 3,553,899 - (45,000) 45,000 3,553,899
Current portion 3,553,899 136,782 - (45,000) 45,000 3,690,681
Current and non-current portions 27,928,668 136,782 1,268,046 (45,000) - 29,288,496
31.12.2017
Unrealised
interest Repayment 30.09.2018
Intesa Sanpaolo S.p.A. 17,943,386 820,857 - 18,764,243
Banca Nazionale del Lavoro S.p.A. 1,056,206 48,318 - 1,104,524
Ubi Banca S.p.A. (formerly Banca Regionale Europea S.p.A.) 4,217,769 192,950 - 4,410,719
Selmabipiemme Leasing S.p.A. 4,501,307 205,921 - 4,707,228
Volksbank Region Leonberg (GER) 210,000 - (45,000) 165,000
Other loans and borrowings 27,928,668 1,268,046 (45,000) 29,151,714
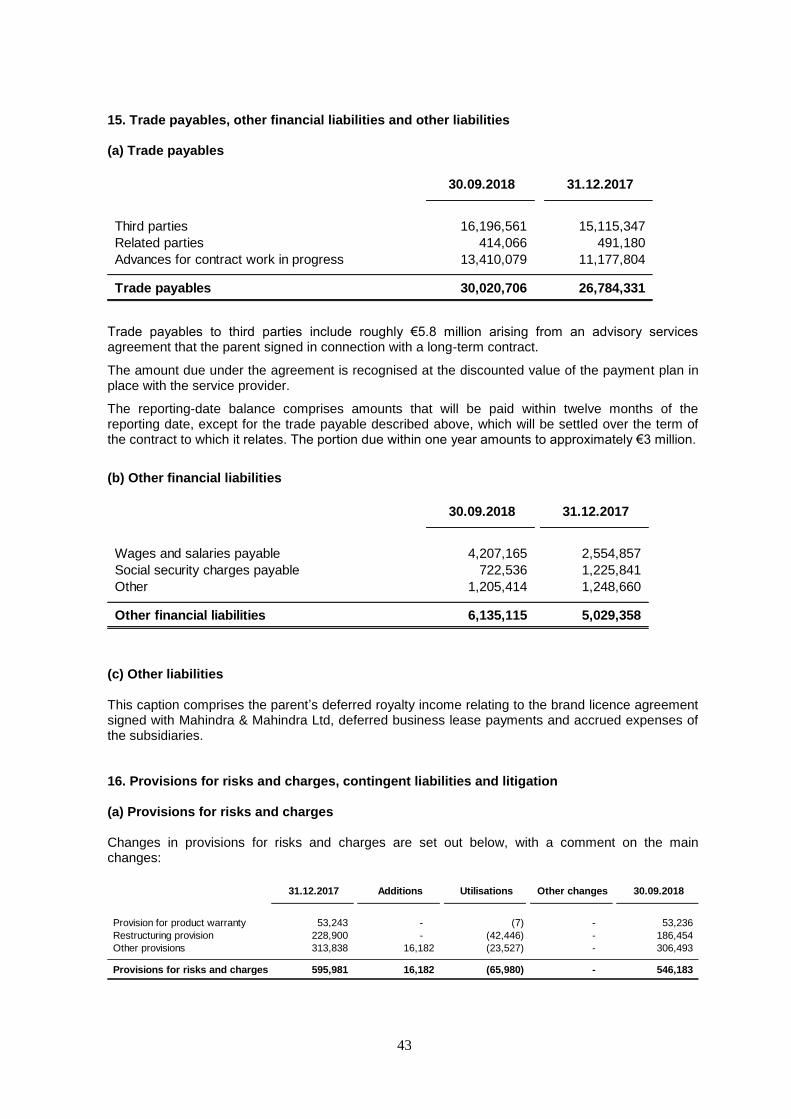
43
15. Trade payables, other financial liabilities and other liabilities (a) Trade payables
Trade payables to third parties include roughly €5.8 million arising from an advisory services agreement that the parent signed in connection with a long-term contract.
The amount due under the agreement is recognised at the discounted value of the payment plan in place with the service provider.
The reporting-date balance comprises amounts that will be paid within twelve months of the reporting date, except for the trade payable described above, which will be settled over the term of the contract to which it relates. The portion due within one year amounts to approximately €3 million.
(b) Other financial liabilities
(c) Other liabilities This caption comprises the parent’s deferred royalty income relating to the brand licence agreement signed with Mahindra & Mahindra Ltd, deferred business lease payments and accrued expenses of the subsidiaries. 16. Provisions for risks and charges, contingent liabilities and litigation (a) Provisions for risks and charges Changes in provisions for risks and charges are set out below, with a comment on the main changes:
30.09.2018 31.12.2017
Third parties 16,196,561 15,115,347
Related parties 414,066 491,180
Advances for contract work in progress 13,410,079 11,177,804
Trade payables 30,020,706 26,784,331
30.09.2018 31.12.2017
Wages and salaries payable 4,207,165 2,554,857
Social security charges payable 722,536 1,225,841
Other 1,205,414 1,248,660
Other financial liabilities 6,135,115 5,029,358
31.12.2017 Additions Utilisations Other changes 30.09.2018
Provision for product warranty 53,243 - (7) - 53,236
Restructuring provision 228,900 - (42,446) - 186,454
Other provisions 313,838 16,182 (23,527) - 306,493
Provisions for risks and charges 595,981 16,182 (65,980) - 546,183

44
The restructuring provision reflects the best estimate of the liability for restructuring at the reporting
date.
Other provisions reflect the estimated liabilities that may arise from losses to complete styling and
engineering contracts, potential disputes with former employees and environmental risks. The
column titled “Additions” shows the effects of unrealised losses to complete long-term contracts,
which are also shown in “Utilisations”. (b) Contingent liabilities and litigation The Supreme Court of Cassation definitely ruled in the parent’s favour with respect to its appeal against the 2002 and 2003 tax notices about the alleged non-payment of VAT on the sale of goods to the Peugeot-Citroen Group. The amount claimed was roughly €29.4 million plus interest.
There are no contingent liabilities or litigation to report at the reporting date.
17. Current and deferred taxes (a) Deferred taxes The table below provides a breakdown of deferred tax assets and liabilities:
The net deferred tax assets shown in the condensed interim consolidated financial statements mainly refer to the German companies. They reflect the recoverable portion of the tax loss carryforwards, determined based on forecast future taxable profit and taking into account the agreement for the filing of a national consolidated tax return signed by the German companies, headed by the subsidiary Pininfarina Extra S.r.l.. Deferred tax assets decreased due to the disappearance of the temporary differences of the subsidiary Pininfarina Extra S.r.l..
Since the Group reported a taxable profit for 2017 after several years in which it recorded losses,
the directors did not recognise the deferred tax assets relating to tax loss carryforwards in the
condensed interim consolidated financial statements at 30 September 2018, as they deemed it
prudent to wait for a consolidation of this turnaround.
30.09.2018 31.12.2017
Deferred tax assets 873,703 880,553
(Deferred tax liabilities) - (2,915)
Net deferred tax assets 873,703 877,638
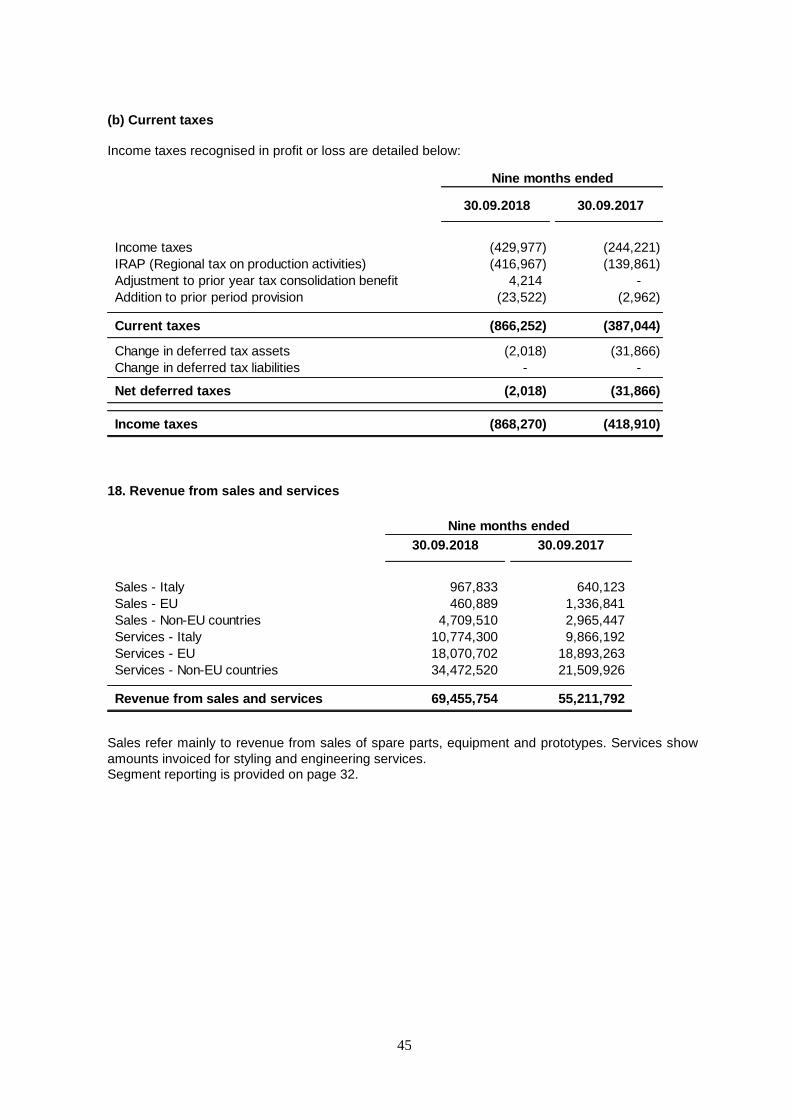
45
(b) Current taxes Income taxes recognised in profit or loss are detailed below:
18. Revenue from sales and services
Sales refer mainly to revenue from sales of spare parts, equipment and prototypes. Services show
amounts invoiced for styling and engineering services. Segment reporting is provided on page 32.
30.09.2018 30.09.2017
Income taxes (429,977) (244,221)
IRAP (Regional tax on production activities) (416,967) (139,861)
Adjustment to prior year tax consolidation benefit 4,214 -
Addition to prior period provision (23,522) (2,962)
Current taxes (866,252) (387,044)
Change in deferred tax assets (2,018) (31,866)
Change in deferred tax liabilities - -
Net deferred taxes (2,018) (31,866)
Income taxes (868,270) (418,910)
Nine months ended
30.09.2018 30.09.2017
Sales - Italy 967,833 640,123
Sales - EU 460,889 1,336,841
Sales - Non-EU countries 4,709,510 2,965,447
Services - Italy 10,774,300 9,866,192
Services - EU 18,070,702 18,893,263
Services - Non-EU countries 34,472,520 21,509,926
Revenue from sales and services 69,455,754 55,211,792
Nine months ended
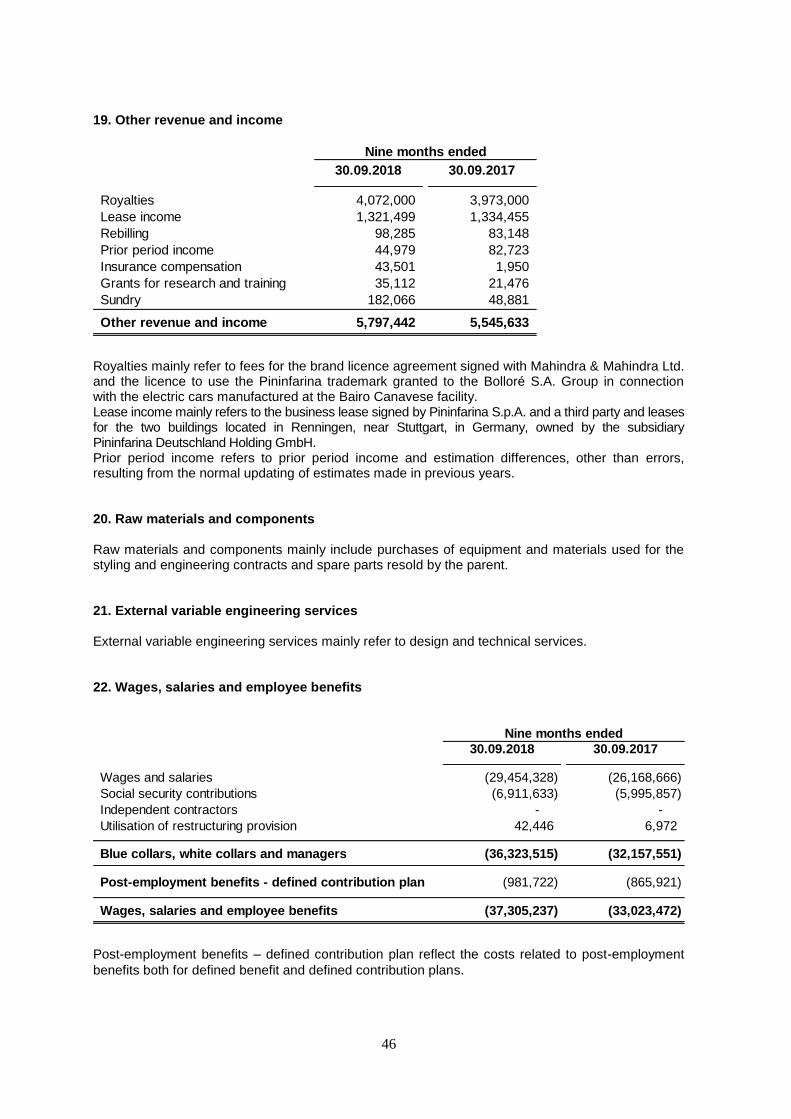
46
19. Other revenue and income
Royalties mainly refer to fees for the brand licence agreement signed with Mahindra & Mahindra Ltd. and the licence to use the Pininfarina trademark granted to the Bolloré S.A. Group in connection with the electric cars manufactured at the Bairo Canavese facility. Lease income mainly refers to the business lease signed by Pininfarina S.p.A. and a third party and leases for the two buildings located in Renningen, near Stuttgart, in Germany, owned by the subsidiary Pininfarina Deutschland Holding GmbH. Prior period income refers to prior period income and estimation differences, other than errors, resulting from the normal updating of estimates made in previous years. 20. Raw materials and components Raw materials and components mainly include purchases of equipment and materials used for the styling and engineering contracts and spare parts resold by the parent. 21. External variable engineering services External variable engineering services mainly refer to design and technical services. 22. Wages, salaries and employee benefits
Post-employment benefits – defined contribution plan reflect the costs related to post-employment
benefits both for defined benefit and defined contribution plans.
30.09.2018 30.09.2017
Royalties 4,072,000 3,973,000
Lease income 1,321,499 1,334,455
Rebilling 98,285 83,148
Prior period income 44,979 82,723
Insurance compensation 43,501 1,950
Grants for research and training 35,112 21,476
Sundry 182,066 48,881
Other revenue and income 5,797,442 5,545,633
Nine months ended
30.09.2018 30.09.2017
Wages and salaries (29,454,328) (26,168,666)
Social security contributions (6,911,633) (5,995,857)
Independent contractors - -
Utilisation of restructuring provision 42,446 6,972
Blue collars, white collars and managers (36,323,515) (32,157,551)
Post-employment benefits - defined contribution plan (981,722) (865,921)
Wages, salaries and employee benefits (37,305,237) (33,023,472)
Nine months ended
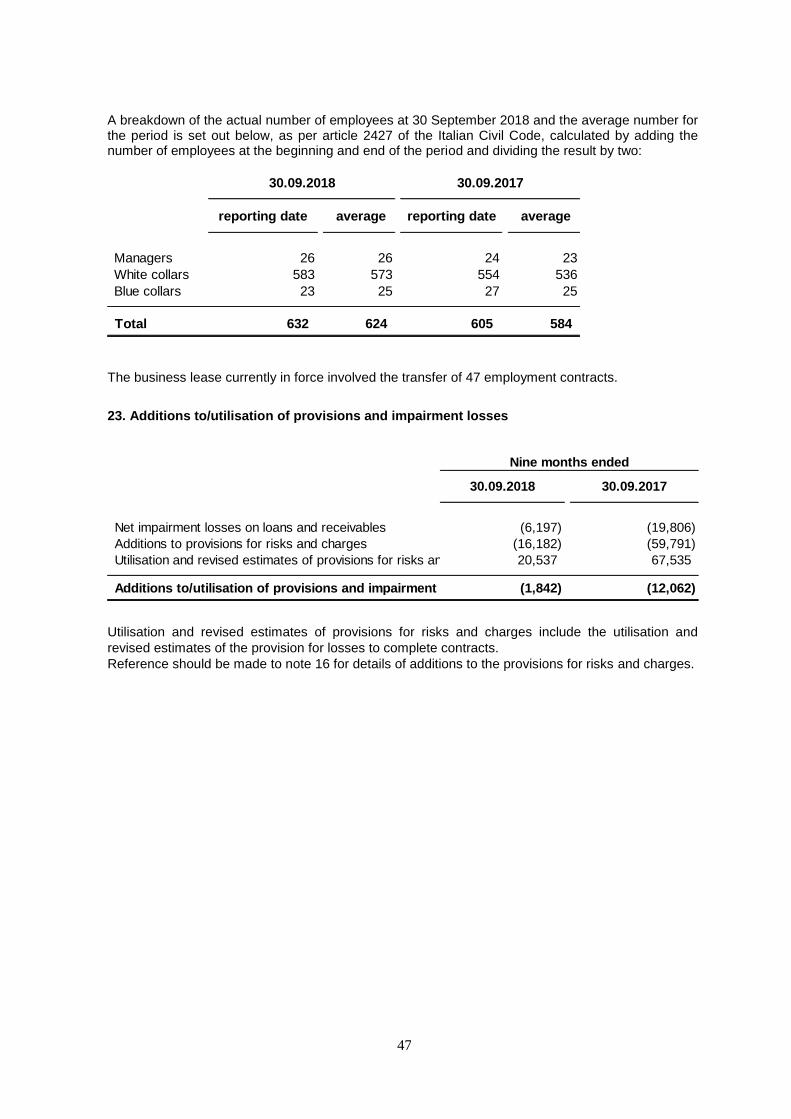
47
A breakdown of the actual number of employees at 30 September 2018 and the average number for the period is set out below, as per article 2427 of the Italian Civil Code, calculated by adding the number of employees at the beginning and end of the period and dividing the result by two:
The business lease currently in force involved the transfer of 47 employment contracts.
23. Additions to/utilisation of provisions and impairment losses
Utilisation and revised estimates of provisions for risks and charges include the utilisation and
revised estimates of the provision for losses to complete contracts.
Reference should be made to note 16 for details of additions to the provisions for risks and charges.
reporting date average reporting date average
Managers 26 26 24 23
White collars 583 573 554 536
Blue collars 23 25 27 25
Total 632 624 605 584
30.09.2018 30.09.2017
30.09.2018 30.09.2017
Net impairment losses on loans and receivables (6,197) (19,806)
Additions to provisions for risks and charges (16,182) (59,791)
Utilisation and revised estimates of provisions for risks and charges 20,537 67,535
Additions to/utilisation of provisions and impairment losses (1,842) (12,062)
Nine months ended
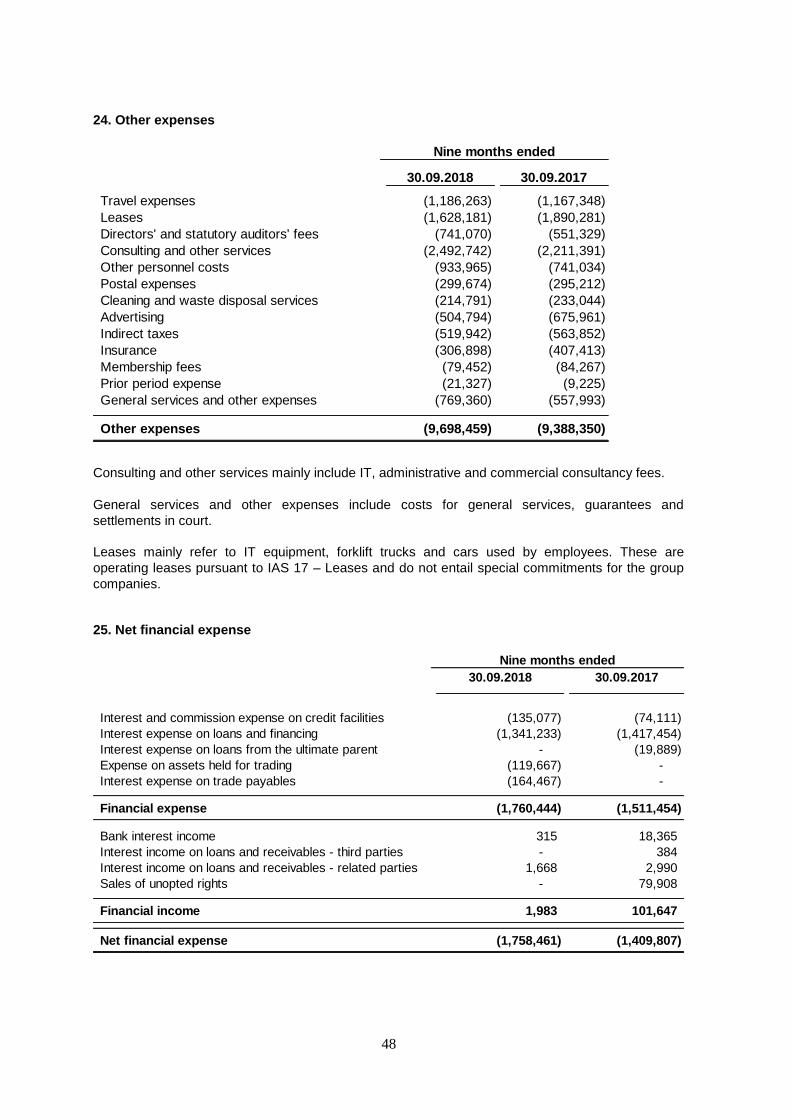
48
24. Other expenses
Consulting and other services mainly include IT, administrative and commercial consultancy fees.
General services and other expenses include costs for general services, guarantees and
settlements in court.
Leases mainly refer to IT equipment, forklift trucks and cars used by employees. These are
operating leases pursuant to IAS 17 – Leases and do not entail special commitments for the group
companies. 25. Net financial expense
30.09.2018 30.09.2017
Travel expenses (1,186,263) (1,167,348)
Leases (1,628,181) (1,890,281)
Directors' and statutory auditors' fees (741,070) (551,329)
Consulting and other services (2,492,742) (2,211,391)
Other personnel costs (933,965) (741,034)
Postal expenses (299,674) (295,212)
Cleaning and waste disposal services (214,791) (233,044)
Advertising (504,794) (675,961)
Indirect taxes (519,942) (563,852)
Insurance (306,898) (407,413)
Membership fees (79,452) (84,267)
Prior period expense (21,327) (9,225)
General services and other expenses (769,360) (557,993)
Other expenses (9,698,459) (9,388,350)
Nine months ended
30.09.2018 30.09.2017
Interest and commission expense on credit facilities (135,077) (74,111)
Interest expense on loans and financing (1,341,233) (1,417,454)
Interest expense on loans from the ultimate parent - (19,889)
Expense on assets held for trading (119,667) -
Interest expense on trade payables (164,467) -
Financial expense (1,760,444) (1,511,454)
Bank interest income 315 18,365
Interest income on loans and receivables - third parties - 384
Interest income on loans and receivables - related parties 1,668 2,990
Sales of unopted rights - 79,908
Financial income 1,983 101,647
Net financial expense (1,758,461) (1,409,807)
Nine months ended

49
Interest and commission expense refers to interest paid on credit facilities and bank fees.
Interest expense on non-current loans and financing of €1,341,233 comprises the effect of
amortised-cost accounting (€1,268,046) and interest accrued under the existing Agreement
(€71,649). The remainder relates to foreign companies.
Interest expense on trade payables of €164,467 relates to the amortised-cost measurement of
liabilities arising from an advisory services agreement that the parent signed in connection with a
long-term engineering contract.
Bank interest income accrued on the current account credit balances.
Interest income on loans and receivables - related parties accrued on the loans granted to the
associate Goodmind S.r.l. by Pininfarina Extra S.r.l.. OTHER INFORMATION
Events after the reporting period
On 10 October 2018, the parent’s Board of Directors approved the merger of Pininfarina Extra S.r.l.
into Pininfarina S.p.A..
There are no other significant events that occurred after the reporting date.
Related party transactions
The table below, which is presented pursuant to Consob communication no. DEM/6064293 of 28 July 2006, summarises related party transactions, including intragroup transactions. These transactions were carried out at market conditions, consistent with the nature of the goods exchanged or services provided. They were neither atypical nor unusual for the purposes of the above-mentioned communication.
Intragroup transactions include:
- Goodmind S.r.l.: loan agreement with Pininfarina Extra S.r.l. and lease for equipped office premises with the parent, terminated in February 2018;
- Signature S.r.l.: loan agreement with the parent, purchases and sales of goods with Pininfarina Extra S.r.l.;
- Tech Mahindra Ltd: services agreements with Pininfarina Deutschland GmbH, Pininfarina S.p.A. and Pininfarina of America Corp.; sales of goods by Pininfarina Extra S.r.l. and recharge of costs incurred by Pininfarina S.p.A. on the company’s behalf.
- Tech Mahindra GmbH: lease agreement for equipped office premises with Pininfarina Deutschland GmbH;
Assets Liabilities Assets Liabilities Revenue Expense Income Expense
Goodmind S.r.l. - - 102,138 - 5,333 - 1,668 -
Signature S.r.l. 57,452 26,916 550,000 - 98,200 63,674 - -
Tech Mahindra Ltd 23,318 265,794 - - 82,318 846,969 - -
Tech Mahindra GmbH 10,115 - - - 93,823 - - -
Mahindra&Mahindra Ltd 3,265,864 - - - 5,672,515 - - -
Mahindra Graphic Research Design S.r.l. - 121,356 - - - 362,685 - -
Ssangyong Motor Company - - - - 415,794 - - -
Automobili Pininfarina GmbH 2,506,287 - - - 2,421,140 - - -
Total 5,863,036 414,066 652,138 - 8,789,123 1,273,328 1,668 -
Commercial Financial Operating Financial

50
- Mahindra & Mahindra Ltd: brand licence agreement and engineering services agreements with Pininfarina S.p.A. and Pininfarina Engineering S.r.l. and sales of goods and services by Pininfarina Extra S.r.l.;
- Mahindra Graphic Research Design S.r.l.: engineering services agreements with Pininfarina S.p.A. and Pininfarina Engineering S.r.l.;
- Ssangyong Motor Company: design services agreement with Pininfarina S.p.A.;
- Automobili Pininfarina GmbH: lease for equipped office premises with Pininfarina Deutschland GmbH and design and engineering agreement with Pininfarina S.p.A..
In addition to the above figures, Studio Starclex - Studio Legale Associato Guglielmetti, related to Romina Guglielmetti (director of Pininfarina S.p.A.), provided legal assistance to the parent for €27,000, while Greta Pininfarina provided employee services to Pininfarina Extra S.r.l. for a cost of approximately €14,000. On 26 September 2018, Pininfarina Engineering S.r.l. signed an engineering services agreement with Mahindra & Mahindra Ltd (“M&M”) for the development of a project to design the upper body systems of the body shell, integration of the body shell with the main operating systems and implementation of the performance requested of a new Mahindra vehicle based on its new platform. Pininfarina Engineering S.r.l. will receive a fee of €10,375,000.00 for its services to be provided over roughly 16 months. This fee qualifies the transaction as a “major transaction” pursuant to the relevant legislation. The services provided are part of the “company’s normal business activities” and are rendered “on an arm’s length basis”. Directors’ and statutory auditors’ fees
(€'000) 30.09.2018 30.09.2017
Directors 658 468
Statutory auditors 83 83
Total 741 551
Nine months ended

51
Significant non-recurring transactions As required by Consob communication no. DEM/6064293 of 28 July 2006, the effects of non-recurring events or transactions, i.e., those events or transactions that do not occur frequently during the normal course of business, are shown in the tables below:
30.09.2018
30.09.2018, net
of significant
non-recurring
transactions
Property, plant and equipment 42,125,411 42,377,837
Investment property 7,478,640 7,478,640
Intangible assets 7,355,925 7,355,925
Equity investments 828,138 298,858
Deferred tax assets 873,703 873,703
Non-current financial assets 652,138 102,138
NON-CURRENT ASSETS 59,313,955 58,487,101
Inventories 477,172 477,172
Contract work in progress 4,191,753 4,191,753
Current financial assets 12,779,511 12,779,511
Derivatives - -
Trade receivables and other assets 33,387,301 33,387,301
Cash and cash equivalents 25,435,477 26,081,257
CURRENT ASSETS 76,271,214 76,916,994
Assets held for sale - -
TOTAL ASSETS 135,585,169 135,404,095
Share capital and reserves 59,412,490 59,412,490
Profit from continuing operations 2,710,756 2,529,682
EQUITY 62,123,246 61,942,172
Non-current loans and borrowings 25,597,815 25,597,815
Deferred tax liabilities - -
Post-employment benefits and other provisions 4,739,043 4,739,043
NON-CURRENT LIABILITIES 30,336,858 30,336,858
Current loans and borrowings 3,690,681 3,690,681
Other financial liabilities 6,135,115 6,135,115
Trade payables 30,020,706 30,020,706
Current tax liabilities 859,577 859,577
Provisions for risks and charges 546,183 546,183
Other liabilities 1,872,803 1,872,803
CURRENT LIABILITIES 43,125,065 43,125,065 0Passività correlate ad attività non correnti destinate ad essere cedute- - 0
TOTAL LIABILITIES 73,461,923 73,461,923
TOTAL LIABILITIES AND EQUITY 135,585,169 135,404,095
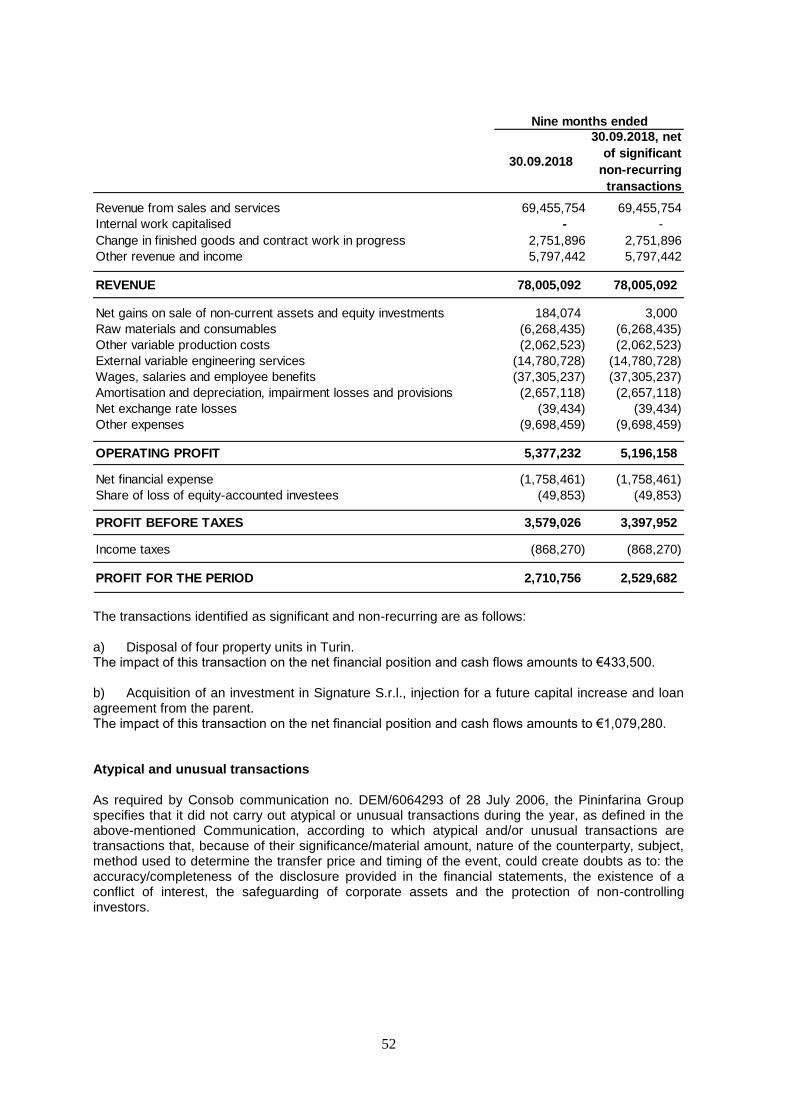
52
The transactions identified as significant and non-recurring are as follows: a) Disposal of four property units in Turin. The impact of this transaction on the net financial position and cash flows amounts to €433,500. b) Acquisition of an investment in Signature S.r.l., injection for a future capital increase and loan agreement from the parent. The impact of this transaction on the net financial position and cash flows amounts to €1,079,280. Atypical and unusual transactions As required by Consob communication no. DEM/6064293 of 28 July 2006, the Pininfarina Group specifies that it did not carry out atypical or unusual transactions during the year, as defined in the above-mentioned Communication, according to which atypical and/or unusual transactions are transactions that, because of their significance/material amount, nature of the counterparty, subject, method used to determine the transfer price and timing of the event, could create doubts as to: the accuracy/completeness of the disclosure provided in the financial statements, the existence of a conflict of interest, the safeguarding of corporate assets and the protection of non-controlling investors.
30.09.2018
30.09.2018, net
of significant
non-recurring
transactions
Revenue from sales and services 69,455,754 69,455,754
Internal work capitalised - -
Change in finished goods and contract work in progress 2,751,896 2,751,896
Other revenue and income 5,797,442 5,797,442
REVENUE 78,005,092 78,005,092
Net gains on sale of non-current assets and equity investments 184,074 3,000
Raw materials and consumables (6,268,435) (6,268,435)
Other variable production costs (2,062,523) (2,062,523)
External variable engineering services (14,780,728) (14,780,728)
Wages, salaries and employee benefits (37,305,237) (37,305,237)
Amortisation and depreciation, impairment losses and provisions (2,657,118) (2,657,118)
Net exchange rate losses (39,434) (39,434)
Other expenses (9,698,459) (9,698,459)
OPERATING PROFIT 5,377,232 5,196,158
Net financial expense (1,758,461) (1,758,461)
Share of loss of equity-accounted investees (49,853) (49,853)
PROFIT BEFORE TAXES 3,579,026 3,397,952
Income taxes (868,270) (868,270)
PROFIT FOR THE PERIOD 2,710,756 2,529,682
Nine months ended

53
Pininfarina S.p.A.
Interim separate financial statements as at and for the nine months ended 30 September 2018
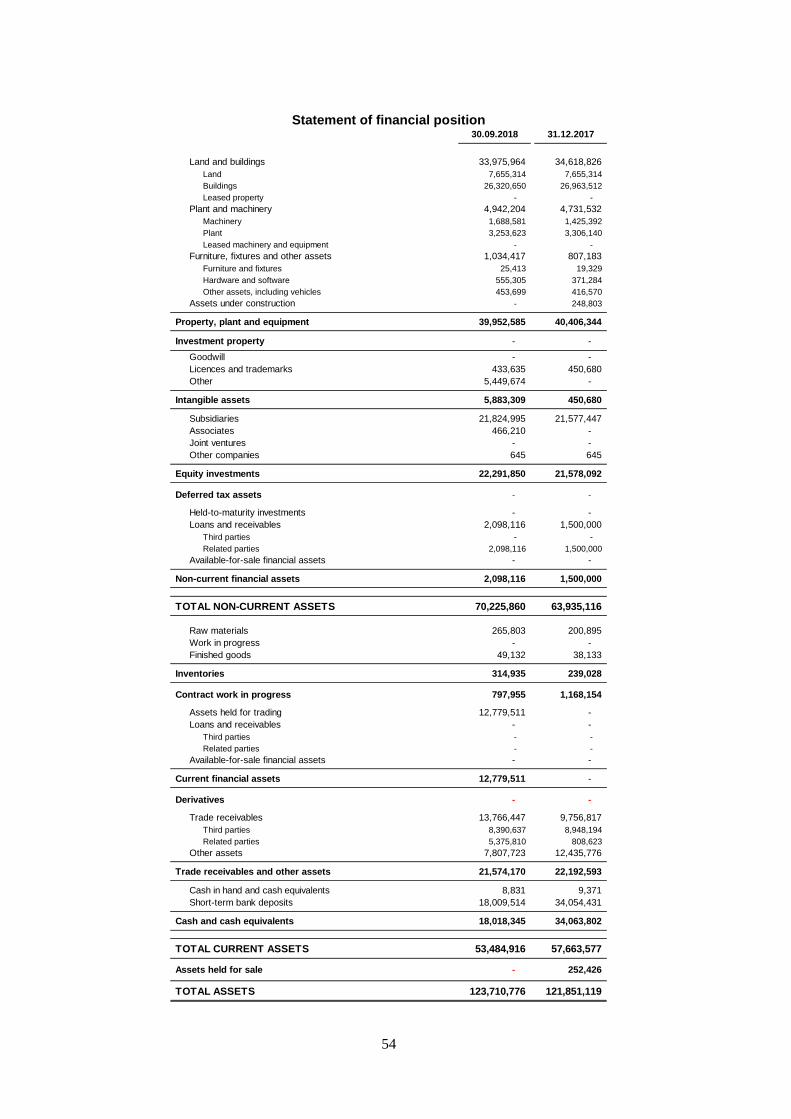
54
Statement of financial position
30.09.2018 31.12.2017
Land and buildings 33,975,964 34,618,826
Land 7,655,314 7,655,314
Buildings 26,320,650 26,963,512
Leased property - -
Plant and machinery 4,942,204 4,731,532
Machinery 1,688,581 1,425,392
Plant 3,253,623 3,306,140
Leased machinery and equipment - -
Furniture, fixtures and other assets 1,034,417 807,183
Furniture and fixtures 25,413 19,329
Hardware and software 555,305 371,284
Other assets, including vehicles 453,699 416,570
Assets under construction - 248,803
Property, plant and equipment 39,952,585 40,406,344
Investment property - -
Goodwill - -
Licences and trademarks 433,635 450,680
Other 5,449,674 -
Intangible assets 5,883,309 450,680
Subsidiaries 21,824,995 21,577,447
Associates 466,210 -
Joint ventures - -
Other companies 645 645
Equity investments 22,291,850 21,578,092
Deferred tax assets - -
Held-to-maturity investments - -
Loans and receivables 2,098,116 1,500,000
Third parties - -
Related parties 2,098,116 1,500,000
Available-for-sale financial assets - -
Non-current financial assets 2,098,116 1,500,000
TOTAL NON-CURRENT ASSETS 70,225,860 63,935,116
Raw materials 265,803 200,895
Work in progress - -
Finished goods 49,132 38,133
Inventories 314,935 239,028
Contract work in progress 797,955 1,168,154
Assets held for trading 12,779,511 -
Loans and receivables - -
Third parties - -
Related parties - -
Available-for-sale financial assets - -
Current financial assets 12,779,511 -
Derivatives - -
Trade receivables 13,766,447 9,756,817
Third parties 8,390,637 8,948,194
Related parties 5,375,810 808,623
Other assets 7,807,723 12,435,776
Trade receivables and other assets 21,574,170 22,192,593
Cash in hand and cash equivalents 8,831 9,371
Short-term bank deposits 18,009,514 34,054,431
Cash and cash equivalents 18,018,345 34,063,802
TOTAL CURRENT ASSETS 53,484,916 57,663,577
Assets held for sale - 252,426
TOTAL ASSETS 123,710,776 121,851,119

55
Statement of financial position
Pursuant to Consob resolution no. 15519 of 27 July 2006, an ad hoc statement of financial position showing related party transactions has not been prepared as these are already shown in the interim separate financial statements schedules. As for transactions with other related parties, such as directors and statutory auditors, “Trade payables - third parties” include accrued fees for the period of €118,743.
30.09.2018 31.12.2017
Share capital 54,271,170 54,271,170
Share premium reserve 2,053,660 2,053,660
Reserve for treasury shares 175,697 175,697
Legal reserve 6,063,759 6,033,331
Stock option reserve 1,724,851 1,172,170
Other reserves 2,646,208 2,646,208
Losses carried forward (6,570,890) (7,165,362)
Profit for the period/year 2,930,012 608,558
EQUITY 63,294,467 59,795,432
Finance lease liabilities - -
Other loans and borrowings 25,492,815 24,224,769
Third parties 25,492,815 24,224,769
Related parties - -
Non-current loans and borrowings 25,492,815 24,224,769
Deferred tax liabilities - -
Italian post-employment benefits 2,701,426 4,046,976
Other - -
Post-employment benefits 2,701,426 4,046,976
TOTAL NON-CURRENT LIABILITIES 28,194,241 28,271,745
Bank overdrafts - -
Finance lease liabilities - -
Other loans and borrowings 3,824,261 3,828,475
Third parties 3,493,899 3,493,899
Related parties 330,362 334,576
Current loans and borrowings 3,824,261 3,828,475
Wages and salaries payable 1,588,915 1,888,292
Social security charges payable 359,677 1,014,776
Other 465,442 1,012,770
Other financial liabilities 2,414,034 3,915,838
Third parties 12,905,832 13,571,580
Related parties 1,621,161 507,407
Advances for contract work in progress 9,024,515 10,537,040
Trade payables 23,551,508 24,616,027
Direct tax liabilities - -
Other tax liabilities 392,796 234,335
Current tax liabilities 392,796 234,335
Derivatives - -
Provision for product warranty 53,236 53,243
Restructuring provision 186,454 228,900
Other provisions 299,779 307,124
Provisions for risks and charges 539,469 589,267
Third parties 300,000 600,000
Related parties 1,200,000 -
Other liabilities 1,500,000 600,000
TOTAL CURRENT LIABILITIES 32,222,068 33,783,942
TOTAL LIABILITIES 60,416,309 62,055,687
Liabilities associated with assets held for sale - -
TOTAL LIABILITIES AND EQUITY 123,710,776 121,851,119 - -
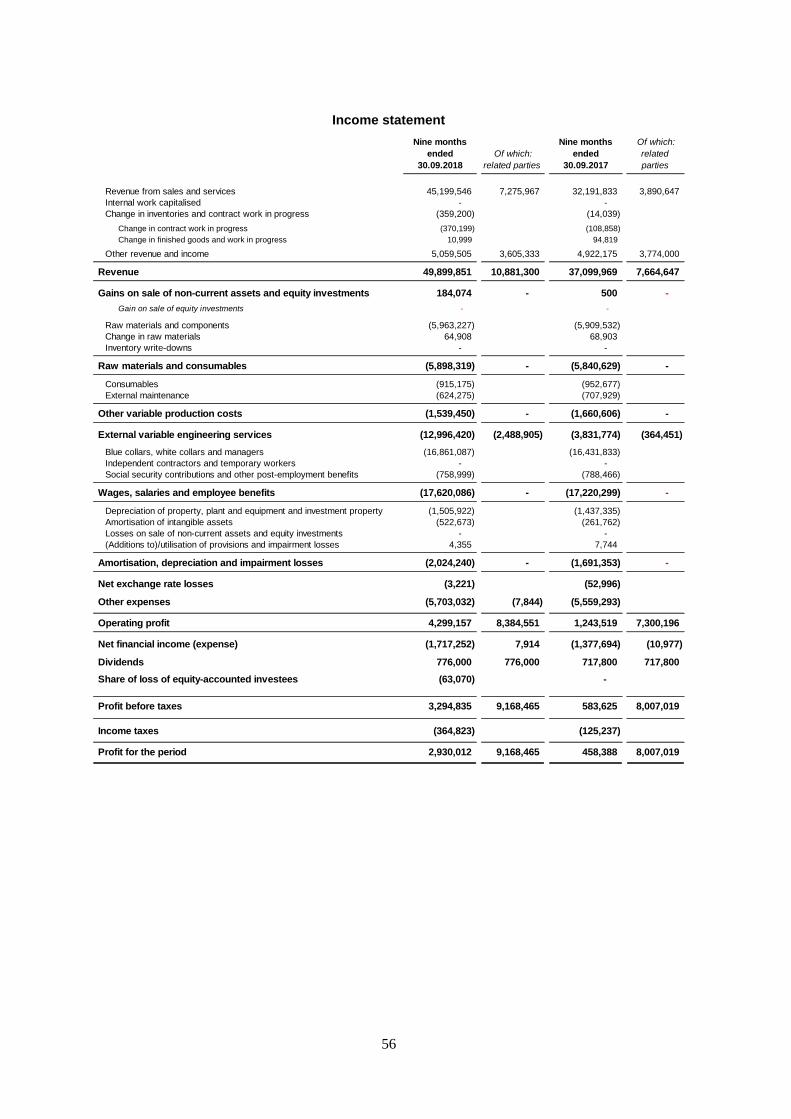
56
Income statement
Nine months
ended
30.09.2018
Of which:
related parties
Nine months
ended
30.09.2017
Of which:
related
parties
Revenue from sales and services 45,199,546 7,275,967 32,191,833 3,890,647
Internal work capitalised - -
Change in inventories and contract work in progress (359,200) (14,039) - -
Change in contract work in progress (370,199) (108,858)
Change in finished goods and work in progress 10,999 94,819 - -
Other revenue and income 5,059,505 3,605,333 4,922,175 3,774,000
Revenue 49,899,851 10,881,300 37,099,969 7,664,647
Gains on sale of non-current assets and equity investments 184,074 - 500 -
Gain on sale of equity investments - -
Raw materials and components (5,963,227) (5,909,532)
Change in raw materials 64,908 68,903
Inventory write-downs - -
Raw materials and consumables (5,898,319) - (5,840,629) -
Consumables (915,175) (952,677)
External maintenance (624,275) (707,929)
Other variable production costs (1,539,450) - (1,660,606) -
External variable engineering services (12,996,420) (2,488,905) (3,831,774) (364,451)
Blue collars, white collars and managers (16,861,087) (16,431,833)
Independent contractors and temporary workers - -
Social security contributions and other post-employment benefits (758,999) (788,466)
Wages, salaries and employee benefits (17,620,086) - (17,220,299) -
Depreciation of property, plant and equipment and investment property (1,505,922) (1,437,335)
Amortisation of intangible assets (522,673) (261,762)
Losses on sale of non-current assets and equity investments - -
(Additions to)/utilisation of provisions and impairment losses 4,355 7,744
Amortisation, depreciation and impairment losses (2,024,240) - (1,691,353) -
Net exchange rate losses (3,221) (52,996)
Other expenses (5,703,032) (7,844) (5,559,293)
Operating profit 4,299,157 8,384,551 1,243,519 7,300,196
Net financial income (expense) (1,717,252) 7,914 (1,377,694) (10,977)
Dividends 776,000 776,000 717,800 717,800
Share of loss of equity-accounted investees (63,070) -
Profit before taxes 3,294,835 9,168,465 583,625 8,007,019
Income taxes (364,823) (125,237)
Profit for the period 2,930,012 9,168,465 458,388 8,007,019

57
Statement of comprehensive income
Pursuant to Consob resolution no. 15519 of 27 July 2006, the effects of related party transactions on the income statement of Pininfarina S.p.A. are shown in the table provided above and in the “Other Information” section of the notes.
30.09.2018 30.09.2017
Profit for the period 2,930,012 458,388
Other comprehensive income:
Items that will not be reclassified to profit or loss:
- Actuarial gains on defined benefit plans - IAS 19 16,342 7,122
- Income taxes - -
- Other - -
Total items of other comprehensive income that will not be
reclassified to profit or loss, net of tax effect:
Items that will or may be subsequently reclassified
to profit or loss:
- Gains (losses) from translation of financial statements of foreign operations - IAS 21 - -
- Other - -
Total items of other comprehensive income that will be subsequently
reclassified to profit or loss, net of tax effect:
Total other comprehensive income, net of tax effect 16,342 7,122
Comprehensive income 2,946,354 465,510
16,342 7,122
- -
Nine months ended
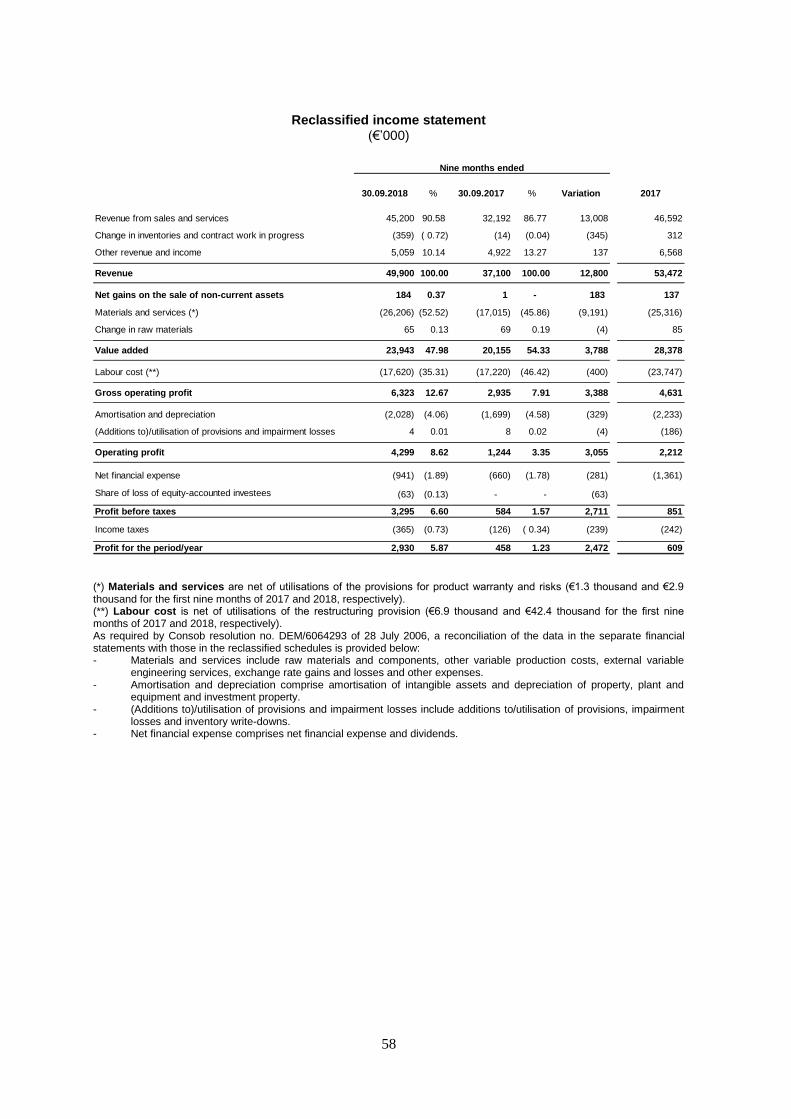
58
Reclassified income statement (€’000)
(*) Materials and services are net of utilisations of the provisions for product warranty and risks (€1.3 thousand and €2.9 thousand for the first nine months of 2017 and 2018, respectively). (**) Labour cost is net of utilisations of the restructuring provision (€6.9 thousand and €42.4 thousand for the first nine months of 2017 and 2018, respectively). As required by Consob resolution no. DEM/6064293 of 28 July 2006, a reconciliation of the data in the separate financial statements with those in the reclassified schedules is provided below: - Materials and services include raw materials and components, other variable production costs, external variable
engineering services, exchange rate gains and losses and other expenses. - Amortisation and depreciation comprise amortisation of intangible assets and depreciation of property, plant and
equipment and investment property. - (Additions to)/utilisation of provisions and impairment losses include additions to/utilisation of provisions, impairment
losses and inventory write-downs. - Net financial expense comprises net financial expense and dividends.
30.09.2018 % 30.09.2017 % Variation 2017
Revenue from sales and services 45,200 90.58 32,192 86.77 13,008 46,592
Change in inventories and contract work in progress (359) ( 0.72) (14) (0.04) (345) 312
Other revenue and income 5,059 10.14 4,922 13.27 137 6,568
Revenue 49,900 100.00 37,100 100.00 12,800 53,472
Net gains on the sale of non-current assets 184 0.37 1 - 183 137
Materials and services (*) (26,206) (52.52) (17,015) (45.86) (9,191) (25,316)
Change in raw materials 65 0.13 69 0.19 (4) 85
Value added 23,943 47.98 20,155 54.33 3,788 28,378
Labour cost (**) (17,620) (35.31) (17,220) (46.42) (400) (23,747)
Gross operating profit 6,323 12.67 2,935 7.91 3,388 4,631
Amortisation and depreciation (2,028) (4.06) (1,699) (4.58) (329) (2,233)
(Additions to)/utilisation of provisions and impairment losses 4 0.01 8 0.02 (4) (186)
Operating profit 4,299 8.62 1,244 3.35 3,055 2,212
Net financial expense (941) (1.89) (660) (1.78) (281) (1,361)
Share of loss of equity-accounted investees (63) (0.13) - - (63)
Profit before taxes 3,295 6.60 584 1.57 2,711 851
Income taxes (365) (0.73) (126) ( 0.34) (239) (242)
Profit for the period/year 2,930 5.87 458 1.23 2,472 609
Nine months ended

59
Reclassified statement of financial position (€’000)
Net financial position (€’000)
30.09.2018 31.12.2017 Variation 30.09.2017
Net non-current assets (A)
Net intangible assets 5,883 451 5,432 468
Net property, plant and equipment and investment property 39,953 40,406 (453) 40,203
Equity investments 22,292 21,578 714 21,578
Total A 68,128 62,435 5,693 62,249
Working capital (B)
Inventories 1,113 1,407 (294) 1,065
Net trade receivables and other assets 21,574 22,193 (619) 10,782
Assets held for sale - 252 (252) -
Trade payables (23,552) (24,616) 1,064 (16,231)
Provisions for risks and charges (539) (589) 50 (398)
Other liabilities (4,308) (4,750) 442 (5,205)
Total B (5,712) (6,103) 391 (9,987)
Net invested capital (C=A+B) 62,416 56,332 6,084 52,262
Post-employment benefits (D) 2,701 4,047 (1,346) 4,035
Net capital requirements (E=C-D) 59,715 52,285 7,430 48,227
Equity (F) 63,294 59,795 3,499 59,474
Net financial (position) debt (G)
Non-current loans and borrowings 23,395 22,725 670 25,758
Net current financial position (26,974) (30,235) 3,261 (37,005)
Total G (3,579) (7,510) 3,931 (11,247)
Total as in E (H=F+G) 59,715 52,285 7,430 48,227
30.09.2018 31.12.2017 Variation 30.09.2017
Cash and cash equivalents 18,018 34,064 (16,046) 40,631
Current assets held for trading 12,780 - 12,780 -
Current finance lease liabilities - - - -
Loans and borrowings - related parties (330) (335) 5 (258)
Current portion of bank loans and borrowings (3,494) (3,494) - (3,368)
Net current financial position 26,974 30,235 (3,261) 37,005
Non-current loans and receivables - related parties 2,098 1,500 598 1,500
Non-current finance lease liabilities - - - -
Non-current bank loans and borrowings (25,493) (24,225) (1,268) (27,258)
Non-current loans and borrowings (23,395) (22,725) (670) (25,758)
NET FINANCIAL POSITION 3,579 7,510 (3,931) 11,247

60
Statement of changes in equity
31.12.2016
Comprehensive
income
Stock
option
reserve
Allocation of
prior year
profit
Proceeds
from the issue
of shares
Capital
increase
transaction
costs 30.09.2017
Share capital 30,150,694 - - - 24,120,476 - 54,271,170
Share premium reserve - - - - 2,412,047 (358,387) 2,053,660
Reserve for treasury shares 175,697 - - - - - 175,697
Legal reserve 6,033,331 - - - - - 6,033,331
Stock option reserve 157,793 - 828,126 - - - 985,919
Other reserves 2,646,208 - - - - - 2,646,208
Losses carried forward (30,424,802) 7,122 - 23,267,243 - - (7,150,437)
Profit for the period/year 23,267,243 458,388 - (23,267,243) - - 458,388
EQUITY 32,006,164 465,510 828,126 - 26,532,523 (358,387) 59,473,936
31.12.2017
Comprehensive
income
Stock
option
reserve
Allocation of
prior year
profit
Proceeds
from the issue
of shares
Capital
increase
transaction
costs 30.09.2018
Share capital 54,271,170 - - - - 54,271,170
Share premium reserve 2,053,660 - - - 2,053,660
Reserve for treasury shares 175,697 - - - - - 175,697
Legal reserve 6,033,331 - - 30,428 - - 6,063,759
Stock option reserve 1,172,170 - 552,681 - - - 1,724,851
Other reserves 2,646,208 - - - - - 2,646,208
Losses carried forward (7,165,362) 16,342 - 578,130 - - (6,570,890)
Profit for the period/year 608,558 2,930,012 - (608,558) - - 2,930,012
EQUITY 59,795,432 2,946,354 552,681 - - - 63,294,467
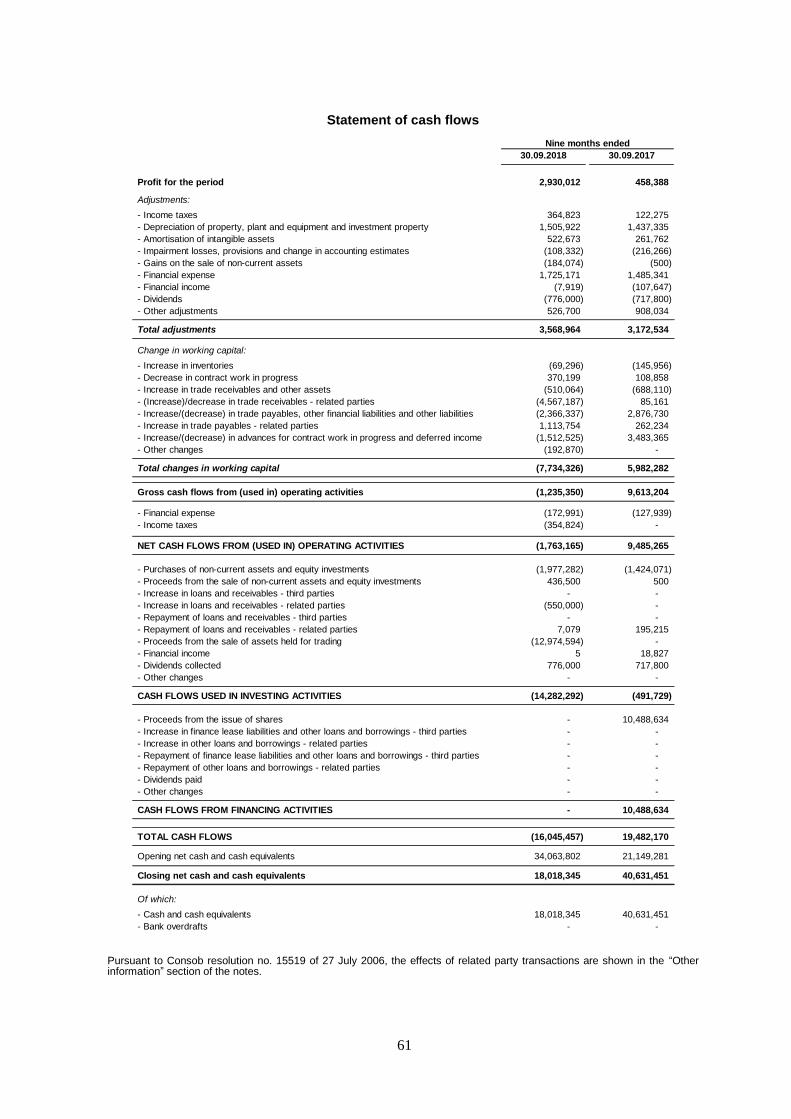
61
Statement of cash flows
Pursuant to Consob resolution no. 15519 of 27 July 2006, the effects of related party transactions are shown in the “Other information” section of the notes.
30.09.2018 30.09.2017
Profit for the period 2,930,012 458,388
Adjustments:
- Income taxes 364,823 122,275
- Depreciation of property, plant and equipment and investment property 1,505,922 1,437,335
- Amortisation of intangible assets 522,673 261,762
- Impairment losses, provisions and change in accounting estimates (108,332) (216,266)
- Gains on the sale of non-current assets (184,074) (500)
- Financial expense 1,725,171 1,485,341
- Financial income (7,919) (107,647)
- Dividends (776,000) (717,800)
- Other adjustments 526,700 908,034
Total adjustments 3,568,964 3,172,534
Change in working capital:
- Increase in inventories (69,296) (145,956)
- Decrease in contract work in progress 370,199 108,858
- Increase in trade receivables and other assets (510,064) (688,110)
- (Increase)/decrease in trade receivables - related parties (4,567,187) 85,161
- Increase/(decrease) in trade payables, other financial liabilities and other liabilities (2,366,337) 2,876,730
- Increase in trade payables - related parties 1,113,754 262,234
- Increase/(decrease) in advances for contract work in progress and deferred income (1,512,525) 3,483,365
- Other changes (192,870) -
Total changes in working capital (7,734,326) 5,982,282
Gross cash flows from (used in) operating activities (1,235,350) 9,613,204
- Financial expense (172,991) (127,939)
- Income taxes (354,824) -
NET CASH FLOWS FROM (USED IN) OPERATING ACTIVITIES (1,763,165) 9,485,265
- Purchases of non-current assets and equity investments (1,977,282) (1,424,071)
- Proceeds from the sale of non-current assets and equity investments 436,500 500
- Increase in loans and receivables - third parties - -
- Increase in loans and receivables - related parties (550,000) -
- Repayment of loans and receivables - third parties - -
- Repayment of loans and receivables - related parties 7,079 195,215
- Proceeds from the sale of assets held for trading (12,974,594) -
- Financial income 5 18,827
- Dividends collected 776,000 717,800
- Other changes - -
CASH FLOWS USED IN INVESTING ACTIVITIES (14,282,292) (491,729)
- Proceeds from the issue of shares - 10,488,634
- Increase in finance lease liabilities and other loans and borrowings - third parties - -
- Increase in other loans and borrowings - related parties - -
- Repayment of finance lease liabilities and other loans and borrowings - third parties - -
- Repayment of other loans and borrowings - related parties - -
- Dividends paid - -
- Other changes - -
CASH FLOWS FROM FINANCING ACTIVITIES - 10,488,634
TOTAL CASH FLOWS (16,045,457) 19,482,170
Opening net cash and cash equivalents 34,063,802 21,149,281
Closing net cash and cash equivalents 18,018,345 40,631,451
Of which:
- Cash and cash equivalents 18,018,345 40,631,451
- Bank overdrafts - -
Nine months ended

62
OTHER INFORMATION
Events after the reporting period
On 10 October 2018, the company’s Board of Directors approved the merger of Pininfarina Extra
S.r.l. into Pininfarina S.p.A..
There are no other significant events that occurred after the reporting date.
Related party transactions
The table below, which is presented pursuant to Consob communication no. DEM/6064293 of 28 July 2006, summarises related party transactions, including intragroup transactions. These transactions were carried out at market conditions, consistent with the nature of the goods exchanged or services provided. They were neither atypical nor unusual for the purposes of the above-mentioned communication.
Intragroup transactions include: - Goodmind S.r.l.: lease for equipped office premises terminated in February 2018; - Signature S.r.l.: loan agreement; - Pininfarina Extra S.r.l.: lease for equipped office premises and services agreements. The
financial liability with Pininfarina Extra S.r.l. relates to the national tax consolidation agreement; - Pininfarina Engineering S.r.l.: sale of goods to furnish its offices during the construction phase,
lease for the equipped premises and services agreements; - Pininfarina Deutschland GmbH: loan agreement; - Pininfarina Shanghai Co Ltd: services agreement; - Tech Mahindra Ltd: services agreement; - Mahindra & Mahindra Ltd: brand licence agreement and engineering services agreements; - Mahindra Graphic Research Design S.r.l.: engineering services agreements - Automobili Pininfarina GmbH: design and engineering agreement; - Ssangyong Motor Company: design services agreement In addition to the above figures, Studio Starclex - Studio Legale Associato Guglielmetti, related to Romina Guglielmetti (director of Pininfarina S.p.A.), provided legal assistance to the company for €27,000.
Assets Liabilities Assets Liabilities Revenue Expense Income Expense
Goodmind S.r.l. - - - - 5,333 - - -
Signature S.r.l. - - 550,000 - - - - -
Pininfarina Extra S.r.l. 98,985 11,717 47,281 330,362 261,141 169,091 776,000 -
Pininfarina Engineering S.r.l. 2,556,213 1,343,650 - - 2,050,232 1,103,004 - -
Pininfarina Deutschland GmbH - - 1,500,835 - - - 7,914 -
Pininfarina Shanghai Co. Ltd 77,450 - - - 106,270 15,000 - -
Tech Mahindra (Shanghai) Co Ltd - - - - - - - -
Tech Mahindra Ltd 7,200 265,794 - - 37,360 846,969 - -
Mahindra&Mahindra Limited 133,364 - - - 5,614,223 - - -
Mahindra Europe S.r.l. - - - - 1,364 - - -
Mahindra Graphic Research Design S.r.l. - - - - - 362,685 - -
Automobili Pininfarina GmbH 2,502,598 - - - 2,389,583 - - -
Ssangyong Motor Company - - - - 415,794 - - -
Total 5,375,810 1,621,161 2,098,116 330,362 10,881,300 2,496,749 783,914 -
Commercial Financial Operating Financial

63
Directors’ and statutory auditors’ fees
The total fees to Pininfarina S.p.A.’s key management personnel approximate €1.1 million for the first nine months of 2018.
(€'000) 30.09.2018 30.09.2017
Directors 463 273
Statutory auditors 76 76
Total 539 349
Nine months ended
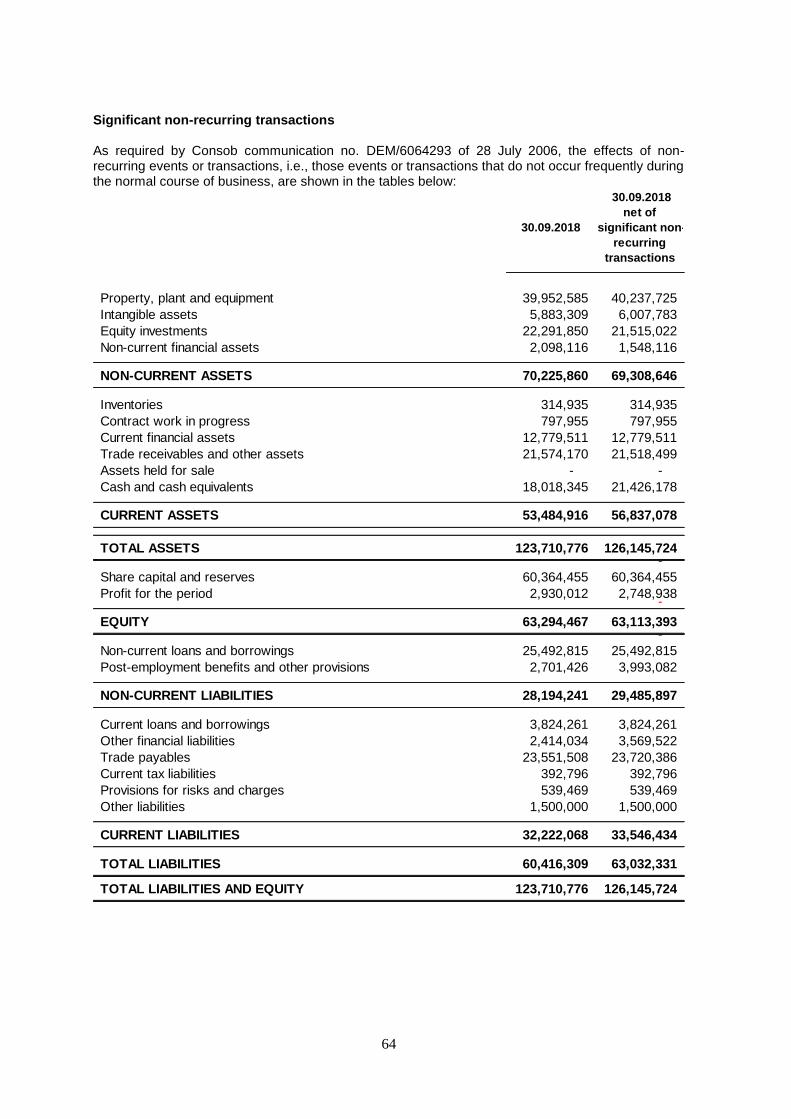
64
Significant non-recurring transactions As required by Consob communication no. DEM/6064293 of 28 July 2006, the effects of non-recurring events or transactions, i.e., those events or transactions that do not occur frequently during the normal course of business, are shown in the tables below:
30.09.2018
30.09.2018
net of
significant non-
recurring
transactions
Property, plant and equipment 39,952,585 40,237,725
Intangible assets 5,883,309 6,007,783
Equity investments 22,291,850 21,515,022
Non-current financial assets 2,098,116 1,548,116 -
NON-CURRENT ASSETS 70,225,860 69,308,646 -
Inventories 314,935 314,935
Contract work in progress 797,955 797,955
Current financial assets 12,779,511 12,779,511
Trade receivables and other assets 21,574,170 21,518,499
Assets held for sale - -
Cash and cash equivalents 18,018,345 21,426,178 -
CURRENT ASSETS 53,484,916 56,837,078 - -
TOTAL ASSETS 123,710,776 126,145,724 - -
Share capital and reserves 60,364,455 60,364,455
Profit for the period 2,930,012 2,748,938 - -
EQUITY 63,294,467 63,113,393 - -
Non-current loans and borrowings 25,492,815 25,492,815
Post-employment benefits and other provisions 2,701,426 3,993,082 -
NON-CURRENT LIABILITIES 28,194,241 29,485,897 -
Current loans and borrowings 3,824,261 3,824,261
Other financial liabilities 2,414,034 3,569,522
Trade payables 23,551,508 23,720,386
Current tax liabilities 392,796 392,796
Provisions for risks and charges 539,469 539,469
Other liabilities 1,500,000 1,500,000 -
CURRENT LIABILITIES 32,222,068 33,546,434 -
TOTAL LIABILITIES 60,416,309 63,032,331 - -
TOTAL LIABILITIES AND EQUITY 123,710,776 126,145,724 -
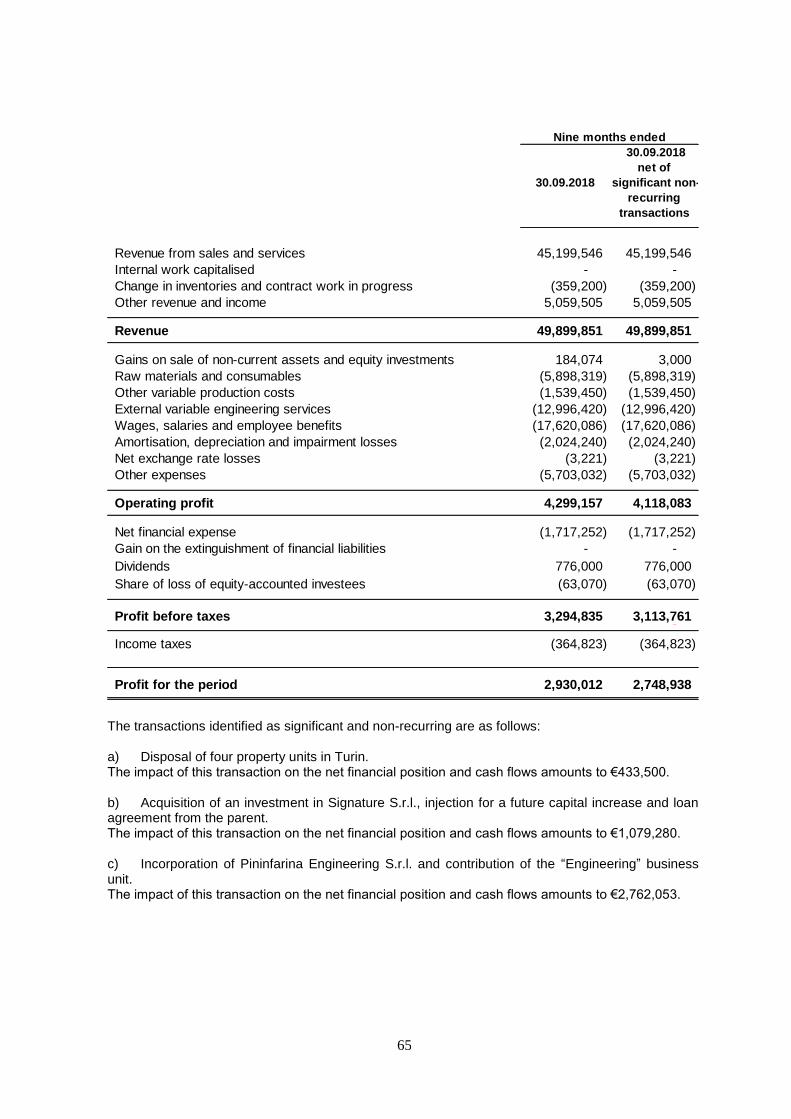
65
The transactions identified as significant and non-recurring are as follows: a) Disposal of four property units in Turin. The impact of this transaction on the net financial position and cash flows amounts to €433,500. b) Acquisition of an investment in Signature S.r.l., injection for a future capital increase and loan agreement from the parent. The impact of this transaction on the net financial position and cash flows amounts to €1,079,280. c) Incorporation of Pininfarina Engineering S.r.l. and contribution of the “Engineering” business unit. The impact of this transaction on the net financial position and cash flows amounts to €2,762,053.
30.09.2018
30.09.2018
net of
significant non-
recurring
transactions
Revenue from sales and services 45,199,546 45,199,546
Internal work capitalised - -
Change in inventories and contract work in progress (359,200) (359,200)
Other revenue and income 5,059,505 5,059,505 -
Revenue 49,899,851 49,899,851 -
Gains on sale of non-current assets and equity investments 184,074 3,000
Raw materials and consumables (5,898,319) (5,898,319)
Other variable production costs (1,539,450) (1,539,450)
External variable engineering services (12,996,420) (12,996,420)
Wages, salaries and employee benefits (17,620,086) (17,620,086)
Amortisation, depreciation and impairment losses (2,024,240) (2,024,240)
Net exchange rate losses (3,221) (3,221)
Other expenses (5,703,032) (5,703,032) -
Operating profit 4,299,157 4,118,083 -
Net financial expense (1,717,252) (1,717,252)
Gain on the extinguishment of financial liabilities - -
Dividends 776,000 776,000
Share of loss of equity-accounted investees (63,070) (63,070)
Profit before taxes 3,294,835 3,113,761 -
Income taxes (364,823) (364,823)
Profit for the period 2,930,012 2,748,938
Nine months ended
66
Atypical and unusual transactions As required by Consob communication no. DEM/6064293 of 28 July 2006, the Pininfarina Group specifies that it did not carry out atypical or unusual transactions during the year, as defined in the above-mentioned Communication, according to which atypical and/or unusual transactions are transactions that, because of their significance/material amount, nature of the counterparty, subject, method used to determine the transfer price and timing of the event, could create doubts as to: the accuracy/completeness of the disclosure provided in the financial statements, the existence of a conflict of interest, the safeguarding of corporate assets and the protection of non-controlling investors.