pinnacle foods inc. -...
TRANSCRIPT

P I N N A C L E F O O D S I N C . 2 0 1 6 A N N U A L R E P O R T399 Jefferson Road • Parsippany, NJ 07054
pinnaclefoods.com
PI
NN
AC
LE
F
OO
DS
I
NC
.
20
16
A
NN
UA
L
RE
PO
RT
98199_Pinnacle_Cover.indd 1 4/5/17 3:36 PM

2016 was another good year for Pinnacle, demonstrating the enduring nature of our business model and value creation strategy.
2 0 1 6 H I G H L I G H T S
HeadquartersPinnacle Foods Inc.
399 Jefferson Road
Parsippany, NJ 07054
(973) 541-8620
www.pinnaclefoods.com
Stock Exchange ListingNew York
Ticker Symbol: PF
Investor RelationsMaria Sceppaguercio
Senior Vice President, Investor Relationsemail: [email protected]
website: http://investors.pinnaclefoods.com
(973) 434-2924
Virtual Annual Meeting of StockholdersThe annual meeting of stockholders
will be held on Tuesday, May 23, 2017 at
10:00 a.m. EDT. The meeting will be
conducted via live webcast at
www.virtualshareholdermeeting.com/PF2017
Transfer Agent and RegistrarComputershare Investor Services
P.O. Box 43078
Providence, RI 02940-3078
(877) 373-6374
DividendsDividends are paid quarterly in January,
April, July and October.
Independent Registered PublicAccounting FirmDeloitte & Touche LLP
Parsippany, NJ
Corporate News and ReportsA wide range of information about the
Company, including news releases,
financial reports, investor information,
corporate governance and career
opportunities are available on our website:
www.pinnaclefoods.com
Printed materials such as the Annual Report
on SEC Form 10-K and quarterly reports on
SEC Form 10-Q may be requested via our
website or by calling (973) 434-2924.
Forward-Looking StatementsThis Annual Report contains statements that
are forward-looking and actual results could
differ materially. Factors that could cause
this difference are set forth in Items 1 and 1A
of the accompanying Annual Report on
SEC Form 10-K.
CORPORATE & INVESTOR INFORMATION
Note: Excludes items affecting comparability. See reconciliation to GAAP financial measures at the end of this Report.
1 Defined as Net Cash Provided By Operating Activities less Capital Expenditures. 2 Reflects legacy Pinnacle retail businesses based on Pinnacle’s IRI custom database for the 52-week period ended 12/25/2016.
• Grew net sales by 17.8% versus 2015,
reflecting the impact of the Boulder
Brands acquisition and a solid base
business
• Gained overall composite market share2
for the fifth consecutive year, fueled
by strength of both existing and new
products
• Expanded gross margin by 120 basis
points, driven by strong productivity,
higher net price realization and favorable
product mix, as well as the benefit of the
Boulder Brands acquisition
• Maintained selling, general and
administrative overhead expenses at
approximately 9% of net sales, among
the lowest in our industry
• Grew adjusted diluted EPS by 12% to $2.15
• Expanded free cash flow to $387 million,
a $122 million increase versus 2015, and
improved net leverage ratio to 4.19x
• Increased our dividend rate by 11.8%
during the year
• Acquired and seamlessly integrated
Boulder Brands, expanding our presence
in growing and complementary health and
wellness categories
(in millions except per share) 2015 2016 Change
Net Sales $2,656 $3,128 +17.8%
Adjusted Gross Profit $750 $921 +22.8%
% Net Sales 28.2% 29.4% +120 bps
Adjusted EBIT $443 $539 +21.6%
% Net Sales 16.7% 17.2% +50 bps
Adjusted Net Earnings $225 $254 +12.8%
Adjusted Diluted EPS $1.92 $2.15 +12.0%
Diluted Shares Outstanding 117.3 118.2 +0.8%
Free Cash Flow1 $265 $387 +$122
98199_Pinnacle_Cover.indd 2 4/6/17 3:48 PM

As I write my first letter to you as CEO, I can’t help but reflect on the early days of joining Pinnacle
and getting to know the culture and the team. At that point in time, Pinnacle had significantly
outperformed its long-term performance targets each year since going public and was rewarded
in the financial markets for doing so. Given this success, some observers questioned the
magnitude of the value creation opportunity that remained, but I was convinced that the Pinnacle
operating model—the Playbook, as we call it—in the hands of the Pinnacle team had plenty of
runway ahead. Almost a year later, and with another strong performance in the record books, I
firmly believe that we are just getting started!
LT Organic Growth Algorithm
2013Actual
2014Actual
2015Actual
2016Actual
Net Sales In line with categories
Outpaced categories
Outpaced categories
Outpaced categories
Outpaced categories
Operating Income 4–6% 10% 13% 5% 22%
EPS 7–9% 39% 14% 10% 12%
Dividend Yield 2.5% 3% 3% 3% 2%
Total 10–12% 42% 17% 13% 14%
Total Shareholder Return since IPO2 40% 75% 121% 192%
Accretive Acquisitions Accelerate Growth Beyond Algorithm
Note: Excludes items affecting comparability. See reconciliation to GAAP financial measures at the end of this Report.
$ MARKET SHARE GROWTHCumulative Point Change since 20111
+0.3
+0.1
+0.6
+1.1
+1.8
1312 14 15 16
1 Represents cumulative composite $ market share change since 2011 for legacy Pinnacle retail businesses, based on Pinnacle’s IRI custom database.2 Total Shareholder Return (TSR) represents stock price appreciation with dividends reinvested on the ex-dividend date. The TSR is based on the
$20 stock price at the time of the Company’s IPO on 3/28/2013.
With momentum on our strong base business and the
Boulder Brands acquisition, which closed in January
2016, we delivered double-digit growth in net sales
and Adjusted diluted EPS this past fiscal year. We also
grew composite market share for the fifth consecutive
year, with our performance accelerating over the
period. Our profit margins advanced significantly and
we maintained our cost discipline, keeping overhead
expenses among the lowest in our industry. We
also meaningfully improved our free cash flow and
net leverage ratio and strengthened our return to
shareholders with a 12% increase in our dividend rate.
DEAR SHAREHOLDERS
PINNACLE FOODS INC. 2016 ANNUAL REPORT | 1
98199_Pinnacle narrative_Final.indd 1 4/11/17 4:23 PM

This progress was achieved while we seamlessly integrated the Boulder Brands acquisition,
including capturing the Year I acquisition synergies contemplated at the time of the transaction.
Importantly, our outlook for the earnings power of this business has grown consistently over the
past year, as we gained greater visibility to the benefit of more tightly managing the supply chain
and overhead expenses, strengthened our conviction regarding the underlying growth potential
of Boulder’s on-trend health and wellness portfolio, and identified some additional synergies for
2018 that will drive incremental savings beyond initial expectations.
Successful innovation and meaningful savings from our
Maximizing Value through Productivity (MVP) program were
also significant contributors to our strong results in 2016, as
they have been in the past. New platform launches behind
several of our Leadership Brands, most notably Birds Eye, not
only drove sales and margin growth, but also fueled double-
digit retail distribution expansion, positioning us for another
good year in 2017.
LE
AD
ER
SH
IPB
RA
ND
S
67% OF NET SALES
ACCELERATE CORE
®
FO
UN
DA
TIO
NB
RA
ND
S
33% OF NET SALES
®
TMTM
...Unleashing Brand Potential speaks to the combined power of the Pinnacle Playbook and the world-class execution capabilities of our team...
“”
2 | P I N N A C L E F O O D S I N C . 2 0 1 6 A N N U A L R E P O R T
98199_Pinnacle narrative_Final.indd 2 4/12/17 1:05 PM

EXPAND MARGINS
AND CASH FLOW
ACCELERATE PROFITABLE
TOP-LINE GROWTH
STRENGTHEN CAPABILITIES;
MAINTAIN COSTS
INCREASE M&A POTENTIAL
THE PINNACLE PLAYBOOK
An important enabler to our success has been our lean organization structure. Not only is it
an efficiency benefit, but it is also an important effectiveness benefit. It fosters a culture of
focus and speed by highly engaged employees who understand how to prioritize and make
smart trade-offs. The strong performance we have delivered over the past four years would
not have been possible without the loyalty and dedication of our 5,500 employees across the
organization. Their unwavering passion and commitment to our Company is truly unique in the
industry, and it is with sincere gratitude that I acknowledge and thank them.
Going forward, our mission of Unleashing Brand Potential speaks to the combined power
of the Pinnacle Playbook and the world-class execution capabilities of our team, applied
against a rigorous adherence to the role each brand plays within our portfolio. By leveraging
the strategic pillars of the Playbook—namely, expanding margins and cash flow, accelerating
profitable top-line growth, strengthening our capabilities while maintaining costs and
increasing our M&A potential—we have significantly outperformed our long-term performance
targets for the fourth consecutive year, and we have our sights set on continuing to do so in
the years ahead.
In closing, I hope you share our excitement regarding the significant value creation that
lies ahead for our Company. On the following pages, we provide a glimpse into how we are
harnessing the Pinnacle Playbook and our organizational capabilities on our path of
Unleashing Brand Potential...
Mark ClouseChief Executive OfficerApril 12, 2017
PINNACLE FOODS INC. 2016 ANNUAL REPORT | 3
98199_Pinnacle narrative_Final.indd 3 4/12/17 1:27 PM

EXPAND MARGINS AND CASH FLOW
We have improved Adjusted gross margin by 430 basis points over
the past four years, and we expect another 300-400 basis points of
improvement over the next three years.
The single biggest driver of our Adjusted gross margin improvement
has been our MVP program. This comprehensive productivity program
uses a cross-functional, end-to-end approach that begins with ideation
and progresses through project evaluation, rigorous planning and
tracking and strong ongoing governance. Over the past four years, we
have generated productivity savings totaling $274 million, representing
approximately 3.9% of cost of products sold on average annually. We
fully expect to maintain performance consistent with these results in
the years ahead, with our most recent acquisition of Boulder Brands
expected to be an important MVP contributor.
1 Excludes items affecting comparability. See reconciliation to GAAP financial measures at the end of this Report.
Expanding margins and cash flow have been, and will continue to be, critical drivers of meaningful value creation at Pinnacle.
4.1%3.7% 3.8% 4.0%
PRODUCTIVITY% of cost of products sold
13 14 15 16
$22m
$31m
$20m
$27m
IMPROVE THE MIXMix impact on gross profit
13 14 15 16
27.0%
25.1%
27.4%28.2%
29.4%
1312 14 15 16
ADJUSTED GROSS PROFIT1
% of net sales
+430 bps
We also expect synergy capture from the Boulder Brands acquisition to continue to contribute to our
margin growth. In 2016, we flawlessly integrated this acquisition and captured Year I synergies totaling
$15 million, with an additional $15 million planned for 2017 and line of sight to approximately another
$5 million in 2018. Over half of these cumulative savings will benefit our Adjusted gross margin.
In addition, the SKU rationalization effort that we undertook in the second half of 2016 eliminated
almost 50% of Boulder’s SKUs, but only 9% of net sales and minimal profit. We also initiated the wind-
down of the Boulder business in
the UK that was operating at a loss.
Eliminating the distraction and
complexity associated with both the
proliferation of Boulder SKUs and
the UK operation is expected to be
another margin driver for us.
Favorable product mix has been
another important contributor to
our gross margin improvement. Our
strategy to grow Leadership Brands
faster than Foundation Brands
drives favorable mix, given the
600 basis-point margin advantage
the Leadership Brands maintain.
4 | P I N N A C L E F O O D S I N C . 2 0 1 6 A N N U A L R E P O R T
98199_Pinnacle narrative_Final.indd 4 4/11/17 3:51 PM

In addition, our innovation strategy is founded on the principle that all innovation must be margin
accretive, and we have enjoyed much success adding premium offerings to many of our brands. Over
the past four years, favorable product mix has contributed $100 million to our Adjusted gross profit,
and we expect mix to continue to be a positive contributor in the years ahead.
A world-class aspect of the Pinnacle Playbook is cash flow generation. Since the IPO, we have generated
free cash flow in excess of $1.1 billion, with the 2016 performance our strongest yet, and we believe we
have opportunities to continue to generate very strong results in this area in the years ahead.
Our Cash Conversion Cycle
(CCC)—a measurement
of days of sales in both
inventory and receivables,
less days in payables—is
currently about average
in our industry. We are
committed to improving
our CCC to the top quartile
of our industry, with an
aspirational target of getting
to world-class over time. In
2016, we reduced our CCC
by nine days, and we expect
continued improvement in
this area over time.
Finally, our cash flow strength provides us with significant optionality to drive shareholder value.
We recently completed a very successful refinancing of our term loan debt that will reduce our cash
interest expense by more than $50 million, beginning in 2017 and extending through 2024, while
extending our maturity profile and enhancing our financial flexibility. After servicing debt and paying
quarterly dividends, our priorities for the use of cash are strategic acquisitions and debt reduction.
Since 2012, we have reduced our leverage ratio from 5.9x to 4.2x this past year, despite having invested
approximately $1.8 billion on acquisitions during this time. We expect to continue to de-lever rapidly
following acquisitions, as we have done in the past, providing us with important optionality to continue
to drive value for our shareholders.
1 Excludes the benefit of $150 million from the Hillshire Brands termination fee, net of expenses and cash taxes.
$178m
$298m1
$265m
$387m
FREE CASH FLOW
13 14 15 16
Operating cash flow
Capital expendituresWe have generated
$1.1 billionin free cash flow since the IPO
Expanding margins and cash flow have been, and will continue to be, critical drivers of meaningful value creation at Pinnacle.
PINNACLE FOODS INC. 2016 ANNUAL REPORT | 5
98199_Pinnacle narrative_Final.indd 5 4/12/17 1:06 PM

Key to our success in strengthening our underlying fundamentals has been our
deepened focus on brand health metrics in marketing, pricing and distribution, as well as
our portfolio segmentation, which clarifies the role each brand plays and the trade-offs
we make regarding investments. Our faster-growing, higher-margin Leadership Brands
represent two-thirds of our net sales and are the primary focus of our marketing and
innovation efforts, while our Foundation Brands, which are managed for stability and
cash flow, represent the balance. As the Leadership portfolio outperforms, the margin
structure of Pinnacle is enhanced.
Leveraging our health and wellness portfolio, which currently represents approximately
55% of sales, is focused on bringing specific benefits to consumers in three categories:
Vegetable Ubiquity, with our Birds Eye brand serving as an important platform to
support the transformation of the freezer case into a healthy destination in stores.
With a focus on taste, convenience and affordability, Birds Eye has significantly
broadened its offerings, providing the 90% of Americans who don’t eat enough
vegetables more opportunities to do so. Over the past two years, Birds Eye introduced
and expanded six new platforms, including Birds Eye Flavorful vegetables, Birds Eye Protein Blends side dishes, Birds Eye Veggie Made Rice, a cauliflower-based
side dish that mimics the mouthfeel of rice, and Birds Eye Signature Skillets meals.
Notwithstanding all of this activity, we believe we are just getting started!
ACCELERATE PROFITABLE TOP-LINE GROWTH
Over the past five years, we’ve grown our composite market share by 1.8 points, consistently
outperforming several challenging category environments. The acquisition of Boulder Brands
strengthens our top-line profile with faster-growing categories that, while not transformational in
magnitude, are expected to be significant in building top-line momentum.
Critical drivers to accelerate profitable top-line growth are:
Our strengthened fundamentals, coupled with the faster growth characteristics of Boulder Brands, position us to accelerate profitable top-line growth.
Strengthening our underlying fundamentals
Leveraging our health and wellness portfolio
Broadening our retail channel coverage
6 | P I N N A C L E F O O D S I N C . 2 0 1 6 A N N U A L R E P O R T
98199_Pinnacle narrative_Final.indd 6 4/12/17 1:09 PM

In early 2017, Birds Eye launched five new platforms that up the game, providing
consumer benefits such as organic varieties, unique grains and Voila! Disney-
themed meals for families—supporting the 65% of Americans that
are actively trying to add more vegetables to their diets.
Lifestyle Leadership, focused on targeting specific consumer needs across
formats and occasions to create a brand destination for the 30% of consumers
participating in some kind of specialized approach to eating. The leading
lifestyle approach in food is plant-based dieting, and our gardein and Earth Balance brands serve these consumers, while our Udi’s and Glutino brands
serve consumers seeking gluten free, the #3 lifestyle approach. Rounding out
our lifestyle portfolio is our clean convenience brand EVOL, which supports the
growing number of consumers seeking clean ingredients.
Better Center of Store, focused on bringing news and relevance to our center of
store brands. Recent examples include our new, healthy oils platforms, such as
Wish-Bone E.V.O.O. and our just-introduced Wish-Bone Avocado Oil dressings. For Duncan Hines, we have introduced unique offerings
that address structural category challenges involving the decline in household size
and consumer portion control concerns. We designed Duncan Hines Perfect Size to
address these challenges and, building on this success, we recently launched Duncan Hines Perfect Size for 1, a new platform made with real, simple ingredients that
provides consumers an ultra-convenient solution that is baked in a coffee mug, in the
microwave, in one minute. This new offering, with varieties for use across all dayparts,
is proving to be a big hit with consumers!
Finally, broadening our retail channel coverage is about expanding our presence
in the retail channels in which our consumers
are increasingly shopping. Non-traditional
channels, such as online, value and club, while
still relatively small, are growing more rapidly
than traditional channels. In fact, online share
of the U.S. grocery market is expected to
double in the next five years. While this is not
expected to be an overnight contributor to
growth for us, we are focused on building the
capabilities to be in position to capitalize on
opportunities as they emerge.
Our strengthened fundamentals, coupled with the faster growth characteristics of Boulder Brands, position us to accelerate profitable top-line growth.
PINNACLE FOODS INC. 2016 ANNUAL REPORT | 7
98199_Pinnacle narrative_Final.indd 7 4/12/17 1:10 PM

STRENGTHEN CAPABILITIES; MAINTAIN COSTS
Strengthening our capabilities, while maintaining costs, is the hallmark of Pinnacle and a critical enabler to our success.
Pinnacle maintains one of the leanest cost structures in the
industry, with SG&A overhead expenses at only 9% of net sales.
Our Company was built as a lean organization, with roots in
private equity and, as a result, we have developed a unique
culture and capabilities that not only enable us to move with
speed and focus, but also execute in a highly effective way.
Maintaining this cost discipline and focus is an imperative for us.
In fact, notwithstanding the significantly higher SG&A overhead
profile of Boulder Brands at the time
of the acquisition in January 2016,
we achieved SG&A overhead for
the year only slightly above our 9%
target. This performance reflected
our expertise in quickly integrating
acquisitions and capturing planned
synergies.
Our ambitious margin agenda,
coupled with the growth
opportunities we are pursuing, also
requires that we have the right
talent and capabilities in place
to enable our success. One such
area of focus is strengthening our
planning expertise.
Since the IPO, we made three acquisitions that added complexity
to our business. We are working to build increased sophistication
in supply chain planning, for example, to ensure our organization
is poised to capitalize on the long-term strategic plan we are
pursuing.
As we build out capabilities critical to our future success, we
will maintain our cost discipline and optimize SG&A overhead
expenses in other areas, staying true to the hallmark of Pinnacle.
9.0% SG&A Average
since the IPO
8.9%8.4%
9.1% 9.3%
SG&A OVERHEAD% of net sales
13 14 15 16
8 | P I N N A C L E F O O D S I N C . 2 0 1 6 A N N U A L R E P O R T
98199_Pinnacle narrative_Final.indd 8 4/11/17 3:51 PM

INCREASE M&A POTENTIAL
Our success with M&A starts with our philosophy that acquisitions should be accretive
to overall performance and not a replacement for it. As a result, since the IPO, the three
acquisitions we made—namely, Wish-Bone, Garden Protein International and Boulder
Brands—were quickly integrated into the business and, in all three cases, we achieved
results that met or exceeded our expectations. Importantly, our base business continued
to perform well, enabling the acquisitions to accelerate our results beyond the long-term
organic growth targets we maintain.
Our criteria for acquisitions start with our belief that a bad deal is worse than no deal. This
means that we remain patient and acquire businesses that meet our proven criteria and for
which we believe there is potential beyond simply capturing synergies.
To ensure our readiness and increase our M&A potential, we have added dedicated resources
in this area. The Boulder acquisition meaningfully expanded our presence in the health and
wellness arena and, as a result, dramatically increased our optionality regarding potential
businesses that would make sense for us. It also, once again, validated our integration
playbook, this time on a larger scale in entirely new segments within our industry.
Finally, in addition to the new optionality associated with adding health and wellness scale to
our portfolio, we will continue to target iconic brands, where we have had great success over
the years. Regardless of size or complexity, we believe we have the expertise to use M&A to
create shareholder value, and we remain steadfast in our focus on continuing to do so.
North America focus
Existing or adjacent categories
Market leadership or line of
sight to leadership
Synergy-rich transaction
Speed of integration
Acquisition date Oct. 2013 Nov. 2014 Jan. 2016
Acquisitions have been a significant value creator for Pinnacle, and we are increasing our M&A potential, with dedicated resources and greater optionality.
PINNACLE FOODS INC. 2016 ANNUAL REPORT | 9
98199_Pinnacle narrative_Final.indd 9 4/11/17 3:51 PM

CHAIRMAN’S LETTER
BOARD OF DIRECTORS
Roger Deromedi
Chairman of the BoardFormer Chief Executive Officer Kraft Foods Inc.
Mark Clouse
Chief Executive OfficerPinnacle Foods Inc.
Ann Fandozzi
Chief Executive OfficerABRA Auto Body & Glass
Mark Jung
Executive Chairman Accela, Inc.
Jane Nielsen
Chief Financial OfficerRalph Lauren Corporation
Muktesh (Micky) Pant
Chief Executive OfficerYum! Restaurants China
Raymond P. Silcock
Executive Vice President and Chief Financial Officer CTI Foods
Ioannis (Yannis) Skoufalos
Global Product Supply OfficerThe Procter & Gamble Company
The Pinnacle team delivered another stellar performance in 2016,
posting the fourth consecutive year of results in excess of the
Company’s long-term growth targets. This performance was
particularly noteworthy, given the Boulder Brands acquisition
and integration and, significantly, the transition of our CEO to
Mark Clouse in May. In typical Pinnacle fashion, this team didn’t
miss a beat.
Mark literally hit the ground running, working with his team to
build a new strategic plan to serve as our roadmap to the next
chapter of value creation for the Company.
On behalf of the Board, I would like to congratulate Mark and
the entire Pinnacle team. In the face of significant change and
uncertainty, the team stepped up and translated their loyalty,
commitment, and creativity into another year of meaningful value
creation for shareholders. The Board and I have tremendous
confidence in Mark, the leadership team and all the members of
the Pinnacle family to continue to deliver industry-leading results.
I would also like to thank our Board for their dedicated service, deep
wisdom and unwavering support of our Company. And finally, I
would like to thank you, our Shareholders, for your steadfast belief in
Pinnacle. You have been rewarded with strong business performance
and shareholder returns in the top tier of our industry, which I firmly
believe will continue in the years to come.
Roger K. Deromedi
Chairman of the BoardApril 12, 2017
1 0 | P I N N A C L E F O O D S I N C . 2 0 1 6 A N N U A L R E P O R T
98199_Pinnacle narrative_Final.indd 10 4/11/17 3:51 PM

EXECUTIVE MANAGEMENT TEAM
BRANDS BY SEGMENT
Mark Clouse
Chief Executive Officer
Craig Steeneck
Executive Vice President and Chief Financial Officer
Michael Allen
Executive Vice President and President, Boulder
Michael Barkley
Executive Vice President and Chief Marketing Officer
Chris Boever
Executive Vice President and Chief Customer Officer
Mary Beth DeNooyer
Executive Vice President and Chief Human Resources Officer
Kelley Maggs
Executive Vice President, Secretary and General Counsel
Mark Schiller
Executive Vice President and President, North America Retail
Michael Wittman
Executive Vice President and Chief Supply Chain Officer
Frozen
Birds Eye
Birds Eye Voila!
Hungry-Man
Van de Kamp’s
Mrs. Paul’s
Lender’s
Aunt Jemima
Celeste
Canada1
Grocery
Duncan Hines
Vlasic
Wish-Bone
Log Cabin
Armour
Smart Balance
Mrs. Butterworth’s
Comstock
Nalley
Brooks
Open Pit
Boulder
Udi’s
Glutino
Earth Balance
gardein
EVOL
Specialty
Tim’s Cascade
Snyder of Berlin
Hawaiian
Hussman’s
Foodservice2
Private Label2
2016 NET SALES
$3.1 billion
41%Frozen
35%Grocery
12%Boulder
12%Specialty
1 All brands in Canada reported in Frozen Segment.2 All U.S. Foodservice and Private Label products reported in Specialty Segment.
PINNACLE FOODS INC. 2016 ANNUAL REPORT | 11
98199_Pinnacle narrative_Final.indd 11 4/11/17 3:51 PM

RECONCILIATION OF NON-GAAP FINANCIAL MEASURES
(1) Primarily includes: Restructuring charges, acquisition integration costs and acquisition-related expenses.
(2) Primarily includes: Trademark impairment charges, the write-up to fair value of inventories acquired as a result of the Boulder Brands acquisition, the wind-down of
the Boulder Brands UK operations, and mark-to-market gains.
(3) Primarily includes: Plant integration and restructuring charges and expenses related to the Boulder acquisition.
(4) Primarily includes: Foreign exchange losses resulting from intra-entity loans, equity-based compensation expense related to the termination of the Hillshire
agreement and mark-to-market losses.
(5) Primarily includes: Hillshire agreement termination fee (net of costs), restructuring charges including integration costs, employee severance and non-recurring
merger costs.
(6) Primarily includes: Equity-based compensation expense resulting from 2014 liquidity event, fair value write-up of acquired inventories and mark-to-market gains/losses.
(7) Primarily includes: Restructuring charges from plant consolidations, integration costs, non-recurring merger costs and employee severance.
(8) Primarily includes: Bond redemption costs and management fee paid to sponsor.
(9) Pro forma data reflects Adjusted Statement of Operations amounts assuming IPO and 2013 Refinancing occurred on the first day of Fiscal 2013.
(10) Pro forma data reflects Adjusted Statement of Operations amounts assuming IPO occurred on the first day of Fiscal 2012.
ADJUSTED & PRO FORMA MEASURES
Reported $2,479 $585 $284 $53 86.5 0.61 Acquisition, merger and other restructuring charges(7) 38 45 28
Other non-cash items(6) (1) Other adjustments(8) 1 21 23Adjusted $2,479 $623 $350 $104 86.5 $1.20 IPO(10) 30 30.9 Public company costs(10) (3) (2)Pro Forma $2,479 $623 $347 $132 117.4 $1.13
Year Ended December 30, 2012 (53 Weeks)
Gross Profit
Net Sales EBIT
Net Earnings
Diluted EPS
Diluted Shares
Reported $2,656 $741 $425 $212 117.3 $1.81 Acquisition, merger and other restructuring charges(3) 10 14 10 Other non-cash items(4) (1) 4 3Adjusted $2,656 $750 $443 $225 117.3 $1.92
Year Ended December 27, 2015 (52 Weeks)
Gross Profit
Net Sales EBIT
Net Earnings
Diluted Shares
Diluted EPS
Year Ended December 28, 2014 (52 Weeks)
Reported $2,591 $681 $512 $248 116.9 $2.13 Acquisition, merger and other restructuring charges(5) 12 (130) (79) Other non-cash items(6) 18 41 34Adjusted $2,591 $711 $423 $203 116.9 $1.74
Gross Profit
Net Sales EBIT
Net Earnings
Diluted Shares
Diluted EPS
Reported $2,464 $654 $293 $89 108.6 $0.82 Acquisition, merger and other restructuring charges(7) 4 22 14
Other non-cash items(6) 6 6 3 Other adjustments(8) 53 55Adjusted $2,464 $664 $374 $161 108.6 $1.49 IPO and Refinancing(9) 16 8.0Pro Forma $2,464 $664 $374 $177 116.6 $1.52 Stock-based compensation 1 8 6 $0.05Pro Forma Excluding Stock-based Compensation $665 $382 $183 116.6 $1.57
Year Ended December 29, 2013 (52 Weeks)
Gross Profit
Net Sales EBIT
Net Earnings
Diluted Shares
Diluted EPS
(in millions, except per share)
Reported $3,128 $916 $480 $211 118.2 $1.79 Acquisition, merger and other restructuring charges(1) 7 46 35 Other non-cash items(2) (2) 13 8 Adjusted $3,128 $921 $539 $254 118.2 $2.15
Year Ended December 25, 2016 (52 Weeks)
Gross Profit
Net Sales EBIT
Net Earnings
Diluted Shares
Diluted EPS
1 2 | P I N N A C L E F O O D S I N C . 2 0 1 6 A N N U A L R E P O R T
98199_Pinnacle narrative_Final.indd 12 4/11/17 3:51 PM

UNITED STATESSECURITIES AND EXCHANGE COMMISSION
Washington, D.C. 20549_____________________
FORM 10-K_____________________
ANNUAL REPORT PURSUANT TO SECTION 13 OR 15(d) OF THE SECURITIESEXCHANGE ACT OF 1934
For the fiscal year ended December 25, 2016
or
TRANSITION REPORT PURSUANT TO SECTION 13 OR 15(d) OF THE SECURITIESEXCHANGE ACT OF 1934
For the transition period from ____________to _____________.
Commission File Number 001-35844___________________________________
Pinnacle Foods Inc.(Exact name of registrant as specified in its charter)
___________________________________
Delaware 35-2215019(State or other jurisdiction of incorporation or organization) (I.R.S. Employer Identification No.)
399 Jefferson RoadParsippany, New Jersey 07054
(Address of Principal Executive Offices) (Zip Code)
Registrant’s telephone number, including area code: (973) 541-6620Securities registered pursuant to Section 12(b) of the Act:
Title of each class Name of the exchange on which registeredCommon Stock, par value $0.01 per share New York Stock Exchange
Securities registered pursuant to Section 12(g) of the Act: None.___________________________________
Indicate by check mark if the registrant is a well-known seasoned issuer (as defined in Rule 405 of the Securities Act). Yes No
Indicate by check mark if the registrant is not required to file reports pursuant to Section 13 or 15(d) of the Act. Yes No
Indicate by check mark whether the registrant: (1) has filed all reports required to be filed by Section 13 or 15(d) of the Securities Exchange Act of 1934 during the preceding 12 months (or for such shorter period that the registrant was required to file such reports), and (2) has been subject to such filing requirements for the past 90 days. Yes No
Indicate by check mark whether the registrant has submitted electronically and posted on its corporate Web site, if any, every Interactive Data File required to be submitted and posted pursuant to Rule 405 of Regulation S-T during the preceding 12 months (or for such shorter period that the registrant was required to submit and post such files). Yes No

Indicate by check mark if disclosure of delinquent filers pursuant to Item 405 of Regulation S-K (§229.405 of this chapter) is not contained herein, and will not be contained, to the best of the registrant’s knowledge, in definitive proxy or information statements incorporated by reference in Part III of this Form 10-K or any amendment to this Form 10-K.
Indicate by check mark whether the registrant is a large accelerated filer, an accelerated filer, a non-accelerated filer, or a smaller reporting company. See definitions of “large accelerated filer," “accelerated filer” and “smaller reporting company” in Rule 12b-2 of the Exchange Act (Check One):
Large accelerated filer Accelerated filer
Non-accelerated filer (Do not check if a smaller reporting company) Smaller Reporting Company
Indicate by check mark whether the registrant is a shell company (as defined in Rule 12b-2 of the Exchange Act)Yes No
As of June 24, 2016 (the last business day of the registrant's most recently completed second fiscal quarter), the aggregate market value of common stock held by non-affiliates of the registrant was approximately $5.05 billion. For purposes of this calculation, the Registrant has assumed that its directors and executive officers are affiliates.
There were 118,152,239 shares of common stock, $0.01 par value, outstanding at February 21, 2017.
DOCUMENTS INCORPORATED BY REFERENCE
Portions of the definitive proxy statement for the annual meeting of shareholders scheduled to be held on May 23, 2017 are incorporated by reference into Part III of this Form 10-K.

TABLE OF CONTENTS
FORM 10-KPageNo.
PART IITEM 1: BUSINESSITEM 1A: RISK FACTORSITEM 1B: UNRESOLVED STAFF COMMENTSITEM 2: PROPERTIESITEM 3: LEGAL PROCEEDINGSITEM 4: MINE SAFETY DISCLOSURES
PART IIITEM 5: MARKET FOR REGISTRANT'S COMMON EQUITY, RELATED STOCKHOLDER MATTERS AND
ISSUER PURCHASES OF EQUITY SECURITIESITEM 6: SELECTED FINANCIAL DATAITEM 7: MANAGEMENT’S DISCUSSION AND ANALYSIS OF FINANCIAL CONDITION AND RESULTS OF
OPERATIONSITEM 7A: QUANTITATIVE AND QUALITATIVE DISCLOSURE ABOUT MARKET RISKITEM 8: FINANCIAL STATEMENTS AND SUPPLEMENTARY DATA
CONSOLIDATED STATEMENTS OF OPERATIONSCONSOLIDATED STATEMENTS OF COMPREHENSIVE EARNINGSCONSOLIDATED BALANCE SHEETSCONSOLIDATED STATEMENTS OF CASH FLOWSCONSOLIDATED STATEMENTS OF SHAREHOLDERS' EQUITYNOTES TO CONSOLIDATED FINANCIAL STATEMENTS1. Summary of Business Activities2. Summary of Significant Accounting Policies3. Acquisitions4. Fair Value Measurements5. Shareholders' Equity, Equity-Based Compensation Expense and Earnings Per Share6. Accumulated Other Comprehensive Loss7. Other Expense (Income), net and Termination Fee Received, Net of Costs8. Balance Sheet Information9. Goodwill, Tradenames and Other Assets10. Debt and Interest Expense11. Pension and Retirement Plans12. Financial Instruments13. Commitments and Contingencies14. Segments15. Provision for Income Taxes16. Quarterly Results (Unaudited)17. Guarantor and Nonguarantor Statements18. Subsequent Events
ITEM 9: CHANGES IN AND DISAGREEMENTS WITH ACCOUNTANTS ON ACCOUNTING AND FINANCIAL DISCLOSURE
ITEM 9A: CONTROLS AND PROCEDURESITEM 9B: OTHER INFORMATION
PART IIIITEM 10: DIRECTORS, EXECUTIVE OFFICERS AND CORPORATE GOVERNANCEITEM 11: EXECUTIVE COMPENSATIONITEM 12: SECURITY OWNERSHIP OF CERTAIN BENEFICIAL OWNERS AND MANAGMENT AND
RELATED STOCKHOLDER MATTERSITEM 13: CERTAIN RELATIONSHIPS AND RELATED TRANSACTIONS AND DIRECTOR INDEPENDENCEITEM 14: PRINCIPAL ACCCOUNTANT FEES AND SERVICES
PART IVITEM 15: EXHIBITS, FINANCIAL STATEMENT SCHEDULES
SIGNATURES
55162425252526
2628
3058606364656667686869757979848687899196101105106106109113114
124124125125125127
127127127128128134
4
DISCLOSURE REGARDING FORWARD-LOOKING STATEMENTS
This annual report on Form 10-K contains “forward-looking statements” within the meaning of Section 27A of the Securities Act of 1933 (the "Securities Act") and section 21E of the Securities Exchange Act of 1934 (the "Exchange Act"). Forward-looking statements include statements concerning our plans, objectives, goals, strategies, future events, future revenues or performance, financing needs, plans or intentions relating to acquisitions, business trends and other information that is not historical information. When used in this Form 10-K, the words “estimates,” “expects,” “contemplates,” “anticipates,” “projects,” “plans,” “intends,” “believes,” “forecasts,” “may,” “should” and variations of such words or similar expressions are intended to identify forward-looking statements. All forward-looking statements, including, without limitation, management's examination of historical facts and operating trends, are based upon our current expectations and various assumptions. Our expectations, beliefs and projections are expressed in good faith and we believe there is a reasonable basis for them. However, there can be no assurance that management's expectations, beliefs and projections will result or be achieved and actual results may vary materially from what is expressed in or indicated by the forward-looking statements.
There are a number of risks and uncertainties that could cause our actual results to differ materially from the forward-looking statements contained in this Form 10-K. Such risks, uncertainties and other important factors include, among other things:
competition;our ability to predict, identify, interpret and respond to changes in consumer preferences;the loss of any of our major customers;our reliance on a single source provider for the manufacturing, co-packing and distribution of many of our products;fluctuations in price and supply of food ingredients, packaging materials and freight;volatility in commodity prices and our failure to mitigate the risks related to commodity price fluctuation and foreign exchange risk through the use of derivative instruments;future borrowing and restrictive covenants under our credit facility and the indentures governing our senior notes;costs and timeliness of integrating acquisitions or our failure to realize anticipated cost savings, revenue enhancements or other synergies therefrom;litigation or claims regarding our intellectual property rights or termination of our material licenses;our ability to drive revenue growth in our key product categories or to add products that are in faster growing and more profitable categories;potential product liability claims;seasonality;stock price volatility;changes in our collective bargaining agreements or shifts in union policy;changes in the cost of compliance with laws and regulations, including environmental, worker health and workplace safety laws and regulations;our failure to comply with U.S. Food & Drug Administration, U.S. Department of Agriculture or Federal Trade Commission regulations and the impact of governmental budget cuts;disruptions in our information technology systems;future impairments of our goodwill and intangible assets;difficulty in the hiring or the retention of key management personnel; andchanges in tax statutes, tax rates, or case laws which impact tax positions we have taken.
There may be other factors that may cause our actual results to differ materially from the forward-looking statements, including factors disclosed under the sections entitled “Risk Factors” and “Management's Discussion and Analysis of Financial Condition and Results of Operations” in this Form 10-K. You should evaluate all forward-looking statements made in this Form 10-K in the context of these risks and uncertainties.
We caution you that the risks, uncertainties and other factors referenced above may not contain all of the risks, uncertainties and other factors that are important to you. In addition, we cannot assure you that we will realize the results, benefits or developments that we expect or anticipate or, even if substantially realized, that they will result in the consequences or affect us or our business in the way expected. All forward-looking statements in this Form 10-K apply only as of the date made and are expressly qualified in their entirety by the cautionary statements included in this Form 10-K. We undertake no obligation to publicly update or revise any forward-looking statements to reflect subsequent events or circumstances.
EXPLANATORY NOTE
Unless the context requires otherwise, in this Form 10-K, “Pinnacle,” the “Company,” “we,” “us” and “our” refers to Pinnacle Foods Inc.”, and the entities that are its consolidated subsidiaries.

5
PART I ITEM 1. BUSINESS
Company Overview
We are a leading manufacturer, marketer and distributor of high-quality, branded food products in North America, with annual net sales of approximately $3.1 billion in fiscal 2016. Our brand portfolio enjoys strong household penetration in the United States, where our products can be found in over 85% of U.S. households. Our products are sold through supermarkets, grocery wholesalers and distributors, mass merchandisers, super centers, convenience stores, dollar stores, natural and organic food stores, drug stores and warehouse clubs in the United States and Canada, as well as in military channels and foodservice locations. Given our diverse portfolio of brands with attractive market positions, our business generates significant and stable cash flows that have enabled us to pay regular quarterly dividends to our shareholders, reduce our debt and drive value creation through both reinvestment in our existing brands and periodic strategic acquisitions.
Pinnacle Foods Inc. was incorporated under the name "Crunch Holding Corp. in Delaware on July 28, 2003. Pinnacle Foods Inc. is a holding company whose sole asset is 100% ownership of Peak Finance Holdings LLC (“PFH”). PFH is a holding company whose sole asset is 100% ownership of Pinnacle Foods Finance LLC.
In the fourth quarter of 2016, following the completion of the integration of the Company’s Boulder Brands acquisition (see below), the Company reorganized its reporting structure into four reportable segments. As a result, the Company’s operations are reported in the Frozen segment, the Grocery segment, the Boulder segment and the Specialty segment. The Boulder Brands acquisition is discussed in greater detail in Note 3 to the Consolidated Financial Statements, “Acquisitions.”
Frozen Segment
Birds Eye is the largest brand in the $3.2 billion frozen vegetables category. Collectively, our steamed and non-steamed product offerings hold the #1 position among branded products, with a 30.4% market share. Government programs, such as the USDA’s My Plate program, and nutrition and health professionals continue to identify increased vegetable consumption as a key to better health. We believe that enhancing the taste of vegetables and making them exceptionally convenient are keys to driving more vegetable consumption. Birds Eye has taken a leadership role in increasing vegetable consumption, including encouraging children to eat more vegetables. We are supporters of the USDA’s My Plate program and have engaged in breakthrough marketing efforts with major multi-media family entertainment partners to encourage children to eat more vegetables. We also compete in the frozen complete bagged meals category with our Birds Eye Voila! brand. We are the largest competitor in the frozen complete bagged meal category with a 41.0% market share. Birds Eye Voila! frozen bagged meals provide consumers with a high quality complete meal, including protein, starch, and vegetables, that can be prepared in a skillet in just minutes.
Our Frozen segment also includes Hungry-Man frozen entrées, Van de Kamp’s and Mrs. Paul's frozen prepared seafood, Aunt Jemima frozen breakfast products, Lender's frozen and refrigerated bagels and Celeste frozen pizza. The Frozen segment also includes all of the Company’s business in Canada, including those of the Garden Protein International and Boulder Brands acquisitions.
Grocery Segment
The Grocery segment consists of a diversified portfolio of shelf-stable and refrigerated products including a complete line of shelf-stable pickle products, primarily under the nationally-distributed Vlasic brand, and the regional brands under the Milwaukee’s and Wiejske Wyroby brands. Our Vlasic brand, represented by its trademark Vlasic stork, has the highest consumer awareness and quality ratings in the pickle category. Vlasic is the #1 brand in the $782 million shelf-stable pickle category and Pinnacle brands collectively hold a 34.9% market share.
Our Duncan Hines portfolio includes cake mixes, ready-to-serve frostings, brownie mixes, and cookie mixes. In addition to our traditional cake mix offerings, our cake mix portfolio also includes premium offerings under the Duncan Hines Decadent and Duncan Hines Perfect Size brands. Duncan Hines is the #2 brand with a 25.7% market share in the $1.1 billion cake/brownie mix and frostings category. We compete in the shelf-stable salad dressings category with our Wish-Bone and Western brands, including our new Wish-Bone E.V.O.O., Wish-Bone Ristorante Italiano and Wish-Bone Avocado Oil lines. We hold the #3 position in the $2.1 billion salad dressings category, with a combined share of 11.6%, and Wish-Bone holds the #1 position in the branded Italian segment of the category. Our Grocery segment also includes Armour, Nalley and Brooks canned meat, Mrs. Butterworth’s and Log Cabin table syrups, Smart Balance premium margarine/spread, Comstock and Wilderness pie and pastry fruit fillings and Open Pit barbecue sauce.

6
Boulder Segment
We offer a portfolio of gluten-free products under the Udi’s and Glutino brands and natural frozen meals under our EVOL brand. Udi’s is the #1 brand in the $355.0 million gluten-free frozen bakery and pizza category with a 38.3% market share. The Boulder segment also includes all of the products under the Earth Balance brand, a plant-based premium refrigerated and shelf-stable portfolio, as well as the rapidly-growing gardein plant-based protein brand.
Specialty Segment
The Specialty segment is comprised of our direct store delivery snacks portfolio, including Tim’s Cascade, Hawaiian kettle style chips, Snyder of Berlin and Husman’s, each of which has strong regional presence. We also manufacture and distribute certain products, mainly in the frozen breakfast, gluten-free, frozen meat substitutes, canned meat, and pie and pastry fruit filling categories, through foodservice channels. The Specialty segment also includes our private label business, which manufactures and distributes products in the canned meat, shelf-stable pickles and frozen prepared seafood categories.
Financial information about our business segments is discussed in greater detail in Note 14 to the consolidated financial statements included elsewhere in this Form 10-K.
Frozen Segment
Major Pinnacle Brands Industry Category
Market Share52 Weeks Ended
December 25, 2016 (1)CategoryRank (1)
Birds Eye Frozen vegetables 30.4% #1
Birds Eye Voila! Frozen complete bagged meals 41.0% #1
Lender's Frozen and refrigerated bagels 65.5% #1
Van de Kamp'sMrs. Paul's
Frozen prepared seafood 25.1% #2
Aunt Jemima Frozen pancakes / waffles / French toast 5.0% #3
Celeste Frozen pizza for one 5.8% #4
Hungry-Man Full-calorie single-serve frozen dinnersand entrées
9.6% #5
7
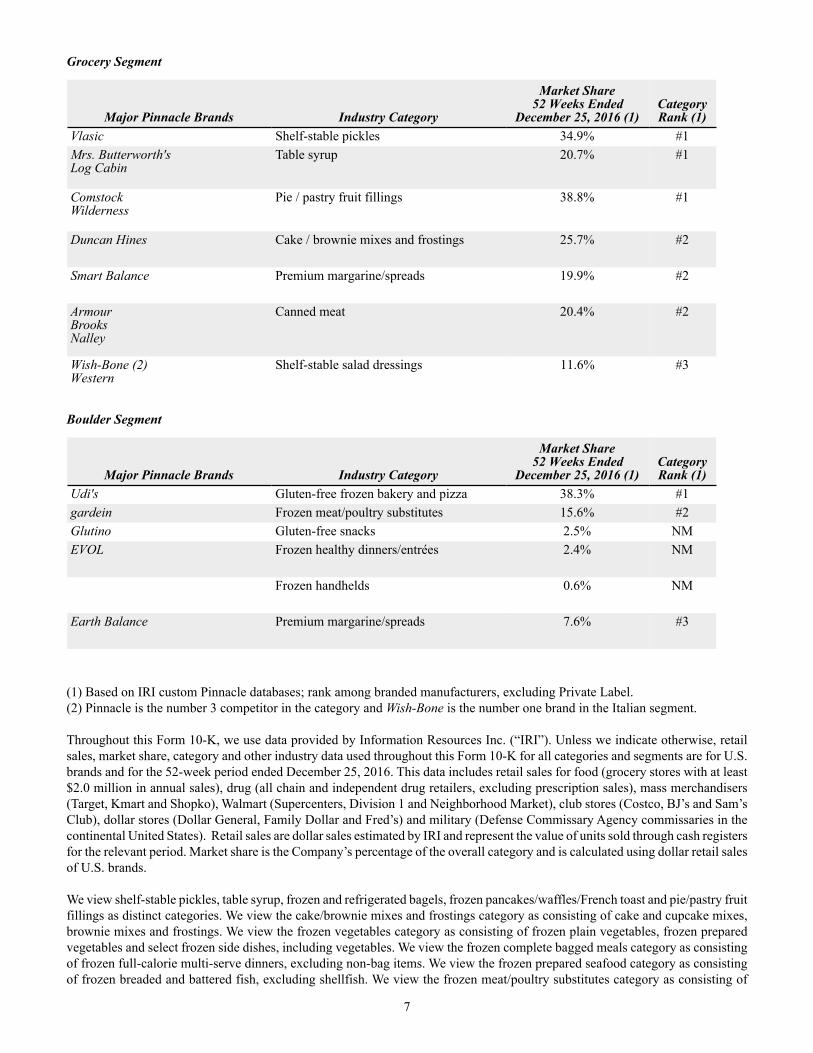
Grocery Segment
Major Pinnacle Brands Industry Category
Market Share52 Weeks Ended
December 25, 2016 (1)CategoryRank (1)
Vlasic Shelf-stable pickles 34.9% #1Mrs. Butterworth'sLog Cabin
Table syrup 20.7% #1
ComstockWilderness
Pie / pastry fruit fillings 38.8% #1
Duncan Hines Cake / brownie mixes and frostings 25.7% #2
Smart Balance Premium margarine/spreads 19.9% #2
ArmourBrooksNalley
Canned meat
20.4% #2
Wish-Bone (2)Western
Shelf-stable salad dressings 11.6% #3
Boulder Segment
Major Pinnacle Brands Industry Category
Market Share52 Weeks Ended
December 25, 2016 (1)CategoryRank (1)
Udi's Gluten-free frozen bakery and pizza 38.3% #1gardein Frozen meat/poultry substitutes 15.6% #2Glutino Gluten-free snacks 2.5% NMEVOL Frozen healthy dinners/entrées 2.4% NM
Frozen handhelds 0.6% NM
Earth Balance Premium margarine/spreads 7.6% #3
(1) Based on IRI custom Pinnacle databases; rank among branded manufacturers, excluding Private Label.(2) Pinnacle is the number 3 competitor in the category and Wish-Bone is the number one brand in the Italian segment.
Throughout this Form 10-K, we use data provided by Information Resources Inc. (“IRI”). Unless we indicate otherwise, retail sales, market share, category and other industry data used throughout this Form 10-K for all categories and segments are for U.S. brands and for the 52-week period ended December 25, 2016. This data includes retail sales for food (grocery stores with at least $2.0 million in annual sales), drug (all chain and independent drug retailers, excluding prescription sales), mass merchandisers (Target, Kmart and Shopko), Walmart (Supercenters, Division 1 and Neighborhood Market), club stores (Costco, BJ’s and Sam’s Club), dollar stores (Dollar General, Family Dollar and Fred’s) and military (Defense Commissary Agency commissaries in the continental United States). Retail sales are dollar sales estimated by IRI and represent the value of units sold through cash registers for the relevant period. Market share is the Company’s percentage of the overall category and is calculated using dollar retail sales of U.S. brands.
We view shelf-stable pickles, table syrup, frozen and refrigerated bagels, frozen pancakes/waffles/French toast and pie/pastry fruit fillings as distinct categories. We view the cake/brownie mixes and frostings category as consisting of cake and cupcake mixes, brownie mixes and frostings. We view the frozen vegetables category as consisting of frozen plain vegetables, frozen prepared vegetables and select frozen side dishes, including vegetables. We view the frozen complete bagged meals category as consisting of frozen full-calorie multi-serve dinners, excluding non-bag items. We view the frozen prepared seafood category as consisting of frozen breaded and battered fish, excluding shellfish. We view the frozen meat/poultry substitutes category as consisting of

8
frozen meat substitutes, frozen poultry substitutes, and frozen dinners/entrées where the ‘meat’ component is a plant-based substitute. We view the single-serve frozen dinners and entrées category as consisting of full-calorie single-serve frozen dinners and entrées and select frozen handheld entrees. We view the frozen pizza-for-one category as consisting of total frozen pizza of 12 ounces per unit or less (for single serve packages, or individual units within multi-serve packages), excluding French bread crust and diet-positioned varieties. We view the canned meat category as consisting of shelf-stable prepared chili, shelf-stable lunch meats, shelf-stable Vienna Sausage and shelf-stable potted meats. We view the shelf-stable salad dressings category as consisting of shelf-stable pourable dressings and salad dressing mixes. We view the frozen healthy single-serve dinners and entrees category as consisting of frozen single-serve frozen dinners and entrees with healthy (natural, organic, non-GMO, gluten free or diet) positioning. We view the frozen handhelds category as consisting of both breakfast and non-breakfast frozen handheld offerings, including burritos. We view the frozen gluten free bakery and pizza category as consisting of all gluten free dedicated brands as well as any of the following that contains a gluten free claim: frozen bread, frozen bagels, frozen rolls, frozen dough/biscuits/muffins, frozen single-serve tortillas/taco kits, frozen pizza and frozen pizza crust/dough. We view the gluten free snacks category as consisting of all gluten free dedicated brands as well an any of the following that contains a gluten free claim: cookies, crackers, cupcakes/brownies, carob/yogurt covered snacks, chocolate covered salty snacks, trail mixes, cheese snacks, pretzels, popcorn, tortilla/tostado chips, breakfast/cereal/snack bars, granola bars or other salted snacks with a gluten free claim. We view the premium margarine/spreads category as consisting of any premium margarine or spread.
Although we believe that this information is reliable, we cannot guarantee its accuracy and completeness, nor have we independently verified it. Although we are not aware of any misstatements regarding the industry data that we present in this Form 10-K, our estimates involve risks and uncertainties and are subject to change based on various factors, including those discussed under “Disclosure regarding forward-looking statements” and “Item 1A: Risk Factors.”
Competitive Strengths
We believe the following competitive strengths differentiate us from our competitors and contribute to our ongoing success:
Actively Managed Portfolio of Iconic Food Brands with Leading Market Positions
We actively manage our diverse portfolio of food brands that participate in attractive product categories. Our well-recognized brand portfolio enjoys strong household penetration in the United States, where our products can be found in over 85% of U.S. households.
We have prioritized our investment spending and brand-building activities behind brands that have higher growth and margins, greater potential for value-added innovation and enhanced responsiveness to consumer marketing. We manage some of our other brands for stability in sales, market share and cash flow, with a focus on ongoing quality upgrades, competitive pricing and strong merchandising and trade programs. Our brand prioritization strategy is focused on ensuring that the strong, stable cash flows from certain brands are deployed for reinvestment in marketing and on-trend innovation for our higher-margin brands, as well as for debt reduction and other corporate priorities.
Strong Innovation and Marketing Capabilities
Over the past few years, we have continually enhanced our organizational capabilities in the areas of new product innovation and consumer marketing. We have improved our in-house innovation capabilities by augmenting and upgrading our innovation team, with the construction of a state-of-the-art Research and Development (“R&D”) facility in our Parsippany, New Jersey headquarters. This facility co-locates our sales, marketing and operations teams with our entire company-wide R&D team, other than gardein,which is located in British Columbia, and better enables us to leverage the innovation experience of our senior management As a result of the Boulder Brands acquisition, we also have sales, marketing, R&D and operations teams in Boulder, Colorado to further enhance our organizational capabilities in the health and wellness arena. Our state-of-the-art manufacturing facility in Denver, Colorado also enables the Company to produce its gluten-free products and improve process capability and product quality.
Additionally, we have increased investment in consumer insights and employee innovation training. Recent examples of successfully launched innovations include new varieties of our Duncan Hines Perfect Size and Birds Eye Steamfresh Flavor Full, Protein Blends and Disney-themed side dishes for kids. We intend to continue to invest in innovation that enables us to further differentiate our brands in the marketplace. Our research and development expenditures totaled $18.1 million, $13.0 million, and $11.3 million for fiscal years 2016, 2015 and 2014, respectively. Our level of research and development expenditures reflects our focus on product development in comparison to basic research.
To complement our accelerated innovation efforts, we have also focused and enhanced our marketing investments. We have partnered with best-in-class branded consumer advertising, digital and media agencies to develop high impact marketing programs

9
implemented across television, print, social and digital media. We intend to increase marketing investments over time, as the volume trends and promotional environment in the broader food industry normalize.
Operational Excellence Driving Continued Gross Margin Improvement
Our operational excellence program is a holistic, Company-wide productivity initiative designed to generate annual productivity savings across our supply chain, in the range of 3.5% to 4.0% of our annual Cost of products sold, which has been achieved over the last five years. In fiscal 2016, our operational excellence initiative drove productivity savings of 4.0%. These productivity savings, combined with selective retail price increases have been instrumental in mitigating input cost inflation in periods of significant inflationary pressure, and driving gross margin expansion in periods of more modest inflation. We also pursue other initiatives to drive incremental improvement in our gross margin, including improving our product mix through new product innovation and low-margin SKU rationalization, increasing the effectiveness of our trade promotional spending and realizing synergies from acquisitions. Furthermore, our gross margin benefits from our diversified input cost basket in which no single commodity accounted for more than 5% of our total Cost of products sold in fiscal 2016.
Strong Free Cash Flow Conversion
Our business generates an attractive Adjusted EBITDA (see non GAAP disclosures later) margin and also benefits from modest capital expenditure and working capital requirements and approximately $425.5 million in net operating loss carryovers (“NOLs”) ($188.3 million after IRC Section 382 limitation, subject to an annual limitation of $17.1 million), which combined have resulted in strong and stable free cash flows. Our Adjusted EBITDA margin benefits from the quality of our brand portfolio and our lean and nimble organization structure, with selling, general and administrative expenses, excluding consumer advertising and promotions and one-time items, slightly above 9% of net sales in fiscal 2016. Our NOLs and other tax attributes will generate modest annual cash tax savings in 2016 and thereafter.
We believe our strong free cash flows will enable us to continue to maximize shareholder value through paying a regular quarterly dividend, financing value-enhancing acquisitions, reducing our indebtedness and strategically deploying our capital to fund innovation and organic growth opportunities.
Proven M&A Expertise with Significant Opportunity
We have substantial experience in sourcing, executing and integrating value-enhancing acquisitions. We maintain a highly-disciplined approach to M&A, focusing on opportunities that add new iconic brands to our portfolio and/or allow for strong synergy realization. On January 15, 2016, the Company acquired Boulder Brands Inc. ("Boulder Brands acquisition") which manufactures, markets and distributes a portfolio of health and wellness brands. The acquisition expanded the Company’s presence in growing and complementary health and wellness categories and in the natural and organic retail channels. In November 2016, we hired a dedicated corporate development resource to enhance the Company’s M&A expertise.
Our strong existing platforms in the Frozen, Grocery, and Boulder segments facilitate a large addressable market and provide us with a broad set of potential acquisition targets. We believe our scale, management depth, integration expertise and access to capital will allow us to consider both small and large acquisitions in the future and to seamlessly integrate them to drive maximum value creation.
Experienced, Hands-On Management Team and Board of Directors
Our management team has a demonstrated history of delivering strong operating results, has extensive food industry experience and includes several executives who have managed significantly larger businesses and have led numerous acquisition integrations. Our management team is complimented by an experienced Board of Directors, which includes several individuals with a proven track record of successfully managing and acquiring consumer businesses.
Customers
We have several large customers that account for a significant portion of our sales. Wal-Mart is our largest customer and represented approximately 28%, 27%, and 27% of net sales in each of fiscal years 2016, 2015, and 2014, respectively. Cumulatively, including Wal-Mart, our top ten customers accounted for approximately 63%, 60%, and 62% of net sales in each of fiscal years 2016, 2015, and 2014.

10
Marketing
Our marketing programs consist of consumer advertising, consumer promotions, trade promotions, direct marketing and public relations. Our advertising consists of television, newspaper, magazine, digital, mobile and social advertising aimed at increasing consumer preference and usage of our brands. Consumer promotions include free trial offers, targeted coupons and on-package offers to generate trial usage and increase purchase frequency. Our trade promotions focus on obtaining retail feature and display support, achieving optimum retail product prices and securing retail shelf space. Over the long term, we continue to focus on shifting our marketing efforts toward building long-term brand equity through increased consumer marketing.
Intellectual Property
Our intellectual property and other proprietary assets include copyrights, registered and common law trademarks and trademark applications, patents and patent applications, domain names, trade secrets, other proprietary rights and licenses of intellectual property rights of various kinds. We consider these assets and rights, both in the United States and in Canada, among our most valuable assets. We rely on a combination of copyright, trademark, patent, trade secret and unfair competition laws as well as contractual provisions to protect these assets. The duration and scope of the protection afforded to our intellectual property and other assets depends on the type of property in question and the laws and regulations of the relevant jurisdiction. In the case of licenses, they also depend on contractual provisions.
We manufacture and market certain of our frozen food products under the Swanson, Aunt Jemima and Voila! brands pursuant to royalty-free, exclusive and perpetual trademark licenses. The licenses give us the right to use certain Swanson, Aunt Jemima and Voila! trademarks both inside and outside of the United States in connection with the manufacture, distribution, marketing, advertising, and promotion and sale of these products. The licenses contain standard provisions, including those dealing with quality control and termination as well as assignment and consent. If we were to breach any material term of the licenses and not timely cure such breach, Campbell Soup Company, The Quaker Oats Company or Voila! Bakeries, Inc. could terminate the licenses.
We also have a license agreement granting us an exclusive, royalty bearing, perpetual license to use certain Armour trademarks in the United States. Under the license agreement, Smithfield Foods, Inc., as successor to ConAgra, Inc., the licensor, grants us a license for the use of various Armour trademarks in conjunction with shelf-stable products within the United States. We are required to make annual royalty payments to the licensor based upon our annual net sales of the approved shelf-stable products. If we were to materially breach the license agreement, Smithfield Foods, Inc. could terminate the license. We own and maintain Armourregistrations in many other countries.
Sales and Distribution
We sell and distribute a majority of our products in the United States and Canada through a combined network of internal sales and broker teams. We employ other brokers for the foodservice and club channels. Through this combination network, our products reach all traditional classes of trade, including supermarkets, grocery wholesalers and distributors, mass merchandisers, super centers, convenience stores, drug stores, warehouse clubs, foodservice and other alternative channels.
Due to the different demands of distribution for frozen, shelf-stable and refrigerated products, we maintain separate distribution systems for these products. In addition to these distribution systems, our snack products are primarily distributed through a direct store delivery network in the Midwest, Mid-Atlantic, and Pacific Northwest, a portion of which we own and operate and a portion of which utilizes third-party providers. We believe that our sales and distribution network is scalable and has the capacity to support substantial increases in volume.
Ingredients and Packaging
We believe that the ingredients and packaging used to produce our products are readily available through multiple sources. Ingredients and packaging typically account for approximately two thirds of our annual Cost of products sold. We use a broad array of ingredients including vegetables and fruits, proteins, grains and oils, sugars, seafood and other agricultural products. Certain vegetables and fruits are purchased under dedicated acreage supply contracts from a number of growers prior to each growing season, while the balance is sourced directly from third parties. Our packaging consists primarily of steel, aluminum, glass jars, plastic bottles, corrugated fiberboard, and various poly-films.

11
Manufacturing
Owned and Operated Manufacturing Facilities. We own and operate twelve and lease six manufacturing facilities for our products. See "Item 2, - Properties" for a listing of our manufacturing facilities.
Co-Packing Arrangements. In addition to our own manufacturing facilities, we source a portion of our products under “co-packing” agreements, a common industry practice in which manufacturing is outsourced to other companies. We regularly evaluate our co-packing arrangements to ensure the most cost-effective manufacturing of our products and to utilize company-owned manufacturing facilities most effectively.
Seasonality
Our sales and cash flows are affected by seasonal cyclicality. In general, our sales are highest in the fourth quarter. In addition, since many of our raw materials are agricultural crops, production of these products is predominantly seasonal. As a result our inventory levels tend to be higher in the third quarter, requiring more working capital at that time.
Competition
We face competition in each of our respective product lines. Although we operate in a highly competitive industry, we believe that the strength of our brands has resulted in strong respective competitive positions. We compete with producers of similar products on the basis of, among other things, product quality, brand recognition and loyalty, price, customer service, effective consumer marketing and promotional activities, and the ability to identify and satisfy emerging consumer preferences.
Employees
We employed approximately 5,100 people as of December 25, 2016, with approximately 56% of our hourly employees unionized. Due to the seasonality of our agricultural businesses, our employment fluctuates throughout the year, and thus our average number of employees was approximately 5,500 throughout fiscal 2016. In September, 2016, we completed negotiations and entered into a new collective bargaining agreement with the union representing approximately 420 employees at our Fort Madison, Iowa plant. In January 2017, we entered into a new collective bargaining agreement with approximately 117 of our union employees at our Fennville, Michigan plant. Our other unionized employees are covered under collective bargaining agreements expiring between April 2018 and October 2022. In general, we consider our relationship with employees to be good. See “Item 1A- Risk Factors- Our financial well-being could be jeopardized by unforeseen changes in our employees’ collective bargaining agreements or shifts in union policy.”
Financial Information About Geographical Areas
For information about our geographic segments, see Note 14 to the consolidated financial statements in this Form 10-K.
Governmental, Legal and Regulatory Matters
Food Safety and Labeling
We are subject to extensive regulation, including, among other things, the Food, Drug and Cosmetic Act, as amended by the Food Safety Modernization Act, the Public Health Security and Bioterrorism Preparedness and Response Act of 2002, and the rules and regulations promulgated thereunder by the U.S. Food and Drug Administration. This comprehensive and evolving regulatory program governs, among other things, the manufacturing, composition and ingredients, labeling, packaging, and safety of food, including compliance with current Good Manufacturing Practices. In addition, the Nutrition Labeling and Education Act of 1990 prescribes the format and content of certain information required to appear on the labels of food products. We are also subject to regulation by certain other governmental agencies, including the U.S. Department of Agriculture.
Our operations and products are also subject to state and local regulation, including the registration and licensing of plants, enforcement by state health agencies of various state standards, and the registration and inspection of facilities. Compliance with federal, state and local regulation is costly and time-consuming. Enforcement actions for violations of federal, state, and local regulations may include seizure and condemnation of products, cease and desist orders, injunctions or monetary penalties. We believe that our practices are sufficient to maintain compliance with applicable government regulations.
Federal Trade Commission
We are subject to certain regulations by the Federal Trade Commission. Advertising of our products is subject to such regulation pursuant to the Federal Trade Commission Act and the regulations promulgated thereunder.

12
Employee Safety Regulations
We are subject to certain health and safety regulations, including regulations issued pursuant to the Occupational Safety and Health Act. These regulations require us to comply with certain manufacturing, health, and safety standards to protect our employees from accidents.
Environmental Regulation
We are subject to a number of federal, state, and local laws and other requirements relating to the protection of the environment and the safety and health of personnel and the public. These requirements relate to a broad range of our activities, including: the discharge of pollutants into the air and water; the identification, generation, storage, handling, transportation, disposal, recordkeeping, labeling, and reporting of, and emergency response in connection with, hazardous materials (including asbestos) associated with our operations; noise emissions from our facilities; and safety and health standards, practices, and procedures that apply to the workplace and the operation of our facilities.
In order to comply with these requirements, we may need to spend substantial amounts of money and other resources from time to time to (i) construct or acquire new equipment, (ii) acquire or amend permits to authorize facility operations, (iii) modify, upgrade, or replace existing and proposed equipment and (iv) clean up or decommission our facilities or other locations to which our wastes have been sent. For example, some of our baking facilities are required to obtain air emissions permits and to install bag filters. Many of our facilities discharge wastewater into municipal treatment works, and may be required to pre-treat the wastewater and/or to pay surcharges. Some of our facilities use and store in tanks large quantities of materials, such as sodium chloride and ammonia, that could cause environmental damage if accidentally released. We use some hazardous materials in our operations, and we generate and dispose of hazardous wastes as a conditionally exempt small quantity generator. Our capital and operating budgets include costs and expenses associated with complying with these laws. If we do not comply with environmental requirements that apply to our operations, regulatory agencies could seek to impose civil, administrative, and/or criminal liabilities, as well as seek to curtail our operations. Under some circumstances, private parties could also seek to impose civil fines or penalties for violations of environmental laws or recover monetary damages, including those relating to property damage or personal injury.
Many of our plants were in operation before current environmental laws and regulations were enacted. Our predecessors have in the past had to remediate soil and/or groundwater contamination at a number of locations, including petroleum contamination caused by leaking underground storage tanks which they removed, and we may be required to do so again in the future. We have sold a number of plants where we have ceased operations, and it is possible that future renovations or redevelopment at these facilities might reveal additional contamination that may need to be addressed. Although remediation costs in the past have not been material, future remediation costs may be. The presence of hazardous materials at our facilities or at other locations to which we have sent hazardous wastes for treatment or disposal, may expose us to potential liabilities associated with the cleanup of contaminated soil and groundwater under federal or state “Superfund” statutes. Under the federal Comprehensive Environmental Response, Compensation, and Liability Act of 1980, as amended (“CERCLA”), owners and operators of facilities from which there has been a release or threatened release of hazardous materials, together with those who have transported or arranged for the transportation or disposal of those materials, are liable for (i) the costs of responding to and remediating that release and (ii) the restoration of natural resources damaged by any such release. Under CERCLA and similar state statutes, liability for the entire cost of cleaning up the contaminated site can, subject to certain exceptions, be imposed upon any such party regardless of the lawfulness of the activities that led to the contamination.
See “Item 1A— Risk Factors— We and our third-party co-packers and suppliers are subject to laws and regulations relating to protection of the environment, worker health, and workplace safety. Costs to comply with these laws and regulations, or claims with respect to environmental, health and safety matters, could have a significant negative impact on our business.”
Insurance
We maintain general liability and product liability, property, worker’s compensation, business interruption, director and officer and other insurance in amounts and on terms that we believe are customary for companies similarly situated. In addition, we maintain excess insurance where we believe it is reasonably cost effective.
Additional Information
Additional information pertaining to our businesses, including operating segments, is set forth under the caption “Management's Discussion and Analysis of Financial Condition and Results of Operations-Results of Operations and Related Information” under

13
Item 7 of this Form 10-K and in Note 14 to the Consolidated Financial Statements, “Segments”, which is included under Item 8 of this Form 10-K.
Our reports on Form 10-K, along with all other reports and amendments, are filed with or furnished to the U.S. Securities and Exchange Commission (the "SEC"). You may read and copy any materials we file with the SEC at the SEC's Public Reference Room at 100 F Street, NE, Washington, D.C., 20549. Please call 1-800-SEC-0330 for further information on the operation of the Public Reference Room. Our filings are also available free of charge to the public from commercial document retrieval services and at the web site maintained by the SEC at http://www.sec.gov. We also make available through our internet website at http://www.pinnaclefoods.com under the heading “Investor Center,” our annual reports on Form 10-K, proxy statements, quarterly reports on Form 10-Q, current reports on Form 8-K and amendments to those reports after we electronically file any such materials with the SEC. In addition, copies of our (i) Corporate Governance Guidelines, (ii) charters for the Audit Committee, Compensation Committee and Nominating and Corporate Governance Committee and (iii) Code of Business Conduct and Ethics are available through our internet website at http://www.pinnaclefoods.com under the heading “Investor Center” and under the sub-heading “Governance Documents”. References to our website are intended to be inactive textual references only and the information posted on, accessed through or otherwise connected to it shall not be deemed to be incorporated by reference into this report.
Executive Officers of the Registrant
Pursuant to General Instruction G of Form 10-K, the following is included in Part I of this Annual Report and sets forth certain information as of February 23, 2017 concerning our executive officers:
Mr. Michael Allen
Mr. Allen, age 55, was named Executive Vice President and President, Boulder in September 2016. In this role, Mr. Allen leads Pinnacle’s Boulder segment of brands. Mr. Allen joined Pinnacle Foods with 20 years of experience in the food industry, including focus in the natural, organic and health-forward channels. Before Pinnacle, Mr. Allen held the role of President, Morning Foods Division at the Kellogg Company and he also served as President, Frozen Foods Division from February 2009 to July 2013. Mr. Allen joined the Kellogg Company in 1997 and progressed through various leadership roles in marketing, innovation and general management. Mr. Allen holds a degree in Communications from Centennial College in Toronto.
Mr. Michael Barkley
Mr. Barkley, age 50, was named Executive Vice President, Meals and Sides and Chief Marketing Officer in December 2015. Mr. Barkley oversees the Meals and Sides category team and channels marketing. Additionally, Mr. Barkley's responsibilities as Chief Marketing Officer include strengthening and harmonizing the Company’s marketing across the business teams, overseeing agency relationships and developing marketing talent. From December 2013 to December 2015, Mr. Barkley served as the Company’s Senior Vice President and General Manager Meals and Sides. Prior to joining Pinnacle, Mr. Barkley served as Vice President and General Manager of Healthy Beverages, Vice President Simple Meals and Vice President Ready to Serve Soup at Campbell Soup Company from 2008 to 2013. Prior to joining Campbell, Mr. Barkley led consumer health brands in various Vice President and General Manager roles at Johnson & Johnson and Bristol-Meyers Squibb. Mr. Barkley holds a B.S. degree from the University of Virginia and an M.B.A. from the University of North Carolina.
Mr. Christopher Boever
Mr. Boever, age 49, was named Executive Vice President and Chief Customer Officer in December, 2011. Mr. Boever oversees the sales force and broker organization for Pinnacle’s U.S. organization. From June 2007 to December 2011, Mr. Boever worked at ConAgra Foods, Inc., most recently serving as Senior Vice President Sales, leading the sales organization for the Consumer Division. At ConAgra he advanced through positions of increasing responsibility including strategy, planning and operations across a portfolio of frozen, grocery, refrigerated and snack food brands. From January 1991 to June 2007, Mr. Boever worked in various headquarters and field positions at Hormel Foods. Mr. Boever holds a Bachelor of Business Administration degree from the University of Wisconsin, Whitewater.
Mr. Mark Clouse
Mr. Clouse, age 48, was appointed Chief Executive Officer effective May 23, 2016. From January 2016 to May 2016, Mr. Clouse served as Executive Vice President and Chief Commercial Officer at Mondelez International, Inc. He previously served as Executive Vice President and Chief Growth Officer from July 2014 until December 2015 and Executive Vice President and President, North America from October 2012 to March 2015. He was President of the Snacks and Confectionery business in North America from

14
June 2011 to October 2012, Senior Vice President of the Biscuits Global Category Team from October 2010 to June 2011, Managing Director of Kraft Foods Brazil from January 2008 to September 2010 and President of Kraft Foods Greater China from January 2006 to January 2008. Prior to that, Mr. Clouse held various positions of increasing responsibility around the world. During Mr. Clouse’s 20-year tenure at Kraft Foods Inc. and the subsequent spin-off of Mondelez, Mr. Clouse held a broad range of leadership positions involving iconic brands such as Oreo, Nabisco, Cadbury and Trident, oversaw the company’s commercial execution for all of its five geographic regions, as well as the global sales function, was responsible for the company’s growth strategy and oversaw key areas such as corporate strategy, global marketing, global sales, and research, development and quality. Mr. Clouse is a graduate of the U.S. Military Academy at West Point, with a degree in economics.
Ms. Mary Beth DeNooyer
Ms. DeNooyer, age 46, was named Executive Vice President and Chief Human Resources Officer in May 2013. As Chief Human Resources Officer, Ms. DeNooyer leads all human resources responsibilities throughout the Company including organizational development, recruitment and talent management, training, compensation and benefits, employee relations, diversity and communications. From April 2011 through June 2012, Ms. DeNooyer served as Senior Vice President and Chief Human Resources Officer, in addition to her role as head of Compensation and Benefits, for the division of Sara Lee which was later spun-off as Hillshire Brands. From March 2010 to April 2011, Ms. DeNooyer served as Senior Vice President, Compensation and Benefits at Sara Lee. Ms. DeNooyer held Human Resources leadership positions at The Pepsi Bottling Group from 1998 to 2010 and General Mills from 1994 to 1998. Ms. DeNooyer holds a Bachelor’s Degree in Business Administration from Drexel University and a Master’s Degree in Industrial and Labor Relations from Cornell University.
Mr. Michael Kelley Maggs
Mr. Maggs, age 65, was named Executive Vice President and General Counsel in March 2013. Previously, Mr. Maggs served as Senior Vice President, General Counsel and Secretary since Pinnacle’s inception in 2001. Mr. Maggs oversees all legal and corporate secretary activities at Pinnacle. He was associated with affiliates of CDM Investor Group LLC from 1993 until 2007. Prior to his involvement with Pinnacle, Mr. Maggs held the same position with International Home Foods Inc. from November 1996 to December 2000. From 1993 to 1996, Mr. Maggs was employed with Stella Foods, Inc. as Vice President and General Counsel. Prior to that time, he was engaged in the private practice of law in Virginia and New York. Mr. Maggs is a graduate of Niagara University and received his Juris Doctor from George Mason University Law School.
Mr. Mark Schiller
Mr. Schiller, age 55, was named Executive Vice President and President North America Retail in January 2015. In this role, Mr. Schiller oversees the management of all of the Company’s retail brands and private label, excluding brands within the Boulder segment and snack business. From May 2013 to December 2014, Mr. Schiller served as Executive Vice President and President Birds Eye Frozen Division. From June 2010 to May 2013, Mr. Schiller served as Executive Vice President and President Duncan Hines Grocery Division. From March 2002 to April 2010, Mr. Schiller worked at PepsiCo as Senior Vice President of Frito Lay New Ventures, President of Quaker Foods and Snacks North America, and Senior Vice President and General Manager of Frito Lay Convenience Foods Division. From 1998 to 2002, Mr. Schiller was Chief Operating Officer and Co-President of Tutor Time Learning Systems, Inc. From 1996 to 1998, Mr. Schiller served as President of Valley Recreation Products, Inc. Mr. Schiller began his career at the Quaker Oats Company in 1985 where he progressed through a number of marketing, sales and supply chain roles. Mr. Schiller holds a Bachelor of Arts degree from Tulane University and an MBA from Columbia University Graduate School of Business.
Mr. Craig Steeneck
Mr. Steeneck, age 58, was named Executive Vice President and Chief Financial Officer in July 2007. Mr. Steeneck oversees our financial operations, treasury, tax, investor relations, corporate development and information technology. From June 2005 to July 2007, Mr. Steeneck served as Executive Vice President, Supply Chain Finance and IT, where he helped redesign the supply chain to generate savings and improved financial performance. From April 2003 to June 2005, Mr. Steeneck served as Executive Vice President, Chief Financial Officer and Chief Administrative Officer of Cendant Timeshare Resort Group (now Wyndham Worldwide), playing key roles in wide-scale organization of internal processes and staff management. From March 2001 to April 2003, Mr. Steeneck served as Executive Vice President and Chief Financial Officer of Resorts Condominiums International (now Wyndham Worldwide) From October 1999 to February 2001, he was the Chief Financial Officer of International Home Foods Inc. Mr. Steeneck is a member of the Board of Directors of Freshpet, Inc. since November 2014, and serves as Chairman of its Audit Committee. Mr. Steeneck is a member of the Board of Directors of Hostess Brands Inc. since November 2016, and he serves as Chairman of its Audit Committee. Mr. Steeneck is an honors graduate of the University of Rhode Island.

15
Mr. D. Michael Wittman
Mr. Wittman, age 55, was named Executive Vice President and Chief Supply Chain Officer in November 2015. In his role, Mr. Wittman has overall corporate responsibility for the end-to-end supply chain, including procurement, manufacturing, customer service, warehousing and distribution. Additionally, Mr. Wittman oversees Pinnacle's food quality and safety programs. From December 2008 to October 2015, Mr. Wittman served as Vice President of Supply Chain for Mars Chocolate North America where he was responsible for the supply chain for the confectionery business. Prior to Mars, Mr. Wittman spent over 25 years within the Johnson & Johnson Family of Companies, including leadership roles in J&J Consumer Companies and McNeil Consumer Products.Mr. Wittman holds a Bachelor of Science degree in Accounting from St. Edward's University in Austin, Texas.

16
ITEM 1A. RISK FACTORS
RISK FACTORS
Risks Related to Our Business
We face significant competition in our industry, which could cause us to lose market share, lower prices, or increase advertising and promotional expenditures. Our success also depends on our ability to predict, identify and interpret changes in consumer preferences and develop and offer new products rapidly enough to meet those changes.
The food products business is highly competitive. Numerous brands and products compete for shelf space and sales, with competition based primarily on product quality, brand recognition and loyalty, price, trade promotion, consumer promotion, customer service, and the ability to identify and satisfy emerging consumer preferences. We compete with a significant number of companies of varying sizes, including divisions, subdivisions, or subsidiaries of larger companies. Many of these competitors have multiple product lines, substantially greater financial and other resources available to them, and may be substantially less leveraged than Pinnacle. In addition, private label is a significant competitor, particularly in the frozen vegetables, shelf-stable pickles, table syrup, frozen and refrigerated bagels, and pie/pastry fruit fillings categories. We may not be able to compete successfully with these companies and private label. Competitive pressures or other factors could cause us to lose market share, which may require us to lower prices, increase marketing and advertising expenditures, or increase the use of discounting or promotional campaigns, each of which would materially and adversely affect our margins and could result in a decrease in our operating results and profitability.
Our success depends on our ability to predict, identify, and interpret the tastes and dietary habits of consumers and to offer products that appeal to those preferences. There are inherent marketplace risks associated with new product or packaging introductions, including uncertainties about trade and consumer acceptance. If we do not succeed in offering products that consumers want to buy, our sales and market share will decrease, resulting in reduced profitability. If we are unable to accurately predict which shifts in consumer preferences will be long-lasting, or are unable to introduce new and improved products to satisfy those preferences, our sales will decline. In addition, given the variety of backgrounds and identities of consumers in our consumer base, we must offer a sufficient array of products to satisfy the broad spectrum of consumer preferences. As such, we must be successful in developing innovative products across a multitude of product categories. Finally, if we fail to rapidly develop products in faster-growing and more profitable categories, we could experience reduced demand for our products, or fail to expand margins.
We are also subject to the effect that the overall economic conditions have upon consumer sentiment and retail sales.
If we lose one or more of our major customers, or if any of our major customers experience significant business interruption or enact initiatives to improve their cost structure, our results of operations could be adversely affected.
We have several large customers that account for a significant portion of our sales. We do not have long-term supply contracts with any of our major customers. Our large customers may choose to purchase products from us based on a combination of factors such as price, consumer demand, customer service performance, their desired inventory levels, and other factors. Changes in any of our major customers’ strategies, including a reduction in the number of brands they carry, initiatives to improve their cost structure, or a shift of shelf space to private label products, may adversely affect sales.
The loss of one or more major customers, a material reduction in sales to these customers as a result of competition from other food manufacturers, or the occurrence of a significant business interruption of our customers’ operations would result in a decrease in our revenues, operating results, and earnings and could adversely affect the market price of our common stock.
In addition, as the retail grocery trade continues to consolidate and our retail customers grow larger and become more sophisticated, our retail customers may demand lower pricing and increased promotional programs. If we fail to use our sales and marketing expertise to maintain our category leadership positions to respond to these trends, or if we lower our prices or increase promotional support of our products and are unable to increase the volume of our products sold, our profitability and financial condition may be adversely affected.
For the manufacturing, co-packing and distribution of many of our products, we primarily rely on single source providers where a significant disruption in a facility or loss of arrangements could affect our business, financial condition, and results of operations.
With the exception of our Birds Eye frozen vegetable products which are produced in two facilities (Waseca, Minnesota and Darien, Wisconsin, which has approximately three times the production capacity of the Waseca location), none of our products are produced

17
in significant amounts at multiple manufacturing facilities or co-packers. Significant unscheduled downtime at any of our facilities or co-packers due to equipment breakdowns, power failures, natural disasters, or any other cause could materially adversely affect our ability to provide products to our customers, which would have a material adverse effect on our business, financial condition and results of operations.
We rely upon co-packers for some of our production needs, including certain Birds Eye products, a significant portion of products acquired through the Boulder Brands acquisition and our Duncan Hines frosting products, among others. We believe that there are a limited number of competent, high-quality co-packers in the industry, and if we were required to obtain additional or alternative co-packing agreements or arrangements in the future, we may not be able to do so on satisfactory terms or in a timely manner.
We sell a majority of our products in the United States and Canada through a combination of a direct and broker network. Our business could suffer disruption if either of our major United States or Canada brokers were to default in the performance of their obligations to perform brokerage services or fail to effectively represent us to the retail grocery trade.
We are vulnerable to fluctuations in the price and supply of food ingredients, packaging materials, and freight.
The prices of the food ingredients, packaging materials and freight are subject to fluctuations in price attributable to, among other things, changes in supply and demand of crops or other commodities, fuel prices and government-sponsored agricultural and livestock programs. The sales prices to our customers are a delivered price. Therefore, changes in our input costs could impact our gross margins. Our ability to pass along higher costs through price increases to our customers is dependent upon competitive conditions and pricing methodologies employed in the various markets in which we compete. To the extent competitors do not also increase their prices, customers and consumers may choose to purchase competing products or may shift purchases to lower-priced private label or other value offerings which may adversely affect our results of operations.
We use significant quantities of food ingredients and other agricultural products as well as plastic, paper corrugated fiberboard, aluminum, glass jars and steel packaging materials provided by third-party suppliers. We buy from a variety of producers and manufacturers, and alternate sources of supply are generally available. However, the supply and price are subject to market conditions and are influenced by other factors beyond our control, such as general economic conditions, unanticipated demand, problems in production or distribution, natural disasters, weather conditions during the growing and harvesting seasons, insects, plant diseases, and fungi.
Adverse weather conditions may occur more frequently as a result of climate change and other factors. There is concern that greenhouse gases in the atmosphere may have an adverse impact on global temperatures, weather patterns and the frequency and severity of extreme weather and natural disasters. Long-term climate changes may negatively impact the price or availability of key raw materials. Adverse weather conditions and natural disasters can reduce crop size and crop quality, which in turn could reduce our supplies of raw materials, lower recoveries of usable raw materials, increase the prices of our raw materials, increase our cost of transporting and storing raw materials, or disrupt our production schedules.
We do not have long-term contracts with many of our suppliers, and, as a result, they could increase prices or fail to deliver. The occurrence of any of the foregoing could increase our costs and disrupt our operations.
If our assessments and assumptions about commodity prices, as well as ingredient and other prices and currency exchange rates, prove to be incorrect in connection with our hedging or forward-buy efforts or planning cycles, our costs may be greater than anticipated and our financial results could be adversely affected. Volatility in commodity prices will impact our results of operations.
From time to time, we enter into commodity forward contracts to fix the price of diesel fuel, natural gas, soybean oil and other commodity purchases at a future delivery date. However, such strategies do not fully address commodity price risk. Adverse movements in commodity prices over the terms of the contracts or instruments could decrease the economic benefits we derive from these strategies. Additionally, changes in the value of our commodities derivatives are recorded in the Cost of products sold line in our Consolidated Statements of Operations. Accordingly, volatility in commodities could result in volatility in our results of operations. As of December 25, 2016, the potential change in fair value of commodity derivative instruments, assuming a 10% adverse movement in the underlying commodity prices, would have resulted in an unrealized net loss of $1.7 million.
In addition, certain parts of our foreign operations in Canada expose us to fluctuations in foreign exchange rates. Net sales in Canada accounted for 3.5% of Consolidated Net Sales for fiscal 2016. We also seek to reduce our exposure to such foreign exchange risks primarily through the use of foreign exchange-related derivative financial instruments. We enter into derivative financial instruments to protect the value or fix the amount of certain obligations in terms of our functional currency. As of December 25,

18
2016, a 10% decline in the U.S. dollar relative to the Canadian dollar would have decreased the fair value of our foreign exchange forward contracts by $1.0 million.
We may cease any of our current programs or use other hedging or derivative programs in the future. The extent of our hedges at any given time depends on our assessment of the markets for these commodities, diesel fuel and natural gas, including our assumptions about future prices and currency exchange rates. For example, if we believe market prices for the commodities we use are unusually high, we may choose to hedge less, or even none, of our upcoming requirements. If we fail to hedge and prices or currency exchange rates subsequently increase, or if we institute a hedge and prices or currency exchange rates subsequently decrease, our costs may be greater than anticipated or greater than our competitors’ costs and our financial results could be adversely affected. See “Item 7 - Management’s Discussion and Analysis of Financial Condition and Results of Operations-Quantitative and Qualitative Disclosures About Market Risk” for a discussion of our current hedging and derivatives programs.
We may not be able to successfully identify, evaluate and integrate businesses we may acquire in the future and we may not be able to realize anticipated cost savings, revenue enhancements, or other synergies from such acquisitions.
We may not be able to identify and complete acquisitions in the future, and our failure to do so could limit our ability to grow our business beyond our existing brands. If we do acquire businesses in the future, the process of integrating such businesses involves risks. Some of these risks include, but are not limited to, demands on management related to the potential significant increase in the size of our business, the diversion of management’s attention from the management of daily operations and difficulties in the assimilation of different corporate cultures and business practices. Failure to successfully integrate acquired businesses may result in reduced levels of revenue, earnings or operating efficiency than might have been achieved if we had not acquired such businesses.
Litigation or claims regarding our trademarks and any other proprietary rights or termination of our material licenses may have a significant, negative impact on our business.
We attempt to protect our intellectual property rights through a combination of trademark, patent, copyright and trade secret laws. We consider our trademarks to be of significant importance to our business and devote resources to the establishment and protection of our trademarks and other intellectual property rights. However, our trademark or other intellectual property applications are not always approved. Third parties may also oppose our intellectual property applications, or otherwise challenge our use of our trademark or other intellectual property. The actions we have taken or will take in the future may not be adequate to prevent violation of our trademark or other proprietary rights by others or prevent others from seeking to block sales of our products as an alleged violation of their trademark or other proprietary rights. We may need to initiate future claims or litigation or defend claims or litigation against us to enforce our trademark or other proprietary rights or to defend ourselves against claimed infringement of the trademark or other proprietary rights of others. Any future claims or litigation of this type, even without merit, could result in a material adverse effect on our business, financial condition or results of operations. Any such future claims or litigation may: (a) be expensive and time consuming to defend; (b) cause us to cease making, licensing or using products that incorporate the challenged intellectual property; (c) require us to rebrand our products or redesign our packaging, if feasible; (d) divert management’s attention and resources; or (e) require us to enter into royalty or licensing agreements in order to obtain the right to use a third party’s intellectual property, which, if required, may not be available to us on acceptable terms or at all. Any inability to use our trademarks or other proprietary rights could harm our business and sales through reduced demand for our products and reduced revenues.
Additionally, we manufacture certain brands under license agreements from various third parties. The loss of these licenses could have a material adverse effect on our business.
We may be unable to drive revenue growth in our key product categories or add products that are in faster growing and more profitable categories.
The food and beverage industry’s overall growth is linked to population growth. Our future results will depend on our ability to drive revenue growth in our key product categories. Because our operations are concentrated in North America, where growth in the food and beverage industry has been moderate, our success also depends in part on our ability to enhance our portfolio by adding innovative new products in faster growing and more profitable categories. Our failure to drive revenue growth in our key product categories or develop innovative products for new and existing categories could materially and adversely affect our profitability, financial condition and results of operations.

19
We may be subject to product recalls or product liability claims should the consumption of any of our products cause injury, illness or death.
We sell food products for human consumption, which involves risks such as product contamination or spoilage, misbranding, product tampering, and other adulteration of food products. Consumption of a misbranded, adulterated, contaminated, or spoiled product may result in personal illness or injury.
We could be subject to claims or lawsuits relating to an actual or alleged illness or injury, and we could incur liabilities that are not insured or exceed our insurance coverage. Even if product liability claims against us are not successful or fully pursued, these claims could be costly and time consuming and may require our management to spend time defending the claims rather than operating our business.
A product that has been actually or allegedly misbranded or becomes adulterated could result in product withdrawals or recalls, destruction of product inventory, negative publicity, temporary plant closings, and substantial costs of compliance or remediation. Recalls might also be required due to usage of raw materials provided by third-party suppliers. A significant product recall could cause our products to be unavailable for a period of time and reduce our sales. Any of these events, including a significant product liability judgment against us, could result in a loss of demand for our food products, which could have a material adverse effect on our financial condition, results of operations or cash flows.
Due to the seasonality of the business, our revenue and operating results may vary from quarter to quarter.
Our sales and cash flows are affected by seasonal cyclicality. Sales of frozen foods, including frozen vegetables and frozen complete bagged meals, tend to be marginally higher during the winter months. Seafood sales peak during Lent, in advance of the Easter holiday. Sales of pickles, relishes, barbecue sauces, potato chips and salad dressings tend to be higher in the spring and summer months, and demand for Duncan Hines, Smart Balance and Earth Balance products, Birds Eye vegetables and our pie and pastry fruit fillings tend to be higher around the Easter, Thanksgiving, and Christmas holidays. Since many of the raw materials we process under the Birds Eye and Vlasic brands are agricultural crops, production of these products is predominantly seasonal, occurring during and immediately following the purchase of such crops. We also increase our Duncan Hines inventories in advance of the peak fall selling season. As a result, our inventory levels tend to be higher during August, September, and October, and thus we require more working capital during these months. We are typically a seasonal net user of cash in the third quarter of the calendar year.
For these reasons, sequential quarterly comparisons are not a good indication of our performance or how we may perform in the future. If we are unable to obtain access to working capital or if seasonal fluctuations are greater than anticipated, there could be a material adverse effect on our financial condition, results of operations or cash flows.
We face risks associated with certain pension obligations.
We hold investments in equity and debt securities in our qualified defined benefit pension plan. Deterioration in the value of plan assets, resulting from a general financial downturn or otherwise, could cause an increase in the underfunded status of our defined benefit pension plan, thereby increasing our obligation to make contributions to the plan. The underfunding in our pension plan totaled $54.6 million as of December 25, 2016. The decrease in discount rates from approximately 6.0% in 2008 to 4.0% as of December 25, 2016 has had a significant impact on our funding status. Changes in interest rates in the future could have a significant effect on our funded status.
Our obligation to make contributions to the pension plan could reduce the cash available for working capital and other corporate uses and may have a material adverse impact on our operations, financial condition and liquidity.
Our financial well-being could be jeopardized by unforeseen changes in our employees’ collective bargaining agreements or shifts in union policy.
We employed approximately 5,100 people as of December 25, 2016, with approximately 56% of our hourly employees unionized. Failure to extend or renew our collective bargaining agreements or a prolonged work stoppage or strike at any facility with union employees could have a material adverse effect on our business, financial condition, or results of operations. In addition, we may not be able to reach new agreements upon the expiration of our existing collective bargaining agreements and if we do reach new agreements, such agreements may not be on terms that we consider favorable. Furthermore, labor organizing activities could result in additional employees becoming unionized.

20
We and our third-party co-packers and suppliers are subject to laws and regulations relating to protection of the environment, worker health, and workplace safety. Costs to comply with these laws and regulations, or claims with respect to environmental, health and safety matters, could have a significant negative impact on our business.
Our operations are subject to various federal, state and local laws and regulations relating to the protection of the environment, including those governing the discharge of pollutants into the air and water, the management and disposal of solid and hazardous materials and wastes, employee exposure to hazards in the workplace and the cleanup of contaminated sites. We are required to obtain and comply with environmental permits for many of our operations, and sometimes we are required to install pollution control equipment or to implement operational changes to limit air emissions or wastewater discharges and/or decrease the likelihood of accidental releases of hazardous materials. We could incur substantial costs, including cleanup costs, civil or criminal fines or penalties, and third-party claims for property damage or personal injury as a result of any violations of environmental laws and regulations, noncompliance with environmental permit conditions or contamination for which we may be responsible that is identified or that may occur in the future. Such costs may be material.
Under federal and state environmental laws, we may be liable for the costs of investigation, removal or remediation of certain hazardous or toxic substances, as well as related costs of investigation and damage to natural resources, at various properties, including our current and former properties and the former properties of our predecessors, as well as offsite waste handling or disposal sites that we or our predecessors have used. Liability may be imposed upon us without regard to whether we knew of or caused the presence of such hazardous or toxic substances. Any such locations, or locations that we may acquire in the future, may result in liability to us under such laws or expose us to third party actions such as tort suits based on alleged conduct or environmental conditions. In addition, we may be liable if hazardous or toxic substances migrate from properties for which we may be responsible to other properties.
In addition to regulations applicable to our operations, failure by any of our co-packers or other suppliers to comply with regulations, or allegations of compliance failure, may disrupt their operations and could result in potential liability. Even if we were able to obtain insurance coverage or compensation for any losses or damages resulting from the non-compliance of a co-packer or supplier with applicable regulations, our brands and reputation may be adversely affected by negative perceptions of our brands stemming from such compliance failures.
We cannot predict what environmental or health and safety legislation or regulations will be enacted in the future or how existing or future laws or regulations will be enforced, administered or interpreted. We also cannot predict the amount of future expenditures that may be required in order to comply with such environmental or health and safety laws or regulations or to respond to environmental claims.
Unsuccessful implementation of business strategies may adversely affect our results of operations.
If we are not able to complete projects designed to improve our processes, systems and business planning, our operating profits may be adversely impacted. In addition, if the initiatives we have implemented to identify productivity opportunities in order to drive margin improvement, or any future cost-saving initiatives, do not generate the expected cost savings and synergies, our results of operations may be adversely affected.
Our operations are subject to regulation by the U.S. Food and Drug Administration (“FDA”), U.S. Department of Agriculture (“USDA”), Federal Trade Commission (“FTC”) and other governmental entities and such regulations are subject to change from time to time which could impact how we manage our production and sale of products. Federal budget cuts could result in furloughs for government employees, including inspectors and reviewers for our plants and products and for our suppliers’ plants and products, which could materially impact our ability to manufacture regulated products.
Our operations are subject to extensive regulation by the FDA, the USDA and other national, state, and local authorities. For example, we are subject to the Food, Drug and Cosmetic Act and regulations promulgated thereunder by the FDA. This comprehensive regulatory program governs, among other things, the manufacturing, composition and ingredients, packaging, and safety of food. Under this program, the FDA regulates manufacturing practices for foods through, among other things, its current “good manufacturing practices” regulations, or cGMPs, and specifies the recipes for certain foods. Our processing facilities and products are subject to periodic inspection by federal, state, and local authorities. In addition, we must comply with similar laws in Canada. The FTC and other authorities regulate how we market and advertise our products, and we could be the target of claims relating to alleged false or deceptive advertising under federal, state, and foreign laws and regulations. Changes in these laws or regulations or the introduction of new laws or regulations could increase the costs of doing business for us or our customers or suppliers or restrict our actions, causing our results of operations to be adversely affected.

21
We seek to comply with applicable regulations through a combination of employing internal personnel to ensure quality-assurance compliance (for example, assuring that food packages contain only ingredients as specified on the package labeling) and contracting with third-party laboratories that conduct analysis of products for the nutritional-labeling requirements. Compliance with federal, state and local regulations is costly and time-consuming. Failure to comply with applicable laws and regulations or maintain permits and licenses relating to our operations could subject us to civil remedies, including fines, injunctions, recalls or seizures, as well as potential criminal sanctions, which could result in increased operating costs resulting in a material adverse effect on our operating results and business.
Our business operations could be disrupted if our information technology systems fail to perform adequately.
The efficient operation of our business depends on our information technology systems, some of which are managed by third-party service providers. We rely on our information technology systems to effectively manage our business data, digital marketing activities, communications, supply chain, order entry and fulfillment, and other business processes. The failure of our information technology systems to perform as we anticipate could disrupt our business and could result in transaction errors, processing inefficiencies, and the loss of sales and customers, causing our business and results of operations to suffer. In addition, our information technology systems may be vulnerable to damage or interruption from circumstances beyond our control, including fire, natural disasters, power outages, systems failures, security breaches, cyber-attacks and viruses. Any such damage or interruption could have a material adverse effect on our business.
Computer viruses, hackers and employee or vendor misconduct, and other external hazards, could expose our data systems to security breaches, cyber-attacks or other disruptions. In addition, we routinely transmit and receive personal, confidential and proprietary information by e-mail and other electronic means. While we attempt to develop secure transmission capabilities with third-party vendors and others with whom we do business, we may be unable to put in place secure capabilities with all of such vendors and third parties and, in addition, these third parties may not have appropriate controls in place to protect the confidentiality of the information.
Like other North American companies, our computer systems are regularly subject to and will continue to be the target of computer viruses, malware or other malicious codes, unauthorized access, cyber-attacks or other computer-related penetrations. While we have experienced threats to our data and systems, to date, we are not aware that we have experienced a material breach of cyber-security. However, over time, and particularly recently, the sophistication of these threats continues to increase. Our administrative and technical controls as well as other preventative actions we take to reduce the risk of cyber incidents and protect our information may be insufficient to detect or prevent unauthorized access, other physical and electronic break-ins, cyber-attacks or other security breaches to our computer systems or those of third parties with whom we do business. In addition, new technology that could result in greater operational efficiency may further expose our computer systems to the risk of cyber-attacks.
The increased risks identified above could expose us to data loss, disruption of service, monetary and reputational damages and significant increases in compliance costs and costs to improve the security and resiliency of our computer systems. The compromise of personal, confidential or proprietary information could also subject us to legal liability or regulatory action under evolving cyber-security, data protection and privacy laws and regulations enacted by the U.S. federal and state governments or other jurisdictions or by various regulatory organizations or exchanges. As a result, our ability to conduct our business and our results of operations might be materially and adversely affected.
Failure to optimize our supply chain or disruption of our supply chain could have an adverse effect on our business, financial condition and results of operations.
In coordination with our suppliers, our ability to make, move and sell products is critical to our success. Our inability to maintain sufficient internal production capacity or our inability to enter into co-packing agreements on terms that are beneficial to the Company could have an adverse effect on our business.
Additionally, damage or disruption to our collective manufacturing or distribution capabilities resulting from weather, any potential effects of climate change, natural disaster, disease, crop spoilage, fire or explosion, terrorism, pandemics, strikes, repairs or enhancements at our facilities, or other reasons, could impair our ability to manufacture or sell our products. Failure to take adequate steps to mitigate the likelihood or potential impact of such events, or to effectively manage such events if they occur, could adversely affect our business, financial condition and results of operations, and may require additional resources to restore our supply chain.
We have a significant amount of goodwill and intangible assets on our Consolidated Balance Sheets that are subject to impairment based upon future adverse changes in our business and the overall economic environment.
At December 25, 2016, the carrying value of goodwill and tradenames was $2,163.2 million and $2,529.6 million, respectively. We evaluate the carrying amount of goodwill and indefinite-lived intangible assets for impairment on an annual basis, in the third

22
quarter, or more frequently if an event occurs or circumstances change that would reduce the fair value below its carrying amount. The value of goodwill and intangible assets will be derived from our business operating plans and is susceptible to an adverse change in demand, input costs, general changes in the business, or changes in the overall economic environment and could require an impairment charge in the future.
If we are unable to retain our key management personnel, our future performance may be impaired and our financial condition could suffer as a result.
Our success depends to a significant degree upon the continued contributions of senior management, certain of whom would be difficult to replace. Departure by certain of our executive officers could have a material adverse effect on our business, financial condition, or results of operations. We do not maintain key-man life insurance on any of our executive officers. The services of such personnel may not continue to be available to us.
We may not be able to utilize all of our net operating loss carryovers.
If there is an unfavorable adjustment from a United States Internal Revenue Service (“IRS”) examination (whether as a result of a change in law, IRS policy or otherwise) that reduces any of our NOLs, cash taxes may increase and impact our ability to pay dividends or make interest payments on our indebtedness. As of December 25, 2016, we had gross NOLs for U.S. federal income tax purposes of approximately $425.5 million. In general, under Section 382 of the Internal Revenue Code of 1986, as amended (the “Code”), a corporation that undergoes an “ownership change” is subject to annual limitations on its ability to utilize its pre-change NOLs to offset future taxable income. Our existing NOLs are subject to annual limitations under Section 382 of the Code. For further detail on our NOLs, see Note 15 “Provision for Income Taxes” to our consolidated financial statements.
Maintaining, extending and expanding our reputation and brand image is essential to our business success.
Our success depends on our ability to maintain brand image for our existing products, extend our brands into new geographies and to new distribution platforms, including online, and expand our brand image with new product offerings.
We seek to maintain, extend and expand our brand image through marketing investments, including advertising and consumer promotions, and product innovation. Continuing global focus on health and wellness, including weight management, and increasing attention from the media, shareholders, consumers, activists and other stakeholders on the role of food marketing could adversely affect our brand image. It could also lead to stricter regulations and increased focus on food and snacking marketing practices. Increased legal or regulatory restrictions on our advertising, consumer promotions and marketing, or our response to those restrictions, could limit our efforts to maintain, extend and expand our brands. Moreover, adverse publicity about regulatory or legal action against us, product quality and safety, or environmental and human rights risks in our supply chain could damage our reputation and brand image, undermine our customers’ confidence and reduce demand for our products, even if the regulatory or legal action is unfounded or these matters are immaterial to our operations.
In addition, our success in maintaining, extending and expanding our brand image depends on our ability to adapt to a rapidly changing marketing and media environment, including our increasing reliance on social media and online dissemination of marketing and advertising campaigns. We are subject to a variety of legal and regulatory restrictions on how and to whom we market our products. These restrictions may limit our ability to maintain, extend and expand our brand image, particularly as social media and the communications environment continue to evolve. Negative posts or comments about us on social networking web sites (whether factual or not) or security breaches related to use of our social media and failure to respond effectively to these posts, comments or activities could seriously damage our reputation and brand image across the various regions in which we operate. In addition, we might fail to invest sufficiently in maintaining, extending and expanding our brand image. As a result, we might be required to recognize impairment charges on our intangible assets or goodwill. If we do not successfully maintain, extend and expand our reputation and brand image, then our brands, product sales, financial condition and results of operations could be materially and adversely affected.

23
Risks Related to Our Indebtedness
Our leverage could adversely affect our ability to raise additional capital to fund our operations, limit our ability to react to changes in the economy or our industry, expose us to rising interest rate risk and prevent us from meeting our obligations under our indebtedness.
This leverage could have important consequences, including:
• requiring a portion of cash flow from operations to be dedicated to the payment of principal and interest on our indebtedness, thereby reducing our ability to use our cash flow to fund our operations, capital expenditures, and future business opportunities or to pay dividends;
• exposing us to the risk of rising interest rates to the extent of borrowings under our senior secured credit facility that are not hedged;
• making it more difficult for us to make payments on our indebtedness;• increasing our vulnerability to general economic and industry conditions;• restricting us from making strategic acquisitions or causing us to make non-strategic divestitures;• subjecting us to restrictive covenants that may limit our flexibility in operating our business;• limiting our ability to obtain additional financing for working capital, capital expenditures, product development, debt
service requirements, acquisitions, and general corporate or other purposes; and• placing us at a competitive disadvantage compared to our competitors who are less highly leveraged.
In the future, we may be able to incur significant additional amounts of debt, which could increase the risks associated with our leverage.
Our debt agreements contain restrictions that will limit our flexibility in operating our business.
Our senior secured credit facilities and the indentures governing our existing notes contain various covenants that limit our restricted subsidiaries’ ability to, among other things:
• incur additional indebtedness and make guarantees;• create liens on assets;• engage in mergers or consolidations;• sell assets;• pay dividends and distributions or repurchase our capital stock;• make investments, loans and advances, including acquisitions; and• engage in certain transactions with affiliates.
The senior secured credit facilities require us to maintain a net first lien leverage ratio not to exceed 5.75 to 1.00. Our ability to comply with this ratio can be affected by events beyond our control, and we cannot assure you that we will continue to comply with this ratio. Our senior secured credit facilities also contain certain customary affirmative covenants and events of default.
A breach of any of these covenants or failure to maintain or satisfy this financial ratio could result in a default under our senior secured credit facilities. Upon the occurrence of an event of default under our senior secured credit facilities, the lenders could elect to declare all amounts outstanding under our senior secured credit facilities to be immediately due and payable and terminate all commitments to extend further credit. Any such acceleration would also result in an event of default under the indentures governing our notes. If we were unable to repay those amounts, the lenders under our senior secured credit facilities could proceed against the collateral granted to them to secure that indebtedness. If the lenders under our senior secured credit facilities accelerate the repayment of borrowings, we cannot assure you that we will have sufficient assets to repay our senior secured credit facilities as well as our unsecured indebtedness, including the notes.
Risks Related to Our Common Stock and the Securities Market
Our stock price may be subject to significant volatility, and you may not be able to resell shares of our common stock at or above the price you paid or at all, and you could lose all or part of your investment as a result.
The market price of our common stock could fluctuate significantly for many reasons, including reasons not specifically related to our performance, such as industry or market trends, reports by industry analysts and other third parties, investor perceptions, actions by credit rating agencies, negative announcements by our customers or competitors regarding their own performance or actions taken by our competitors, as well as general economic and industry conditions. Our common stock price is also affected by announcements we make about our business, market data that is available to subscribers, analyst reports related to our Company,

24
changes in financial estimates by analysts, whether or not we meet the financial estimates of analysts who follow our Company, rating agency announcements about our business, variations in our quarterly results of operations and those of our competitors, general economic and stock market conditions, future sales of our common stock, perceptions of the investment opportunity associated with our common stock relative to other investment alternatives, the public’s reaction to our public announcements and filings with the SEC, actual or anticipated growth rates relative to our competitors, and speculation by the investment community regarding our business, among other factors.
As a result of these factors, investors in our common stock may not be able to resell their shares at or above the price at which they purchase our common stock. In addition, the stock market in general has experienced extreme price and volume fluctuations that have often been unrelated or disproportionate to the operating performance of companies like us. These broad market and industry factors may materially reduce the market price of our common stock, regardless of our operating performance. In addition, in the past, some companies that have had volatile market prices for their securities have been subject to class action or derivative lawsuits. The filing of a lawsuit against us, regardless of the outcome, could have a negative effect on our business, financial condition and results of operations, as it could result in substantial legal costs and a diversion of management’s attention and resources.
ITEM 1B. UNRESOLVED STAFF COMMENTS
None.

25
ITEM 2. PROPERTIES
We own and operate the following 12 manufacturing and warehouse facilities:
Facility location Principal products Principal segment (1) Facility size Darien, Wisconsin Frozen vegetables and complete bagged meals Frozen 748,000 square feetFt. Madison, Iowa Canned meat Grocery 475,000 square feetImlay City, Michigan Pickles, peppers, relish Grocery 467,500 square feetFayetteville, Arkansas Frozen dinners and entrées Frozen 360,000 square feetWaseca, Minnesota Frozen vegetables Frozen 348,000 square feetCentralia, Illinois Cake and Brownie Mixes / Frosting Grocery 342,000 square feetFennville, Michigan Fruit toppings and fillings Grocery 328,000 square feetJackson, Tennessee Frozen breakfast, frozen pizza, frozen prepared seafood Frozen 324,300 square feetSt. Elmo, Illinois Syrup, salad dressing, barbecue sauce Grocery 292,000 square feetMattoon, Illinois Frozen and refrigerated bagels, frozen breakfast Frozen 244,000 square feetBerlin, Pennsylvania Snack foods - Snyder of Berlin Specialty 180,000 square feetHagerstown, Maryland (2) Plant based proteins Boulder 142,000 square feet
(1)We manufacture private label and foodservice products which are included in the Specialty segment, in many of our plants.(2)The Hagerstown location is expected to begin production in first quarter 2017.
All of our properties are mortgaged to secure our obligations under our Senior Secured Credit Facility. Our Senior Secured Credit Facility is described in more detail in Note 10 to the Consolidated Financial Statements.
We also lease manufacturing plants, warehouses and distribution centers in Algona, Washington (Snack foods - Tim's Cascade);Richmond, British Columbia (gardein); Laval, Quebec, Denver, Colorado, Aurora, Colorado and Boulder, Colorado (Boulder). In addition, we lease warehouses in Darien, Wisconsin, Waseca, Minnesota and Effingham, Illinois.
We have entered into co-packing (third-party manufacturing) agreements with several manufacturers for certain of our finished products. We believe that our manufacturing facilities, together with our co-packing agreements, provide us with sufficient capacity to accommodate our planned internal growth.
We also lease office space under operating leases (expiring) in Parsippany, New Jersey (April 2023); Cherry Hill, New Jersey (October 2021); Fayetteville, Arkansas (Month to Month); Mississauga, Ontario (June 2026); and Richmond, British Columbia (July 2022) Boulder, Colorado (September 2025) and Paramus, New Jersey (June 2020).
We own property in the United Kingdom for office, manufacturing and storage space acquired as part of the Boulder Brands acquisition. As more fully described in Note 7 to the Consolidated Financial Statements, in October 2016, we voluntarily ceased production at the facility and are in the process of winding down operations.
ITEM 3. LEGAL PROCEEDINGS
From time to time, we and our operations are parties to, or targets of, lawsuits, claims, investigations, and proceedings, which are being handled and defended in the ordinary course of business. Although the outcome of such items cannot be determined with certainty, our general counsel and management are of the opinion that the final outcome of these matters individually or in the aggregate will not have a material effect on our financial condition, results of operations or cash flows.
ITEM 4. MINE SAFETY DISCLOSURES Not Applicable.

26
PART II
ITEM 5. MARKET FOR REGISTRANT'S COMMON EQUITY, RELATED STOCKHOLDER MATTERS AND ISSUER PURCHASES OF EQUITY SECURITIES
The Company's common stock is listed and traded on the New York Stock Exchange (NYSE) under the symbol "PF". The number of holders of record, including individual owners, of the Company's common stock was 32 as of February 21, 2017. This is not the actual number of beneficial owners of the Company's common stock, as shares are held in "street name" by brokers and others on behalf of individual owners. The closing price of the common stock on the NYSE on February 21, 2017 was $55.24. The following graph compares the cumulative total return on our common stock with the cumulative total return of the Standard & Poor’s ("S&P") 500 Index and the S&P 500 Packaged Foods and Meats index, which represents our peer group. This graph covers the period from March 28, 2013 (the first day our common stock began trading on the NYSE) through December 23, 2016 (the last trading day of our fiscal year). The graph shows total shareholder return assuming $100 was invested on March 28, 2013 and dividends were reinvested.
Date Pinnacle Foods, Inc S&P 500 Index
S&P 500Packaged Foods &
Meats IndexMarch 28, 2013 * $ 100.00 $ 100.00 $ 100.00
December 27, 2013 125.30 119.23 107.95December 26, 2014 168.38 138.01 124.04December 25, 2015 207.30 139.07 143.60December 23, 2016 263.85 156.14 156.08
* Using the closing market price at the end of the first trading day of $22.21 in accordance with SEC guidance. The IPO price was $20.00 per share.

27
Information regarding our common stock high and low sales prices as reported on NYSE and dividends declared during the last two fiscal years are included in Note 16 to the Consolidated Financial Statements.
This performance graph and other information furnished under this Item of this Annual Report on Form 10-K shall not be deemed to be “soliciting material” or to be “filed” with the SEC or subject to Regulation 14A or 14C, or to the liabilities of Section 18 of the Securities Exchange Act of 1934, as amended.
Issuer Purchase of Equity Securities
The Company does not have a share repurchase program currently in place but may seek authorization from our Board of Directors to implement one in the future.
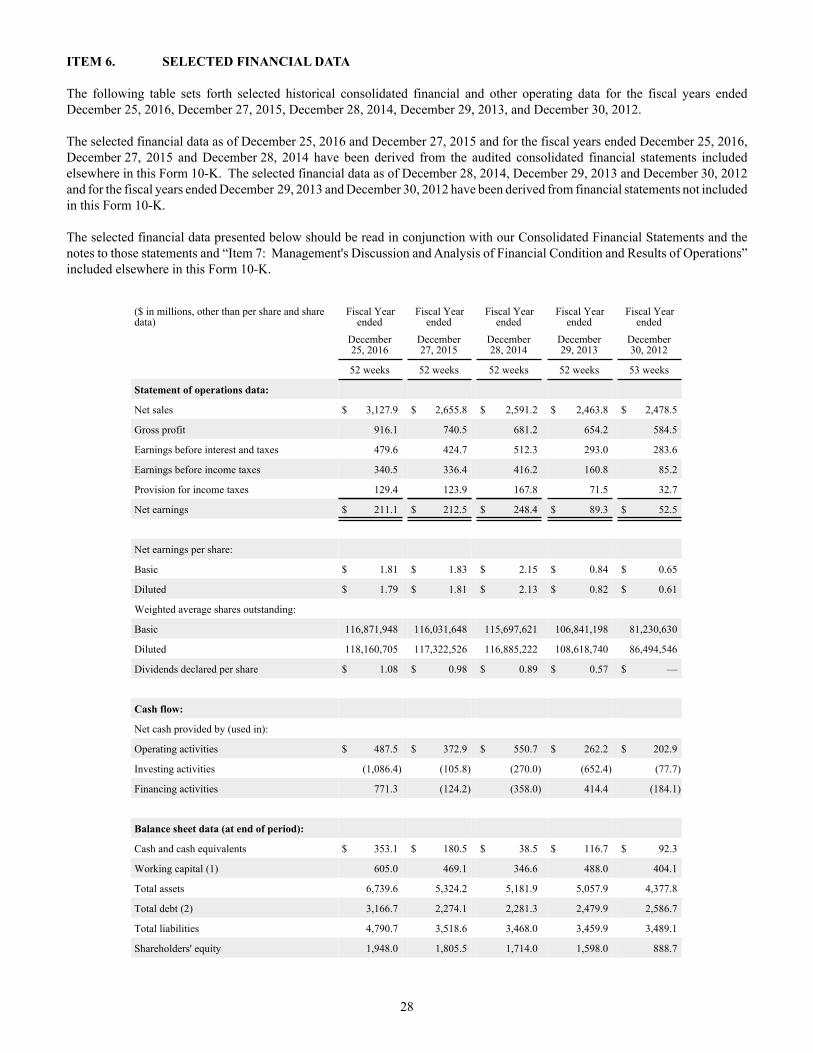
28
ITEM 6. SELECTED FINANCIAL DATA
The following table sets forth selected historical consolidated financial and other operating data for the fiscal years ended December 25, 2016, December 27, 2015, December 28, 2014, December 29, 2013, and December 30, 2012.
The selected financial data as of December 25, 2016 and December 27, 2015 and for the fiscal years ended December 25, 2016, December 27, 2015 and December 28, 2014 have been derived from the audited consolidated financial statements included elsewhere in this Form 10-K. The selected financial data as of December 28, 2014, December 29, 2013 and December 30, 2012 and for the fiscal years ended December 29, 2013 and December 30, 2012 have been derived from financial statements not included in this Form 10-K.
The selected financial data presented below should be read in conjunction with our Consolidated Financial Statements and the notes to those statements and “Item 7: Management's Discussion and Analysis of Financial Condition and Results of Operations” included elsewhere in this Form 10-K.
($ in millions, other than per share and sharedata)
Fiscal Yearended
Fiscal Yearended
Fiscal Yearended
Fiscal Yearended
Fiscal Yearended
December25, 2016
December27, 2015
December28, 2014
December29, 2013
December30, 2012
52 weeks 52 weeks 52 weeks 52 weeks 53 weeks
Statement of operations data:
Net sales $ 3,127.9 $ 2,655.8 $ 2,591.2 $ 2,463.8 $ 2,478.5
Gross profit 916.1 740.5 681.2 654.2 584.5
Earnings before interest and taxes 479.6 424.7 512.3 293.0 283.6
Earnings before income taxes 340.5 336.4 416.2 160.8 85.2
Provision for income taxes 129.4 123.9 167.8 71.5 32.7
Net earnings $ 211.1 $ 212.5 $ 248.4 $ 89.3 $ 52.5
Net earnings per share:
Basic $ 1.81 $ 1.83 $ 2.15 $ 0.84 $ 0.65
Diluted $ 1.79 $ 1.81 $ 2.13 $ 0.82 $ 0.61
Weighted average shares outstanding:
Basic 116,871,948 116,031,648 115,697,621 106,841,198 81,230,630
Diluted 118,160,705 117,322,526 116,885,222 108,618,740 86,494,546
Dividends declared per share $ 1.08 $ 0.98 $ 0.89 $ 0.57 $ —
Cash flow:
Net cash provided by (used in):
Operating activities $ 487.5 $ 372.9 $ 550.7 $ 262.2 $ 202.9
Investing activities (1,086.4) (105.8) (270.0) (652.4) (77.7)
Financing activities 771.3 (124.2) (358.0) 414.4 (184.1)
Balance sheet data (at end of period):
Cash and cash equivalents $ 353.1 $ 180.5 $ 38.5 $ 116.7 $ 92.3
Working capital (1) 605.0 469.1 346.6 488.0 404.1
Total assets 6,739.6 5,324.2 5,181.9 5,057.9 4,377.8
Total debt (2) 3,166.7 2,274.1 2,281.3 2,479.9 2,586.7
Total liabilities 4,790.7 3,518.6 3,468.0 3,459.9 3,489.1
Shareholders' equity 1,948.0 1,805.5 1,714.0 1,598.0 888.7

29
($ in millions, other than per share and sharedata)
Fiscal Yearended
Fiscal Yearended
Fiscal Yearended
Fiscal Yearended
Fiscal Yearended
December25, 2016
December27, 2015
December28, 2014
December29, 2013
December30, 2012
52 weeks 52 weeks 52 weeks 52 weeks 53 weeks
Other financial data:
Adjusted gross profit (3) $ 921.1 $ 749.8 $ 711.3 $ 664.4 $ 622.8
Adjusted EBITDA (4) 644.4 531.6 504.0 452.4 425.2
Capital expenditures 101.1 108.5 103.0 84.1 78.3
(1) Working capital excludes notes payable, revolving debt facility and current portion of long term debt.(2) Total debt includes long term debt, notes payable, revolving debt facility and current portion of long term debt.(3) Adjusted gross profit is defined and explained in more detail in the section titled "Adjusted Gross Profit" in "Item 7 -
Management’s Discussion and Analysis of Financial Condition and Results of Operations." (4) Adjusted EBITDA is defined and explained in more detail in the section titled "Covenant Compliance" in "Item 7 -
Management’s Discussion and Analysis of Financial Condition and Results of Operations."

30
ITEM 7: MANAGEMENT’S DISCUSSION AND ANALYSIS OF FINANCIAL CONDITION AND RESULTS OF OPERATIONS
(dollars in millions, except where noted)
You should read the following discussion of our results of operations and financial condition with the “Selected Financial Data” and the audited Consolidated Financial Statements appearing elsewhere in this Form 10-K. This discussion contains
forward-looking statements and involves numerous risks and uncertainties, including, but not limited to, those described in the “Item 1A - Risk Factors” section of this Form 10-K. Actual results may differ materially from those contained in any forward-
looking statements. See "Disclosure Regarding Forward Looking Statements".
Overview
We are a leading manufacturer, marketer and distributor of high quality, branded food products in North America. In the fourth quarter of fiscal 2016 during which the integration of the Boulder Brands acquisition was substantially complete, the Company reorganized its reporting structure, resulting in a change to its reportable segments. The new segments, which mirror the manner in which the businesses will be managed, are Frozen, Grocery, Boulder and Specialty.
The Boulder Brands acquisition added the Udi's, Glutino, Smart Balance, Earth Balance and EVOL brands to the Company's portfolio, as well as complementary foodservice, private label and Canadian businesses. The new segment structure aligns each of these businesses with related Pinnacle businesses into four new reportable segments, the composition of which is provided below.
The Frozen segment is comprised of the retail businesses of the Company’s legacy frozen brands, including vegetables (Birds Eye), complete bagged meals (Birds Eye Voila! and Birds Eye Signature Skillets), full-calorie single-serve frozen dinners and entrées (Hungry-Man), prepared seafood (Van de Kamp's and Mrs. Paul's), pancakes / waffles / french toast (Aunt Jemima), frozen and refrigerated bagels (Lender's) and pizza for one (Celeste). The Frozen segment also includes all of the Company’s business in Canada, including those of the Garden Protein International and Boulder Brands acquisitions.
The Grocery segment is comprised of the retail businesses of the Company’s grocery brands, including cake/brownie mixes and frostings (Duncan Hines), shelf-stable pickles (Vlasic), salad dressings (Wish-Bone, Western and Bernstein’s), table syrups (Log Cabin and Mrs. Butterworth's), refrigerated and shelf-stable spreads (Smart Balance), canned meat (Armour, Nalley and Brooks), pie and pastry fillings (Duncan Hines Comstock and Wilderness) and barbecue sauces (Open Pit).
The Boulder segment is comprised of the retail businesses of the Company’s health and wellness lifestyle brands, including gluten-free products (Udi's and Glutino), natural frozen meal offerings (EVOL), plant-based refrigerated and shelf-stable spreads (Earth Balance) and plant-based protein frozen products (gardein).
The Specialty segment includes the Company’s snack products (Tim's Cascade and Snyder of Berlin) and all of its U.S. foodservice and private label businesses, including those of the Garden Protein International and Boulder Brands acquisitions.
Segment performance is evaluated by the Company’s Chief Operating Decision Maker and is based on earnings before interest and taxes. Transfers between segments and geographic areas are recorded at cost plus markup or at market. Identifiable assets are those assets, including goodwill, which are identified with the operations in each segment or geographic region. Corporate assets consist of prepaid and deferred tax assets. Unallocated corporate expenses consist of corporate overhead such as executive management and finance and legal functions. Unallocated corporate income in 2014 includes the termination fee received, net of costs, associated with the Hillshire merger agreement (see Note 7 to the Consolidated Financial Statements for further details).
Business Drivers and Measures
In operating our business and monitoring its performance, we pay attention to trends in the food manufacturing industry and a number of performance measures and operational factors. The industry experiences volatility in overall commodity prices from time to time, which has historically been managed by increasing retail prices. However, over the past several years, significant macroeconomic weakness and ongoing pressures on the consumer have resulted in shifting consumer buying patterns for grocery products. As a result, industry volumes have come under pressure, hampering the ability of the industry to pass along higher input costs.

31
Industry Trends
Growth in our industry is driven primarily by population growth, changes in product selling prices, changes in consumption between out-of-home and in-home eating and lifestyle trends. Lifestyle categories driven by health and wellness choices are the fastest growing trend in the industry, with plant based/vegetarian and gluten-free products being two of the largest accelerators. In the current environment, consumers are looking for both value and healthier alternatives, which have caused an increase in the percentage of products sold on promotion and a shift from traditional retail grocery to natural and organic, mass merchandisers, club stores and dollar store channels. We believe we are well positioned in grocery and non-traditional channels, maintaining strong customer relationships across key retailers in each segment. In addition, the Boulder Brands and Garden Protein acquisitions have significantly increased our presence and footprint in the natural and organic lifestyle segments.
In order to maintain and grow our business, we must successfully react to, and offer products that respond to, evolving consumer trends, such as changing lifestyle trends, the focus on convenience and the growth of smaller households. Incremental growth in the industry is principally driven by product and packaging innovation.
Revenue Factors
Our net sales are driven principally by the following factors:
• Gross sales, which change as a function of changes in volume and list price; and• the costs that we deduct from gross sales to arrive at net sales, which consist of:
• Cash discounts, returns and other allowances.• Trade marketing expenses, which include the cost of temporary price reductions (“on sale” prices), promotional
displays and advertising space in store circulars.• New product distribution (slotting) expenses, which are the costs of having certain retailers stock a new product,
including amounts retailers charge for updating their warehousing systems, allocating shelf space and in-store systems set-up, among other things.
• Consumer coupon redemption expenses, which are costs from the redemption of coupons we circulate as part of our marketing efforts.
Cost Factors
• Costs recorded in Cost of products sold in the consolidated statement of operations include:• Raw materials, such as vegetables and fruits, proteins, grains and oils, sugars, seafood and other agricultural products,
among others, are available from numerous independent suppliers but are subject to price fluctuations due to a number of factors, including changes in crop size, federal and state agricultural programs, export demand, weather conditions and insects, among others.
• Packaging costs. Our broad array of products entail significant costs for packaging and is subject to fluctuations in the price of plastics, paper and corrugated fiberboard, aluminum, glass jars, and steel.
• Conversion costs, which include all costs necessary to convert raw materials into finished product. Key components of this cost include direct labor, and plant overhead such as salaries, benefits, utilities and depreciation.
• Freight and distribution. We use a combination of common carriers and inter-modal rail to transport our products from our manufacturing facilities to distribution centers and to deliver products to our customers from both those centers and directly from our manufacturing plants. Our freight and distribution costs are influenced by fuel costs as well as capacity within the industry.
• Costs recorded in marketing and selling expenses in the consolidated statement of operations include:• Advertising and other marketing expenses. These expenses represent advertising and other consumer and trade-
oriented marketing programs.• Brokerage commissions and other overhead expenses.
• Costs recorded in administrative and research and development expenses in the consolidated statement of operations include:• Administrative expenses. These expenses consist of personnel and facility charges and also include third party
professional and other services. Our lean, nimble structure and efficient internal processes have enabled us to consistently hold our overhead costs (i.e., selling, general and administrative expenses, excluding one-time items affecting comparability) to approximately 9% of net sales on an annual basis.
• Research and Development. These expenses consist of personnel and facility charges and include expenditures on new products and the improvement and maintenance of existing products and processes.

32
Working Capital
Our working capital is primarily driven by accounts receivable and inventories, which fluctuate throughout the year due to seasonality in both sales and production. See “Seasonality” below. We continually focus on reducing our working capital requirements while simultaneously maintaining our customer service levels and fulfilling our production requirements. We have historically relied on internally generated cash flows and temporary borrowings under our revolving credit facility to satisfy our working capital requirements.
Other Factors
Other factors that have influenced our results of operations and may do so in the future include:
• Interest Expense. As a result of our previous acquisitions and the recent Boulder Brands acquisition, we have significant indebtedness. However, our February 3, 2017 debt refinancing and principle pay down has significantly reduced our expected future interest expense. See Note 18 to the Consolidated Financial Statements for further details. Although we expect to continue to reduce our leverage over time, we expect interest expense to continue to be a significant component of our expenses.
• Cash Taxes. We had significant tax-deductible intangible asset amortization and federal and state Net Operating Loss carryforwards, ("NOLs"), which resulted in minimal federal and state cash taxes through 2015, with modest savings in 2016. Continued amortization and utilization of our remaining NOLs will generate modest annual cash tax savings for 2017 and thereafter.
• Acquisitions and Consolidations. We believe we have the expertise to identify and integrate value-enhancing acquisitions to grow our business and we have done so successfully in the past. On November 14, 2014, we acquired Garden Protein for $156.5 million, the rapidly growing manufacturer of the plant-based protein brand gardein. On August 20, 2015 we acquired a manufacturing facility in Hagerstown, Maryland for approximately $8.0 million. The site is being used to expand production capabilities for the gardein brand and provide an east coast footprint to supplement the existing Richmond, British Columbia manufacturing location. We also invested $28.9 million for the gardein capacity expansion and incurred $5.6 million of additional charges to integrate the location in 2016. As previously mentioned, on January 15, 2016, the Company acquired Boulder Brands for a cost of $1.0 billion (including the repayment of debt and including $16.1 millionof cash acquired). Total acquisition and financing costs of $32.9 million have been incurred to date, of which $2.1 million was incurred in the fourth quarter of 2015. Included in this total is $24.4 million of debt acquisition costs, including original issue discount. During 2016, we incurred one-time costs associated with the integration of Boulder Brands of approximately $32.3 million.
• As more fully described in Note 7 to the Consolidated Financial Statements, in October 2016, we voluntarily ceased production at Boulder Brands private label gluten free bakery operation based in the United Kingdom. In conjunction with the wind down, we incurred charges of $4.3 million in the fourth quarter of 2016 which were recorded in Other expense (income), net. For the fiscal year ended December 25, 2016, net sales were $8.7 million and the business incurred a loss before interest, taxes, depreciation and amortization related to normal business operations of $3.9 million.
Seasonality
Our sales and cash flows are affected by seasonal cyclicality. Sales of frozen foods, including frozen vegetables and frozen complete bagged meals, tend to be marginally higher during the winter months. Seafood sales peak during Lent, in advance of the Easter holiday. Sales of pickles, relishes, barbecue sauces, potato chips and salad dressings tend to be higher in the spring and summer months, and demand for Duncan Hines products, Birds Eye vegetables and our pie and pastry fruit fillings tend to be higher around the Easter, Thanksgiving, and Christmas holidays. Since many of the raw materials we process under the Birds Eye, Vlasic, Duncan Hines Comstock and Wilderness brands are agricultural crops, production of these products is predominantly seasonal, occurring during and immediately following the purchase of such crops. We also increase our Duncan Hines inventories in advance of the peak fall selling season. As a result, our inventory levels tend to be higher during August, September, and October, and thus we require more working capital during these months.

33
Inflation
To the extent possible, we strive to offset the effects of inflation with cost reduction and productivity programs. However, we spend approximately $2.2 billion annually on cost of products sold, therefore each 1% change in our weighted average cost of inputs would increase our cost of products sold by approximately $22 million. If we experience significant inflation, price increases may be necessary in order to preserve our margins and returns. However, over the past several years, significant macroeconomic weakness and ongoing pressures on the consumer have resulted in shifting consumer buying patterns for grocery products. As a result, industry volumes have come under pressure, hampering our ability to pass along higher input costs with limited exceptions in select categories. Severe increases in inflation could have an adverse impact on our business, financial condition and results of operations.
Items Affecting Year Over Year Results
During fiscal 2016, our earnings before interest and taxes were impacted by certain items. These items included:
• As more fully described in Note 9 to the Consolidated Financial Statements, we recorded $11.2 million of tradename impairment charges related to the Celeste ($7.3 million), Aunt Jemima ($3.0 million) and Snyder of Berlin ($0.9 million) tradenames. These charges were the result of the Company's reassessment of the long-term sales projections for the brands during our annual planning cycle which occurs during the third quarter each year.
• As more fully described in Note 7 to the Consolidated Financial Statements, in October 2016, we voluntarily ceased production at Boulder Brands private label gluten free bakery operation based in the United Kingdom. In conjunction with the wind down, we incurred charges of $4.3 million in the fourth quarter of 2016 which were recorded in Other expense (income), net. For the fiscal year ended December 25, 2016, net sales were $8.7 million and the business incurred a loss before interest, taxes, depreciation and amortization related to normal business operations of $3.9 million.
• We recorded $32.9 million of restructuring charges and integration costs related to the Boulder Brands and Garden Protein acquisitions, of which $30.0 million was recorded in Administrative expenses, $1.5 million in Costs of products sold, $1.0 million in Marketing and selling expenses and $0.2 million in Research and development expenses.
• We recorded $10.4 million of purchase accounting adjustments which represents expense related to the write-up to fair value of inventories acquired as a result of the Boulder Brands acquisition, which was recorded in Cost of products sold.
• As more fully described in Note 3 to the Consolidated Financial Statements, we recorded acquisition costs of $6.8 million related to the Boulder Brands acquisition, which were recorded in Other expense (income), net.
During fiscal 2015, our earnings before interest and taxes were impacted by certain items. These items included:
• We recorded $8.6 million of manufacturing integration costs related to the Wish-Bone and Garden Protein acquisitions which were recorded in Cost of products sold.
• The Boulder Brands acquisition was completed on January 15, 2016. Acquisition costs, primarily legal, accounting and other professional fees of $1.7 million were incurred in the fourth quarter of 2015.
• As more fully described in Note 7 to the Consolidated Financial Statements, we recorded $4.7 million of foreign exchange losses, which represents foreign exchange losses from intra-entity loans resulting from the Garden Protein acquisition.
During fiscal 2014, our earnings before interest and taxes were impacted by certain items. These items included:
• As more fully described in Note 7 to the Consolidated Financial Statements, the Hillshire merger agreement was terminated on June 30, 2014. As a result, Pinnacle received a $163.0 million cash termination fee in the third quarter of 2014. One-time fees and expenses associated with the merger agreement, comprising external advisors' fees and employee retention incentives, including equity awards, totaled $19.2 million, of which $17.4 million was incurred in fiscal 2014, with the remainder in the first quarter of fiscal 2015. The impact on earnings for the fiscal year ended December 28, 2014, was a pre-tax gain of $145.6 million, $89.1 million net of tax, or $0.76 per diluted share.
• We recorded $36.0 million of equity based compensation expense, an increase of $28.1 million from fiscal year 2013. On November 21, 2014, Blackstone sold approximately 19.7 million shares of the Company's common stock. Blackstone's ownership level after the sale resulted in a liquidity event (as defined below) and in conjunction with Blackstone obtaining an annual internal rate of return in excess of 12% on their initial investment resulted in the immediate vesting of approximately 1.1 million non-vested shares and 0.2 million options and the recognition of approximately $23.7 million of equity based compensation expense (the "Liquidity event"). Additionally, $3.5 million

34
of equity based compensation was recognized related to employee incentives and retention awards granted as a result of the termination of the Hillshire merger agreement. Both of these are explained in greater detail in Note 5 to the Consolidated Financial Statements and are primarily recorded in Administrative expense.
• We recorded $11.5 million of manufacturing integration costs related to the acquisitions of Wish-Bone and the Duncan Hines manufacturing business located in Centralia, Illinois which were recorded in Cost of products sold.

35
Results of Operations:
Consolidated Statements of Operations
The following tables set forth our statement of operations data expressed in dollars and as a percentage of net sales.
Fiscal yearDecember 25,
2016December 27,
2015December 28,
201452 Weeks 52 Weeks 52 Weeks
Net sales $ 3,127.9 100.0% $ 2,655.8 100.0% $ 2,591.2 100.0 %Cost of products sold 2,211.9 70.7% 1,915.3 72.1% 1,910.0 73.7 %
Gross profit 916.1 29.3% 740.5 27.9% 681.2 26.3 %
Marketing and sellingexpenses 218.3 7.0% 176.7 6.7% 177.4 6.8 %Administrativeexpenses 163.1 5.2% 107.0 4.0% 117.3 4.5 %Research anddevelopment expenses 18.1 0.6% 13.0 0.5% 11.3 0.4 %Tradename impairmentcharges 11.2 0.4% — —% — — %Termination feereceived, net of costs,associated with theHillshire mergeragreement — —% — —% (153.0) (5.9)%Other expense(income), net 25.8 0.8% 19.1 0.7% 16.0 0.6 %
436.4 14.0% 315.8 11.9% 168.9 6.5 %Earnings before interest andtaxes $ 479.6 15.3% $ 424.7 16.0% $ 512.3 19.8 %
Fiscal yearDecember 25,
2016December 27,
2015December 28,
201452 Weeks 52 Weeks 52 Weeks
Net sales (a)Frozen $ 1,304.8 $ 1,236.0 $ 1,190.4Grocery 1,089.3 1,024.3 1,050.1Boulder 364.7 41.5 4.3Specialty 369.2 354.1 346.4
Total $ 3,127.9 $ 2,655.9 $ 2,591.2
Earnings (loss) before interest and taxes (a)
Frozen $ 240.9 $ 218.5 $ 193.2Grocery 229.2 203.1 177.4Boulder 9.1 (5.5) (4.2)Specialty 32.3 34.4 31.0Unallocated corporate income (expense) (31.8) (25.9) 114.9
Total $ 479.6 $ 424.6 $ 512.3
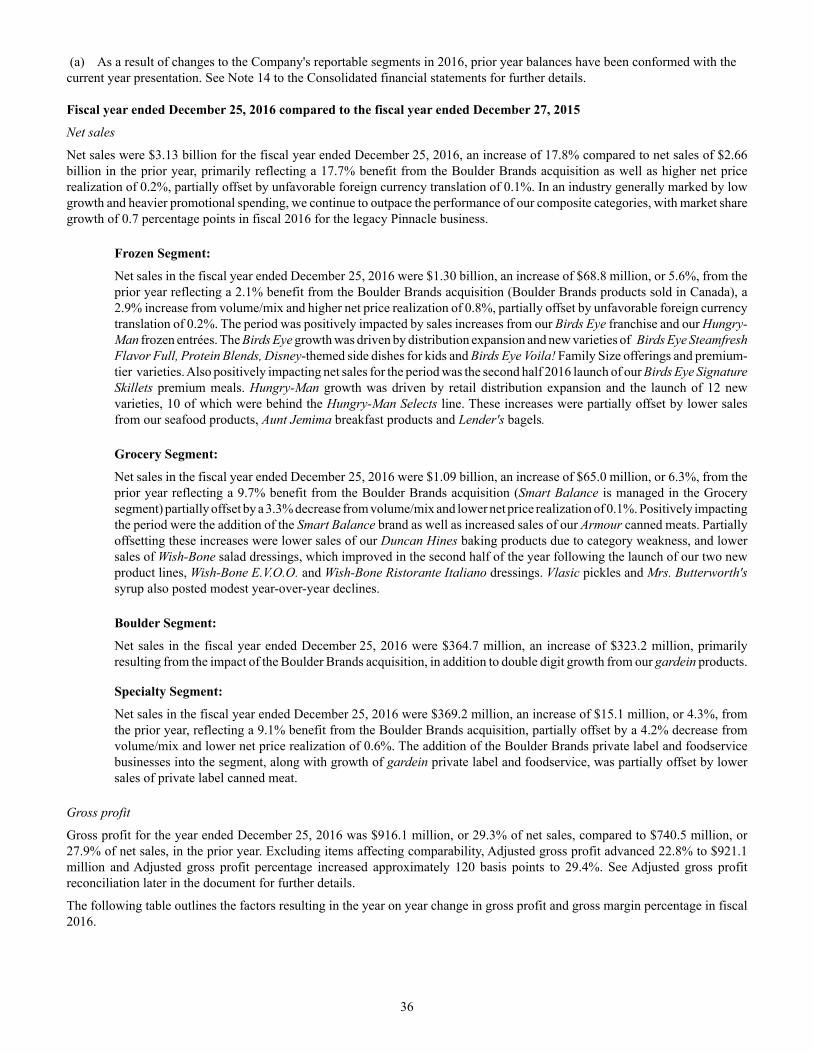
36
(a) As a result of changes to the Company's reportable segments in 2016, prior year balances have been conformed with the current year presentation. See Note 14 to the Consolidated financial statements for further details.
Fiscal year ended December 25, 2016 compared to the fiscal year ended December 27, 2015
Net sales
Net sales were $3.13 billion for the fiscal year ended December 25, 2016, an increase of 17.8% compared to net sales of $2.66 billion in the prior year, primarily reflecting a 17.7% benefit from the Boulder Brands acquisition as well as higher net price realization of 0.2%, partially offset by unfavorable foreign currency translation of 0.1%. In an industry generally marked by low growth and heavier promotional spending, we continue to outpace the performance of our composite categories, with market share growth of 0.7 percentage points in fiscal 2016 for the legacy Pinnacle business.
Frozen Segment:
Net sales in the fiscal year ended December 25, 2016 were $1.30 billion, an increase of $68.8 million, or 5.6%, from the prior year reflecting a 2.1% benefit from the Boulder Brands acquisition (Boulder Brands products sold in Canada), a 2.9% increase from volume/mix and higher net price realization of 0.8%, partially offset by unfavorable foreign currency translation of 0.2%. The period was positively impacted by sales increases from our Birds Eye franchise and our Hungry-Man frozen entrées. The Birds Eye growth was driven by distribution expansion and new varieties of Birds Eye Steamfresh Flavor Full, Protein Blends, Disney-themed side dishes for kids and Birds Eye Voila! Family Size offerings and premium-tier varieties. Also positively impacting net sales for the period was the second half 2016 launch of our Birds Eye Signature Skillets premium meals. Hungry-Man growth was driven by retail distribution expansion and the launch of 12 new varieties, 10 of which were behind the Hungry-Man Selects line. These increases were partially offset by lower sales from our seafood products, Aunt Jemima breakfast products and Lender's bagels.
Grocery Segment:
Net sales in the fiscal year ended December 25, 2016 were $1.09 billion, an increase of $65.0 million, or 6.3%, from the prior year reflecting a 9.7% benefit from the Boulder Brands acquisition (Smart Balance is managed in the Grocery segment) partially offset by a 3.3% decrease from volume/mix and lower net price realization of 0.1%. Positively impacting the period were the addition of the Smart Balance brand as well as increased sales of our Armour canned meats. Partially offsetting these increases were lower sales of our Duncan Hines baking products due to category weakness, and lower sales of Wish-Bone salad dressings, which improved in the second half of the year following the launch of our two new product lines, Wish-Bone E.V.O.O. and Wish-Bone Ristorante Italiano dressings. Vlasic pickles and Mrs. Butterworth'ssyrup also posted modest year-over-year declines.
Boulder Segment:
Net sales in the fiscal year ended December 25, 2016 were $364.7 million, an increase of $323.2 million, primarily resulting from the impact of the Boulder Brands acquisition, in addition to double digit growth from our gardein products.
Specialty Segment:
Net sales in the fiscal year ended December 25, 2016 were $369.2 million, an increase of $15.1 million, or 4.3%, from the prior year, reflecting a 9.1% benefit from the Boulder Brands acquisition, partially offset by a 4.2% decrease from volume/mix and lower net price realization of 0.6%. The addition of the Boulder Brands private label and foodservice businesses into the segment, along with growth of gardein private label and foodservice, was partially offset by lower sales of private label canned meat.
Gross profit
Gross profit for the year ended December 25, 2016 was $916.1 million, or 29.3% of net sales, compared to $740.5 million, or 27.9% of net sales, in the prior year. Excluding items affecting comparability, Adjusted gross profit advanced 22.8% to $921.1 million and Adjusted gross profit percentage increased approximately 120 basis points to 29.4%. See Adjusted gross profit reconciliation later in the document for further details.
The following table outlines the factors resulting in the year on year change in gross profit and gross margin percentage in fiscal 2016.

37
$ % net salesProductivity $ 70.0 2.2%Favorable product mix 26.6 0.5Higher mark-to-market gains on financial instruments 10.5 0.3Higher net price realization, net of slotting 7.5 0.2Inflation (36.0) (1.2)Effects of adjustments related to the application of purchaseaccounting (a) (10.4) (0.3)Higher depreciation expense (b) (3.4) (0.1)Other (c) (9.5) (0.2)
Subtotal 55.3 1.4%Higher sales volume, including Boulder Brands 120.3
$ 175.6
(a) Represents expense related to the write-up to fair market value of inventories acquired as a result of the Boulder Brands acquisition.(b) The increase primarily relates to insourcing of the manufacturing of Wish-Bone into our St. Elmo, Illinois location.(c) Consists primarily of investments in new Birds-Eye stand-up packaging, higher product obsolescence, and the unfavorable impact of foreign currency.
Marketing and selling expenses
Marketing and selling expenses were $218.3 million, or 7.0% of net sales, for the fiscal year ended December 25, 2016, compared to $176.7 million, or 6.7% of net sales, for fiscal 2015. The increase was driven by the addition of the Boulder Brands acquisition.
Administrative expenses
Administrative expenses were $163.1 million, or 5.2% of net sales, for the fiscal year ended December 25, 2016, compared to $107.0 million, or 4.0% of net sales, for the prior year. The increase primarily reflected the impact of the Boulder Brands acquisition, which included $19.1 million of restructuring costs in 2016, as well as higher management incentive compensation in 2016.
Research and development expenses
Research and development expenses were $18.1 million, or 0.6% of net sales, for the fiscal year ended December 25, 2016, compared to $13.0 million, or 0.5% of net sales, for the comparable prior-year period. This increase primarily reflected the impacts of the Boulder Brands acquisition and innovation related expenses on the base Pinnacle business.
Other Income and Expense:
Fiscal year ended
December25, 2016
December27, 2015
Other expense (income), net consists of:Amortization of intangibles/other assets $ 17.0 $ 13.6Boulder Brands acquisition costs (Note 3) 6.8 1.7Foreign exchange (gains) losses (0.5) 4.7Charges resulting from the wind down of Boulder Brands UnitedKingdom operations 4.3 —
Royalty income and other (1.7) (0.9)Total other expense (income), net $ 25.8 $ 19.1
Foreign exchange (gains) losses. Represents foreign exchange (gains) losses from intra-entity loans resulting from the Garden Protein acquisition that are anticipated to be settled in the foreseeable future.
38
Charges resulting from the wind down of Boulder Brands United Kingdom operations. In October 2016, the Company voluntarily ceased production at Boulder Brands private label gluten free bakery operation which is based in the United Kingdom. As such, the Company adopted a plan in the fourth quarter to wind down operations and dispose of all associated assets such as land, buildings, machinery and equipment and inventory. The Company expects the final sale and disposal of the assets to be substantially completed sometime in the first half of 2017. In connection with the plan of disposal, the Company determined that the carrying values of some of the underlying assets exceeded their fair values. Consequently, the above charges are primarily comprised of impairment losses, which represents the excess of the carrying values of the assets over their fair values. The charges also include employee termination benefits and professional fees resulting from the closing and disposition.
Tradename impairment charges
In the third quarter of 2016, the Company recorded tradename impairments of $7.3 million on Celeste, $3.0 million on Aunt Jemima and $0.9 million on Snyder of Berlin. See Note 9 for further details.
Earnings before interest and taxes
Earnings before interest and taxes for the fiscal year ended December 25, 2016 were $479.6 million, an increase of $54.9 million, or 12.9% as compared to the prior year, primarily resulting from increased gross profit, as discussed above, partially offset by higher selling, general and administrative expenses primarily associated with the Boulder Brands acquisition and the unfavorable impact of items affecting comparability. Excluding items affecting comparability, Adjusted earnings before interest and taxes increased $95.5 million or 21.6% to $538.6 million.
Frozen Segment:
Earnings before interest and taxes for the fiscal year ended December 25, 2016 increased $22.4 million, or 10.2%, to $240.9 million as compared to the prior year reflecting the benefits of the net sales growth, strong productivity and higher mark-to-market unrealized gains on financial instruments, partially offset by input cost inflation, investment behind the conversion to new Birds Eye Steamfresh stand-up packaging and Tradename impairment charges. Excluding items affecting comparability, Earnings before interest and taxes increased $26.9 million, or 12.3%, to $246.4 million.
Grocery Segment:
Earnings before interest and taxes increased $26.0 million, or 12.8%, to $229.2 million as compared to the previous year reflecting the benefit of the net sales growth, strong productivity and favorable mix from the inclusion of the Smart Balance brand, partially offset by input cost inflation. Excluding items affecting comparability, Earnings before interest and taxes increased $25.4 million, or 12.1%, to $236.1 million.
Boulder Segment:
Earnings before interest and taxes were $9.1 million in 2016 as compared to a loss before interest and taxes of $5.5 million in 2015 primarily reflecting the benefit of the Boulder Brands acquisition. Excluding items affecting comparability, but including the benefit of the acquisition, Earnings before interest and taxes totaled $46.5 million in 2016, versus $2.7 million in 2015.
Specialty Segment:
Earnings before interest and taxes were $32.3 million in 2016, a decline of $2.1 million or 6.1% as compared to the previous year reflecting higher net sales, largely due to gains from the Boulder Brands acquisition, which was more than offset by acquisition integration and Tradename impairment charges. Excluding items affecting comparability, Earnings before interest and taxes of $34.6 million was essentially flat as compared to the year ago period.
Unallocated corporate income (expenses):
Unallocated corporate expense for fiscal 2016 was $31.8 million, as compared to $25.9 million in the comparable prior year period. The increase primarily reflected the impact of the Boulder Brands acquisition costs partially offset by lower equity based compensation expense driven by the CEO transition.

39
Interest Expense, net
Net interest expense increased 57.5%, or $50.8 million, from $88.3 million in the fiscal year ended December 27, 2015 to $139.1 million in the fiscal year ended December 25, 2016. The increase was largely driven by additional debt issued to finance the Boulder Brands acquisition and, to a lesser extent, the impact of higher interest expense for floating rate debt. Also impacting the comparison were $0.6 of charges associated with the re-pricing of Term Loan I during the third quarter of 2016 and higher interest rate swap losses described below.
We utilize interest rate swap agreements to reduce the potential exposure to interest rate movements and to achieve a desired proportion of variable versus fixed rate debt. Any gains or losses realized on the interest rate swap agreements, excluding the Accumulated other comprehensive (loss) earnings ("AOCL") portion, are recorded as an adjustment to interest expense. Included in net interest expense was $8.5 million and $3.7 million for the fiscal 2016 and fiscal 2015, respectively, recorded from losses on interest rate swap agreements.
As discussed in more detail in Note 18 to the Financial Statements, on February 3, 2017, the Company amended it credit agreement which significantly changed our debt profile and expected future interest expense.
Provision (benefit) for income taxes
The effective tax rate was 38.0% for the fiscal year ended December 25, 2016 compared to 36.8% for the fiscal year ended December 27, 2015. The effective rate for the year ended December 25, 2016 includes benefits of approximately 1.9% related to the domestic production activities deduction. In connection with our acquisition of Boulder Brands, Inc., our effective income tax rate was adversely impacted for the tax effect associated with incurring certain non-deductible acquisition costs and compensation payments of 0.6%, a charge for an increase in our non-current state deferred income tax liability balance of approximately 1.0%, and a charge to record a valuation allowance on our foreign tax credit carryforward of approximately 0.2%.
The effective rate for the year ended December 27, 2015, includes benefits of approximately 0.3% related to the domestic production activities deduction and 0.6% related to foreign earnings, including recognition of foreign tax credit. The foreign tax credit benefit is attributable to a fiscal year 2015 dividend repatriation from the Company’s Canadian subsidiary to its U.S parent. The 2015 rate also includes a charge for 0.3% for non-deductible transaction expenditures related to acquisition activity (Note 3) and our public offerings (Note 1).
Under Internal Revenue Code (“the Code”) Section 382, the Company is a loss corporation. Section 382 of the Code places limitations on our ability to use our Net Operating Loss carryovers (NOL's) to offset taxable income. As described in Note 15 to the Consolidated Financial Statements, an ownership change in the third quarter of 2014 placed an annual limitation of approximately $94.0 million on approximately $230.8 million of our federal NOL carryovers which previously were not subject to an annual limitation. During 2015 the Company fully utilized the federal NOL’s which became subject to the 2014 limitation. Our remaining NOLs remain subject to an annual limitation of approximately $17.1 million. See Note 15 to the Consolidated Financial Statements.
On January 15, 2016, we acquired Boulder Brands, Inc. which is a loss corporation. As of the acquisition date, Boulder had approximately $54.5 million of federal NOL carryover subject to the Section 382 provisions. The annual limitation is approximately $26.5 million subject to increase for recognized built in gains. We have fully utilized the $54.5 million of federal NOLs in 2016.
We have significant tax-deductible intangible asset amortization and federal and state NOLs, which resulted in minimal federal and state cash taxes through 2015. We expect continued amortization and utilization of our NOLs will generate modest annual cash tax savings in 2016 and thereafter.
Fiscal year ended December 27, 2015 compared to fiscal year ended December 28, 2014
Net sales
Net sales were $2.66 billion for the fiscal year ended December 27, 2015, an increase of 2.5% compared to net sales of $2.59 billion in the comparable prior-year period, reflecting a 2.3% benefit from the Garden Protein acquisition and higher net price realization of 1.3% partially offset by a 0.7% decrease from volume/mix. The year was also impacted by unfavorable foreign currency translation of 0.4%. In an industry generally marked by no growth and heavier promotional spending, we continued to outpace the performance of our composite categories, with market share growth of 0.5 percentage points in fiscal 2015.

40
Frozen Segment:
Net sales in the fiscal year ended December 27, 2015 were $1.24 billion, an increase of $45.6 million, or 3.8%, from the prior year reflecting a 0.5% benefit from the Garden Protein acquisition (gardein products sold in Canada), a 2.6% increase from volume/mix and higher net price realization of 1.6%, partially offset by unfavorable foreign currency translation of 0.8%. The period was positively impacted by gains in sales of our Birds Eye frozen vegetables and Birds Eye Voila! complete bagged meals, reflecting distribution expansion and the benefit of newly launched products in 2015 such as Birds Eye Steamfresh Flavor Full, Protein Blends, Disney-themed side dishes for kids and Birds Eye Voila! non-chicken varieties. These increases were partially offset by lower sales of Hungry-Man, Lender's, Aunt Jemima and Celeste products.
Grocery Segment:
Net sales in the fiscal year ended December 27, 2015 were $1.02 billion, a decline of $25.8 million, or 2.5%, from the prior year reflecting a 3.4% decrease from volume/mix, partially offset by higher net price realization of 0.9%. Positively impacting the period were increased sales of our Log Cabin syrups and Vlasic pickles. More than offsetting this increase were lower sales of our Duncan Hines baking products due to category weakness, and lower sales of Wish-Bone products, reflecting a highly competitive category environment. The decline in Duncan Hines was partially offset by the 2015 introduction of Duncan Hines Perfect Size baking kits designed specifically for smaller households.
Boulder Segment:
Net sales in the fiscal year ended December 27, 2015 were $41.5 million, an increase of $37.2 million, from the prior year, reflecting the full year benefit of the Garden Protein acquisition as compared to six weeks in the prior year.
Specialty Segment:
Net sales in the fiscal year ended December 27, 2015 were $354.1 million, an increase of $7.6 million, or 2.2%, from the prior year reflecting a 4.7% increase from the Garden Protein acquisition and higher net price realization of 1.1% partially offset by a 3.6% decrease from volume/mix. The volume increase was primarily attributable to the full year benefit of the Garden Protein acquisition partially offset by lower sales of private label canned meat.
Gross profit
Gross profit for the year ended December 27, 2015 was $740.5 million, or 27.9% of net sales, compared to $681.2 million, or 26.3% of net sales, in the comparable prior-year period. Excluding items affecting comparability, gross profit advanced 5.4% and gross margin percentage increased approximately 80 basis points. See Adjusted gross profit reconciliation later in the document for further details.
The following table outlines the factors resulting in the year on year change in gross profit and gross margin percentage in fiscal2015.
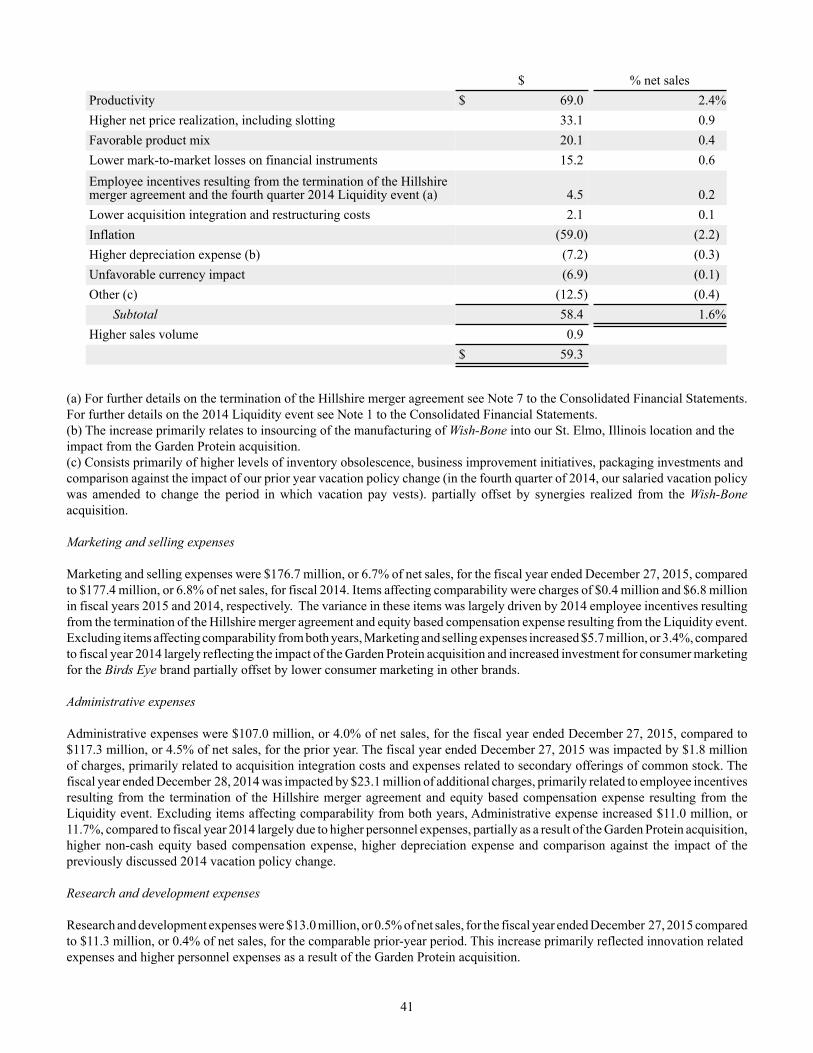
41
$ % net salesProductivity $ 69.0 2.4%Higher net price realization, including slotting 33.1 0.9Favorable product mix 20.1 0.4Lower mark-to-market losses on financial instruments 15.2 0.6Employee incentives resulting from the termination of the Hillshiremerger agreement and the fourth quarter 2014 Liquidity event (a) 4.5 0.2Lower acquisition integration and restructuring costs 2.1 0.1Inflation (59.0) (2.2)Higher depreciation expense (b) (7.2) (0.3)Unfavorable currency impact (6.9) (0.1)Other (c) (12.5) (0.4)
Subtotal 58.4 1.6%Higher sales volume 0.9
$ 59.3
(a) For further details on the termination of the Hillshire merger agreement see Note 7 to the Consolidated Financial Statements. For further details on the 2014 Liquidity event see Note 1 to the Consolidated Financial Statements.(b) The increase primarily relates to insourcing of the manufacturing of Wish-Bone into our St. Elmo, Illinois location and the impact from the Garden Protein acquisition.(c) Consists primarily of higher levels of inventory obsolescence, business improvement initiatives, packaging investments and comparison against the impact of our prior year vacation policy change (in the fourth quarter of 2014, our salaried vacation policy was amended to change the period in which vacation pay vests). partially offset by synergies realized from the Wish-Bone acquisition.
Marketing and selling expenses
Marketing and selling expenses were $176.7 million, or 6.7% of net sales, for the fiscal year ended December 27, 2015, compared to $177.4 million, or 6.8% of net sales, for fiscal 2014. Items affecting comparability were charges of $0.4 million and $6.8 millionin fiscal years 2015 and 2014, respectively. The variance in these items was largely driven by 2014 employee incentives resultingfrom the termination of the Hillshire merger agreement and equity based compensation expense resulting from the Liquidity event.Excluding items affecting comparability from both years, Marketing and selling expenses increased $5.7 million, or 3.4%, comparedto fiscal year 2014 largely reflecting the impact of the Garden Protein acquisition and increased investment for consumer marketingfor the Birds Eye brand partially offset by lower consumer marketing in other brands.
Administrative expenses
Administrative expenses were $107.0 million, or 4.0% of net sales, for the fiscal year ended December 27, 2015, compared to $117.3 million, or 4.5% of net sales, for the prior year. The fiscal year ended December 27, 2015 was impacted by $1.8 million of charges, primarily related to acquisition integration costs and expenses related to secondary offerings of common stock. The fiscal year ended December 28, 2014 was impacted by $23.1 million of additional charges, primarily related to employee incentives resulting from the termination of the Hillshire merger agreement and equity based compensation expense resulting from the Liquidity event. Excluding items affecting comparability from both years, Administrative expense increased $11.0 million, or 11.7%, compared to fiscal year 2014 largely due to higher personnel expenses, partially as a result of the Garden Protein acquisition, higher non-cash equity based compensation expense, higher depreciation expense and comparison against the impact of the previously discussed 2014 vacation policy change.
Research and development expenses
Research and development expenses were $13.0 million, or 0.5% of net sales, for the fiscal year ended December 27, 2015 compared to $11.3 million, or 0.4% of net sales, for the comparable prior-year period. This increase primarily reflected innovation relatedexpenses and higher personnel expenses as a result of the Garden Protein acquisition.

42
Other Income and Expense:
Fiscal year ended
December27, 2015
December28, 2014
Other expense (income), net consists of:Amortization of intangibles/other assets $ 13.6 $ 13.9Boulder Brands acquisition costs (Note 3) 1.7 —Garden Protein acquisition costs (Note 3) — 3.1Foreign exchange losses 4.7 0.7
Royalty income and other (0.9) (1.7)Total other expense (income), net $ 19.1 $ 16.0
Foreign exchange losses. Represents foreign exchange losses from intra-entity loans resulting from the Garden Protein acquisition that are anticipated to be settled in the foreseeable future.
Earnings before interest and taxes
Earnings before interest and taxes declined $87.6 million, or 17.1%, to $424.7 million for the fiscal year ended December 27, 2015. Items affecting comparability in fiscal years 2015 and 2014 were $18.3 million of charges and $88.9 million of credits, respectively. The variance in these items was largely driven by the 2014 benefit of the Hillshire merger termination fee, net of costs incurred, associated employee incentives and retention expenses incurred in the year ago period and incremental equity based compensation expense resulting from the Liquidity event (see Note 1). Excluding items affecting comparability from both years, Earnings before interest and taxes increased $19.7 million, or 4.6%, primarily resulting from increased gross profit, partially offset by higher administrative expenses and higher marketing and selling expenses.
Frozen Segment:
Earnings before interest and taxes for the fiscal year ended December 27, 2015 were $218.5 million, an increase of 13.1%, or $25.4 million as compared to the previous year, primarily reflecting net sales growth, which included higher net price realization as well as productivity savings. Also impacting the year were newly launched margin accretive products described earlier. These increases were partially offset by input cost inflation and increased investment for consumer marketing for Birds Eye in support of new products. Excluding items affecting comparability, Earnings before interest and taxes increased $10.0 million, or 4.8% to $219.4 million.
Grocery Segment:
Earnings before interest and taxes increased $25.8 million, or 14.5%, to $203.1 million as compared to the previous year, largely reflecting productivity savings, higher net price realization, lower consumer marketing expense and synergies realized from the Wish-Bone acquisition, partially offset by the impacts of lower sales volume and input cost inflation. Excluding items affecting comparability, Earnings before interest and taxes increased $6.2 million, or 3.0% to $210.6 million.
Boulder Segment:
Loss before interest and taxes increased $1.3 million, or 29.6%, to $5.5 million, primarily reflecting $8.2 million of integration costs for the Garden Protein acquisition, partially offset by higher volume from the full year benefit of the acquisition as compared to six weeks in the prior year. Excluding items affecting comparability, Earnings before interest and taxes increased $2.5 million to $2.7 million.

43
Specialty Segment:
Earnings before interest and taxes increased $3.3 million, or 10.8%, to $34.4 million, primarily reflecting productivity savings and lower intangible amortization, partially offset by the decline in net sales and input cost inflation. Excluding items affecting comparability, Earnings before interest and taxes increased $0.8 million, or 2.4% to $34.5 million.
Unallocated corporate income (expenses):
Unallocated corporate expense for fiscal 2015 was $25.9 million, as compared to unallocated income of $114.9 million in the comparable prior year period. The change primarily reflected the impact in 2014 of the receipt of the Hillshire merger termination fee payment, net of costs and partially offset by incremental employee incentives and retention expenses, resulting from the termination of the Hillshire merger agreement and the higher equity based compensation expense resulting from the Liquidity event (see Note 1). Excluding these and other items affecting comparability, Unallocated Corporate expenses were $24.1 million for fiscal 2015, compared to $24.3 million for fiscal 2014.
Interest Expense, net
Net interest expense declined 8.1%, or $7.7 million, from $96.1 million in the fiscal year ended December 28, 2014 to $88.3 million in the fiscal year ended December 27, 2015. The decrease primarily resulted from lower outstanding debt balances, a 25 basis step-down on our term loans due to the benefit of our improved net leverage ratio and comparison against $1.9 million of year ago charges associated with our July 2014 principal payment (see Note 10). Partially impacting these benefits was higher interest rate swap losses described below.
We utilize interest rate swap agreements to reduce the potential exposure to interest rate movements and to achieve a desired proportion of variable versus fixed rate debt. Any gains or losses realized on the interest rate swap agreements, excluding the AOCL portion, are recorded as an adjustment to interest expense. Included in net interest expense was $3.7 million and $0.9 million for the fiscal 2015 and fiscal 2014, respectively, recorded from losses on interest rate swap agreements.
Provision (benefit) for income taxes
The effective tax rate was 36.8% for the fiscal year ended December 27, 2015 compared to 40.3% for the fiscal year ended December 28, 2014. The effective rate for the year ended December 27, 2015 includes benefits of approximately 0.6% related to foreign earnings, including recognition of a foreign tax credit, and 0.3% related to the domestic production activities deduction. The foreign tax credit benefit is attributable to a fiscal year 2015 dividend repatriation from the Company's Canadian subsidiary to its U.S. parent. The Company was not eligible for the production activities deduction in prior years due its net operating losses offsetting federal taxable income. The 2015 tax rate also includes a charge of 0.3% for non-deductible transaction expenditures related to the Boulder Brands acquisition (Note 3) and our public offerings (Note 1). The effective rate for the year ended December 28, 2014, was primarily driven by approximately $22.6 million of non-deductible, equity based compensation expense resulting from the Liquidity Event (Note 1). Excluding the impact of this and other items affecting comparability, the effective rate for fiscal 2014 would have been 37.9%.
Under Internal Revenue Code ("the Code") Section 382, the Company is a loss corporation. Section 382 of the Code places limitations on our ability to use our Net Operating Loss carryovers (NOL's) to offset taxable income. As described in Note 16, an ownership change in the third quarter of 2014 placed an annual limitation of approximately $94.0 million on approximately $230.8 million of our federal NOL carryovers which previously were not subject to an annual limitation. During 2015 the Company fully utilized the federal NOL's which became subject to the 2014 limitation. Our remaining NOL's remain subject to an annual limitation of approximately $17.1 million. See Note 15 to the Consolidated Financial Statements.
We have significant tax-deductible intangible asset amortization and federal and state NOLs, which resulted in minimal federal and state cash taxes through 2015. We expect continued amortization and utilization of our NOLs will generate modest annual cash tax savings in 2016 and thereafter.

44
Liquidity and Capital Resources
Historical
Our cash flows are seasonal. Typically we are a net user of cash in the third quarter of the calendar year (i.e., the quarter ending in September) and a net generator of cash over the balance of the year.
Our principal liquidity requirements have been, and we expect will be, for working capital and general corporate purposes, including capital expenditures, debt service, and our quarterly dividend program. Currently, the quarterly payment is $0.285 per share or approximately $34.0 million. The Company repurchased 1.0 million of its shares of common stock at a cost of $32.1 million during fiscal 2014 to offset shares issued under the Liquidity event (see Note 1). We do not have a share repurchase program currently in place but may seek authorization from our Board of Directors to implement one in the future. Capital expenditures are expected to be approximately $125.0 to $130.0 million in 2017. We have historically satisfied our liquidity requirements with internally generated cash flows and availability under our revolving credit facility. We expect that our ability to generate cash from our operations and ability to borrow from our credit facilities should be sufficient to support working capital needs, planned growth and capital expenditures for the next 12 months and for the foreseeable future. We keep an insignificant amount of cash in foreign accounts, primarily related to the operations of our Canadian business.
Statements of cash flows for the fiscal year ended December 25, 2016 compared to the fiscal year ended December 27, 2015
Net cash provided by operating activities was $487.5 million for the fiscal year ended December 25, 2016 and was the result of net earnings, excluding non-cash charges and credits of $376.8 million and a decrease in working capital of $110.7 million. The decrease in working capital was primarily the result of a $61.0 million increase in accounts payable driven by our inventory purchases and the timing of vendor payments, a $36.4 million increase in accrued liabilities driven primarily by higher income tax, interest and restructuring accruals, a $23.5 million decrease in inventories resulting from the sale of higher cost acquired inventories in addition to higher agricultural crop yields in 2015, a $14.4 million decrease in other current assets driven primarily by prepaid income taxes and a $4.8 million increase in accrued trade marketing expense driven by the Boulder Brands acquisition partially offset by the timing of payments. This was partially offset by a $29.4 million increase in accounts receivable primarily resulting from an increase in days sales outstanding.
Net cash provided by operating activities was $372.9 million for the fiscal year ended December 27, 2015 and was the result ofnet earnings, excluding non-cash charges and credits of $441.8 million and an increase in working capital of $68.9 million. Theincrease in working capital was primarily the result of a $49.2 million increase in inventories resulting from favorable agricultural crop yields and innovation related inventory build, a $30.9 million increase in accounts receivable resulting from the timing of sales within the month of December 2015 compared to the previous year, a $8.1 million decrease in accrued liabilities driven primarily by lower accrued income taxes, and a $6.4 million increase in other current assets driven primarily by prepaid income taxes. This was partially offset by a $15.1 million increase in accounts payable driven by our inventory purchases and the timing of vendor payments and a $10.5 million increase in accrued trade marketing expense driven by higher sales for December 2015 compared to the previous year.
Net cash used in investing activities for the fiscal year ended December 25, 2016 totaled $1,086.4 million and included $985.4 million for the Boulder Brands acquisition as well as $101.1 million for capital expenditures.
Net cash used in investing activities for the fiscal year ended December 27, 2015 totaled $105.8 million and included $108.5 million for capital expenditures as well as $1.1 million of cash inflows from a Garden Protein acquisition post closing working capital adjustment. Capital expenditures included approximately $25.5 million of costs related to our acquisition integration projects. Investing activities also included $1.6 million of proceeds from the sale of assets.
Net cash provided by financing activities for the fiscal year ended December 25, 2016 was $771.3 million and consisted of $547.3 million of net proceeds from our Tranche I Term Loans and $350.0 million from our 5.875% Senior Notes offering (both related to the funding of the Boulder Brands acquisition), $36.9 million of net cash inflows related to our equity based compensation plans which were partially offset by $122.9 million of dividends paid, $22.6 million of debt acquisition costs, $13.7 million of term loan repayments and $3.8 million of net capital leases and notes payable activity.
Net cash used in financing activities for the fiscal year ended December 27, 2015 was $124.2 million and consisted of $111.8 million of dividends paid, $8.9 million of term loan repayments, $3.8 million of net capital leases and notes payable activity and $0.3 million of cash inflows related to our equity based compensation plans.
The net of all activities resulted in an increase in cash of $172.5 million for the fiscal year ended December 25, 2016, compared to an increase in cash of $142.1 million for the fiscal year ended December 27, 2015.

45
Statements of cash flows for the fiscal year ended December 27, 2015 compared to the fiscal year ended December 28, 2014
Net cash provided by operating activities was $372.9 million for the fiscal year ended December 27, 2015 and was the result of net earnings, excluding non-cash charges and credits of $441.8 million and an increase in working capital of $68.9 million. The increase in working capital was primarily the result of a $49.2 million increase in inventories resulting from favorable agricultural crop yields and innovation related inventory build, a $30.9 million increase in accounts receivable resulting from the timing of sales within the month of December 2015 compared to the previous year, a $8.1 million decrease in accrued liabilities driven primarily by lower accrued income taxes, and a $6.4 million increase in other current assets driven primarily by prepaid income taxes. This was partially offset by a $15.1 million increase in accounts payable driven by our inventory purchases and the timing of vendor payments and a $10.5 million increase in accrued trade marketing expense driven by higher sales for December 2015 compared to the previous year.
Net cash provided by operating activities was $550.7 million for the fiscal year ended December 28, 2014, which included $151.4 million of cash inflows related to the termination of the Hillshire merger agreement. In addition, net earnings, exclusive of the aforementioned termination inflow and non-cash charges and credits, were $387.8 million. Also impacting the period was a decrease in working capital of $11.5 million. The decrease in working capital was primarily the result of a $24.9 million increase in accounts payable driven principally by improved vendor terms, and a $21.6 million decrease in inventory principally resulting from lower crop yields. The decrease in working capital was partially offset by a $11.5 million decrease in accrued liabilities primarily attributable to the change in the vacation policy and lower accrued interest and a $21.6 million increase in accounts receivable resulting from the timing of sales within the month of December in 2014 compared to the previous year. All other working capital accounts were a net $1.8 million cash outflow.
Net cash used in investing activities for the fiscal year ended December 27, 2015 totaled $105.8 million and included $108.5 million for capital expenditures as well as $1.1 million of cash inflows from a Garden Protein acquisition post closing working capital adjustment. Capital expenditures included approximately $25.5 million of costs related to our acquisition integration projects. Investing activities also included $1.6 million of proceeds from the sale of assets.
Net cash used in investing activities for the fiscal year ended December 28, 2014 totaled $270.0 million and included $169.4 million for the Garden Protein and Gilster acquisitions as well as $103.0 million for capital expenditures, which included approximately $41.5 million of capital related to the Wish-Bone and Gilster acquisitions. Net cash used in investing activities also included $2.3 million of proceeds from the sale of assets.
Net cash used in financing activities for the fiscal year ended December 27, 2015 was $124.2 million and consisted of $111.8 million of dividends paid, $8.9 million of term loan repayments, $3.8 million of net capital leases and notes payable activity and $0.3 million of cash inflows related to our equity based compensation plans.
Net cash used in financing activities for the fiscal year ended December 28, 2014 was $358.0 million and consisted of $220.0 million of term loan repayments, $101.6 million of dividends paid, $32.1 million for the purchase of treasury stock, $2.4 million of net capital leases and notes payable activity and $1.7 million of cash outflows related to our equity based compensation plans. All other financing activities generated a net $0.3 million outflow.
The net of all activities resulted in an increase in cash of $142.1 million for the fiscal year ended December 27, 2015, compared to a decrease in cash of $78.3 million for the fiscal year ended December 28, 2014.
DebtFor more information on our debt, see Note 10 of the Consolidated Financial Statements "Debt and Interest Expense".
Covenant Compliance
The following is a discussion of the financial covenants contained in our debt agreements. See section below for detailed calculation.
Third Amended and Restated Credit Agreement
As discussed in more detail in Note 18 to the Financial Statements, on February 3, 2017, the Company entered into an amendment to its Second Amended and Restated Credit Agreement (the “Amended Credit Agreement”) in order to (1) refinance all of the

46
Company’s outstanding term loans with a new seven-year term loan in an aggregate principal amount of $2,262.0 million (the “New Term Loans”), (2) replace the Company’s existing $150.0 million revolving credit facility with a new five-year $225.0 million revolving credit facility (the “New Revolving Credit Facility and, collectively with the New Term Loans, the “New Credit Facilities”) and (3) amend and restate the Amended Credit Agreement in its entirety to make certain other amendments and modifications (as so amended and restated, the “Third Amended and Restated Credit Agreement”).
Our Third Amended and Restated Credit Agreement contains a number of covenants that, among other things, restrict, subject to certain exceptions, our ability to:
• incur additional indebtedness and make guarantees;• create liens on assets;• engage in mergers or consolidations;• sell assets;• pay dividends and distributions or repurchase our capital stock;• make investments, loans and advances, including acquisitions; and• engage in certain transactions with affiliates.
The Third Amended and Restated Credit Agreement also contains certain customary affirmative covenants and events of default.
5.875% Senior Notes and 4.875% Senior Notes
In April 2013, we issued the 4.875% Senior Notes. In January 2016, we issued the 5.875% Senior Notes. We refer to the 4.875% Notes and the 5.875% Notes as the "Senior Notes". The Senior Notes are general senior unsecured obligations, effectively subordinated to all of our existing and future secured indebtedness to the extent of the value of the assets securing that indebtedness, and guaranteed on a full, unconditional, joint and several basis by the Company and Pinnacle Foods Finance's wholly-owned domestic subsidiaries that guarantee our other indebtedness.
The indentures governing the Senior Notes limits our (and our restricted subsidiaries’) ability to, subject to certain exceptions:• incur additional debt or issue certain preferred shares;• pay dividends on or make other distributions in respect of our capital stock or make other restricted payments;• make certain investments;• sell certain assets;• create liens on certain assets to secure debt;• consolidate, merge, sell or otherwise dispose of all or substantially all of our assets;• enter into certain transactions with our affiliates; and• designate our subsidiaries as unrestricted subsidiaries.
Subject to certain exceptions, the indentures governing the Senior Notes permits us and our restricted subsidiaries to incur additional indebtedness, including secured indebtedness.
Non-GAAP Financial Measures
Pinnacle uses the following non-GAAP financial measures as defined by the Securities and Exchange Commission in its financial communications. These non-GAAP financial measures should be considered as supplements to the GAAP reported measures, should not be considered replacements for, or superior to, the GAAP measures and may not be comparable to similarly named measures used by other companies.
• Adjusted gross profit• Adjusted gross profit as a % of sales• Adjusted EBITDA• Adjusted Earnings before Interest and Taxes (Adjusted EBIT)• Covenant Compliance EBITDA
Adjusted gross profitPinnacle defines Adjusted gross profit as gross profit before accelerated depreciation related to restructuring activities, certain non-cash items, acquisition, merger and other restructuring charges and other adjustments. The Company believes that the presentation of Adjusted gross profit is useful to investors in the evaluation of the operating performance of companies in similar industries. The Company believes this measure is useful to investors because it increases transparency and assists investors in understanding the underlying performance of the Company and in the analysis of ongoing operating trends. In addition, Adjusted

47
gross profit is one of the components used to evaluate the performance of Company's management. Such targets include, but are not limited to, measurement of sales efficiency, productivity measures and recognition of acquisition synergies.
Adjusted EBITDAPinnacle defines Adjusted EBITDA as earnings before interest expense, taxes, depreciation and amortization ("EBITDA"), further adjusted to exclude certain non-cash items, non-recurring items and certain other adjustment items permitted in calculating Covenant Compliance EBITDA under the Amended Credit Agreement, the Third Amended and Restated Credit Agreement and the indentures governing the Senior Notes. Adjusted EBITDA does not include adjustments for equity-based compensation and certain other adjustments related to acquisitions, both of which are permitted in calculating Covenant Compliance EBITDA.
Management uses Adjusted EBITDA as a key metric in the evaluation of underlying Company performance, in making financial, operating and planning decisions and, in part, in the determination of cash bonuses for its executive officers and employees. TheCompany believes this measure is useful to investors because it increases transparency and assists investors in understanding theunderlying performance of the Company and in the analysis of ongoing operating trends. Additionally, Pinnacle believes the presentation of Adjusted EBITDA provides investors with useful information, as it is an important component in determining ourability to service debt and meet any payment obligations. In addition, Pinnacle believes that Adjusted EBITDA is frequently usedby analysts, investors and other interested parties in their evaluation of companies, many of which present an Adjusted EBITDAmeasure when reporting their results. The Company has historically reported Adjusted EBITDA to analysts and investors and believes that its continued inclusion provides consistency in financial reporting and enables analysts and investors to perform meaningful comparisons of past, present and future operating results.
Adjusted EBITDA should not be considered as an alternative to operating or net earnings (loss), determined in accordance withUS GAAP, as an indicator of the Company's operating performance, as an alternative to cash flows from operating activities, determined in accordance with GAAP, as an indicator of cash flows, or as a measure of liquidity.
Adjusted Earnings before Interest and Taxes (Adjusted EBIT)Adjusted earnings before interest and taxes is provided because Pinnacle believes it is useful information in understanding our EBIT results by improving the comparability of year-to-year results. Additionally, Adjusted EBIT provides transparent and usefulinformation to management, investors, analysts and other parties in evaluating and assessing the Company and its segments, primary operating results from period to period after removing the impact of unusual, non-operational or restructuring-related activities that affect comparability. Adjusted EBIT is one of the measures management uses for planning and budgeting, monitoring and evaluating financial and operating results and in the analysis of ongoing operating trends.
Covenant Compliance EBITDACovenant Compliance EBITDA is defined as earnings before interest expense, taxes, depreciation and amortization, further adjusted to exclude non-cash items, extraordinary, unusual or non-recurring items and other adjustment items permitted in calculating Covenant Compliance EBITDA under the Amended Credit Agreement, the Third Amended and Restated Credit Agreement and the indentures governing the Senior Notes. We believe that the inclusion of supplementary adjustments to EBITDA applied in presenting Covenant Compliance EBITDA is appropriate to provide additional information to investors to demonstrate compliance with our financial covenants.
EBITDA, Adjusted EBITDA and Covenant Compliance EBITDA do not represent net earnings or (loss) or cash flow from operations as those terms are defined by GAAP and do not necessarily indicate whether cash flows will be sufficient to fund cash needs. In particular, the definitions of Covenant Compliance EBITDA under the Amended Credit Agreement, the Third Amended and Restated Credit Agreement and the indentures allow Pinnacle to add back certain non-cash, extraordinary, unusual or non-recurring charges that are deducted in calculating net earnings or loss. However, these are expenses that may recur, vary greatly and are difficult to predict. While EBITDA, Adjusted EBITDA and Covenant Compliance EBITDA and similar measures are frequently used as measures of operations and the ability to meet debt service requirements, they are not necessarily comparable to other similarly titled captions of other companies due to the potential inconsistencies in the method of calculation.
Pursuant to the terms of both the Amended Credit Agreement and the Third Amended and Restated Credit Agreement, Pinnacle Foods Finance is required to maintain a ratio of Net First Lien Secured Debt to Covenant Compliance EBITDA of no greater than 5.75 to 1.00. Net First Lien Secured Debt is defined as Pinnacle Foods Finance's aggregate consolidated secured indebtedness secured on a first lien basis, less the aggregate amount of all unrestricted cash and cash equivalents.
In addition, under the Amended Credit Agreement, the Third Amended and Restated Credit Agreement and the indentures governing the Senior Notes, our ability to engage in activities such as incurring additional indebtedness, making investments and paying dividends is tied to the Senior Secured Leverage Ratio (which is currently the same as the ratio of Net First Lien Secured Debt to Covenant Compliance EBITDA described above), in the case of the Amended Credit Agreement, and the Third Amended

48
and Restated Credit Agreement, or to the ratio of Covenant Compliance EBITDA to fixed charges for the most recently concluded four consecutive fiscal quarters, in the case of the Senior Notes. We believe that these covenants are material terms of these agreements and that information about the covenants is material to an investor's understanding our financial performance. As of December 25, 2016, we were in compliance with all covenants and other obligations under the Amended Credit Agreement and the indentures governing the Senior Notes.
Our ability to meet the covenants specified above in future periods will depend on events beyond our control, and we cannot assure you that we will meet those ratios. A breach of any of these covenants in the future could result in a default under, or an inability to undertake certain activities in compliance with, the Third Amended and Restated Credit Agreement and the indentures governing the Senior Notes, at which time the lenders could elect to declare all amounts outstanding under the Third Amended and Restated Credit Agreement to be immediately due and payable. Any such acceleration would also result in a default under the indentures governing the Senior Notes.
The following table provides a reconciliation from our net earnings to EBITDA and Covenant Compliance EBITDA for the fiscal years ended December 25, 2016 and December 27, 2015. The terms and related calculations are defined in the Amended Credit Agreement and the indentures governing the Senior Notes.
(thousands of dollars) Fiscal yearDecember 25,
2016December 27,
2015
Net earnings $ 211,117 $ 212,508
Interest expense, net 139,098 88,315
Income tax expense 129,430 123,879
Depreciation and amortization expense 105,772 89,660
EBITDA $ 585,417 $ 514,362
Non-cash items (a) 12,850 4,315Acquisition, merger and other restructuring charges (b) 46,100 12,926
Adjusted EBITDA $ 644,367 $ 531,603
Wish-Bone, Garden Protein and Boulder Brands acquisitionadjustments (1) 23,120 10,544
Non-cash equity based compensation charges (2) 14,016 13,555
Covenant Compliance EBITDA $ 681,503 $ 555,702
(1) For fiscal 2016, represents proforma additional EBITDA from Boulder for the period prior to the acquisition and net cost savings projected to be realized from acquisition synergies from the Boulder and Garden Protein acquisitions, calculated consistent with the definition of Covenant Compliance EBITDA. For fiscal 2015, represents the net cost savings projected to be realized from acquisition synergies from both the Garden Protein and Wish-Bone acquisitions, calculated consistent with the definition of Covenant Compliance EBITDA.
(2) Represents non-cash compensation charges related to the granting of equity awards that occur in the normal course of business. Awards that were issued as a result of the termination of the Hillshire merger agreement are being treated as an adjustment in the determination of Adjusted EBITDA. See Non-cash items below for details.

49
(a) Non-cash items are comprised of the following:
(thousands of dollars) Fiscal yearDecember 25,
2016December 27,
2015
Unrealized gains resulting from hedging activities (1) $ (12,511) $ (1,983)
Tradename impairment charges (2) 11,200 —Effects of adjustments related to the application of purchaseaccounting (3) 10,382 —
Non-cash compensation charges (4) — 1,567
Intra entity foreign exchange (gains) losses (5) (486) 4,731
Wind down of Boulder Brands UK operations (6) 4,265 —
Total non-cash items $ 12,850 $ 4,315
_________________
(1) Represents non-cash gains resulting from mark-to-market adjustments of obligations under derivative contracts.(2) For fiscal 2016, represents tradename impairment on Celeste ($7.3 million), Aunt Jemima ($3.0 million) and Snyder of
Berlin ($0.9 million).(3) For fiscal 2016, represents expense related to the write-up to fair market value of inventories acquired as a result of the
Boulder Brands acquisition. (4) For fiscal 2015, represents non-cash employee incentives and retention charges resulting from the termination of the
Hillshire merger agreement. (5) Represents foreign exchange (gains) losses resulting from intra-entity loans that are anticipated to be settled in the
foreseeable future.(6) Represents charges related to the voluntary wind down of the Boulder Brands private label gluten free bakery operation
which is based in the United Kingdom.
(b) Acquisition, merger and other restructuring charges are comprised of the following:
(thousands of dollars) Fiscal yearDecember 25,
2016December 27,
2015Expenses in connection with an acquisition or other non-recurringcosts (1) $ 6,781 $ 2,735Restructuring charges, integration costs and other businessoptimization expenses (2) 39,079 9,504Employee severance (3) 240 687Total other adjustments $ 46,100 $ 12,926
_________________
(1) For fiscal 2016, represents Boulder Brands acquisition costs. For fiscal 2015, represents Boulder Brands acquisition costs and expenses related to the secondary offerings of common stock.
(2) For fiscal 2016, primarily represents restructuring charges and integration costs of the Boulder Brands and Garden Protein acquisitions. For fiscal 2015, primarily represents integration costs of the Garden Protein and Wish-Bone acquisitions.
(3) Represents severance costs paid, or to be paid, to terminated employees.

50
Our covenant requirements and actual ratios for the year ended December 25, 2016 are as follows:
Covenant
Requirement Actual Ratio
Amended Credit AgreementNet First Lien Leverage Ratio (1) 5.75 to 1.00 3.15Total Leverage Ratio (2) Not applicable 4.19
Senior Notes (3)Minimum Covenant Compliance EBITDA to fixed charges ratio required toincur additional debt pursuant to ratio provisions (4) 2.00 to 1.00 5.28
_________________(1) Pursuant to the terms of the Amended Credit Agreement, Pinnacle Foods Finance was required to maintain a ratio of Net
First Lien Secured Debt to Covenant Compliance EBITDA of no greater than 5.75 to 1.00. Net First Lien Secured Debt is defined as Pinnacle Foods Finance's aggregate consolidated secured indebtedness secured on a first lien priority basis, less the aggregate amount of all unrestricted cash and cash equivalents.
(2) The Total Leverage Ratio is not a financial covenant but is used to determine the applicable margin rate under the Amended Credit Agreement. As of December 25, 2016, the Company achieved a total net leverage ratio of less than 4.25:1.0, which would have resulted in a 25 basis point reduction on the margin on Term Loans G and H under the Amended Credit Agreement, subsequent to our quarterly certification to the Administrative Agent which occurs after the filing of this 10-K report. However, Total Leverage Ratio is no longer an applicable metric with respect to the applicable margin rate after the Refinancing which is described more fully in Note 18 to the Consolidated Financial Statements. The Total Leverage Ratio is calculated by dividing consolidated total debt less the aggregate amount of all unrestricted cash and cash equivalents by Covenant Compliance EBITDA.
(3) Our ability to incur additional debt and make certain restricted payments under the indentures governing the Senior Notes, subject to specified exceptions, is tied to an Covenant Compliance EBITDA to fixed charges ratio of at least 2.00 to 1.00.
(4) Fixed charges is defined in the indentures governing the Senior Notes as (i) consolidated interest expense (excluding specified items) plus consolidated capitalized interest less consolidated interest income, plus (ii) cash dividends and distributions paid on preferred stock or disqualified stock.
Pinnacle Foods Inc. Reconciliation of Non-GAAP measures (Unaudited)
Adjusted gross profit and Adjusted gross profit as a % of sales(thousands)
(thousands of dollars) Fiscal yearDecember 25,
2016December 27,
2015December 28,
2014
Gross profit $ 916,074 $ 740,506 $ 681,198Accelerated depreciation expense (a) — 1,131 —Non-cash items (b) (2,129) (1,029) 17,856Acquisition, merger or other restructuring charges (c) 7,121 9,217 12,247Adjusted gross profit $ 921,066 $ 749,825 $ 711,301
Adjusted gross profit as a % of Net sales 29.4% 28.2% 27.5%
_________________
(a) Reflects accelerated depreciation related to in-sourcing of Wish-Bone production.
(b) Non-cash items are comprised of the following:

51
(thousands of dollars) Fiscal yearDecember 25,
2016December 27,
2015December 28,
2014
Unrealized gains resulting from hedging activities (1) $ (12,511) $ (1,983) $ 12,542Effects of adjustments related to the application ofpurchase accounting (2) 10,382 — 636Non-cash compensation charges (3) — 954 4,678Non-cash items $ (2,129) $ (1,029) $ 17,856
_________________
(1) Represents non-cash gains resulting from mark-to-market obligations under derivative contracts.(2) For fiscal 2016, represents expense related to the write-up to fair market value of inventories acquired as a
result of the Boulder Brands acquisition. For fiscal 2014, represents expense related to the write-up to fair market value of inventories acquired as a result of the Garden Protein acquisition.
(3) For fiscal 2015, represents non-cash employee incentives and retention charges resulting from the termination of the Hillshire merger agreement. For fiscal 2014, represents non-cash employee incentives and retention charges resulting from the termination of the Hillshire merger agreement and equity based compensation expense resulting from the Liquidity event.
(c) Acquisition, merger and other restructuring charges are comprised of the following:
(thousands of dollars) Fiscal yearDecember 25,
2016December 27,
2015December 28,
2014
Expenses in connection with an acquisition orother non-recurring merger costs (1) $ — $ 130 $ 855Restructuring charges, integration costs and otherbusiness optimization expenses (2) 7,121 8,625 10,697Employee severance and recruiting (3) — 462 695Total acquisition, merger and other restructuringcharges $ 7,121 $ 9,217 $ 12,247
_________________(1) Represents expenses incurred related to the terminated agreement with Hillshire. (2) For fiscal 2016, primarily represents integration costs of the Garden Protein and Boulder Brands acquisition.
For fiscal 2015, primarily represents integration costs of the Garden Protein and Wish-Bone acquisitions. For fiscal 2014, represents integration costs of the Wish-Bone and Gilster acquisitions and a gain from the sale of our Millsboro, DE facility in September 2014.
(3) Represents severance costs paid or accrued to terminated employees.

52
Pinnacle Foods Inc. and SubsidiariesReconciliation of Non-GAAP measures
Adjusted EBIT (1)(thousands)
Fiscal YearDecember 25,
2016December 27,
2015December 28,
2014Net earnings (as reported) $ 211,117 $ 212,508 $ 248,418 Interest expense, net 139,098 88,315 96,053 Provision for income taxes 129,430 123,879 167,800Earnings before interest and taxes (as reported) 479,645 424,702 512,271
Accelerated depreciation expense (2) — 1,131 —
Non-cash items
Unrealized gains resulting from hedging (3) (12,511) (1,983) 12,542Purchase accounting adjustments (4) 10,382 — 636Tradename impairment charges (5) 11,200 — —Non-cash compensation charges (6) — 1,567 27,189Intra entity foreign exchange (gains)/losses (7) (486) 4,731 655Wind down of Boulder Brands UK operations (8) 4,265 — —
Acquisition, merger and other restructuring charges
Acquisition or other non recurring expenses (9) 6,781 2,735 (144,526)Restructuring and integration costs (10) 39,079 9,504 11,011Employee severance (11) 240 687 3,465Other — — 169
Adjusted EBIT $ 538,595 $ 443,074 $ 423,412
(1) Excludes Boulder, Wish-Bone and Gardein anticipated synergies which are included in calculating Covenant compliance.
(2) Reflects accelerated depreciation related to in-sourcing of Wish-Bone production. (3) Represents non-cash gains resulting from mark-to-market obligations under derivative contracts. (4) For fiscal 2016, represents expense related to the write-up to fair value of inventories acquired as a result of the
Boulder Brands acquisition. (5) Represents tradename impairment on Celeste ($7.3 million), Aunt Jemima ($3.0 million) and Snyder of Berlin ($0.9
million). (6) Represents non-cash employee incentives and retention charges resulting from the termination of the Hillshire merger
agreement. (7) Represents foreign exchange (gains) losses resulting from intra-entity loans that are anticipated to be settled in the
foreseeable future. (8) Represents charges related to the voluntary wind down of the Boulder Brands private label gluten free bakery
operation which is based in the United Kingdom. (9) For fiscal 2016, represents Boulder Brands acquisition costs. For fiscal 2015, represents Boulder Brands acquisition
costs and expenses related to the secondary offerings of common stock.(10) For fiscal 2016, primarily represents restructuring charges and integration costs of the Boulder Brands and Garden
Protein acquisitions. For fiscal 2015, primarily represents integration costs of the Garden Protein and Wish-Bone acquisitions.
(11) Represents severance costs not related to business acquisitions paid, or to be paid, to terminated employees.

53
Pinnacle Foods Inc.Reconciliation from Reported to Adjusted Segment Amounts
For the fiscal year ended December 25, 2016, December 27, 2015, and December 28, 2014 (thousands)
Fiscal Year
December 25,2016
December 27,2015
December 28,2014
Earnings before interest & taxes - ReportedFrozen $ 240,919 $ 218,536 $ 193,185Grocery 229,155 203,146 177,381Boulder 9,096 (5,498) (4,242)Specialty 32,263 34,369 31,029Unallocated corporate expenses (31,788) (25,851) 114,918Total $ 479,645 $ 424,702 $ 512,271
Adjustments (Non GAAP - See separate table)Frozen $ 5,454 $ 894 $ 16,240Grocery 6,907 7,467 27,076Boulder 37,439 8,181 4,436Specialty 2,369 117 2,637Unallocated corporate expenses 6,781 1,713 (139,248)Total $ 58,950 $ 18,372 $ (88,859)
Earnings before interest & taxes - Adjusted(Non GAAP - See separate discussion andtables)Frozen $ 246,373 $ 219,430 $ 209,425Grocery 236,062 210,613 204,457Boulder 46,535 2,683 194Specialty 34,632 34,486 33,666Unallocated corporate expenses (25,007) (24,138) (24,330)Total $ 538,595 $ 443,074 $ 423,412

54
Pinnacle Foods Inc.Reconciliation from Reported to Adjusted Segment Amounts
Supplemental Schedule of Adjustments Detail (unaudited)For the fiscal year ended December 25, 2016, December 27, 2015, and December 28, 2014
(millions)
Adjustments to Earnings Before Interest and TaxesFiscal Year
December 25, 2016 December 27, 2015 December 28, 2014FrozenRestructuring and acquisition integration charges $ 0.5 $ — $ —Employee severance 0.1 0.4 1.6Liquidity event stock compensation expense — — 4.9Unrealized mark-to-market (gain)/loss (5.8) (0.6) 5.9Hillshire merger termination-related employee compensationexpense — 0.8 3.5Expenses related to the write-up to fair value of inventories acquired 0.3 — —Tradename impairment charges 10.3 — —Other 0.1 0.3 0.3Total Frozen $ 5.5 $ 0.9 $ 16.2
GroceryRestructuring and acquisition integration charges $ 8.6 $ 7.3 $ 11.1Employee severance 0.1 0.3 1.7Liquidity event stock compensation expense — — 4.7Unrealized mark-to-market (gain)/loss (5.5) (1.3) 5.6Hillshire merger termination-related employee compensationexpense — 0.8 3.4Expenses related to the write-up to fair value of inventories acquired 3.5 — —Other 0.2 0.4 0.6Total Grocery $ 6.9 $ 7.5 $ 27.1
BoulderRestructuring and acquisition integration charges $ 27.4 $ 8.2 $ 4.4Wind down of Boulder Brands UK operations 4.3 — —Unrealized mark-to-market (gain)/loss (0.3) — —Expenses related to the write-up to fair value of inventories acquired 6.0 — —Total Boulder $ 37.4 $ 8.2 $ 4.4
SpecialtyEmployee severance $ — $ — $ 0.2Restructuring and acquisition integration charges 1.4 — —Liquidity event stock compensation expense — — 0.6Unrealized mark-to-market (gain)/loss (0.8) (0.1) 0.8Hillshire merger termination-related employee compensationexpense — 0.1 0.5Expenses related to the write-up to fair value of inventories acquired 0.6 — —Tradename impairment charges 0.9 — —Other 0.3 0.1 0.5Total Specialty $ 2.4 $ 0.1 $ 2.6
Unallocated Corporate ExpensesBoulder Brands acquisition related charges $ 6.8 $ 1.7 $ —Hillshire merger termination fee received, net — — (153.0)Liquidity event stock compensation expense — — 13.6Other — — 0.2Total Unallocated Corporate Expenses $ 6.8 $ 1.7 $ (139.2)

55
Contractual Commitments
The table below provides information on our contractual commitments as of December 25, 2016:
Total
Less Than1 Year
1-3 Years
3-5 Years
More than 5 Years
(in thousands)
Total debt at face value (1) $3,169,926 $ 17,605 $ 21,196 $2,264,125 $ 867,000Projected interest payments on long term debt (2) 418,509 96,536 212,579 81,606 27,788Operating lease obligations 76,589 16,674 24,690 18,714 16,511Capital lease obligations 47,421 11,356 15,144 12,738 8,183Purchase obligations (3) 1,008,087 609,056 101,325 77,674 220,032Pension (4) 65,552 — 8,178 10,224 47,150Total (5) $4,786,084 $ 751,227 $ 383,112 $2,465,081 $1,186,664
(1) Total debt at face value includes scheduled principal repayments and excludes interest payments. (2) The total projected interest payments on long-term debt are based upon borrowings and interest rates as of December 25,
2016, including the effect of interest rate swaps in place. The interest rate on variable rate debt is subject to changes beyond our control and may result in actual interest expense and payments differing from the amounts above. Our refinancing, more fully described in Note 18 of the Consolidated Financial Statements, is expected to result in significantly lower projected interest payments than those as of the balance sheet date.
(3) The amounts indicated in this line primarily reflect future contractual payments, including certain take-or-pay arrangements entered into as part of the normal course of business. The amounts do not include obligations related to other contractual purchase obligations that are not take-or-pay arrangements. Such contractual purchase obligations are primarily purchase orders at fair value that are part of normal operations and are reflected in historical operating cash flow trends. Purchase obligations also include trade and consumer promotion and advertising commitments. We do not believe such purchase obligations will adversely affect our liquidity position.
(4) The funding of the defined benefit pension plan is based upon our planned 2017 cash contribution. The future years' contributions are based upon our expectations taking into consideration the funded status of the plan at December 25, 2016. Currently, under ERISA and IRS guidelines, our plan is 99% funded.
(5) The total excludes the liability for uncertain tax positions. We are not able to reasonably estimate the timing of the long-term payments or the amount by which the liability will increase or decrease over time. Therefore, the long-term portion of the liability is excluded from the preceding table.
Off-Balance Sheet Arrangements
As of December 25, 2016, we did not have any off-balance sheet obligations.
Accounting Policies and Pronouncements
Critical Accounting Policies and Estimates
The preparation of financial statements in accordance with generally accepted accounting principles in the United States requires the use of judgment, estimates and assumptions. We make such subjective determinations after careful consideration of our historical performance, management's experience, current economic trends and events and information from outside sources. Inherent in this process is the possibility that actual results could differ from these estimates and assumptions for any particular period.
Our significant accounting policies are detailed in Note 2 to our Consolidated Financial Statements for the fiscal year ended December 25, 2016. The following areas are the most important and require the most difficult, subjective judgments.
Trade and Consumer Promotion Programs
The Company offers various sales incentive programs to customers and consumers, such as feature price discounts, in-store display incentives, cooperative advertising programs, new product introduction fees, and coupons. The mix between the various sales incentive programs, which are classified as reductions in revenue, and advertising or other marketing activities, which are classified as marketing and selling expenses, fluctuates between periods based on the Company's overall marketing plans, and such fluctuations have an impact on revenues. The measurement and recognition of the costs for trade and consumer promotion programs

56
involves the use of judgment related to performance and redemption estimates. Estimates are made based on historical experience and other factors and are adjusted quarterly based upon our most recent experience and new information. Typically, programs that are offered have a very short duration. Historically, the difference between actual experience compared to estimated redemptions and performance has not been significant to the quarterly or annual financial statements and actual expense has been within 1.0% of amounts accrued. However, actual expenses may differ if the level of redemption rates and performance were to vary from estimates.
Goodwill and Indefinite-lived Trade Names
Goodwill and trade names are tested for impairment annually and whenever events and circumstances indicate that impairment may have occurred. The goodwill impairment review consists of a two-step process. We perform quantitative testing by calculating the fair value of each reporting unit. We then compare the fair value of the reporting unit with its carrying value. If this fair value exceeds the carrying value, no further analysis or goodwill impairment charge is required. If the fair value is below the carrying value, we proceed to the next step, which is to measure the amount of the impairment loss. The impairment loss is measured as the difference between the carrying value and implied fair value of goodwill. To measure the implied fair value of goodwill we make a hypothetical allocation of the estimated fair value of the reporting unit to the tangible and intangible assets (other than goodwill) within the respective reporting unit using the same rules for determining fair value and allocation under the authoritative guidance for business combinations as we would use if it were an original purchase price allocation. If the implied fair value of the reporting unit's goodwill is less than its carrying amount, the shortfall is charged to earnings.
In estimating the fair value of our reporting units we primarily use the income approach, which utilizes forecasted discounted cash flows to estimate the fair value for each reporting unit. We believe that the use of the discounted cash flow model results in the most accurate estimate of the reporting unit's fair value since market values for our reporting units are not readily available. The income approach utilizes management's business plans and projections as the basis for expected future cash flows for five years plus a terminal year. We make significant assumptions including projected sales growth rates and operating margins and the weighted average cost of capital. In our recent impairment tests, we forecasted cash flows for five years plus a terminal year and assumed a weighted average cost of capital of 6.25%. Our projections assume sales growth rates for the next five years and the terminal year that generally average between 1.0% and 3.0% and operating margins which increase moderately from historical levels over time as a result of planned capital improvements in our plants and manufacturing efficiency projects. These assumptions are determined based upon our expectations for each of the individual reporting units and in our judgment are consistent with other companies in the packaged food industry.
In fiscal 2016, all reporting units tested had a fair value that exceeded their carrying value by at least 70%. We performed a sensitivity analysis on our weighted average cost of capital and we determined that a 50 basis point increase in the weighted average cost of capital would not have resulted in any of our reporting units implied fair value being less than their carrying value. Additionally, a 50 basis point decrease in the terminal growth rate used for each reporting unit would also not have resulted in any of our reporting units implied fair value being less than their carrying value
We also evaluate the carrying amount of our trade names for impairment on an annual basis, in conjunction with our Goodwill testing, or more frequently if events or changes in circumstances indicate that the asset might be impaired. The impairment test consists of a comparison of the fair value of an intangible asset with its carrying value. If the carrying value of a trade name exceeds its fair value at the time of the evaluation, we would charge the shortfall to earnings.
To estimate the fair value of our trade names we primarily use the relief from royalty method, which utilizes forecasted discounted net sales to estimate the fair value. The utilization of the relief from royalty method requires us to make significant assumptions including sales growth rates, implied royalty rates and discount rates. As discussed in Note 9 to the Consolidated Financial Statements, in fiscal 2016, we recognized impairments of $7.3 million on Celeste, $3.0 million on Aunt Jemima and $0.9 million on Snyder of Berlin. These charges were the result of the Company's reassessment of the long-term sales projections for the brands during our annual planning cycle which occurs during the third quarter each year. In addition, we performed a sensitivity analysis on our weighted average cost of capital and we determined that a 50 basis point increase in the weighted average cost of capital would have resulted in an additional impairment of $5.3 million. Additionally, a 50 basis point decrease in the terminal growth rate used for each of the impaired tradenames would have resulted in an additional impairment of $4.3 million.
Other than the recently valued Boulder Brands tradenames, in the course of our testing, we identified an additional three tradenames which do not have a fair value that exceeded their carrying value by at least 15%. The total carrying value of these tradenames as of December 25, 2016 is $25.5 million.We performed a sensitivity analysis on our weighted average cost of capital and we determined that a 50 basis point increase in the weighted average cost of capital would have resulted in an additional impairment of $5.7 million. Additionally, a 50 basis point decrease in the terminal growth rate used for each tradename would have resulted in an additional impairment of $4.6 million.

57
Pension Benefits
The Company had provided pension benefits to certain employees and retirees. All pension plans are frozen for future benefits. Determining the cost associated with such benefits is dependent on various actuarial assumptions, including discount rates, expected return on plan assets and mortality rates. Independent actuaries, in accordance with GAAP, perform the required calculations to determine pension expense. Actual results that differ from the actuarial assumptions are generally accumulated and amortized over future periods.
The discount rate is established as of the Company's fiscal year-end measurement date. In establishing the discount rate, the Company reviews published market indices of high-quality debt securities, adjusted as appropriate for duration. In addition, independent actuaries apply high-quality bond yield curves to the expected benefit payments of the plan. The expected return on plan assets is a long-term assumption based upon historical experience and expected future performance, considering our current and projected investment mix. This estimate is based on an estimate of future inflation, long-term projected real returns for each asset class, and a premium for active management. Within any given fiscal period, significant differences may arise between the actual return and the expected return on plan assets. The value of plan assets, used in the calculation of pension expense, is the fair market value. Gains and losses resulting from differences between actual experience and the assumptions are determined at each measurement date. If the net gain or loss exceeds 10% of the greater of plan assets or liabilities, a portion is amortized into earnings in the following year.
Net periodic pension benefit was $0.2 million in fiscal 2016, $1.8 million in fiscal 2015 and $1.6 million in fiscal 2014. Significant weighted-average assumptions for all plans used in the calculation are:
Pension Benefits 2016 2015 2014
PensionDiscount rate 4.2% 3.9% 4.8%Expected return on plan assets 6.0% 6.3% 6.5%
Estimated sensitivities to annual net periodic pension cost are as follows: a 50-basis-point reduction in the discount rate would have a minimal effect on pension expense by decreasing it by $0.1 million; a 50-basis-point reduction in the estimated return on assets assumption would increase pension expense by approximately $1.0 million.
Net periodic pension benefit is expected to be approximately $2.0 million in 2017. In fiscal 2017, the Company does not expect to make any significant contributions. We made contributions to our plans of $0.3 million in fiscal 2016, $3.1 million in fiscal 2015 and $7.8 million in fiscal 2014.
See also Note 11 to the Consolidated Financial Statements "Pension and Retirement Plans" for additional information on pension expenses.
Income taxes
We record income taxes based on the amounts that are refundable or payable in the current year, and we include results of any difference between U.S. GAAP and tax reporting that we record as deferred tax assets or liabilities. We review our deferred tax assets for recovery. A valuation allowance is established when the Company believes that it is more likely than not that some portion of its deferred tax assets will not be realized. Changes in valuation allowances from period to period are included in our tax provision in the period of change. Assessment of the appropriate amount and classification of income taxes is dependent on several factors, including estimates of the timing and realization of deferred income tax assets and the timing of income tax payments. Actual collections and payments may differ from these estimates as a result of changes in tax laws as well as unanticipated future transactions impacting related income tax balances.
Recently Issued Accounting Pronouncements
For more information on recently issued accounting pronouncements, see Note 2 of the Consolidated Financial Statements "Summary of Significant Accounting Policies".

58
ITEM 7A: QUANTITATIVE AND QUALITATIVE DISCLOSURE ABOUT MARKET RISK
FINANCIAL INSTRUMENTS
The sensitivity analyses we present below do not consider the effect of possible adverse changes in the general economy, nor do they consider additional actions we may take to mitigate our exposure to such changes. Our effort to manage or continue to manage any of these risks in the future may not be successful.
Risk Management Strategy
We are exposed to certain risks arising from both our business operations and economic conditions. We principally manage our exposures to a wide variety of business and operational risks through management of our core business activities. We manage economic risks, including interest rate, liquidity, and credit risk primarily by managing the amount, sources, and duration of our debt funding and the use of derivative financial instruments. The primary risks managed by using derivative instruments are interest rate risk, foreign currency exchange risk and commodity price risk. Specifically, we enter into derivative financial instruments to manage exposures that arise from business activities that result in the receipt or payment of future known and uncertain cash amounts, the value of which are determined by interest rates, foreign exchange rates or commodity prices. Please refer to Note 12 of the Consolidated Financial Statements "Financial Instruments" for additional details regarding our derivatives and refer to Note 10 of the Consolidated Financial Statements "Debt and Interest Expense" for additional details regarding our debt instruments.
Interest Rate Risk
We manage interest rate risk based on the varying circumstances of anticipated borrowings and existing variable and fixed rate debt, including our revolving line of credit. Examples of interest rate management strategies include capping interest rates using targeted interest cost benchmarks, hedging portions of the total amount of debt, hedging a period of months and not always hedging to maturity, and at other times locking in rates to fix interests costs.
Our objectives in using interest rate derivatives are to add stability to interest expense and to manage our exposure to interest rate movements. To accomplish this objective, we primarily use interest rate swaps as part of our interest rate risk management strategy. Interest rate swaps designated as cash flow hedges in accordance with the authoritative guidance for derivative and hedge accounting involve the receipt of variable-rate amounts from a counterparty in exchange for us making fixed-rate payments over the life of the agreements without exchange of the underlying notional amount.
As discussed above, our variable rate financing arrangements subject us to interest rate risk. If the benchmark LIBOR interest rate were to increase by 50 basis points this would have no impact on the interest payments on our variable rate facilities or payments made on our interest rate swap contracts. An increase of 50 basis points on LIBOR interest rates would not have placed rates above the floor for our variable rate facilities or our interest rate contracts. As of December 25, 2016, a 50 basis point decrease in the benchmark LIBOR interest rate would have decreased the fair value of our interest rate swap assets by $10.3 million.
As discussed in more detail in Note 18 to the Financial Statements, on February 3, 2017, the Company amended it credit agreement which significantly changed our debt profile and associated risk.
Foreign Currency Risk
Certain parts of our foreign operations in Canada expose us to fluctuations in foreign exchange rates. Our goal is to reduce our exposure to such foreign exchange risks on our foreign currency cash flows and fair value fluctuations on recognized foreign currency denominated assets, liabilities and unrecognized firm commitments to acceptable levels primarily through the use of foreign exchange-related derivative financial instruments. We enter into derivative financial instruments to protect the value or fix the amount of certain obligations in terms of our functional currency. As of December 25, 2016, a 10% appreciation in the U.S. dollar relative to the Canadian dollar would have decreased the fair value of our foreign exchange forward contracts by $1.0 million.
Commodity Price Risk
We purchase raw materials in quantities expected to be used in a reasonable period of time in the normal course of business. We generally enter into agreements for either spot market delivery or forward delivery. The prices paid in the forward delivery contracts are generally fixed, but may also be variable within a capped or collared price range. The outstanding purchase commitment for

59
these commodities at any point in time typically ranges from 6 to 12 months of anticipated requirements, depending on the commodity. These contracts are considered normal purchases and sales.
In addition, we may also purchase forward derivative contracts on certain commodities to manage the price risk associated with forecasted purchases of materials used in our manufacturing process. Although they are not speculative, generally these derivatives are not designated as hedges as they do not meet the authoritative guidance for derivative and hedge accounting. From time to time, we enter into commodity forward contracts to fix the price of diesel fuel, natural gas, soybean oil and other commodity purchases at a future delivery date. Changes in the fair value of derivatives not designated in hedging relationships are recorded directly in Cost of products sold in the Consolidated Statements of Operations.
As of December 25, 2016, the potential change in fair value of commodity derivative instruments, assuming a 10% adverse movement in the underlying commodity prices, would have resulted in an unrealized net loss of $1.7 million.
Although we may utilize forward purchase contracts and other instruments to mitigate the risks related to commodity price fluctuation, such strategies do not fully mitigate commodity price risk. Adverse movements in commodity prices over the terms of the contracts or instruments could decrease the economic benefits we derive from these strategies.

60
ITEM 8. FINANCIAL STATEMENTS
Financial statements begin on the following page

61
REPORT OF INDEPENDENT REGISTERED PUBLIC ACCOUNTING FIRM
To the Board of Directors and Shareholders of Pinnacle Foods Inc.Parsippany, New Jersey
We have audited the accompanying consolidated balance sheets of Pinnacle Foods Inc. and subsidiaries (the “Company”) as of December 25, 2016 and December 27, 2015, and the related consolidated statements of operations, comprehensive earnings, shareholders’ equity, and cash flows for each of the three years in the period ended December 25, 2016. Our audits also included the financial statement schedule listed in the Index at Item 15. These financial statements and financial statement schedule are the responsibility of the Company’s management. Our responsibility is to express an opinion on the financial statements and financial statement schedule based on our audits.
We conducted our audits in accordance with the standards of the Public Company Accounting Oversight Board (United States). Those standards require that we plan and perform the audit to obtain reasonable assurance about whether the financial statements are free of material misstatement. An audit includes examining, on a test basis, evidence supporting the amounts and disclosures in the financial statements. An audit also includes assessing the accounting principles used and significant estimates made by management, as well as evaluating the overall financial statement presentation. We believe that our audits provide a reasonable basis for our opinion.
In our opinion, such consolidated financial statements present fairly, in all material respects, the financial position of Pinnacle Foods Inc. and subsidiaries as of December 25, 2016 and December 27, 2015, and the results of their operations and their cash flows for each of the three years in the period ended December 25, 2016, in conformity with accounting principles generally accepted in the United States of America. Also, in our opinion, such financial statement schedule, when considered in relation to the basic consolidated financial statements taken as a whole, presents fairly, in all material respects, the information set forth therein.
We have also audited, in accordance with the standards of the Public Company Accounting Oversight Board (United States), the Company’s internal control over financial reporting as of December 25, 2016, based on the criteria established in Internal Control- Integrated Framework (2013) issued by the Committee of Sponsoring Organizations of the Treadway Commission and our report dated February 23, 2017 expressed an unqualified opinion on the Company’s internal control over financial reporting.
/s/ Deloitte & Touche LLP Parsippany, New Jersey February 23, 2017

62
REPORT OF INDEPENDENT REGISTERED PUBLIC ACCOUNTING FIRM
To the Board of Directors and Shareholders of Pinnacle Foods Inc.Parsippany, New Jersey
We have audited the internal control over financial reporting of Pinnacle Foods Inc. and subsidiaries (the “Company”) as of December 25, 2016, based on criteria established in Internal Control-Integrated Framework (2013) issued by the Committee of Sponsoring Organizations of the Treadway Commission. The Company’s management is responsible for maintaining effective internal control over financial reporting and for its assessment of the effectiveness of internal control over financial reporting, included in Management’s Annual Report on Internal Control over Financial Reporting. Our responsibility is to express an opinion on the Company’s internal control over financial reporting based on our audit.
We conducted our audit in accordance with the standards of the Public Company Accounting Oversight Board (United States). Those standards require that we plan and perform the audit to obtain reasonable assurance about whether effective internal control over financial reporting was maintained in all material respects. Our audit included obtaining an understanding of internal control over financial reporting, assessing the risk that a material weakness exists, testing and evaluating the design and operating effectiveness of internal control based on the assessed risk, and performing such other procedures as we considered necessary in the circumstances. We believe that our audit provides a reasonable basis for our opinion.
A company’s internal control over financial reporting is a process designed by, or under the supervision of, the company’s principal executive and principal financial officers, or persons performing similar functions, and effected by the company’s board of directors, management, and other personnel to provide reasonable assurance regarding the reliability of financial reporting and the preparation of financial statements for external purposes in accordance with generally accepted accounting principles. A company’s internal control over financial reporting includes those policies and procedures that (1) pertain to the maintenance of records that, in reasonable detail, accurately and fairly reflect the transactions and dispositions of the assets of the company; (2) provide reasonable assurance that transactions are recorded as necessary to permit preparation of financial statements in accordance with generally accepted accounting principles, and that receipts and expenditures of the company are being made only in accordance with authorizations of management and directors of the company; and (3) provide reasonable assurance regarding prevention or timely detection of unauthorized acquisition, use, or disposition of the company’s assets that could have a material effect on the financial statements.
Because of the inherent limitations of internal control over financial reporting, including the possibility of collusion or improper management override of controls, material misstatements due to error or fraud may not be prevented or detected on a timely basis. Also, projections of any evaluation of the effectiveness of the internal control over financial reporting to future periods are subject to the risk that the controls may become inadequate because of changes in conditions, or that the degree of compliance with the policies or procedures may deteriorate.
In our opinion, the Company maintained, in all material respects, effective internal control over financial reporting as of December 25, 2016, based on the criteria established in Internal Control-Integrated Framework (2013) issued by the Committee of Sponsoring Organizations of the Treadway Commission.
We have also audited, in accordance with the standards of the Public Company Accounting Oversight Board (United States), the consolidated financial statements and financial statement schedule as of and for the year ended December 25, 2016 of the Company and our report dated February 23, 2017 expressed an unqualified opinion on those financial statements.
/s/ Deloitte & Touche LLP Parsippany, New Jersey February 23, 2017

63
PINNACLE FOODS INC. AND SUBSIDIARIESCONSOLIDATED STATEMENTS OF OPERATIONS(thousands, except per share amounts)
Fiscal year
December 25,
2016December 27,
2015December 28,
201452 weeks 52 weeks 52 weeks
Net sales $ 3,127,938 $ 2,655,792 $ 2,591,183Cost of products sold 2,211,864 1,915,286 1,909,985
Gross profit 916,074 740,506 681,198
Marketing and selling expenses 218,260 176,702 177,372Administrative expenses 163,056 107,004 117,275Research and development expenses 18,113 12,992 11,281Tradename impairment charges 11,200 — —Termination fee received, net of costs, associatedwith the Hillshire merger agreement — — (152,982)Other expense (income), net 25,800 19,106 15,981
436,429 315,804 168,927Earnings before interest and taxes 479,645 424,702 512,271
Interest expense 139,243 88,513 96,174Interest income 145 198 121
Earnings before income taxes 340,547 336,387 416,218Provision for income taxes 129,430 123,879 167,800Net earnings $ 211,117 $ 212,508 $ 248,418
Net earnings per share:Basic $ 1.81 $ 1.83 $ 2.15Weighted average shares outstanding- basic 116,872 116,032 115,698Diluted $ 1.79 $ 1.81 $ 2.13Weighted average shares outstanding- diluted 118,161 117,323 116,885Dividends declared $ 1.08 $ 0.98 $ 0.89
See accompanying Notes to Consolidated Financial Statements

64
PINNACLE FOODS INC. AND SUBSIDIARIESCONSOLIDATED STATEMENTS OF COMPREHENSIVE EARNINGS(thousands)
Fiscal year
December 25, 2016 December 27, 2015 December 28, 201452 Weeks 52 Weeks 52 Weeks
Pre-taxamount
Tax(expense)
benefitAfter-taxamount
Pre-taxamount
Tax(expense)
benefitAfter-taxamount
Pre-taxamount
Tax(expense)
benefitAfter-taxamount
Net earnings $ 211,117 $ 212,508 $ 248,418Other comprehensive earnings(loss)
Foreign currency translation:Foreign currency translationadjustments 2,429 — 2,429 (4,364) — (4,364) (2,588) 1,000 (1,588)
Cash-flow hedges:Unrealized gains (losses)arising during the period (6,573) 2,496 (4,077) (22,078) 8,519 (13,559) (24,841) 9,538 (15,303)Reclassification adjustmentfor (gains) losses included innet earnings 8,219 (3,144) 5,075 526 (323) 203 (625) 471 (154)
Pension:Net actuarial gain (loss)arising during the period 6,023 (2,295) 3,728 (7,305) 2,763 (4,542) (21,347) 8,114 (13,233)Reclassification of netactuarial loss included in netearnings 1,071 (407) 664 981 (373) 608 67 (26) 41
Other comprehensive earnings(loss) 11,169 (3,350) 7,819 (32,240) 10,586 (21,654) (49,334) 19,097 (30,237)Total comprehensive earnings $ 218,936 $ 190,854 $ 218,181
See accompanying Notes to Consolidated Financial Statements

65
PINNACLE FOODS INC. AND SUBSIDIARIESCONSOLIDATED BALANCE SHEETS(thousands, except share and per share amounts)
December 25,2016
December 27,2015
Current assets:Cash and cash equivalents $ 353,076 $ 180,549Accounts receivable, net of allowances of $12,335 and $7,902, respectively 289,582 219,736Inventories 445,491 403,101Other current assets 10,687 13,677Deferred tax assets 51,679 40,571
Total current assets 1,150,515 857,634Plant assets, net of accumulated depreciation of $491,397 and $408,294,respectively 723,345 631,109Tradenames 2,529,558 2,001,048Other assets, net 173,071 120,364Goodwill 2,163,156 1,714,008
Total assets $ 6,739,645 $ 5,324,163
Current liabilities:Short-term borrowings $ 2,389 $ 2,225Current portion of long-term obligations 23,801 14,847Accounts payable 292,478 211,039Accrued trade marketing expense 51,054 46,228Accrued liabilities 166,741 100,510Dividends payable 35,233 30,798
Total current liabilities 571,696 405,647Long-term debt 3,140,496 2,257,012Pension and other postretirement benefits 56,323 63,454Other long-term liabilities 47,529 54,506Deferred tax liabilities 974,659 738,015
Total liabilities 4,790,703 3,518,634Commitments and contingencies (Note 13)Shareholders' equity:
Pinnacle preferred stock: $.01 per share, 50,000,000 shares authorized, noneissued — —Pinnacle common stock: par value $.01 per share, 500,000,000 sharesauthorized; issued 119,127,269 and 117,619,695, respectively 1,191 1,176Additional paid-in-capital 1,429,447 1,378,521Retained earnings 601,049 517,330Accumulated other comprehensive loss (51,569) (59,388)Capital stock in treasury, at cost, 1,000,000 common shares (32,110) (32,110)
Total Pinnacle Foods Inc. and Subsidiaries shareholders' equity 1,948,008 1,805,529Noncontrolling interest 934 —
Total Equity 1,948,942 1,805,529Total liabilities and shareholders' equity $ 6,739,645 $ 5,324,163
See accompanying Notes to Consolidated Financial Statements

66
PINNACLE FOODS INC. AND SUBSIDIARIESCONSOLIDATED STATEMENTS OF CASH FLOWS(thousands)
Fiscal year
December 25,
2016December 27,
2015December 28,
201452 weeks 52 weeks 52 weeks
Cash flows from operating activitiesNet earnings $ 211,117 $ 212,508 $ 248,418Non-cash charges (credits) to net earnings
Depreciation and amortization 105,772 89,660 80,627Tradename impairment charge 11,200 — —Charges resulting from the wind down of Boulder Brands United Kingdom operations 4,265 — —Amortization of debt acquisition costs and discounts 9,554 6,353 6,507Refinancing costs and write off of debt issuance costs 600 — 1,879Change in value of financial instruments (12,511) (1,942) 12,537Equity based compensation expense 14,016 15,122 35,951Pension expense, net of contributions (37) (4,700) (9,300)Gain on sale of assets held for sale — — (1,541)Other long-term liabilities (3,007) 4,506 1,962Other long-term assets (283) — —Foreign exchange (gains) losses (486) 4,731 2,620Excess tax benefits on equity-based compensation (11,577) (1,442) (905)Deferred income taxes 48,182 115,584 159,537
Changes in working capitalAccounts receivable (29,417) (30,882) (21,630)Inventories 23,530 (49,210) 21,557Accrued trade marketing expense 4,771 10,534 (516)Accounts payable 61,016 15,050 24,910Accrued liabilities 36,443 (6,609) (10,620)Other current assets 14,356 (6,352) (1,283)
Net cash provided by operating activities 487,504 372,911 550,710Cash flows from investing activities
Business acquisition activity (985,365) 1,102 (169,373)Capital expenditures (101,050) (108,477) (102,967)Proceeds from sale of plant assets — 1,618 2,328
Net cash used in investing activities (1,086,415) (105,757) (270,012)Cash flows from financing activities
Net proceeds from issuance of common stock 26,436 1,231 489Dividends paid (122,850) (111,758) (101,606)Proceeds from bank term loans 547,250 — —Proceeds from notes offerings 350,000 — —Repayments of long-term obligations (13,741) (8,870) (219,967)Proceeds from short-term borrowings 4,452 4,261 4,757Repayments of short-term borrowings (4,259) (4,480) (4,799)Borrowings under revolving credit facility — — 65,000Repayments of revolving credit facility — — (65,000)Repayment of capital lease obligations (3,950) (3,585) (2,373)Purchase of stock for treasury — — (32,110)Excess tax benefits on stock-based compensation 11,577 1,442 905Taxes paid related to net share settlement of equity awards (1,087) (2,401) (3,061)Debt acquisition costs (22,564) — (258)
Net cash provided by (used in) by financing activities 771,264 (124,160) (358,023)Effect of exchange rate changes on cash 174 (922) (937)Net change in cash and cash equivalents 172,527 142,072 (78,262)Cash and cash equivalents - beginning of period 180,549 38,477 116,739Cash and cash equivalents - end of period $ 353,076 $ 180,549 $ 38,477Supplemental disclosures of cash flow information:Interest paid $ 109,029 $ 78,926 $ 88,783Interest received 145 198 121Income taxes paid 31,645 18,885 7,802Non-cash investing and financing activities:
New capital leases 18,014 — 1,288Note payable issued in connection with acquisitions — — 14,850Dividends payable 35,233 30,798 27,847Accrued additions to plant assets 27,183 23,878 25,763
See accompanying Notes to Consolidated Financial Statements

67
PIN
NA
CL
E F
OO
DS
INC
. AN
D S
UB
SID
IAR
IES
CO
NSO
LID
ATE
D S
TAT
EM
EN
TS
OF
SHA
RE
HO
LD
ER
S' E
QU
ITY
(thou
sand
s, ex
cept
shar
e an
d pe
r sha
re a
mou
nts)
Com
mon
Sto
ckTr
easu
ry S
tock
Add
ition
alPa
id In
Cap
ital
Ret
aine
dea
rnin
gs
Acc
umul
ated
Oth
erC
ompr
ehen
sive
Loss
Tota
lSh
areh
olde
rs'
Equi
ty
Non
-C
ontro
lling
Inte
rest
Tota
l Equ
itySh
ares
Am
ount
Shar
esA
mou
ntB
alan
ce, D
ecem
ber 2
9 20
1311
7,23
1,85
3$
1,17
2—
$—
$1,
328,
847
$27
5,51
9$
(7,4
97)
$1,
598,
041
$—
$1,
598,
041
Equi
ty c
ontri
butio
ns:
Equi
ty b
ased
com
pens
atio
n pl
ans
61,8
921
34,2
8234
,283
34,2
83Tr
easu
ry st
ock
purc
hase
d(1
,000
,000
)(3
2,11
0)(3
2,11
0 )(3
2,11
0 )D
ivid
ends
($0.
89 p
er sh
are)
(1)
(104
,406
)(1
04,4
06)
(104
,406
)C
ompr
ehen
sive
ear
ning
s24
8,41
8(3
0,23
7)21
8,18
121
8,18
1B
alan
ce, D
ecem
ber 2
8, 2
014
117,
293,
745
$1,
173
(1,0
00,0
00)
$(3
2,11
0)$
1,36
3,12
9$
419,
531
$(3
7,73
4)$
1,71
3,98
9$
—$
1,71
3,98
9
Equi
ty c
ontri
butio
ns:
Equi
ty b
ased
com
pens
atio
n pl
ans
325,
950
315
,392
15,3
9515
,395
Div
iden
ds ($
0.98
per
shar
e)(2
)(1
14,7
09)
(114
,709
)(1
14,7
09)
Com
preh
ensi
ve e
arni
ngs
212,
508
(21,
654)
190,
854
190,
854
Bal
ance
, Dec
embe
r 27,
201
511
7,61
9,69
5$
1,17
6(1
,000
,000
)$
(32,
110)
$1,
378,
521
$51
7,33
0$
(59,
388)
$1,
805,
529
$—
$1,
805,
529
Equi
ty c
ontri
butio
ns:
Equi
ty b
ased
com
pens
atio
n pl
ans
1,50
7,57
415
50,9
2650
,941
50,9
41D
ivid
ends
($1.
08 p
er sh
are)
(3)
(127
,398
)(1
27,3
98)
(127
,398
)N
on-c
ontro
lling
inte
rest
inac
quis
ition
934
934
Com
preh
ensi
ve e
arni
ngs
211,
117
7,81
921
8,93
621
8,93
6B
alan
ce, D
ecem
ber 2
5, 2
016
119,
127,
269
$1,
191
(1,0
00,0
00)
$(3
2,11
0)$
1,42
9,44
7$
601,
049
$(5
1,56
9)$
1,94
8,00
8$
934
$1,
948,
942
See
acco
mpa
nyin
g N
otes
to C
onso
lidat
ed F
inan
cial
Sta
tem
ents
(1)
$0.2
1 pe
r sha
re d
ecla
red
Febr
uary
201
4 an
d M
ay 2
014,
$0.
235
per s
hare
dec
lare
d A
ugus
t 201
4 an
d D
ecem
ber 2
014.
(2)
$0.2
35 p
er sh
are
decl
ared
Feb
ruar
y 20
15 a
nd Ju
ne 2
015,
$0.
255
per s
hare
dec
lare
d Se
ptem
ber 2
015
and
Dec
embe
r 201
5.(3
) $0
.255
per
shar
e de
clar
ed F
ebru
ary
2016
and
June
201
6, $
0.28
5 pe
r sha
re d
ecla
red
Aug
ust 2
016
and
Dec
embe
r 201
6.
PINNACLE FOODS INC. AND SUBSIDIARIESNOTES TO CONSOLIDATED FINANCIAL STATEMENTS(thousands, except share and per share amounts and where noted in millions)
68
1. Summary of Business Activities
Business OverviewPinnacle Foods Inc. ("Pinnacle" or the "Company") is a leading manufacturer, marketer and distributor of high quality, branded convenience food products, the products and operations of which are managed and reported in four operating segments: (i) Frozen, (ii) Grocery, (iii) Boulder and (iv) Specialty. During the fourth quarter of fiscal 2016, the Company reorganized its reporting structure in a manner that resulted in the above four reportable segments. Refer to Note 14, Segments, for additional information and selected financial information.
The Frozen segment is comprised of the retail businesses of the Company's legacy frozen brands, including vegetables (Birds Eye), complete bagged meals (Birds Eye Voila! and Birds Eye Signature Skillets), full-calorie single-serve frozen dinners and entrées (Hungry-Man), prepared seafood (Van de Kamp's and Mrs. Paul's), pancakes / waffles / French Toast (Aunt Jemima), frozen and refrigerated bagels (Lender's) and pizza for one (Celeste). The Frozen segment also includes all of the Company’s business in Canada. The Grocery segment is comprised of the retail businesses of the Company's grocery brands, including cake/brownie mixes and frostings (Duncan Hines), shelf-stable pickles (Vlasic), salad dressings (Wish-Bone, Western and Bernstein’s), table syrups (Log Cabin and Mrs. Butterworth's), refrigerated and shelf-stable spreads (Smart Balance), canned meat (Armour, Nalley and Brooks), pie and pastry fillings (Duncan Hines Comstock and Wilderness), and barbecue sauces (Open Pit). The Boulder segment is comprised of the retail businesses of the Company's health and wellness lifestyle brands including gluten-free products (Udi's and Glutino), natural frozen meal offerings (EVOL), plant-based refrigerated and shelf-stable spreads (Earth Balance) and plant-based protein frozen products (gardein). The Specialty Foods segment includes the Company’s snack products (Tim's Cascadeand Snyder of Berlin) and all of its U.S. foodservice and private label businesses, including those of the Garden Protein International and Boulder Brands acquisitions.
History and Current Ownership
On April 2, 2007, the Company was acquired by, and became a wholly owned subsidiary of Peak Holdings LLC ("Peak Holdings"), an entity controlled by investment funds affiliated with The Blackstone Group L.P ("Blackstone"). We refer to this merger transaction and related financing transactions as the Blackstone Transaction. As a result of the Blackstone Transaction, Blackstone owned, through Peak Holdings, approximately 98% of the common stock of the Company.
As of the launch of our initial public offering on April 3, 2013 (the “IPO”), we were controlled by Blackstone. Effective September 12, 2014, as a result of Blackstone’s reduced ownership in the Company, we no longer qualified as a “controlled company” under applicable New York Stock Exchange listing standards. On November 21, 2014, Blackstone sold additional shares, in an underwritten public offering. Blackstone's reduced ownership level after the transaction resulted in a liquidity event. This caused the immediate vesting of approximately 1.1 million non-vested shares and 0.2 million equity options and the recognition of approximately $23.7 million of equity based compensation expense (the "Liquidity event"). On May 8, 2015, Blackstone sold their final 5,000,000 shares in an underwritten public offering. Upon completion of the offering, Blackstone no longer beneficially owned any of the Company's outstanding common stock.

PINNACLE FOODS INC. AND SUBSIDIARIESNOTES TO CONSOLIDATED FINANCIAL STATEMENTS(thousands, except share and per share amounts and where noted in millions)
69
2. Summary of Significant Accounting Policies
Consolidation. The Consolidated Financial Statements include the accounts of Pinnacle and its subsidiaries. The results of companies acquired during the year are included in the Consolidated Financial Statements from the effective date of the acquisition. Intercompany transactions have been eliminated in consolidation.
Foreign Currency Translation. Foreign-currency-denominated assets and liabilities are translated into U.S. dollars at exchange rates existing at the respective balance sheet dates. Translation adjustments resulting from fluctuations in exchange rates are recorded as a separate component of Accumulated other comprehensive loss within shareholders' equity. The Company translates the results of operations of its foreign subsidiaries at the average exchange rates during the respective periods. Gains and losses resulting from foreign currency transactions are normally included in Cost of products sold on the Consolidated Statements of Operations and include the mark to market and realized gains and losses on our foreign currency swaps as discussed in Note 12to our Consolidated Financial Statements. Additionally, the Company recorded a $0.5 million foreign exchange gain and a $4.7million foreign exchange loss in the fiscal years ended December 25, 2016 and December 27, 2015, respectively. These amounts represent foreign exchange losses from intra-entity loans resulting from the Garden Protein acquisition that are anticipated to be settled in the foreseeable future and are recorded in Other expense (income), net on the Consolidated Statements of Operations.
Fiscal Year. The Company's fiscal year ends on the last Sunday in December.
Cash and Cash Equivalents. The Company considers investments in all highly liquid instruments with an initial maturity of three months or less to be cash equivalents. Cash equivalents are measured at fair value and are Level 1 assets.
Inventories. Substantially all inventories are valued at the lower of average cost or net realizable value. The type of costs included in inventory are ingredients, containers, packaging, other raw materials, direct manufacturing labor and fully absorbed manufacturing overheads. When necessary, the Company adjusts the carrying value of its inventories to the lower of cost or net realizable value, including any costs to sell or dispose and consideration for obsolescence, excessive inventory levels, product deterioration and other factors in evaluating net realizable value.
Plant Assets. Plant assets are stated at historical cost, and depreciation is computed using the straight-line method over the lives of the assets. Buildings and machinery and equipment are depreciated over periods not exceeding 45 years and 15 years, respectively. The weighted average estimated remaining useful lives are approximately 15 years for buildings and 8 years for machinery and equipment. When assets are retired, sold, or otherwise disposed of, their gross carrying value and related accumulated depreciation are removed from the accounts and included in determining gain or loss on such disposals. Costs of assets acquired in a business combination are based on the estimated fair value at the date of acquisition.
Goodwill and Indefinite-lived Intangible Assets. The Company evaluates the carrying amount of goodwill and indefinite-lived tradenames for impairment on at least an annual basis and when events occur or circumstances change that an impairment might exist. The Company performs goodwill impairment testing for each business which constitutes a component of the Company's operating segments, known as reporting units. The Company performs quantitative testing by calculating the fair value of each reporting unit. The Company compares the fair value of these reporting units with their carrying values inclusive of goodwill. If the carrying amount of the reporting unit exceeds its fair value, the Company compares the implied fair value of the reporting unit's goodwill to its carrying amount and any shortfall is charged to earnings. In estimating the implied fair value of the goodwill, the Company estimates the fair value of the reporting unit's tangible and intangible assets (other than goodwill). In estimating the fair value of its reporting units, the Company primarily uses the income approach, which utilizes forecasted discounted cash flows to estimate the fair value for each reporting unit. The income approach utilizes management's business plans and projections as the basis for expected future cash flows for five years plus a terminal year. It requires significant assumptions including projected sales growth rates and operating margins and the weighted average cost of capital. In the most recent impairment tests, the Company forecasted cash flows for five years plus a terminal year and assumed a weighted average cost of capital of 6.25%. These projections assume sales growth rates for the next five years and the terminal year that generally average between 1.0% and 3.0% and operating margins which increase moderately from historical levels over time as a result of planned capital improvements in the Company's plants and manufacturing efficiency projects. These assumptions are determined based upon management's expectations for each of the individual reporting units.
For indefinite-lived tradename intangible assets, the Company determines recoverability by comparing the carrying value to its fair value estimated based on discounted cash flows attributable to the tradename and charges the shortfall, if any, to earnings. In estimating the fair value of trade names, the Company primarily uses the relief from royalty method. The relief from royalty

PINNACLE FOODS INC. AND SUBSIDIARIESNOTES TO CONSOLIDATED FINANCIAL STATEMENTS(thousands, except share and per share amounts and where noted in millions)
70
method involves discounted net sales, which require management to make significant assumptions regarding the weighted average cost of capital, sales growth trends and representative royalty rates.
Assumptions underlying fair value estimates referred to above are subject to risks and uncertainties. These measurements are considered level 3 under the fair value hierarchy as described in Note 4 to the Consolidated Financial Statements. For more information on goodwill and indefinite-lived intangible assets, please refer to Note 9 to the Consolidated Financial Statements.
Valuation of Long-Lived Assets. The carrying value of long-lived assets held and used, other than goodwill and indefinite-lived intangibles, is evaluated at the asset group level when events or changes in circumstances indicate the carrying value may not be recoverable. The carrying value of a long-lived asset group is considered impaired when the total projected undiscounted cash flows from such asset group are less than the carrying value. In that event, a loss is recognized based on the amount by which the carrying value exceeds the fair market value of the long-lived asset group. Fair market value is determined primarily using the projected cash flows from the asset group discounted at a rate commensurate with the risk involved. Losses on long-lived asset groups held for sale, other than goodwill, are determined in a similar manner, except that fair market values are reduced for disposal costs.
Revenue Recognition and Trade Marketing. Revenue from product sales is recognized upon shipment to the customers as terms are free on board ("FOB") shipping point, at which point title and risk of loss is transferred and the selling price is fixed or determinable. This completes the revenue-earning process specifically that an arrangement exists, delivery has occurred, ownership has transferred, the price is fixed and collectability is reasonably assured. A provision for payment discounts and product return allowances, which is estimated based upon the Company's historical performance, management's experience and current economic trends, is recorded as a reduction of sales in the same period that the revenue is recognized.
Trade promotions, consisting primarily of customer pricing allowances and merchandising funds, and consumer coupons are offered through various programs to customers and consumers. Sales are recorded net of estimated trade promotion spending, which is recognized as incurred at the time of sale. Certain retailers require the payment of slotting fees in order to obtain space for the Company's products on the retailer's store shelves. The fees are recognized as reductions of revenue on the date a liability to the retailer is created. These amounts are included in the determination of net sales. Accruals for expected payouts under these programs are included as accrued trade marketing expense in the Consolidated Balance Sheet. Coupon redemption costs are also recognized as reductions of net sales when the coupons are issued. Estimates of trade promotion expense and coupon redemption costs are based upon programs offered, timing of those offers, estimated redemption/usage rates from historical performance, management's experience and current economic trends.
Trade marketing expense is comprised of amounts paid to retailers for programs designed to promote our products. These costs include standard introductory allowances for new products (slotting fees). They also include the cost of in-store product displays, feature pricing in retailers' advertisements and other temporary price reductions. These programs are offered to our customers both in fixed and variable (rate per case) amounts. The ultimate cost of these programs depends on retailer performance and is the subject of significant management estimates. The Company records as expense the estimated ultimate cost of the program in the period during which the program occurs. In accordance with the authoritative guidance for revenue recognition, these trade marketing expenses are classified in the Consolidated Statements of Operations as a reduction of net sales. Also, in accordance with the guidance, coupon redemption costs are also recognized as reductions of net sales when issued.
Advertising. Advertising costs include the cost of working media (advertising on television, radio or in print), the cost of producing advertising, and the cost of coupon insertion and distribution. Working media and coupon insertion and distribution costs are expensed in the period the advertising is run or the coupons are distributed. The cost of producing advertising is expensed as of the first date the advertisement takes place. Advertising included in the Company's marketing and selling expenses were $33.0million for fiscal year ended December 25, 2016, $28.2 million for fiscal year ended December 27, 2015 and $35.9 million for fiscal year ended December 28, 2014.
Shipping and Handling Costs. In accordance with the authoritative guidance for revenue recognition, costs related to shipping and handling of products shipped to customers are classified as Cost of products sold.
Pension benefits. The Company had provided pension benefits to certain employees and retirees. Pension benefits are no longer offered to salaried employees. All pension plans are frozen for future benefits. Determining the cost associated with such benefits is dependent on various actuarial assumptions, including discount rates, expected return on plan assets and mortality rates. Independent actuaries, in accordance with Generally Accepted Accounting Principles in the United States of America ("U.S.

PINNACLE FOODS INC. AND SUBSIDIARIESNOTES TO CONSOLIDATED FINANCIAL STATEMENTS(thousands, except share and per share amounts and where noted in millions)
71
GAAP"), perform the required calculations to determine pension expense. Actual results that differ from the actuarial assumptions are generally accumulated and amortized over future periods.
Equity Based Compensation expense. Grant-date fair value of performance share units ("PSU's") and performance shares ("PS's") are estimated using a Monte Carlo simulation. Grant-date fair value of stock options are estimated using the Black-Scholes option-pricing model, which includes using the simplified method to estimate the number of periods to exercise date. While we had equity compensation plans in place as a private company, our broader post-IPO equity compensation plans have not been in place for a sufficient amount of time to understand their post vesting behavior. As such, we will continue to use this methodology until such time we have sufficient history to provide a reasonable basis on which to estimate the expected term. Compensation expense is reduced based on estimated forfeitures with adjustments to actual expense recorded at the time of vesting. Forfeitures are estimated based on historical experience. The majority of our equity options have a three-year vesting period. For those awards that have a performance condition, compensation expense is based upon the number of shares expected to vest after assessing the probability that the performance criteria will be met. We recognize compensation cost for awards over the vesting period, adjusted for any changes in our probability assessment.
Insurance reserves. The Company is self-insured under its worker's compensation insurance policy. The Company utilizes a stop loss policy issued by an insurance company to fund claims in excess of $350. The Company estimates the outstanding retained-insurance liabilities by projecting incurred losses to their ultimate liability and subtracting amounts paid-to-date to obtain the remaining liabilities. The Company bases actuarial estimates of ultimate liability on actual incurred losses, estimates of incurred but not yet reported losses and the projected costs to resolve these losses.
Income Taxes. Income taxes are accounted for in accordance with the authoritative guidance for accounting for income taxes under which deferred tax assets and liabilities are determined based on the difference between the financial statement and tax bases of assets and liabilities, using enacted tax rates in effect for the year in which the differences are expected to reverse. The Company continually reviews its deferred tax assets for recovery. A valuation allowance is established when the Company believes that it is more likely than not that some portion of its deferred tax assets will not be realized. Changes in valuation allowances from period to period are included in the Company's tax provision in the period of change.
Financial Instruments. The Company uses financial instruments to manage its exposure to movements in interest rates, foreign currencies and certain commodity prices. The use of these financial instruments modifies the exposure of these risks with the intent to reduce the risk or cost to the Company. The Company does not use derivatives for trading purposes and is not a party to leveraged derivatives. The authoritative guidance for derivative and hedge accounting requires that all derivatives be recognized as either assets or liabilities at fair value. Changes in the fair value of derivatives not designated as hedging instruments are recognized in earnings. The cash flows associated with the financial instruments are included in the cash flow from operating activities.
Deferred financing costs. Deferred financing costs are amortized over the life of the related debt using the effective interest rate method. If debt is prepaid or retired early, the related unamortized deferred financing costs are written off in the period the debt is retired.
Capitalized Internal Use Software Costs. The Company capitalizes the cost of internal-use software that has a useful life in excess of one year. These costs consist of payments made to third parties and the salaries of employees working on such software development. Subsequent additions, modifications or upgrades to internal-use software are capitalized only to the extent that they allow the software to perform a task it previously did not perform. Capitalized internal use software costs are amortized using the straight-line method over their estimated useful lives, generally 2 ½ to 3 years. The Company amortized $10.4 million for fiscal year ended December 25, 2016, $9.6 million for fiscal year ended December 27, 2015 and $7.7 million for fiscal year ended December 28, 2014. Additionally, as of December 25, 2016 and December 27, 2015, the net book value of capitalized internal use software totaled $25.1 million and $19.1 million, respectively and is included in Plant assets, net on the Consolidated Balance Sheets.
Accumulated other comprehensive loss ("AOCL"). Accumulated other comprehensive loss includes loss on financial instruments, foreign currency translation adjustments, net gains or (losses) on pension actuarial assumptions and the related tax provisions or benefits that are currently presented as a component of shareholder's equity. For more information on accumulated other comprehensive loss, please refer to Note 6 to the Consolidated Financial Statements

PINNACLE FOODS INC. AND SUBSIDIARIESNOTES TO CONSOLIDATED FINANCIAL STATEMENTS(thousands, except share and per share amounts and where noted in millions)
72
Use of Estimates. The preparation of financial statements in conformity with U.S. GAAP requires management to make estimates and assumptions that affect amounts reported in the financial statements and accompanying notes. Actual results could differ from those estimates.

PINNACLE FOODS INC. AND SUBSIDIARIESNOTES TO CONSOLIDATED FINANCIAL STATEMENTS(thousands, except share and per share amounts and where noted in millions)
73
Recently Adopted Accounting
In 2016, the Company changed the presentation of debt issuance costs in line with the guidance set forth by Accounting Standards Update ("ASU") No. 2015-03 "Simplifying the Presentation of Debt Issuance Costs". The Company now presents such costs in the balance sheet as a direct deduction from the related debt liability, rather than as an asset. Amortization of the costs continue to be reported as interest expense. The changes in presentation were applied retrospectively to all periods presented.
In September 2015, the FASB issued ASU No. 2015-16, “Simplifying the Accounting for Measurement-Period Adjustments”. The new guidance eliminates the requirement to retrospectively account for adjustments to provisional amounts recognized in a business combination. Under the ASU, the adjustments to the provisional amounts will be recognized in the reporting period in which the adjustment amounts are determined. The Company has implemented this guidance in 2016 without material effect on the consolidated financial statements.
Recently Issued Accounting Pronouncements
In May 2014, the FASB issued guidance based on the principle that revenue is recognized in an amount expected to be collected and to which the entity expects to be entitled in exchange for the transfer of goods or services. As originally issued, this guidance was effective for us beginning in fiscal year 2018. In August 2015, the FASB deferred the effective date by one year while providing the option to early adopt the standard on the original effective date. Accordingly, the Company will have the option to adopt the standard in either fiscal year 2018 or 2019. The guidance can be adopted either retrospectively or as a cumulative-effect adjustment as of the date of adoption. The Company is currently evaluating the impact that the new guidance will have on the consolidated financial statements, as well as which transition method it will use.
In March 2016, the FASB issued ASU No. 2016-09, "Improvements to Employee Share-Based Payment Accounting". The areas for simplification in this ASU involve several aspects of the accounting for share-based payment transactions, including the income tax consequences, classification of awards as either equity or liabilities, and classification on the statement of cash flows. The updated guidance will be effective for fiscal years beginning after December 15, 2016, and interim periods within those annual periods. Early application is permitted. The amendments related to the timing of when excess tax benefits are recognized are to be applied using a modified retrospective approach. The amendments related to the presentation of employee taxes paid on the statement of cash flows are to be applied retrospectively. The amendments requiring recognition of excess tax benefits and tax deficiencies in the income statement are to be applied prospectively. The Company is in the process of evaluating this guidance.
In February 2016, the FASB issued ASU No. 2016-02, “Leases”. The FASB is amending the FASB Accounting Standards Codification ("ASC") and creating Topic 842, Leases, which will supersede Topic 840, Leases. The main difference between previous GAAP and Topic 842 is the recognition of lease assets and lease liabilities by lessees for those leases classified as operating leases under previous GAAP. Under the new guidance, lessees will be required to recognize the assets and liabilities arising from leases on the balance sheet. The updated guidance will be effective for fiscal years beginning after December 15, 2018, including interim periods within those fiscal years. Early application is permitted. In transition to the new guidance, entities are required to recognize and measure leases at the beginning of the earliest period presented using a modified retrospective approach. The Company is in the process of evaluating this guidance.
In November 2015, the FASB issued ASU No. 2015-17, “Balance Sheet Classification of Deferred Taxes”. The new guidance eliminates the requirement to separate deferred income tax liabilities and assets into current and noncurrent amounts. The amendments will require that deferred tax liabilities and assets be classified as noncurrent in a classified statement of financial position. The updated guidance will be effective for fiscal years beginning after December 15, 2016, including interim periods within those annual periods. Early adoption is permitted, and the amendments may be applied either prospectively to all deferred tax liabilities and assets or retrospectively to all periods presented. The Company is in the process of evaluating this
In July 2015, the FASB issued ASU No. 2015-11, "Simplifying the Measurement of Inventory", which requires entities to measure most inventory “at the lower of cost and net realizable value,” thereby simplifying the current guidance under which an entity must measure inventory at the lower of cost or market. The ASU will not apply to inventories that are measured by using either the last-in, first-out (LIFO) method or the retail inventory method (RIM). The updated guidance will be effective for annual reporting periods beginning after December 15, 2016, including interim periods within that reporting period. Early adoption is permitted.The Company is in the process of evaluating this guidance.

PINNACLE FOODS INC. AND SUBSIDIARIESNOTES TO CONSOLIDATED FINANCIAL STATEMENTS(thousands, except share and per share amounts and where noted in millions)
74
In January 2017, the FASB issued ASU 2017-04, “Intangibles - Goodwill and Other (Topic 350): Simplifying the Test for Goodwill Impairment,” which eliminates the requirement to determine the fair value of individual assets and liabilities of a reporting unit to measure goodwill impairment. Under the amendments in the new ASU, goodwill impairment testing will be performed by comparing the fair value of the reporting unit with its carrying amount and recognizing an impairment charge for the amount by which the carrying amount exceeds the reporting unit’s fair value. The new standard is effective for annual and interim goodwill impairment tests in fiscal years beginning after December 15, 2019, and should be applied on a prospective basis. Early adoption is permitted for annual or interim goodwill impairment testing performed after January 1, 2017. The Company is currently evaluating the impact of adopting this guidance.

PINNACLE FOODS INC. AND SUBSIDIARIESNOTES TO CONSOLIDATED FINANCIAL STATEMENTS(thousands, except share and per share amounts and where noted in millions)
75
3. Acquisitions
Acquisition of the Duncan Hines manufacturing business (the "Gilster acquisition")
On March 31, 2014, the Company acquired the Duncan Hines manufacturing business located in Centralia, Illinois, from Gilster Mary Lee Corporation (“Gilster”), the Company's primary co-packer of Duncan Hines products. The cost of the acquisition was $26.6 million, $11.7 million of which was paid in cash, with the balance due under a $14.9 million four-year note. For more information, see Note 10 to the Consolidated Financial Statements, Debt and Interest Expense. Goodwill, which is not subject to amortization, totaled $9.6 million (tax deductible goodwill of $7.5 million). The entire acquisition was allocated to the Grocery segment. Other operating costs of approximately $0.3 million incurred in connection with the transaction were expensed as incurred and recorded in Cost of products sold in the Consolidated Statements of Operations.
The following table summarizes the allocation of the total cost of the acquisition to the assets acquired and liabilities assumed:
Assets acquired: Inventories $ 10,188 Building and land 3,480 Plant assets 2,302 Deferred tax assets 1,278 Goodwill 9,550 Fair value of assets acquired 26,798Liabilities assumed: Accrued liabilities 178Total cost of acquisition $ 26,620
Unaudited pro forma revenue and net earnings related to the acquisition are not presented because the pro forma impact is not material.
Acquisition of Garden Protein (the "Garden Protein acquisition")
On November 14, 2014, the Company acquired Garden Protein International Inc., a Canadian corporation, the manufacturer of the plant-based protein brand gardein. The brand has a line of frozen products that serve as alternatives for traditional animal based protein formats such as chicken strips and tenders, ground beef and fish fillets.
The cost of the Garden Protein acquisition was $156.5 million, which included a first quarter 2015 post closing working capital adjustment that reduced the preliminary purchase price by $1.1 million. This adjustment to the purchase price allocation did not significantly impact previously reported amounts or results. The following table summarizes the allocation of the total cost of the acquisition to the assets acquired and liabilities assumed:

PINNACLE FOODS INC. AND SUBSIDIARIESNOTES TO CONSOLIDATED FINANCIAL STATEMENTS(thousands, except share and per share amounts and where noted in millions)
76
Assets acquired: Accounts receivable $ 5,226 Inventories 6,798 Prepaid expenses and other assets 572 Property and equipment 13,895 Tradenames 51,950 Distributor relationships 3,098 Private label customer relationships 1,328 Formulations 7,611 Goodwill 82,970 Fair value of assets acquired 173,448Liabilities assumed: Accounts payable and accrued liabilities 5,007 Income tax payable 7,878 Long term deferred tax liabilities 1,347 Other long-term liabilities 2,714Total cost of acquisition $ 156,502
Based upon the allocation, the value assigned to intangible assets and goodwill totaled $147.0 million at the valuation date. The goodwill was generated primarily as a result of expected synergies to be achieved in the acquisition. Distributor relationships and private label customer relationships are being amortized on an accelerated basis over 30 and 7 years, respectively. Formulations are being amortized on a straight line basis over 10 years. These useful lives are based on an attrition rate based on industry experience, which management believes is appropriate in the Company's circumstances. The Company has also assigned $51.9 million to the value of the tradename acquired, which is not subject to amortization but is reviewed annually for impairment. Goodwill, which is also not subject to amortization, totaled $83.0 million (tax deductible goodwill of $53.6 million will result from the acquisition). The entire acquisition was allocated to the Boulder segment. During the year ended December 28, 2014, the acquisition resulted in an additional $6.8 million of net sales and a net loss of $3.1 million, related to Garden Protein operations from November 14, 2014 to December 28, 2014, which included a $0.6 millioncharge related to the fair value step-up of inventories acquired and sold during 2014 and $3.1 million of transaction costs, primarily foreign exchange losses in addition to legal, accounting and other professional fees. The inventory-step up and transactions costs are recorded in Cost of products sold and Other expense (income), net in the Consolidated Statements of Operations, respectively.
The acquisition was financed through cash on hand and borrowings of $40.0 million under our revolving credit facility which were repaid in full as of December 28, 2014.
Unaudited pro forma revenue and net earnings related to the acquisition are not presented because the pro forma impact is not material.
Acquisition of Boulder Brands Inc. (the "Boulder Brands acquisition")
On January 15, 2016, the Company acquired 100% of the capital stock of Boulder Brands Inc. ("Boulder") which manufactures a portfolio of health and wellness brands, including Udi's and Glutino gluten-free products, EVOL natural frozen meal offerings, Smart Balance refrigerated and shelf-stable spreads and Earth Balance plant-based refrigerated and shelf-stable spreads. The Boulder Brands acquisition expands the Company's presence in growing and complementary health and wellness categories and in the natural and organic retail channels.
The cost of the Boulder Brands acquisition was $1,001.4 million, which included the repayment of debt. The following table summarizes the allocation of the total cost of the acquisition to the assets acquired and liabilities assumed:

PINNACLE FOODS INC. AND SUBSIDIARIESNOTES TO CONSOLIDATED FINANCIAL STATEMENTS(thousands, except share and per share amounts and where noted in millions)
77
Assets acquired: Cash $ 16,054 Accounts receivable 41,064 Inventories 66,893 Other current assets 12,043 Deferred tax assets 27,955 Property and equipment 59,405 Tradenames 539,600 Distributor relationships 40,600 Customer relationships 11,400 Other assets 12,298 Goodwill 445,954 Fair value of assets acquired 1,273,266Liabilities assumed: Accounts payable 16,022 Accrued liabilities 41,555 Capital lease obligations 7,486 Long term deferred tax liabilities 201,358 Other long-term liabilities 4,504 Non-controlling interest 922Total cost of acquisition $ 1,001,419
Based upon the allocation, the value assigned to intangible assets and goodwill totaled $1,037.7 million. The goodwill was generated primarily as a result of expected synergies to be achieved because of the Boulder Brands acquisition. Distributor relationships and customer relationships are being amortized on an accelerated basis over 30 and 10 years, respectively. These useful lives are based on an attrition rate based on industry experience, which management believes is appropriate in the Company's circumstances. The Company has also assigned $539.6 million to the value of the tradenames acquired, which is not subject to amortization but is reviewed annually for impairment. Goodwill, which is also not subject to amortization, totaled $446.0 million (tax deductible goodwill of $85.5 million resulted from the Boulder Brands acquisition). Goodwill was allocated to the Frozen, Grocery, Boulder, and Specialty segments, as is illustrated in Note 9 to the Consolidated Financial Statements.
During the year ended December 25, 2016, the Boulder Brands acquisition resulted in an additional $469.7 million of net sales and a net loss of $19.3 million, related to Boulder operations from January 15, 2016 to December 25, 2016, which included a $10.4 million charge related to the fair value step-up of inventories acquired and sold during the period, $19.2 million of restructuring costs, primarily severance, $6.8 million of acquisition costs described below and additional interest expense incurred on debt issued to finance the acquisition.
In accordance with the requirements of the accounting for acquisitions, inventories obtained in the Boulder Brands acquisition were required to be valued at fair value (net realizable value, which is defined as estimated selling prices less the sum of (a) costs of disposal and (b) a reasonable profit allowance for the selling effort of the acquiring entity), which is $10.4 million higher than historical manufacturing costs. Cost of products sold for the year ended December 25, 2016 includes pre-tax charges of $10.4 million related to the inventory acquired, which were subsequently sold.
The Boulder Brands acquisition was financed through borrowings of $550.0 million in incremental term loans (the "Tranche I Term Loans") due 2023, $350.0 million of 5.875% Senior Notes (the "5.875% Senior Notes) due 2024, $118.3 million of cash on hand, prior to transaction costs of $6.8 million and $1.7 million in the twelve months ended December 25, 2016 and December 27, 2015, respectively, and debt acquisition costs of $24.0 million and $0.4 million in the twelve months ended December 25, 2016and December 27, 2015, respectively. The debt acquisition costs, which included original issue discount are being amortized over the life of the associated debt using the effective interest method and are recorded in Long-Term debt on the Consolidated Balance Sheet. For more information, see Note 10 to the Consolidated Financial Statements, Debt and Interest Expense. Included in the

PINNACLE FOODS INC. AND SUBSIDIARIESNOTES TO CONSOLIDATED FINANCIAL STATEMENTS(thousands, except share and per share amounts and where noted in millions)
78
acquisition costs of $6.8 million for the year ended December 25, 2016 are $6.1 million of merger, acquisition and advisory fees and $0.7 million of other costs. The $1.7 million of transaction costs incurred in fiscal 2015 primarily relate to legal, accounting and other professional fees. The transaction costs are recorded in Other expense (income), net in the Consolidated Statements of Operations.
Pro forma Information The following unaudited pro forma summary presents the Company's consolidated results of operations as if Boulder had been acquired on December 29, 2014, which was the first day of fiscal 2015. These amounts adjusted Boulder's historical results to reflect the additional depreciation and amortization that would have been charged assuming the fair value adjustments to plant assets and intangible assets had been applied from December 29, 2014, together with the consequential tax effects. These adjustments also reflect the additional interest expense incurred on the debt to finance the purchase. The year ended December 25, 2016 pro forma earnings were adjusted to exclude the acquisition related and restructuring costs incurred and the nonrecurring expense related to the fair value inventory step-up adjustment. The year ended December 27, 2015 pro forma earnings were adjusted to include these charges. The pro forma financial information presented below is for informational purposes only and is not indicative of the results of operations that would have been achieved if the acquisition and borrowings undertaken to finance the acquisition had taken place at the beginning of 2015.
Amounts in millions:
Year ended December 25, 2016
(unaudited)
Year ended December 27, 2015
(unaudited)Net sales $ 3,145.5 $ 3,162.8Net earnings $ 235.2 $ 167.3
Boulder Brands Restructuring
As a result of the Boulder Brands acquisition, the Company incurred $19.2 million of restructuring charges in 2016, primarily related to employee termination and retention benefits and were recorded in Administrative expenses in the Consolidated Statements of Operations.
The following table summarizes total restructuring charges accrued as of December 25, 2016. These amounts are recorded in our Consolidated Balance Sheet in Accrued Liabilities.
Balance BalanceDescription December 27, 2015 Expense Payments December 25, 2016
Accrued restructuring charges $ — $ 19,145 $ (11,558) $ 7,587

PINNACLE FOODS INC. AND SUBSIDIARIESNOTES TO CONSOLIDATED FINANCIAL STATEMENTS(thousands, except share and per share amounts and where noted in millions)
79
4. Fair Value Measurements
The authoritative guidance for financial assets and liabilities discusses valuation techniques, such as the market approach (comparable market prices), the income approach (present value of future income or cash flow), and the cost approach (cost to replace the service capacity of an asset or replacement cost). The guidance utilizes a fair value hierarchy that prioritizes the inputs to valuation techniques used to measure fair value into three broad levels. The following is a brief description of those three levels:
Level 1: Observable inputs such as quoted prices (unadjusted) in active markets for identical assets or liabilities.
Level 2: Inputs other than quoted prices that are observable for the asset or liability, either directly or indirectly. These include quoted prices for similar assets or liabilities in active markets and quoted prices for identical or similar assets or liabilities in markets that are not active.
Level 3: Unobservable inputs that reflect the Company’s assumptions.
The Company’s financial assets and liabilities subject to recurring fair value measurements and the required disclosures are as follows:
Fair Value
as ofDecember 25,
2016
Fair Value MeasurementsUsing Fair Value Hierarchy
Fair Valueas of
December 27,2015
Fair Value MeasurementsUsing Fair Value Hierarchy
Level 1 Level 2 Level 3 Level 1 Level 2 Level 3
AssetsForeign currencyderivatives $ 86 $ — $ 86 $ — $ 471 $ — $ 471 $ —Commodity derivatives 2,833 — 2,833 — — — — —Total assets at fair value $ 2,919 $ — $ 2,919 $ — $ 471 $ — $ 471 $ —
LiabilitiesInterest rate derivatives $ 16,852 $ — $ 16,852 $ — $ 18,868 $ — $ 18,868 $ —Commodity derivatives 327 — 327 — 10,013 — 10,013 —Total liabilities at fair value $ 17,179 $ — $ 17,179 $ — $ 28,881 $ — $ 28,881 $ —
The Company manages economic risks, including interest rate, liquidity and credit risk, primarily by managing the amount, sources and duration of its debt funding and the use of derivative financial instruments. The primary risks managed by using derivative instruments are interest rate risk, foreign currency exchange risk and commodity price risk.
The valuations of these instruments are determined using widely accepted valuation techniques, including discounted cash flow analysis on the expected cash flows of each derivative. This analysis reflects the contractual terms of the derivatives, including the period to maturity, and uses observable market-based inputs, including interest rate, commodity, and foreign exchange forward curves. The fair values of interest rate swaps are determined using the market standard methodology of netting the discounted future fixed cash payments (or receipts) and the discounted expected variable cash receipts (or payments). The variable cash receipts (or payments) are based on an expectation of future interest rates (forward curves) derived from observable market interest rate curves. To comply with the provisions of the authoritative guidance for fair value disclosure, the Company incorporates credit valuation adjustments to appropriately reflect both its own non-performance risk and the respective counterparty’s non-performance risk in the fair value measurements. In adjusting the fair value of its derivative contracts for the effect of non-performance risk, the Company has considered the impact of netting and any applicable credit enhancements, such as collateral postings, thresholds, mutual puts, and guarantees. The Company had no recurring fair value measurements based upon significant unobservable inputs (Level 3) as of December 25, 2016 or December 27, 2015.
In addition to the instruments named above, the Company also makes fair value measurements in connection with its annual goodwill and trade name impairment testing. These measurements fall into Level 3 of the fair value hierarchy.

PINNACLE FOODS INC. AND SUBSIDIARIESNOTES TO CONSOLIDATED FINANCIAL STATEMENTS(thousands, except share and per share amounts and where noted in millions)
80
5. Shareholders' Equity, Equity Based Compensation Expense and Earnings Per Share
Equity based Compensation Expense
The Company has two long-term incentive programs: The 2007 Stock Incentive Plan (as defined below) and the 2013 Omnibus Incentive Plan (as defined below). Equity based compensation expense recognized during the period is based on the value of the portion of equity based payment awards that is ultimately expected to vest during the period. As equity based compensation expense recognized in the Consolidated Statements of Operations is based on awards ultimately expected to vest, it has been reduced for estimated forfeitures. The Company estimates forfeitures at the time of grant and revises, if necessary, in subsequent periods if actual forfeitures differ from those estimates.
Expense Information
The following table summarizes equity based compensation expense which was allocated as follows:
Fiscal year ended
December 25,2016
December 27,2015
December 28,2014
Cost of products sold $ 1,556 $ 3,647 $ 5,565Marketing and selling expenses 5,501 3,642 5,836Administrative expenses 6,417 7,461 23,977Research and development expenses 542 372 573Pre-Tax Equity Based Compensation Expense 14,016 15,122 35,951Income Tax Benefit 5,268 5,638 4,738Net Equity Based Compensation Expense $ 8,748 $ 9,484 $ 31,213
As of December 25, 2016, cumulative unrecognized equity compensation expense of the unvested portion of shares and options for the Company's two long-term incentive programs was $34.0 million. The weighted average period over which vesting will occur is approximately 0.9 years for the 2007 Stock Incentive Plan and 1.3 years for the 2013 Omnibus Incentive Plan.
2007 Stock Incentive Plan
The Company adopted an equity option plan (the “2007 Stock Incentive Plan”) providing for the issuance of up to 1,104,888 shares of the Company's common stock through the granting of nonqualified stock options. As of December 25, 2016 any unvested awards vest ratably over five years from the date of grant. Subsequent to the adoption of the 2013 Omnibus Incentive Plan (as further described below), there will be no more grants under this plan.

PINNACLE FOODS INC. AND SUBSIDIARIESNOTES TO CONSOLIDATED FINANCIAL STATEMENTS(thousands, except share and per share amounts and where noted in millions)
81
The following table summarizes the equity option transactions under the 2007 Stock Incentive Plan:
Number of Options
WeightedAverageExercise
Price
WeightedAverage Fair
Value at GrantDate
WeightedAverage
RemainingLife
AggregateIntrinsic
Value(000's)
Outstanding, December 27, 2015 142,643 $ 9.96 $ 5.97 3.42 $ 4,687
Granted — — —Exercised (61,062) 9.79 5.87Forfeitures (6,362) 12.46 3.97
Outstanding, December 25, 2016 75,219 $ 9.84 $ 5.99 2.35 $ 3,266
Exercisable and Expected to Vest,December 25, 2016 74,873 $ 9.80 $ 6.00 2.33 $ 3,253
Exercisable, December 25, 2016 74,399 $ 9.76 $ 6.01 2.31 $ 3,236
2013 Omnibus Incentive Plan
In connection with the IPO, the Company adopted an equity incentive plan (the “2013 Omnibus Incentive Plan”) providing for the issuance of up to 11,300,000 shares of common stock. On May 25, 2016, the Company’ shareholders approved the Company’s Amended and Restated 2013 Omnibus Incentive Plan (the “Amended and Restated Omnibus Incentive Plan”). Awards granted under this plan include equity options, non-vested shares and restricted stock units ("RSU's"). The Company also granted non-vested performance shares ("PS's") and performance share units ("PSU's") both of which vest based on achievement of total shareholder return performance goals. Under the program, awards of PS's and PSU's will be earned by comparing the company's total shareholder return during a three-year period to the respective total shareholder returns of companies in a performance peer group. Based upon the company's ranking in the performance peer group, a recipient of PS's or PSU's may earn a total award ranging from 0% to 200% of the initial grant.
Stock Options: During 2016, the Company granted 654,613 options under the 2013 Omnibus Incentive Plan and the Amended and Restated Omnibus Incentive Plan. The options vest in full after three years. The exercise price of all options granted is equal to the market value of the shares on the date of grant. Options under the plans have a termination date of 10 years from the date of issuance.
The following table summarizes the equity option transactions under the 2013 Omnibus Incentive Plan and the Amended and Restated Omnibus Incentive Plan:

PINNACLE FOODS INC. AND SUBSIDIARIESNOTES TO CONSOLIDATED FINANCIAL STATEMENTS(thousands, except share and per share amounts and where noted in millions)
82
Number of Options
WeightedAverageExercise
Price
WeightedAverage Fair
Value at GrantDate
WeightedAverage
RemainingLife
AggregateIntrinsic
Value(000's)
Outstanding, December 27, 2015 3,168,266 $ 24.72 $ 6.09 7.72 $ 57,336
Granted 654,613 43.51 9.20Exercised (1,282,833) 20.15 4.70Forfeitures (484,976) 33.57 8.44
Outstanding, December 25, 2016 2,055,070 $ 31.44 $ 7.39 7.64 $ 44,821
Exercisable and Expected to Vest,December 25, 2016 1,805,386 $ 29.84 $ 7.15 7.40 $ 42,363
Exercisable, December 25, 2016 782,535 $ 20.78 $ 4.96 6.29 $ 25,410
The Company currently uses the Black-Scholes pricing model as its method of valuation for equity option awards. The fair value of the options granted during the fiscal years ended December 25, 2016, December 27, 2015 and December 28, 2014 was estimated on the date of the grant with the following weighted average assumptions:
Fiscal year endedDecember 25,
2016December 27,
2015December 28,
2014
Risk-free interest rate 1.53% 1.57% 2.18%Expected time to option exercise 6.50 years 6.50 years 6.50 yearsExpected volatility 27% 27% 37%Expected dividend yield on Pinnacle Foods Inc. stock 2.4% 2.3% 2.9%
Volatility was based on the average volatility of a group of publicly traded food companies. The Company estimates the annual forfeiture rates to be approximately 11% under its long-term incentive plans.
Cash received from option exercises for the fiscal years ended December 25, 2016, December 27, 2015 and December 28, 2014 was $26.4 million, $1.2 million and $0.5 million, respectively.
Non-vested shares and RSU's: During 2016, the Company granted 341,456 RSU's under the 2013 Omnibus Incentive Plan and and the Amended and Restated Omnibus Incentive Plan. The awards vest in full over a period of one to three years.
The following table summarizes the changes in non-vested shares and Restricted Stock Units ("RSU's").

PINNACLE FOODS INC. AND SUBSIDIARIESNOTES TO CONSOLIDATED FINANCIAL STATEMENTS(thousands, except share and per share amounts and where noted in millions)
83
Number of Shares
WeightedAverage Fair
Value at GrantDate
AggregateIntrinsic
Value(000's)
Outstanding, December 27, 2015 449,951 $ 32.71 $ 19,267
Granted 341,456 44.38Forfeitures (74,942) 39.73Vested (97,980) 24.31
Outstanding, December 25, 2016 618,485 $ 39.63 $ 32,303
Expected to Vest, December 25, 2016 513,484 $ 38.84 $ 26,819
PS's and PSU's: During 2016, the Company granted 133,964 PS's and 100,821 PSU's under the 2013 Omnibus Incentive Plan and and the Amended and Restated Omnibus Incentive Plan. The awards vest in full over a period of two and a half to three years.
The following table summarizes the changes in non-vested Performance Shares ("PS's") and Performance Share Units ("PSU's").
Number ofInstruments
WeightedAverage Fair
Value at GrantDate
AggregateIntrinsic
Value(000's)
Outstanding, December 27, 2015 391,573 $ 42.67 $ 16,767
Granted 234,785 49.59Forfeitures (155,009) 43.38Vested — —
Outstanding, December 25, 2016 471,349 $ 45.88 $ 24,619
Expected to Vest, December 25, 2016 362,551 $ 44.89 $ 18,936
The Company estimated the fair value of PSU's at the date of grant using a Monte Carlo simulation. The fair value of the PSU's granted during the fiscal years ended December 25, 2016 and December 27, 2015, were estimated on the date of the grant with the following assumptions:
December 25,2016
December 27,2015
December 28,2014
Risk-free interest rate 1.3% 1.3% 0.9%Expected term 2.91 years 3.00 years 3.00 yearsExpected volatility 17% 22% 35%Expected dividend yield 2.3% 2.3% 2.8%

PINNACLE FOODS INC. AND SUBSIDIARIESNOTES TO CONSOLIDATED FINANCIAL STATEMENTS(thousands, except share and per share amounts and where noted in millions)
84
Earnings Per Share
Basic earnings per common share is computed by dividing net earnings or loss for common shareholders by the weighted-average number of common shares outstanding during the period. Diluted earnings per common share are calculated by dividing net earnings by weighted-average common shares outstanding during the period plus dilutive potential common shares, which are determined as follows:
Fiscal year ended
December 25,2016
December 27,2015
December 28,2014
Weighted-average common shares 116,871,948 116,031,648 115,697,621
Effect of dilutive securities 1,288,756 1,290,878 1,187,601
Dilutive potential common shares 118,160,704 117,322,526 116,885,222
Dilutive potential common shares are calculated in accordance with the treasury stock method, which assumes that proceeds from the exercise of all warrants and options are used to repurchase common stock at market value. The amount of shares remaining after the proceeds are exhausted represents the potentially dilutive effect of the securities. For the fiscal years ended December 25, 2016, December 27, 2015 and December 28, 2014, conversion of securities totaling 501,014, 267,565 and 670,889 respectively, into common share equivalents were excluded from this calculation as their effect would have been anti-dilutive.
6. Accumulated Other Comprehensive Loss
The components of Accumulated Other Comprehensive Loss ("AOCL") consist of the following:
Currencytranslation
adjustments
Gains (Losses)on cash flow
hedgesChange inpensions Total
Balance at December 28, 2014 $ (2,054) $ 4,124 $ (39,804) $ (37,734)
Other comprehensive loss before reclassification (4,364) (13,559) (4,542) (22,465)
Amounts reclassified from accumulated othercomprehensive loss — 203 608 811
Net current period other comprehensive gain (loss) (4,364) (13,356) (3,934) (21,654)
Balance at December 27, 2015 $ (6,418) $ (9,232) $ (43,738) $ (59,388)
Other comprehensive loss before reclassification 2,429 (4,077) 3,728 2,080
Amounts reclassified from accumulated othercomprehensive loss — 5,075 664 5,739
Net current period other comprehensive gain (loss) 2,429 998 4,392 7,819
Balance at December 25, 2016 $ (3,989) $ (8,234) $ (39,346) $ (51,569)

PINNACLE FOODS INC. AND SUBSIDIARIESNOTES TO CONSOLIDATED FINANCIAL STATEMENTS(thousands, except share and per share amounts and where noted in millions)
85
Other Comprehensive Earnings
The following table presents amounts reclassified out of AOCL and into Net earnings for the fiscal years ended December 25, 2016, December 27, 2015 and December 28, 2014.
Gain/(Loss) Amounts Reclassified from AOCLFiscal year ended
Details about Accumulated Other Comprehensive EarningsComponents
December 25,2016
December 27,2015
December 28,2014 Reclassified from AOCL to:
Gains and losses on financial instrument contractsInterest rate contracts $ (8,539) $ (3,737) $ (877) Interest expenseForeign exchange contracts 320 3,211 1,502 Cost of products sold
Total before tax (8,219) (526) 625Tax (expense) benefit 3,144 323 (471) Provision for income taxes
Net of tax (5,075) (203) 154
Pension actuarial assumption adjustmentsAmortization of actuarial loss (1,071) (981) (67) (a) Cost of products soldTax benefit 407 373 26 Provision for income taxes
Net of tax (664) (608) (41)Net reclassifications into net earnings $ (5,739) $ (811) $ 113
(a) This is included in the computation of net periodic pension cost (see Note 11 for additional details).

PINNACLE FOODS INC. AND SUBSIDIARIESNOTES TO CONSOLIDATED FINANCIAL STATEMENTS(thousands, except share and per share amounts and where noted in millions)
86
7. Other Expense (Income), net and Termination Fee Received, Net of Costs
Other Expense (Income), net
Fiscal year
December 25,
2016December 27,
2015December 28,
2014
Other expense (income), net consists of:Amortization of intangibles/other assets $ 16,965 $ 13,554 $ 13,917Boulder Brands acquisition costs (Note 3) 6,781 1,713 —Garden Protein acquisition costs (Note 3) — — 3,121Foreign exchange (gains) losses (486) 4,731 655Charges resulting from the wind down of the BoulderBrands United Kingdom operations 4,265 — —Royalty income and other (1,725) (892) (1,712)Total other expense (income), net $ 25,800 $ 19,106 $ 15,981
Foreign exchange (gains) losses. Represents foreign exchange (gains) losses from intra-entity loans resulting from the Garden Protein acquisition that are anticipated to be settled in the foreseeable future.
Charges resulting from the wind down of Boulder Brands United Kingdom operations. In October 2016, the Company voluntarily ceased production at Boulder Brands private label gluten free bakery operation which is based in the United Kingdom. As such, the Company adopted a plan in the fourth quarter to wind down operations and dispose of all associated assets such as land, buildings, machinery and equipment and inventory. The Company expects the final sale and disposal of the assets to be substantially completed sometime in the first half of 2017. In connection with the plan of disposal, the Company determined that the carrying values of some of the underlying assets exceeded their fair values. Consequently, the above charges are primarily comprised of impairment losses, which represents the excess of the carrying values of the assets over their fair values. The charges also include employee termination benefits and professional fees resulting from the closing and disposition.
Termination Fee Received, Net of Costs, Associated With the Hillshire Merger Agreement
On May 12, 2014 the Company entered into a definitive merger agreement for the sale of the Company to The Hillshire Brands Company ("Hillshire"). Subsequently, Hillshire received an offer from Tyson Foods, Inc. ("Tyson") to acquire all of its outstanding common shares. On June 16, 2014, in light of the Tyson offer, Hillshire's board of directors withdrew its recommendation of the pending acquisition of the Company. Under the terms of the merger agreement, as a result of the change in recommendation, the Company had the right to terminate its merger agreement with Hillshire, which it did on June 30, 2014. As a result of the termination, on July 2, 2014, the Company received a merger termination fee payment of $163.0 million from Tyson, on behalf of Hillshire. One-time fees and expenses associated with the merger agreement, comprising external advisors' fees and employee retention incentives, including equity awards, totaled $19.2 million, of which $17.4 million was incurred in fiscal 2014, with the remainder in the first quarter of fiscal 2015. The net impact on 2014 pre-tax earnings of $145.6 million is included on the various lines of the Consolidated Statement of Operations as follows: $(153.0) million in Termination Fee Received, Net of Costs, $2.9 millionin Cost of products sold, $2.0 million in Marketing and selling expenses, $2.2 million in Administrative expenses and $0.3 millionin Research and development expenses.

PINNACLE FOODS INC. AND SUBSIDIARIESNOTES TO CONSOLIDATED FINANCIAL STATEMENTS(thousands, except share and per share amounts and where noted in millions)
87
8. Balance Sheet Information
Accounts Receivable. Customer accounts receivable are recorded at the invoiced amount and do not bear interest. The allowance for cash discounts, returns and bad debts is the Company's best estimate of the amount of uncollectible amounts in its existing accounts receivable. The Company determines the allowance based on historical discounts taken and write-off experience. The Company reviews its allowance for doubtful accounts quarterly. Account balances are charged off against the allowance when the Company concludes it is probable the receivable will not be recovered. The Company does not have any off-balance sheet credit exposure related to its customers. Accounts receivable are as follows:
December 25,2016
December 27,2015
Customers $ 292,029 $ 219,352Allowances for cash discounts, bad debts and returns (12,335) (7,902)
Subtotal 279,694 211,450Other receivables 9,888 8,286
Total $ 289,582 $ 219,736
Following are the changes in the allowance for cash discounts, bad debts, and returns:
Beginning Ending Balance Revenue Reductions Deductions Balance
Fiscal 2016 $ 7,902 $ 106,103 $ (101,670) $ 12,335 Fiscal 2015 6,801 98,374 (97,273) 7,902 Fiscal 2014 5,849 96,491 (95,539) 6,801
Inventories. Inventories are as follows:
December 25,2016
December 27,2015
Raw materials, containers and supplies $ 81,660 $ 57,145Work in progress (1) 55,068 61,527Finished product 308,763 284,429
Total $ 445,491 $ 403,101
(1) Included in work in progress is primarily agricultural inventory.
The Company has various purchase commitments for raw materials, containers, supplies and certain finished products incident to the ordinary course of business. Such commitments are not at prices in excess of current market.
Other Current Assets. Other Current Assets are as follows:
December 25,2016
December 27,2015
Prepaid expenses and other $ 9,911 $ 8,166Prepaid income taxes 776 5,511
Total $ 10,687 $ 13,677

PINNACLE FOODS INC. AND SUBSIDIARIESNOTES TO CONSOLIDATED FINANCIAL STATEMENTS(thousands, except share and per share amounts and where noted in millions)
88
Plant Assets. Plant assets are as follows:
December 25,2016
December 27,2015
Land $ 15,720 $ 14,948Buildings 272,510 246,988Machinery and equipment 826,344 716,314Projects in progress (a) 100,168 61,153
Subtotal 1,214,742 1,039,403Accumulated depreciation (491,397) (408,294)
Total $ 723,345 $ 631,109
Depreciation was $88.8 million, $76.1 million and $66.7 million during the fiscal years ended December 25, 2016, December 27, 2015 and December 28, 2014, respectively. As of December 25, 2016 and December 27, 2015, Plant Assets included assets under capital lease with a book value of $38.1 million and $16.4 million (net of accumulated depreciation of $14.3 million and $11.0million), respectively.
(a) The significant increase in Projects in process as of December 25, 2016 as compared to December 27, 2015 primarily relates to additional investment in the Hagerstown facility which will expand the capacity for gardein in 2017.
Accrued Liabilities. Accrued liabilities are as follows:
December 25,2016
December 27,2015
Employee compensation and benefits $ 65,402 $ 55,416Interest payable 23,854 12,127Consumer coupons 5,048 2,035Accrued restructuring charges (see note 3) 7,587 —Accrued financial instrument contracts (see note 12) 4,940 5,957Accrued broker commissions 7,982 4,651Accrued income taxes 29,173 842Other 22,755 19,482
Total $ 166,741 $ 100,510
Other Long-Term Liabilities. Other long-term liabilities are as follows:
December 25,2016
December 27,2015
Employee compensation and benefits $ 12,630 $ 9,806 Long-term rent liability and deferred rent allowances 6,794 7,774 Liability for uncertain tax positions 9,786 7,712 Accrued financial instrument contracts (see note 12) 12,239 22,924 Other 6,080 6,290
Total $ 47,529 $ 54,506

PINNACLE FOODS INC. AND SUBSIDIARIESNOTES TO CONSOLIDATED FINANCIAL STATEMENTS(thousands, except share and per share amounts and where noted in millions)
89
9. Goodwill, Tradenames and Other Assets
Goodwill
Goodwill by segment is as follows:
Frozen Grocery Boulder Specialty TotalBalance, December 28, 2014 $ 741,960 $ 746,565 $ 72,588 $ 158,447 $ 1,719,560Purchase price adjustment (1) — — (1,287) — (1,287)Foreign currency adjustment (4,265) — — — (4,265)Balance, December 27, 2015 $ 737,695 $ 746,565 $ 71,301 $ 158,447 $ 1,714,008Boulder Brands acquisition (Note 3) 9,130 114,407 293,582 28,835 445,954Foreign currency adjustment 3,194 — — — 3,194Balance, December 25, 2016 $ 750,019 $ 860,972 $ 364,883 $ 187,282 $ 2,163,156
(1) Primarily relates to a 2015 post close working capital adjustment of the preliminary purchase price related to the Garden Protein acquisition.
The authoritative guidance for business combinations requires that all business combinations be accounted for at fair value under the acquisition method of accounting. The authoritative guidance for goodwill provides that goodwill will not be amortized, but will be tested for impairment on an annual basis or more often when events indicate. The Company completed its annual testing in the third quarter of 2016, resulting in no impairment.
All of the Company's acquisitions are accounted for in accordance with the authoritative guidance for business combinations. The Boulder Brands acquisition resulted in $446.0 million of goodwill being recorded in 2016.
Tradenames
Tradenames by segment are as follows:
Frozen Grocery Boulder Specialty TotalBalance, December 28, 2014 $ 801,754 $ 1,118,712 $ 45,408 $ 36,000 $ 2,001,874Foreign currency adjustment (826) — — — (826)Balance, December 27, 2015 $ 800,928 $ 1,118,712 $ 45,408 $ 36,000 $ 2,001,048Boulder Brands acquisition (Note 3) — 142,200 397,400 — 539,600Foreign currency adjustment 110 — — — 110Impairments (10,300) — — (900) (11,200)Balance, December 25, 2016 $ 790,738 $ 1,260,912 $ 442,808 $ 35,100 $ 2,529,558
The allocation of the Boulder Brands acquisition purchase price resulted in $539.6 million of indefinite-lived tradename intangible assets being recorded in 2016.
The authoritative guidance for indefinite-lived assets provides that indefinite-lived assets will not be amortized, but will be tested for impairment on an annual basis or more often when events indicate. Upon completion of the annual testing in the third quarter of 2016, the Company recorded tradename impairments of $7.3 million on Celeste, $3.0 million on Aunt Jemima and $0.9 million on Snyder of Berlin. Celeste and Aunt Jemima are reported in our Frozen segment and Snyder of Berlin is reported in the Specialty segment. These charges were the result of the Company's reassessment of the long-term sales projections for the brands
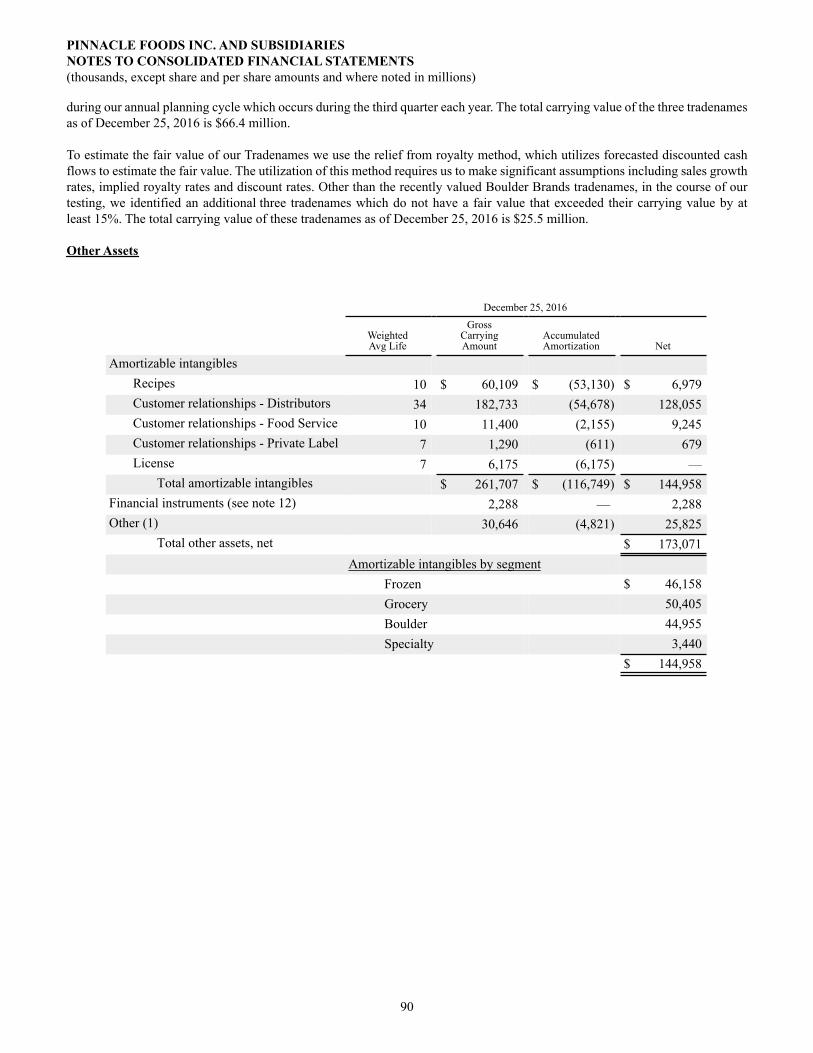
PINNACLE FOODS INC. AND SUBSIDIARIESNOTES TO CONSOLIDATED FINANCIAL STATEMENTS(thousands, except share and per share amounts and where noted in millions)
90
during our annual planning cycle which occurs during the third quarter each year. The total carrying value of the three tradenames as of December 25, 2016 is $66.4 million.
To estimate the fair value of our Tradenames we use the relief from royalty method, which utilizes forecasted discounted cash flows to estimate the fair value. The utilization of this method requires us to make significant assumptions including sales growth rates, implied royalty rates and discount rates. Other than the recently valued Boulder Brands tradenames, in the course of our testing, we identified an additional three tradenames which do not have a fair value that exceeded their carrying value by at least 15%. The total carrying value of these tradenames as of December 25, 2016 is $25.5 million.
Other Assets
December 25, 2016
WeightedAvg Life
GrossCarryingAmount
AccumulatedAmortization Net
Amortizable intangiblesRecipes 10 $ 60,109 $ (53,130) $ 6,979Customer relationships - Distributors 34 182,733 (54,678) 128,055Customer relationships - Food Service 10 11,400 (2,155) 9,245Customer relationships - Private Label 7 1,290 (611) 679License 7 6,175 (6,175) —
Total amortizable intangibles $ 261,707 $ (116,749) $ 144,958Financial instruments (see note 12) 2,288 — 2,288Other (1) 30,646 (4,821) 25,825
Total other assets, net $ 173,071Amortizable intangibles by segment
Frozen $ 46,158Grocery 50,405Boulder 44,955Specialty 3,440
$ 144,958

PINNACLE FOODS INC. AND SUBSIDIARIESNOTES TO CONSOLIDATED FINANCIAL STATEMENTS(thousands, except share and per share amounts and where noted in millions)
91
December 27, 2015
WeightedAvg Life
GrossCarryingAmount
AccumulatedAmortization Net
Amortizable intangiblesRecipes 10 $ 60,094 $ (47,077) $ 13,017Customer relationships - Distributors 35 142,129 (46,507) 95,622Customer relationships - Private Label 7 1,290 (399) 891License 7 6,175 (5,800) 375
Total amortizable intangibles $ 209,688 $ (99,783) $ 109,905Financial instruments (see note 12) — — —Other (1) 14,779 (4,320) 10,459
Total other assets, net $ 120,364Amortizable intangibles by segment
Frozen $ 51,971Grocery 45,503Boulder 8,539Specialty 3,892
$ 109,905
(1) As of December 25, 2016 and December 27, 2015, Other primarily consists of security deposits and supplemental savings plan investments.
Amortization of intangible assets was $17.0 million, $13.6 million and $13.9 million during the fiscal years ended December 25, 2016, December 27, 2015 and December 28, 2014, respectively. Estimated amortization expense for each of the next five years and thereafter is as follows: 2017 - $11.8 million; 2018 - $9.6 million; 2019 - $8.9 million; 2020 - $8.2 million; 2021 - $6.8 million and thereafter - $99.6 million.
10. Debt and Interest Expense
December 25,2016
December 27,2015
Short-term borrowings- Notes payable $ 2,389 $ 2,225
Total short-term borrowings $ 2,389 $ 2,225Long-term debt
- Amended Credit Agreement - Tranche G Term Loans due 2020 (a) $ 1,409,625 $ 1,409,625- Amended Credit Agreement - Tranche H Term Loans due 2020 (a) 509,250 514,500- Amended Credit Agreement - Tranche I Term Loans due 2023 (a) 545,875 —- 4.875% Senior Notes due 2021 350,000 350,000- 5.875% Senior Notes due 2024 350,000 —- 3.0% Note payable to Gilster Mary Lee Corporation due 2018 5,176 8,878- Unamortized discount on long term debt and deferred financing costs (41,954) (26,267)- Capital lease obligations 36,325 15,123
3,164,297 2,271,859Less: current portion of long-term obligations 23,801 14,847Total long-term debt $ 3,140,496 $ 2,257,012

PINNACLE FOODS INC. AND SUBSIDIARIESNOTES TO CONSOLIDATED FINANCIAL STATEMENTS(thousands, except share and per share amounts and where noted in millions)
92
Interest expense Fiscal year
December 25,
2016December 27,
2015December 28,
2014
Interest expense, third party $ 120,550 $ 78,423 $ 86,906Amortization of debt acquisition costs andoriginal issue discount 9,554 6,353 6,507Write-off of debt acquisition costs and originalissue discount 600 — 1,879Interest rate swap losses (Note 12) 8,539 3,737 882
Total interest expense $ 139,243 $ 88,513 $ 96,174
(a) Please refer to Note 18 of the Consolidated Financial Statements "Subsequent Events" which describes the February 3, 2017 refinancing, (the "Refinancing") of all remaining borrowings under the Amended Credit Agreement.
Amended Credit Agreement
On July 8, 2014, the Company repaid $200.0 million of the Tranche G Term Loans (defined below) with a combination of the Hillshire merger termination fee received and cash on hand. As part of the pay down, the Company wrote off $0.9 million existing original issue discount and $1.0 million of debt acquisition costs.
To partially fund the Boulder Brands acquisition, on January 15, 2016 as described in Note 3, Pinnacle Foods Finance entered into an amendment to the Second Amended and Restated Credit Agreement (the “Amended Credit Agreement”) in the form of incremental term loans in the amount of $550.0 million (the “Tranche I Term Loans”). The Tranche I Term Loans have consistent terms with the Tranche G Term Loans and Tranche H Term Loans. In connection with the Tranche I Term Loans, Pinnacle Foods Finance incurred $2.7 million of original issue discount and deferred financing fees of $10.5 million. Additionally, Pinnacle Foods Finance issued 5.875% Senior Notes in the aggregate principal amount of $350.0 million (the "5.875% Senior Notes") due January 15, 2024.
On July 26, 2016, Pinnacle Foods Finance entered into amendments to the Amended Credit Agreement for the purpose of reducing the interest rate applicable to the Tranche I Term Loans (the “Repricing”). The eurocurrency rate was amended from a minimum of 0.75% to a minimum of 0.0%, the base rate was amended from a minimum of 1.75% to 1.00%, the interest rate margin in the case of Eurocurrency rate loans was amended from 3.00% to 2.75%, and the interest rate margin in the case of base rate loans was amended from 2.00% to 1.75%. All other terms and conditions of the Tranche I Term Loans remained the same. In connection with the Repricing, Pinnacle Foods Finance incurred approximately $1.0 million of fees and wrote off $0.6 million of existing debt acquisition costs.
As a result of the Boulder Brands acquisition, Pinnacle Foods Finance's total net leverage ratio increased above 4.25:1.0,which resulted in a 25 basis point interest rate step-up on existing Term Loans G and H, under the Amended Credit Agreement immediately subsequent to the quarterly certification to the Administrative Agent which occurred after filing the first quarter 10-Q report on April 28, 2016. The higher rate remains in effect as long as the total net leverage ratio remains greater than 4.25:1.0. As of December 25, 2016, the total net leverage ratio was 4.19:1.0, which would have resulted in a 25 basis point interest rate reduction subsequent to the quarterly certification to the Administrative Agent which would have occured after filing the 10-K report on February 23, 2017. However, as discussed in more detail in Note 18 to the Financial Statements, on February 3, 2017, the Company entered into the Third Amended and Restated Credit Agreement, under which the interest rate will not be subject to adjustment based on the total net leverage ratio.
The obligations under the Amended Credit Agreement are unconditionally and irrevocably guaranteed by Peak Finance Holdings LLC, any subsidiary of Peak Finance Holdings LLC that directly or indirectly owns 100% of the issued and outstanding equity interests of Pinnacle Foods Finance, subject to certain exceptions, each of Pinnacle Foods Finance’s direct or indirect material wholly-owned domestic subsidiaries (collectively, the “Guarantors”) and by the Company effective with the 2013 Refinancing. In addition, subject to certain exceptions and qualifications, borrowings under the Amended Credit Agreement are secured by first priority or equivalent security interests in (i) all the capital stock of, or other equity interests in, each direct or indirect domestic material subsidiary of Pinnacle Foods Finance and 65% of the capital stock of, or other equity interests in, each direct material

PINNACLE FOODS INC. AND SUBSIDIARIESNOTES TO CONSOLIDATED FINANCIAL STATEMENTS(thousands, except share and per share amounts and where noted in millions)
93
"first tier" foreign subsidiary of Pinnacle Foods Finance and (ii) certain tangible and intangible assets of Pinnacle Foods Finance and those of the Guarantors (subject to certain exceptions and qualifications). A commitment fee of 0.375% per annum based on current leverage ratios is applied to the unused portion of the revolving credit facility. The fee is 0.30% effective with the Refinancing. There were no revolver borrowings outstanding as of December 25, 2016. There were no revolver borrowings made during the fiscal 2016, however, the weighted average interest rate on the revolving credit facility would have been 2.9% calculated on the Eurocurrency rate or 4.7% calculated on the base rate. There were no revolver borrowings made during the fiscal 2015, however, the weighted average interest rate on the revolving credit facility would have been 2.5% calculated on the Eurocurrency rate or 4.5% calculated on the base rate. There were revolver borrowings made during the fiscal years ending December 28, 2014 and the weighted average interest rates on the revolving credit facility were 2.95%.
For the fiscal years ended December 25, 2016, December 27, 2015, and December 28, 2014, the weighted average interest rate on the term loan components of the Senior Secured Credit Facility were 3.26%, 3.00% and 3.20%, respectively. As of December 25, 2016 and December 27, 2015 the Eurocurrency interest rate on the term loan facilities was 3.26% and 3.00%, respectively.
Pinnacle Foods Finance pays a fee for all outstanding letters of credit drawn against the revolving credit facility at an annual rate equivalent to the applicable eurocurrency rate margin then in effect under the revolving credit facility, plus the fronting fee payable in respect of the applicable letter of credit. The fronting fee is equal to 0.125% per annum of the daily maximum amount then available to be drawn under such letter of credit. The fronting fees are computed on a quarterly basis in arrears. Total letters of credit issued under the revolving credit facility cannot exceed $50.0 million. As of December 25, 2016 and December 27, 2015, Pinnacle Foods Finance had utilized $24.3 million and $29.6 million, respectively of the revolving credit facility for letters of credit. As of December 25, 2016 and December 27, 2015, respectively, there was $125.7 million and $120.4 million of borrowing capacity under the revolving credit facility, of which $25.7 million and $20.4 million was available to be used for letters of credit.
Under the terms of the Amended Credit Agreement, Pinnacle Foods Finance is required to use 50% of its “Excess Cash Flow” to prepay the term loans under the Amended Credit Agreement (which percentage will be reduced to 25% at a total net leverage ratio of between 4.50 and 5.49 and to 0% at a total net leverage ratio below 4.50). As of December 25, 2016, Pinnacle Foods Finance had a total net leverage ratio of 4.19:1.0. Excess Cash Flow is defined as consolidated net income (as defined), as adjusted for certain items, including (1) all non-cash charges and credits included in arriving at consolidated net income, (2) changes in working capital, (3) capital expenditures (to the extent they were not financed with debt), (4) the aggregate amount of principal payments on indebtedness and (5) certain other items defined in the Amended Credit Agreement. For the 2016 reporting year, Pinnacle Foods Finance determined that there were no amounts due under the Excess Cash Flow requirements of the Senior Secured Credit Facility. Pursuant to the terms of the Amended Credit Agreement, Pinnacle Foods Finance is required to maintain a ratio of Net First Lien Secured Debt to Covenant Compliance EBITDA of no greater than 5.75 to 1.00. Net First Lien Secured Debt is defined as aggregate consolidated secured indebtedness, less the aggregate amount of all unrestricted cash and cash equivalents. In addition, under the Amended Credit Agreement and the indentures governing the Senior Notes, Pinnacle Foods Finance's ability to engage in activities such as incurring additional indebtedness, making investments and paying dividends is tied to the Senior Secured Leverage Ratio (which is currently the same as the ratio of Net First Lien Secured Debt to Covenant Compliance EBITDA described above), in the case of the Amended Credit Agreement, or to the ratio of Covenant Compliance EBITDA to fixed charges for the most recently concluded four consecutive fiscal quarters, in the case of the Senior Notes. The Amended Credit Agreement also permits restricted payments up to an aggregate amount of (together with certain other amounts) the greater of $50 million and 2% of Pinnacle Foods Finance's consolidated total assets, so long as no default has occurred and is continuing and its pro forma Senior Secured Leverage Ratio would be no greater than 4.25 to 1.00. As of December 25, 2016 the Company is in compliance with all covenants and other obligations under the Amended Credit Agreement and the indentures governing the Senior Notes.
As discussed in more detail in Note 18 to the Financial Statements, on February 3, 2017, the Company entered into the Third and Amended Restated Credit Agreement in order to (1) refinance all of the Company’s outstanding term loans with New Term Loans, (2) replace the Company’s existing revolving credit facility with the New Revolving Credit Facility and, collectively and (3) amend and restate the Amended Credit Agreement in its entirety to make certain other amendments and modifications

PINNACLE FOODS INC. AND SUBSIDIARIESNOTES TO CONSOLIDATED FINANCIAL STATEMENTS(thousands, except share and per share amounts and where noted in millions)
94
Senior and Other Notes
To partially fund the Gilster acquisition, on March 31, 2014 as described in Note 3, the Company entered into a $14.9 million note payable to Gilster Mary Lee Corporation. The note has a four-year term with a maturity date of March 31, 2018 and bears interest at 3.0% per annum.
To partially fund the Boulder Brands acquisition, on January 15, 2016 as described in Note 3, the Company issued $350.0 millionaggregate principal amount of 5.875% Senior Notes (the “5.875% Senior Notes”) due 2024.
The Company's 4.875% Senior Notes and 5.875% Senior Notes (together the "Senior Notes") are general senior unsecured obligations of Pinnacle Foods Finance, effectively subordinated in right of payment to all existing and future senior secured indebtedness of Pinnacle Foods Finance and guaranteed on a full, unconditional, joint and several basis by Pinnacle Foods Finance’s wholly-owned domestic subsidiaries that guarantee other indebtedness of Pinnacle Foods Finance and by the Company. See Note 17 for the condensed Consolidated Financial Statements for Guarantor and Nonguarantor Financial Statements.
Pinnacle Foods Finance may redeem some or all of the 5.875% Senior Notes at any time prior to January 15, 2019, at a price equal to 100% of the principal amount of notes redeemed plus the Applicable Premium as of, and accrued and unpaid interest to, the redemption date, subject to the right of holders of record on the relevant record date to receive interest due on the relevant interest payment date. The “Applicable Premium” is defined as the greater of (1) 1.0% of the principal amount of such 5.875% Senior Notes and (2) the excess, if any, of (a) the present value at such redemption date of (i) the redemption price of such5.875% Senior Notes at January 15, 2019, plus (ii) all required interest payments due on such 5.875% Senior Notes through January 15, 2019 (excluding accrued but unpaid interest to the redemption date), computed using a discount rate equal to the treasury rate plus 50basis points over (b) the principal amount of such 5.875% Senior Notes.
Pinnacle Foods Finance may redeem the 4.875% Senior Notes at the redemption prices listed below, if redeemed during the twelve-month period beginning on May 1st of each of the years indicated below:
4.875% Senior NotesYear Percentage
2016 103.656%2017 102.438%2018 101.219%2019 and thereafter 100.000%
Pinnacle Foods Finance may redeem the 5.875% Senior Notes at the redemption prices listed below, if redeemed during the twelve-month period beginning on January 15th of each of the years indicated below:
5.875% Senior NotesYear Percentage
2019 104.406%2020 102.938%2021 101.469%2022 and thereafter 100.000%
In addition, until January 15, 2019 for the 5.875% Senior Notes, Pinnacle Foods Finance may redeem up to 35% of the aggregate principal amount of the 5.875% Senior Notes at a redemption price equal to 100.000% for the 5.875% Senior Notes of the aggregate principal amount thereof, plus accrued and unpaid interest, if any, to the redemption date, subject to the right of holders of the 5.875% Senior Notes of record on the relevant record date to receive interest due on the relevant interest payment date, with the net cash proceeds received by Pinnacle Foods Finance from one or more equity offerings; provided that (i) at least 50% of the aggregate principal amount of the5.875% Senior Notes originally issued under the indentures remains outstanding immediately after the occurrence of each such redemption and (ii) each such redemption occurs within 120 days of the date of closing of each such equity offering.

PINNACLE FOODS INC. AND SUBSIDIARIESNOTES TO CONSOLIDATED FINANCIAL STATEMENTS(thousands, except share and per share amounts and where noted in millions)
95
Debt Acquisition Costs and Original Issue Discounts
As discussed in Note 2 of the Consolidated Financial Statements and in accordance with ASU No. 2015-03, the Company now presents debt acquisition costs in the balance sheet as a direct deduction from the related debt liability, rather than as an asset.As part of the Boulder Brands acquisition, debt acquisition costs of $21.5 million and $0.4 million were incurred during the twelve months ended December 25, 2016 and December 27, 2015, respectively. Additionally, original issue discounts of $2.8 million were incurred during the twelve months ended December 25, 2016 as a result of the acquisition. Further, $0.6 million of these costs were written off in July of 2016 in connection with the repricing of Term Loan I. In addition, $1.0 million of debt acquisition costs were incurred as a result of the repricing. All debt acquisition costs and original issue discounts are amortized into interest expense over the life of the related debt using the effective interest method. Amortization of debt acquisition costs and original issue discount were $9.0 million, $5.9 million, and $4.1 million during the fiscal years ended December 25, 2016, December 27, 2015, and December 28, 2014 respectively.
The following summarizes debt acquisition cost and original issue discount activity during the twelve months ended December 25, 2016.
GrossCarryingAmount
AccumulatedAmortization Net
Balance, December 27, 2015 $ 58,036 $ (31,769) $ 26,2672016 - Additions 25,314 — 25,3142016 - Amortization — (9,027) (9,027)2016 - Write off (600) — (600)Balance, December 25, 2016 $ 82,750 $ (40,796) $ 41,954
The estimated fair value of the Company’s long-term debt, including the current portion, as of December 25, 2016, is as follows:
December 25, 2016Issue Face Value Fair Value
Amended Credit Agreement - Tranche G Term Loans $ 1,409,625 $ 1,423,721Amended Credit Agreement - Tranche H Term Loans 509,250 514,343Amended Credit Agreement - Tranche I Term Loans 545,875 554,7453.0% Note payable to Gilster Mary Lee Corporation 5,176 5,1764.875% Senior Notes 350,000 359,6255.875% Senior Notes 350,000 369,250
$ 3,169,926 $ 3,226,860
The estimated fair value of the Company’s long-term debt, including the current portion, as of December 27, 2015, is as follows:
December 27, 2015Issue Face Value Fair Value
Amended Credit Agreement - Tranche G Term Loans $ 1,409,625 $ 1,384,957Amended Credit Agreement - Tranche H Term Loans 514,500 505,4963.0% Note payable to Gilster Mary Lee Corporation 8,878 8,8784.875% Senior Notes 350,000 337,750
$ 2,283,003 $ 2,237,081

PINNACLE FOODS INC. AND SUBSIDIARIESNOTES TO CONSOLIDATED FINANCIAL STATEMENTS(thousands, except share and per share amounts and where noted in millions)
96
The estimated fair values of the Company's long-term debt are classified as Level 2 in the fair value hierarchy. The fair value is based on the quoted market price for such notes and borrowing rates currently available to the Company for loans with similar terms and maturities.
11. Pension and Retirement Plans
The Company accounts for pension and retirement plans in accordance with the authoritative guidance for retirement benefit compensation. This guidance requires recognition of the funded status of a benefit plan in the statement of financial position. The guidance also requires recognition in accumulated other comprehensive earnings of certain gains and losses that arise during the period but are deferred under pension accounting rules.
On December 31, 2013, the Pinnacle Foods Pension Plan merged into the Birds Eye Foods Pension Plan in order to achieve administrative, operational and cost efficiencies. The merged plan was renamed the Pinnacle Foods Group LLC Pension Plan (the "Plan"). The Plan is frozen for future benefit accruals. The Company also has three qualified 401(k) plans, three non-qualified supplemental savings plans and participates in a multi-employer defined benefit plan.
Pinnacle Foods Group LLC Pension Plan
The Plan covers eligible union employees and provides benefits generally based on years of service and employees’ compensation. The Plan is frozen for future benefits. The Plan is funded in conformity with the funding requirements of applicable government regulations. The Plan assets consist principally of cash equivalents, equity and fixed income common collective trusts. The Plan assets do not include any of the Company’s own equity or debt securities.
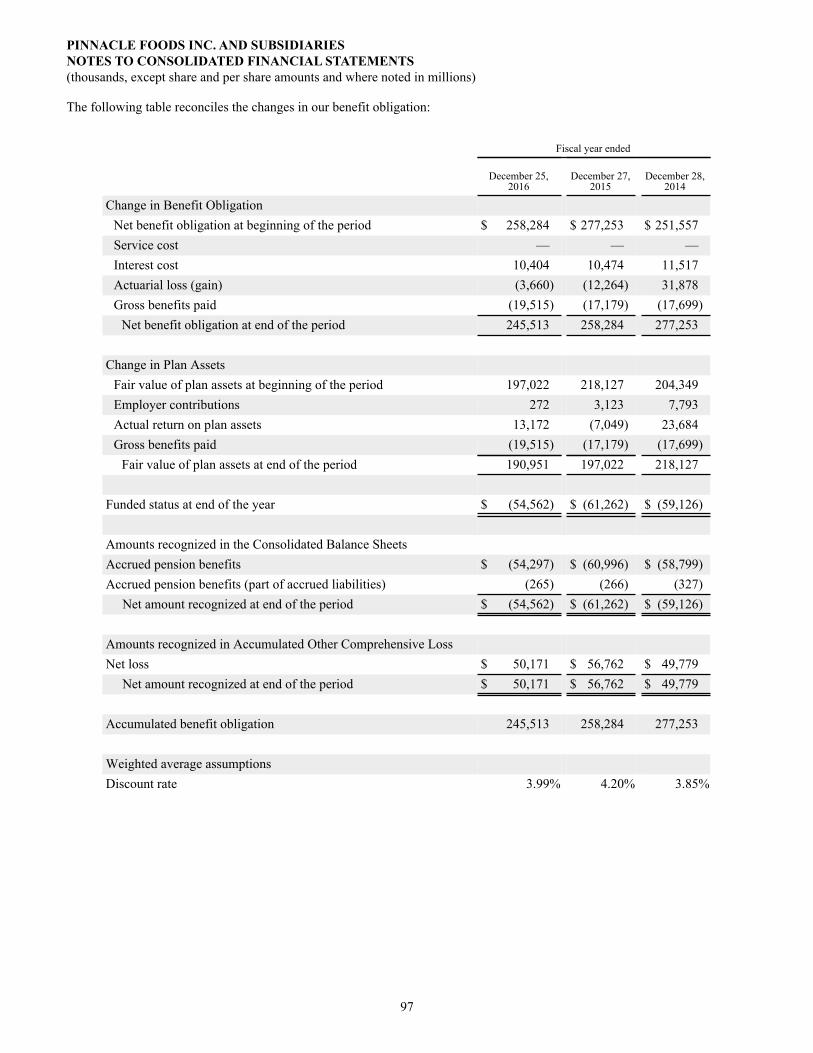
PINNACLE FOODS INC. AND SUBSIDIARIESNOTES TO CONSOLIDATED FINANCIAL STATEMENTS(thousands, except share and per share amounts and where noted in millions)
97
The following table reconciles the changes in our benefit obligation:
Fiscal year ended
December 25,2016
December 27,2015
December 28,2014
Change in Benefit ObligationNet benefit obligation at beginning of the period $ 258,284 $ 277,253 $ 251,557Service cost — — —Interest cost 10,404 10,474 11,517Actuarial loss (gain) (3,660) (12,264) 31,878Gross benefits paid (19,515) (17,179) (17,699)
Net benefit obligation at end of the period 245,513 258,284 277,253
Change in Plan AssetsFair value of plan assets at beginning of the period 197,022 218,127 204,349Employer contributions 272 3,123 7,793Actual return on plan assets 13,172 (7,049) 23,684Gross benefits paid (19,515) (17,179) (17,699)
Fair value of plan assets at end of the period 190,951 197,022 218,127
Funded status at end of the year $ (54,562) $ (61,262) $ (59,126)
Amounts recognized in the Consolidated Balance SheetsAccrued pension benefits $ (54,297) $ (60,996) $ (58,799)Accrued pension benefits (part of accrued liabilities) (265) (266) (327) Net amount recognized at end of the period $ (54,562) $ (61,262) $ (59,126)
Amounts recognized in Accumulated Other Comprehensive LossNet loss $ 50,171 $ 56,762 $ 49,779 Net amount recognized at end of the period $ 50,171 $ 56,762 $ 49,779
Accumulated benefit obligation 245,513 258,284 277,253
Weighted average assumptionsDiscount rate 3.99% 4.20% 3.85%
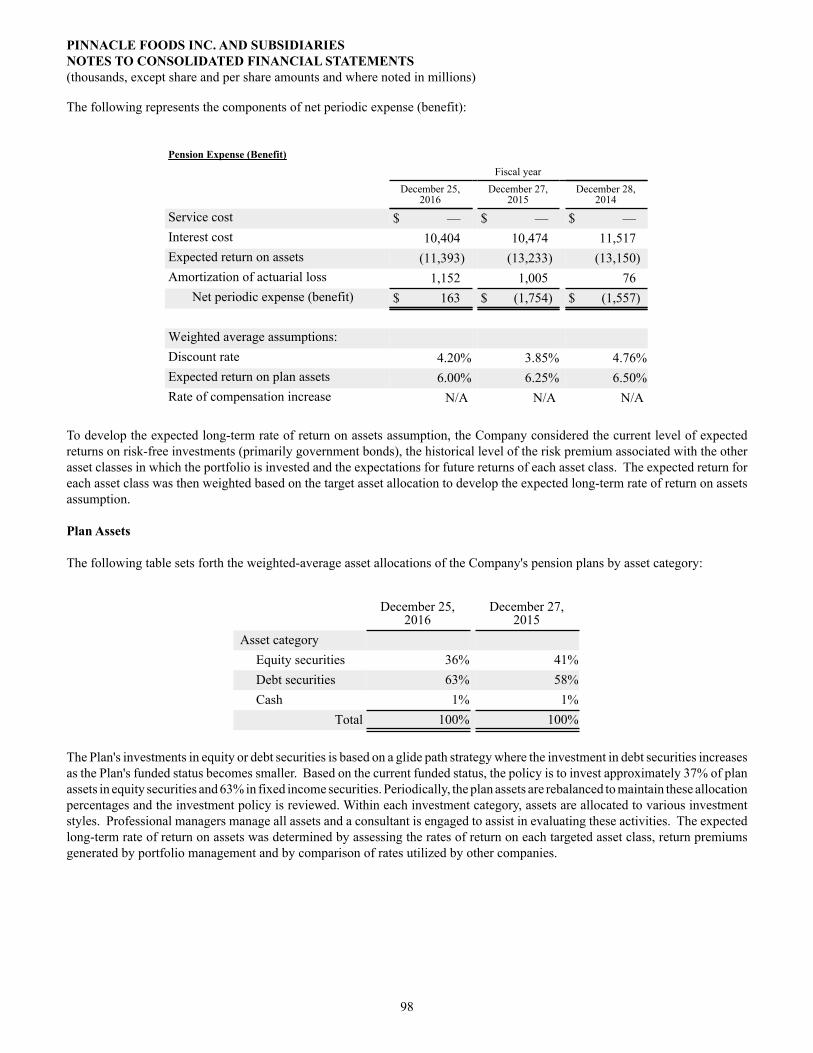
PINNACLE FOODS INC. AND SUBSIDIARIESNOTES TO CONSOLIDATED FINANCIAL STATEMENTS(thousands, except share and per share amounts and where noted in millions)
98
The following represents the components of net periodic expense (benefit):
Pension Expense (Benefit) Fiscal year
December 25,
2016December 27,
2015December 28,
2014
Service cost $ — $ — $ —Interest cost 10,404 10,474 11,517Expected return on assets (11,393) (13,233) (13,150)Amortization of actuarial loss 1,152 1,005 76
Net periodic expense (benefit) $ 163 $ (1,754) $ (1,557)
Weighted average assumptions:Discount rate 4.20% 3.85% 4.76%Expected return on plan assets 6.00% 6.25% 6.50%Rate of compensation increase N/A N/A N/A
To develop the expected long-term rate of return on assets assumption, the Company considered the current level of expected returns on risk-free investments (primarily government bonds), the historical level of the risk premium associated with the other asset classes in which the portfolio is invested and the expectations for future returns of each asset class. The expected return for each asset class was then weighted based on the target asset allocation to develop the expected long-term rate of return on assets assumption.
Plan Assets
The following table sets forth the weighted-average asset allocations of the Company's pension plans by asset category:
December 25,2016
December 27,2015
Asset category Equity securities 36% 41% Debt securities 63% 58% Cash 1% 1%
Total 100% 100%
The Plan's investments in equity or debt securities is based on a glide path strategy where the investment in debt securities increases as the Plan's funded status becomes smaller. Based on the current funded status, the policy is to invest approximately 37% of plan assets in equity securities and 63% in fixed income securities. Periodically, the plan assets are rebalanced to maintain these allocation percentages and the investment policy is reviewed. Within each investment category, assets are allocated to various investment styles. Professional managers manage all assets and a consultant is engaged to assist in evaluating these activities. The expected long-term rate of return on assets was determined by assessing the rates of return on each targeted asset class, return premiums generated by portfolio management and by comparison of rates utilized by other companies.
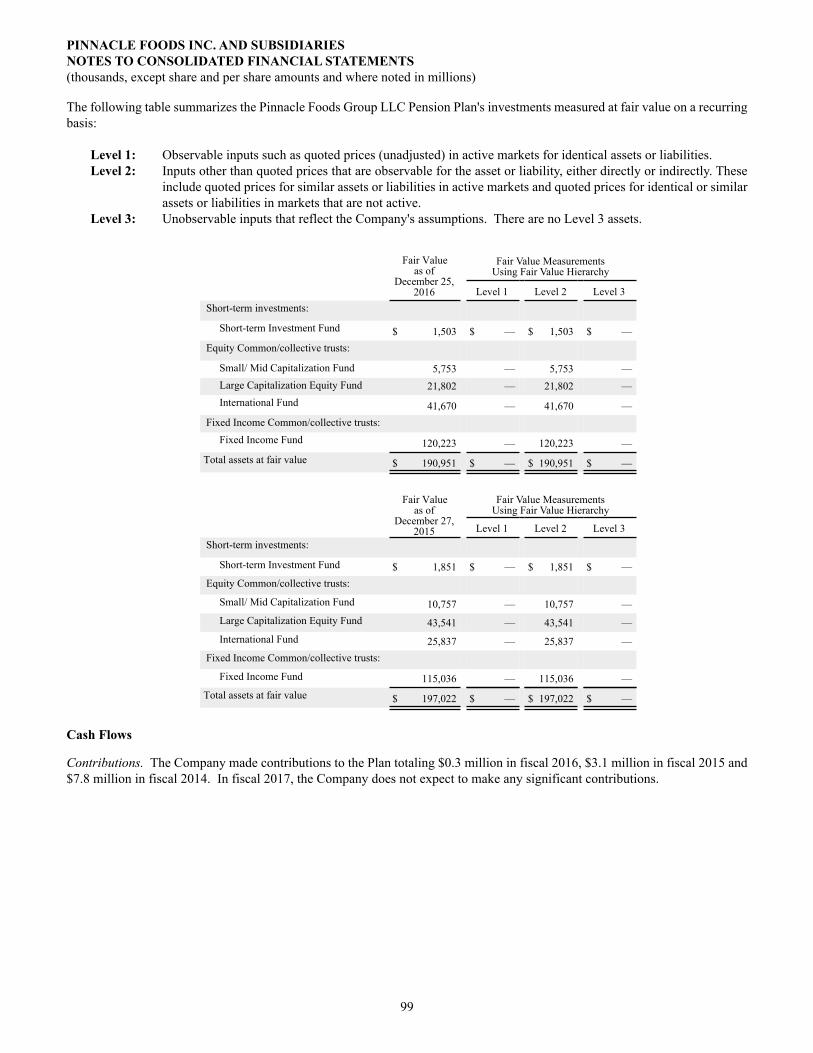
PINNACLE FOODS INC. AND SUBSIDIARIESNOTES TO CONSOLIDATED FINANCIAL STATEMENTS(thousands, except share and per share amounts and where noted in millions)
99
The following table summarizes the Pinnacle Foods Group LLC Pension Plan's investments measured at fair value on a recurring basis:
Level 1: Observable inputs such as quoted prices (unadjusted) in active markets for identical assets or liabilities.Level 2: Inputs other than quoted prices that are observable for the asset or liability, either directly or indirectly. These
include quoted prices for similar assets or liabilities in active markets and quoted prices for identical or similar assets or liabilities in markets that are not active.
Level 3: Unobservable inputs that reflect the Company's assumptions. There are no Level 3 assets.
Fair Value
as ofDecember 25,
2016
Fair Value MeasurementsUsing Fair Value Hierarchy
Level 1 Level 2 Level 3 Short-term investments:
Short-term Investment Fund $ 1,503 $ — $ 1,503 $ — Equity Common/collective trusts:
Small/ Mid Capitalization Fund 5,753 — 5,753 —Large Capitalization Equity Fund 21,802 — 21,802 —International Fund 41,670 — 41,670 —
Fixed Income Common/collective trusts:Fixed Income Fund 120,223 — 120,223 —
Total assets at fair value $ 190,951 $ — $ 190,951 $ —
Fair Value
as ofDecember 27,
2015
Fair Value MeasurementsUsing Fair Value Hierarchy
Level 1 Level 2 Level 3 Short-term investments:
Short-term Investment Fund $ 1,851 $ — $ 1,851 $ — Equity Common/collective trusts:
Small/ Mid Capitalization Fund 10,757 — 10,757 —Large Capitalization Equity Fund 43,541 — 43,541 —International Fund 25,837 — 25,837 —
Fixed Income Common/collective trusts:
Fixed Income Fund 115,036 — 115,036 —Total assets at fair value $ 197,022 $ — $ 197,022 $ —
Cash Flows
Contributions. The Company made contributions to the Plan totaling $0.3 million in fiscal 2016, $3.1 million in fiscal 2015 and $7.8 million in fiscal 2014. In fiscal 2017, the Company does not expect to make any significant contributions.

PINNACLE FOODS INC. AND SUBSIDIARIESNOTES TO CONSOLIDATED FINANCIAL STATEMENTS(thousands, except share and per share amounts and where noted in millions)
100
Estimated Future Benefit Payments for all Plans
The following benefit payments are expected to be paid:
Year Benefit Payment ($)2017 15,0642018 14,9192019 14,7402020 14,7632021 14,836
2022-2026 74,857
Savings Plans
The Company's employees participated in three 401(k) plans in 2016. Pinnacle matches 50% of employee contributions up to six percent of compensation for salaried employees and the Company also matches 50% of employee contributions up to six percent of compensation for the majority of union employees. It is our current intent to continue the match at these levels. Boulder Brands had a 401(k) plan which matched 100% of employee contributions up to 5 percent of compensation. The plan was liquidated on January 3, 2017, with all employees now participating in Pinnacle's 401(k) plans. Employer contributions made by the Company relating to these plans were $6.9 million for fiscal 2016, $5.6 million for fiscal 2015 and $5.1 million for fiscal 2014.
In addition, the Company sponsors three non-qualified Plans. One is the Birds Eye Foods non-qualified plan which was closed to new contributions on April 1, 2010. The second plan is the Pinnacle Foods Supplemental Savings Plan which was approved by the Compensation Committee of the Board of Directors on September 11, 2012 to become effective in 2013 and was adopted for the purpose of allowing certain employees the opportunity to receive the same 3% match on total compensation (base salary plus bonus). The third plan is the Boulder Brands Deferred Compensation Plan, which had three participants at the time of the Boulder Brands acquisition. The Board of Directors approved the termination of this plan effective August 16, 2016. All of the assets were liquidated and paid to the remaining participants in January 2017.
Multi-employer Plan Pinnacle contributes to the United Food and Commercial Workers International Union Industry Pension Fund (EIN 51-6055922) (the "UFCW Plan") under the terms of the collective-bargaining agreement with its Fort Madison employees.
For the fiscal years ended December 25, 2016, December 27, 2015 and December 28, 2014 contributions to the UFCW Plan were $0.7 million, $0.8 million and $0.8 million, respectively. The contributions to this plan are paid monthly based upon the number of employees. They represent less than 5% of the total contributions received by this plan during the most recent plan year.
The risks of participating in multi-employer plans are different from single-employer plans in the following aspects: (a) assets contributed to a multi-employer plan by one employer may be used to provide benefits to employees of other participating employers, (b) if a participating employer stops contributing to the multi-employer plan, the unfunded obligations of the plan may be borne by the remaining participating employers and (c) if the Company chooses to stop participating in the plan, the Company may be required to pay a withdrawal liability based on the underfunded status of the plan. The UFCW Plan received a Pension Protection Act “green” zone status for the plan year ending June 30, 2016. The zone status is based on information the Company received from the plan and is certified by the plan's actuary. Among other factors, plans in the "green" zone are at least 80 percent funded. The UFCW Plan did not utilize any extended amortization provisions that effect its placement in the "green" zone. The UFCW Plan has never been required to implement a funding improvement plan nor is one pending at this time.

PINNACLE FOODS INC. AND SUBSIDIARIESNOTES TO CONSOLIDATED FINANCIAL STATEMENTS(thousands, except share and per share amounts and where noted in millions)
101
12. Financial Instruments
Risk Management Objective of Using Derivatives
The Company is exposed to certain risks arising from both its business operations and economic conditions. The Company principally manages its exposures to a wide variety of business and operational risks through management of its core business activities. The Company manages economic risks, including interest rate, liquidity, and credit risk primarily by managing the amount, sources, and duration of its debt funding and the use of derivative financial instruments. The primary risks managed by using derivative instruments are interest rate risk, foreign currency exchange risk and commodity price risk. Specifically, the Company enters into derivative financial instruments to manage exposures that arise from business activities that result in the receipt or payment of future known and uncertain cash amounts, the value of which are determined by interest rates, foreign exchange rates or commodity prices.
The Company manages interest rate risk based on the varying circumstances of anticipated borrowings and existing variable and fixed rate debt, including the Company’s revolving credit facility. Examples of interest rate management strategies include capping interest rates using targeted interest cost benchmarks, hedging portions of the total amount of debt, or hedging a period of months and not always hedging to maturity, and at other times locking in rates to fix interests costs.
Certain parts of the Company’s foreign operations in Canada expose the Company to fluctuations in foreign exchange rates. The Company’s goal is to reduce its exposure to such foreign exchange risks on its foreign currency cash flows and fair value fluctuations on recognized foreign currency denominated assets, liabilities and unrecognized firm commitments to acceptable levels primarily through the use of foreign exchange-related derivative financial instruments. The Company enters into derivative financial instruments to protect the value or fix the amount of certain obligations in terms of its functional currency. The Company does not enter into these transactions for non-hedging purposes.
The Company purchases raw materials in quantities expected to be used in a reasonable period of time in the normal course of business. The Company generally enters into agreements for either spot market delivery or forward delivery. The prices paid in the forward delivery contracts are generally fixed, but may also be variable subject to fluctuations in underlying commodity prices. Forward derivative contracts on certain commodities are entered into to manage the price risk associated with forecasted purchases of materials used in the Company’s manufacturing processes.
Cash Flow Hedges of Interest Rate Risk
The Company’s objectives in using interest rate derivatives are to add stability to interest expense and to manage its exposure to interest rate movements. To accomplish this objective, the Company primarily uses interest rate swaps. Interest rate swaps designated as cash flow hedges involve the receipt of variable-rate amounts from a counterparty in exchange for the Company making fixed-rate payments over the life of the agreements without exchange of the underlying notional amount. During the fiscal years ended December 25, 2016, December 27, 2015 and December 28, 2014 such derivatives were used to hedge the variable cash flows associated with existing variable-rate debt.
As of December 25, 2016, the Company had the following interest rate swaps that were designated as cash flow hedges of interest rate risk:
ProductNumber ofInstruments
CurrentNotionalAmountHedged Fixed Rate Range Index Trade Dates
MaturityDates
Interest Rate Swaps 9 $ 1,006,300 1.45% - 2.97% USD-LIBOR-BBAApr 2013 -Oct 2013
Apr 2017 -Apr 2020
The effective portion of changes in the fair value of derivatives designated and that qualify as cash flow hedges is recorded in AOCL in the Consolidated Balance Sheets and is subsequently reclassified into earnings in the period that the hedged forecasted transaction affects earnings. The ineffective portion of the change in fair value of the derivatives is recognized directly in earnings. Amounts reported in AOCL related to derivatives will be reclassified to Interest expense as interest payments are made on the Company’s variable-rate debt. As discussed in more detail in Note 18 to the Financial Statements, on February 3, 2017, the Company amended its credit agreement which significantly changed its debt profile and associated interest rate swaps. Had the Company

PINNACLE FOODS INC. AND SUBSIDIARIESNOTES TO CONSOLIDATED FINANCIAL STATEMENTS(thousands, except share and per share amounts and where noted in millions)
102
not amended its credit agreement, during the next twelve months, the Company estimates that an additional $8,209 would have been reclassified as an increase to Interest expense.
Cash Flow Hedges of Foreign Exchange Risk
The Company’s operations in Canada expose the Company to changes in the U.S. Dollar – Canadian Dollar ("USD-CAD") foreign exchange rate. From time to time, the Company’s Canadian subsidiary purchases inventory denominated in U.S. Dollars ("USD"), a currency other than its functional currency. The subsidiary sells that inventory in Canadian dollars ("CAD"). The subsidiary uses currency forward and collar agreements to manage its exposure to fluctuations in the USD-CAD exchange rate. Currency forward agreements involve fixing the USD-CAD exchange rate for delivery of a specified amount of foreign currency on a specified date. Currency collar agreements involve the sale of CAD currency in exchange for receiving USD if exchange rates rise above an agreed upon rate and purchase of USD currency in exchange for paying CAD currency if exchange rates fall below an agreed upon rate at specified dates.
As of December 25, 2016, the Company had the following foreign currency exchange contracts (in aggregate) that were designated as cash flow hedges of foreign exchange risk:
ProductNumber ofInstruments
Notional Sold inAggregate in
("CAD")
NotionalPurchased inAggregate in
("USD")
USD to CADExchange
Rates Trade DateMaturity
Dates
Canadian $ contracts 6 $ 12,000 $ 8,958 1.339 - 1.340 Nov 2016 Jan 2017 -Jun 2017
The effective portion of changes in the fair value of derivatives designated that qualify as cash flow hedges of foreign exchange risk is recorded in AOCL in the Consolidated Balance Sheets and subsequently reclassified into earnings in the period that the hedged forecasted transaction affects earnings. The ineffective portions of the change in fair value of the derivative, as well as amounts excluded from the assessment of hedge effectiveness, are recognized directly in Cost of products sold in the Consolidated Statements of Operations.
Non-designated Hedges of Commodity Risk
Derivatives not designated as hedges are not speculative and are used to manage the Company’s exposure to commodity price risk but do not meet the authoritative guidance for hedge accounting. From time to time, the Company enters into commodity forward contracts to fix the price of diesel fuel, natural gas, soybean oil purchases and other commodities at a future delivery date. Changes in the fair value of derivatives not designated in hedging relationships are recorded directly in Cost of products sold in the Consolidated Statements of Operations.
As of December 25, 2016, the Company had the following derivative instruments that were not designated in qualifying hedging relationships:
Commodity ContractsNumber ofInstruments
NotionalPurchased inAggregate Price/Index Trade Dates
MaturityDates
Diesel Fuel Contracts 1 7,205,182Gallons
3.68 - 3.80 perGallon Nov 2014 Jan 2017
Heating Oil Contracts 17 11,920,535Gallons
1.25 - 1.82 perGallon
Jan 2015 -Nov 2016
Jan 2017 -Dec 2017
Natural Gas Contracts 3 968,690MMBTU's
3.04 - 3.55 perMMBTU
July 2016 -Oct 2016
Jan 2017 -Dec 2017
The table below presents the fair value of the Company’s derivative financial instruments as well as their classification in the Consolidated Balance Sheets as of December 25, 2016 and December 27, 2015.
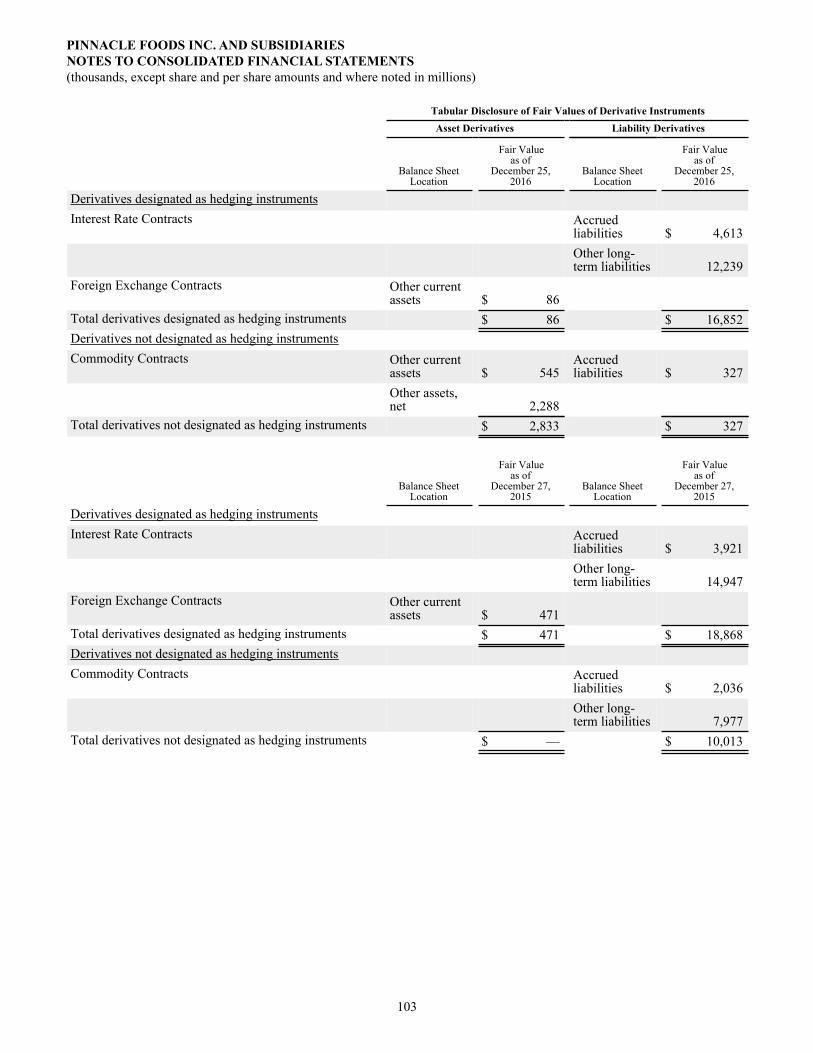
PINNACLE FOODS INC. AND SUBSIDIARIESNOTES TO CONSOLIDATED FINANCIAL STATEMENTS(thousands, except share and per share amounts and where noted in millions)
103
Tabular Disclosure of Fair Values of Derivative Instruments Asset Derivatives Liability Derivatives
Balance Sheet
Location
Fair Valueas of
December 25,2016
Balance SheetLocation
Fair Valueas of
December 25,2016
Derivatives designated as hedging instrumentsInterest Rate Contracts Accrued
liabilities $ 4,613Other long-term liabilities 12,239
Foreign Exchange Contracts Other currentassets $ 86
Total derivatives designated as hedging instruments $ 86 $ 16,852Derivatives not designated as hedging instrumentsCommodity Contracts Other current
assets $ 545Accruedliabilities $ 327
Other assets,net 2,288
Total derivatives not designated as hedging instruments $ 2,833 $ 327
Balance Sheet
Location
Fair Valueas of
December 27,2015
Balance SheetLocation
Fair Valueas of
December 27,2015
Derivatives designated as hedging instrumentsInterest Rate Contracts Accrued
liabilities $ 3,921Other long-term liabilities 14,947
Foreign Exchange Contracts Other currentassets $ 471
Total derivatives designated as hedging instruments $ 471 $ 18,868Derivatives not designated as hedging instrumentsCommodity Contracts Accrued
liabilities $ 2,036Other long-term liabilities 7,977
Total derivatives not designated as hedging instruments $ — $ 10,013
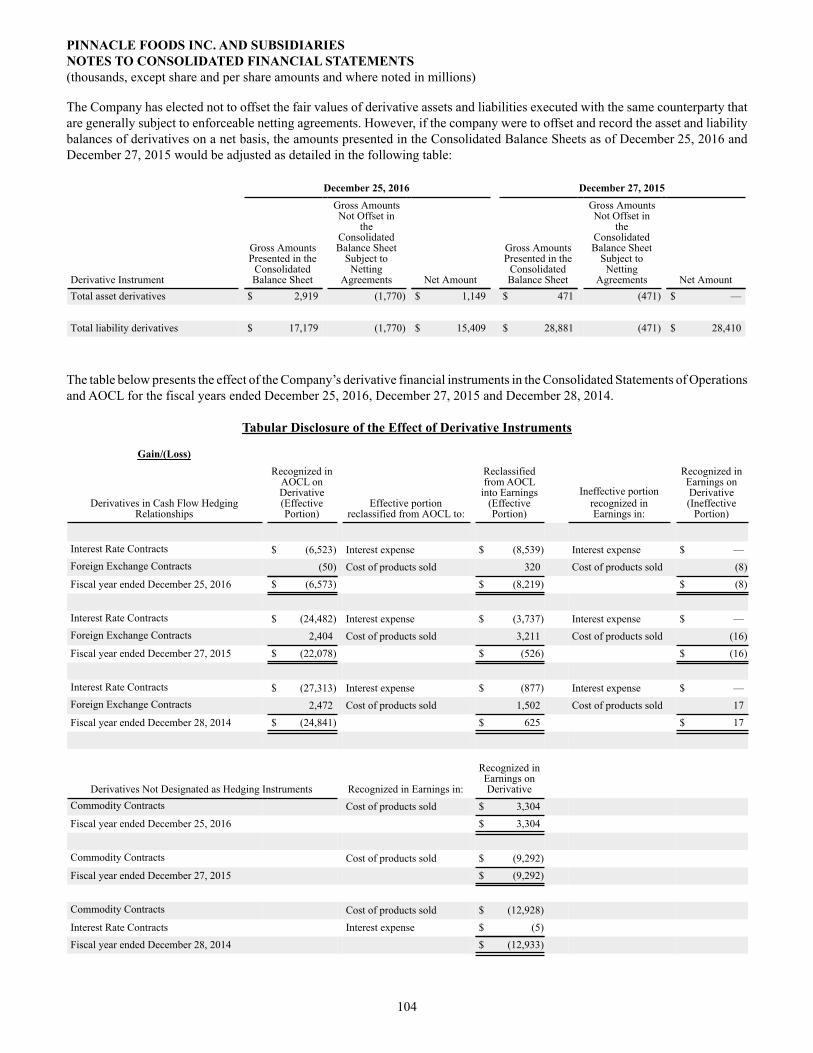
PINNACLE FOODS INC. AND SUBSIDIARIESNOTES TO CONSOLIDATED FINANCIAL STATEMENTS(thousands, except share and per share amounts and where noted in millions)
104
The Company has elected not to offset the fair values of derivative assets and liabilities executed with the same counterparty that are generally subject to enforceable netting agreements. However, if the company were to offset and record the asset and liability balances of derivatives on a net basis, the amounts presented in the Consolidated Balance Sheets as of December 25, 2016 and December 27, 2015 would be adjusted as detailed in the following table:
December 25, 2016 December 27, 2015
Derivative Instrument
Gross AmountsPresented in the
ConsolidatedBalance Sheet
Gross AmountsNot Offset in
theConsolidatedBalance Sheet
Subject toNetting
Agreements Net Amount
Gross AmountsPresented in the
ConsolidatedBalance Sheet
Gross AmountsNot Offset in
theConsolidatedBalance Sheet
Subject toNetting
Agreements Net AmountTotal asset derivatives $ 2,919 (1,770) $ 1,149 $ 471 (471) $ —
Total liability derivatives $ 17,179 (1,770) $ 15,409 $ 28,881 (471) $ 28,410
The table below presents the effect of the Company’s derivative financial instruments in the Consolidated Statements of Operations and AOCL for the fiscal years ended December 25, 2016, December 27, 2015 and December 28, 2014.
Tabular Disclosure of the Effect of Derivative Instruments
Gain/(Loss)
Derivatives in Cash Flow HedgingRelationships
Recognized inAOCL onDerivative(EffectivePortion)
Effective portionreclassified from AOCL to:
Reclassifiedfrom AOCL
into Earnings(EffectivePortion)
Ineffective portionrecognized in Earnings in:
Recognized inEarnings onDerivative(Ineffective
Portion)
Interest Rate Contracts $ (6,523) Interest expense $ (8,539) Interest expense $ —Foreign Exchange Contracts (50) Cost of products sold 320 Cost of products sold (8)Fiscal year ended December 25, 2016 $ (6,573) $ (8,219) $ (8)
Interest Rate Contracts $ (24,482) Interest expense $ (3,737) Interest expense $ —Foreign Exchange Contracts 2,404 Cost of products sold 3,211 Cost of products sold (16)Fiscal year ended December 27, 2015 $ (22,078) $ (526) $ (16)
Interest Rate Contracts $ (27,313) Interest expense $ (877) Interest expense $ —Foreign Exchange Contracts 2,472 Cost of products sold 1,502 Cost of products sold 17Fiscal year ended December 28, 2014 $ (24,841) $ 625 $ 17
Derivatives Not Designated as Hedging Instruments Recognized in Earnings in:
Recognized inEarnings onDerivative
Commodity Contracts Cost of products sold $ 3,304Fiscal year ended December 25, 2016 $ 3,304
Commodity Contracts Cost of products sold $ (9,292)Fiscal year ended December 27, 2015 $ (9,292)
Commodity Contracts Cost of products sold $ (12,928)Interest Rate Contracts Interest expense $ (5)Fiscal year ended December 28, 2014 $ (12,933)
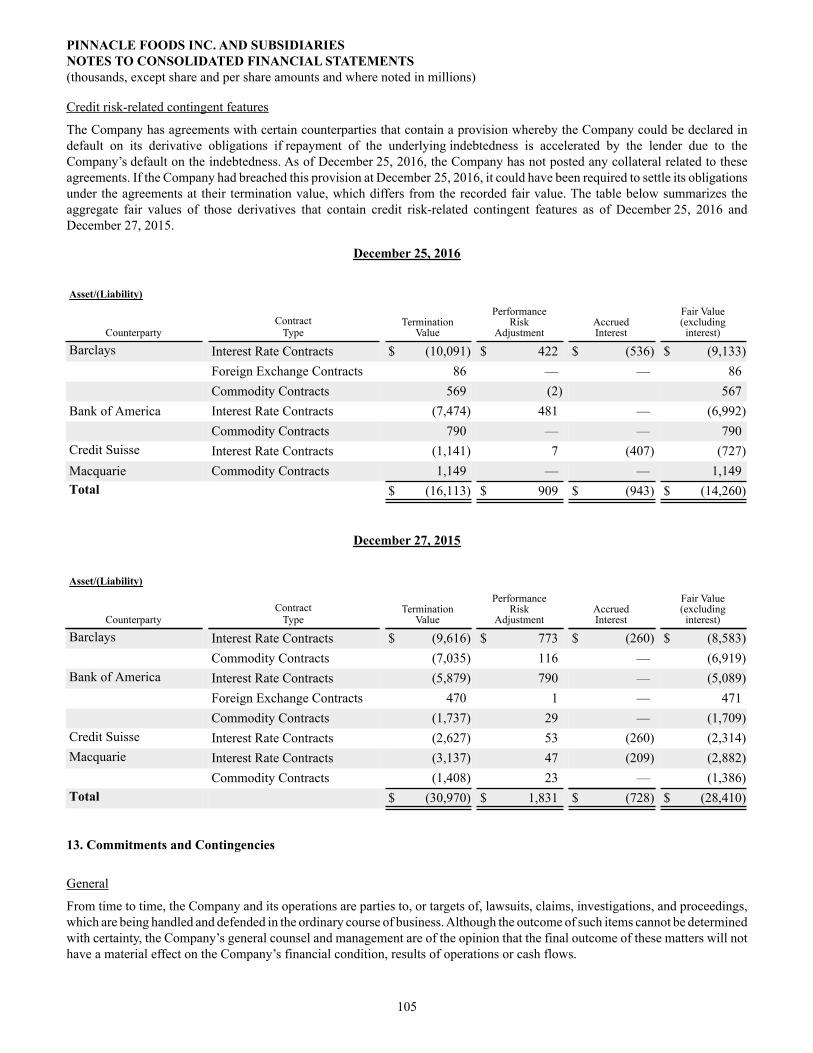
PINNACLE FOODS INC. AND SUBSIDIARIESNOTES TO CONSOLIDATED FINANCIAL STATEMENTS(thousands, except share and per share amounts and where noted in millions)
105
Credit risk-related contingent features
The Company has agreements with certain counterparties that contain a provision whereby the Company could be declared in default on its derivative obligations if repayment of the underlying indebtedness is accelerated by the lender due to the Company’s default on the indebtedness. As of December 25, 2016, the Company has not posted any collateral related to these agreements. If the Company had breached this provision at December 25, 2016, it could have been required to settle its obligations under the agreements at their termination value, which differs from the recorded fair value. The table below summarizes the aggregate fair values of those derivatives that contain credit risk-related contingent features as of December 25, 2016 and December 27, 2015.
December 25, 2016
Asset/(Liability)
CounterpartyContract
TypeTermination
Value
PerformanceRisk
AdjustmentAccruedInterest
Fair Value(excludinginterest)
Barclays Interest Rate Contracts $ (10,091) $ 422 $ (536) $ (9,133)Foreign Exchange Contracts 86 — — 86Commodity Contracts 569 (2) 567
Bank of America Interest Rate Contracts (7,474) 481 — (6,992)Commodity Contracts 790 — — 790
Credit Suisse Interest Rate Contracts (1,141) 7 (407) (727)Macquarie Commodity Contracts 1,149 — — 1,149Total $ (16,113) $ 909 $ (943) $ (14,260)
December 27, 2015
Asset/(Liability)
CounterpartyContract
TypeTermination
Value
PerformanceRisk
AdjustmentAccruedInterest
Fair Value(excludinginterest)
Barclays Interest Rate Contracts $ (9,616) $ 773 $ (260) $ (8,583)Commodity Contracts (7,035) 116 — (6,919)
Bank of America Interest Rate Contracts (5,879) 790 — (5,089)Foreign Exchange Contracts 470 1 — 471Commodity Contracts (1,737) 29 — (1,709)
Credit Suisse Interest Rate Contracts (2,627) 53 (260) (2,314)Macquarie Interest Rate Contracts (3,137) 47 (209) (2,882)
Commodity Contracts (1,408) 23 — (1,386)Total $ (30,970) $ 1,831 $ (728) $ (28,410)
13. Commitments and Contingencies
General
From time to time, the Company and its operations are parties to, or targets of, lawsuits, claims, investigations, and proceedings, which are being handled and defended in the ordinary course of business. Although the outcome of such items cannot be determined with certainty, the Company’s general counsel and management are of the opinion that the final outcome of these matters will not have a material effect on the Company’s financial condition, results of operations or cash flows.
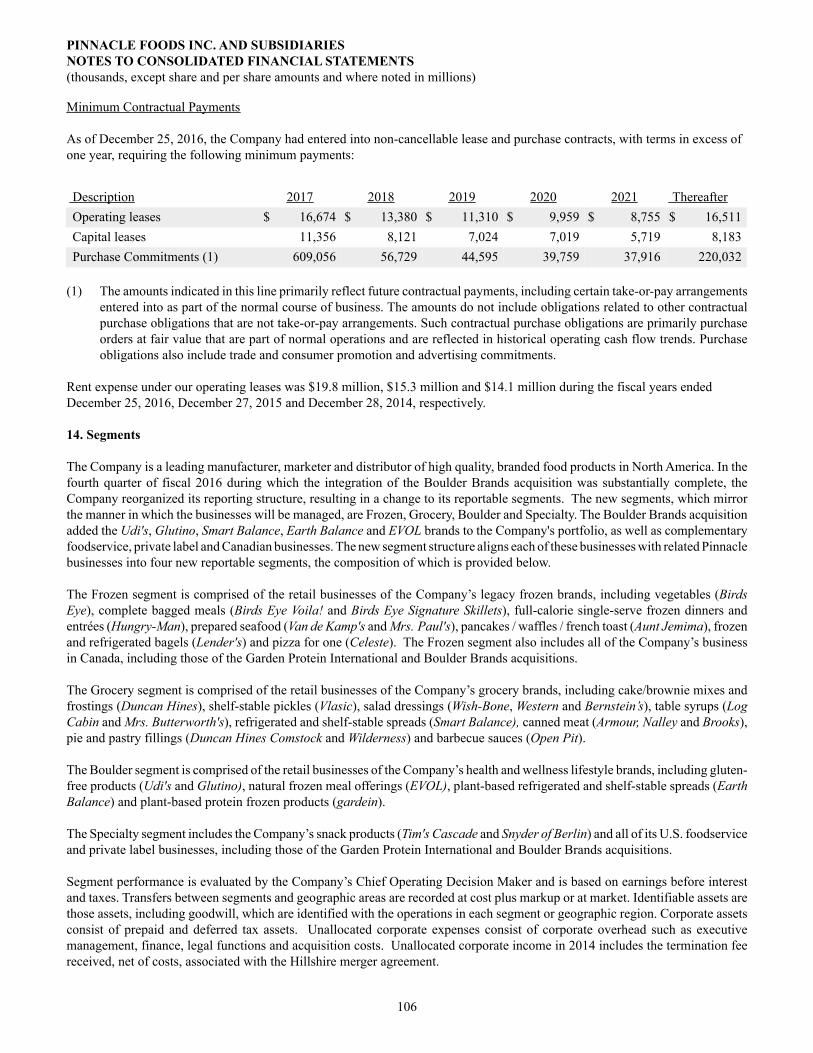
PINNACLE FOODS INC. AND SUBSIDIARIESNOTES TO CONSOLIDATED FINANCIAL STATEMENTS(thousands, except share and per share amounts and where noted in millions)
106
Minimum Contractual Payments
As of December 25, 2016, the Company had entered into non-cancellable lease and purchase contracts, with terms in excess of one year, requiring the following minimum payments:
Description 2017 2018 2019 2020 2021 Thereafter Operating leases $ 16,674 $ 13,380 $ 11,310 $ 9,959 $ 8,755 $ 16,511 Capital leases 11,356 8,121 7,024 7,019 5,719 8,183 Purchase Commitments (1) 609,056 56,729 44,595 39,759 37,916 220,032
(1) The amounts indicated in this line primarily reflect future contractual payments, including certain take-or-pay arrangements entered into as part of the normal course of business. The amounts do not include obligations related to other contractual purchase obligations that are not take-or-pay arrangements. Such contractual purchase obligations are primarily purchase orders at fair value that are part of normal operations and are reflected in historical operating cash flow trends. Purchase obligations also include trade and consumer promotion and advertising commitments.
Rent expense under our operating leases was $19.8 million, $15.3 million and $14.1 million during the fiscal years ended December 25, 2016, December 27, 2015 and December 28, 2014, respectively.
14. Segments
The Company is a leading manufacturer, marketer and distributor of high quality, branded food products in North America. In the fourth quarter of fiscal 2016 during which the integration of the Boulder Brands acquisition was substantially complete, the Company reorganized its reporting structure, resulting in a change to its reportable segments. The new segments, which mirror the manner in which the businesses will be managed, are Frozen, Grocery, Boulder and Specialty. The Boulder Brands acquisition added the Udi's, Glutino, Smart Balance, Earth Balance and EVOL brands to the Company's portfolio, as well as complementary foodservice, private label and Canadian businesses. The new segment structure aligns each of these businesses with related Pinnacle businesses into four new reportable segments, the composition of which is provided below.
The Frozen segment is comprised of the retail businesses of the Company’s legacy frozen brands, including vegetables (Birds Eye), complete bagged meals (Birds Eye Voila! and Birds Eye Signature Skillets), full-calorie single-serve frozen dinners and entrées (Hungry-Man), prepared seafood (Van de Kamp's and Mrs. Paul's), pancakes / waffles / french toast (Aunt Jemima), frozen and refrigerated bagels (Lender's) and pizza for one (Celeste). The Frozen segment also includes all of the Company’s business in Canada, including those of the Garden Protein International and Boulder Brands acquisitions.
The Grocery segment is comprised of the retail businesses of the Company’s grocery brands, including cake/brownie mixes and frostings (Duncan Hines), shelf-stable pickles (Vlasic), salad dressings (Wish-Bone, Western and Bernstein’s), table syrups (Log Cabin and Mrs. Butterworth's), refrigerated and shelf-stable spreads (Smart Balance), canned meat (Armour, Nalley and Brooks), pie and pastry fillings (Duncan Hines Comstock and Wilderness) and barbecue sauces (Open Pit).
The Boulder segment is comprised of the retail businesses of the Company’s health and wellness lifestyle brands, including gluten-free products (Udi's and Glutino), natural frozen meal offerings (EVOL), plant-based refrigerated and shelf-stable spreads (Earth Balance) and plant-based protein frozen products (gardein).
The Specialty segment includes the Company’s snack products (Tim's Cascade and Snyder of Berlin) and all of its U.S. foodservice and private label businesses, including those of the Garden Protein International and Boulder Brands acquisitions.
Segment performance is evaluated by the Company’s Chief Operating Decision Maker and is based on earnings before interest and taxes. Transfers between segments and geographic areas are recorded at cost plus markup or at market. Identifiable assets are those assets, including goodwill, which are identified with the operations in each segment or geographic region. Corporate assets consist of prepaid and deferred tax assets. Unallocated corporate expenses consist of corporate overhead such as executive management, finance, legal functions and acquisition costs. Unallocated corporate income in 2014 includes the termination fee received, net of costs, associated with the Hillshire merger agreement.

PINNACLE FOODS INC. AND SUBSIDIARIESNOTES TO CONSOLIDATED FINANCIAL STATEMENTS(thousands, except share and per share amounts and where noted in millions)
107
Fiscal yearSEGMENT INFORMATION December 25,
2016December 27,
2015December 28,
2014
52 weeks 52 weeks 52 weeks
Net salesFrozen $ 1,304,791 $ 1,235,951 $ 1,190,354Grocery 1,089,270 1,024,269 1,050,085Boulder 364,716 41,494 4,307Specialty 369,161 354,078 346,437
Total $ 3,127,938 $ 2,655,792 $ 2,591,183Earnings (loss) before interest and taxes
Frozen $ 240,919 $ 218,536 $ 193,185Grocery 229,155 203,146 177,381Boulder 9,096 (5,498) (4,242)Specialty 32,263 34,369 31,029Unallocated corporate income (expenses) (31,788) (25,851) 114,918
Total $ 479,645 $ 424,702 $ 512,271Depreciation and amortization
Frozen $ 42,371 $ 42,162 $ 40,688Grocery 32,971 30,671 26,405Boulder 13,230 2,430 379Specialty 17,200 14,397 13,155
Total $ 105,772 $ 89,660 $ 80,627Capital expenditures (1)
Frozen $ 57,555 $ 46,662 $ 29,359Grocery 28,038 42,289 66,422Boulder 20,404 8,457 747Specialty 13,067 11,069 7,727
Total $ 119,064 $ 108,477 $ 104,255
NET SALES BY PRODUCT TYPE
Net salesFrozen $ 1,664,505 $ 1,384,587 $ 1,278,147Meals and Meal Enhancers 990,642 859,598 876,670Desserts 330,876 309,702 331,766Snacks 141,915 101,905 104,600
Total $ 3,127,938 $ 2,655,792 $ 2,591,183
GEOGRAPHIC INFORMATIONNet sales
United States $ 3,064,800 $ 2,635,141 $ 2,563,730Canada 165,761 118,194 82,722United Kingdom 8,573 — —Intercompany (111,196) (97,543) (55,269)
Total $ 3,127,938 $ 2,655,792 $ 2,591,183

PINNACLE FOODS INC. AND SUBSIDIARIESNOTES TO CONSOLIDATED FINANCIAL STATEMENTS(thousands, except share and per share amounts and where noted in millions)
108
(1) Includes new capital leases.
SEGMENT INFORMATIONDecember 25,
2016December 27,
2015
Total assetsFrozen $ 2,431,701 $ 2,344,733Grocery 2,833,186 2,461,198Boulder 1,030,053 138,257Specialty 391,276 335,436Corporate 53,429 44,539
Total $ 6,739,645 $ 5,324,163GEOGRAPHIC INFORMATIONLong-lived assets
United States $ 690,515 $ 615,123Canada 31,399 15,986United Kingdom 1,431 —
Total $ 723,345 $ 631,109
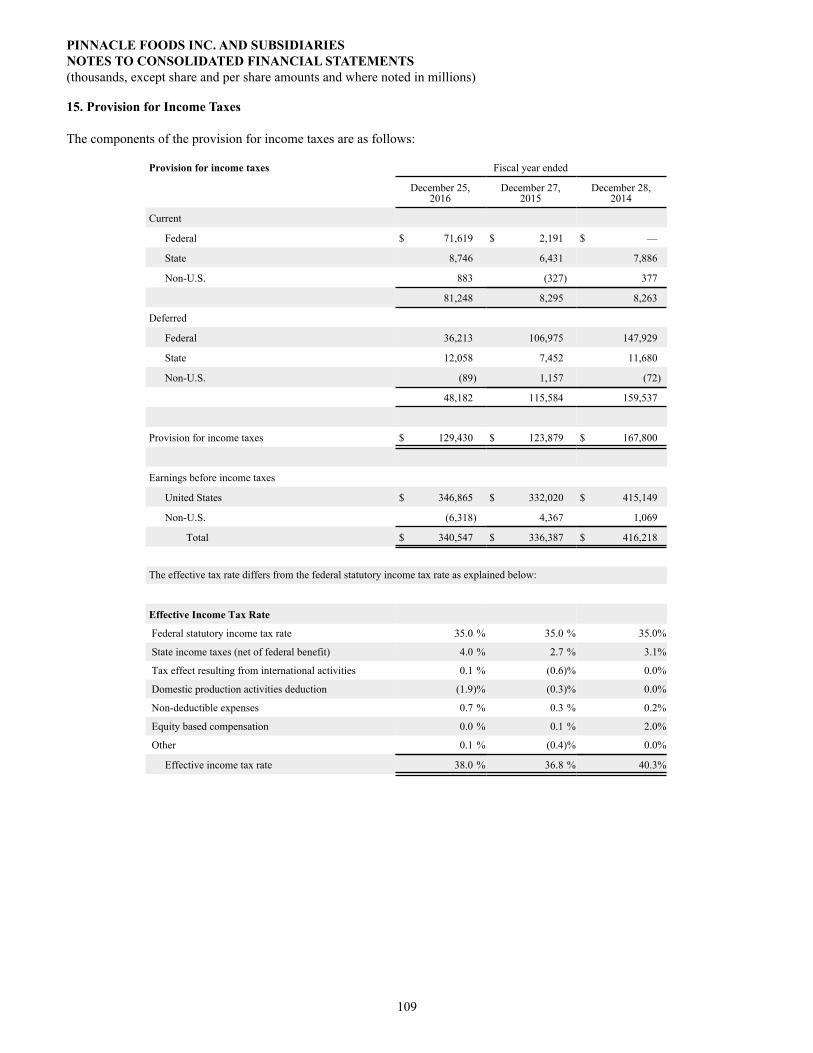
PINNACLE FOODS INC. AND SUBSIDIARIESNOTES TO CONSOLIDATED FINANCIAL STATEMENTS(thousands, except share and per share amounts and where noted in millions)
109
15. Provision for Income Taxes
The components of the provision for income taxes are as follows:
Provision for income taxes Fiscal year ended
December 25,2016
December 27,2015
December 28,2014
Current
Federal $ 71,619 $ 2,191 $ —
State 8,746 6,431 7,886
Non-U.S. 883 (327) 377
81,248 8,295 8,263
Deferred
Federal 36,213 106,975 147,929
State 12,058 7,452 11,680
Non-U.S. (89) 1,157 (72)
48,182 115,584 159,537
Provision for income taxes $ 129,430 $ 123,879 $ 167,800
Earnings before income taxes
United States $ 346,865 $ 332,020 $ 415,149
Non-U.S. (6,318) 4,367 1,069
Total $ 340,547 $ 336,387 $ 416,218
The effective tax rate differs from the federal statutory income tax rate as explained below:
Effective Income Tax Rate
Federal statutory income tax rate 35.0 % 35.0 % 35.0%
State income taxes (net of federal benefit) 4.0 % 2.7 % 3.1%
Tax effect resulting from international activities 0.1 % (0.6)% 0.0%
Domestic production activities deduction (1.9)% (0.3)% 0.0%
Non-deductible expenses 0.7 % 0.3 % 0.2%
Equity based compensation 0.0 % 0.1 % 2.0%
Other 0.1 % (0.4)% 0.0%
Effective income tax rate 38.0 % 36.8 % 40.3%

PINNACLE FOODS INC. AND SUBSIDIARIESNOTES TO CONSOLIDATED FINANCIAL STATEMENTS(thousands, except share and per share amounts and where noted in millions)
110
Deferred Tax Assets and LiabilitiesDecember 25,
2016December 27,
2015
Accrued liabilities $ 11,537 $ 11,907
Inventories 11,489 5,974
Benefits and compensation 37,049 25,689
Hedges 6,511 7,159
Net operating loss carryforwards 81,515 85,742
Federal & state tax credits 2,386 3,655
Postretirement benefits 20,863 23,401
Alternative minimum tax 1,993 1,993
Other 2,755 3,129
Subtotal 176,098 168,649
Valuation allowance (3,146) (1,487)
Total net deferred tax assets 172,952 167,162
Other intangible assets (964,547) (749,498)
Partnership interests (10,473) (8,866)
Plant assets (118,223) (105,563)
Other (2,689) (679)
Total deferred tax liabilities (1,095,932) (864,606)
Net deferred tax liability $ (922,980) $ (697,444)
Amounts recognized in the Consolidated Balance Sheets
Current net deferred tax assets 51,679 40,571
Long-term net deferred tax liability (974,659) (738,015)
Net deferred tax liability $ (922,980) $ (697,444)
Income taxes are accounted for in accordance with the authoritative guidance for accounting for income taxes under which deferred tax assets and liabilities are determined based on the difference between the financial statement basis and tax basis of assets and liabilities using enacted tax rates in effect for the year in which the differences are expected to reverse.
The effective tax rate was 38.0% for the fiscal year ended December 25, 2016 compared to 36.8% for the fiscal year ended December 27, 2015. The effective rate for the year ended December 25, 2016 includes benefits of approximately 1.9% related to the domestic production activities deduction. In connection with our acquisition of Boulder Brands Inc. (“Boulder”), our effective income tax rate was adversely impacted for the tax effect associated with incurring certain non-deductible acquisition costs and compensation payments of 0.6%, a charge for an increase in our non-current state deferred income tax liability balance of approximately 1.0%, and a charge to record a valuation allowance on our foreign tax credit carryforward of approximately 0.2%.
During the fiscal year ended December 27, 2015 the Company generated sufficient federal taxable income to enable it to claim the domestic production activities deduction, resulting in a 0.3% benefit in our effective tax rate. Our Canadian subsidiary repatriated a dividend representing all accumulated earnings of our foreign operations as of December 27, 2015 to its U.S. parent. As a result of this transaction, a net benefit of $1.4 million was recorded to the 2015 provision for income taxes for the effect of the current income tax liability on the dividend, reversal of the cumulative deferred tax liability on unremitted earnings, recognition of available foreign tax credit and reversal of the associated deferred tax asset on our cumulative translation adjustment. The net effective tax rate impact of this distribution, when added to the Canadian tax rate differential on our Canadian subsidiaries earnings, was a 0.6% benefit.

PINNACLE FOODS INC. AND SUBSIDIARIESNOTES TO CONSOLIDATED FINANCIAL STATEMENTS(thousands, except share and per share amounts and where noted in millions)
111
The Company’s fiscal 2014 earnings include $145.6 million of pre-tax earnings from the terminated Hillshire merger agreement (see Note 7 of the Consolidated Financial Statements). Utilization of net operating loss carryovers (NOL’s) reduced our taxes currently payable on the net termination fee to approximately $3.0 million. The Company also recognized approximately $23.7 million of non-deductible, equity based compensation expense during the year, primarily associated with the Liquidity event (See Note 1 of the Consolidated Financial Statements).
The Company is a loss corporation as defined by Internal Revenue Code Section 382. Section 382 places an annual limitation on our ability to utilize our net operating loss carryovers (NOLs) and other attributes to reduce future taxable income. As of December 25, 2016, we have federal NOL carryovers of $425.5 million, subject to an annual limitation of $17.1 million. As a result, $237.2 million of the carryovers exceed the estimated available Section 382 limitation. The Company has reduced its deferred tax assets for this limitation.
On January 15, 2016, we acquired Boulder Brands, Inc. (“Boulder”) which is a loss corporation. As of the acquisition date, Boulder had approximately $54.5 million of federal NOL carryover subject to the Section 382 provisions. The annual limitation is approximately $26.5 million subject to increase for recognized built in gains. We have fully utilized the federal NOL in 2016 without limitation. The Company's federal NOLs have expiration periods beginning in 2020 through 2027 and we have a federal foreign tax credit carryover of $0.6 million that has an expiration period in 2025. The Company also has state tax NOLs that are limited and vary in amount by jurisdiction. Gross state net operating losses are approximately $275.4 million with expiration periods beginning in 2017 through 2033. State tax credits total $2.9 million and expire on or before 2020.
The authoritative guidance for accounting for income taxes requires that a valuation allowance be established when it is “more likely than not” that all or a portion of deferred tax assets will not be realized. The Company regularly evaluates its deferred tax assets for future realization. A review of all available positive and negative evidence must be considered, including a company's performance, the market environment in which the company operates, the utilization of past tax credits, length of carryback and carryforward periods, and existing contracts or sales backlog that will result in future profits. Based on a review of both the positive and negative evidence, it was determined that the Company had sufficient positive evidence to outweigh any negative evidence and support that it was more likely that not that substantially all of the deferred tax assets would be realized.
The table below lists the changes in the Company’s deferred tax valuation allowance. The valuation allowance increase of $0.7 million is attributable to foreign tax credits and state NOLs, the realization of which is not more likely than not. In connection with the wind down of Boulder Brand’s United Kingdom operations (see Note 7 of the Consolidated Financial Statements), a valuation allowance of $1.1 million was recorded for the related deferred tax assets that will not be recognized in the future. The decrease of $0.2 million is primarily attributable to the write-off of state tax credits that were subject to a full valuation reserve, as the Company determined it will not generate future income of a certain character to realize the loss carryforward.
Beginning Ending
Balance Additions Acquisitions Deductions Balance
Fiscal year ended December 25, 2016 $ 2,287 $ 1,775 $ 59 $ (208) $ 3,913
Fiscal year ended December 27, 2015 2,288 623 — (624) 2,287
Fiscal year ended December 28, 2014 3,952 — — (1,664) 2,288

PINNACLE FOODS INC. AND SUBSIDIARIESNOTES TO CONSOLIDATED FINANCIAL STATEMENTS(thousands, except share and per share amounts and where noted in millions)
112
A reconciliation of the beginning and ending amount of gross unrecognized tax positions is as follows:
Fiscal year endedDecember 25,
2016December 27,
2015December 28,
2014Gross unrecognized tax positions at beginning of year $ 8,611 $ 8,242 $ 6,905Increase for tax positions related to prior periods 4,225 — 1,300Decrease for tax positions related to prior periods (444) — —Increase for tax positions related to the current period 507 558 204Decrease related to settlement with tax authorities (89) — —Reductions due to lapse of applicable statutes of limitations (706) (189) (167)Gross unrecognized tax positions at end of year $ 12,104 $ 8,611 $ 8,242
The Company's liability for unrecognized tax positions as of December 25, 2016 was $12.1 million, reflecting a net increase of $3.5 million. Net benefit of $0.1 million was recognized in the provision for income taxes resulting primarily from the expiration of statutes of limitations on certain matters offset by interest accrual of uncertainties related to prior year matters. The amount that, if recognized, would impact the effective tax rate as of December 25, 2016 would be $6.3 million.
From time to time, various taxing authorities may audit the Company's tax returns. It is reasonably possible that a decrease in the uncertain tax positions of approximately $2.0 to $5.0 million may occur within the next twelve months due to the lapse of certain statutes of limitations or resolution of uncertainties.
The Company recorded a net expense for interest and penalties associated with uncertain tax positions of $0.4 million, $0.1 millionand $0.0 million, to the provision for income taxes for the fiscal years ended December 25, 2016, December 27, 2015 and December 28, 2014, respectively. The Company's liability includes accrued interest and penalties of $1.1 million and $0.2 millionas of December 25, 2016 and December 27, 2015, respectively.
The Company files income tax returns with the U.S. federal government and various state and international jurisdictions. With few exceptions, the Company's calendar year 1999 and subsequent federal and state tax years remain open by statute, principally relating to NOLs. With limited exception for certain states, Federal and state tax years for pre-acquisition periods (2013 and earlier) of Boulder Brands Inc. are closed by statute. Tax returns of our Canadian affiliates from 2010 generally remain open for examination. As a matter of course, from time to time various taxing authorities may audit the Company's tax returns and the ultimate resolution of such audits could result in adjustments to amounts recognized by the Company.

PINNACLE FOODS INC. AND SUBSIDIARIESNOTES TO CONSOLIDATED FINANCIAL STATEMENTS(thousands, except share and per share amounts and where noted in millions)
113
16. Quarterly Results (Unaudited)
Summarized quarterly financial data is presented below
Quarter EndedMarch2016
June2016
September2016
December2016
Fiscal2016
13 weeks 13 weeks 13 weeks 13 weeks 52 weeksNet sales $ 754,255 $ 756,381 $ 758,821 $ 858,481 $ 3,127,938Cost of products sold 555,688 535,189 530,117 590,870 2,211,864Gross profit 198,567 221,192 228,704 267,611 916,074
Net earnings 24,837 45,783 52,353 88,144 211,117Net earnings per share (1)Basic $ 0.21 $ 0.39 $ 0.45 $ 0.75 $ 1.81Weighted average shares outstanding-basic (2) 116,117 116,657 117,224 117,489 116,872Diluted $ 0.21 $ 0.39 $ 0.44 $ 0.74 $ 1.79Weighted average shares outstanding-diluted (2) 117,613 117,766 118,390 118,874 118,161Dividends declared $ 0.255 $ 0.255 $ 0.285 $ 0.285 $ 1.08Market price - high $ 46.08 $ 45.37 $ 51.85 $ 53.25 $ 53.25Market price - low $ 39.89 $ 41.82 $ 43.34 $ 46.62 $ 39.89
Quarter EndedMarch2015
June2015
September2015
December2015
Fiscal2015
13 weeks 13 weeks 13 weeks 13 weeks 52 weeksNet sales $ 665,281 $ 631,746 $ 636,287 $ 722,478 $ 2,655,792Cost of products sold 493,564 462,637 459,432 499,653 1,915,286Gross profit 171,717 169,109 176,855 222,825 740,506
Net earnings 41,536 43,679 48,098 79,195 212,508
Net earnings per share (1)Basic $ 0.36 $ 0.38 $ 0.41 $ 0.68 $ 1.83Weighted average shares outstanding-basic (2) 115,906 116,031 116,085 116,105 116,032Diluted $ 0.35 $ 0.37 $ 0.41 $ 0.67 $ 1.81Weighted average shares outstanding-diluted (2) 117,036 117,281 117,470 117,503 117,323Dividends declared $ 0.235 $ 0.235 $ 0.255 $ 0.255 $ 0.98Market price - high $ 40.89 $ 47.35 $ 47.41 $ 44.75 $ 47.41Market price - low $ 34.77 $ 39.79 $ 43.21 $ 40.27 $ 34.77
(1) The sum of the individual per share amounts may not add due to rounding.(2) Shares presented in thousands.

PINNACLE FOODS INC. AND SUBSIDIARIESNOTES TO CONSOLIDATED FINANCIAL STATEMENTS(thousands, except share and per share amounts and where noted in millions)
114
Net earnings during fiscal 2016 and fiscal 2015 were affected by the following charges (credits):
Quarter EndedMarch2016
June2016
September2016
December2016
Fiscal2016
13 weeks 13 weeks 13 weeks 13 weeks 52 weeks
Cost of products soldAcquisition integration costs (a) 842 539 1,077 3,108 5,566
Administrative expenses Boulder Brands integration costs (b) 12,814 8,822 3,637 3,183 28,456
Other expense (income)Boulder Brands UK wind down (c) — — — 4,265 4,265Boulder Brands acquisition costs (d) 6,781 — — — 6,781
Tradename impairments (e) — — 11,200 — 11,200
Quarter EndedMarch2015
June2015
September2015
December2015
Fiscal2015
13 weeks 13 weeks 13 weeks 13 weeks 52 weeks
Cost of products soldAcquisition integration costs (f) 2,489 1,677 2,011 2,448 8,625
Other expense (income), net Boulder Brands acquisition costs (b) — — — 1,713 1,713Foreign exchange losses (gains) (g) 2,278 (700) 2,102 1,051 4,731
(a) The Company recorded integration costs related to the Garden Protein acquisition.(b) The Company recorded integration costs related to the Boulder Brands acquisition.(c) The Company recorded $4.3 million of charges related to wind down of operations and the disposal of associated
assets at Boulder Brands private label gluten free bakery operation which is based in the United Kingdom. This is explained in greater detail in Note 7 to the Consolidated Financial Statements.
(d) Boulder Brands acquisition costs primarily consist of legal, accounting and other professional fees. (e) The Company recorded tradename impairments related to Celeste, Aunt Jemima, and Snyder of Berlin. This is
explained in greater detail in Note 9 to the Consolidated Financial Statements. (f) The Company recorded integration costs related to the Garden Protein and Wish-Bone acquisitions.(g) The Company recorded foreign exchange losses from intra-entity loans resulting from the Garden Protein acquisition
that are anticipated to be settled in the foreseeable future.

PINNACLE FOODS INC. AND SUBSIDIARIESNOTES TO CONSOLIDATED FINANCIAL STATEMENTS(thousands, except share and per share amounts and where noted in millions)
115
17. Guarantor and Nonguarantor Statements
The Senior Notes are general senior unsecured obligations of Pinnacle Foods Finance, effectively subordinated in right of payment to all existing and future senior secured indebtedness of Pinnacle Foods Finance and guaranteed on a full, unconditional, joint and several basis by the Company and Pinnacle Foods Finance's 100% owned domestic subsidiaries that guarantee other indebtedness of the Company. The indentures governing the Senior Notes contains customary exceptions under which a guarantee of a guarantor subsidiary will terminate, including (1) the sale, exchange or transfer (by merger or otherwise) of the capital stock or all of the assets of such guarantor subsidiary, (2) the release or discharge of the guarantee by such guarantor subsidiary of the Amended Credit Agreement or other guarantee that resulted in the creation of the guarantee, (3) the designation of such guarantor subsidiary as an “unrestricted subsidiary” in accordance with the indentures governing the Senior Notes and (4) upon the legal defeasance or covenant defeasance or discharge of the indentures governing the Senior Notes.
The following condensed consolidating financial information presents:(1) (a) Condensed consolidating balance sheets as of December 25, 2016 and December 27, 2015.
(b) The related condensed consolidating statements of operations and comprehensive earnings for the Company, Pinnacle Foods Finance, all guarantor subsidiaries and the non-guarantor subsidiaries for the following:
i. Fiscal year ended December 25, 2016; and ii. Fiscal year ended December 27, 2015; andiii. Fiscal year ended December 28, 2014.
(c) The related condensed consolidating statements of cash flows for the Company, Pinnacle Foods Finance, all guarantor subsidiaries and the non-guarantor subsidiaries for the following:
i. Fiscal year ended December 25, 2016; and ii. Fiscal year ended December 27, 2015; andiii. Fiscal year ended December 28, 2014.
(2) Elimination entries necessary to consolidate the Company, Pinnacle Foods Finance with its guarantor subsidiaries and non-guarantor subsidiaries.
Investments in subsidiaries are accounted for by the parent using the equity method of accounting. The guarantor subsidiaries and non-guarantor subsidiaries are presented on a combined basis. The principal elimination entries eliminate investments in subsidiaries and intercompany balances and transactions and include a reclassification entry of net non-current deferred tax assets to non-current deferred tax liabilities.

PINNACLE FOODS INC. AND SUBSIDIARIESNOTES TO CONSOLIDATED FINANCIAL STATEMENTS(thousands, except share and per share amounts and where noted in millions)
116
Pinnacle Foods Inc.Condensed Consolidating Balance Sheet
December 25, 2016
Pinnacle
Foods Inc.
PinnacleFoods
Finance LLCGuarantor
SubsidiariesNonguarantorSubsidiaries
Eliminationsand
ReclassificationsConsolidated
TotalCurrent assets:
Cash and cash equivalents $ — $ — $ 341,238 $ 11,838 $ — $ 353,076Accounts receivable, net — — 281,189 8,393 — 289,582Intercompany accounts receivable 96,923 — 804,203 — (901,126) —Inventories, net — — 429,009 16,482 — 445,491Other current assets — 631 8,402 1,654 — 10,687Deferred tax assets — 1,233 49,527 919 — 51,679
Total current assets 96,923 1,864 1,913,568 39,286 (901,126) 1,150,515Plant assets, net — — 690,515 32,830 — 723,345Investment in subsidiaries 1,886,496 2,589,850 30,600 — (4,506,946) —Intercompany note receivable — 2,984,974 44,928 9,800 (3,039,702) —Tradenames — — 2,525,200 4,358 — 2,529,558Other assets, net — 2,963 158,934 11,174 — 173,071Deferred tax assets — 333,945 — — (333,945) —Goodwill — — 2,104,648 58,508 — 2,163,156
Total assets $ 1,983,419 $ 5,913,596 $ 7,468,393 $ 155,956 $ (8,781,719) $ 6,739,645Current liabilities:
Short-term borrowings $ — $ — $ 2,389 $ — $ — $ 2,389Current portion of long-term obligations — 10,750 13,028 23 — 23,801Accounts payable — — 283,999 8,479 — 292,478Intercompany accounts payable — 863,358 — 37,766 (901,124) —Accrued trade marketing expense — — 48,850 2,204 — 51,054Accrued liabilities 178 28,557 133,316 4,690 — 166,741Dividends payable 35,233 — — — — 35,233
Total current liabilities 35,411 902,665 481,582 53,162 (901,124) 571,696Long-term debt — 3,112,196 28,024 276 — 3,140,496Intercompany note payable — — 2,975,471 64,233 (3,039,704) —Pension and other postretirement benefits — — 56,323 — — 56,323Other long-term liabilities — 12,239 31,994 3,296 — 47,529Deferred tax liabilities — — 1,305,149 3,455 (333,945) 974,659
Total liabilities 35,411 4,027,100 4,878,543 124,422 (4,274,773) 4,790,703Commitments and contingencies (Note 13)
Shareholder’s equity:
Pinnacle Common Stock $ 1,191 $ — $ — $ — $ — $ 1,191Additional paid-in-capital 1,429,447 1,430,639 1,352,568 32,770 (2,815,977) 1,429,447Retained earnings 601,049 507,426 1,272,939 3,936 (1,784,301) 601,049Accumulated other comprehensive loss (51,569) (51,569) (35,657) (6,106) 93,332 (51,569)Capital stock in treasury (32,110) — — — — (32,110)
Total Pinnacle Foods Inc. and Subsidiariesstockholders' equity 1,948,008 1,886,496 2,589,850 30,600 (4,506,946) 1,948,008
Non-controlling interest — — — 934 — 934Total Equity 1,948,008 1,886,496 2,589,850 31,534 (4,506,946) 1,948,942Total liabilities and shareholders' equity $ 1,983,419 $ 5,913,596 $ 7,468,393 $ 155,956 $ (8,781,719) $ 6,739,645

PINNACLE FOODS INC. AND SUBSIDIARIESNOTES TO CONSOLIDATED FINANCIAL STATEMENTS(thousands, except share and per share amounts and where noted in millions)
117
Pinnacle Foods Inc.Condensed Consolidating Balance Sheet
December 27, 2015
Pinnacle
Foods Inc.
PinnacleFoods
Finance LLCGuarantor
SubsidiariesNonguarantorSubsidiaries
Eliminationsand
ReclassificationsConsolidated
TotalCurrent assets:
Cash and cash equivalents $ — $ — $ 177,669 $ 2,880 $ — $ 180,549
Accounts receivable, net — — 214,690 5,046 — 219,736
Intercompany accounts receivable 92,475 — 725,074 — (817,549) —
Inventories, net — — 392,404 10,697 — 403,101
Other current assets — 470 11,860 1,347 — 13,677
Deferred tax assets — 1,670 38,516 385 — 40,571
Total current assets 92,475 2,140 1,560,213 20,355 (817,549) 857,634
Plant assets, net — — 615,123 15,986 — 631,109
Investment in subsidiaries 1,744,015 2,428,472 26,433 — (4,198,920) —
Intercompany note receivable — 2,084,130 8,398 9,800 (2,102,328) —
Tradenames — — 1,996,800 4,248 — 2,001,048
Other assets, net — 16,855 102,701 808 — 120,364
Deferred tax assets — 332,372 — — (332,372) —
Goodwill — — 1,692,715 21,293 — 1,714,008
Total assets $ 1,836,490 $ 4,863,969 $ 6,002,383 $ 72,490 $ (7,451,169) $ 5,324,163Current liabilities:
Short-term borrowings $ — $ — $ 2,225 $ — $ — $ 2,225Current portion of long-term obligations — 5,250 9,515 82 — 14,847Accounts payable — — 206,082 4,957 — 211,039Intercompany accounts payable — 815,100 — 2,449 (817,549) —
Accrued trade marketing expense — — 44,096 2,132 — 46,228
Accrued liabilities 163 18,152 79,468 2,727 — 100,510
Dividends payable 30,798 — — — — 30,798
Total current liabilities 30,961 838,502 341,386 12,347 (817,549) 405,647
Long-term debt — 2,258,528 (1,865) 349 — 2,257,012
Intercompany note payable — — 2,075,113 27,215 (2,102,328) —
Pension and other postretirement benefits — — 63,454 — — 63,454Other long-term liabilities — 22,924 28,195 3,387 — 54,506
Deferred tax liabilities — — 1,067,628 2,759 (332,372) 738,015
Total liabilities 30,961 3,119,954 3,573,911 46,057 (3,252,249) 3,518,634Commitments and contingencies (Note 13)
Shareholder’s equity:Pinnacle Common Stock $ 1,176 $ — $ — $ — $ — $ 1,176
Additional paid-in-capital 1,378,521 1,379,697 1,301,642 20,476 (2,701,815) 1,378,521
Retained earnings 517,330 423,706 1,169,032 14,212 (1,606,950) 517,330
Accumulated other comprehensive loss (59,388) (59,388) (42,202) (8,255) 109,845 (59,388)Capital stock in treasury (32,110) — — — — (32,110)
Total shareholders' equity 1,805,529 1,744,015 2,428,472 26,433 (4,198,920) 1,805,529Total liabilities and shareholders' equity $ 1,836,490 $ 4,863,969 $ 6,002,383 $ 72,490 $ (7,451,169) $ 5,324,163

PINNACLE FOODS INC. AND SUBSIDIARIESNOTES TO CONSOLIDATED FINANCIAL STATEMENTS(thousands, except share and per share amounts and where noted in millions)
118
Pinnacle Foods Inc. Condensed Consolidating Statement of Operations and Comprehensive Earnings (Loss)
For the fiscal year ended December 25, 2016
Pinnacle
Foods Inc.
PinnacleFoods
Finance LLCGuarantor
SubsidiariesNonguarantorSubsidiaries Eliminations
ConsolidatedTotal
Net sales $ — $ — $ 3,064,800 $ 174,334 $ (111,196) $ 3,127,938Cost of products sold — — 2,161,918 157,859 (107,913) 2,211,864
Gross profit — — 902,882 16,475 (3,283) 916,074Operating expenses
Marketing and selling expenses — — 213,171 5,089 — 218,260Administrative expenses — — 153,835 9,221 — 163,056Research and development expenses — — 17,384 729 — 18,113Tradename impairment charges — — 11,200 — — 11,200Intercompany royalties — — (562) 562 — —Intercompany management fees — — — 2,286 (2,286) —Intercompany technical service fees — — — 997 (997) —Other expense (income), net — (486) 21,265 5,021 — 25,800Equity in (earnings) loss of investees (211,117) (231,305) 10,275 — 432,147 —
Total operating (income)expenses (211,117) (231,791) 426,568 23,905 428,864 436,429
Earnings (loss) before interest andtaxes 211,117 231,791 476,314 (7,430) (432,147) 479,645
Intercompany interest (income)expense — (105,328) 103,268 2,060 — —Interest expense — 137,227 1,973 43 — 139,243Interest income — — 93 52 — 145
Earnings (loss) before income taxes 211,117 199,892 371,166 (9,481) (432,147) 340,547Provision (benefit) for income taxes — (11,225) 139,861 794 — 129,430Net earnings (loss) $ 211,117 $ 211,117 $ 231,305 $ (10,275) $ (432,147) $ 211,117
Total comprehensive earnings (loss) $ 218,936 $ 218,936 $ 237,851 $ (8,127) $ (448,660) $ 218,936

PINNACLE FOODS INC. AND SUBSIDIARIESNOTES TO CONSOLIDATED FINANCIAL STATEMENTS(thousands, except share and per share amounts and where noted in millions)
119
Pinnacle Foods Inc.Condensed Consolidating Statement of Operations and Comprehensive Earnings (Loss)
For the fiscal year ended December 27, 2015
Pinnacle
Foods Inc.
PinnacleFoods
Finance LLCGuarantor
SubsidiariesNonguarantorSubsidiaries Eliminations
ConsolidatedTotal
Net sales $ — $ — $ 2,635,141 $ 118,194 $ (97,543) $ 2,655,792Cost of products sold — — 1,915,267 96,545 (96,526) 1,915,286
Gross profit — — 719,874 21,649 (1,017) 740,506Operating expenses
Marketing and selling expenses — — 168,239 8,463 — 176,702Administrative expenses — — 100,556 6,448 — 107,004Research and development expenses — — 12,492 500 — 12,992Intercompany royalties — — — 20 (20) —Intercompany technical service fees — — — 997 (997) —Other expense (income), net — 3,663 15,338 105 — 19,106Equity in (earnings) loss of investees (212,508) (226,847) (3,235) — 442,590 —
Total operating expenses (212,508) (223,184) 293,390 16,533 441,573 315,804Earnings before interest and taxes 212,508 223,184 426,484 5,116 (442,590) 424,702
Intercompany interest (income)expense — (68,701) 67,657 1,044 — —Interest expense — 86,745 1,727 41 — 88,513Interest income — — 163 35 — 198
Earnings before income taxes 212,508 205,140 357,263 4,066 (442,590) 336,387Provision (benefit) for income taxes — (7,368) 130,416 831 — 123,879Net earnings $ 212,508 $ 212,508 $ 226,847 $ 3,235 $ (442,590) $ 212,508
Total comprehensive earnings (loss) $ 190,854 $ 190,854 $ 217,931 $ (1,747) $ (407,038) $ 190,854

PINNACLE FOODS INC. AND SUBSIDIARIESNOTES TO CONSOLIDATED FINANCIAL STATEMENTS(thousands, except share and per share amounts and where noted in millions)
120
Pinnacle Foods Inc.Condensed Consolidating Statement of Operations and Comprehensive Earnings
(Loss)For the fiscal year ended December 28, 2014
Pinnacle
Foods Inc.
PinnacleFoods
Finance LLCGuarantor
SubsidiariesNonguarantorSubsidiaries Eliminations
ConsolidatedTotal
Net sales $ — $ — $ 2,563,730 $ 82,722 $ (55,269) $ 2,591,183Cost of products sold — — 1,894,503 69,655 (54,173) 1,909,985
Gross profit — — 669,227 13,067 (1,096) 681,198Operating expenses
Marketing and selling expenses — — 171,267 6,105 — 177,372Administrative expenses — 742 112,180 4,353 — 117,275Research and development expenses — — 11,209 72 — 11,281Intercompany royalties — — — 37 (37) —Intercompany technical service fees — — — 1,059 (1,059) —Termination fee received, net ofcosts, associated with the Hillshiremerger agreement (152,982) — — — — (152,982)Other expense (income), net — 2,620 13,177 184 — 15,981Equity in (earnings) loss of investees (154,793) (173,467) (473) — 328,733 —
Total operating expenses (307,775) (170,105) 307,360 11,810 327,637 168,927Earnings (loss) before interest andtaxes 307,775 170,105 361,867 1,257 (328,733) 512,271
Intercompany interest (income)expense — (66,993) 66,486 507 — —Interest expense — 94,144 1,999 31 — 96,174Interest income — — 62 59 — 121
Earnings (loss) before income taxes 307,775 142,954 293,444 778 (328,733) 416,218Provision (benefit) for income taxes 59,357 (11,839) 119,977 305 — 167,800Net earnings (loss) $ 248,418 $ 154,793 $ 173,467 $ 473 $ (328,733) $ 248,418
Total comprehensive earnings (loss) $ 218,181 $ 124,556 $ 159,409 $ (390) $ (283,575) $ 218,181

PINNACLE FOODS INC. AND SUBSIDIARIESNOTES TO CONSOLIDATED FINANCIAL STATEMENTS(thousands, except share and per share amounts and where noted in millions)
121
Pinnacle Foods Inc.Condensed Consolidating Statement of Cash Flows
For the fiscal year ended December 25, 2016
PinnacleFoodsInc.
PinnacleFoods
Finance LLCGuarantor
SubsidiariesNonguarantorSubsidiaries
Eliminationsand
ReclassificationsConsolidated
TotalCash flows from operating activities
Net cash provided by (used in) operatingactivities $ — $ (714) $ 474,237 $ 13,981 $ — $ 487,504
Cash flows from investing activitiesIntercompany accounts receivable/payable — 24,977 541 — (25,518) —Intercompany loans — (880,122) — — 880,122 —Payments for business acquisition — — (985,365) — — (985,365)Investment in subsidiary 85,924 76,472 — — (162,396) —Capital expenditures — — (96,404) (4,646) — (101,050)
Net cash (used in) provided by investingactivities 85,924 (778,673) (1,081,228) (4,646) 692,208 (1,086,415)
Cash flows from financing activitiesProceeds from issuance of common stock 26,436 — — — — 26,436Excess tax benefits on stock-basedcompensation 11,577 — — — — 11,577Taxes paid related to net share settlement ofequity awards (1,087) — — — — (1,087)Dividends paid (122,850) — — — — (122,850)Proceeds from notes offering — 350,000 — — — 350,000Proceeds from bank term loans — 547,250 — — — 547,250Repayments of long-term obligations — (9,375) (4,366) — — (13,741)Proceeds from short-term borrowing — — 4,452 — — 4,452Repayments of short-term borrowing — — (4,259) — — (4,259)Intercompany accounts receivable/payable — — (24,977) (541) 25,518 —Return of capital — (85,924) (76,472) — 162,396 —Intercompany loans — — 880,122 — (880,122) —Repayment of capital lease obligations — — (3,940) (10) — (3,950)Debt acquisition costs — (22,564) — — — (22,564)
Net cash (used in) provided by financingactivities (85,924) 779,387 770,560 (551) (692,208) 771,264
Effect of exchange rate changes on cash — — — 174 — 174Net change in cash and cash equivalents — — 163,569 8,958 — 172,527
Cash and cash equivalents - beginning of period — — 177,669 2,880 — 180,549Cash and cash equivalents - end of period $ — $ — $ 341,238 $ 11,838 $ — $ 353,076

PINNACLE FOODS INC. AND SUBSIDIARIESNOTES TO CONSOLIDATED FINANCIAL STATEMENTS(thousands, except share and per share amounts and where noted in millions)
122
Pinnacle Foods Inc.Condensed Consolidating Statement of Cash Flows
For the fiscal year ended December 27, 2015
PinnacleFoodsInc.
PinnacleFoods
Finance LLCGuarantor
SubsidiariesNonguarantorSubsidiaries
Eliminationsand
ReclassificationsConsolidated
TotalCash flows from operating activities
Net cash provided by (used in) operatingactivities $ — $ (12,155) $ 394,876 $ (9,810) $ — $ 372,911
Cash flows from investing activitiesIntercompany accounts receivable/payable — 128,891 (14,400) — (114,491) —Repayments of intercompany loans — — (801) 801 —Payments for business acquisition — — 1,102 — — 1,102Investment in subsidiary 111,486 — — — (111,486) —Capital expenditures — — (101,353) (7,124) — (108,477)Sale of plant assets — — 1,618 — — 1,618
Net cash (used in) provided by investingactivities 111,486 128,891 (113,834) (7,124) (225,176) (105,757)
Cash flows from financing activitiesProceeds from issuance of common stock 1,231 — — — — 1,231Excess tax benefits on stock-basedcompensation 1,442 — — — — 1,442Taxes paid related to net share settlement ofequity awards (2,401) — — — — (2,401)Dividends paid (111,758) — — — — (111,758)Repayments of long-term obligations — (5,250) (3,620) — — (8,870)Proceeds from short-term borrowing — — 4,261 — — 4,261Repayments of short-term borrowing — — (4,480) — — (4,480)Intercompany accounts receivable/payable — — (128,891) 14,400 114,491 —Return of capital — (111,486) — — 111,486 —Intercompany loans — — — 801 (801) —Repayment of capital lease obligations — — (3,585) — — (3,585)
Net cash (used in) provided by financingactivities (111,486) (116,736) (136,315) 15,201 225,176 (124,160)
Effect of exchange rate changes on cash — — — (922) — (922)Net change in cash and cash equivalents — — 144,727 (2,655) — 142,072
Cash and cash equivalents - beginning of period — — 32,942 5,535 — 38,477Cash and cash equivalents - end of period $ — $ — $ 177,669 $ 2,880 $ — $ 180,549

PINNACLE FOODS INC. AND SUBSIDIARIESNOTES TO CONSOLIDATED FINANCIAL STATEMENTS(thousands, except share and per share amounts and where noted in millions)
123
Pinnacle Foods Inc.Condensed Consolidating Statement of Cash Flows
For the fiscal year ended December 28, 2014
PinnacleFoodsInc.
PinnacleFoods
Finance LLCGuarantor
SubsidiariesNonguarantorSubsidiaries
Eliminationsand
ReclassificationsConsolidated
TotalCash flows from operating activities
Net cash provided by (used in) operatingactivities $ 149,982 $ (65,834) $ 472,484 $ (5,922) $ — $ 550,710
Cash flows from investing activitiesIntercompany accounts receivable/payable (14,599) — (333,136) — 347,735 —Repayments of intercompany loans — 119,814 — (119,814) —Payments for business acquisition — — (169,373) — — (169,373)Investment in subsidiary — (169,373) — — 169,373 —Capital expenditures — — (102,967) — — (102,967)Sale of plant assets held for sale — — 2,328 — — 2,328
Net cash (used in) provided by investingactivities (14,599) (49,559) (603,148) — 397,294 (270,012)
Cash flows from financing activitiesProceeds from issuance of common stock 489 — — — — 489Excess tax benefits on stock-based compensation 905 — — — — 905Taxes paid related to net share settlement ofequity awards (3,061) — — — — (3,061)Dividends paid (101,606) — — — — (101,606)Repayments of long-term obligations — (217,392) (2,575) — — (219,967)Proceeds from short-term borrowing — — 4,757 — — 4,757Repayments of short-term borrowing — — (4,799) — — (4,799)Borrowings under revolving credit facility — 65,000 — — — 65,000Repayments of revolving credit facility — (65,000) — — — (65,000)Intercompany accounts receivable/payable — 333,043 14,692 (347,735) —Parent investment — — 169,373 — (169,373) —Repayments of intercompany loans — — (119,814) — 119,814 —Repayment of capital lease obligations — — (2,373) — — (2,373)Purchase of stock for treasury (32,110) — — — — (32,110)Debt acquisition costs — (258) — — — (258)
Net cash (used in) provided by financingactivities (135,383) 115,393 59,261 — (397,294) (358,023)
Effect of exchange rate changes on cash — — — (937) — (937)Net change in cash and cash equivalents — — (71,403) (6,859) — (78,262)
Cash and cash equivalents - beginning of period — — 104,345 12,394 — 116,739Cash and cash equivalents - end of period $ — $ — $ 32,942 $ 5,535 $ — $ 38,477
PINNACLE FOODS INC. AND SUBSIDIARIESNOTES TO CONSOLIDATED FINANCIAL STATEMENTS(thousands, except share and per share amounts and where noted in millions)
124
18. Subsequent Events
Debt Refinancing
On February 3, 2017, Pinnacle Foods Finance, entered into the fifth amendment to the Second Amended and Restated Credit Agreement (the "Refinancing"), which provided for a seven year term loan facility in the amount of $2,262.0 million (the "Tranche B Term Loans") and replaced the existing revolving credit facility with a new five year $225.0 million revolving credit facility.
The interest rates applicable to loans under the new credit facilities are, at the Company's option, equal to either a LIBOR rate or a base rate, plus an applicable margin equal to 2.00% for LIBOR rate loans and 1.00% for base rate loans. The new credit facilities are also subject to an interest rate floor of 0.00% for LIBOR rate loans and 1.00% for base rate loans. Unused commitments under the new revolving credit facility are subject to a commitment fee of 0.30% per annum.
As a result of the Refinancing, Pinnacle Foods Finance used the proceeds from the Tranche B Term Loans and $213.1 million of cash on hand to repay all existing indebtedness outstanding under the then existing Amended Credit Agreement, consisting of (a) $1,409.6 million of Tranche G Term Loans, (b) $507.9 million of Tranche H Term Loans and (c) $544.5 million of Tranche I Term Loans.
As part of the Refinancing, the Company will perform an analysis of its unamortized debt acquisition costs and original issue discount. Upon completion of this analysis, the Company may incur a non-cash charge for a portion or all of these costs in its first fiscal quarter of 2017. Additionally, Pinnacle Foods Finance incurred debt acquisition costs and original issue discounts of $10.2 million on the new Tranche B Term Loans.
For the interest rate swaps in place at the time of the Refinancing, it became probable that the associated original forecasted transactions would not occur. As such, the Company discontinued hedge accounting, settled the associated liability of $20.7 millionwith its counter parties and accelerated the reclassification of amounts in AOCL to earnings. Immediately subsequent to the settlement of the old swaps, the Company entered into new interest rate swap agreements with various financial institutions. As a result, $1.5 billion of debt is hedged in 2017 at a rate of 0.96%, $1.0 billion in 2018 at a rate of 1.48% and $750 million in 2019 at a rate of 1.8%.
ITEM 9. CHANGES IN AND DISAGREEMENTS WITH ACCOUNTANTS ON ACCOUNTING AND FINANCIAL DISCLOSURE
None.
ITEM 9A. CONTROLS AND PROCEDURES
(a) Disclosure Controls and Procedures
We maintain disclosure controls and procedures that are designed to provide reasonable assurance that information required to be disclosed by us in our reports that we file or submit under the Exchange Act (as defined in Rules 13a-15(e) and 15d-15(e) of the Securities Exchange Act of 1934, as amended (the “Exchange Act”)) is recorded, processed, summarized and reported within the time periods specified in the SEC's rules and forms, and that such information is accumulated and communicated to our management, with the participation of our Chief Executive Officer and Chief Financial Officer, as appropriate, to allow timely decisions regarding required disclosures.
In designing and evaluating our disclosure controls and procedures, management recognizes that disclosure controls and procedures, no matter how well conceived and operated, can provide only reasonable, not absolute, assurance that the objective of the disclosure controls and procedures are met. The design of any controls and procedures also is based on certain assumptions about the likelihood of future events, and there can be no assurance that any design will succeed in achieving its stated goals under all potential future conditions.
Our management, with the participation of our Chief Executive Officer and Chief Financial Officer, has evaluated the effectiveness of the design and operation of our disclosure controls and procedures as of December 25, 2016. Based upon that evaluation and

125
subject to the foregoing, our Chief Executive Officer and Chief Financial Officer concluded that the design and operation of our disclosure controls and procedures are effective at a level of reasonable assurance.
(b) Management's Annual Report on Internal Control Over Financial Reporting.
The management of Pinnacle Foods Inc. and subsidiaries (the “Company”) is responsible for establishing and maintaining adequate internal control over financial reporting as defined in Exchange Act Rule 13a-15(f) and 15d-15(f). The Company's internal control system was designed to provide reasonable assurance to the Company's management and board of directors regarding the reliability of financial reporting and the preparation of financial statements for external purposes in accordance with generally accepted accounting principles.
Management assessed the effectiveness of the Company's internal control over financial reporting as of December 25, 2016. In making this assessment, management used the criteria established in Internal Control - Integrated Framework (2013) issued by the Committee of Sponsoring Organizations (COSO) of the Treadway Commission. Based on this assessment, management believes that, as of December 25, 2016, the Company's internal control over financial reporting is effective based on those criteria.
/s/ Mark Clouse Mark ClouseChief Executive Officer
/s/ Craig Steeneck Craig SteeneckExecutive Vice President and Chief Financial Officer
(c) Attestation Report of the Registered Public Accounting Firm.
The effectiveness of the Company's internal control over financial reporting as of December 25, 2016 has been audited by Deloitte & Touche LLP, an independent registered public accounting firm, as stated in their report which appears herein.
(d) Changes in Internal Control Over Financial Reporting
There was no change in our internal control over financial reporting (as defined in Rules 13a-15(f) and 15d-15(f) of the Exchange Act) that occurred during the fiscal quarter ended December 25, 2016 that has materially affected, or is reasonably likely to materially affect, our internal control over financial reporting.
ITEM 9B: OTHER INFORMATION
Rule 10b5-1 Plans
Our policy governing transactions in our securities by our directors, officers and employees permits such persons to adopt stock trading plans pursuant to Rule 10b5-1 promulgated by the SEC under the Securities Exchange Act of 1934, as amended. Our directors, officers and employees have in the past and may from time to time establish such stock trading plans. We do not undertake any obligation to disclose, or to update or revise any disclosure regarding, any such plans and specifically do not undertake to disclose the adoption, amendment, termination or explanation of any such plans.
Annual Meeting Date
The Board of Directors of the Company has fixed the date of the Annual Meeting of Stockholders for May 23, 2017.
PART III
ITEM 10. DIRECTORS AND EXECUTIVE OFFICERS OF THE REGISTRANT
Information required by this Item 10 will be included in our definitive Proxy Statement to be filed no later than 120 days after the end of the fiscal year covered by this Annual Report on Form 10-K and is incorporated herein by reference.

126
See information on executive officers in Part I.

127
ITEM 11. EXECUTIVE COMPENSATION
Information required by this Item 11 will be included in our definitive Proxy Statement to be filed no later than 120 days after the end of the fiscal year covered by this Annual Report on Form 10-K and is incorporated herein by reference.
ITEM 12. SECURITY OWNERSHIP OF CERTAIN BENEFICIAL OWNERS AND MANAGEMENT
Information required by this Item 12 will be included in our definitive Proxy Statement to be filed no later than 120 days after the end of the fiscal year covered by this Annual Report on Form 10-K and is incorporated herein by reference.
ITEM 13. CERTAIN RELATIONSHIPS AND RELATED TRANSACTIONS AND DIRECTOR INDEPENDENCE
Information required by this Item 13 will be included in our definitive Proxy Statement to be filed no later than 120 days after the end of the fiscal year covered by this Annual Report on Form 10-K and is incorporated herein by reference.
ITEM 14. PRINCIPAL ACCOUNTANT FEES AND SERVICES
Information required by this Item 14 will be included in our definitive Proxy Statement to be filed no later than 120 days after the end of the fiscal year covered by this Annual Report on Form 10-K and is incorporated herein by reference.

128
PART IV
ITEM 15: EXHIBITS, FINANCIAL STATEMENTS AND SCHEDULES
Financial Statements: The information required by this Item is contained in Item 8 of Part II of this Annual Report on Form10-K.
Financial Statement Schedules: Schedule I - Condensed Financial Statements (Parent Company)
ExhibitNumber Exhibit Description Filed
Herewith
Incorporated by Reference
fromForm
Exhibit Filing Date
3.1 Amended and Restated Certificate of Incorporation of PinnacleFoods Inc. 8-K 3.1 4/3/13
3.2 Second Amended and Restated Bylaws of Pinnacle Foods Inc. 8-K 3.1 2/16/164.1 Form of Stock Certificate for Common Stock S-1/A 4.1 3/7/13
4.2
Senior Notes Indenture dated as of April 29, 2013 amongPinnacle Foods Finance LLC and Pinnacle Foods Finance Corp.,the Guarantors listed therein and Wilmington Trust Company, asTrustee 8-K 4.1 4/30/13
4.3
Indenture, dated as of January 15, 2016, by and among PinnacleFoods Finance LLC, Pinnacle Foods Finance Corp., theguarantors listed therein and Wilmington Trust, NationalAssociation 8-K 4.1 1/15/2016
4.4
First Supplemental Indenture, dated as of January 15, 2016, byand among Pinnacle Foods Finance LLC, Pinnacle FoodsFinance Corp., the guarantors listed therein and WilmingtonTrust, National Association 8-K 4.2 1/15/2016
4.5
Registration Rights Agreement, dated January 15, 2016, by andamong Pinnacle Foods Finance LLC, Pinnacle Foods FinanceCorp., the guarantors listed therein and Merrill Lynch, Pierce,Fenner & Smith Incorporated, as representative of the initialpurchasers 8-K 4.3 1/15/2016
4.6
First Supplemental Indenture, dated as of February 8, 2016, byand among Pinnacle Foods Finance LLC, Pinnacle FoodsFinance Corp., the guarantors listed therein and WilmingtonTrust, National Association 10-Q 4.5 4/28/2016
10.1
Second Amended and Restated Credit Agreement dated April 29,2013 among Pinnacle Foods Finance LLC, Peak FinanceHoldings, LLC, Barclays Banks PLC and the Other LendersParty thereto 8-K 10.1 4/30/13
10.2
Second Amendment to Amended and Restated Credit Agreementdated April 29, 2013 among Pinnacle Foods Finance LLC, PeakFinance Holdings LLC, the Guarantors Party hereto, BarclaysBank Plc, Bank of America, NA and the Other Lenders Partythereto 8-K 10.2 4/30/13
10.3
First Amendment to Second Amended and Restated CreditAgreement dated October 1, 2013 among Pinnacle FoodsFinance LLC, Peak Finance Holdings LLC, the Guarantors Partythereto, Barclays Bank Plc and the Other Lenders Party thereto 8-K 10.1 10/1/2013
10.4
Amended and Restated Credit Agreement dated as of April 29,2013, by and among Pinnacle Finance, Peak Finance HoldingsLLC, the guarantors party thereto, the Lenders party thereto andBarclays Bank PLC, as administrative agent for the Lenders. 8-K 10.1 1/15/2016
10.5
Third Amendment to Amended and Restated Credit Agreementdated July 19, 2016 among Pinnacle Foods Finance LLC, PeakFinance Holdings LLC, the Guarantors Party hereto, BarclaysBank Plc, Bank of America, NA and the Other Lenders Partythereto X
10.6
Fourth Amendment to Amended and Restated Credit Agreementdated July 26, 2016 among Pinnacle Foods Finance LLC, PeakFinance Holdings LLC, the Guarantors Party hereto, BarclaysBank Plc, Bank of America, NA and the Other Lenders Partythereto X

129
10.7
Fifth Amendment, dated as of February 3, 2017, to the SecondAmended and Restated Credit Agreement, dated as of April 29,2013, by and among the Borrower, Peak Finance Holdings LLC,the lenders from time to time party thereto and Barclays BankPLC, as administrative agent, collateral agent, and swing linelender. 8-K 10.1 2/3/2017
10.8
Third Amended and Restated Credit Agreement, dated as ofFebruary 3, 2017, by and among the Borrower, Peak FinanceHoldings LLC, the lenders from time to time party thereto andBarclays Bank PLC, as administrative agent, collateral agent, andswing line lender. 8-K 10.2 2/3/2017
10.9
Guaranty, dated as of April 2, 2007, among Peak FinanceHoldings LLC, certain Subsidiaries of Pinnacle Foods FinanceLLC and Holdings identified therein and Lehman CommercialPaper Inc. (filed under Pinnacle Foods Finance LLC) S-4 4.10 12/21/07
10.10
Intellectual Property Security Agreement, dated as of April 2,2007, among Peak Finance LLC (to be merged with and intoPinnacle Foods Finance LLC) as Borrower, Peak FinanceHoldings, LLC as Holdings, certain Subsidiaries of Borrower andHoldings identified therein and Lehman Commercial Paper Inc.(filed under Pinnacle Foods Finance LLC) S-4 4.11 12/21/07
10.11Parent Guaranty, dated as of April 29, 2013, between PinnacleFoods Inc. and Barclays Bank PLC S-1 10.7 11/26/13
10.12Parent Security Agreement dated as of April 29, 2013, betweenPinnacle Foods Inc. and Barclays Bank PLC S-1 10.8 11/26/13
10.13
Securities Purchase Agreement, dated as of November 13, 2014,between Pinnacle Foods Inc. and Garden Protein International,Inc. 8-K 2.1 11/14/14
10.14
Agreement and Plan of Merger, dated as of November 24, 2015,by and among Pinnacle Foods Inc., Slope Acquisition Inc. andBoulder Brands, Inc. 8-K 2.1 11/24/15
10.15
Modification of the Pinnacle Foods Inc. (formerly CrunchHolding Corp.) 2007 Stock Incentive Plan Form of NonqualifiedStock Option Agreement (filed under Pinnacle Foods FinanceLLC) 10-K 10.42 3/5/13
10.16Pinnacle Foods Inc. Amended and Restated 2013 OmnibusIncentive Plan DEF 14A 4/14/2016
10.17 Pinnacle Foods Inc. 2013 Omnibus Incentive Plan 8-K 10.3 4/3/13
10.18Form of Restricted Stock Agreement under 2013 OmnibusIncentive Plan 10-Q 10.7 5/15/13
10.19Form of Restricted Stock Agreement (Conversion ReplacementAward) S-1/A 10.45 3/7/13
10.20Form of Nonqualified Stock Option Agreement under 2013Omnibus Incentive Plan S-1/A 10.46 3/7/13
10.21
Trademark License Agreement by and between The DialCorporation and Conagra, Inc., dated July 1, 1995 (filed underPinnacle Foods Group Inc.) 10-K 10.33 12/25/05
10.22
Swanson Trademark License Agreement (U.S.) by and betweenCSC Brands, Inc. and Vlasic International Brands Inc., dated asof March 24, 1998 (filed under Pinnacle Foods Group Inc.) S-4 10.27 8/20/04
10.23
Swanson Trademark License Agreement (Non-U.S.) by andbetween Campbell Soup Company and Vlasic InternationalBrands Inc., dated as of March 26, 1998 (filed under PinnacleFoods Group Inc.) S-4 10.28 8/20/04
10.24
Trademark License Agreement, dated as of July 9, 1996, by andbetween The Quaker Oats Company, The Quaker Oats Companyof Canada Limited and Van de Kamp’s Inc. (filed under PinnacleFoods Finance LLC) S-4 10.21 12/21/07
10.25Trademark License Agreement, dated August 19, 2002, by andbetween Voila Bakeries, Inc. and Agrilink Food Foods, Inc. 10-Q 10.1 5/9/12
10.26
Technology Sharing Agreement by and between Campbell SoupCompany and Vlasic Foods International Inc., dated as of March26, 1998 (filed under Pinnacle Foods Group Inc.) S-4 10.29 8/20/04
10.27*
Pinnacle Foods Inc. (formerly Crunch Holding Corp.) 2007 StockIncentive Plan, effective as of August 8, 2007 (filed underPinnacle Foods Finance LLC) S-4 10.19 12/21/07

130
10.28*
Pinnacle Foods Inc. (formerly Crunch Holding Corp.) 2007 StockIncentive Plan Form of Nonqualified Stock Option Agreement(filed under Pinnacle Foods Finance LLC) S-4 10.20 12/21/07
10.29*
Modification of the Pinnacle Foods Inc. (formerly CrunchHolding Corp.) 2007 Stock Incentive Plan Form of NonqualifiedStock Option Agreement (filed under Pinnacle Foods FinanceLLC) 10-K 10.27 3/3/09
10.30
Lease, dated April 15, 2010, between Woodcrest RoadAssociates, L.P. and Pinnacle Foods Group LLC (Cherry Hill,New Jersey) (filed under Pinnacle Foods Finance LLC) 10-Q 10.40 8/9/10
10.31
Lease, dated December 14, 2010 between Jeffroad Green, LLCand Pinnacle Foods Group LLC (Parsippany, New Jersey) (filedunder Pinnacle Foods Finance LLC) 10-Q 10.45 5/11/11
10.32
First Amendment to Lease Agreement, dated July 28, 2011, byand between Jeffroad Green, LLC and Pinnacle Foods GroupLLC X
10.33
Second Amendment to Lease Agreement, dated February 2,2012, by and between Jeffroad Green, LLC and Pinnacle FoodsGroup LLC X
10.34
Third Amendment to Lease Agreement, dated May 2, 2012, byand between Jeffroad Green, LLC and Pinnacle Foods GroupLLC X
10.35*Terms of Employment letter dated February 7, 2011 (Antonio F.Fernandez) (filed under Pinnacle Foods Finance LLC) 10-K 10.43 3/10/11
10.36*
Modification of the Pinnacle Foods Inc. (formerly CrunchHolding Corp.) 2007 Stock Incentive Plan Form of NonqualifiedStock Option Agreement (filed under Pinnacle Foods FinanceLLC) 10-K 10.42 3/5/13
10.37*Form of Nonqualified Stock Option Agreement under 2013Omnibus Incentive Plan 10-Q 10.2 11/13/13
10.38*Form of Restricted Stock Agreement under 2013 OmnibusIncentive Plan 10-Q 10.1 11/13/13
10.39*Form of 2014 Performance Share Unit Agreement under 2013Omnibus Incentive Plan 10-Q 10.3 5/14/2014
10.40*Form of 2015 Performance Restricted Share Agreement under2013 Omnibus Incentive Plan 10-Q 10.1 4/30/15
10.41 Form of Restricted Sock Award Agreement (Directors) 10-K 10.40 3/6/14
10.42Form of Performance Share Unit Agreement under Amended andRestated 2013 Omnibus Incentive Plan 10-Q 10.3 7/28/2016
10.43Form of Nonqualified Stock Option Agreement under Amendedand Restated 2013 Omnibus Incentive Plan 10-Q 10.4 7/28/2016
10.44 Restricted Share Agreement (Mark Clouse) 10-Q 10.5 7/28/201610.45 Nonqualified Stock Option Agreement (Mark Clouse) 10-Q 10.6 7/28/201610.46 Performance Restricted Share Agreement (Mark Clouse) 10-Q 10.7 7/28/201610.47 Restricted Stock Unit Agreement (Mark Schiller) 10-Q 10.8 7/28/201610.48 Performance Share Unit Agreement (Mark Schiller) 10-Q 10.9 7/28/201612.1 Computation of Ratios of Earnings to Fixed Charges X21.1 List of Subsidiaries X23.1 Consent of Deloitte & Touche LLP X
31.1Rule 13a-14(a)/15d-14(a) Certification of Chief ExecutiveOfficer X
31.2Rule 13a-14(a)/15d-14(a) Certification of Executive VicePresident and Chief Financial Officer X
32.1**
Certification of Chief Executive Officer pursuant to 18 U.S.C.Section 1350, as adopted pursuant to Section 906 of theSarbanes-Oxley Act of 2002 X
32.2**
Certification of Executive Vice President and Chief FinancialOfficer pursuant to 18 U.S.C. Section 1350, as adopted pursuantto Section 906 of the Sarbanes-Oxley Act of 2002 X

131
101.1
The following materials are formatted in XBRL (eXtensibleBusiness Reporting Language): (i) the Consolidated Statementsof Operations, (ii) the Consolidated Statements ofComprehensive Earnings, (iii) the Consolidated Balance Sheets,(iv) the Consolidated Statements of Cash Flows, (v) theConsolidated Statements of Member’s Equity, (vi) Notes toConsolidated Financial Statements, and (vii) document and entityinformation. X
*Identifies exhibits that consist of a management contract or compensatory plan or arrangement.**This certification will not be deemed “filed” for purposes of Section 18 of the Exchange Act (15 U.S.C. 78r), or otherwise subject to the liability of that section. Such certification will not be deemed to be incorporated by reference into any filing under the Securities Act or Exchange Act, except to the extent that the Registrant specifically incorporates it by reference.

132
PARENT COMPANY INFORMATIONPINNACLE FOODS INC
SCHEDULE I - CONDENSED FINANCIAL STATEMENTS(thousands of dollars)
STATEMENTS OF OPERATIONS
Fiscal year ended
December 25,2016
December 27,2015
December 28,2014
Termination fee received, net of costs,associated with the Hillshire mergeragreement $ — $ — $ 152,982Equity in earnings of investees 211,117 212,508 154,793Earnings before interest and taxes 211,117 212,508 307,775Provision for income taxes — — 59,357Net earnings $ 211,117 $ 212,508 $ 248,418Comprehensive earnings $ 218,936 $ 190,854 $ 218,181
BALANCE SHEETS
December 25,2016
December 27,2015
Current Assets:Due from subsidiaries 96,923 92,475 Total current assets 96,923 92,475Non current assets:Investment in subsidiaries 1,886,496 1,744,015 Total assets $ 1,983,419 $ 1,836,490
Current liabilities:Accrued liabilities 178 163Dividends payable 35,233 30,798Total liabilities $ 35,411 $ 30,961
Commitment and contingencies:Shareholders' equity 1,948,008 1,805,529Total liabilities and shareholders’s equity $ 1,983,419 $ 1,836,490

133
STATEMENTS OF CASH FLOWS
Fiscal year ended
December 26,
2016December 27,
2015December 28,
2014Cash flows from operating activitiesNet earnings $ 211,117 $ 212,508 $ 248,418Non-cash credits to net earningsDeferred taxes — — 56,357Equity in (earnings) of investees (211,117) (212,508) (154,793)Net cash provided by operating activities — — 149,982
Cash flows from investing activities
Reduction (increase) in investment in subsidiaries 85,924 111,486 (14,599)Net cash (used) provided by investing activities 85,924 111,486 (14,599)
Cash flows from financing activitiesEquity contributions 26,436 1,231 489Dividends paid (122,850) (111,758) (101,606)Excess tax benefits on stock-based compensation 11,577 1,442 905
Taxes paid related to net share settlement of equityawards (1,087) (2,401) (3,061)Purchase of stock for treasury — (32,110)Repurchase of equity — —Net cash provided (used) by financing activities (85,924) (111,486) (135,383)
Cash and cash equivalents - beginning of period — — —Cash and cash equivalents - end of period $ — $ — $ —
See notes to Consolidated Financial Statements of Pinnacle Foods Inc.
PINNACLE FOODS INC.SCHEDULE I - NOTES TO CONDENSED FINANCIAL STATEMENTS
NOTE A - BASIS OF PRESENTATION
Pinnacle Foods Inc. (the “Company”) is a holding company whose sole asset is 100% ownership of Peak Finance Holdings LLC (“PFH”). PFH is a holding company whose sole asset is 100% ownership of Pinnacle Foods Finance LLC (“PFF”). As specified in PFF’s debt agreements, there are restrictions on the Company’s ability to obtain funds from its subsidiary through dividends, loans or advances. Accordingly, these condensed financial statements have been prepared on a “parent-only” basis. Under a parent-only presentation, the Company’s investments in its consolidated subsidiaries are presented under the equity method of accounting. The Company has no material contingencies, long-term obligations or guarantees, except as described in Note 17. This parent-only financial statements should be read in conjunction with Pinnacle Foods Inc.’s audited Consolidated Financial Statements included elsewhere herein.

134
SIGNATURES Pursuant to the requirements of Section 13 or 15(d) of the Securities Exchange Act of 1934, in the City of Parsippany, New Jersey, on February 23, 2017 the registrant has duly caused this report to be signed on its behalf by the undersigned, thereunto duly authorized.
PINNACLE FOODS INC.
By: /s/ Craig SteeneckName: Craig SteeneckTitle: Executive Vice President and Chief Financial Officer
(Principal Financial Officer and Principal AccountingOfficer)
Date: February 23, 2017
135
Pursuant to the requirement of the Securities Exchange Act of 1934, this report has been signed below by the following persons on behalf of the registrant and in the capacities and on the dates indicated.
Name Title Date
/s/ Mark Clouse Chief Executive Officer and Director February 23, 2017By: Mark Clouse (Principal Executive Officer)
/s/ Craig Steeneck Executive Vice President and Chief Financial Officer February 23, 2017By: Craig Steeneck (Principal Financial Officer and
Principal Accounting Officer)
/s/ Roger Deromedi Chairman of the Board and Director February 23, 2017By: Roger Deromedi
/s/ Ann Fandozzi Director February 23, 2017By: Ann Fandozzi
/s/ Yannis Skoufalos Director February 23, 2017By: Yannis Skoufalos
/s/ Mark A. Jung Director February 23, 2017By: Mark A. Jung
/s/ Jane Nielsen Director February 23, 2017By: Jane Nielsen
/s/ Muktesh Pant Director February 23, 2017By: Muktesh Pant
/s/ Raymond P. Silcock Director February 23, 2017By: Raymond P. Silcock

[THIS PAGE INTENTIONALLY LEFT BLANK]

2016 was another good year for Pinnacle, demonstrating the enduring nature of our business model and value creation strategy.
2 0 1 6 H I G H L I G H T S
HeadquartersPinnacle Foods Inc.
399 Jefferson Road
Parsippany, NJ 07054
(973) 541-8620
www.pinnaclefoods.com
Stock Exchange ListingNew York
Ticker Symbol: PF
Investor RelationsMaria Sceppaguercio
Senior Vice President, Investor Relationsemail: [email protected]
website: http://investors.pinnaclefoods.com
(973) 434-2924
Virtual Annual Meeting of StockholdersThe annual meeting of stockholders
will be held on Tuesday, May 23, 2017 at
10:00 a.m. EDT. The meeting will be
conducted via live webcast at
www.virtualshareholdermeeting.com/PF2017
Transfer Agent and RegistrarComputershare Investor Services
P.O. Box 43078
Providence, RI 02940-3078
(877) 373-6374
DividendsDividends are paid quarterly in January,
April, July and October.
Independent Registered PublicAccounting FirmDeloitte & Touche LLP
Parsippany, NJ
Corporate News and ReportsA wide range of information about the
Company, including news releases,
financial reports, investor information,
corporate governance and career
opportunities are available on our website:
www.pinnaclefoods.com
Printed materials such as the Annual Report
on SEC Form 10-K and quarterly reports on
SEC Form 10-Q may be requested via our
website or by calling (973) 434-2924.
Forward-Looking StatementsThis Annual Report contains statements that
are forward-looking and actual results could
differ materially. Factors that could cause
this difference are set forth in Items 1 and 1A
of the accompanying Annual Report on
SEC Form 10-K.
CORPORATE & INVESTOR INFORMATION
Note: Excludes items affecting comparability. See reconciliation to GAAP financial measures at the end of this Report.
1 Defined as Net Cash Provided By Operating Activities less Capital Expenditures. 2 Reflects legacy Pinnacle retail businesses based on Pinnacle’s IRI custom database for the 52-week period ended 12/25/2016.
• Grew net sales by 17.8% versus 2015,
reflecting the impact of the Boulder
Brands acquisition and a solid base
business
• Gained overall composite market share2
for the fifth consecutive year, fueled
by strength of both existing and new
products
• Expanded gross margin by 120 basis
points, driven by strong productivity,
higher net price realization and favorable
product mix, as well as the benefit of the
Boulder Brands acquisition
• Maintained selling, general and
administrative overhead expenses at
approximately 9% of net sales, among
the lowest in our industry
• Grew adjusted diluted EPS by 12% to $2.15
• Expanded free cash flow to $387 million,
a $122 million increase versus 2015, and
improved net leverage ratio to 4.19x
• Increased our dividend rate by 11.8%
during the year
• Acquired and seamlessly integrated
Boulder Brands, expanding our presence
in growing and complementary health and
wellness categories
(in millions except per share) 2015 2016 Change
Net Sales $2,656 $3,128 +17.8%
Adjusted Gross Profit $750 $921 +22.8%
% Net Sales 28.2% 29.4% +120 bps
Adjusted EBIT $443 $539 +21.6%
% Net Sales 16.7% 17.2% +50 bps
Adjusted Net Earnings $225 $254 +12.8%
Adjusted Diluted EPS $1.92 $2.15 +12.0%
Diluted Shares Outstanding 117.3 118.2 +0.8%
Free Cash Flow1 $265 $387 +$122
98199_Pinnacle_Cover.indd 2 4/6/17 3:48 PM

P I N N A C L E F O O D S I N C . 2 0 1 6 A N N U A L R E P O R T399 Jefferson Road • Parsippany, NJ 07054
pinnaclefoods.com
PI
NN
AC
LE
F
OO
DS
I
NC
.
20
16
A
NN
UA
L
RE
PO
RT
98199_Pinnacle_Cover.indd 1 4/5/17 3:36 PM