pioneering transformative growth beyond the pandemic
TRANSCRIPT

Pioneering Transformative Growth
beyond the Pandemic
Friday, 30 October 2020
09h00 - 12h00
Ms Philisiwe Mthethwa, CEO

NEF Mandate…
Established by the
National Empowerment FundAct No. 105
of 1998, the NEF is an agency of the dtic and
is a driver and a thought-leader in promoting and facilitating
black economic participation through the provision of financial
and non- financial support to black-owned and managed
businesses, as well as by promoting a culture of savings and
investment among black people.
The only DFI exclusively mandated to grow B-BBEE
NEF funds across all sectors of the
economy from R250 000
up to R75 million
2

1. To provide finance to business ventures established and managed by black people.
2. Invest in black empowered businesses that have high employment creating opportunities
3. Support the participation of black women and youth in the economy
4. Maximise support for township and rural economies.
5. Facilitate investment across all provinces in South Africa
6. Encourage and promote savings, investment and meaningful economic participation by black people
7. Advance black economic empowerment through commercially sustainable enterprises
8. Establish the NEF as a financially sustainable DFI in South Africa.
The NEF’s strategic outcome-oriented goals
3
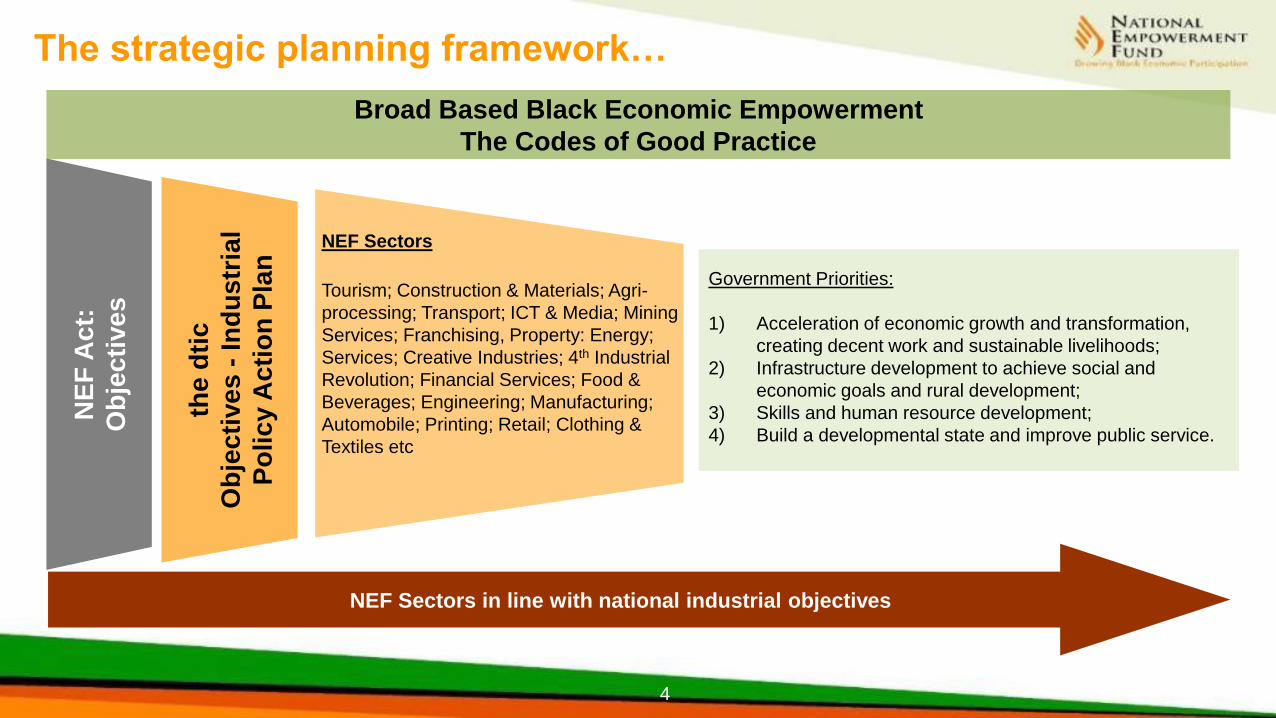
Broad Based Black Economic Empowerment
The Codes of Good Practice
The strategic planning framework…N
EF
Ac
t:
Ob
jec
tive
s
the
dti
c
Ob
jec
tive
s -
Ind
us
tria
l
Po
lic
y A
cti
on
Pla
nGovernment Priorities:
1) Acceleration of economic growth and transformation,
creating decent work and sustainable livelihoods;
2) Infrastructure development to achieve social and
economic goals and rural development;
3) Skills and human resource development;
4) Build a developmental state and improve public service.
NEF Sectors
Tourism; Construction & Materials; Agri-
processing; Transport; ICT & Media; Mining
Services; Franchising, Property: Energy;
Services; Creative Industries; 4th Industrial
Revolution; Financial Services; Food &
Beverages; Engineering; Manufacturing;
Automobile; Printing; Retail; Clothing &
Textiles etc
NEF Sectors in line with national industrial objectives
4

Life to date performance milestones
Output Achievements
1 Approvals • Approved 1058 transactions worth more than R10.61 billion across the country.
2 Disbursement • Over R7 billion has been disbursed to these companies since inception.
3 Integrity • Secured clean external audit opinions for 17 years running.
4 Supporting jobs• Since inception, the number of job opportunities supported is 101 183 of which 68 989 were
new.
5 Industrialisation
• 24 strategic and industrial projects worth R12.5 billion, with the potential to support over
52 000 jobs. 75% of the transactions are at an advanced development stage.
• Since inception 3 600 job opportunities have been created.
6A culture of savings &
investment
• In a transaction worth over R1 billion the NEF Asonge Share Scheme made available more
than 12 million MTN shares to over 87 000 investors comprising black individuals and
groups. 49% of investors were women.
7 Investor education
• Reached approximately 87 632 people in villages and townships through 322 community
seminars on how to save and invest, personal financial discipline, shares, dividends, bonds,
the property and money markets.
8Entrepreneurship
training / incubation
• Business skills training provided over 3808 potential entrepreneurs who attended 398
seminars from 2012 to date.
9 National footprint• Approximately 72% of the number (76% by value) of approved transactions emanated from
the regional offices and Pre-Investment Unit.
10 Collections • Over R3.7 billion has been repaid by investees.
5
6
Annual NEF Approvals, Disbursements and Commitments
PERFORMANCE
SINCE INCEPTION
To date the NEF has
approved over R10
billion to black
entrepreneurs.
Committed
transactions have
exceeded R8 billion
in value.
Cumulative
disbursements
currently sit at over
R7 billion.
YearApproval
(R millions)
Commitments
(R millions)
Disbursements
(R millions)
Apr-03 - Mar-04 R 5.00 R 5.00
Apr-04 - Mar-05 R 30.00 R 20.00 R 12.70
Apr-05 - Mar-06 R 357.00 R 251.00 R 192.90
Apr-06 - Mar-07 R 205.00 R 219.00 R 199.00
Apr-07 - Mar-08 R 128.00 R 203.00 R 192.10
Apr-08 - Mar-09 R 329.00 R 279.00 R 288.10
Apr-09 - Mar-10 R 749.20 R 548.50 R 429.20
Apr-10 - Mar-11 R 749.30 R 552.10 R 608.00
Apr-11 - Mar-12 R 1,162.23 R 620.17 R 597.00
Apr-12 - Mar-13 R 1,332.00 R 946.00 R 632.00
Apr-13 - Mar-14 R 418.00 R 303.00 R 636.12
Apr-14 - Mar-15 R 895.00 R 879.00 R 562.00
Apr-15 - Mar-16 R 1,248.00 R 1,028.00 R 819.00
Apr-16 - Mar-17 R 1,067.00 R 982.00 R 699.00
Apr-17 - Mar-18 R 634.00 R 521.00 R 411.00
Apr-18 - Mar-19 R 576.06 R 513.05 R 437.00
Apr-19 - Mar-20 R 726.51 R 566.86 R 304.00
Total R 10,611.30 R 8,436.67 R 7,019.12

Cumulative NEF Approvals, Disbursements and
Commitments
7
Approvals since inceptionR10 613
Commitments since inceptionR8 437
Disbursements since inception; R7 020
R0
R2 000
R4 000
R6 000
R8 000
R10 000
R12 000
Apr-03- Mar-
04
Apr-04- Mar-
05
Apr-05- Mar-
06
Apr-06- Mar-
07
Apr-07- Mar-
08
Apr-08- Mar-
09
Apr-09- Mar-
10
Apr-10- Mar-
11
Apr-11- Mar-
12
Apr-12- Mar-
13
Apr-13- Mar-
14
Apr-14- Mar-
15
Apr-15- Mar-
16
Apr-16- Mar-
17
Apr-17- Mar-
18
Apr-18- Mar-
19
Apr-19- Mar-
20
NEF approved, committed & disbursed deals by value since inception to 31 March 2020
Approvals since inception Commitments since inception Disbursements since inception

NEF Investment Funds
uMnotho iMbewuStrategic
Projects
Fund
Rural and
Community
Development
Women
Empowerment
Fund
Ob
jec
tive
s
Provides capital for
expansion of
businesses, the buying
of shares in white-
owned businesses or
funding new ventures
• Supports start-up
businesses
• Provides capital for
the expansion of
small enterprises
Funds the
development of
projects through
stages of projects
Supports the
development and growth
of a rural economy in rural
communities, which is
achieved by the
mobilisation of structures
such as cooperatives
•Supports
businesses
that are more
than 50%
owned and
managed by
black women
Pro
du
cts
• Acquisitions
• New Ventures
• Expansion
• Capital Markets
• Liquidity and
Warehousing
• Franchise financing
• Procurement/
Contract
• Entrepreneurship
funding
• Venture Capital
funding structures
• Development of
Black Industrialist
funding in
strategic sectors
• New Ventures
• BusinessAcquisition
• Expansion
The product
offerings
cut across all
products provided
by the different
Funds
Ra
ng
e
Funding ranges from
R2 million to R75
million
Funding from R250
000 to R15 million
Funding up to R75
million
Funding ranges from
R1 million to R50
million
Funding from
R250 000 to R75
million
8

9
Non-Financial Support
9
Pre-investment
As the first-point-of-contact the unit provides product advisory services, manages the online business-plan solution, manages the administration of applications, incubation and entrepreneurial training.
Socio Economic Development
Empower black people in existing NEF transactions and other broad based groups through various interventions such aspromotion of saving and investments, social facilitation,entrepreneurial training, investor education, corporate governancetraining and market access for the acceleration of meaningfulparticipation.
Post-investment support
Monitor investments, provide ongoing portfolio management, manage mentorship support and collections as well as legal compliance
Turnarounds, Workouts and Restructuring
Rehabilitate distressed transactions and reduce impairments Through a combination of measures including balance sheet restructuring, equity and /or working capital injection, operational restructuring, introduction of a strategic equity partner and / or turnaround specialist and business rescue.
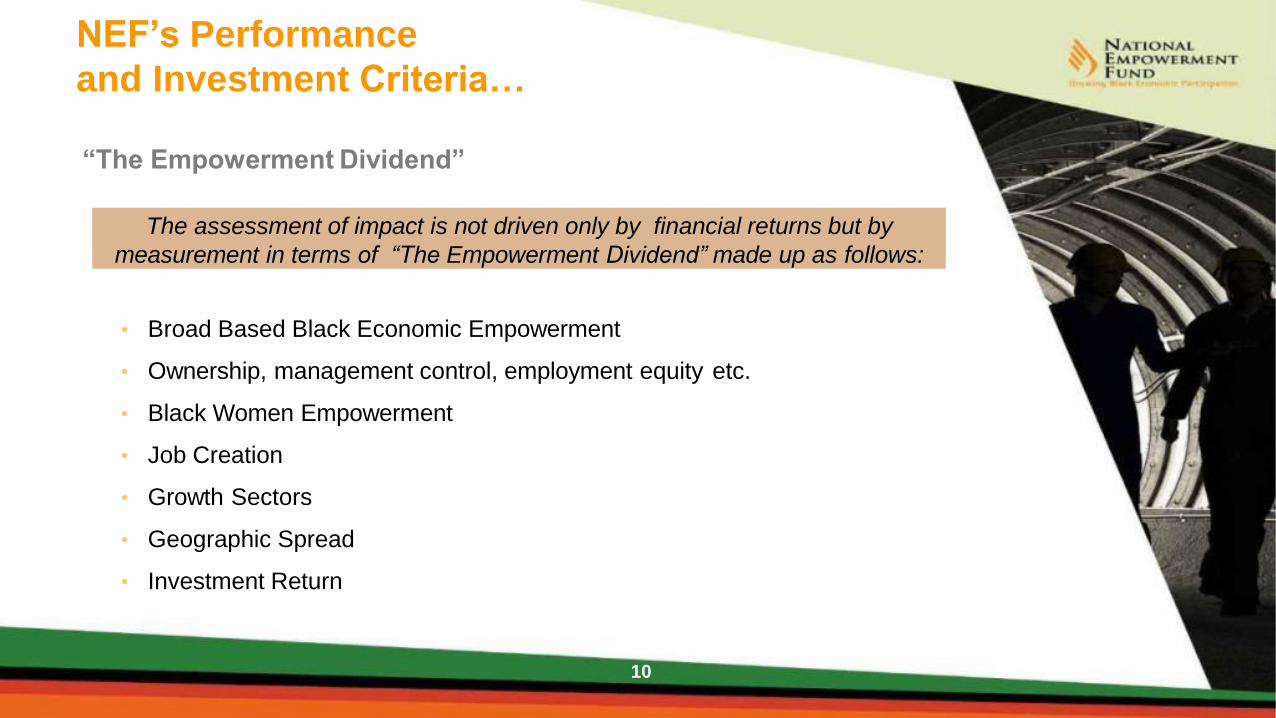
“The Empowerment Dividend”
• Broad Based Black Economic Empowerment
• Ownership, management control, employment equity etc.
• Black Women Empowerment
• Job Creation
• Growth Sectors
• Geographic Spread
• Investment Return
The assessment of impact is not driven only by financial returns but by
measurement in terms of “The Empowerment Dividend” made up as follows:
NEF’s Performance
and Investment Criteria…
10

Government
Sector FocusExamples of NEF Investment Breakthroughs
1Black
industrialists
Create new manufacturing and industrial capacity alongside local and international partners. To date the NEF has invested about
R900m in developing projects (with a total of 24 projects currently under development) with a total of 5 operational businesses that
have created over 3600 jobs and leveraged over R4 billion of third party funding.
2 Support SMEs
A dedicated fund that has supported entrepreneurship, procurement & franchise funding, as well as business planning, incubation,
training and mentorship support. To date, NEF disbursed over R1.6 billion into the support of 454 small and medium enterprises.
3Township &
Rural
Economy
A dedicated fund that supports businesses in rural areas and townships. The businesses are in various sectors including property
(shopping malls), petroleum sector (petrol stations) and tourism. To date the NEF disbursed over R2.1 billion in support of entities
in rural and township economies.
4 Property
To respond to the market failures of low ownership of property by black businesses, the NEF introduced the property funding
product to contribute to transformation of the sector. To date the NEF has approved over R372 million in the property sector.
These investments are expected to contribute in job creation, infrastructure development, addressing the lack of student
accommodation and supporting government’s economic stimulus and recovery plan. In the past year alone, the NEF approved
approximately R150 million in this sector, leveraging close to R600 million in third-party funding.
5 Tourism
The NEF continues to invest in community-owned hotels and lodges to drive the growth of the tourism sector. This includes
investments in tourist attraction projects like the Graskop Gorge Lift, a flagship project that will drive tourism development in the
Panorama Tourist Route in Mpumalanga, and is the first of its kind in Africa. To date the NEF has disbursed over R251 million into
this sector and continues to identify opportunities in partnership with the Department of Tourism.
6Affordable
housing
In partnership with various industry stakeholders, supported the construction of several social housing, student accommodation
and related projects. To date, NEF invested over R272 million in this sector.
7Agro-
processing
Supported beneficiation investments across the agricultural value chain such as processing of castor oil, fruit juices,
condiments etc. To date, NEF invested over R316 million in this sector.
8 Energy Invested over R885 million in service stations countrywide, 40% of which are owned and managed by black women.
Sectors Funded by the NEF
11
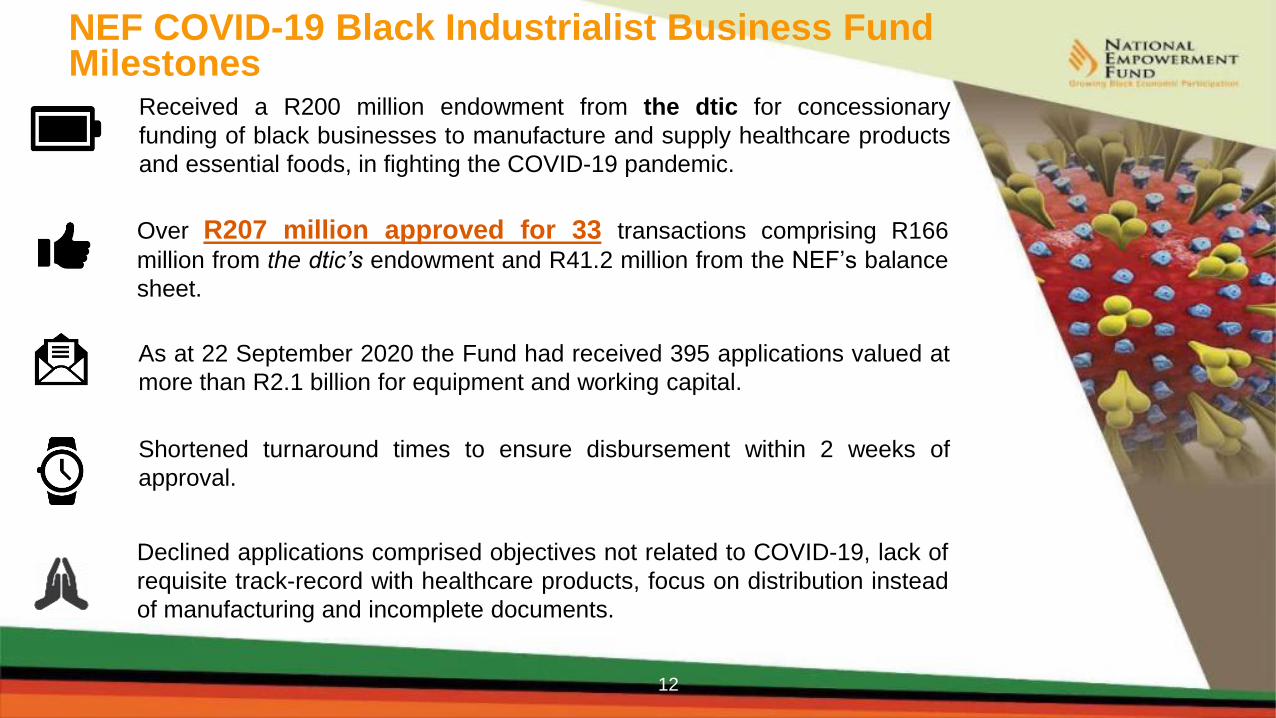
NEF COVID-19 Black Industrialist Business Fund Milestones
Shortened turnaround times to ensure disbursement within 2 weeks of
approval.
Over R207 million approved for 33 transactions comprising R166
million from the dtic’s endowment and R41.2 million from the NEF’s balance
sheet.
As at 22 September 2020 the Fund had received 395 applications valued at
more than R2.1 billion for equipment and working capital.
12
Declined applications comprised objectives not related to COVID-19, lack of
requisite track-record with healthcare products, focus on distribution instead
of manufacturing and incomplete documents.
Received a R200 million endowment from the dtic for concessionary
funding of black businesses to manufacture and supply healthcare products
and essential foods, in fighting the COVID-19 pandemic.

13
NEF Covid 19 Initiatives
BUSINESS IN DISTRESS
OPERATIONAL
TURNAROUND TO BE
UNDERTAKEN BY TWR
INSOLVENT COMPANY
INABILITY TO PAY LOAN
ACCORDING TO APPROVED
TERMS
RESTRUCTURING OF
BALANCE SHEET/LOANS
BY POIU/TWR

14
NEF Covid 19 Initiatives
CANNOT MEET NEF LOAN
REPAYMENTS
CANNOT PAY SALARIES
AND CRITICAL COSTS
NO AVAILABLE WORKING
CAPITAL TO TRADE POST
LOCKDOWN
MORATORIUM GRANTED
ON LOANS
INTEREST FREEZE FOR 6
MNTHS
*2 MNTH SOFT LOANS FOR
EMERGENCY COSTS ONLY
*UIF TERS APPLICATIONS
*sefa DEBT RELIEF FUND
*UIF – DISTRESS FUND
*dtic/GOVT INCENTIVES
DURING
LOCKDOWN

R50 million COVID-19 Relief Measures for NEF investees
• NEF granted 47% of existing investees a loan repayment holiday for a period of
up to three months from April to June 2020.
• This was to help safeguard the sustainability of the businesses whose operations
had been affected by the lockdown.
• This amounted to a total R30 million postponement in capital repayments. In
addition, NEF granted a zero rating on interest for these eligible investees over the
same period, which will resulted in a total R20 million benefit for the clients.
• Total COVID-19 relief package amounted to R50 million.
• These concessions ensured that when the lockdown was eased, the businesses
were not confronted by an ominous debt obligation.
15

Ongoing Support to NEF Investees
• The NEF continues to provide ongoing support to its investees in the form of
mentorship, post investment and back office support.
• The investees are provided with financial relief in the form of interest and capital
repayment moratoriums on a case by case basis.
• The NEF has submitted a proposal to the National Treasury via the Department
of Trade, Industry and Competition (the dtic) for an allocation in the amount of
R200 million.
• If the above allocation is approved, it would be used for supporting investees who
have been adversely affected by COVID-19.
• The support would be in the form of working capital support to finance the businesses
to enable them to return to normal operations and to retain jobs that have been lost as
a result of COVID-19.
16

OVERVIEW OF NEF FUNDING
17

Empowering the Black Youth (2010-2020)
18
Youth Sector FocusAmount
ApprovedActive Deals Jobs Impact
Arts & Culture 21,398,500 3 1570
Services 61,145,553 7 535
Energy 88,843,000 13 448
Construction 7,300,000 2 258
Mining 13,000,000 1 93
Property 78,369,002 4 83
Retail 12,622,000 5 81
Food & Beverages 13,792,529 6 68
Manufacturing 35,101,240 5 64
Agro Processing 15,750,000 2 47
Transportation 16,136,718 3 30
Tourism & Entertainment 4,051,859 2 17
Distribution 5,000,000 1 6
Engineering 6,500,000 1 1
Total 379,010,401 55 3301
• Young Entrepreneurs
have increasingly
found expression
through the funding of
the National
Empowerment Fund.
• Creative industries
have proven to be a
great factor for
unlocking broad-based
impact with the number
of jobs created per
funds invested proving
to be a great catalytic
factor for the NEF.
• The Youth Owned
Business portfolio has
proven to be as
diverse as it is
sustainable with
investments across
numerous industries.

Black Women Owned Businesses -(2010-2020)
• In the past 11 years the NEF approved black woman-owned
transactions worth over R1.3 billion.
• Total volume approved transactions is 186.
Financial year Value Approved
Transactions
Number of Approved
Transactions
2020 R84 628 553 5
2019 R161 913 736 16
2018 R125 370 874 15
2017 R200 806 627 21
2016 R235 943 610 34
2015 R187 851 238 28
2014 R23 125 000 3
2013 R129 532 003 21
2012 R135 443 683 22
2011 R81 422 727 15
2010 R17 283 526 6
TOTAL R1 383 321 577 186
19

NEF Investments in the Fuel Sector
3 473 jobs110 fuel stationsR885 million
31% successful exits R100 million
guaranteed44% women-owned
• Within the NEF’s franchise portfolio, service stations rank as the most vibrant and successful both
commercially and in terms of the repayment trends to the NEF.
• Relationships have been created with the various petroleum companies in line with the NEF SME Strategy
that seeks to leverage the technical expertise provided by the oil companies for the benefit of black and
women-ownedenterprises.
20
20
Success attributes:
Hands-on approach by the
owner
Location is very critical
Branding – new and
revamped sites
Continuous marketing with
stakeholders
High volume-based
forecourt
New developments in the
area
Non-financial support
NEF personnel continuous
monitoring & advice

Supporting Tourism
21
In June 2018 the Department of Tourism singed an MOU with the NEF to establish the
Tourism Transformation Fund (TTF).
NDT will transfer R120 million to the NEF over a 3-year period to transform the
tourism sector.
The NEF has funded various lodges and hotels within the tourism industry throughout the
country:
Total approved is over R372 million.
Secured R52 million in 3rd-party funding from the Department of Tourism.
Over 950 jobs supported as a result of investments made in the sector.
The impact of these transactions have influenced social and infrastructure development in the
respective communities:
Road Infrastructure
Housing
Retail and Shopping Centers
The transactions have been structured such that the local communities become
shareholders in the funded facilities.
21

Rural and Township Economies
Examples of Township Property Sector
Examples of Rural/Township-based enterprises
• The NEF also drives black economic empowerment by supporting the growth of township and rural economies, where
the majority of the NEF’s target market resides.
• Over R2.1 billion has been invested in the development of businesses in townships and rural areas, having supported
18 989 jobs, with the majority of beneficiaries being women.
• Black-owned shopping malls, hotels, social housing developments, student accommodation, procurement, franchises,
clothing and footwear manufacturers, among many others, including converting existing spaza shops into mini
supermarkets that can compete with established retailers, constitute some of the investments made.
Name of Investee Location Total Project
Cost
NEF
Commitment
Number of
Beneficiaries
Jobs
Created
Black Women
OwnershipUmlazi Mega City KZN 51 800 000 51 800 000 450 2500 60%
Qumbu Shopping Centre Eastern Cape 55 226 000 48 886 000 350 235 60%
Willowvale Shopping
Centre
Eastern Cape 26 421 000 23 321 000 17 120 33%
Eyethu Mall Gauteng 500 000 000 50 000 00065 40 000 1101 60%633 447 000 174 007 000 40 817 3 956
Name of Investee LocationNEF
Commitment
Jobs
Created
Black Women
OwnershipSomething Nice Market Western Cape 1 730 000 22 49%BVN Market Store Gauteng 1 430 000 16 0%Matlala's Market Store Gauteng 1 550 000 22 0%Eden Park Market Store Gauteng 1 395 000 14 100%
6 105 000 74
22

Human Settlement Out of a University student population of approximately 530 000, there is currently only enough student
accommodation for 100 000 students.
Less than 10% of 1st year university students can be accommodated
Technical and Vocational Education and Training (“TVET”) colleges have over 710 000 college students, only with
10 120 beds
Colleges can provide accommodation for only 1.4% of students
Increase in accommodation costs - poorer students will increasingly find themselves in tough competition with
those who can afford to pay for the cost of accommodation.
Limited land for development at Universities
By 2030, to meet the enrolment targets set out in the Post School Education and Training policy and the National
Development Plan, an extra 400 000 beds would be needed.
Below is a sample of the housing projects funded by theNEF:
23
NEF
Commitment
52 159 000 33 375 000 308 128 50.4%
232 545 000 50 000 000 1062 490 0%
50 025 253 34 530 961 264 255 35%
390 588 517 48 000 000 1168 1151 25,10%
49 327 000 25 705 000 106 366 100%
120 330 000 32 176 000 312 321 0%
894 974 770 223 786 961 3 220 2 711 35%
Black
Women
Ownership
Total
Project
Cost
Number
of Beds
Jobs
Created

Creative Industries & Media In 2015, global revenue from cultural and creative industries accounted for 3% of the world’s Gross Domestic
Product (GDP), or a total of $2 250bn. It alsocreated a total of 29.5 million jobs worldwide, or 1% of the
world’s actively employed population.
South Africa is aligned with this trend where in 2014, according to some early mapping of the sector, the
country’s creative economy contributed over R90.5bn to the national economy and contributed 2.9% of the
GDP, exceeding, for instance, the contribution of agriculture to GDP (2.2%). In 2014, the industry accounted
for 2.9% of employment in South Africa, equating to 443 000jobs.
R390 million creating over 2300 jobs since inception todate.
Below is a sample of the creative industries & media funded by the NEF:
Name of Investee LocationTotal Project
Cost
NEF
Commitment
Nature of
Business
Jobs
Created
Black
Women
OwnershipLong Walk to Freedom KZN 296 097 916 50 000 000 Movie 799 0%Power 98.7 Gauteng 132 736 522 75 121 416 Media 107 0%
SkyRink Studios Gauteng 240 442 291 40 000 000Production
Studios 114 0%
Sew Winter into my skin Western Cape 12 500 000 3 500 000 Movie 37 50%
Diprente Gauteng 8 412 000 7 612 000Animation
Studios 140 0%
690 188 729 176 233 416 1197
24

Logistics
25
South Africa is home to the farthest-reaching and highest-quality transport network on the African continent, which is
good news for aspiring transport entrepreneurs.
For decades the country’s extensive road, air, rail and sea links have underpinned economic and social development
not only in the domestic market but through the region as a whole.
As with all sectors of the economy, however, transportation and logistics remain largely untransformed.
The NEF has invested R385 million in the sector, which comprises 3,27% of the invested portfolio. NEF investment has
supported 3101 jobs.
14% has benefitted black women entrepreneurs.
Name of
Investee LocationTotal Project
Cost
NEF
Commitment Nature of Business Jobs CreatedBlack Women
OwnershipAPM Gauteng 79 050 000 45 000 000 Passenger Transport 179 6%AB 350 Eastern Cape 23 668 000 12 268 000 Passenger Transport 501 23%
Desert Oil Western Cape 50 000 000 37 390 122 Wholesale Fuel Retailer 31 0%Gibela Rail Gauteng 300 000 000 90 000 000 Train Manufacturing 31 121 60%
Bapo
TransportNorth West 176 571 000 65 928 000 Passenger Transport 174 30%
629 289 000 250 586 122 32 006
Below is a sample of the logistics businesses funded by the NEF:
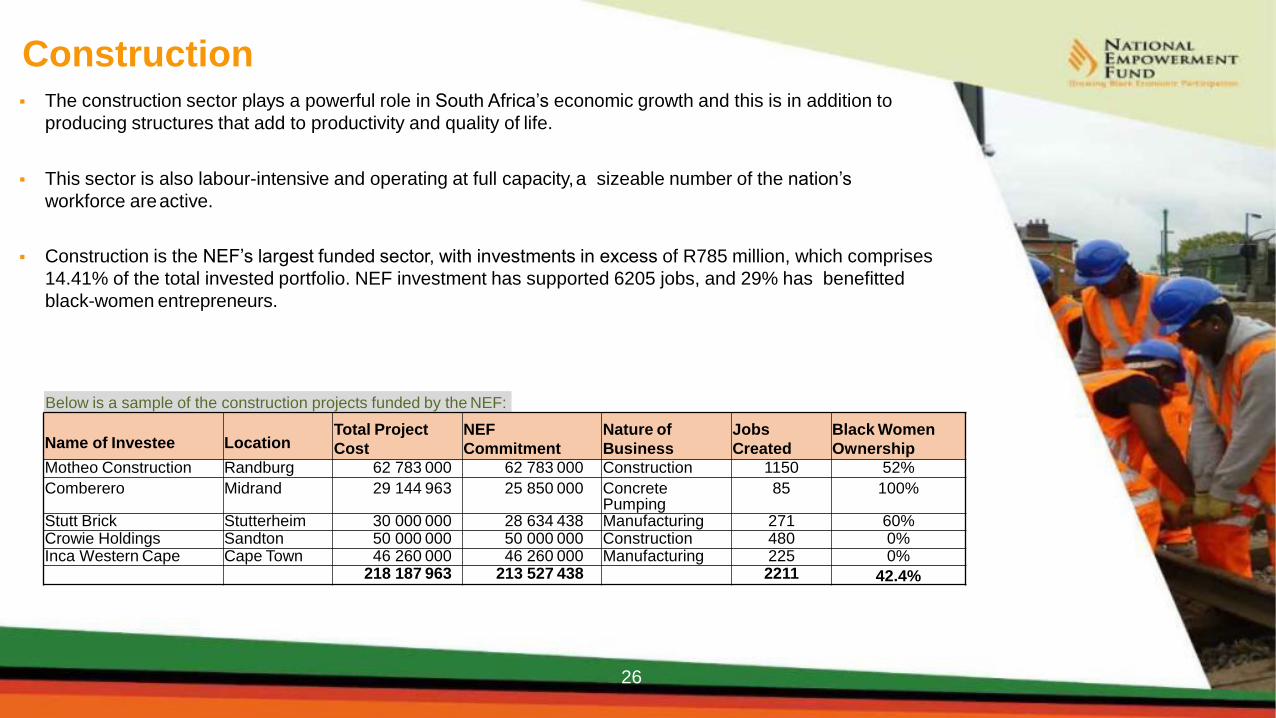
Construction The construction sector plays a powerful role in South Africa’s economic growth and this is in addition to
producing structures that add to productivity and quality of life.
This sector is also labour-intensive and operating at full capacity,a sizeable number of the nation’s
workforce areactive.
Construction is the NEF’s largest funded sector, with investments in excess of R785 million, which comprises
14.41% of the total invested portfolio. NEF investment has supported 6205 jobs, and 29% has benefitted
black-women entrepreneurs.
Below is a sample of the construction projects funded by the NEF:
Name of Investee LocationTotal Project
Cost
NEF
Commitment
Nature of
Business
Jobs
Created
Black Women
Ownership
Motheo Construction Randburg 62 783 000 62 783 000 Construction 1150 52%
Comberero Midrand 29 144 963 25 850 000 ConcretePumping
85 100%
Stutt Brick Stutterheim 30 000 000 28 634 438 Manufacturing 271 60%Crowie Holdings Sandton 50 000 000 50 000 000 Construction 480 0%Inca Western Cape Cape Town 46 260 000 46 260 000 Manufacturing 225 0%
218 187 963 213 527 438 2211 42.4%
26

Building the economy, brick by brick
Construction of 312 social housing
apartments in Kempton Park, Ekurhuleni, to be
known as Kempton Village. Its scale and
magnitude, developmental essence and the entrepreneurial
spirit that birthed it, define the courage and vision of the NEF and its
co-funders.
27

SUPPORTING BLACK INDUSTRIALISTS
28

Industrialisation Focus and Objectives
Creation of new manufacturing and industrial capacity.
Creation of new jobs as opposed to replacement capital finance.
Investment of new fixed capital into economically depressed areas or
poverty nodes.
Creation of an inclusive economy by increasing industrial investment
participation of black businesses.
Increase RSA export earning potential and reduce import dependence.
Increase co-investment and linkage with foreign direct investment.
29
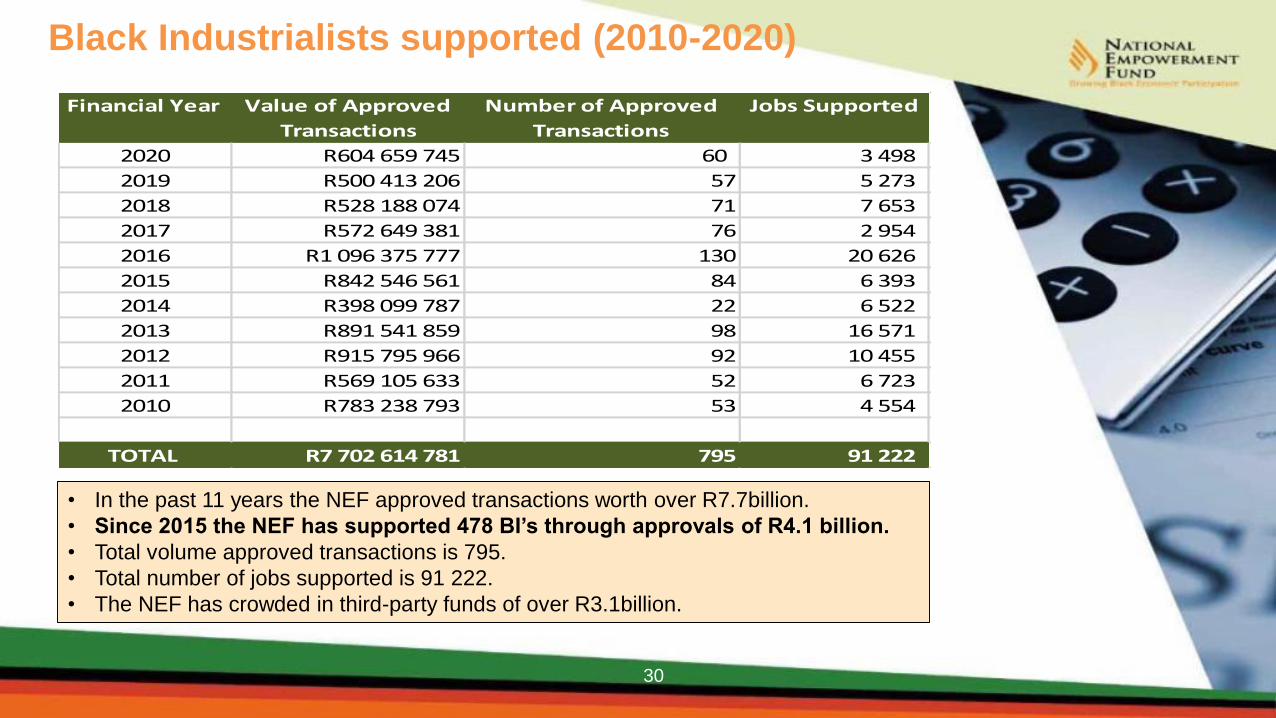
Financial Year Value of Approved
Transactions
Number of Approved
Transactions
Jobs Supported
2020 R604 659 745 60 3 498
2019 R500 413 206 57 5 273
2018 R528 188 074 71 7 653
2017 R572 649 381 76 2 954
2016 R1 096 375 777 130 20 626
2015 R842 546 561 84 6 393
2014 R398 099 787 22 6 522
2013 R891 541 859 98 16 571
2012 R915 795 966 92 10 455
2011 R569 105 633 52 6 723
2010 R783 238 793 53 4 554
TOTAL R7 702 614 781 795 91 222
• In the past 11 years the NEF approved transactions worth over R7.7billion.
• Since 2015 the NEF has supported 478 BI’s through approvals of R4.1 billion.
• Total volume approved transactions is 795.
• Total number of jobs supported is 91 222.
• The NEF has crowded in third-party funds of over R3.1billion.
Black Industrialists supported (2010-2020)
30

Black Industrialists supported (2010-2020)Sector 2010 2011 2012 2013 2014 2015 2016 2017 2018 2019 2020 Total
Services 51,380,001 80,395,000 43,128,504 202,169,144 156,400,000 147,032,750 127,696,658 183,335,688 37,390,827 19,270,600 68,397,697 1,116,596,869
Energy 23,960,000 38,132,000 128,582,000 118,986,380 46,405,000 183,621,223 65,760,464 62,721,215 122,402,000 57,790,000 38,610,000 886,970,282
Construction and Materials 250,000 57,350,501 110,075,998 91,923,406 45,638,730 73,053,019 146,404,752 67,745,000 79,700,000 49,000,000 - 721,141,406
Manufacturing 4,619,871 15,595,000 81,875,965 91,150,000 50,411,057 96,634,200 96,285,500 47,210,000 77,966,983 22,992,336 36,711,000 621,451,911
Retail 1,200,000 54,833,500 79,060,500 98,315,245 - 10,242,610 63,901,610 36,333,488 74,671,870 70,945,000 88,740,000 578,243,823
Property 50,000,000 700,000 6,600,000 - 86,255,323 57,880,986 - 81,964,394 141,398,310 49,299,193 474,098,206
Agro Processing 44,500,687 46,241,030 125,471,759 45,889,952 - 10,100,000 126,700,000 18,100,000 - - 34,011,850 451,015,278
Media 170,010,000 31,900,000 50,000,000 76,244,000 - 5,000,000 84,276,944 - 8,500,000 13,568,500 - 439,499,444
Engineering 133,520,049 9,300,000 143,000,000 17,420,000 - 35,650,585 47,480,000 7,950,000 - 29,902,410 - 424,223,044
Transportation 30,000,000 51,945,563 5,000,000 9,375,210 95,945,000 15,960,032 73,293,750 75,429,408 5,820,000 - 47,411,750 410,180,713
Tourism and Entertainment 96,705,358 - 9,666,960 56,299,158 - - 33,400,000 9,831,832 - 38,316,487 128,016,560 372,236,355
Mining Industry 10,000,000 50,000,000 33,500,000 8,500,000 2,100,000 87,568,169 35,309,000 2,000,000 13,000,000 15,000,000 35,446,033 292,423,202
Food and Beverage 53,403,632 11,211,300 38,048,200 21,154,234 - 46,208,650 30,898,610 16,678,750 10,907,000 5,725,000 2,000,000 236,235,376
Chemicals & Pharmaceuticals 17,200,011 53,500,000 - - 45,220,000 - - - 8,520,000 1,250,000 125,690,011
ICT 50,001,000 - - 7,215,130 - - 39,820,000 4,500,000 480,000 5,000,000 14,875,000 121,891,130
Maritime 71,380,000 9,800,000 - - - - - - - - - 81,180,000
Distributors, Dispatchers and Processors 30,800,000 - - 7,580,000 17,736,000 3,535,000 5,000,000 - 64,651,000
Financial Services 25,002,510 12,000,000 1,000,000 - - - 8,050,000 - 3,485,000 15,000,000 64,537,510
Motor Industry 2,672,734 2,186,080 - 1,200,000 - 27,487,473 - 350,000 - 15,950,000 49,846,287
Arts and Culture 10,000,000 - - - - - - - 14,499,563 23,940,662 48,440,225
Textiles 8,500,000 - - 17,200,030 - - - 5,000,000 30,700,030
Printing and Publishing Services 22,308,195 7,526,484 - - - - - - - - - 29,834,679
Wholesale 12,788,000 10,000,000 - - 22,788,000
Equipment Rental and Leasing 20,000,000 - - - - - - - - - - 20,000,000
Education 15,000,000 2,240,000 1,500,000 - - 18,740,000
Total 783,238,793 569,105,633 915,795,966 891,541,859 398,099,787 842,546,561 1,096,375,777 572,649,381 528,188,074 500,413,206 604,659,745 7,702,614,781
Provincial Split 2010 2011 2012 2013 2014 2015 2016 2017 2018 2019 2020 Total
GP 364,663,661 304,949,256 271,920,229 390,276,234 107,305,000 274,642,240 553,015,906 191,626,670 325,169,204 301,738,976 279,684,954 3,364,992,330
KN 219,309,574 26,726,484 314,634,698 120,567,941 4,700,000 60,049,250 131,289,030 151,965,838 55,190,870 37,031,765 29,112,253 1,150,577,703
WC 142,715,520 41,350,000 82,816,978 65,447,210 174,913,000 60,346,232 90,256,000 33,709,408 17,050,000 36,600,055 39,011,000 784,215,403
EC 49,500,038 114,017,563 70,150,000 110,540,100 44,138,730 156,722,323 31,631,500 24,290,000 40,295,000 6,140,000 39,930,000 687,355,254
LP - 53,664,000 74,263,000 43,762,374 - 102,689,750 64,323,610 12,260,000 19,100,000 50,000,000 67,694,856 487,757,590
MP 3,500,000 17,448,330 53,121,358 36,638,000 14,445,000 64,201,565 105,890,000 20,451,000 41,548,000 45,602,410 62,927,110 465,772,773
NW 3,550,000 3,000,000 28,278,000 10,000,000 - 94,205,201 71,038,506 111,380,715 17,970,000 1,700,000 56,631,949 397,754,371
FS - - 4,750,000 99,945,000 10,000,000 29,690,000 21,443,752 11,965,750 8,330,000 6,600,000 20,000,000 212,724,502
NC - 7,950,000 15,861,703 14,365,000 42,598,057 - 27,487,473 15,000,000 3,535,000 15,000,000 9,667,623 151,464,856
Total 783,238,793 569,105,633 915,795,966 891,541,859 398,099,787 842,546,561 1,096,375,777 572,649,381 528,188,074 500,413,206 604,659,745 7,702,614,781
31

Geographic Split Life to Date
32
• The NEF has supported Black Businesses throughout the length and breadth of the country.
• As a development financier the NEF has prioritised the provinces with the smallest GDP
contribution to spread the empowerment dividend countrywide more effectively.
EC7%
FS2%
GP47%KN
15%
LP6%
MP5%
NC2%
NW4%
WC12%
13,6
7,7
2,1
5,0
16,0
6,4
34,3
7,5
7,4
0,0 5,0 10,0 15,0 20,0 25,0 30,0 35,0 40,0
Western Cape
Eastern Cape
Northern Cape
Free State
KwaZulu-Natal
North West
Gauteng
Mpumalanga
Limpopo
GDP % Contribution by Province
2018 2017

Qualifications Statistics
33
No Qualification Number
1 Chartered Accountants 15
2 Master’s degree 17
3 Engineers (additional 3 holds Master’s degree)
4
4 Honours degree 22
5 Bachelors degree 39
6 LLB degrees (8 are admitted attorneys) 9
7 Advanced Diploma 1
8 Diplomas 20
9 Certificates 30
10 Abet 3
Total 160
Head Count – Core vs Support
No. Percentage
Core 106 66%
Support 54 34%
Total 160 100%
Average age of NEF employees is 39 years –
maturing organisation
• 60% of the employee complement is female
• 41% of MANCO is female

NEF Financial Position
34

A Promise to Fund the Funder
3535
State of the Nation Address, 21 May 2004, former
President Mr Thabo Mbeki:
“The National Empowerment Fund
will announce new financial and non-
financial empowerment products,
within the next three months. In this
context, we must bear in mind that
Government has provided R1 billion
for black economic empowerment
during the current fiscal year, with
R10 billion provided for over the next
five years”.

Deployment of Trust Capital
Cash funds received from the dti (at the time) R2.3 billion
Investment in listed shares (MTN) at cost R171 million
Total Trust Capital R2.4 billion
Net asset Value as at 31 March 2020 R3.6 billion
Net appreciation in assets since inception R1.2 billion
In 2020 received support from the dtic for the NEF COVID
Fund
R200 million
With the R2.4 billion total recapitalisation since inception, the NEF has increased its initial capital by 50% and
delivered the following socio-economic benefits:
Over R10.6 billion in approvals, R7 billion of which has been injected into the economy.
R3.4 billion approved for the empowerment of black women.
Over 101 183 jobs opportunities supported.
Provided financial and non-financial support to entrepreneurs across all 9 provinces
of the country
36

37
NEF Capitalisation
1. Trust capital of R2,47 billion
– cash transfers by National Treasury of R2.3 billion (awarded
in 2005 and received over a 5 year period to 2010); and
- allocation of MTN shares valued at R171 million (2002/3
financial year).
2. NEF Asonge Share Scheme (R1 billion raised through the retail
offer) during the 2007/8 financial year.
3. Initially operating expenses supported through the dti (at the time)
transfers of R322 million over a 5 year period to 2010.
4. Self-sustained through dividends, interest on investments and
deposits, as well as ED Funding.
5. In 2020 received R200 million from the dtic for the NEF COVID
Fund.

13
NEF Cash Balance
38
Unaudited Actuals Unaudited ProjectionsMonth 12 months
31-Mar-201 April 2020 - 31 March
2021Inflows R RBank balance 1 419 514 008 271 443 277 Collections - 296 952 920 Dividends - 56 505 244 Interest on cash Investments - 48 391 345 Capital raising Fees - 3 600 000 Enterprise Development Fund - 5 200 000 Other income - 1 150 000 Bad Debts Recovered - 8 000 000
1 419 514 008 691 242 786 OutflowsApprovals - 600 000 000 Commitments 723 037 181 -DisbursementCancellationsOpex & Capex - 252 167 205 Conditional Enterprise Development 425 033 550
1 148 070 731 852 167 205
Unencumbered cash 271 443 277 -160 924 419

Unlocking Third Party Funds
uMnotho iMbewu RCDF SPF Total
Total value of
funded projectsR952m R61m R18m R135m R1166bn
NEF funding R304m R34m R8m R37m R383m
Third party funding R647m R27m R10m R98m R782m
% funding
leveraged68% 44% 55% 73% 67%
In partnership with other stakeholders, the NEF leveraged a
total of R782m third party funding during FY 2018-2019
• Average leverage of 60% across the Funds, with higher
leverage in uMnotho and SPF (also driven by limited available
capital for the NEF),
• NEF is a catalyst for unlocking economic value.
Life to date the NEF has leveraged third party funding
amounting to R8.8 billion.
39

Annual Collections
40
Over R2,3bn collected during the last five years
Effective portfolio management
Culture of loan payments entrenched
In 2016, the amount was high due to Busamed’s part settlement of R196m
Settlement agreements paid:
Ubumbano R140m
Matlosana R52m
R'm
Year Annual Collections
2016 520
2017 427
2018 488
2019 414
2020 495
520
427 488
414
495
-
100
200
300
400
500
600
2016 2017 2018 2019 2020
Annual CollectionsR'm
R'm Annual Collections

A partner trusted by manyNo. Funder Launch Date Total Funds Received Primary Objective of Fund
1 Daimler Chrysler SA September 2011 R4 800 431,26 To empower two former employees of Chrysler to start
their own business
2 Dept. of Economic
Development (WC)
August 2012 R40 302 775,00 Co-funding black entrepreneurs in the Western Cape
3 Bakwena Ba Mogopa November 2012 R5 000 000,00 Co-funding black SMME’s in the North West.
4 Evraz Highveld December 2012 R2 000 000,00 Co-funding black SMME's participating in the steel and
Vanadium value chain in Mpumalanga
5 Transalloy December 2012 R250 000,00 NEF to provide funding on a 60:40 ratio to black
suppliers participating in the ED Gas supply chain in
Emalahleni.
6 Intersurgical December 2012 R400 00,00 Co-funding black entrepreneurs in the Inter-surgical value chain
7 ED Gas December 2012 R350 000,00 Co-funding black entrepreneurs in the ED Gas value chain
8 BPSA February 2017 R53 000 000,00 Support black entrepreneurs to acquire filling stations
9 Bakgatla Ba Kgafela March 2013 R5 000 000,00 Provide financial and non-financial support for SMME’s
and entrepreneurs in the community.
10 Dept. of Rural Dev. &
Land Reform
March 2016 R583 222 424,57 Support farms workers to become land owners
11 Department of Sports
Arts & Culture
September 2016 R75 000 000,00 Unlocking business opportunities in the arts and
heritage sectors
12 Department of Tourism March 2017 R120 000 000,00 Tourism Transformation Fund (TTF)
13 Nissan South Africa March 2016 R5 305 900,00 Allocate business vehicles to black entrepreneurs
14 Transnet Port Terminals April 2019 R15 000 000,00 To empower SME’s operating within the Transnet value chain.
15 Bakubung December 2019 R3 000 000,00 Empower SME's in host communities of Bakubung in line with the
Enterprise and Supplier Development obligations of the SLP.
16 City of Ekurhuleni
Metropolitan Municipality
December 2019 R33 000 000,00 Invest in SME's conducting business within the City of Ekurhuleni
Total R945 631 530.8
41

NEF ESD PARTNERS
Enterprise & Supplier Development Partners
42
Recapitalisation of the NEF
43

Dangers of not recapitalising the NEF:
1.Weakens public trust in Government’s
commitment to B-BBEE.
2.Will result in a funding crisis for black
entrepreneurs.
3.Has led to staff attrition and institutional
memory leakage.
4.Threatens the potential collapse and
closure of a high-performing
organisation.
5.Undermines the historical obligation and
importance of transforming the
economy.
6.Emboldens private sector’s disregard for
the transformation imperative.
7.Constitutes a political risk for the State.
1. In 2004
Government promised to fund the NEF to the tune of
R10bn “over the next five years”.
9. Project Kopano initiated in June 2014:
“business
combination” talks with IDC..
8. In 2015 Finance Minister Hon. N. Nene
recommended the IDC to
fund NEF to the tuneof R1 bn
10. Current efforts: MTEF, IDC, UIF &
PIC
2. Trust capital of R2.47bn awarded between 2004 & 2010, and R1bn raised from equity in
MTN through Asonge Share
Scheme in 2007.
6. Efforts to obtain support from theJobs Fund in 2013 & 2016.
3. Operating expenses supported through the dti (at the time) transfers of R322mn over a 5 year period up to 2010.
4. Applications for recapitalisation
through the MTEF in2012, 2013, 2014,
2015 & 2016.
5. Applications for reclassifica25tion & Limited Borrowing Rights in 2012 & 2013, 2016 & 2017.
7. Temporary Moratorium from 1 May 2013 to 29
April 2014.
Journey of NEF RecapitalisationIs Government
failing to support
radical economic
transformation?
Is Government
failing to fund
black people?
44

1.A funding crisis for black entrepreneurswho have very few alternatives to
seek funding from.
2.
Regrettably, the NEF may be forced to declare a moratorium on the funding
of new transactions, thus placing a break on the entry of new black
entrepreneurs into the economy and placing jobs on the line.
3.Potential to weaken public trust in Government’s commitment to B-BBEE.
4.Threatens the potential collapse and closure of a high-performing
organisation.
5. Undermines commitment to economic transformation.
6.Could embolden the private sector’s disregard for the transformation
imperative.
Key Risks of not capitalising the NEF
45

NEF Market Gap
The NEF has over 280 active investees who will face closure should the organization
cease to exist
Over 30 247 jobs could be lost if the recapitalization is not finalized. On the other hand, an
additional 9000 jobs can be created if the NEF is recapitalized (and therefore immediate
18 000 jobs potential through the decision to recapitalize – old and new jobs)
Over the next 5 years there is a potential to create a further 52 000 jobs from the NEF
strategic investments
There is no other DFI funder for the segment of R5 million to R75 million especially for
black SME’s, construction sector, medical healthcare, rural and township economies, the
petroleum sector, property investments, retail and franching and financial services which
are not funded by the IDC and for which Sefa is not able to fund
The NEF is the only DFI with a mandate of providing investor education to rural
communities and which provides mentorship and back office support at no cost to its
investees. All this will be lost to the black investors if the NEF is not recapitalized.
46
46

47
NEF – IDC BUSINESS COMBINATION
• Project Kopano is a process that began on 18 June 2014 following a dti (at
the time) letter to NEF and IDC stating that “….a process should unfold to
merge the NEF into IDC”. The following structural options subsequently
emerged:
Continue as is (independent)
Arms length subsidiary
Closely managed subsidiary
NEF as a division of the IDC
Complete merger into the IDC
• At the time, the NEF and the dti (at the time) recommended the
implementation of an Arms Length subsidiary where NEF assets and
business are transferred to a company that is a subsidiary of the IDC.
47

NEF – IDC BUSINESS COMBINATION
48
Project Kopano, which is the process of incorporating the NEF into the IDC, began in July 2014.
The process reached a higher trajectory in February 2017 when the Minister of Trade & Industry and the
Minister of Economic Development approved the merger.
As part of the business combination process, the Ministers have recommended that the IDC grants the
NEF a bridging facility effective 1 April 2017 to continue its operations pending finalisation of the
business combination process.
In March 2017 the IDC Board approved a facility of R500 million, however this has not been disbursed
subject to the following conditions precedent:
o Cabinet endorsement of the merger,
o Pledge of MTN shares held by the NEF,
o NT approval of NEF’s limited borrowing rights.
The IDC agreed to consider waving the above CPs subject to NT granting approval for limited borrowing
rights.
THE FACILITY WAS NOT DISBURSED
48
48

NEF – IDC BUSINESS COMBINATION
49
In August 2018 the IDC Board approved a second facility of R500 million to address the funding issues
in a different format, with the following conditions precedent:
o Approval by the dti; EDD & NT in terms of s54 of the PFMA,
The approvals were delayed and the facility was not disbursed to the NEF
In November 2019 the IDC Board approved a third facility of R500 million and this was meant to be a
fund management arrangement
The IDC and NEF teams are still negotiating terms of the facility
The Minister of dtic has approved the facility and implementation will be as soon as there is
agreement on the terms
THE PROCESS OF BUSINESS COMBINATION IS ONGOING AND CURRENTLY AWAITING THE
APPROVAL OR IN PRINCIPLE SUPPORT OF THE CABINET.
49
49

Moody’s Analysis – 20 Feb. 2017
Following the February 2017 announcement of the NEF becoming a
subsidiary of the IDC:
__________________________________________
“…a credit positive for the IDC”.
“IDC will benefit from the NEF’s strong capitalization and liquidity metrics, and will be able to
use NEF as a conduit to disburse additional funding to black-owned enterprises, further
diversifying its income streams”.
“NEF has no borrowings given its status as a trust”.
“We estimate that NEF’s significant capital base (trust capital plus accumulated surplus
accounted for 95.5% of total assets) will improve IDC’s pro forma ratio of tangible common
equity/ tangible managed assets by two percentage points to 40% from 38% as at March
2016”.
“We also expect IDC to benefit from the NEF’s expertise in its core business of black
empowerment investments, particularly among emerging and existing black entrepreneurs.
The incorporation will help IDC meet its five-year strategic targets to lend and invest ZAR23
billion in black-owned enterprises by 2020. IDC has fallen behind in this segment in recent
years, completing only ZAR2.9 billion in transactions in fiscal 2016 and ZAR2.0 billion in fiscal
2015”.
50
17
50

16
Proposed Funding Solution for the NEF
16
Proposed NEF Recapitalization Plan
Institution Amount
1
Immediate Funding Requirement:
National Government (immediate funding for current financial
year)
Industrial Development Corporation (approved facility)
R500 million
R500 million
_____________
R1 billion
2 Proposed annual allocation over the next 5 years R1 billion per annum
51

Activity Summary
CategoryFYE 2020 FYE 2019
Volume Vol % Value Value % Volume Vol % Value Value %
Approved 17 7% R250 955 537 3,45% 18 113% R305 448 063 5,53%
Approved but Declined Pre-Commitment 0 0% R0 0,00% 1 6% R15 000 000 0,27%
Conditional Approval 0 0% R0 0,00% 2 13% R42 667 623 0,77%
Currently at DD stage 12 5% R272 250 000 3,74% 13 81% R150 889 610 2,73%
Currently at PreDD stage 6 2% R165 330 000 2,27% 12 75% R329 146 000 5,96%
Currently at screening 56 22% R1 449 877 412 19,94% 51 319% R1 233 118 887 22,31%
Declined after PreDD 8 3% R106 774 805 1,47% 2 13% R23 000 000 0,42%
Declined at Screening 123 49% R4 317 439 675 59,38% 86 538% R2 994 585 501 54,18%
Declined Post DD 2 1% R46 000 000 0,63% 9 56% R150 446 900 2,72%
Withdrawn 27 11% R662 670 000 9,11% 16 100% R282 900 000 5,12%
251 R7 271 297 429 210 R5 527 202 584
Approved7%
Approved but Declined Pre-Commitment
0%Conditional Approval
0%Currently at DD
stage5%
Currently at PreDD stage
2%Currently at screening
22%
Declined after PreDD
3%
Declined at Screening
49%
Declined Post DD1%
Withdrawn11%
ACTIVITY BY VOLUME
Approved3%
Approved but Declined Pre-Commitment
0%
Conditional Approval
0%
Currently at DD stage
4%
Currently at PreDD stage
2%
Currently at screening
20%
Declined after PreDD
2%
Declined at Screening
59%
Declined Post DD1%
Withdrawn9%
ACTIVITY BY VALUE
52

Thank you
Contact Details
53
www.nefcorp.co.za
WHERE TELEPHONE
1 Head Office,
Johannesburg
011 305 8000 or 0861843 633 /
0861 THE NEF
2 Eastern Cape 0861 633 327 / 0861 NEF ECP
3 Free State 0861 633 377 / 0861 NEF FSP
4 KwaZulu Natal 0861 633 596 / 0861 NEF KZN
5 Limpopo 0861 633 546 / 0861 NEF LIM
6 Mpumalanga 0861 633 678 / 0861 NEF MPU
7 Western Cape 0861 633 927 / 0861 NEF WCP
8 North West 0861 633 697 / 0861 NEF NWP
9 Northern Cape 0861 633 627 / 0861 NEF NCP

A Sample of NEF Investees
54
Nkomazi Cotton Development
55
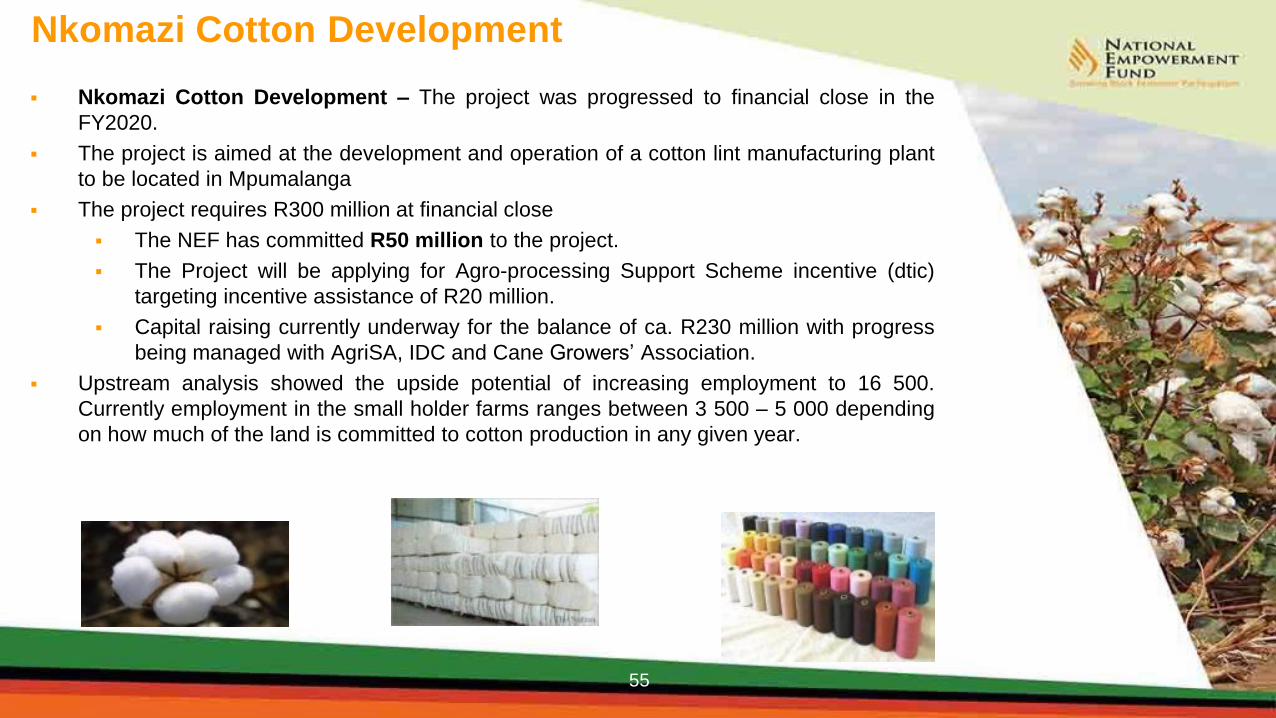
Nkomazi Cotton Development – The project was progressed to financial close in the
FY2020.
The project is aimed at the development and operation of a cotton lint manufacturing plant
to be located in Mpumalanga
The project requires R300 million at financial close
The NEF has committed R50 million to the project.
The Project will be applying for Agro-processing Support Scheme incentive (dtic)
targeting incentive assistance of R20 million.
Capital raising currently underway for the balance of ca. R230 million with progress
being managed with AgriSA, IDC and Cane Growers’ Association.
Upstream analysis showed the upside potential of increasing employment to 16 500.
Currently employment in the small holder farms ranges between 3 500 – 5 000 depending
on how much of the land is committed to cotton production in any given year.

Graskop Gorge
Live the view, feel the forest!
56
The Graskop Gorge Lift Company is the latest and most innovative tourism development in South Africa. This jewel of Mpumalanga’s
Panorama Route is located in the breath-taking Afromontane forest and may be accessed via a viewing elevator that travels 51-metres down
into the Gorge. The centre also offers a restaurant perched on the edge of the gorge, an art gallery, African fashion, curios, crafts and much
more.
The journey begins as the visitor drops off the grassy cliff top plateau in a custom-designed 26-passenger outdoor elevator. It travels down
the cliff face into the cool mountain forest below. The forest trail is a sensory delight and environmental splendour, full of natural sounds,
texture and unforgettable sights. Water drips down rock faces, moss grows in abundance, the river dances across boulders and the waterfall
cascades. A rich, earthy aroma lingers, and little flowers vie for attention next to towering trees as exotic birds glide gracefully in their pristine
habitat.

APM Busses
APM provides intercity passenger
transport services.
APM started its operations with four
rented/leased
buses before obtaining NEF funding.
APM received R50.5 million expansion
finance from the NEF.
The company has sales offices in
Pretoria, Johannesburg and
Durban.
APM has 32 operating licenses for all the
routes
envisaged in the business plan.
Black ownership is 100% and
includes black women and youth.
Through this investment, 30 jobs were
retained and 33 new jobs were created.
Localisation: All NEF-funded
buseswere assembled South
Africa.
Local content of body value is 31%,
chassis is 19%. Average of 25%.
57

BusaMed – transforming healthcare in SA
Busamed’s vision is to be a consolidator of the fragmented health care market. This has been kick-started with the
commercialisation of 4 hospital licenses for 630 hospital beds, spread over three provinces, namely Western Cape, Gauteng and
the Free State. The aim is to develop centres of excellence, which will provide world-class services. The first hospital (a cardiologic
centre) commenced operations & admitted its first in May 2015. The second hospital was launched in Johannesburg’s
Modderfontein in November 2016, while the third was launched in Harrismith at the same time. The Bloemfontein hospital began
operation in 2018.
PIC invested circa R700 million in BusaMed
58

• Presently the 3-star graded hotel with160 rooms, centrally located in
Polokwane within 3 kms from the CBD, next to a Golf course and
Peter Mokaba Stadium, about 6kms to the airport and within walking
distance to many professional firms and entertainment.
• Targeted at local and international business and leisure travellers.
• Traveller who requires quality services, a comfortable and safe
environment.
• Offering all amenities including restaurant, conference facility and
other related facilities typical of a 3-star midscale hotel experience.
• NEF funding of R45.8 million has enabled B-BBEE ownership of 83%,
including the NEF equity as well as effective black women
shareholding of 30%.
• And effective black woman shareholding is 30% and black male is
30%.
• This investment supports108 direct permanent jobs.
59
Park Inn Hotel – R45.8m
59

The People Shall Share…
1. Bussing over 20 000 daily
2. R66 million supporting 174 jobs
1. Supply Personal Protective
Equipment
2. R15 million supporting 62 jobs
Community of 50 000
households located in North
West Province, Brits, in
Marikana.
Total NEF funding = R96
million.
Supporting 388 direct jobs.
Contracts worth R1.65 billion
range between 5 and 8 years.
1. Transportation of ore from shafts
2. R15 million supporting 152 jobs
60
60

POWER 98.7 - Now We’re Talking
61
The NEF has funded POWER 98.7 to the tune of R49,3million in a total project
cost of R132 million.
The radio station aimed at creating a platform that serves as a catalyst for frank
talk about key issues and concerns in the hearts and minds of the audience.
The company’s core target market is aspirational black men and women aged
between 25 and 49 years old in LSM 6 to 10.
POWER 98.7 is licensed to broadcast up to 70% of its air time as talk and at
least 30% of its air time as music.

Construction
Building black Industrialists
Motheo Construction
Group (Pty)Ltd.
(R61million)
Motheo Construction Group (Pty) Ltd is a black-
woman controlled construction company that is
active in general building, civil engineering and rail
infrastructure. The company’s primary focus is social
housing throughout South Africa. Motheo’s CIDB
grading was recently increased to 9GB and 9CE.
This was achieved through the NEF’s initial funding,
which enabled the company to meet the all the
criteria for a CIDB 9 grading. Motheo is 54% black
owned with more than 51% being held by black
women. Motheo is an award- winning construction
company with a solid record of accomplishment built
on having completed R5.5 billion worth of projects
since inception. Over the years, Motheo has grown
its order book from R463 million to R2.8 billion in
total, NEF has invested R61m in Motheo. Motheo
has increased its staff personnel by almost 100% the
total staff complement is 1 884 people. .
62

Appendix-
How the NEF Compares with other DFIs
63

8
64
Comparative Portfolio Impairment Ratios
Entity 2018/19 2017/18 2016/17
NEF 18% 15.41% 17.55%
DBSA 4.5% 4.50% 5.06%
IDC 28.4% 17.4% 16.7%
Business Partners 9.2% 6.9% 7.3%
Sefa (direct lending) 47% 69% 70%
Business Partners is owned majority by institutional investors and fundspeople who can provide security (e.g. properties). DBSA fundsinfrastructure and mainly as senior debt and therefore its funding ismainly not accessible to black business. Those entities have lowerimpairments because they take less unsecured risks.
The IDC and Sefa, which have portfolio profiles (developmental) similarto NEF have both posted impairment ratio higher than NEF. The latteruses GRAP whereas the former use IFRS to measure and recogniseimpairment.

65
NEF: the cost to income ratio for the NEF has been constant at 60% over the last 3 years.
DBSA and Business Partners: reported 23% and 54% respectively in 2018/19 FY, However, the two entities have been experiencing steady deterioration from 2016/17 FY to date.
IDC : the ratio has worsen by 28% between 2017/18 and 2018/19 FY. The growth was primarily driven by decline in revenue while operating cost structure has remained the same. If this growth is maintained, IDC may fail to absorb operating costs from operation income in the medium to long-term.
Sefa: Sefa’s cost to income ratio remains high above 100%. However, the ratio has been coming down year-on-year.
Conclusion: While cost-to-income for NEF has been constant for the last three year, IDC, Business partners and DBSA have been experiencing unfavourable growth over the same period.
65
Entity 2018/19 2017/18 2016/17
NEF 59% 61.3% 55.7%
DBSA 22.9% 21.7% 18.8%
IDC 50% 39.0% 46.0%
Business Partners 53.9% 49.5% 48.9%
sefa 105% 109% 161%
Comparative Cost to Income Ratios