pipeline capacity disclosure - blob-static.vector.co.nz · intake and offtake points on each...
TRANSCRIPT

PIPELINE CAPACITY DISCLOSURE
Relating to Gas (Information Disclosure) Regulations 1997
Year Ending 30 June 2009
August 2009

Vector Gas Limited Pipeline Capacity Disclosure 30 June 2009 page 2
1. INTRODUCTION This document comprises the Pipeline Capacity Disclosure of Vector Gas Limited (“Vector”) [formerly NGC New Zealand Limited] pursuant to the Gas (Information Disclosure) Regulations 1997 (the "Regulations"), Schedule 1, PART 5, for the year ending 30 June 2008. As far as practicable main section headings mirror those of Schedule 1, PART 5 of the Regulations. For additional clarity the relevant clause number of Schedule 1 PART 5 is given alongside each main section heading, and some sub-section headings. Inquiries in relation to this disclosure in particular and system capacity generally, should be directed to: Manager Network Solutions
Vector Gas Limited 101 Carlton Gore Rd Newmarket Auckland 1023
Ph. 09 978 7672 Email [email protected] Terminology In this report terminology generally matches that in the Regulations. Some terms differ from those currently used in Vector’s Transmission System Information Memorandum and transmission services agreements. For example:
Term in this Report: Equivalent Vector Term: Intake Point Receipt Point Offtake Point Delivery Point transmission system pipeline (ie part of the “Transmission
System”) Exclusions This report covers the transmission pipeline systems specified in the Regulations. Some parts of Vector’s Transmission System, specifically minor laterals off the Maui pipeline, are not covered. These include the Te Awamutu North lateral, the Te Kuiti South and the Te Kuiti North laterals. Disclaimer Except in the case of a pipeline with a single Intake Point supplying a single Offtake Point it is difficult to describe a pipeline’s capacity in simple terms. Vector’s pipelines serve multiple Offtake Points most of which are entirely independent of each other notwithstanding that they may supply similar loads, for example dairy factories, or be subject to similar influences, such as the weather.

Vector Gas Limited Pipeline Capacity Disclosure 30 June 2009 page 3
In addition, since gas is a compressible fluid the quantity of energy stored within a pipeline (“line pack”) may change significantly over time as pressures within the pipeline change. As a consequence the flow at a pipeline’s Intake Point need not necessarily equate to the sum of the offtakes at any given time. This has a significant bearing on a pipeline’s ability to supply the various Offtake Points. It is the interaction of all the time-varying offtakes along its length that determines a pipeline’s capacity to transport gas from the Intake Point to a given Offtake Point. Therefore capacity must generally be defined as the ability to transport gas from the Intake Point to a given Offtake Point subject to what is happening at other Offtake Points at the same time. Where there are multiple large Offtake Points a significant change at any one of them may materially affect the capacity available to the others. Information contained in this report is presented in good faith in order to comply with the Regulations and to give an overview of the capacity of Vector's transmission systems. However, shippers or potential shippers should not base their business decisions on the information contained in this report without consulting Vector. Vector will accept no responsibility for the consequences of any misunderstanding, misinterpretation or misuse of information contained in this report. While reasonable care has been taken in the preparation of this report, Vector takes no responsibility for the consequences of any errors that may be contained herein.

Vector Gas Limited Pipeline Capacity Disclosure 30 June 2009 page 4
TABLE OF CONTENTS 1. INTRODUCTION ..................................................................................................................2
2. TRANSMISSION SYSTEMS.............................................................................................5
TABLE 2.1 NORTH SYSTEM........................................................................................................7 Table 2.2 Central (North) System ...................................................................................7 Table 2.3 Central (South) System...................................................................................7 Table 2.4 Bay of Plenty System........................................................................................8 Table 2.5 South System ......................................................................................................8 Table 2.6 Frankley Rd to Kapuni System......................................................................8
3. INTAKE POINTS (REF. SCHEDULE 1 PART 5, CLAUSE3) ....................................9
4. OFFTAKE POINTS (REF. SCHEDULE 1 PART 5, CLAUSE 4) ..............................10
5. FURTHER DISCLOSURE: OFFTAKE POINTS WITH THROUGHPUT LESS THAN 2,000 GJ/WEEK ...............................................................................................................11
6. CRITICAL POINTS OF TRANSMISSION SYSTEMS..........................................12
7. METHODOLOGIES (REF. SCHEDULE 1 PART 5, CLAUSE 7) .............................13
INTAKE POINTS (REF. CLAUSE 3)..........................................................................................13 OFFTAKE POINTS (REF. CLAUSE 4) ........................................................................................13 THROUGHPUT INCREASE IN SYSTEM PEAK WEEK ......................................................................14 (REF. CLAUSE 4 (4) ( C )) .........................................................................................................14 FURTHER DISCLOSURE RELATING TO TRANSMISSION SYSTEMS (REF. CLAUSE 5) ...........18 CRITICAL POINTS OF TRANSMISSION SYSTEMS.........................................................................18 (REF. CLAUSE 6 (2))...................................................................................................................18 TRANSIENT FLOW (CAPACITY SIMULATION) MODEL .................................................................19 (REF. CLAUSE 7 (2))...................................................................................................................19
8. GAS (CAPACITY) RESERVED IN TRANSMISSION SYSTEMS (REF. SCHEDULE 1 PART 5, CLAUSE 8) ..............................................................................................20
APPENDIX 1 ....................................................................................................................................21
FLOW PROFILES ...........................................................................................................................21

Vector Gas Limited Pipeline Capacity Disclosure 30 June 2009 page 5
2. TRANSMISSION SYSTEMS (Ref. Schedule 1 Part 5, Clause 1)
The attached map and pipeline schematics (sheets 01 to 06) depict Vector's high-pressure gas transmission pipelines dealt with in this disclosure. They show all Intake and Offtake Points, other pipeline stations including compressor stations, pressure reductions stations and main line (ie line-break isolation) valves, pipe sizes and other information. Distances between any two stations on the same pipeline can be calculated from the respective station numbers shown on the schematics, as follows:
The last 4 digits of each station number give the distance in km (ie wxy.z km) of that station from the origin of the particular pipeline or lateral on which it is located.
Example 1: Gisborne Sales Gate has the station number 5052013. This means that this station is on the 505 lateral, which starts at the Gisborne Offtake Station near Kawerau, and is 201.3 km downstream of that point. Example 2: The distance between the Southdown and Henderson Delivery Points (on the North System) is found by subtracting the upstream station number from the downstream, ie: Henderson station number = 4300355
Southdown station number = 4300015 Distance between these points = 34.0 km Tables 2.7.1, 2.7.2 and 2.7.3 show the station number, location and map grid reference of each Intake and Offtake Point. Clause 23 (4) of the Regulations requires Vector to treat the following four transmission pipelines as separate transmission systems:
North (ie north of Rotowaro) Central (ie Kapuni to Rotowaro including the Morrinsville sub-system) Bay of Plenty (ie east of Pokuru) South (ie south of Kapuni)
The Central System is currently divided into two sections, the Central (North) and Central (South). There is an interconnection between the Central (South) System and the Bay of Plenty System at Pokuru (No.2). This report also includes the Frankley Rd to Kapuni transmission pipeline. Therefore the transmission pipelines presented in this disclosure are:

Vector Gas Limited Pipeline Capacity Disclosure 30 June 2009 page 6
North: extending from the end of the Maui pipeline at Rotowaro (near
Huntly) to Auckland, then through to Kauri north of Whangarei;
Central (North): extending from Rotowaro to Hamilton (Temple View) and including the Morrinsville sub-system;
Central (South): extending from the Kapuni Gas Treatment Plant to the
interconnection to the Bay of Plenty System at Pokuru (“Pokuru No.2 Offtake”);
Bay of Plenty: extending east from Pokuru (near Te Awamutu) on the
Maui line to Tauranga, Taupo and Gisborne, etc;
South: extending south from the Kapuni Gas Treatment Plant to Wellington and Hastings;
Frankley Rd to Kapuni: extending from the Frankley Rd Offtake Station
on the Maui pipeline near New Plymouth to the Kapuni Gas Treatment Plant, including laterals to the TCC Power Station and the Ammonia-Urea Plant.
For convenience a certain amount of information has been extracted from the attached schematics and presented in the following tables. Note that “MAOP” means the maximum allowable operating pressure of the pipeline.

Vector Gas Limited Pipeline Capacity Disclosure 30 June 2009 page 7
Table 2.1 North System The pipeline consists of the following main sections (ie excluding minor laterals):
Pipeline Segment Nominal Bore (mm)
Length (km)
MAOP (bar g)
Rotowaro - Papakura East Pressure Reducing Station
350 60.8 86
Papakura East Pressure Reducing Station - Westfield
350 26.7 66
Rotowaro - Papakura West 200 60.8 86 Ingram Rd - Glenbrook 150 23.0 86 Westfield - Henderson 200 35.5 66 Henderson - Whangarei Offtake 150 145.4 86 Whangarei - Kauri 100 21.5 86
Table 2.2 Central (North) System This pipeline consists of the following main sections
Pipeline Segment Nominal Bore (mm)
Length (km)
MAOP (bar g)
Rotowaro - Te Kowhai 200 25.8 86 Te Kowhai - Te Rapa Offtake 150 6.3 86 Te Rapa lateral 200 1.3 86 Te Rapa Offtake - Horotiu East 150 1.0 86 Horotiu East - Kuranui Rd 100 24.8 86 Kuranui Rd - Cambridge 80 22.7 86 Kuranui Rd - Morrinsville 150 8.5 86 Morrinsville - Waitoa 100 9.4 86 Te Kowhai – Temple View 200 9.7 86
Table 2.3 Central (South) System This pipeline consists of the following main sections
Pipeline Segment Nominal Bore (mm)
Length (km)
MAOP (bar g)
Kapuni - New Plymouth Offtake 200 52.9 86 New Plymouth lateral 100 10.5 86 New Plymouth - Mahoenui Compressor.
200 81.7 86
Mahoenui Compressor. – Pokuru No.2 Offtake
200 84.0 86
Pokuru No.2 Offtake – Temple View 200 24.5 86
Vector Gas Limited Pipeline Capacity Disclosure 30 June 2009 page 8
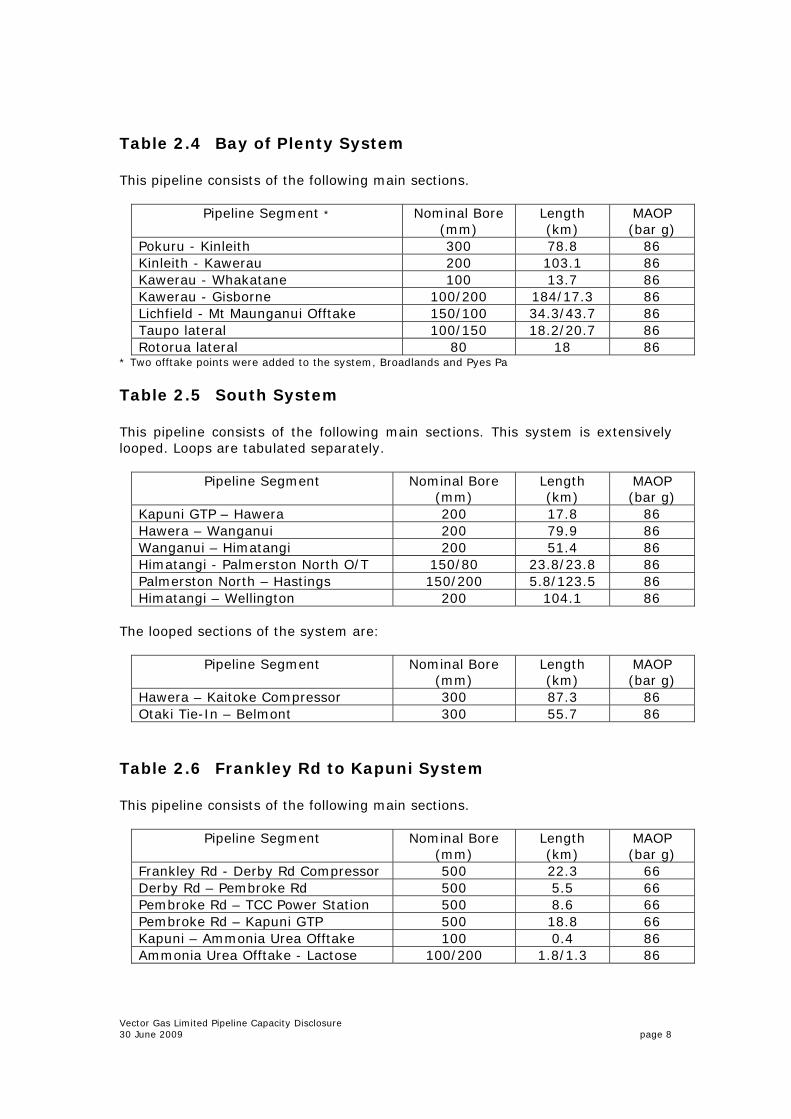
Table 2.4 Bay of Plenty System This pipeline consists of the following main sections.
Pipeline Segment * Nominal Bore (mm)
Length (km)
MAOP (bar g)
Pokuru - Kinleith 300 78.8 86 Kinleith - Kawerau 200 103.1 86 Kawerau - Whakatane 100 13.7 86 Kawerau - Gisborne 100/200 184/17.3 86 Lichfield - Mt Maunganui Offtake 150/100 34.3/43.7 86 Taupo lateral 100/150 18.2/20.7 86 Rotorua lateral 80 18 86
* Two offtake points were added to the system, Broadlands and Pyes Pa Table 2.5 South System This pipeline consists of the following main sections. This system is extensively looped. Loops are tabulated separately.
Pipeline Segment Nominal Bore (mm)
Length (km)
MAOP (bar g)
Kapuni GTP – Hawera 200 17.8 86 Hawera – Wanganui 200 79.9 86 Wanganui – Himatangi 200 51.4 86 Himatangi - Palmerston North O/T 150/80 23.8/23.8 86 Palmerston North – Hastings 150/200 5.8/123.5 86 Himatangi – Wellington 200 104.1 86
The looped sections of the system are:
Pipeline Segment Nominal Bore (mm)
Length (km)
MAOP (bar g)
Hawera – Kaitoke Compressor 300 87.3 86 Otaki Tie-In – Belmont 300 55.7 86
Table 2.6 Frankley Rd to Kapuni System This pipeline consists of the following main sections.
Pipeline Segment Nominal Bore (mm)
Length (km)
MAOP (bar g)
Frankley Rd - Derby Rd Compressor 500 22.3 66 Derby Rd – Pembroke Rd 500 5.5 66 Pembroke Rd – TCC Power Station 500 8.6 66 Pembroke Rd – Kapuni GTP 500 18.8 66 Kapuni – Ammonia Urea Offtake 100 0.4 86 Ammonia Urea Offtake - Lactose 100/200 1.8/1.3 86


Vector Gas Limited Pipeline Capacity Disclosure 30 June 2009 page 9
3. INTAKE POINTS (Ref. Schedule 1 Part 5, Clause3) In the year ending 30 June 2009 the Intake Points for Vector's transmission pipelines were as follows:
North System
There was only a single Intake Point, at Rotowaro. All gas entering the
North System there was received from the Maui Pipeline.
South System There were two major Intake Points for the South System, namely the Kapuni Gas Treatment Plant and the Mokoia Mixing Station, south of Hawera. Central System Rotowaro was the sole Intake Point for the Central (North) System. The sole Intake Point for the Central (South) System was at the Kapuni Gas Treatment Plant.
Bay of Plenty System Gas entered the Bay of Plenty System either through the Pokuru No.1 Intake Point (from the Maui pipeline) or the Pokuru No.2 Intake Point (from the Central (South) System). The Pokuru No.1 and Pokuru No.2 Intake Points are located within a hundred metres or so of each other, adjacent to the Pokuru compressor station. Frankley Rd System
Frankley Rd is both an Intake Point and an Offtake Point as Frankley Rd has “bi-directional” two-way flow metering. In practise however, the great bulk of the gas which entered the Frankley Rd System did so via the Intake Point from the Maui pipeline at Frankley Rd. The TAW Intake Point did not flow gas this year. Therefore the Frankley Rd Intake Point was treated as the sole Intake Point for the Frankley Rd System.

Vector Gas Limited Pipeline Capacity Disclosure 30 June 2009 page 10
4. OFFTAKE POINTS (Ref. Schedule 1 Part 5, Clause 4) Tables 4.1 to 4.6, respectively, give the following information for each pipeline:
Date of the system peak week
The throughput of each Offtake Point in the system peak week For each Offtake Point with a throughput in the system peak week
greater than 2,000 GJ, the dates of the Offtake Point's peak week
For each Offtake Point with a throughput in the system peak week greater than 2,000 GJ, the Offtake Point’s peak week throughput
The average throughput in the system peak week of all Offtake Points
with a throughput in the system peak week less than 2,000 GJ
Total system throughput in the system peak week
The theoretical numerical factor (ie multiplier) by which the throughput of each Offtake Point with a throughput in the system peak week greater than 2,000 GJ could have been increased, assuming:
the same load profile at each Offtake Point; and no capital expenditure (ie no system expansion); and no change in throughput at other Offtake Points
The increase in weekly throughput after applying the above factor.
(NB: If the factor is "x" the increase is (x-1) × weekly throughput.)

TABLE 2.7.1 LOCATION OF INTAKE AND OFFTAKE POINTSRef. Schedule 1 Part 5, Clause 1 (1)
SYSTEM INTAKE OFFTAKE STATION LOCATION NZMS 260POINT POINT NUMBER GRID REFERENCE
North Rotowaro 4002907 Waikokowai Rd Huntly S13 928027
Alfriston 4190001 Phillip Rd Manukau City R11 842626Bruce McLaren 4300239 Bruce McLaren Rd Glen Eden R11 548763Drury 1 & 2 4003496 Waihoehoe Rd Drury R12 848533Flat Bush 4003677 171 Murphy's Rd Flat Bush R11 815670Glenbrook 4050230 Mission Bush Rd Glenbrook R12 642422Harrisville 2003197 Harrisville Rd Harrisville R12 838385Henderson 4300356 110 Amriens Rd Taupaki Q11 487837Hunua 4180001 Parker St Papakura R12 848570Kauri 4350215 SH 1 (near Vinegar Hill Rd) Kauri Q06 283174Kingseat 4050141 Kingseat Rd Patumahoe R12 717453Marsden 1 4370069 Mair Rd Marsden Point Q07 459943Marsden 2 4370069 Mair Rd Marsden Point Q07 459943Maungaturoto DF 4330133 SH 12 Maungaturoto Q08 343654Oakleigh 4301681 Whittle Rd Oakleigh Q07 316927Otahuhu B 4420025 Hellabys Rd Otara R11 762708Papakura 2003394 Hingaia Rd Papakura R12 817570Pukekohe 4050059 Butcher Rd Pukekohe R12 790452Ramarama 4170001 Ararimu Rd Ramarama R12 850489Southdown 4300015 Hugo Johnston Drive Penrose R11 731732Tuakau 2003168 Bollard Rd Tuakau R12 839356Waitoki 4310001 Kaihikatea Flat Rd Rodney Q10 468064Waiuku 4050214 Glenbrook Rd Glenbrook R12 658422Warkworth 4320100 Woodcocks Rd Warkworth R09 585313Wellsford 4301075 Farmers Lime Rd Wellsford Q09 495466Westfield 4003781 Mt Wellington Highway Westfield R11 744738Whangarei 4340091 Dyer St Whangarei Q07 294040
Central (North) Rotowaro 4002907 Waikokowai Rd Huntly S13 928027
Cambridge 4070227 Bruntwood Rd Cambridge S15 269689Hamilton (Te Kowhai) 2080001 Limmer Rd Hamilton S14 008817Hamilton (Temple View) 2002431 Foster Rd Temple View S14 049733Horotiu 4020071 Horotiu Bridge Rd Te Rapa S14 048869Kiwitahi 4090014 Morrinsville - Walton Rd Morrinsville T14 348887Matangi 4080039 Tauwhare Rd Matangi S14 213747Morrinsville 4020406 Railway Yards Morrinsville T14 340907Morrinsville DF 4020406 Railway Yards Morrinsville T14 340907Tatuanui 4020470 SH 26 Tatuanui T14 391942Tauwhare 4070131 Tauwhare Rd Tauwhare S14 237773Te Rapa 4100022 SH 1 Te Rapa S14 054852Te Rapa Cogeneration 4100022 SH 1 Te Rapa S14 054852Waitoa 4020500 Wood Rd Waitoa T14 422943
Central (South) Kapuni 1000001 Palmer Rd Kapuni Q20 110918
Eltham 2060076 North St Eltham Q20 213964Kaponga 2070059 Manaia Rd Kaponga P20 089976Inglewood 2010041 Tarata Rd Inglewood Q19 153267New Plymouth 2030105 195a Connett Rd New Plymouth Q19 111409Stratford 2000192 Pembroke Rd Stratford Q20 157083Waitara 2030046 Waitara Rd Waitara Q19 168402

TABLE 2.7.2 LOCATION OF INTAKE AND OFFTAKE POINTSRef. Schedule 1 Part 5, Clause 1 (1)
SYSTEM INTAKE OFFTAKE STATION LOCATION NZMS 260POINT POINT NUMBER GRID REFERENCE
Bay of Plenty Pokuru 4002308 Candy Rd Te Awamutu S15 040487
Broadlands 5100001 Broadlands Rd Reparoa U17 003944Edgecumbe 5020192 Awakeri Rd Edgecumbe V15 470509Edgecumbe DF 5020192 Awakeri Rd Edgecumbe V15 470509Gisborne 5052013 Back Ormond Rd Gisborne Y18 442740Kawerau 5001820 East Bank Rd Kawerau V15 361407Kawerau (Caxton mill) 5001820 East Bank Rd Kawerau V15 361407Kawerau (Tasman mill) 5001820 East Bank Rd Kawerau V15 361407Kihikihi (Te Awamutu) 5000113 Brill Rd, Kihikihi Te Awamutu S15 148481Kinleith 5010004 Off Old Taupo Rd Kinleith T16 617218Kinleith (mill) 5000789 Off Old Taupo Rd Kinleith T16 617218Lichfield DF 5090005 SH 1 Lichfield T16 572370Mt Maunganui 8040049 Truman Rd Mt Maunganui U14 951854Okoroire Springs 8000175 Somerville Rd Okoroire T15 568568Opotiki 5060044 Factory Rd Opotiki W15 848440Papamoa 8000805 SH 2 Te Puke U14 997818Pyes Pa 8070001 Lakes boulevard Pyes Pa, Tauranga U14 842 802Putaruru 8000044 SH 1 Putaruru T15 549458Rainbow Mountain 5001303 Okaro Rd Rotomahana U16 068167Rangiuru 8050083 SH 2 Te Puke U14 083734Reporoa 5040182 SH 5 Parekarangi U17 995034Rotorua 5030180 SH 5 Rotorua U16 948308Taupo 5080389 269 Rakaunui Rd Taupo U18 812776Tauranga 8030079 Birch Av Tauranga U14 872843Te Puke 8000888 Washer Rd Te Puke U14 023571Te Teko 5020093 Matahina Rd Te Teko V15 432442Tirau 8020020 Okoroire Rd Tirau T15 529549Tirau DF 8020020 Okoroire Rd Tirau T15 529549Tokoroa 5000720 Baird Rd Tokoroa T16 583270Waikeria 5000176 Higham Rd Kihikihi S15 205474Whakatane 5070137 Mill Rd Whakatane W15 580533
Frankley Rd Frankley Rd 4000439 Frankley Rd New Plymouth P19 012304to Kapuni
Ammonia-Urea Plant 3070000 Palmer Rd Kapuni Q20 107915Kapuni (Lactose plant) 3060034 Manaia Rd Kapuni P20 079915Kapuni Gas Treatment Plant 1000001 Palmer Rd Kapuni Q20 110918TCC Power Station 3010002 189 East Rd Stratford Q20 237074

TABLE 2.7.3 LOCATION OF INTAKE AND OFFTAKE POINTSRef. Schedule 1 Part 5, Clause 1 (1)
SYSTEM INTAKE OFFTAKE STATION LOCATION NZMS 260POINT POINT NUMBER GRID REFERENCE
South Kapuni 1000001 Palmer Rd Kapuni Q20 110918
Ashhurst 7050001 Saddle Rd Ashhurst T24 448993Belmont 1100028 Belmont Rd Lower Hutt R27 698033Dannevirke 7000503 Rule Rd Dannevirke U23 721077Feilding 1140087 Campbell Rd Feilding S23 044295Flockhouse 1001420 Parewanui Rd Bulls S23 018001Foxton 1001629 Foxton Beach Rd Foxton S24 021799Hastings 7001531 Karamu Rd South Hastings V21 394660Hawera 1000178 Fairfield Rd Hawera Q21 193769Kairanga 1070244 Gillespies Line Palmerston North S24 278939Kaitoke 1050041 Pauri Rd Kaitoke R22 055344Kakariki 1150001 Cnr Makirikiri Rd & Goldings Line Marton S23 137200Kuku 1160001 Ohau West Rd Kuku S25 934579Lake Alice 1060013 Lake Alice Rd Lake Alice S23 093170Levin 1090052 Hokio Beach Rd Levin S25 009621Longburn 1080068 Reserve Rd Longburn S24 262889Manaia 1010016 Kohiti Rd Okaiawa Q21 122857Mangaroa 7001469 Bridge Pa Rd Mangaroa V21 339463Mangatainoka 7030004 Kohinui Rd Mangatainoka T24 531832Marton 1040212 Wings Line Marton S23 144208Matapu 1000013 Skeet Rd Kapuni Q20 119907
Mokoia Mixing Station Mokoia 1000266 Mokoia Rd Mokoia Q21 258715Okaiawa 1010016 Kohiti Rd Okaiawa Q21 122857Oroua Downs 1130051 SH 1 near Omanuka Rd Oroua Downs S24 087939Otaki 1002005 off SH 1 next to Otaki River Otaki R25 892475Paekakariki 1180001 SH 1 Paekakariki R26 755231Pahiatua 7020212 Mangahao Rd Pahiatua T24 491806Palmerston North 1070272 Rangitikei Line Palmerston North T24 304934Paraparaumu 1002236 Valley Rd Paraparaumu R26 793289Patea 1000422 Victoria Rd Patea Q22 368589Pauatahanui 1 1002455 Paekakariki Hill Rd Paekakariki R26 707117Pauatahanui 2 1002428 Paekakariki Hill Rd Pauatahanui R26 739140Takapau 7000844 SH 2 (Nancy St) Takapau U23 958266Tawa A 1110077 Takapu Rd Tawa R27 635007Tawa B 1190001 SH1 Tawa R27 636008Te Horo 1170001 Te Horo Beach Rd Te Horo R25 866438Waikanae 1002164 Kauri Rd Waikanae R26 807347Waitangirua 1002532 Track off Waihora Crescent Porirua East R27 684057Waitotara 1000692 Waiinu Beach Rd Waitotara R22 586492Wanganui 1000977 Karoro Rd Wanganui R22 824377Waverley 1030058 Lower Otouku Rd Waverley R22 536577

TABLE 4.1 NORTH TRANSMISSION SYSTEMRef. Schedule 1 Part 5, Clause 4 (4) (a) (b) and (c)
INTAKE OFFTAKE POINTS
POINT Week Ending Throughput Week Ending Throughput
(GJ) (Factor) (GJ) (GJ)
Rotowaro 07-Jul-08 n/a n/a n/a n/a n/aofftakes > 2,000 GJ per week
Otahuhu B power station 07-Jul-08 394,188 1.12 47,303 27-Jul-08 420,563Southdown power station 07-Jul-08 247,903 1.20 49,581 07-Jul-08 247,903Westfield 07-Jul-08 123,467 1.25 30,867 07-Jun-09 133,805Glenbrook 07-Jul-08 48,659 2.60 77,854 07-Jul-08 48,659Papakura 07-Jul-08 132,036 1.95 125,434 07-Jul-08 132,018Henderson 07-Jul-08 34,018 1.90 30,616 21-Jun-09 37,068Flat Bush 07-Jul-08 9,733 5.00 38,932 17-Aug-08 10,221Harrisville 07-Jul-08 12,127 12.00 133,397 21-Jun-09 12,155Bruce McLaren 07-Jul-08 7,205 5.80 34,584 21-Jun-09 7,244Drury 07-Jul-08 5,752 12.50 66,148 25-May-09 7,376Tuakau 07-Jul-08 2,762 48.50 131,195 24-May-09 4,877Warkworth 07-Jul-08 5,157 2.00 5,157 21-Jun-09 7,373Marsden (note 2) 07-Jul-08 37,068 0.00 0 01-Mar-09 67,148Hunua 07-Jul-08 2,520 18.50 44,100 21-Jun-09 3,724Kauri DF 07-Jul-08 7,935 3.10 16,664 19-Oct-08 17,065Waitoki 07-Jul-08 2,785 15.50 40,383 14-Sep-08 3,258Whangarei 07-Jul-08 3,625 8.00 25,375 21-Jun-09 3,681
1,076,940
offtakes < 2,000 per week
Pukekohe 07-Jul-08 1,011Ramarama 07-Jul-08 749Maungaturoto DF 07-Jul-08 0Alfriston 07-Jul-08 510Wellsford 07-Jul-08 86Oakleigh 07-Jul-08 0Kingseat 07-Jul-08 55
2,411 344
TOTAL THROUGHPUT 1,079,351
Notes:1. Theoretical capacity assuming all other offtake points remain unchanged with no provision for operational 'headroom'. Factors do not take account of potential coincident peak flows from dominant generation load namely Otahuhu B & Southdown.
2. This load was not included in the modelling to determine the factors for other Offtake Points.
ie Average per Offtake<2,000 GJ =
SYSTEM PEAK WEEK OFFTAKE PEAK WEEKINCREASE WITH
NO CAPEX 1
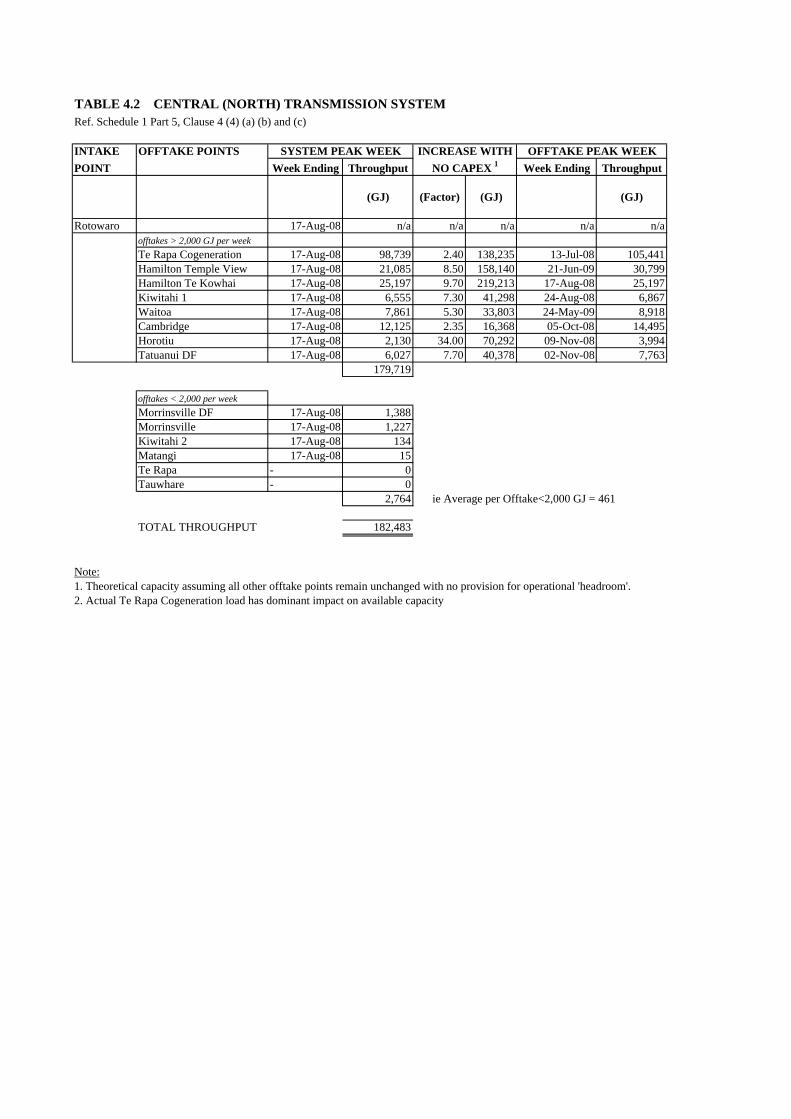
TABLE 4.2 CENTRAL (NORTH) TRANSMISSION SYSTEMRef. Schedule 1 Part 5, Clause 4 (4) (a) (b) and (c)
INTAKE OFFTAKE POINTS
POINT Week Ending Throughput Week Ending Throughput
(GJ) (Factor) (GJ) (GJ)
Rotowaro 17-Aug-08 n/a n/a n/a n/a n/aofftakes > 2,000 GJ per week
Te Rapa Cogeneration 17-Aug-08 98,739 2.40 138,235 13-Jul-08 105,441Hamilton Temple View 17-Aug-08 21,085 8.50 158,140 21-Jun-09 30,799Hamilton Te Kowhai 17-Aug-08 25,197 9.70 219,213 17-Aug-08 25,197Kiwitahi 1 17-Aug-08 6,555 7.30 41,298 24-Aug-08 6,867Waitoa 17-Aug-08 7,861 5.30 33,803 24-May-09 8,918Cambridge 17-Aug-08 12,125 2.35 16,368 05-Oct-08 14,495Horotiu 17-Aug-08 2,130 34.00 70,292 09-Nov-08 3,994Tatuanui DF 17-Aug-08 6,027 7.70 40,378 02-Nov-08 7,763
179,719
offtakes < 2,000 per week
Morrinsville DF 17-Aug-08 1,388Morrinsville 17-Aug-08 1,227Kiwitahi 2 17-Aug-08 134Matangi 17-Aug-08 15Te Rapa - 0Tauwhare - 0
2,764 461
TOTAL THROUGHPUT 182,483
Note:1. Theoretical capacity assuming all other offtake points remain unchanged with no provision for operational 'headroom'.2. Actual Te Rapa Cogeneration load has dominant impact on available capacity
ie Average per Offtake<2,000 GJ =
SYSTEM PEAK WEEK INCREASE WITH OFFTAKE PEAK WEEK
NO CAPEX 1

TABLE 4.3 CENTRAL (SOUTH) TRANSMISSION SYSTEMRef. Schedule 1 Part 5, Clause 4 (4) (a) (b) and (c)
INTAKE OFFTAKE POINTS
POINT Week Ending Throughput Week Ending Throughput
(GJ) (Factor) (GJ) (GJ)
Kapuni 21-Jun-09 n/a n/a n/a n/a n/aofftakes > 2,000 GJ per week
Pokuru 2 n/a 147,114 n/a n/a n/a n/aNew Plymouth 21-Jun-09 22,380 1.62 13,876 21-Jun-09 22,380Stratford 21-Jun-09 2,171 29.50 61,874 17-Aug-08 2,211Waitara 21-Jun-09 2,279 12.00 25,069 24-May-09 2,615Eltham 21-Jun-09 4,028 11.50 42,294 24-May-09 4,400
177,972
offtakes < 2,000 per week
Inglewood 15-Jun-09 841Kaponga 15-Jun-09 57
898 449
TOTAL THROUGHPUT 178,870
Notes:1. Theoretical capacity assuming all other offtake points remain unchanged with no provision for operational 'headroom'.2. The throughput for Pokuru 2 represents a flat profile of 3.9 scm/s.
ie Average per Offtake<2,000 GJ =
SYSTEM PEAK WEEK INCREASE WITH OFFTAKE PEAK WEEK
NO CAPEX 2

TABLE 4.4 BAY OF PLENTY TRANSMISSION SYSTEMRef. Schedule 1 Part 5, Clause 4 (4) (a) (b) and (c)
INTAKE OFFTAKE POINTS
POINT Week Ending Throughput Week Ending Throughput
(GJ) (Factor) (GJ) (GJ)
Pokuru 14-Sep-08 n/a n/a n/a n/a n/aofftakes > 2,000 GJ per week
Kinleith (mill) 14-Sep-08 73,761 1.47 34,841 27-Jul-08 95,608Edgecumbe DF 14-Sep-08 24,563 2.42 34,841 19-Oct-08 32,157Taupo 14-Sep-08 2,960 12.77 34,841 21-Jun-09 4,268Mt Maunganui 14-Sep-08 13,892 2.75 24,311 03-Aug-08 15,310Whakatane mill 14-Sep-08 8,021 3.80 22,459 21-Sep-08 8,044Whakatane 14-Sep-08 9,040 3.46 22,193 08-Sep-08 9,040Reporoa 14-Sep-08 13,991 3.49 34,841 21-Sep-08 16,153Rotorua 14-Sep-08 8,986 2.75 15,726 12-Jul-08 12,209Kawerau (Tasman mill) 14-Sep-08 12,424 3.80 34,841 31-May-09 12,617Kawerau (Caxton mill) 14-Sep-08 11,438 4.05 34,841 31-Aug-08 13,628Gisborne 14-Sep-08 5,508 4.20 17,626 15-May-09 15,060Tauranga 14-Sep-08 5,094 3.73 13,881 28-Jun-09 7,630Tirau DF 14-Sep-08 9,065 4.84 34,841 21-Sep-08 10,056Lichfield DF 14-Sep-08 12,181 3.86 34,841 19-Oct-08 13,056Putaruru 14-Sep-08 2,092 17.65 34,841 06-Jul-08 3,018Papamoa 14-Sep-08 2,490 10.00 22,410 28-Jun-09 3,206
215,506
offtakes < 2,000 per week
Kihikihi (Te Awamutu) 14-Sep-08 1,210Rainbow Mountain 14-Sep-08 0Rangiuru 14-Sep-08 1,512Te Puke 14-Sep-08 534Tokoroa 14-Sep-08 1,981Waikeria 14-Sep-08 728Kinleith 14-Sep-08 592Kawerau 14-Sep-08 228Edgecumbe 14-Sep-08 2Opotiki 14-Sep-08 155Tirau 14-Sep-08 80Te Teko 14-Sep-08 81Broadlands 14-Sep-08 1,896Okoroire Springs 14-Sep-08 15Pyes Pa 14-Sep-08 639
9,653 644
TOTAL THROUGHPUT 225,159
Notes:1. Theoretical capacity assuming all other offtake points remain unchanged with no provision for operational 'headroom'.
ie Average per Offtake<2,000 GJ =
SYSTEM PEAK WEEK INCREASE WITH OFFTAKE PEAK WEEK
NO CAPEX 1

TABLE 4.5 FRANKLEY RD TO KAPUNI TRANSMISSION SYSTEMRef. Schedule 1 Part 5, Clause 4 (4) (a) (b) and (c)
INTAKE OFFTAKE POINTS
POINT Week Ending Throughput Week Ending Throughput
(GJ) (Factor) (GJ) (GJ)
Frankley Rd 07-Jul-08 n/a n/a n/a n/aofftakes > 2,000 GJ per week
Kapuni GTP 07-Jul-08 245,675 1.25 61,419 17-May-09 355,199Ammonia-Urea Plant 07-Jul-08 63,740 1.86 54,816 21-Jun-09 69,051TCC power station 07-Jul-08 376,389 1.28 105,389 05-Apr-09 439,728
685,804
offtakes < 2,000 per week
Lactose 07-Jul-08 281281 281
TOTAL THROUGHPUT 686,085
Notes:1. Theoretical capacity assuming all other offtake points remain unchanged with no provision for operational 'headroom'.
ie Average per Offtake<2,000 GJ =
SYSTEM PEAK WEEK INCREASE WITH OFFTAKE PEAK WEEK
NO CAPEX 1

TABLE 4.6.1 SOUTH TRANSMISSION SYSTEMRef. Schedule 1 Part 5, Clause 3 and Clause 4 (4) (a) (b) and (c)
INTAKE OFFTAKE POINTS
POINT Week Ending Throughput Week Ending Throughput
(GJ) (Factor) (GJ) (GJ)
Kapuni 15-Jun-09 n/a n/aofftakes > 2,000 GJ per week
Tawa A+B 15-Jun-09 81,955 1.72 59,008 15-Jun-09 81,955Belmont 15-Jun-09 47,661 2.20 57,194 15-Jun-09 47,661Hastings 15-Jun-09 42,597 2.00 42,597 05-Apr-09 44,088Palmerston North 15-Jun-09 33,419 1.45 15,039 15-Jun-09 33,419Wanganui 15-Jun-09 18,010 4.50 63,036 27-Jul-08 20,254Hawera 15-Jun-09 6,676 11.00 66,756 26-Oct-08 24,996Levin 15-Jun-09 8,301 3.95 24,488 15-Jun-09 8,301Waitangirua 15-Jun-09 9,332 7.35 59,255 15-Jun-09 9,332Feilding 15-Jun-09 5,601 3.50 14,003 28-Jun-09 5,669Longburn 15-Jun-09 5,778 7.15 35,536 05-Oct-08 9,064Okaiawa 15-Jun-09 6,606 6.22 34,482 17-May-09 8,651Pahiatua 15-Jun-09 2,481 8.50 18,608 26-Oct-08 10,762Pauatahanui 1 15-Jun-09 2,269 27.50 60,123 15-Jun-09 2,269Marton 15-Jun-09 4,132 10.00 37,186 15-Mar-09 5,332Paraparaumu 15-Jun-09 4,662 12.95 55,717 28-Jun-09 4,732
279,480
offtakes < 2,000 per week
Waikanae 15-Jun-09 1,921Dannevirke 15-Jun-09 1,512Takapau 15-Jun-09 1,555Kakariki 15-Jun-09 296Foxton 15-Jun-09 1,456Mangaroa 15-Jun-09 625Patea 15-Jun-09 641Otaki 15-Jun-09 741Manaia 15-Jun-09 757Mangatainoka 15-Jun-09 330Waitotara 15-Jun-09 442Lake Alice 15-Jun-09 589Kaitoke 15-Jun-09 630Ashhurst 15-Jun-09 245Waverley 15-Jun-09 720Paekakariki 15-Jun-09 29Kuku 15-Jun-09 25Te Horo 15-Jun-09 22Matapu 15-Jun-09 8Pauatahanui 2 15-Jun-09 4Oroua Downs 15-Jun-09 922Flockhouse 15-Jun-09 1Kairanga 15-Jun-09 209
13,680 595
TOTAL THROUGHPUT 293,160
Notes:1. Theoretical capacity assuming all other offtake points remain unchanged with no provision for operational 'headroom'.2. Kapuni intake maximum assumed at 560 000 GJ/week.
ie Average per Offtake<2,000 GJ =
SYSTEM PEAK WEEK INCREASE WITH OFFTAKE PEAK WEEK
NO CAPEX 1

TABLE 4.6.2 SOUTH TRANSMISSION SYSTEMRef. Schedule 1 Part 5, Clause 3 and Clause 4 (4) (a) (b) and (c)
INTAKE OFFTAKE POINTS
POINT Week Ending Throughput Week Ending Throughput
(GJ) (Factor) (GJ) (GJ)
Mokoia 15-Jun-09 n/a n/aofftakes > 2,000 GJ per week
Tawa A+B 15-Jun-09 81,955 1.55 45,075 15-Jun-09 81,955Belmont 15-Jun-09 47,661 1.96 45,755 15-Jun-09 47,661Hastings 15-Jun-09 42,597 1.82 34,929 05-Apr-09 44,088Palmerston North 15-Jun-09 33,419 1.30 10,026 15-Jun-09 33,419Wanganui 15-Jun-09 18,010 4.50 63,036 27-Jul-08 20,254Hawera 15-Jun-09 6,676 11.00 66,756 26-Oct-08 24,996Levin 15-Jun-09 8,301 3.55 21,168 15-Jun-09 8,301Waitangirua 15-Jun-09 9,332 6.30 49,457 15-Jun-09 9,332Feilding 15-Jun-09 5,601 3.50 14,003 28-Jun-09 5,669Longburn 15-Jun-09 5,778 6.25 30,336 05-Oct-08 9,064Okaiawa 15-Jun-09 6,606 6.52 36,464 17-May-09 8,651Pahiatua 15-Jun-09 2,481 7.25 15,507 26-Oct-08 10,762Pauatahanui 1 15-Jun-09 2,269 24.45 53,204 15-Jun-09 2,269Marton 15-Jun-09 4,132 9.25 34,087 15-Mar-09 5,332Paraparaumu 15-Jun-09 4,662 10.45 44,060 28-Jun-09 4,732
279,480
offtakes < 2,000 per week
Waikanae 15-Jun-09 1,921Dannevirke 15-Jun-09 1,512Takapau 15-Jun-09 1,555Kakariki 15-Jun-09 296Foxton 15-Jun-09 1,456Mangaroa 15-Jun-09 625Patea 15-Jun-09 641Otaki 15-Jun-09 741Manaia 15-Jun-09 757Mangatainoka 15-Jun-09 330Waitotara 15-Jun-09 442Lake Alice 15-Jun-09 589Kaitoke 15-Jun-09 630Ashhurst 15-Jun-09 245Waverley 15-Jun-09 720Paekakariki 15-Jun-09 29Kuku 15-Jun-09 25Te Horo 15-Jun-09 22Matapu 15-Jun-09 8Pauatahanui 2 15-Jun-09 4Oroua Downs 15-Jun-09 922Flockhouse 15-Jun-09 1Kairanga 15-Jun-09 209
13,680 595
TOTAL THROUGHPUT 293,160
Notes:1. Theoretical capacity assuming all other offtake points remain unchanged with no provision for operational 'headroom'.2. Mokai intake maximum assumed at 86330 GJ/week
ie Average per Offtake<2,000 GJ =
SYSTEM PEAK WEEK INCREASE WITH OFFTAKE PEAK WEEK
NO CAPEX 1

Vector Gas Limited Pipeline Capacity Disclosure 30 June 2009 page 11
5. FURTHER DISCLOSURE: OFFTAKE POINTS WITH THROUGHPUT LESS THAN 2,000 GJ/WEEK (Ref. Schedule 1 Part 5, Clause 5)
Tables 4.1 to 4.6, respectively, also show for each pipeline the following information in respect of each Offtake Point with a throughput in the system peak week less than 2,000 GJ:
Throughput of each such Offtake Point in the system peak week
Total throughput of all such Offtake Points in the system peak week
Average throughput of all such Offtake Points in the system peak week

Vector Gas Limited Pipeline Capacity Disclosure 30 June 2009 page 12
6. CRITICAL POINTS OF TRANSMISSION SYSTEMS (Ref. Schedule 1 Part 5, Clause 6)
Tables 6.1 to 6.6, respectively, show for each pipeline the following information in relation to each Offtake Point with a throughput in the system peak week greater than 2,000 GJ:
The factor by which the throughput of the Offtake Point could have been increased in the system peak week assuming no capital expenditure on the Offtake Point for the increased throughput.
The critical point or section of pipeline providing the first or principal
constraint on increased throughput at the Offtake Point in the system peak week
A brief statement of a possible means to remove the constraint
An estimate of the increase in throughput at the Offtake Point given
the removal of the constraint
An estimate of the capital cost to remove the system constraint on the estimated increased throughput excluding upgrade of the intake or offtake points.

TABLE 6.1 NORTH TRANSMISSION SYSTEMRef. Schedule 1 Part 5, Clause 6 (2) (a) (b) and (c)
OFFTAKE POINTS CRITICAL POINT(S) LIMITING MEANS TO REMOVE LIMITATION CAPITAL
THROUGHPUT COST 1
(Factor) (GJ) ($000) (Factor) (GJ)
Otahuhu B power station 1.12 34,584 Papakura East to Smales Rd pipeline Loop Papakura East to Smales Rd MLV 27,500 1.85 335,060Southdown power station 1.20 66,148 Papakura East to Smales Rd pipeline Loop Papakura East to Smales Rd MLV 27,500 2.25 309,879Westfield 1.25 38,932 Papakura East to Smales Rd pipeline Loop Papakura East to Smales Rd MLV 27,500 3.25 277,801Glenbrook 2.60 77,854 Ingram Rd to Papakura East pipeline Loop Ingram Rd to Papakura East 11,100 2.65 80,287Papakura 1.95 133,397 Ingram Rd to Papakura East pipeline Loop Ingram Rd to Papakura East 11,100 2.00 132,036Henderson 1.90 30,616 Papakura East to Smales Rd pipeline Loop Papakura East to Smales Rd MLV 27,500 5.65 158,184Flat Bush 5.00 44,100 Papakura East to Smales Rd pipeline Loop Papakura East to Smales Rd MLV 27,500 30.00 282,257Harrisville 12.00 16,664 Ingram Rd to Papakura East pipeline Loop Ingram Rd to Papakura East 11,100 10.20 111,568Bruce McLaren 5.80 47,303 Papakura East to Smales Rd pipeline Loop Papakura East to Smales Rd MLV 27,500 31.50 219,753Drury 12.50 125,434 Ingram Rd to Papakura East pipeline Loop Ingram Rd to Papakura East 11,100 40.00 224,328Tuakau 48.50 49,581 Ingram Rd to Papakura East pipeline Loop Ingram Rd to Papakura East 11,100 50.00 135,338Warkworth 2.00 131,195 Warkworth lateral pipeline Loop Warkworth Lateral 5,300 4.25 16,760Hunua 18.50 40,383 Ingram Rd to Papakura East pipeline Loop Ingram Rd to Papakura East 11,100 50.00 123,480Kauri DF 3.10 5,157 Kauri delivery point Loop Kauri DP 7,000 5.50 35,708Waitoki 15.50 30,867 Papakura East to Smales Rd pipeline Loop Papakura East to Smales Rd MLV 27,500 32.00 86,335Whangarei 8.00 25,375 Papakura East to Smales Rd pipeline Loop Papakura East to Smales Rd MLV 27,500 10.7 34,981
Note:Capital Cost estimates exclude the cost of upgrading the Intake or Offtake Points (if required) for the increased throughput.
SYSTEM PEAK WEEK: Week Ending 7 July 2008
INCREASE WITH INCREASE
NO CAPEX (Limit removed)

TABLE 6.2 CENTRAL (NORTH) TRANSMISSION SYSTEMRef. Schedule 1 Part 5, Clause 6 (2) (a) (b) and (c)
OFFTAKE POINTS CRITICAL POINT(S) LIMITING MEANS TO REMOVE LIMITATION CAPITAL
THROUGHPUT COST 1
(Factor) (GJ) ($000) (Factor) (GJ)
Te Rapa Cogeneration 2.40 138,235 Te Kowhai to Te Rapa pipeline Loop Te Kowhai to Te Rapa pipeline 3,400 2.95 192,541Hamilton Temple View 8.50 158,140 Cambridge lateral pipeline Loop Cambridge lateral 11,600 9.00 168,683Hamilton Te Kowhai 9.70 219,213 Cambridge lateral pipeline Loop Cambridge lateral 11,600 10.00 226,772Kiwitahi 1 7.30 41,298 Horotiu to Kuranui Rd pipeline Install compression downstream of Horotiu 12,200 9.15 53,425Waitoa 5.30 33,803 Horotiu to Kuranui Rd pipeline Install compression downstream of Horotiu 12,200 6.45 42,844Cambridge 2.35 16,368 Cambridge lateral pipeline Loop Cambridge lateral 11,600 2.85 22,431Horotiu 34.00 70,292 Cambridge lateral pipeline Loop Cambridge lateral 11,600 36.00 74,552Tatuanui DF 7.70 40,378 Horotiu to Kuranui Rd pipeline Install compression downstream of Horotiu 12,200 9.55 51,527
Note:Capital Cost estimates exclude the cost of upgrading the Intake or Offtake Points (if required) for the increased throughput.
SYSTEM PEAK WEEK: Week Ending 17 August 2008
INCREASE WITH INCREASE
NO CAPEX (Limit removed)
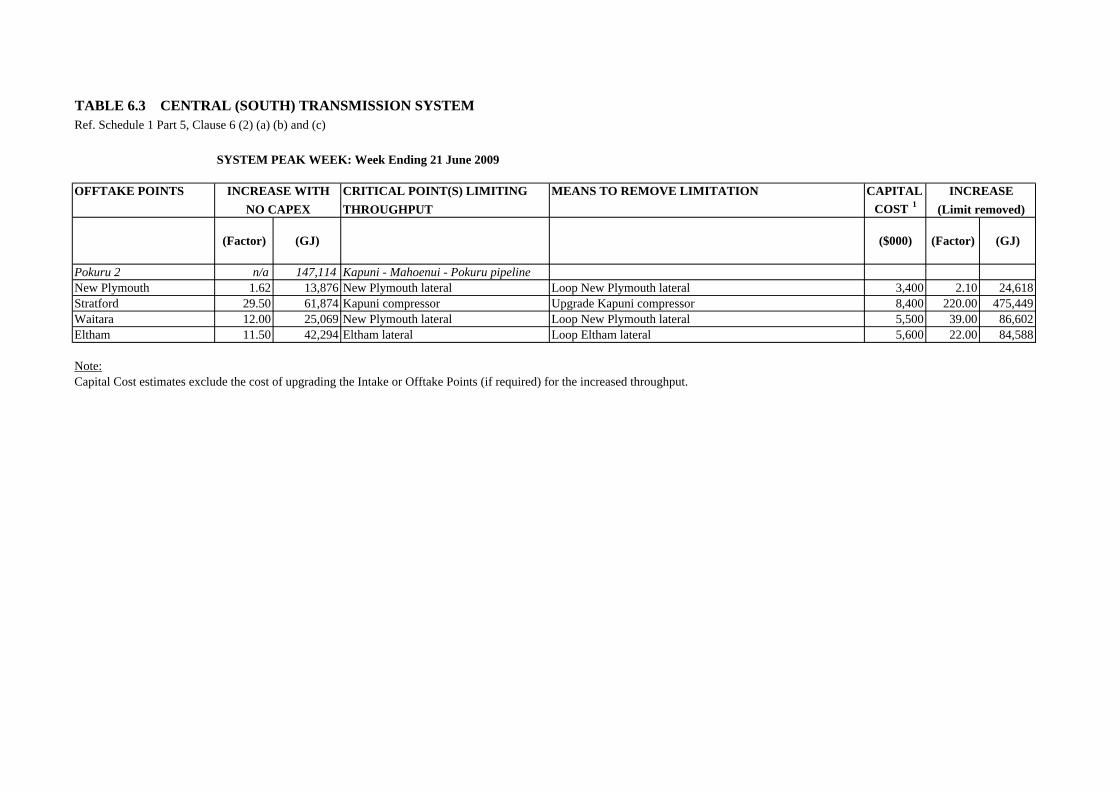
TABLE 6.3 CENTRAL (SOUTH) TRANSMISSION SYSTEMRef. Schedule 1 Part 5, Clause 6 (2) (a) (b) and (c)
OFFTAKE POINTS CRITICAL POINT(S) LIMITING MEANS TO REMOVE LIMITATION CAPITAL
THROUGHPUT COST 1
(Factor) (GJ) ($000) (Factor) (GJ)
Pokuru 2 n/a 147,114 Kapuni - Mahoenui - Pokuru pipelineNew Plymouth 1.62 13,876 New Plymouth lateral Loop New Plymouth lateral 3,400 2.10 24,618Stratford 29.50 61,874 Kapuni compressor Upgrade Kapuni compressor 8,400 220.00 475,449Waitara 12.00 25,069 New Plymouth lateral Loop New Plymouth lateral 5,500 39.00 86,602Eltham 11.50 42,294 Eltham lateral Loop Eltham lateral 5,600 22.00 84,588
Note:Capital Cost estimates exclude the cost of upgrading the Intake or Offtake Points (if required) for the increased throughput.
SYSTEM PEAK WEEK: Week Ending 21 June 2009
INCREASE WITH INCREASE
NO CAPEX (Limit removed)

TABLE 6.4 BAY OF PLENTY TRANSMISSION SYSTEMRef. Schedule 1 Part 5, Clause 6 (2) (a) (b) and (c)
OFFTAKE POINTS CRITICAL POINT(S) LIMITING MEANS TO REMOVE LIMITATION CAPITAL
THROUGHPUT COST 1
(Factor) (GJ) ($000) (Factor) (GJ)
Kinleith (mill) 1.47 34,841 Pokuru compression Upgrade Pokuru 16,500 4.50 258,164Edgecumbe DF 2.42 34,841 Pokuru compression Upgrade Pokuru 16,500 2.55 38,073Taupo 12.77 34,841 Pokuru compression Upgrade Pokuru 16,500 17.15 47,804Mt Maunganui 2.75 24,311 Pokuru compression Upgrade Pokuru 16,500 2.75 24,311Whakatane mill 3.80 22,459 Pokuru compression Upgrade Pokuru 16,500 3.80 22,459Whakatane 3.46 22,193 Pokuru compression Upgrade Pokuru 16,500 3.46 22,193Reporoa 3.49 34,841 Pokuru compression Upgrade Pokuru 16,500 5.35 60,861Rotorua 2.75 15,726 Rotorua lateral Loop Rotorua lateral and upgrade Pokuru 25,400 7.85 61,554Kawerau (Tasman mill) 3.80 34,841 Pokuru compression Upgrade Pokuru 16,500 10.80 121,755Kawerau (Caxton mill) 4.05 34,841 Pokuru compression Upgrade Pokuru 16,500 10.80 112,092Gisborne 4.20 17,626 Kawerau to Kiteratatahi pipeline + Pokuru compression Loop Gisborne and Upgrade Pokuru 16,500 4.80 20,930Tauranga 3.73 13,881 Tauranga lateral + Pokuru compression Loop Tauranga lateral and upgrade Pokuru 21,700 6.73 29,163Tirau DF 4.84 34,841 Pokuru compression Upgrade Pokuru 16,500 9.40 76,146Lichfield DF 3.86 34,841 Pokuru compression Upgrade Pokuru 16,500 15.22 173,214Putaruru 17.65 34,841 Pokuru compression Upgrade Pokuru 16,500 120.00 248,948Papamoa 10.00 22,410 Papamoa pipeline Loop Papamoa - Te puke 4,300 10.25 23,033
Notes:1. Capital Cost estimates exclude the cost of upgrading the Intake or Offtake Points (if required) for the increased throughput.2. The increased flow through some laterals would approach the limit of acceptable velocity. If the laterals were to be looped even larger increases would be possible, provided also that Pokuru compression was upgraded accordingly.
SYSTEM PEAK WEEK: Week Ending 14 September 2008
INCREASE WITH INCREASE
NO CAPEX (Limit removed)

TABLE 6.5 FRANKLEY RD TO KAPUNI TRANSMISSION SYSTEMRef. Schedule 1 Part 5, Clause 6 (2) (a) (b) and (c)
OFFTAKE POINTS CRITICAL POINT(S) LIMITING MEANS TO REMOVE LIMITATION CAPITALTHROUGHPUT COST 1
(Factor) (GJ) ($000) (Factor) (GJ)
Kapuni GTP 1.25 61,419 Pressure at Kapuni Build new compressor station at Frankley Rd 35,000 7.50 1,596,888Ammonia-Urea Plant 1.86 54,816 Pressure at Kapuni Build new compressor station at Frankley Rd 35,000 3.55 162,536TCC power station 1.28 105,389 Pressure at Kapuni Build new compressor station at Frankley Rd 35,000 5.30 1,618,473
Notes:1. Capital Cost estimates exclude the cost of upgrading the Intake or Offtake Points (if required) for the increased throughput.2. Additional throughput would be obtainable with larger compressors at Frankley Rd, ie the pipeline would not be the constraint with the increased throughput.
SYSTEM PEAK WEEK: Week Ending 7 July 2008
INCREASE WITH INCREASENO CAPEX (Limit removed)

TABLE 6.6 SOUTH TRANSMISSION SYSTEMRef. Schedule 1 Part 5, Clause 6 (2) (a) (b) and (c)
OFFTAKE POINTS CRITICAL POINT(S) LIMITING MEANS TO REMOVE LIMITATION CAPITAL
THROUGHPUT COST 1
(Factor) (GJ) ($000) (Factor) (GJ)
Tawa A+B 1.55 45,075 Kaitoke to Himatangi pipeline Upgrade Kaitoke cpr, loop from Kaitoke to Himatangi 40,900 2.45 118,835Belmont 1.96 45,755 Kaitoke to Himatangi pipeline Upgrade Kaitoke cpr, loop from Kaitoke to Himatangi 40,900 3.55 121,536Hastings 1.82 34,929 Kaitoke to Himatangi pipeline Upgrade Kaitoke cpr, loop from Kaitoke to Himatangi 40,900 2.58 67,303Palmerston North 1.30 10,026 Palmerston North lateral Upgrade Kaitoke cpr, link Palmerston Nth DP to 113 line 9,600 2.67 55,810Wanganui 4.50 63,036 Kapuni to Hawera (unlooped) pipeline Loop Kapuni to Hawera and upgrade Kapuni compressor 21,400 16.00 270,156Hawera 11.00 66,756 Kapuni to Hawera (unlooped) pipeline Loop Kapuni to Hawera and upgrade Kapuni compressor 21,400 43.00 280,374Levin 3.55 21,168 Levin lateral Upgrade Kaitoke cpr, loop Levin lateral 11,100 6.55 46,071Waitangirua 6.30 49,457 Kaitoke to Himatangi pipeline Upgrade Kaitoke cpr, loop from Kaitoke to Himatangi 41,000 12.25 104,980Feilding 3.50 14,003 Feilding lateral Upgrade Kaitoke cpr, loop Feilding lateral 12,900 7.85 38,367Longburn 6.25 30,336 Longburn lateral Upgrade Kaitoke cpr, loop Longburn lateral 11,900 7.85 39,581Okaiawa 6.22 34,482 Okaiawa Lateral Upgrade Kaitoke cpr, loop Okaiawa lateral 11,900 38.45 247,387Pahiatua 7.25 15,507 Pahiatua lateral Upgrade Kaitoke cpr, loop Pahiatua lateral 41,000 11.85 26,920Pauatahanui 1 24.45 53,204 Kaitoke to Himatangi pipeline Upgrade Kaitoke cpr, loop from Kaitoke to Himatangi 41,000 60.00 133,860Marton 9.25 34,087 Marton lateral Upgrade Kaitoke cpr, loop Marton lateral 19,200 17.15 66,728Paraparaumu 10.45 44,060 Kaitoke to Himatangi pipeline Upgrade Kaitoke cpr, loop from Kaitoke to Himatangi 19,200 28.25 127,053
Notes:1. Capital Cost estimates exclude the cost of upgrading the Intake or Offtake Points (if required) for the increased throughput.2. Gas injected from Mokoia was fixed in indentifying critical points of South system. The increased supply was assumed to be sourced from Kapuni. It would be necessay to reinforce the Frankley Rd System in some cases should the additional throughput be sourced from the Maui pipeline.3. Mokoia intake maximum assumed at 86330 GJ/week
SYSTEM PEAK WEEK: Week Ending 15 June 2009
INCREASE WITH INCREASE
NO CAPEX (Limit removed)

Vector Gas Limited Pipeline Capacity Disclosure 30 June 2009 page 13
7. METHODOLOGIES (Ref. Schedule 1 Part 5, Clause 7)
Intake Points (Ref. Clause 3) South System
The actual flow rates in the system peak week for Kapuni and Mokoia were not used in the modelling, instead a fixed pressures and flows replaced the load profiles of both. When determining the numerical factors for possible throughput increases with Kapuni as the Intake Point, the Kapuni supply pressure was fixed at 84barg, and the Mokoia flow intake was set at the maximum compressor capacity to maximise the throughput increase factor. When determining the numerical factors for possible throughput increases with Mokoia as the Intake Point, Mokoia supply pressure was fixed at 77barg, and the Kapuni flow rate was set at the maximum available compressor capacity. Available compressor capacity is the maximum compression capability less the gas load delivered to Central South at South system peak week. 77barg was the maximum possible pressure at Mokoia that would allow the flow from Kapuni while preventing the Kapuni supply pressure from exceeding 84barg.
Offtake Points (Ref. Clause 4) Information disclosed as required by Clause 4 (4) of the Regulations was determined as set out below.
Peak Week Dates (Ref. Clause 4 (4) (a)) For Systems
For all Offtake Points with metering incorporating electronic data storage capability (the vast majority) reports are available showing the daily throughput at each Offtake Point. For each transmission system a spreadsheet was compiled showing the daily throughput of all Offtake Points for the whole year. Aggregate daily and weekly throughputs were then calculated. In all cases, the system peak week was taken to be the week, ie 00:00 hours on Monday to 24:00 hours on Sunday, in which the aggregate offtake was greatest.
For Individual Offtake Points
The date of each Offtake Point’s individual peak week was obtained from the spreadsheets of daily throughput for each system referred to above.

Vector Gas Limited Pipeline Capacity Disclosure 30 June 2009 page 14
Peak Week Throughput (Ref. Clause 4 (4) (b))
For the System
In all cases, system peak week throughputs were obtained from the spreadsheets of daily throughput for each system referred to above.
For the Offtake Points Individual Offtake Point peak throughputs were obtained from the
spreadsheets of daily throughputs for each system referred to above.
Throughput Increase in System Peak Week
(Ref. Clause 4 (4) ( c ))
General Considerations
The numerical factor (theoretical multiplier) by which the throughput of each Offtake Point could have been increased in the system peak week was determined using Vector’s transient flow model (the "Model", as defined below). In accordance with the requirements of the Regulations this was done (i) assuming no capital investment to increase existing system capacity and (ii) no change in throughput at other Offtake Points on the system (iii) in addition there is no provision for operational headroom necessary to ensure reliability of supply.
Using data from SCADA/OATIS or metering as applicable, flow rates (in
standard m3/s) were calculated for each hour of the system peak week
for each Offtake Point. The data was assembled into "flow profiles" of the form required by the Model, then loaded into the model. (A hard copy of each flow profile is included in Appendix 1.)
For the few Offtake Points for which hourly data was not available
(those having metering without electronic data storage capability, ie generally sites with very small throughput) an average flow rate was calculated from meter readings and entered into the Model.
Each of the defined transmission systems was modelled separately.
The Model was first run with actual loads in the system peak week to generate appropriate starting conditions for subsequent simulations.
An Offtake Point was then selected and a multiplier applied to its flow
profile. This factor affected only the hourly flow rates for the chosen Offtake Point.
Each simulation was continued until it became evident either that the
increased load was unsustainable or conversely a larger factor could be applied. A new factor was selected and the simulation repeated. This process was continued until the maximum factor consistent with the
Vector Gas Limited Pipeline Capacity Disclosure 30 June 2009 page 15
relevant limiting criterion (see below) was identified.
The above process was applied in turn to each Offtake Points on the system with a throughput greater than 2,000 GJ in the system peak week.
The limiting criterion applied to determine whether the increased
throughput would have been achievable or not was whether the pipeline pressure at the most critical point of the system remained above the minimum acceptable value. For the Northland section of the North System, this was taken as 20 bar g; for other systems, 30 bar g. A lower pressure criterion would have resulted in only an insignificant increase in throughput. No account was taken of the rate of pressure decay to the minimum acceptable value or the “volatility” of the pressure at the critical point resulting from the increased throughput or other provision for operational headroom necessary to ensure reliability of supply.
Where the pressure drop in a lateral or section of pipeline was
observed to be exceptionally high given the increased throughput the maximum velocity of gas in the pipeline was checked. In some cases this constituted the limit on increased throughput.
Where compression at the Intake Point was not modelled (see below)
the maximum flow rate through the Intake Point during each simulation was noted. This was later checked against the known capacity of the existing compression to verify the adequacy of such compression.
The Model is set up to model only high pressure pipelines. Offtake
Points are not modelled. Attempting to simulate flow through the heater, regulators or control valves, piping and meter of each Offtake Point on the system would result in an unwarranted increase in complexity and simulation running time. As a consequence no account was taken of the ability of an existing Offtake Point to handle increased throughput. It was assumed that an Offtake Point could be upgraded if required. (This is a significant assumption in view of the possibility of additional land being required and/or more stringent operating restrictions being imposed by statutory authorities as a condition of any significant upgrade being permitted. Readers of this report should take note.)
Modelling was undertaken without regard to shippers’ current capacity
reservations or the probability of the increased capacity ever being required at any particular Offtake Point.
System Specific Considerations North System Capacity of the Rotowaro compressor station, Intake Point for the
North System, is directly proportional to the pressure available from the Maui pipeline. The Rotowaro compressor station comprises two gas turbine-driven centrifugal units plus two gas engine-driven 4-cylinder reciprocating units. These units are able to run with a suction pressure corresponding to the minimum contractual Maui delivery pressure, ie 30 bar g, and still achieve a discharge pressure equal to the maximum

Vector Gas Limited Pipeline Capacity Disclosure 30 June 2009 page 16
working pressure of the downstream pipelines (86 bar g).
For the sake of simplicity compression at Rotowaro was not modelled. Instead a fixed pressure of 84 bar g was assumed in all simulations. The peak throughput of the Rotowaro Intake Point was noted in each simulation. This was added to the peak throughput of the Central (North) System for which Rotowaro is also the Intake Point. The total peak Rotowaro throughput was compared to the capacity of the compression installed there to check that the latter would have been sufficient.
Additional criteria applied in the case of the North System were that
pipeline pressures at the Otahuhu B and Southdown Offtake Points be not less than 35 and 49 bar g, respectively, in order that contractual delivery pressure obligations could be met.
During the year, the Westfield offtake point discharge pressure is
adjusted . This resulted in redistribution of flow offtake amongst Westfield, Papakura, and Henderson offtake points. The availability of capacity at each offtake point in the North system was impacted in consequence.
In the system peak week, NZ Refinery Company was using gas.
However, because the supply to NZRC is interruptible, the refinery’s load was removed from the system while modelling other offtake points.
Central (North) System Rotowaro is the Intake Point for the Central (North) System. As noted
above, compression at Rotowaro was not modelled. A fixed pressure of 84 bar g at the Intake Point was assumed in all simulations.
Central (South) System
Installed compression at the Kapuni Gas Treatment Plant, Intake Point
for the Central (South) System, is adequate to meet current requirements but could limit pipeline capacity at flows above 560,000GJ/week. Therefore for simplicity compression at Kapuni was not modelled. A fixed pressure of 84 bar g at the Intake Point was assumed in all simulations albeit that available suction pressure may constrain the compressor discharge pressure/capacity.
The only existing “Offtake Point” north of New Plymouth is the
interconnection to the Bay of Plenty System, ie Pokuru. For simplicity compression at Mahoenui was not modelled. Instead a fixed pressure of 84 bar g was assumed and a flat load profile was assumed for the interconnection to BOP. The BOP flat load was calculated from the average value of Pokuru #2 flow load at the time of Central South system peak week.
The Pokuru Offtake incorporates piping connections to both the suction
side and the discharge side of the Pokuru compressors. Simulations to determine the maximum throughput were based on a suction-side connection. The principal criterion was then to deliver the throughput at sufficient pressure, ie 50 bar g, for a one of two Pokuru unit to be able to compress it into the BOP System.

Vector Gas Limited Pipeline Capacity Disclosure 30 June 2009 page 17
Bay of Plenty System For simplicity compression at Pokuru was not modelled but could limit
pipeline capacity at flows above 260,000GJ/week. A fixed pressure of 84 bar g at the system Intake Point was assumed in all simulations.
South System As noted in Central South above, installed compression capacity at the
Kapuni Gas Treatment Plant is adequate for current requirements but could limit pipeline capacity at flows above 560,000GJ/week. Therefore for simplicity compression at Kapuni was not modelled. A fixed pressure of 84 bar g at the Intake Point was assumed in all simulations albeit that available suction pressure may constrain compressor discharge pressure/capacity.
Mokoia’s maximum capacity was assumed at 86330GJ/week; therefore
some theoretical numerical factors have been reduced to prevent exceeding the compressors capacity.
In simulations of the existing system requiring compression at Kaitoke
the smaller (No.1) unit was modelled.
The discharge pressure set point at Kaitoke was 84 bar g. The No.1 unit was able to maintain this pressure during most simulations.
The Offtake Points that supply Wellington city are Tawa A (for
Powerco’s distribution network) and Tawa B (for Nova’s distribution network). However many years ago the South transmission system was reconfigured to end at Waitangirua, some 7.7 km north of Tawa. Since then the section of the original (200 mm) transmission pipeline from Waitangirua to Tawa has operated at a nominal pressure of 19bar. Factors for Tawa A and B, respectively, therefore technically apply at Waitangirua.
Frankley Rd to Kapuni System A fixed pressure of 44 bar g was assumed to be available from the
Maui pipeline at the Frankley Rd Intake Point. This pressure is typical of pressure available from the Maui line however, the Maui pipeline owner may not be obliged to deliver gas from the Maui pipeline at more than 30 bar g. Compression at Derby Rd was not required at any time during the year. Currently Derby Rd compressor station is not operational and will require significant work to enable it to be brought back to service.
An addition criterion in all simulations was to maintain a minimum
delivery pressure of 41 bar g to the Kapuni Gas Treatment Plant.

Vector Gas Limited Pipeline Capacity Disclosure 30 June 2009 page 18
Further Disclosure Relating to Transmission Systems (Ref. Clause 5)
Throughputs for Offtake Points with a throughput less than 2,000 GJ in the system peak week were determined in the same way as those for Offtake Points with throughputs greater than 2,000 GJ. (See above.)
Critical Points of Transmission Systems
(Ref. Clause 6 (2))
During modelling pursuant to Clause 4 (4) (c) of the Regulations the
critical point or section of each system constraining further increases in throughput at each Offtake Point was noted.
For each Offtake Point in turn system a reinforcement option was
selected capable of removing the constraint. The appropriate Model files were then amended accordingly.
For each Offtake Point in turn further simulations were carried out to
determine the increased throughput deliverable from the reinforced system. Essentially the same methodology as described earlier (see “Throughput Increase in System Peak Week (Ref. Clause 4 (4) ( c ))” above) was followed.
In all simulations a fixed pressure was modelled at the Rotowaro,
Pokuru, and Kapuni Intake Points, respectively. The throughput displayed by the Model for each of these Intake Points was noted. In the case of Rotowaro the existing flow into the Central (North) System was added to the increased flow into the North System. In the case of Kapuni the existing flow into the Central (South) System was added to the increased flow into the South System. Additional compression requirements (if any) were then calculated from the flow, suction and discharge pressure.
Where additional compression along the pipeline was considered to be
a suitable means of removing a constraint, for example as at Henderson and Horotiu, a compressor “module” available within the Model was used in simulations. The compressor throughput, suction and discharge conditions were noted and used to select and cost suitable compression later on.
Estimates of the cost to remove the constraint affecting each Offtake
Point contained in Tables 6.1 to 6.6 were developed using historic average construction rates for pipelines and other facilities. Please note: on no account does Vector wish to imply that the means of increasing system capacity identified in these tables would necessarily be the optimum, taking into account the requirements of the system as a whole, or that Vector would necessarily employ such means. The costs are “order of magnitude” only; Vector does not warrant their accuracy.

Vector Gas Limited Pipeline Capacity Disclosure 30 June 2009 page 19
No account was taken of RMA-related issues in identifying means to remove constraints on the transmission system. Vector does not have any special rights of access to private land for the purposes of constructing new pipelines and related facilities.
Values for the numerical factor by which the throughput of each
Offtake Point could have been increased are set out in Tables 6.1 to 6.6 respectively, were in all cases determined through further modelling.
Transient Flow (Capacity Simulation) Model
(Ref. Clause 7 (2))
Modelling of pipeline systems undertaken pursuant to this disclosure was carried out using Stoner Pipeline Simulator (SPS) software, version 9.30 and 9.5, written by Stoner Associates of the USA. The SPS was installed on a PC. Vector has only a single user licence.
A hard copy of the input data (a flow profile for each Offtake Point) is provided in Appendix 1 of this disclosure. This data will be provided on request in Microsoft Excel spreadsheet format.

Vector Gas Limited Pipeline Capacity Disclosure 30 June 2009 page 20
8. GAS (CAPACITY) RESERVED IN TRANSMISSION SYSTEMS (Ref. Schedule 1 Part 5, Clause 8) Tables 8.1 to 8.6, respectively, show the following information in relation to Intake and Offtake Points on each pipeline for the first, third and fifth financial years after the financial year to which this report refers. The data has been extracted from OATIS and relevant contracts.
Aggregate capacity reserved (GJ of MDQ) at each Offtake Point by Vector-owned, and non-Vector companies, respectively.
The allowable aggregate MHQ at each Offtake Point for both Vector-
owned and non-Vector companies. (NB: In most cases MHQ = MDQ ÷ 16, in accordance with the ‘Vector Transmission Code’.)
Delivery pressures, where non-standard.
Vector’s financial year ends on 30th June annually. Vector’s contract year (for transmission services) however ends on 30th September annually. The tables include shippers’ capacity reserved under Vector’s transmission services agreements and Supplementary Agreements plus transmission capacity made available to shippers under non-VTC contracts.
Shippers reserve capacity under transmission services agreements annually prior to the start of the contract year. Thereafter they may transfer capacity between Offtake Points, and/or trade capacity with other shippers for periods as short as one day, subject to certain conditions set out in the ‘Vector Transmission Code’. Shippers may also purchase additional capacity from Vector (or other shippers) during a contract year also subject to the provisions of the ‘Vector Transmission Code’. Shippers are under no obligation to reserve the same level of capacity in subsequent years.
As at the date of this report shippers have not confirmed their capacity requirements for the 2009-2010 contract year. Shippers’ capacity reservations for the financial year to 30 June 2010 have therefore been taken as their actual reserved capacity as at the end of June 2009.
As it is not known what capacity shippers will reserve in future, these same reservations have been assumed for the years ending 30 June 2012 and 2014, respectively.
The transmission capacity available under Supplementary Agreements and non-VTC contracts has been assumed to continue.

TABLE 8.1 NORTH TRANSMISSION SYSTEM CAPACITY RESERVATIONSRef. Schedule 1 Part 5, Clause 8 (2)
INTAKE OFFTAKE POINTS NON-STDPOINT DELIVERY
Vector Others Vector Others Vector Others PRESSURERotowaro Over 2,000 GJ per week bar g
Drury 1 MDQ 200 57 200 57 200 57MHQ 13 4 13 4 13 4
Drury 2 MDQ 500 105 500 105 500 105MHQ 31 7 31 7 31 7
Flat Bush MDQ 0 1,774 0 1,774 0 1,774MHQ 0 111 0 111 0 111
Glenbrook MDQ 6,439 0 6,439 0 6,439 0
MHQ 322 0 322 0 322 0
Harrisville MDQ 1,927 0 1,927 0 1,927 0
MHQ 120 0 120 0 120 0
Hunua MDQ 150 476 150 476 150 476
MHQ 9 30 9 30 9 30
Otahuhu B power station MDQ 0 66,000 0 66,000 0 66,000 31-36
MHQ 0 3,300 0 3,300 0 3,300
Southdown power station MDQ 0 39,240 0 39,240 0 39,240 49
MHQ 0 1,784 0 1,784 0 1,784
Tuakau MDQ 200 618 200 618 200 618MHQ 13 39 13 39 13 39
Warkworth MDQ 1,568 81 1,568 81 1,568 81
MHQ 98 5 98 5 98 5
Greater Auckland MDQ 15,668 33,303 15,668 33,303 15,668 33,303
MHQ 979 2,081 979 2,081 979 2,081
Waitoki MDQ 0 342 0 342 0 342MHQ 0 21 0 21 0 21
Whangarei MDQ 199 720 199 720 199 720MHQ 12 45 12 45 12 45
Kauri DF & Maungaturoto DF MDQ 2,500 0 2,500 0 2,500 0MHQ 125 0 125 0 125 0
TOTAL MDQ 29,350 142,716 29,350 142,716 29,350 142,716MHQ 1,723 7,426 1,723 7,426 1,723 7,426
3 Under 2,000 GJ per week MDQ 400 444 400 444 400 444MHQ 25 28 25 28 25 28
Notes:1 Firm transmission capacity only: interruptible capacity excluded2 Hunua includes Hunua (Nova)3 Includes Alfriston, Kingseat, Marsden 2, Oakleigh, Papakura 3, Pukekohe, Ramarama & Wellsford
- all numbers are GJ -
y/e 30 June 2012 y/e 30 June 2014CAPACITY RESERVED For:
y/e 30 June 2010
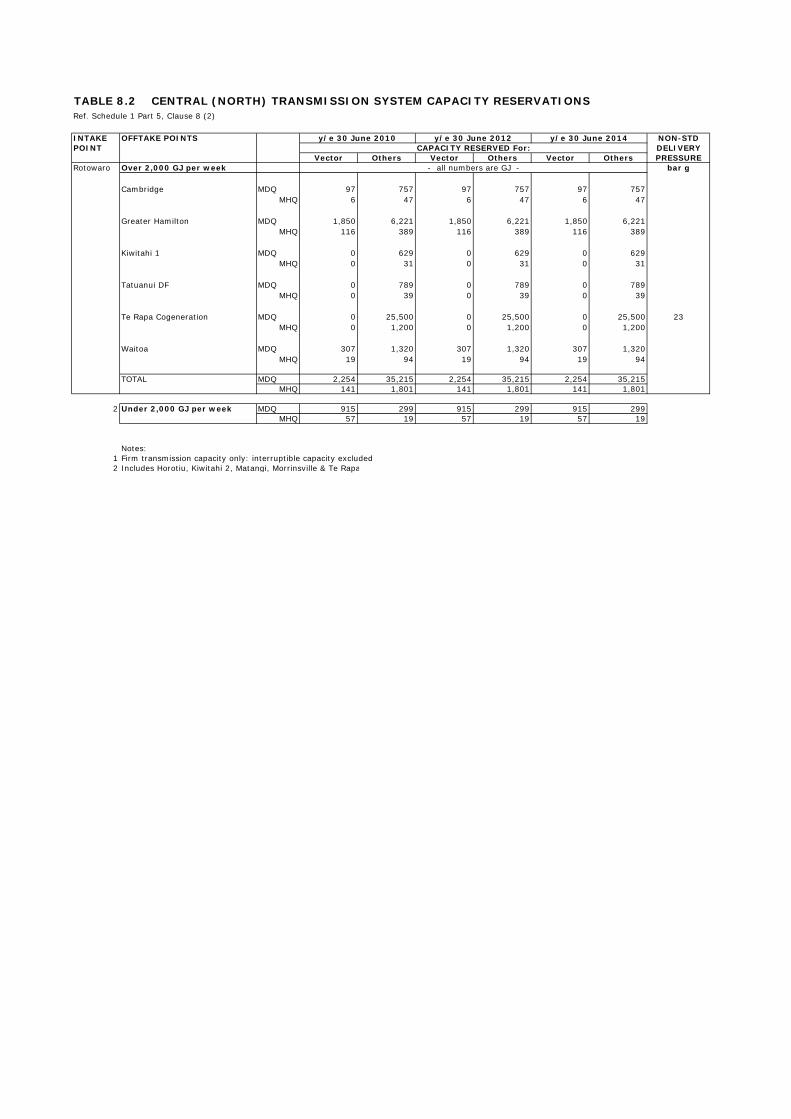
TABLE 8.2 CENTRAL (NORTH) TRANSMISSION SYSTEM CAPACITY RESERVATIONSRef. Schedule 1 Part 5, Clause 8 (2)
INTAKE OFFTAKE POINTS NON-STDPOINT DELIVERY
Vector Others Vector Others Vector Others PRESSURERotowaro Over 2,000 GJ per week bar g
Cambridge MDQ 97 757 97 757 97 757MHQ 6 47 6 47 6 47
Greater Hamilton MDQ 1,850 6,221 1,850 6,221 1,850 6,221MHQ 116 389 116 389 116 389
Kiwitahi 1 MDQ 0 629 0 629 0 629MHQ 0 31 0 31 0 31
Tatuanui DF MDQ 0 789 0 789 0 789MHQ 0 39 0 39 0 39
Te Rapa Cogeneration MDQ 0 25,500 0 25,500 0 25,500 23MHQ 0 1,200 0 1,200 0 1,200
Waitoa MDQ 307 1,320 307 1,320 307 1,320MHQ 19 94 19 94 19 94
TOTAL MDQ 2,254 35,215 2,254 35,215 2,254 35,215MHQ 141 1,801 141 1,801 141 1,801
2 Under 2,000 GJ per week MDQ 915 299 915 299 915 299MHQ 57 19 57 19 57 19
Notes:1 Firm transmission capacity only: interruptible capacity excluded2 Includes Horotiu, Kiwitahi 2, Matangi, Morrinsville & Te Rapa
- all numbers are GJ -
y/e 30 June 2010 y/e 30 June 2012 y/e 30 June 2014CAPACITY RESERVED For:

TABLE 8.3 CENTRAL (SOUTH) TRANSMISSION SYSTEM CAPACITY RESERVATIONSRef. Schedule 1 Part 5, Clause 8 (2)
INTAKE OFFTAKE POINTS NON-STDPOINT DELIVERY
Vector Others Vector Others Vector Others PRESSUREKapuni Over 2,000 GJ per week bar g
Eltham MDQ 255 452 255 452 255 452
MHQ 16 28 16 28 16 28
New Plymouth MDQ 955 2,353 955 2,353 955 2,353
MHQ 60 147 60 147 60 147
2 Stratford MDQ 0 348 0 348 0 348
MHQ 0 22 0 22 0 22
Waitara MDQ 95 320 95 320 95 320
MHQ 6 20 6 20 6 20
Pokuru 2 MDQ 12,000 0 12,000 0 12,000 0
MHQ 500 0 500 0 500 0
TOTAL MDQ 13,305 3,473 13,305 3,473 13,305 3,473MHQ 582 217 582 217 582 217
3 Under 2,000 GJ per week MDQ 5 172 5 172 5 172MHQ 0 11 0 11 0 11
Notes:1 Firm transmission capacity only: interruptible capacity excluded2 Stratford refers to the town / distribution network3 Includes Inglewood & Kaponga
- all numbers are in GJ -
y/e 30 June 2010 y/e 30 June 2012 y/e 30 June 2014CAPACITY RESERVED For:

TABLE 8.4 BAY of PLENTY TRANSMISSION SYSTEM CAPACITY RESERVATIONSRef. Schedule 1 Part 5, Clause 8 (2)
INTAKE OFFTAKE POINTS NON-STDPOINT DELIVERY
Vector Others Vector Others Vector Others PRESSUREPokuru Over 2,000 GJ per week bar g
Edgecumbe DF MDQ 0 4,725 0 4,725 0 4,725MHQ 0 236 0 236 0 236
Gisborne MDQ 2,358 1,034 2,358 1,034 2,358 1,034MHQ 134 65 134 65 134 65
Kawerau (Caxton mill) MDQ 1,880 0 1,880 0 1,880 0MHQ 94 0 94 0 94 0
Kawerau (Tasman mill) MDQ 1,740 0 1,740 0 1,740 0MHQ 87 0 87 0 87 0
Kinleith (mill) MDQ 12,360 0 12,360 0 12,360 0MHQ 773 0 773 0 773 0
Lichfield DF MDQ 0 33 0 33 0 33MHQ 0 2 0 2 0 2
2 Greater Mt Maunganui MDQ 1,216 2,778 1,216 2,778 1,216 2,778MHQ 76 178 76 178 76 178
Reporoa MDQ 0 680 0 680 0 680MHQ 0 34 0 34 0 34
Rotorua MDQ 366 1,552 366 1,552 366 1,552MHQ 23 97 23 97 23 97
3 Greater Tauranga MDQ 227 951 227 951 227 951MHQ 14 59 14 59 14 59
Tirau DF MDQ 0 90 0 90 0 90MHQ 0 6 0 6 0 6
Whakatane MDQ 2,388 131 2,388 131 2,388 131MHQ 149 8 149 8 149 8
TOTAL MDQ 22,535 11,974 22,535 11,974 22,535 11,974MHQ 1,349 685 1,349 685 1,349 685
4 Under 2,000 GJ per week MDQ 3,028 1,715 3,028 1,715 3,028 1,715MHQ 170 107 170 107 170 107
Notes:1 Firm transmission capacity only: interruptible capacity excluded2 Includes Mt Maunganui & Papamoa3 Includes Pyes Pa & Tauranga4 Includes Broadlands, Edgecumbe, Kawerau, Kihikihi, Kinleith, Okoroire Springs, Opotiki, Putaruru, Rangiuru, Taupo, Te Puke,
Te Toko, Tirau, Tokoroa & Waikeria
- all numbers are in GJ -
y/e 30 June 2010 y/e 30 June 2012 y/e 30 June 2014CAPACITY RESERVED For:

TABLE 8.5 FRANKLEY RD TRANSMISSION SYSTEM CAPACITY RESERVATIONSRef. Schedule 1 Part 5, Clause 8 (2)
INTAKE OFFTAKE POINTS NON-STDPOINT DELIVERY
Vector Others Vector Others Vector Others PRESSUREFrankley Rd & Kupe Over 2,000 GJ per week bar g
TCC power station MDQ 0 64,000 0 64,000 0 64,000 31MHQ 0 2,827 0 2,827 0 2,827
Kapuni GTP MDQ 0 26,713 0 26,713 0 26,713 42MHQ 0 1,336 0 1,336 0 1,336
2 Ammonia-Urea Plant MDQ 0 22,500 0 22,500 0 22,500MHQ 0 1,010 0 1,010 0 1,010
TOTAL MDQ 0 113,213 0 113,213 0 113,213MHQ 0 5,173 0 5,173 0 5,173
3 Under 2,000 GJ per week MDQ 0 208 0 208 0 208MHQ 0 13 0 13 0 13
Notes:1 Firm transmission capacity only: interruptible capacity excluded2 Includes Ballance 8201 & Ballance 96263 Includes Kapuni (Lactose et al)
- all numbers are in GJ -
y/e 30 June 2010 y/e 30 June 2012 y/e 30 June 2014CAPACITY RESERVED For:

TABLE 8.6 SOUTH TRANSMISSION SYSTEM CAPACITY RESERVATIONSRef. Schedule 1 Part 5, Clause 8 (2)
INTAKE OFFTAKE POINTS NON-STDPOINT DELIVERY
Vector Others Vector Others Vector Others PRESSURE
Kapuni & Mokoia
Over 2,000 GJ per week bar g
Belmont MDQ 580 8,044 580 8,044 580 8,044MHQ 36 503 36 503 36 503
Feilding MDQ 840 1,076 840 1,076 840 1,076MHQ 53 67 53 67 53 67
2 Hastings MDQ 4,520 5,318 4,520 5,318 4,520 5,318MHQ 283 332 283 332 283 332
3 Hawera MDQ 0 1,666 0 1,666 0 1,666MHQ 0 104 0 104 0 104
Levin MDQ 438 1,288 438 1,288 438 1,288MHQ 27 80 27 80 27 80
Longburn MDQ 50 865 50 865 50 865MHQ 3 43 3 43 3 43
Marton MDQ 720 310 720 310 720 310MHQ 45 19 45 19 45 19
Okaiawa MDQ 0 1,680 0 1,680 0 1,680MHQ 0 70 0 70 0 70
Palmerston North MDQ 810 4,953 810 4,953 810 4,953MHQ 51 310 51 310 51 310
Paraparaumu MDQ 35 593 35 593 35 593MHQ 2 37 2 37 2 37
Tawa A+B MDQ 795 13,047 795 13,047 795 13,047MHQ 50 815 50 815 50 815
Waikanae MDQ 0 206 0 206 0 206MHQ 0 13 0 13 0 13
4 Greater Waitangirua MDQ 170 1,179 170 1,179 170 1,179MHQ 11 74 11 74 11 74
Wanganui MDQ 690 2,794 690 2,794 690 2,794MHQ 43 175 43 175 43 175
TOTAL MDQ 9,649 43,019 9,649 43,019 9,649 43,019MHQ 602 2,643 602 2,643 602 2,643
5 Under 2,000 GJ per week MDQ 539 2,779 539 2,779 539 2,779MHQ 34 167 34 167 34 167
Notes:1 Firm transmission capacity only: interruptible capacity excluded2 Hastings includes Hastings (Nova)3 Hawera includes Hawera (Nova)4 Includes Waitangirua & Pauatahanui 15 Includes Ashhurst, Dannevirke, Flockhouse, Foxton, Kairanga, Kaitoke, Kakariki, Kuku, Lake Alice, Manaia, Managaroa,
Mangatainoka, Matapu, Oroua Downs, Otaki, Paekakariki, Pahiatua, Patea, Pauatahanui 2, Takapau, Te Horo, Waitotara,Waverley
- all numbers are in GJ -
y/e 30 June 2010 y/e 30 June 2012 y/e 30 June 2014CAPACITY RESERVED For:
Vector Gas Limited Pipeline Capacity Disclosure 30 June 2009 page 21
APPENDIX 1
FLOW PROFILES Note: Associated with the flow profile for each Offtake Point is the weekly load in
TJ. These weekly loads are for checking purposes only and are not used in the Model. They were calculated by multiplying the hourly flow rates by a typical average CV. The resulting values may therefore differ somewhat from those shown in Tables 4.1 – 4.6, which were determined using daily average CV’s. Rounding of flow rates to two decimal places may also have contributed slight differences.

X DELIVERY POINT ALFRISTONX CODERAMP ALFEXT.V1 = 0.0375+ 0.03 0.04 0.04 0.04 0.03 0.04 0.03 0.04 0.03 0.01 0.00 0.00+ 0.00 0.00 0.00 0.00 0.01 0.02 0.03 0.03 0.03 0.05 0.04 0.04+ 0.04 0.04 0.04 0.04 0.04 0.04 0.04 0.04 0.04 0.02 0.00 0.00+ 0.01 0.00 0.01 0.00 0.01 0.03 0.04 0.04 0.04 0.04 0.04 0.04+ 0.04 0.04 0.04 0.04 0.04 0.04 0.04 0.04 0.04 0.01 0.00 0.00+ 0.00 0.00 0.00 0.00 0.01 0.02 0.04 0.04 0.04 0.04 0.04 0.04+ 0.04 0.04 0.04 0.04 0.04 0.04 0.04 0.04 0.04 0.01 0.00 0.00+ 0.00 0.00 0.00 0.00 0.00 0.02 0.02 0.02 0.02 0.02 0.02 0.02+ 0.02 0.02 0.02 0.02 0.03 0.02 0.02 0.01 0.01 0.00 0.00 0.00+ 0.00 0.00 0.00 0.00 0.01 0.01 0.01 0.01 0.01 0.01 0.01 0.01+ 0.01 0.01 0.01 0.01 0.01 0.01 0.01 0.01 0.01 0.00 0.00 0.00+ 0.00 0.00 0.00 0.00 0.00 0.01 0.01 0.01 0.01 0.02 0.02 0.03+ 0.02 0.03 0.03 0.03 0.03 0.03 0.03 0.03 0.02 0.00 0.00 0.00+ 0.00 0.00 0.00 0.00 0.00 0.01 0.02 0.03 0.03 0.03 0.03 0.00+ TIME= WEEK+ MULT= 1.00+ ADD = 0.00X Weekly Load TJ = 0.51X Each figure represents average hourly flow rate in std. m3/sX Profile date = 7 JULY 2008 - 13 JULY 2008X ==========================================================X DELIVERY POINT BRUCE MCLARENX CODERAMP BMCEXT.V1= 0.1925+ 0.17 0.16 0.18 0.20 0.22 0.25 0.36 0.43 0.45 0.45 0.43 0.41+ 0.38 0.36 0.34 0.34 0.36 0.35 0.34 0.32 0.32 0.30 0.28 0.27+ 0.24 0.23 0.24 0.25 0.24 0.30 0.37 0.44 0.50 0.46 0.41 0.40+ 0.37 0.38 0.37 0.34 0.39 0.49 0.37 0.35 0.34 0.32 0.30 0.27+ 0.25 0.24 0.25 0.26 0.28 0.33 0.44 0.50 0.54 0.50 0.44 0.45+ 0.40 0.41 0.38 0.34 0.29 0.31 0.36 0.35 0.34 0.34 0.30 0.28+ 0.26 0.26 0.25 0.28 0.28 0.34 0.43 0.50 0.54 0.52 0.45 0.44+ 0.42 0.38 0.34 0.31 0.29 0.29 0.30 0.29 0.27 0.24 0.22 0.19+ 0.17 0.16 0.15 0.18 0.18 0.22 0.32 0.36 0.40 0.39 0.39 0.40+ 0.39 0.34 0.32 0.32 0.31 0.30 0.29 0.25 0.24 0.22 0.20 0.16+ 0.15 0.14 0.12 0.12 0.12 0.15 0.17 0.20 0.23 0.23 0.25 0.25+ 0.25 0.23 0.23 0.23 0.23 0.24 0.24 0.21 0.20 0.19 0.17 0.15+ 0.14 0.15 0.15 0.13 0.15 0.16 0.18 0.21 0.25 0.22 0.22 0.23+ 0.20 0.18 0.18 0.19 0.19 0.21 0.24 0.22 0.22 0.21 0.21 0.13+ TIME= WEEK+ MULT= 1+ ADD = 0X Weekly Load TJ = 7.226982X Each figure represents average hourly flow rate in std. m3/sX Profile date = 7 JULY 2008 - 13 JULY 2008X ==========================================================X DELIVERY POINT DRURYX CODERAMP DRUEXT.V1= 0.416944+ 0.41 0.43 0.46 0.45 0.45 0.44 0.42 0.40 0.34 0.17 0.13 0.14+ 0.15 0.15 0.15 0.17 0.19 0.12 0.13 0.13 0.25 0.34 0.34 0.35+ 0.37 0.38 0.41 0.41 0.42 0.42 0.43 0.43 0.33 0.17 0.15 0.14+ 0.14 0.14 0.15 0.14 0.19 0.24 0.19 0.20 0.22 0.34 0.37 0.38+ 0.38 0.39 0.42 0.43 0.45 0.44 0.45 0.42 0.29 0.11 0.13 0.14+ 0.14 0.14 0.16 0.12 0.11 0.21 0.22 0.21 0.37 0.38 0.37 0.42+ 0.43 0.45 0.46 0.49 0.46 0.46 0.43 0.45 0.33 0.16 0.13 0.13+ 0.16 0.16 0.17 0.20 0.17 0.15 0.12 0.08 0.10 0.11 0.15 0.26+ 0.27 0.23 0.26 0.24 0.23 0.23 0.18 0.21 0.22 0.15 0.16 0.15+ 0.16 0.15 0.19 0.21 0.21 0.09 0.07 0.06 0.08 0.08 0.15 0.19+ 0.19 0.15 0.17 0.19 0.17 0.16 0.18 0.16 0.17 0.14 0.14 0.17+ 0.15 0.13 0.10 0.15 0.13 0.06 0.07 0.05 0.09 0.07 0.17 0.22+ 0.17 0.25 0.28 0.28 0.27 0.27 0.34 0.29 0.20 0.12 0.11 0.11+ 0.11 0.11 0.11 0.11 0.11 0.11 0.16 0.17 0.16 0.23 0.32 0.00+ TIME= WEEK+ MULT= 1+ ADD = 0X Weekly Load TJ = 5.769193X Each figure represents average hourly flow rate in std. m3/sX Profile date = 7 JULY 2008 - 13 JULY 2008X ==========================================================

X DELIVERY POINT FLAT BUSHX CODERAMP FBUEXT.V1= 0.198889+ 0.20 0.25 0.23 0.23 0.23 0.34 0.40 0.41 0.46 0.50 0.55 0.52+ 0.52 0.51 0.55 0.57 0.52 0.51 0.47 0.47 0.47 0.45 0.46 0.41+ 0.36 0.38 0.38 0.38 0.36 0.38 0.49 0.58 0.62 0.62 0.58 0.59+ 0.58 0.59 0.55 0.55 0.49 0.46 0.46 0.46 0.44 0.47 0.44 0.43+ 0.40 0.39 0.39 0.42 0.38 0.42 0.50 0.59 0.66 0.61 0.59 0.58+ 0.57 0.63 0.59 0.61 0.54 0.53 0.47 0.49 0.49 0.46 0.48 0.43+ 0.39 0.41 0.39 0.41 0.36 0.43 0.41 0.55 0.65 0.62 0.62 0.60+ 0.59 0.60 0.61 0.57 0.52 0.48 0.46 0.43 0.40 0.43 0.42 0.38+ 0.40 0.37 0.36 0.40 0.35 0.40 0.50 0.54 0.57 0.57 0.58 0.54+ 0.59 0.59 0.54 0.53 0.50 0.46 0.45 0.47 0.43 0.35 0.33 0.34+ 0.34 0.33 0.30 0.22 0.24 0.24 0.28 0.28 0.31 0.32 0.29 0.30+ 0.29 0.21 0.19 0.16 0.16 0.14 0.15 0.14 0.12 0.14 0.12 0.14+ 0.11 0.13 0.13 0.11 0.14 0.12 0.13 0.14 0.14 0.14 0.12 0.15+ 0.13 0.13 0.15 0.15 0.15 0.14 0.13 0.17 0.14 0.16 0.16 0.08+ TIME= WEEK+ MULT= 1+ ADD = 0X Weekly Load TJ = 9.745927X Each figure represents average hourly flow rate in std. m3/sX Profile date = 7 JULY 2008 - 13 JULY 2008X ==========================================================X DELIVERY POINT GLEN BROOKX CODERAMP GLNEXT.V1= 1.791944+ 1.86 2.00 1.98 2.00 2.02 2.05 2.17 2.00 2.01 1.97 1.85 1.82+ 1.91 1.88 2.07 2.08 2.10 2.17 2.13 1.95 1.77 1.74 1.75 1.93+ 1.77 1.91 2.07 2.25 2.11 2.05 2.05 2.02 2.16 2.18 2.20 1.98+ 1.96 1.89 2.00 1.97 1.84 1.91 2.17 2.16 2.07 2.02 2.34 2.53+ 2.44 2.18 2.12 2.14 2.02 2.00 1.77 1.63 1.75 1.83 1.76 1.86+ 2.41 2.71 2.64 2.11 2.37 2.35 2.26 2.68 2.65 2.79 2.21 2.66+ 3.21 2.59 3.16 2.60 2.14 2.00 2.07 2.21 2.67 3.28 2.51 2.23+ 2.63 2.65 2.99 2.29 2.00 1.91 2.00 1.86 1.75 1.75 1.82 1.86+ 1.98 2.55 2.37 2.10 2.21 2.28 2.49 2.46 2.58 2.69 2.77 2.65+ 2.42 2.35 2.07 2.14 2.44 2.40 2.55 2.70 2.35 2.56 2.72 2.48+ 2.14 2.00 2.16 2.23 1.72 1.70 2.09 1.88 2.00 1.93 1.30 1.29+ 1.51 1.91 1.89 1.70 1.79 1.32 0.67 0.58 0.60 0.62 0.76 0.67+ 0.60 0.59 0.60 0.76 0.81 0.74 0.65 0.76 0.95 1.02 0.88 0.74+ 0.76 0.88 0.86 1.00 1.23 1.93 2.07 2.02 1.86 1.77 1.88 2.97+ TIME= WEEK+ MULT= 1+ ADD = 0X Weekly Load TJ = 49.0795X Each figure represents average hourly flow rate in std. m3/sX Profile date = 7 JULY 2008 - 13 JULY 2008X ==========================================================X DELIVERY POINT HARRISVILLEX CODERAMP HAREXT.V1= 0.705278+ 0.69 0.78 0.77 0.70 0.68 0.62 0.65 0.80 0.72 0.64 0.70 0.68+ 0.58 0.59 0.58 0.54 0.35 0.11 0.10 0.10 0.13 0.34 0.45 0.71+ 0.68 0.70 0.78 0.82 0.84 0.83 0.83 0.83 0.77 0.67 0.67 0.67+ 0.62 0.59 0.56 0.50 0.28 0.12 0.11 0.12 0.26 0.38 0.61 0.69+ 0.68 0.76 0.79 0.73 0.85 0.86 0.84 0.83 0.71 0.63 0.61 0.59+ 0.49 0.55 0.56 0.50 0.28 0.29 0.34 0.20 0.38 0.28 0.41 0.55+ 0.64 0.66 0.76 0.79 0.84 0.82 0.84 0.85 0.68 0.65 0.69 0.65+ 0.59 0.54 0.54 0.48 0.29 0.26 0.18 0.15 0.19 0.28 0.35 0.37+ 0.36 0.32 0.22 0.21 0.21 0.35 0.31 0.49 0.71 0.60 0.71 0.66+ 0.60 0.57 0.54 0.46 0.33 0.16 0.16 0.15 0.20 0.28 0.32 0.31+ 0.30 0.29 0.23 0.22 0.26 0.29 0.32 0.38 0.68 0.68 0.65 0.60+ 0.61 0.60 0.56 0.46 0.29 0.15 0.16 0.17 0.19 0.20 0.32 0.33+ 0.35 0.53 0.45 0.32 0.37 0.40 0.48 0.57 0.54 0.62 0.66 0.60+ 0.57 0.47 0.46 0.41 0.21 0.17 0.18 0.21 0.27 0.33 0.41 0.20+ TIME= WEEK+ MULT= 1+ ADD = 0X Weekly Load TJ = 12.213X Each figure represents average hourly flow rate in std. m3/sX Profile date = 7 JULY 2008 - 13 JULY 2008X ==========================================================
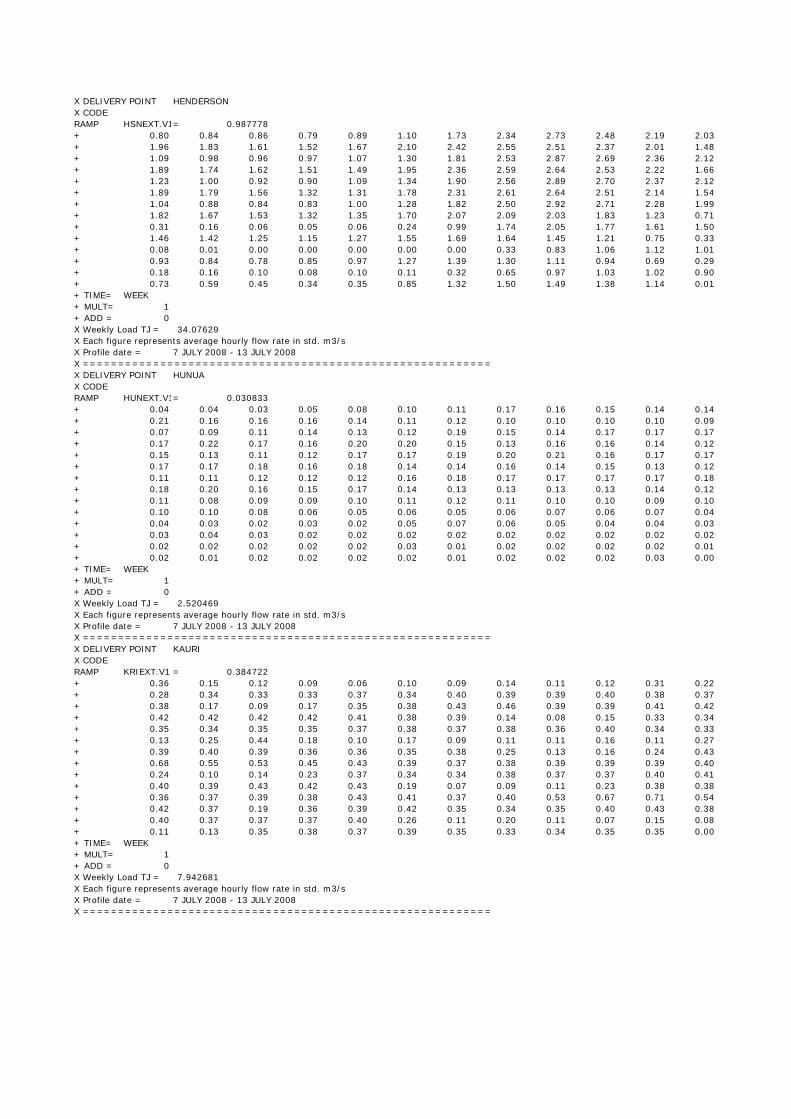
X DELIVERY POINT HENDERSONX CODERAMP HSNEXT.V1= 0.987778+ 0.80 0.84 0.86 0.79 0.89 1.10 1.73 2.34 2.73 2.48 2.19 2.03+ 1.96 1.83 1.61 1.52 1.67 2.10 2.42 2.55 2.51 2.37 2.01 1.48+ 1.09 0.98 0.96 0.97 1.07 1.30 1.81 2.53 2.87 2.69 2.36 2.12+ 1.89 1.74 1.62 1.51 1.49 1.95 2.36 2.59 2.64 2.53 2.22 1.66+ 1.23 1.00 0.92 0.90 1.09 1.34 1.90 2.56 2.89 2.70 2.37 2.12+ 1.89 1.79 1.56 1.32 1.31 1.78 2.31 2.61 2.64 2.51 2.14 1.54+ 1.04 0.88 0.84 0.83 1.00 1.28 1.82 2.50 2.92 2.71 2.28 1.99+ 1.82 1.67 1.53 1.32 1.35 1.70 2.07 2.09 2.03 1.83 1.23 0.71+ 0.31 0.16 0.06 0.05 0.06 0.24 0.99 1.74 2.05 1.77 1.61 1.50+ 1.46 1.42 1.25 1.15 1.27 1.55 1.69 1.64 1.45 1.21 0.75 0.33+ 0.08 0.01 0.00 0.00 0.00 0.00 0.00 0.33 0.83 1.06 1.12 1.01+ 0.93 0.84 0.78 0.85 0.97 1.27 1.39 1.30 1.11 0.94 0.69 0.29+ 0.18 0.16 0.10 0.08 0.10 0.11 0.32 0.65 0.97 1.03 1.02 0.90+ 0.73 0.59 0.45 0.34 0.35 0.85 1.32 1.50 1.49 1.38 1.14 0.01+ TIME= WEEK+ MULT= 1+ ADD = 0X Weekly Load TJ = 34.07629X Each figure represents average hourly flow rate in std. m3/sX Profile date = 7 JULY 2008 - 13 JULY 2008X ==========================================================X DELIVERY POINT HUNUAX CODERAMP HUNEXT.V1= 0.030833+ 0.04 0.04 0.03 0.05 0.08 0.10 0.11 0.17 0.16 0.15 0.14 0.14+ 0.21 0.16 0.16 0.16 0.14 0.11 0.12 0.10 0.10 0.10 0.10 0.09+ 0.07 0.09 0.11 0.14 0.13 0.12 0.19 0.15 0.14 0.17 0.17 0.17+ 0.17 0.22 0.17 0.16 0.20 0.20 0.15 0.13 0.16 0.16 0.14 0.12+ 0.15 0.13 0.11 0.12 0.17 0.17 0.19 0.20 0.21 0.16 0.17 0.17+ 0.17 0.17 0.18 0.16 0.18 0.14 0.14 0.16 0.14 0.15 0.13 0.12+ 0.11 0.11 0.12 0.12 0.12 0.16 0.18 0.17 0.17 0.17 0.17 0.18+ 0.18 0.20 0.16 0.15 0.17 0.14 0.13 0.13 0.13 0.13 0.14 0.12+ 0.11 0.08 0.09 0.09 0.10 0.11 0.12 0.11 0.10 0.10 0.09 0.10+ 0.10 0.10 0.08 0.06 0.05 0.06 0.05 0.06 0.07 0.06 0.07 0.04+ 0.04 0.03 0.02 0.03 0.02 0.05 0.07 0.06 0.05 0.04 0.04 0.03+ 0.03 0.04 0.03 0.02 0.02 0.02 0.02 0.02 0.02 0.02 0.02 0.02+ 0.02 0.02 0.02 0.02 0.02 0.03 0.01 0.02 0.02 0.02 0.02 0.01+ 0.02 0.01 0.02 0.02 0.02 0.02 0.01 0.02 0.02 0.02 0.03 0.00+ TIME= WEEK+ MULT= 1+ ADD = 0X Weekly Load TJ = 2.520469X Each figure represents average hourly flow rate in std. m3/sX Profile date = 7 JULY 2008 - 13 JULY 2008X ==========================================================X DELIVERY POINT KAURIX CODERAMP KRIEXT.V1 = 0.384722+ 0.36 0.15 0.12 0.09 0.06 0.10 0.09 0.14 0.11 0.12 0.31 0.22+ 0.28 0.34 0.33 0.33 0.37 0.34 0.40 0.39 0.39 0.40 0.38 0.37+ 0.38 0.17 0.09 0.17 0.35 0.38 0.43 0.46 0.39 0.39 0.41 0.42+ 0.42 0.42 0.42 0.42 0.41 0.38 0.39 0.14 0.08 0.15 0.33 0.34+ 0.35 0.34 0.35 0.35 0.37 0.38 0.37 0.38 0.36 0.40 0.34 0.33+ 0.13 0.25 0.44 0.18 0.10 0.17 0.09 0.11 0.11 0.16 0.11 0.27+ 0.39 0.40 0.39 0.36 0.36 0.35 0.38 0.25 0.13 0.16 0.24 0.43+ 0.68 0.55 0.53 0.45 0.43 0.39 0.37 0.38 0.39 0.39 0.39 0.40+ 0.24 0.10 0.14 0.23 0.37 0.34 0.34 0.38 0.37 0.37 0.40 0.41+ 0.40 0.39 0.43 0.42 0.43 0.19 0.07 0.09 0.11 0.23 0.38 0.38+ 0.36 0.37 0.39 0.38 0.43 0.41 0.37 0.40 0.53 0.67 0.71 0.54+ 0.42 0.37 0.19 0.36 0.39 0.42 0.35 0.34 0.35 0.40 0.43 0.38+ 0.40 0.37 0.37 0.37 0.40 0.26 0.11 0.20 0.11 0.07 0.15 0.08+ 0.11 0.13 0.35 0.38 0.37 0.39 0.35 0.33 0.34 0.35 0.35 0.00+ TIME= WEEK+ MULT= 1+ ADD = 0X Weekly Load TJ = 7.942681X Each figure represents average hourly flow rate in std. m3/sX Profile date = 7 JULY 2008 - 13 JULY 2008X ==========================================================

X DELIVERY POINT KINGSEATX CODERAMP KSTEXT.V1= 0.003056+ 0.00 0.00 0.00 0.00 0.00 0.00 0.00 0.00 0.00 0.00 0.00 0.00+ 0.00 0.00 0.00 0.00 0.00 0.00 0.00 0.00 0.00 0.00 0.00 0.00+ 0.00 0.00 0.00 0.00 0.00 0.00 0.00 0.00 0.00 0.00 0.00 0.00+ 0.00 0.00 0.00 0.00 0.00 0.00 0.00 0.00 0.00 0.00 0.00 0.00+ 0.00 0.00 0.00 0.00 0.00 0.00 0.00 0.00 0.00 0.00 0.00 0.00+ 0.00 0.00 0.00 0.00 0.00 0.00 0.00 0.00 0.00 0.00 0.00 0.00+ 0.00 0.00 0.00 0.00 0.00 0.01 0.00 0.00 0.01 0.00 0.00 0.00+ 0.00 0.00 0.00 0.00 0.00 0.00 0.00 0.00 0.00 0.00 0.00 0.00+ 0.00 0.00 0.00 0.00 0.00 0.00 0.00 0.00 0.00 0.00 0.00 0.00+ 0.00 0.00 0.00 0.00 0.00 0.00 0.00 0.00 0.00 0.00 0.00 0.00+ 0.00 0.00 0.00 0.00 0.00 0.00 0.00 0.00 0.00 0.00 0.00 0.00+ 0.00 0.00 0.00 0.00 0.00 0.00 0.00 0.00 0.00 0.00 0.00 0.00+ 0.00 0.00 0.00 0.00 0.00 0.00 0.00 0.00 0.00 0.00 0.00 0.00+ 0.00 0.00 0.00 0.00 0.00 0.00 0.00 0.00 0.00 0.00 0.00 0.00+ TIME= WEEK+ MULT= 1+ ADD = 0X Weekly Load TJ = 0.055127X Each figure represents average hourly flow rate in std. m3/sX Profile date = 7 JULY 2008 - 13 JULY 2008X ==========================================================X DELIVERY POINT MARSDEN POINT (CH LVL)X CODERAMP MDNEXT.V1= 0+ 0.00 0.00 0.00 0.00 0.00 0.00 0.00 0.00 0.00 0.00 0.00 0.00+ 0.00 0.00 0.00 0.00 0.00 0.00 0.00 0.00 0.00 0.00 0.00 0.00+ 0.00 0.00 0.00 0.00 0.00 0.00 0.00 0.00 0.00 0.00 0.00 0.00+ 0.00 0.00 0.00 0.00 0.00 0.00 0.00 0.00 0.00 0.00 0.00 0.00+ 0.00 0.00 0.03 0.03 0.01 0.00 0.00 0.00 0.00 0.00 0.00 0.00+ 0.00 0.00 0.00 0.00 0.00 0.00 0.00 0.00 0.00 0.00 0.00 0.00+ 0.00 0.00 0.00 0.00 0.00 0.00 0.00 0.00 0.00 0.00 0.00 0.00+ 0.02 0.01 0.00 0.00 0.00 0.00 0.00 0.00 0.00 0.00 0.00 0.00+ 0.00 0.00 0.00 0.00 0.00 0.00 0.00 0.00 0.00 0.00 0.00 0.00+ 0.00 0.00 0.00 0.00 0.00 0.00 0.00 0.00 0.00 0.00 0.00 0.00+ 0.00 0.00 0.00 0.00 0.00 0.00 0.00 0.00 0.00 0.00 0.00 0.00+ 0.00 0.00 0.00 0.00 0.00 0.00 0.00 0.00 0.00 0.00 0.00 0.00+ 0.00 0.00 0.00 0.00 0.00 0.00 0.00 0.00 0.00 0.00 0.00 0.00+ 0.00 0.00 0.00 0.00 0.00 0.00 0.00 0.00 0.00 0.00 0.00 0.00+ TIME= WEEK+ MULT= 1+ ADD = 0X Weekly Load TJ = 0.013298X Each figure represents average hourly flow rate in std. m3/sX Profile date = 7 JULY 2008 - 13 JULY 2008X ==========================================================X DELIVERY POINT MARSDEN POINT (REFINERY)X CODERAMP NZDEXT.V1= 1.980556+ 1.98 1.98 1.98 1.99 1.99 2.00 2.00 1.99 2.00 1.92 1.95 1.95+ 2.02 1.98 2.16 2.14 2.05 1.98 1.98 1.97 1.94 1.96 1.97 1.98+ 1.97 1.98 1.99 1.99 1.99 1.99 2.00 2.00 1.88 1.83 1.54 1.51+ 1.51 1.51 1.51 1.51 1.52 1.53 1.53 1.53 1.53 1.53 1.54 1.54+ 1.54 1.54 1.54 1.54 1.54 1.54 1.55 1.55 1.55 1.53 1.52 1.46+ 1.53 1.53 1.54 1.54 1.54 1.55 1.56 1.56 1.56 1.56 1.56 1.57+ 1.56 1.57 1.57 1.57 1.58 1.58 1.58 1.57 1.56 1.55 1.54 1.53+ 1.52 1.52 1.53 1.53 1.54 1.54 1.54 1.54 1.54 1.56 1.65 1.65+ 1.66 1.66 1.66 1.66 1.66 1.66 1.66 1.66 1.66 1.54 1.60 1.60+ 1.40 1.01 1.01 1.61 1.62 1.36 1.15 1.12 1.54 1.63 1.63 1.63+ 1.63 1.63 1.51 1.45 1.33 1.13 0.99 0.83 0.79 0.76 0.71 0.69+ 0.70 0.75 1.16 1.60 1.50 1.46 1.27 1.20 1.13 1.01 0.91 0.84+ 0.42 0.39 0.86 1.14 1.19 1.20 1.27 1.22 0.78 0.41 0.28 0.14+ 0.68 0.62 1.10 1.24 1.23 1.16 1.17 1.22 1.24 1.47 1.61 2.14+ TIME= WEEK+ MULT= 1+ ADD = 0X Weekly Load TJ = 37.46095X Each figure represents average hourly flow rate in std. m3/sX Profile date = 7 JULY 2008 - 13 JULY 2008X ==========================================================
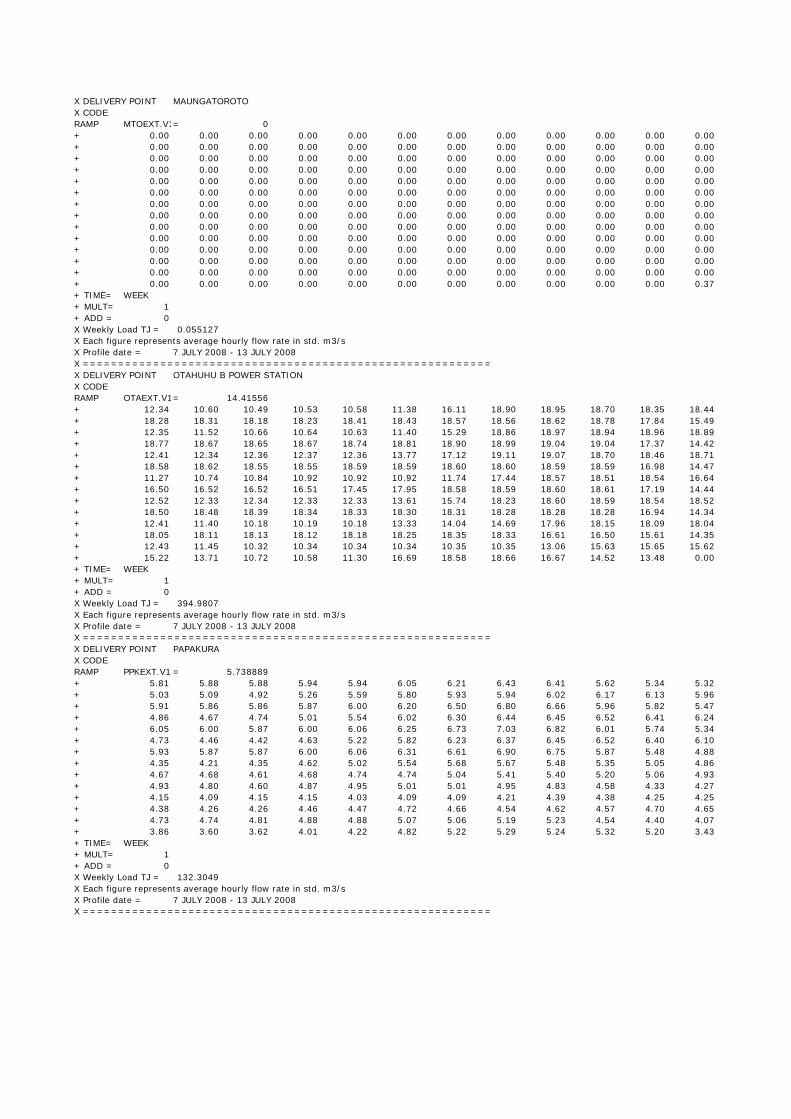
X DELIVERY POINT MAUNGATOROTOX CODERAMP MTOEXT.V1= 0+ 0.00 0.00 0.00 0.00 0.00 0.00 0.00 0.00 0.00 0.00 0.00 0.00+ 0.00 0.00 0.00 0.00 0.00 0.00 0.00 0.00 0.00 0.00 0.00 0.00+ 0.00 0.00 0.00 0.00 0.00 0.00 0.00 0.00 0.00 0.00 0.00 0.00+ 0.00 0.00 0.00 0.00 0.00 0.00 0.00 0.00 0.00 0.00 0.00 0.00+ 0.00 0.00 0.00 0.00 0.00 0.00 0.00 0.00 0.00 0.00 0.00 0.00+ 0.00 0.00 0.00 0.00 0.00 0.00 0.00 0.00 0.00 0.00 0.00 0.00+ 0.00 0.00 0.00 0.00 0.00 0.00 0.00 0.00 0.00 0.00 0.00 0.00+ 0.00 0.00 0.00 0.00 0.00 0.00 0.00 0.00 0.00 0.00 0.00 0.00+ 0.00 0.00 0.00 0.00 0.00 0.00 0.00 0.00 0.00 0.00 0.00 0.00+ 0.00 0.00 0.00 0.00 0.00 0.00 0.00 0.00 0.00 0.00 0.00 0.00+ 0.00 0.00 0.00 0.00 0.00 0.00 0.00 0.00 0.00 0.00 0.00 0.00+ 0.00 0.00 0.00 0.00 0.00 0.00 0.00 0.00 0.00 0.00 0.00 0.00+ 0.00 0.00 0.00 0.00 0.00 0.00 0.00 0.00 0.00 0.00 0.00 0.00+ 0.00 0.00 0.00 0.00 0.00 0.00 0.00 0.00 0.00 0.00 0.00 0.37+ TIME= WEEK+ MULT= 1+ ADD = 0X Weekly Load TJ = 0.055127X Each figure represents average hourly flow rate in std. m3/sX Profile date = 7 JULY 2008 - 13 JULY 2008X ==========================================================X DELIVERY POINT OTAHUHU B POWER STATIONX CODERAMP OTAEXT.V1= 14.41556+ 12.34 10.60 10.49 10.53 10.58 11.38 16.11 18.90 18.95 18.70 18.35 18.44+ 18.28 18.31 18.18 18.23 18.41 18.43 18.57 18.56 18.62 18.78 17.84 15.49+ 12.35 11.52 10.66 10.64 10.63 11.40 15.29 18.86 18.97 18.94 18.96 18.89+ 18.77 18.67 18.65 18.67 18.74 18.81 18.90 18.99 19.04 19.04 17.37 14.42+ 12.41 12.34 12.36 12.37 12.36 13.77 17.12 19.11 19.07 18.70 18.46 18.71+ 18.58 18.62 18.55 18.55 18.59 18.59 18.60 18.60 18.59 18.59 16.98 14.47+ 11.27 10.74 10.84 10.92 10.92 10.92 11.74 17.44 18.57 18.51 18.54 16.64+ 16.50 16.52 16.52 16.51 17.45 17.95 18.58 18.59 18.60 18.61 17.19 14.44+ 12.52 12.33 12.34 12.33 12.33 13.61 15.74 18.23 18.60 18.59 18.54 18.52+ 18.50 18.48 18.39 18.34 18.33 18.30 18.31 18.28 18.28 18.28 16.94 14.34+ 12.41 11.40 10.18 10.19 10.18 13.33 14.04 14.69 17.96 18.15 18.09 18.04+ 18.05 18.11 18.13 18.12 18.18 18.25 18.35 18.33 16.61 16.50 15.61 14.35+ 12.43 11.45 10.32 10.34 10.34 10.34 10.35 10.35 13.06 15.63 15.65 15.62+ 15.22 13.71 10.72 10.58 11.30 16.69 18.58 18.66 16.67 14.52 13.48 0.00+ TIME= WEEK+ MULT= 1+ ADD = 0X Weekly Load TJ = 394.9807X Each figure represents average hourly flow rate in std. m3/sX Profile date = 7 JULY 2008 - 13 JULY 2008X ==========================================================X DELIVERY POINT PAPAKURAX CODERAMP PPKEXT.V1 = 5.738889+ 5.81 5.88 5.88 5.94 5.94 6.05 6.21 6.43 6.41 5.62 5.34 5.32+ 5.03 5.09 4.92 5.26 5.59 5.80 5.93 5.94 6.02 6.17 6.13 5.96+ 5.91 5.86 5.86 5.87 6.00 6.20 6.50 6.80 6.66 5.96 5.82 5.47+ 4.86 4.67 4.74 5.01 5.54 6.02 6.30 6.44 6.45 6.52 6.41 6.24+ 6.05 6.00 5.87 6.00 6.06 6.25 6.73 7.03 6.82 6.01 5.74 5.34+ 4.73 4.46 4.42 4.63 5.22 5.82 6.23 6.37 6.45 6.52 6.40 6.10+ 5.93 5.87 5.87 6.00 6.06 6.31 6.61 6.90 6.75 5.87 5.48 4.88+ 4.35 4.21 4.35 4.62 5.02 5.54 5.68 5.67 5.48 5.35 5.05 4.86+ 4.67 4.68 4.61 4.68 4.74 4.74 5.04 5.41 5.40 5.20 5.06 4.93+ 4.93 4.80 4.60 4.87 4.95 5.01 5.01 4.95 4.83 4.58 4.33 4.27+ 4.15 4.09 4.15 4.15 4.03 4.09 4.09 4.21 4.39 4.38 4.25 4.25+ 4.38 4.26 4.26 4.46 4.47 4.72 4.66 4.54 4.62 4.57 4.70 4.65+ 4.73 4.74 4.81 4.88 4.88 5.07 5.06 5.19 5.23 4.54 4.40 4.07+ 3.86 3.60 3.62 4.01 4.22 4.82 5.22 5.29 5.24 5.32 5.20 3.43+ TIME= WEEK+ MULT= 1+ ADD = 0X Weekly Load TJ = 132.3049X Each figure represents average hourly flow rate in std. m3/sX Profile date = 7 JULY 2008 - 13 JULY 2008X ==========================================================

X DELIVERY POINT PUKEKOHEX CODERAMP PUKEXT.V1= 0.028889+ 0.02 0.03 0.03 0.02 0.02 0.04 0.07 0.08 0.08 0.08 0.06 0.06+ 0.06 0.07 0.07 0.06 0.05 0.04 0.05 0.04 0.04 0.04 0.05 0.04+ 0.03 0.03 0.02 0.03 0.04 0.04 0.07 0.09 0.09 0.08 0.08 0.07+ 0.07 0.07 0.06 0.04 0.04 0.05 0.05 0.04 0.04 0.04 0.05 0.03+ 0.03 0.02 0.02 0.02 0.02 0.04 0.07 0.08 0.10 0.09 0.08 0.07+ 0.06 0.07 0.06 0.05 0.04 0.04 0.05 0.04 0.04 0.04 0.05 0.04+ 0.02 0.02 0.03 0.03 0.03 0.03 0.07 0.08 0.09 0.07 0.06 0.06+ 0.06 0.05 0.05 0.05 0.04 0.04 0.05 0.05 0.05 0.04 0.04 0.03+ 0.02 0.01 0.02 0.02 0.02 0.02 0.05 0.07 0.07 0.07 0.07 0.08+ 0.06 0.06 0.06 0.05 0.05 0.04 0.04 0.04 0.03 0.04 0.03 0.02+ 0.01 0.01 0.01 0.01 0.01 0.01 0.01 0.02 0.04 0.03 0.02 0.03+ 0.03 0.03 0.02 0.02 0.02 0.02 0.02 0.02 0.02 0.02 0.01 0.01+ 0.01 0.01 0.01 0.01 0.02 0.03 0.03 0.03 0.03 0.03 0.02 0.02+ 0.02 0.02 0.02 0.02 0.01 0.02 0.02 0.02 0.02 0.02 0.03 0.03+ TIME= WEEK+ MULT= 1+ ADD = 0X Weekly Load TJ = 1.015252X Each figure represents average hourly flow rate in std. m3/sX Profile date = 7 JULY 2008 - 13 JULY 2008X ==========================================================X DELIVERY POINT RAMARAMAX CODERAMP RAMEXT.V1= 0.067222+ 0.07 0.07 0.06 0.07 0.06 0.05 0.05 0.06 0.05 0.02 0.01 0.00+ 0.00 0.00 0.00 0.01 0.02 0.04 0.03 0.04 0.06 0.05 0.05 0.07+ 0.07 0.07 0.07 0.06 0.07 0.06 0.06 0.06 0.04 0.01 0.00 0.01+ 0.00 0.00 0.00 0.01 0.02 0.04 0.04 0.05 0.04 0.05 0.05 0.05+ 0.05 0.05 0.05 0.05 0.05 0.05 0.05 0.04 0.04 0.02 0.01 0.00+ 0.00 0.01 0.00 0.01 0.02 0.05 0.06 0.07 0.04 0.06 0.07 0.07+ 0.06 0.05 0.07 0.07 0.06 0.06 0.06 0.06 0.04 0.02 0.00 0.00+ 0.00 0.00 0.00 0.01 0.01 0.03 0.03 0.02 0.04 0.03 0.02 0.03+ 0.03 0.02 0.03 0.02 0.04 0.03 0.03 0.04 0.03 0.02 0.01 0.01+ 0.01 0.01 0.01 0.02 0.01 0.01 0.02 0.01 0.02 0.02 0.01 0.02+ 0.01 0.01 0.02 0.01 0.02 0.01 0.02 0.03 0.02 0.01 0.01 0.01+ 0.01 0.01 0.01 0.01 0.01 0.02 0.01 0.02 0.02 0.03 0.03 0.03+ 0.03 0.04 0.03 0.04 0.03 0.04 0.03 0.05 0.03 0.00 0.00 0.00+ 0.01 0.01 0.00 0.01 0.02 0.02 0.04 0.05 0.03 0.04 0.05 0.04+ TIME= WEEK+ MULT= 1+ ADD = 0X Weekly Load TJ = 0.758763X Each figure represents average hourly flow rate in std. m3/sX Profile date = 7 JULY 2008 - 13 JULY 2008X ==========================================================X DELIVERY POINT SOUTHDOWNX CODERAMP SDNEXT.V1= 10.19111+ 10.18 10.24 10.21 10.23 10.28 10.25 10.25 10.25 10.69 10.52 10.51 10.54+ 10.49 10.54 10.52 10.50 10.47 10.47 10.42 10.48 10.52 10.54 10.55 10.52+ 10.55 10.57 10.56 10.57 10.58 10.57 10.55 10.61 10.60 10.58 10.46 10.36+ 10.48 10.45 10.47 10.48 10.45 10.47 10.54 10.60 10.60 10.61 10.61 10.60+ 10.62 10.63 10.65 10.67 10.59 10.65 10.66 10.66 10.65 10.64 10.65 10.67+ 10.68 10.68 10.66 10.66 10.64 10.67 10.68 10.67 10.67 10.65 10.67 10.64+ 10.65 10.64 10.63 10.65 10.64 10.63 10.61 10.63 10.62 10.59 10.61 10.63+ 10.62 10.61 10.36 10.61 10.62 10.63 10.64 10.64 10.64 10.65 10.63 10.64+ 10.63 10.64 10.57 10.61 10.63 10.66 10.66 10.66 10.66 10.65 10.65 10.64+ 10.64 10.63 10.62 10.60 10.59 10.56 10.90 10.54 10.54 10.55 10.55 10.55+ 10.55 10.54 10.54 9.01 6.87 6.09 6.09 6.11 6.89 10.47 10.54 10.53+ 10.54 10.52 10.53 10.51 10.52 10.53 10.52 7.30 7.17 7.16 7.16 7.15+ 6.42 6.10 6.11 4.77 3.10 3.09 3.09 4.08 6.72 9.96 10.31 10.61+ 10.61 10.56 10.60 7.65 7.17 7.29 10.25 10.57 10.56 10.53 10.59 0.00+ TIME= WEEK+ MULT= 1+ ADD = 0X Weekly Load TJ = 248.0058X Each figure represents average hourly flow rate in std. m3/sX Profile date = 7 JULY 2008 - 13 JULY 2008X ==========================================================

X DELIVERY POINT TUAKAUX CODERAMP TUAEXT.V1= 0+ 0.00 0.00 0.00 0.00 0.00 0.00 0.05 0.10 0.10 0.11 0.12 0.12+ 0.12 0.15 0.13 0.10 0.09 0.14 0.11 0.08 0.07 0.08 0.11 0.11+ 0.11 0.11 0.14 0.16 0.18 0.14 0.17 0.19 0.15 0.14 0.12 0.13+ 0.10 0.11 0.13 0.10 0.13 0.15 0.14 0.17 0.19 0.18 0.15 0.13+ 0.08 0.08 0.10 0.11 0.10 0.09 0.14 0.19 0.21 0.21 0.22 0.26+ 0.21 0.20 0.19 0.20 0.15 0.20 0.20 0.21 0.20 0.13 0.10 0.10+ 0.10 0.11 0.10 0.13 0.15 0.14 0.22 0.26 0.23 0.17 0.15 0.15+ 0.14 0.15 0.14 0.16 0.15 0.17 0.19 0.20 0.20 0.15 0.10 0.10+ 0.10 0.09 0.06 0.13 0.16 0.18 0.23 0.25 0.21 0.17 0.11 0.09+ 0.09 0.08 0.11 0.18 0.14 0.09 0.10 0.09 0.07 0.10 0.13 0.17+ 0.19 0.20 0.20 0.20 0.19 0.19 0.20 0.21 0.19 0.19 0.16 0.11+ 0.09 0.08 0.09 0.07 0.05 0.01 0.00 0.00 0.00 0.00 0.00 0.00+ 0.00 0.00 0.00 0.00 0.00 0.00 0.00 0.00 0.00 0.00 0.00 0.00+ 0.00 0.00 0.00 0.00 0.00 0.00 0.00 0.00 0.00 0.00 0.00 0.00+ TIME= WEEK+ MULT= 1+ ADD = 0X Weekly Load TJ = 2.764442X Each figure represents average hourly flow rate in std. m3/sX Profile date = 7 JULY 2008 - 13 JULY 2008X ==========================================================X DELIVERY POINT WAITOKIX CODERAMP WAIEXT.V1= 0.069167+ 0.05 0.04 0.04 0.05 0.05 0.07 0.14 0.22 0.20 0.17 0.14 0.10+ 0.11 0.10 0.10 0.09 0.12 0.18 0.23 0.22 0.19 0.15 0.10 0.06+ 0.04 0.03 0.03 0.03 0.04 0.06 0.13 0.18 0.20 0.30 0.20 0.12+ 0.11 0.12 0.09 0.09 0.10 0.17 0.24 0.24 0.21 0.17 0.12 0.06+ 0.04 0.04 0.03 0.03 0.04 0.05 0.12 0.23 0.21 0.16 0.12 0.21+ 0.11 0.08 0.08 0.07 0.09 0.16 0.23 0.23 0.21 0.17 0.12 0.06+ 0.04 0.03 0.02 0.02 0.03 0.05 0.11 0.24 0.34 0.31 0.17 0.10+ 0.21 0.22 0.18 0.08 0.15 0.22 0.20 0.19 0.17 0.14 0.09 0.05+ 0.03 0.02 0.02 0.02 0.02 0.04 0.11 0.17 0.19 0.15 0.14 0.14+ 0.11 0.11 0.10 0.10 0.12 0.17 0.19 0.19 0.15 0.13 0.10 0.07+ 0.04 0.03 0.03 0.03 0.03 0.04 0.05 0.07 0.11 0.13 0.13 0.11+ 0.10 0.08 0.08 0.09 0.11 0.14 0.16 0.14 0.11 0.10 0.08 0.05+ 0.03 0.02 0.02 0.02 0.01 0.02 0.03 0.06 0.10 0.12 0.12 0.10+ 0.09 0.08 0.06 0.06 0.07 0.12 0.16 0.16 0.15 0.18 0.12 0.04+ TIME= WEEK+ MULT= 1+ ADD = 0X Weekly Load TJ = 2.795278X Each figure represents average hourly flow rate in std. m3/sX Profile date = 7 JULY 2008 - 13 JULY 2008X ==========================================================X DELIVERY POINT WARKWORTHX CODERAMP WKWEXT.V= 0.328889+ 0.34 0.35 0.33 0.33 0.33 0.38 0.37 0.39 0.25 0.14 0.21 0.21+ 0.23 0.27 0.20 0.16 0.15 0.32 0.08 0.06 0.09 0.12 0.16 0.24+ 0.36 0.35 0.35 0.35 0.37 0.38 0.39 0.40 0.34 0.15 0.23 0.23+ 0.25 0.26 0.25 0.16 0.06 0.35 0.11 0.08 0.22 0.21 0.23 0.36+ 0.37 0.37 0.37 0.36 0.39 0.39 0.39 0.42 0.33 0.18 0.22 0.25+ 0.27 0.28 0.23 0.15 0.05 0.33 0.08 0.04 0.09 0.18 0.26 0.36+ 0.36 0.36 0.34 0.37 0.40 0.39 0.39 0.40 0.34 0.23 0.13 0.19+ 0.21 0.22 0.23 0.16 0.04 0.04 0.06 0.05 0.05 0.06 0.06 0.05+ 0.06 0.09 0.12 0.10 0.13 0.31 0.33 0.15 0.20 0.13 0.19 0.16+ 0.22 0.24 0.24 0.15 0.07 0.11 0.07 0.06 0.07 0.05 0.04 0.06+ 0.05 0.11 0.11 0.10 0.13 0.22 0.27 0.19 0.12 0.20 0.22 0.16+ 0.16 0.16 0.17 0.06 0.05 0.11 0.07 0.05 0.05 0.12 0.12 0.07+ 0.18 0.28 0.28 0.24 0.27 0.33 0.33 0.33 0.17 0.14 0.21 0.24+ 0.26 0.25 0.24 0.14 0.03 0.10 0.08 0.06 0.06 0.09 0.18 0.18+ TIME= WEEK+ MULT= 1+ ADD = 0X Weekly Load TJ = 5.190672X Each figure represents average hourly flow rate in std. m3/sX Profile date = 7 JULY 2008 - 13 JULY 2008X ==========================================================

X DELIVERY POINT WESTFIELDX CODERAMP WFDEXT.V1 = 2.2605556+ 2.03 1.98 1.87 1.70 1.84 2.53 4.71 7.53 8.77 8.37 8.04 7.79+ 7.62 7.11 6.47 6.32 6.35 7.36 8.12 7.68 6.87 5.80 5.04 3.44+ 2.82 2.59 2.64 2.38 2.50 3.35 5.06 7.80 9.40 8.55 7.77 7.47+ 7.00 6.74 6.78 6.15 5.87 6.83 7.59 7.71 7.12 5.72 5.08 3.51+ 2.88 2.56 2.09 1.99 2.37 2.83 5.08 8.38 9.38 9.40 8.39 7.81+ 8.05 7.97 7.37 6.69 6.01 6.63 7.72 7.57 7.08 6.19 5.10 3.49+ 2.69 2.35 2.38 2.31 2.70 3.17 4.95 7.74 9.39 9.03 8.21 7.72+ 7.69 7.76 7.30 6.48 5.91 6.70 7.56 7.81 7.10 5.73 4.67 3.82+ 3.25 2.84 2.29 2.24 2.52 3.14 4.66 6.30 7.26 6.91 6.67 6.23+ 5.90 5.99 5.98 5.70 5.80 6.04 6.51 5.99 5.50 5.18 4.19 3.32+ 2.73 2.40 2.10 2.16 1.94 1.91 2.17 3.46 4.62 4.75 4.83 4.78+ 4.74 4.59 4.37 4.33 4.55 4.93 4.86 4.36 3.63 3.13 2.56 1.90+ 1.32 1.02 0.82 0.78 0.79 0.99 1.64 2.14 3.35 4.55 4.49 4.47+ 4.28 4.14 3.93 3.47 3.41 3.70 4.26 4.17 3.82 3.20 2.65 0.00+ TIME= WEEK+ MULT= 1.00+ ADD = 0.00X Weekly Load TJ = 123.58X Each figure represents average hourly flow rate in std. m3/sX Profile date = 7 JULY 2008 - 13 JULY 2008X ==========================================================X DELIVERY POINT WHANGAREIX CODERAMP WHGEXT.V = 0.077222+ 0.07 0.07 0.06 0.06 0.07 0.08 0.20 0.21 0.22 0.20 0.19 0.18+ 0.19 0.19 0.16 0.16 0.18 0.19 0.19 0.18 0.16 0.13 0.11 0.08+ 0.07 0.07 0.07 0.08 0.09 0.11 0.20 0.22 0.24 0.21 0.20 0.20+ 0.18 0.19 0.18 0.16 0.18 0.21 0.23 0.22 0.21 0.18 0.14 0.11+ 0.10 0.10 0.10 0.11 0.11 0.13 0.22 0.24 0.26 0.24 0.22 0.20+ 0.20 0.19 0.17 0.18 0.17 0.21 0.23 0.22 0.21 0.18 0.14 0.12+ 0.11 0.11 0.11 0.10 0.10 0.12 0.22 0.26 0.29 0.28 0.25 0.23+ 0.21 0.20 0.18 0.18 0.18 0.21 0.22 0.21 0.19 0.16 0.12 0.10+ 0.08 0.08 0.07 0.08 0.07 0.09 0.18 0.19 0.21 0.19 0.18 0.18+ 0.17 0.17 0.16 0.15 0.15 0.17 0.18 0.17 0.15 0.13 0.11 0.09+ 0.07 0.07 0.07 0.06 0.07 0.07 0.08 0.10 0.12 0.13 0.13 0.13+ 0.12 0.11 0.11 0.12 0.13 0.15 0.15 0.14 0.13 0.11 0.09 0.07+ 0.07 0.06 0.06 0.06 0.07 0.07 0.09 0.11 0.13 0.14 0.12 0.11+ 0.11 0.10 0.09 0.09 0.10 0.13 0.16 0.16 0.14 0.13 0.10 0.12+ TIME= WEEK+ MULT= 1+ ADD = 0X Weekly Load TJ = 3.642104X Each figure represents average hourly flow rate in std. m3/sX Profile date = 7 JULY 2008 - 13 JULY 2008X ==========================================================
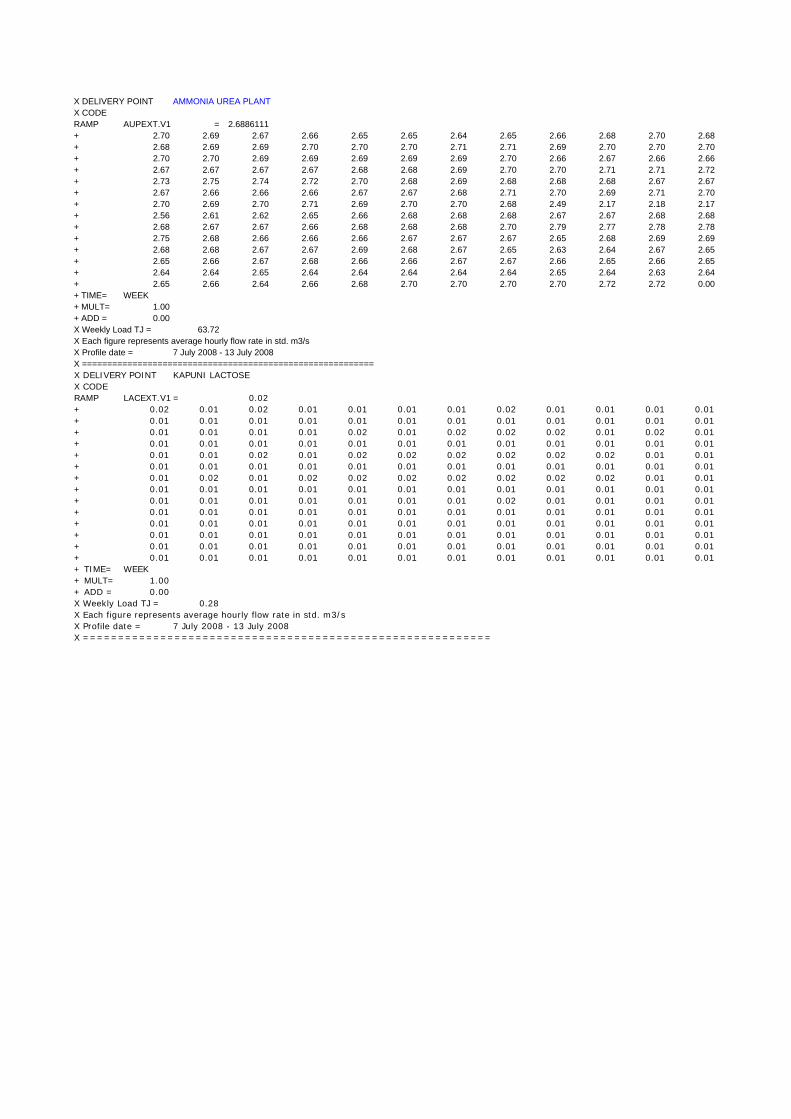
X DELIVERY POINT AMMONIA UREA PLANTX CODERAMP AUPEXT.V1 = 2.6886111+ 2.70 2.69 2.67 2.66 2.65 2.65 2.64 2.65 2.66 2.68 2.70 2.68+ 2.68 2.69 2.69 2.70 2.70 2.70 2.71 2.71 2.69 2.70 2.70 2.70+ 2.70 2.70 2.69 2.69 2.69 2.69 2.69 2.70 2.66 2.67 2.66 2.66+ 2.67 2.67 2.67 2.67 2.68 2.68 2.69 2.70 2.70 2.71 2.71 2.72+ 2.73 2.75 2.74 2.72 2.70 2.68 2.69 2.68 2.68 2.68 2.67 2.67+ 2.67 2.66 2.66 2.66 2.67 2.67 2.68 2.71 2.70 2.69 2.71 2.70+ 2.70 2.69 2.70 2.71 2.69 2.70 2.70 2.68 2.49 2.17 2.18 2.17+ 2.56 2.61 2.62 2.65 2.66 2.68 2.68 2.68 2.67 2.67 2.68 2.68+ 2.68 2.67 2.67 2.66 2.68 2.68 2.68 2.70 2.79 2.77 2.78 2.78+ 2.75 2.68 2.66 2.66 2.66 2.67 2.67 2.67 2.65 2.68 2.69 2.69+ 2.68 2.68 2.67 2.67 2.69 2.68 2.67 2.65 2.63 2.64 2.67 2.65+ 2.65 2.66 2.67 2.68 2.66 2.66 2.67 2.67 2.66 2.65 2.66 2.65+ 2.64 2.64 2.65 2.64 2.64 2.64 2.64 2.64 2.65 2.64 2.63 2.64+ 2.65 2.66 2.64 2.66 2.68 2.70 2.70 2.70 2.70 2.72 2.72 0.00+ TIME= WEEK+ MULT= 1.00+ ADD = 0.00X Weekly Load TJ = 63.72X Each figure represents average hourly flow rate in std. m3/sX Profile date = 7 July 2008 - 13 July 2008X ==========================================================X DELIVERY POINT KAPUNI LACTOSEX CODERAMP LACEXT.V1 = 0.02+ 0.02 0.01 0.02 0.01 0.01 0.01 0.01 0.02 0.01 0.01 0.01 0.01+ 0.01 0.01 0.01 0.01 0.01 0.01 0.01 0.01 0.01 0.01 0.01 0.01+ 0.01 0.01 0.01 0.01 0.02 0.01 0.02 0.02 0.02 0.01 0.02 0.01+ 0.01 0.01 0.01 0.01 0.01 0.01 0.01 0.01 0.01 0.01 0.01 0.01+ 0.01 0.01 0.02 0.01 0.02 0.02 0.02 0.02 0.02 0.02 0.01 0.01+ 0.01 0.01 0.01 0.01 0.01 0.01 0.01 0.01 0.01 0.01 0.01 0.01+ 0.01 0.02 0.01 0.02 0.02 0.02 0.02 0.02 0.02 0.02 0.01 0.01+ 0.01 0.01 0.01 0.01 0.01 0.01 0.01 0.01 0.01 0.01 0.01 0.01+ 0.01 0.01 0.01 0.01 0.01 0.01 0.01 0.02 0.01 0.01 0.01 0.01+ 0.01 0.01 0.01 0.01 0.01 0.01 0.01 0.01 0.01 0.01 0.01 0.01+ 0.01 0.01 0.01 0.01 0.01 0.01 0.01 0.01 0.01 0.01 0.01 0.01+ 0.01 0.01 0.01 0.01 0.01 0.01 0.01 0.01 0.01 0.01 0.01 0.01+ 0.01 0.01 0.01 0.01 0.01 0.01 0.01 0.01 0.01 0.01 0.01 0.01+ 0.01 0.01 0.01 0.01 0.01 0.01 0.01 0.01 0.01 0.01 0.01 0.01+ TIME= WEEK+ MULT= 1.00+ ADD = 0.00X Weekly Load TJ = 0.28X Each figure represents average hourly flow rate in std. m3/sX Profile date = 7 July 2008 - 13 July 2008X ==========================================================

X DELIVERY POINT KAPUNI GAS TREATMENT PLANT (BAPASS)X CODERAMP KAMEXT.V1= 11.53+ 11.55 11.54 11.53 11.52 11.53 11.52 11.52 11.52 11.52 11.52 11.52 11.51+ 11.52 11.51 11.51 11.51 11.51 11.51 11.51 11.67 12.43 12.45 12.52 12.52+ 12.55 12.53 12.53 12.53 12.53 12.52 12.52 12.52 12.52 12.52 12.52 12.52+ 12.52 12.52 12.52 12.52 12.52 12.52 12.52 12.52 12.52 12.52 12.53 12.52+ 12.52 12.52 12.52 12.52 12.53 12.52 12.52 12.52 12.52 12.51 12.52 12.51+ 12.52 12.51 12.52 12.53 12.52 12.52 12.52 12.52 12.53 12.53 12.53 12.53+ 12.54 12.53 12.53 12.53 12.53 12.26 10.53 10.53 10.54 10.53 10.53 10.52+ 10.52 10.52 10.52 10.52 10.51 10.50 10.50 10.52 10.53 10.52 10.52 10.53+ 10.51 10.54 10.53 10.53 10.53 10.53 10.53 10.53 10.52 10.52 9.96 9.52+ 9.51 9.52 9.52 9.52 9.51 9.51 9.53 9.53 9.53 9.52 9.53 9.53+ 9.53 9.53 9.52 9.53 9.53 9.53 9.52 9.52 9.52 9.52 9.52 9.52+ 9.52 9.52 8.74 8.53 8.53 8.39 7.73 7.53 7.53 7.53 7.53 7.53+ 7.53 7.53 7.53 7.53 7.53 6.57 5.26 5.04 5.04 5.04 5.04 5.04+ 5.04 5.04 4.95 4.53 4.54 4.53 4.54 4.54 4.54 4.54 4.54 0.00+ TIME= WEEK+ MULT= 1.00+ ADD = 0.00X Weekly Load TJ = 246.68X Each figure represents average hourly flow rate in std. m3/sX Profile date = 7 July 2008 - 13 July 2008X ==========================================================X DELIVERY POINT TARANIKI COMBINED CYCLE POWER STATIONX CODERAMP TCCEXT.V1= 15.14+ 10.00 9.87 9.92 9.91 9.90 12.48 17.60 19.07 19.02 18.99 19.04 19.04+ 19.06 19.08 19.07 19.12 19.21 19.24 19.26 19.30 19.40 19.42 16.64 16.52+ 13.13 11.56 11.34 11.35 11.36 11.44 14.53 19.46 19.45 19.40 19.40 19.50+ 19.45 18.79 20.09 18.82 19.48 19.54 19.61 19.58 19.59 19.59 16.91 16.71+ 15.44 14.02 14.02 14.02 14.02 14.10 15.70 19.18 19.58 19.53 19.52 19.54+ 19.47 19.47 19.47 19.48 19.54 19.59 19.57 19.61 19.60 19.63 18.42 16.73+ 11.49 10.04 10.08 10.07 10.08 10.09 11.34 14.55 14.16 10.35 10.02 7.84+ 10.48 12.67 13.37 11.36 15.58 19.29 19.48 19.53 19.45 19.44 17.83 13.88+ 16.08 13.94 13.78 13.79 13.80 13.80 13.80 13.77 18.40 19.12 19.14 19.00+ 18.97 19.01 19.00 18.98 18.93 18.90 18.88 18.87 18.85 18.87 16.40 11.35+ 11.58 10.15 10.61 10.69 9.89 9.90 10.02 10.23 13.73 18.87 18.86 18.85+ 18.82 18.77 16.18 18.29 18.54 18.89 18.50 15.92 15.21 14.02 14.48 13.16+ 9.95 9.90 9.89 9.90 9.89 11.41 11.25 12.06 13.84 15.37 13.94 13.90+ 12.76 11.55 12.66 12.18 13.46 17.86 18.20 17.38 17.20 16.70 14.79 0.00+ TIME= WEEK+ MULT= 1.00+ ADD = 0.00X Weekly Load TJ = 375.71X Each figure represents average hourly flow rate in std. m3/sX Profile date = 7 July 2008 - 13 July 2008X ==========================================================

X DELIVERY POINT CAMBRIDGE X CODERAMP CAMEXT.V1 = 0.3905556+ 0.39 0.43 0.47 0.40 0.35 0.40 0.47 0.59 0.61 0.59 0.55 0.55+ 0.48 0.41 0.41 0.37 0.29 0.32 0.36 0.40 0.38 0.38 0.33 0.29+ 0.27 0.37 0.39 0.37 0.35 0.42 0.46 0.59 0.58 0.56 0.59 0.59+ 0.48 0.49 0.47 0.54 0.55 0.58 0.64 0.59 0.57 0.55 0.48 0.48+ 0.47 0.42 0.43 0.36 0.27 0.33 0.40 0.55 0.52 0.56 0.56 0.52+ 0.54 0.48 0.48 0.51 0.54 0.61 0.55 0.52 0.49 0.52 0.53 0.47+ 0.52 0.50 0.49 0.49 0.53 0.53 0.50 0.49 0.44 0.41 0.35 0.48+ 0.50 0.44 0.42 0.43 0.34 0.35 0.40 0.48 0.51 0.38 0.48 0.45+ 0.49 0.50 0.53 0.48 0.47 0.51 0.56 0.57 0.54 0.57 0.56 0.54+ 0.57 0.61 0.61 0.60 0.63 0.64 0.62 0.60 0.59 0.56 0.53 0.51+ 0.53 0.53 0.42 0.40 0.25 0.26 0.36 0.37 0.49 0.53 0.53 0.57+ 0.48 0.55 0.48 0.46 0.49 0.59 0.66 0.64 0.59 0.59 0.55 0.54+ 0.49 0.49 0.46 0.53 0.52 0.50 0.48 0.53 0.54 0.51 0.52 0.50+ 0.48 0.42 0.53 0.56 0.51 0.53 0.53 0.51 0.46 0.47 0.39 0.00+ TIME= WEEK+ MULT= 1.00+ ADD = 0.00X Weekly Load TJ = 12.12X Each figure represents average hourly flow rate in std. m3/sX Profile date = 11 August 2008 - 17 August 2008X ==========================================================X DELIVERY POINT HOROTIU X CODERAMP HTEEXT.V1= 0.00+ 0.00 0.00 0.05 0.06 0.13 0.12 0.14 0.14 0.17 0.13 0.17 0.27+ 0.21 0.19 0.20 0.13 0.10 0.02 0.04 0.02 0.01 0.01 0.00 0.00+ 0.00 0.00 0.00 0.01 0.12 0.16 0.17 0.15 0.20 0.28 0.26 0.30+ 0.06 0.30 0.26 0.26 0.14 0.02 0.02 0.03 0.03 0.02 0.01 0.00+ 0.00 0.00 0.00 0.02 0.12 0.16 0.21 0.18 0.20 0.28 0.25 0.25+ 0.27 0.26 0.28 0.10 0.10 0.02 0.01 0.03 0.02 0.01 0.00 0.00+ 0.00 0.00 0.00 0.01 0.12 0.16 0.17 0.14 0.26 0.28 0.21 0.26+ 0.27 0.26 0.24 0.19 0.14 0.00 0.00 0.00 0.00 0.00 0.00 0.00+ 0.00 0.00 0.00 0.01 0.11 0.15 0.17 0.16 0.18 0.20 0.27 0.32+ 0.30 0.24 0.24 0.23 0.21 0.13 0.13 0.13 0.05 0.00 0.00 0.00+ 0.00 0.00 0.00 0.00 0.05 0.15 0.15 0.11 0.07 0.05 0.01 0.00+ 0.00 0.00 0.00 0.00 0.00 0.00 0.00 0.00 0.00 0.00 0.00 0.00+ 0.00 0.00 0.00 0.00 0.00 0.00 0.00 0.00 0.00 0.00 0.00 0.00+ 0.00 0.00 0.00 0.00 0.00 0.00 0.00 0.00 0.00 0.00 0.00 0.00+ TIME= WEEK+ MULT= 1.00+ ADD = 0.00X Weekly Load TJ = 2.13X Each figure represents average hourly flow rate in std. m3/sX Profile date = 11 August 2008 - 17 August 2008X ==========================================================X DELIVERY POINT KIWITAHI (KIWI FERTILISER)X CODERAMP KIWEXT.V1= 0.00+ 0.00 0.00 0.00 0.00 0.00 0.01 0.02 0.01 0.01 0.01 0.02 0.00+ 0.01 0.02 0.00 0.00 0.02 0.01 0.01 0.00 0.01 0.01 0.00 0.01+ 0.00 0.00 0.00 0.00 0.01 0.00 0.00 0.00 0.00 0.00 0.01 0.00+ 0.00 0.00 0.00 0.02 0.01 0.00 0.02 0.01 0.01 0.02 0.01 0.01+ 0.02 0.01 0.00 0.00 0.00 0.00 0.01 0.00 0.00 0.01 0.02 0.00+ 0.02 0.01 0.00 0.02 0.01 0.01 0.02 0.00 0.01 0.01 0.00 0.02+ 0.00 0.00 0.00 0.00 0.00 0.00 0.01 0.01 0.02 0.00 0.01 0.02+ 0.00 0.01 0.01 0.00 0.01 0.00 0.01 0.01 0.00 0.00 0.00 0.00+ 0.00 0.00 0.00 0.00 0.00 0.00 0.01 0.01 0.02 0.00 0.01 0.02+ 0.00 0.00 0.00 0.00 0.00 0.00 0.00 0.00 0.00 0.00 0.00 0.00+ 0.00 0.00 0.00 0.00 0.00 0.00 0.00 0.00 0.00 0.00 0.00 0.00+ 0.00 0.00 0.00 0.00 0.00 0.00 0.00 0.00 0.00 0.00 0.00 0.00+ 0.00 0.00 0.00 0.00 0.00 0.00 0.00 0.00 0.00 0.00 0.00 0.00+ 0.00 0.00 0.00 0.00 0.00 0.00 0.00 0.00 0.00 0.00 0.00 0.00+ TIME= WEEK+ MULT= 1.00+ ADD = 0.00X Weekly Load TJ = 0.13X Each figure represents average hourly flow rate in std. m3/sX Profile date = 11 August 2008 - 17 August 2008X ==========================================================

X DELIVERY POINT KIWITAHI (PEROXIDE)X CODERAMP DUPEXT.V1= 0.28+ 0.28 0.27 0.28 0.28 0.28 0.27 0.27 0.26 0.27 0.27 0.27 0.27+ 0.27 0.26 0.27 0.26 0.27 0.27 0.29 0.29 0.29 0.28 0.29 0.28+ 0.28 0.28 0.28 0.27 0.28 0.28 0.27 0.28 0.27 0.26 0.27 0.27+ 0.26 0.27 0.27 0.29 0.28 0.28 0.29 0.28 0.28 0.27 0.27 0.27+ 0.27 0.28 0.28 0.28 0.27 0.27 0.27 0.27 0.26 0.27 0.26 0.27+ 0.28 0.29 0.29 0.28 0.29 0.28 0.28 0.27 0.28 0.28 0.27 0.28+ 0.27 0.28 0.28 0.27 0.26 0.27 0.27 0.27 0.27 0.26 0.27 0.27+ 0.27 0.27 0.27 0.27 0.29 0.29 0.29 0.28 0.28 0.28 0.28 0.27+ 0.28 0.28 0.28 0.27 0.28 0.27 0.27 0.27 0.27 0.27 0.11 0.03+ 0.09 0.15 0.19 0.21 0.25 0.26 0.26 0.26 0.26 0.26 0.26 0.25+ 0.25 0.25 0.25 0.25 0.25 0.26 0.25 0.24 0.25 0.24 0.25 0.25+ 0.26 0.25 0.25 0.24 0.25 0.25 0.25 0.24 0.25 0.25 0.25 0.24+ 0.25 0.25 0.24 0.25 0.24 0.25 0.24 0.25 0.25 0.26 0.26 0.26+ 0.26 0.27 0.27 0.27 0.28 0.28 0.29 0.28 0.28 0.28 0.28 0.27+ TIME= WEEK+ MULT= 1.00+ ADD = 0.00X Weekly Load TJ = 6.59X Each figure represents average hourly flow rate in std. m3/sX Profile date = 11 August 2008 - 17 August 2008X ==========================================================X DELIVERY POINT MORRINSVILLEX CODERAMP MDIEXT.V1= 0.03+ 0.03 0.03 0.03 0.03 0.03 0.04 0.09 0.10 0.09 0.06 0.04 0.03+ 0.04 0.06 0.06 0.06 0.06 0.10 0.13 0.11 0.09 0.08 0.05 0.04+ 0.04 0.03 0.03 0.03 0.03 0.03 0.08 0.08 0.07 0.05 0.05 0.05+ 0.05 0.05 0.04 0.04 0.05 0.07 0.10 0.08 0.07 0.05 0.04 0.03+ 0.03 0.03 0.02 0.02 0.02 0.02 0.07 0.08 0.07 0.04 0.04 0.04+ 0.04 0.03 0.05 0.05 0.06 0.08 0.11 0.09 0.07 0.06 0.04 0.03+ 0.02 0.02 0.01 0.02 0.02 0.05 0.09 0.10 0.08 0.05 0.03 0.03+ 0.03 0.03 0.03 0.04 0.04 0.07 0.11 0.08 0.07 0.06 0.04 0.03+ 0.03 0.03 0.03 0.03 0.03 0.03 0.07 0.08 0.07 0.05 0.04 0.04+ 0.05 0.06 0.04 0.04 0.06 0.08 0.10 0.07 0.07 0.05 0.04 0.03+ 0.01 0.01 0.01 0.01 0.01 0.02 0.02 0.04 0.06 0.06 0.05 0.04+ 0.04 0.05 0.05 0.06 0.06 0.07 0.07 0.07 0.06 0.05 0.04 0.03+ 0.03 0.02 0.02 0.02 0.02 0.02 0.03 0.04 0.05 0.07 0.07 0.07+ 0.07 0.06 0.05 0.05 0.06 0.07 0.07 0.07 0.06 0.05 0.04 0.01+ TIME= WEEK+ MULT= 1.00+ ADD = 0.00X Weekly Load TJ = 1.23X Each figure represents average hourly flow rate in std. m3/sX Profile date = 11 August 2008 - 17 August 2008X ==========================================================X DELIVERY POINT MORRINSVILLE DAIRY FACTORY X CODERAMP MDFEXT.V1= 0.04+ 0.03 0.02 0.03 0.02 0.02 0.03 0.07 0.06 0.06 0.05 0.05 0.07+ 0.06 0.06 0.07 0.07 0.09 0.06 0.00 0.00 0.00 0.00 0.00 0.00+ 0.00 0.00 0.00 0.07 0.05 0.03 0.03 0.03 0.05 0.06 0.08 0.07+ 0.07 0.12 0.09 0.08 0.07 0.02 0.00 0.00 0.00 0.00 0.00 0.01+ 0.00 0.00 0.00 0.04 0.03 0.06 0.05 0.03 0.03 0.04 0.07 0.07+ 0.06 0.03 0.07 0.09 0.03 0.07 0.05 0.03 0.03 0.03 0.02 0.00+ 0.00 0.00 0.01 0.03 0.03 0.03 0.03 0.03 0.02 0.10 0.12 0.18+ 0.23 0.30 0.24 0.23 0.24 0.11 0.09 0.09 0.09 0.08 0.09 0.06+ 0.02 0.03 0.03 0.02 0.03 0.03 0.02 0.03 0.03 0.04 0.07 0.03+ 0.11 0.13 0.19 0.22 0.22 0.23 0.23 0.23 0.06 0.02 0.03 0.03+ 0.03 0.03 0.03 0.03 0.02 0.03 0.03 0.03 0.04 0.10 0.04 0.05+ 0.06 0.10 0.08 0.02 0.05 0.03 0.03 0.03 0.03 0.03 0.05 0.04+ 0.02 0.02 0.02 0.02 0.03 0.03 0.03 0.03 0.06 0.05 0.07 0.06+ 0.11 0.10 0.09 0.09 0.04 0.03 0.02 0.02 0.03 0.03 0.02 0.56+ TIME= WEEK+ MULT= 1.00+ ADD = 0.00X Weekly Load TJ = 1.47X Each figure represents average hourly flow rate in std. m3/sX Profile date = 11 August 2008 - 17 August 2008X ==========================================================
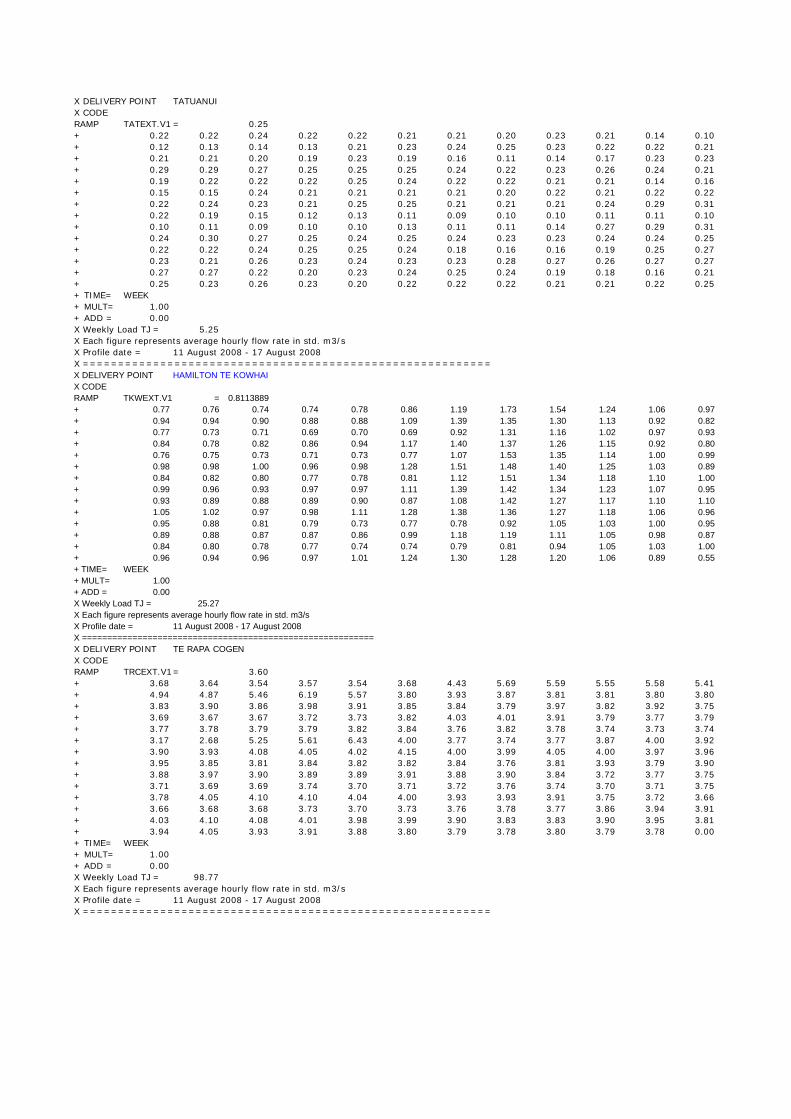
X DELIVERY POINT TATUANUIX CODERAMP TATEXT.V1 = 0.25+ 0.22 0.22 0.24 0.22 0.22 0.21 0.21 0.20 0.23 0.21 0.14 0.10+ 0.12 0.13 0.14 0.13 0.21 0.23 0.24 0.25 0.23 0.22 0.22 0.21+ 0.21 0.21 0.20 0.19 0.23 0.19 0.16 0.11 0.14 0.17 0.23 0.23+ 0.29 0.29 0.27 0.25 0.25 0.25 0.24 0.22 0.23 0.26 0.24 0.21+ 0.19 0.22 0.22 0.22 0.25 0.24 0.22 0.22 0.21 0.21 0.14 0.16+ 0.15 0.15 0.24 0.21 0.21 0.21 0.21 0.20 0.22 0.21 0.22 0.22+ 0.22 0.24 0.23 0.21 0.25 0.25 0.21 0.21 0.21 0.24 0.29 0.31+ 0.22 0.19 0.15 0.12 0.13 0.11 0.09 0.10 0.10 0.11 0.11 0.10+ 0.10 0.11 0.09 0.10 0.10 0.13 0.11 0.11 0.14 0.27 0.29 0.31+ 0.24 0.30 0.27 0.25 0.24 0.25 0.24 0.23 0.23 0.24 0.24 0.25+ 0.22 0.22 0.24 0.25 0.25 0.24 0.18 0.16 0.16 0.19 0.25 0.27+ 0.23 0.21 0.26 0.23 0.24 0.23 0.23 0.28 0.27 0.26 0.27 0.27+ 0.27 0.27 0.22 0.20 0.23 0.24 0.25 0.24 0.19 0.18 0.16 0.21+ 0.25 0.23 0.26 0.23 0.20 0.22 0.22 0.22 0.21 0.21 0.22 0.25+ TIME= WEEK+ MULT= 1.00+ ADD = 0.00X Weekly Load TJ = 5.25X Each figure represents average hourly flow rate in std. m3/sX Profile date = 11 August 2008 - 17 August 2008X ==========================================================X DELIVERY POINT HAMILTON TE KOWHAI X CODERAMP TKWEXT.V1 = 0.8113889+ 0.77 0.76 0.74 0.74 0.78 0.86 1.19 1.73 1.54 1.24 1.06 0.97+ 0.94 0.94 0.90 0.88 0.88 1.09 1.39 1.35 1.30 1.13 0.92 0.82+ 0.77 0.73 0.71 0.69 0.70 0.69 0.92 1.31 1.16 1.02 0.97 0.93+ 0.84 0.78 0.82 0.86 0.94 1.17 1.40 1.37 1.26 1.15 0.92 0.80+ 0.76 0.75 0.73 0.71 0.73 0.77 1.07 1.53 1.35 1.14 1.00 0.99+ 0.98 0.98 1.00 0.96 0.98 1.28 1.51 1.48 1.40 1.25 1.03 0.89+ 0.84 0.82 0.80 0.77 0.78 0.81 1.12 1.51 1.34 1.18 1.10 1.00+ 0.99 0.96 0.93 0.97 0.97 1.11 1.39 1.42 1.34 1.23 1.07 0.95+ 0.93 0.89 0.88 0.89 0.90 0.87 1.08 1.42 1.27 1.17 1.10 1.10+ 1.05 1.02 0.97 0.98 1.11 1.28 1.38 1.36 1.27 1.18 1.06 0.96+ 0.95 0.88 0.81 0.79 0.73 0.77 0.78 0.92 1.05 1.03 1.00 0.95+ 0.89 0.88 0.87 0.87 0.86 0.99 1.18 1.19 1.11 1.05 0.98 0.87+ 0.84 0.80 0.78 0.77 0.74 0.74 0.79 0.81 0.94 1.05 1.03 1.00+ 0.96 0.94 0.96 0.97 1.01 1.24 1.30 1.28 1.20 1.06 0.89 0.55+ TIME= WEEK+ MULT= 1.00+ ADD = 0.00X Weekly Load TJ = 25.27X Each figure represents average hourly flow rate in std. m3/sX Profile date = 11 August 2008 - 17 August 2008X ==========================================================X DELIVERY POINT TE RAPA COGEN X CODERAMP TRCEXT.V1= 3.60+ 3.68 3.64 3.54 3.57 3.54 3.68 4.43 5.69 5.59 5.55 5.58 5.41+ 4.94 4.87 5.46 6.19 5.57 3.80 3.93 3.87 3.81 3.81 3.80 3.80+ 3.83 3.90 3.86 3.98 3.91 3.85 3.84 3.79 3.97 3.82 3.92 3.75+ 3.69 3.67 3.67 3.72 3.73 3.82 4.03 4.01 3.91 3.79 3.77 3.79+ 3.77 3.78 3.79 3.79 3.82 3.84 3.76 3.82 3.78 3.74 3.73 3.74+ 3.17 2.68 5.25 5.61 6.43 4.00 3.77 3.74 3.77 3.87 4.00 3.92+ 3.90 3.93 4.08 4.05 4.02 4.15 4.00 3.99 4.05 4.00 3.97 3.96+ 3.95 3.85 3.81 3.84 3.82 3.82 3.84 3.76 3.81 3.93 3.79 3.90+ 3.88 3.97 3.90 3.89 3.89 3.91 3.88 3.90 3.84 3.72 3.77 3.75+ 3.71 3.69 3.69 3.74 3.70 3.71 3.72 3.76 3.74 3.70 3.71 3.75+ 3.78 4.05 4.10 4.10 4.04 4.00 3.93 3.93 3.91 3.75 3.72 3.66+ 3.66 3.68 3.68 3.73 3.70 3.73 3.76 3.78 3.77 3.86 3.94 3.91+ 4.03 4.10 4.08 4.01 3.98 3.99 3.90 3.83 3.83 3.90 3.95 3.81+ 3.94 4.05 3.93 3.91 3.88 3.80 3.79 3.78 3.80 3.79 3.78 0.00+ TIME= WEEK+ MULT= 1.00+ ADD = 0.00X Weekly Load TJ = 98.77X Each figure represents average hourly flow rate in std. m3/sX Profile date = 11 August 2008 - 17 August 2008X ==========================================================

X DELIVERY POINT HAMILTON TEMPLE VIEW X CODERAMP HAMEXT.V1= 0.48+ 0.31 0.24 0.23 0.27 0.37 0.55 1.25 2.08 1.85 1.50 1.19 0.92+ 0.81 0.70 0.62 0.63 0.78 1.27 1.77 1.72 1.59 1.30 0.76 0.32+ 0.15 0.14 0.10 0.07 0.13 0.38 1.04 1.61 1.40 1.23 1.11 1.09+ 0.83 0.68 0.68 0.84 0.97 1.34 1.65 1.63 1.47 1.25 0.85 0.44+ 0.27 0.23 0.25 0.24 0.26 0.44 1.13 1.78 1.52 1.19 0.94 0.86+ 0.96 0.84 1.00 0.90 0.98 1.45 1.80 1.75 1.58 1.36 0.89 0.40+ 0.23 0.16 0.15 0.11 0.16 0.43 1.09 1.74 1.51 1.27 1.03 0.80+ 0.84 0.65 0.56 0.62 0.75 1.16 1.59 1.66 1.52 1.28 0.78 0.33+ 0.12 0.08 0.08 0.00 0.02 0.29 0.99 1.61 1.40 1.10 0.94 0.89+ 0.87 0.67 0.52 0.53 1.01 1.37 1.55 1.45 1.28 1.02 0.62 0.24+ 0.03 0.00 0.00 0.00 0.00 0.05 0.43 0.87 1.07 1.02 0.79 0.58+ 0.41 0.43 0.46 0.64 0.71 1.09 1.39 1.40 1.25 1.11 0.80 0.47+ 0.23 0.13 0.10 0.01 0.01 0.10 0.31 0.68 1.05 1.28 1.23 1.18+ 1.11 1.11 1.20 1.24 1.31 1.57 1.67 1.63 1.48 1.18 0.73 0.00+ TIME= WEEK+ MULT= 1.00+ ADD = 0.00X Weekly Load TJ = 21.08X Each figure represents average hourly flow rate in std. m3/sX Profile date = 11 August 2008 - 17 August 2008X ==========================================================X DELIVERY POINT WAITOAX CODERAMP WTAEXT.V1= 0.31+ 0.32 0.32 0.31 0.31 0.28 0.29 0.31 0.34 0.32 0.32 0.33 0.28+ 0.25 0.27 0.29 0.30 0.32 0.36 0.37 0.38 0.38 0.39 0.38 0.35+ 0.38 0.39 0.37 0.39 0.35 0.34 0.33 0.37 0.36 0.35 0.33 0.28+ 0.31 0.29 0.30 0.31 0.34 0.35 0.35 0.36 0.33 0.36 0.37 0.37+ 0.41 0.42 0.39 0.37 0.33 0.37 0.38 0.36 0.34 0.31 0.26 0.25+ 0.26 0.26 0.26 0.28 0.32 0.34 0.36 0.36 0.36 0.39 0.41 0.41+ 0.42 0.41 0.40 0.38 0.35 0.37 0.36 0.39 0.38 0.35 0.30 0.27+ 0.28 0.27 0.32 0.32 0.33 0.33 0.33 0.33 0.34 0.37 0.38 0.36+ 0.39 0.40 0.39 0.41 0.38 0.36 0.32 0.35 0.35 0.30 0.30 0.33+ 0.32 0.29 0.31 0.32 0.36 0.36 0.38 0.38 0.37 0.40 0.39 0.37+ 0.40 0.40 0.39 0.38 0.35 0.31 0.26 0.25 0.27 0.26 0.25 0.26+ 0.26 0.23 0.22 0.21 0.20 0.22 0.28 0.29 0.29 0.24 0.22 0.22+ 0.20 0.20 0.20 0.22 0.22 0.23 0.21 0.20 0.21 0.19 0.21 0.22+ 0.21 0.18 0.13 0.29 0.19 0.22 0.25 0.23 0.24 0.23 0.23 0.04+ TIME= WEEK+ MULT= 1.00+ ADD = 0.00X Weekly Load TJ = 7.87X Each figure represents average hourly flow rate in std. m3/sX Profile date = 11 August 2008 - 17 August 2008X ==========================================================

X DELIVERY POINT ELTHAMX CODERAMP ELTEXT.V1 = 0.0941667+ 0.09 0.10 0.10 0.10 0.12 0.17 0.20 0.22 0.21 0.20 0.20 0.20+ 0.19 0.19 0.18 0.18 0.19 0.20 0.18 0.17 0.12 0.12 0.13 0.11+ 0.10 0.10 0.10 0.09 0.13 0.16 0.19 0.22 0.20 0.24 0.25 0.22+ 0.20 0.21 0.20 0.18 0.19 0.22 0.20 0.20 0.15 0.13 0.12 0.11+ 0.10 0.11 0.11 0.11 0.12 0.18 0.20 0.24 0.23 0.25 0.23 0.23+ 0.20 0.24 0.21 0.19 0.19 0.21 0.22 0.20 0.12 0.13 0.11 0.10+ 0.11 0.11 0.12 0.11 0.13 0.19 0.22 0.24 0.24 0.27 0.23 0.23+ 0.23 0.22 0.20 0.19 0.19 0.20 0.21 0.21 0.13 0.12 0.11 0.11+ 0.11 0.09 0.09 0.10 0.12 0.21 0.24 0.26 0.25 0.26 0.22 0.22+ 0.21 0.23 0.22 0.19 0.21 0.21 0.20 0.18 0.12 0.11 0.11 0.10+ 0.10 0.09 0.09 0.09 0.11 0.19 0.20 0.21 0.21 0.22 0.20 0.18+ 0.20 0.19 0.18 0.17 0.19 0.19 0.19 0.18 0.13 0.11 0.10 0.09+ 0.08 0.09 0.09 0.09 0.11 0.15 0.18 0.20 0.19 0.22 0.22 0.20+ 0.20 0.19 0.17 0.17 0.14 0.16 0.15 0.12 0.08 0.07 0.06 0.07+ TIME= WEEK+ MULT= 1.00+ ADD = 0.00X Weekly Load TJ = 4.04X Each figure represents average hourly flow rate in std. m3/sX Profile date = 15 June 2009 - 21 June 2009X ==========================================================X DELIVERY POINT INGLEWOODX CODERAMP INGEXT.V1 = 0.01+ 0.00 0.00 0.00 0.00 0.00 0.02 0.04 0.07 0.06 0.06 0.04 0.04+ 0.03 0.02 0.01 0.01 0.02 0.05 0.05 0.05 0.05 0.04 0.02 0.01+ 0.01 0.00 0.01 0.00 0.00 0.03 0.05 0.07 0.07 0.06 0.05 0.05+ 0.04 0.04 0.04 0.03 0.04 0.06 0.07 0.07 0.05 0.04 0.03 0.01+ 0.01 0.01 0.01 0.01 0.01 0.02 0.05 0.09 0.09 0.08 0.06 0.05+ 0.03 0.02 0.02 0.02 0.04 0.06 0.07 0.07 0.06 0.05 0.03 0.02+ 0.01 0.01 0.01 0.01 0.01 0.03 0.06 0.09 0.09 0.08 0.05 0.06+ 0.04 0.03 0.02 0.02 0.04 0.06 0.07 0.06 0.06 0.05 0.03 0.02+ 0.01 0.01 0.01 0.01 0.01 0.03 0.05 0.09 0.09 0.08 0.06 0.05+ 0.04 0.04 0.02 0.02 0.04 0.06 0.06 0.06 0.05 0.04 0.03 0.01+ 0.01 0.01 0.01 0.01 0.01 0.01 0.02 0.05 0.06 0.05 0.03 0.03+ 0.03 0.02 0.02 0.03 0.04 0.06 0.06 0.05 0.05 0.04 0.03 0.02+ 0.01 0.01 0.01 0.01 0.01 0.01 0.01 0.02 0.04 0.04 0.03 0.02+ 0.02 0.02 0.01 0.02 0.04 0.05 0.06 0.06 0.05 0.04 0.02 0.01+ TIME= WEEK+ MULT= 1.00+ ADD = 0.00X Weekly Load TJ = 0.84X Each figure represents average hourly flow rate in std. m3/sX Profile date = 15 June 2009 - 21 June 2009X ==========================================================X DELIVERY POINT NEW PLYMOUTH X CODERAMP NPGEXT.V1= 0.54+ 0.48 0.36 0.37 0.39 0.38 0.46 0.73 1.18 1.24 1.06 0.87 0.79+ 0.76 0.78 0.79 0.80 0.98 1.20 1.39 1.33 1.22 1.07 0.83 0.61+ 0.51 0.48 0.44 0.48 0.45 0.52 0.84 1.33 1.34 1.17 1.01 0.92+ 0.88 0.88 0.79 0.83 0.99 1.29 1.62 1.66 1.54 1.36 1.01 0.73+ 0.64 0.58 0.55 0.57 0.61 0.68 0.97 1.57 1.76 1.53 1.28 1.10+ 0.99 0.90 0.80 0.84 1.00 1.33 1.63 1.66 1.58 1.40 1.09 0.78+ 0.68 0.62 0.58 0.60 0.61 0.67 0.97 1.57 1.78 1.50 1.23 1.05+ 0.90 0.85 0.77 0.83 1.00 1.31 1.59 1.61 1.52 1.37 1.05 0.80+ 0.68 0.63 0.61 0.62 0.62 0.69 1.01 1.54 1.80 1.51 1.19 0.97+ 0.82 0.81 0.82 0.81 0.90 1.19 1.37 1.33 1.26 1.14 0.91 0.70+ 0.52 0.49 0.41 0.43 0.41 0.46 0.53 0.77 1.06 1.08 0.88 0.75+ 0.64 0.58 0.57 0.59 0.77 1.17 1.35 1.24 1.13 1.03 0.86 0.64+ 0.52 0.45 0.41 0.41 0.39 0.42 0.50 0.74 1.03 1.18 1.00 0.84+ 0.70 0.61 0.59 0.61 0.80 1.18 1.44 1.42 1.26 1.08 0.83 0.56+ TIME= WEEK+ MULT= 1.00+ ADD = 0.00X Weekly Load TJ = 22.47X Each figure represents average hourly flow rate in std. m3/sX Profile date = 15 June 2009 - 21 June 2009X ==========================================================

X DELIVERY POINT STRATFORD X CODERAMP SFDEXT.V1= 0.03+ 0.03 0.03 0.02 0.02 0.03 0.05 0.10 0.16 0.15 0.12 0.10 0.10+ 0.09 0.11 0.08 0.09 0.09 0.14 0.13 0.12 0.11 0.10 0.07 0.05+ 0.06 0.08 0.05 0.03 0.04 0.07 0.10 0.13 0.14 0.14 0.11 0.10+ 0.10 0.12 0.10 0.10 0.11 0.15 0.14 0.13 0.14 0.11 0.08 0.05+ 0.08 0.07 0.04 0.04 0.05 0.08 0.13 0.17 0.17 0.15 0.13 0.10+ 0.08 0.10 0.09 0.09 0.10 0.13 0.16 0.15 0.12 0.09 0.06 0.04+ 0.04 0.06 0.05 0.04 0.05 0.07 0.12 0.16 0.17 0.15 0.13 0.11+ 0.09 0.09 0.09 0.10 0.11 0.13 0.13 0.14 0.14 0.12 0.08 0.07+ 0.07 0.06 0.06 0.06 0.05 0.08 0.12 0.17 0.18 0.15 0.12 0.10+ 0.11 0.09 0.08 0.08 0.09 0.10 0.11 0.11 0.10 0.08 0.06 0.05+ 0.04 0.04 0.03 0.03 0.04 0.04 0.05 0.08 0.11 0.11 0.10 0.09+ 0.08 0.08 0.09 0.09 0.10 0.12 0.12 0.12 0.11 0.09 0.07 0.05+ 0.04 0.04 0.04 0.04 0.04 0.04 0.05 0.07 0.10 0.10 0.08 0.07+ 0.06 0.06 0.06 0.06 0.10 0.11 0.14 0.11 0.10 0.08 0.06 0.04+ TIME= WEEK+ MULT= 1.00+ ADD = 0.00X Weekly Load TJ = 2.18X Each figure represents average hourly flow rate in std. m3/sX Profile date = 15 June 2009 - 21 June 2009X ==========================================================X DELIVERY POINT WAITARAX CODERAMP WIGEXT.V1= 0.04+ 0.03 0.03 0.04 0.05 0.04 0.05 0.07 0.09 0.09 0.11 0.08 0.08+ 0.07 0.07 0.07 0.07 0.10 0.13 0.14 0.12 0.11 0.09 0.06 0.04+ 0.04 0.04 0.03 0.05 0.04 0.05 0.07 0.10 0.10 0.10 0.08 0.08+ 0.07 0.07 0.07 0.09 0.11 0.15 0.16 0.14 0.14 0.12 0.09 0.07+ 0.06 0.06 0.05 0.07 0.07 0.07 0.10 0.14 0.16 0.15 0.11 0.09+ 0.08 0.07 0.07 0.08 0.11 0.14 0.17 0.17 0.14 0.12 0.11 0.07+ 0.06 0.06 0.06 0.07 0.07 0.08 0.11 0.14 0.15 0.12 0.10 0.09+ 0.08 0.07 0.07 0.09 0.12 0.15 0.17 0.16 0.16 0.14 0.12 0.09+ 0.07 0.07 0.07 0.08 0.08 0.09 0.12 0.15 0.17 0.15 0.10 0.10+ 0.08 0.08 0.08 0.10 0.13 0.16 0.16 0.15 0.15 0.13 0.11 0.09+ 0.07 0.07 0.07 0.06 0.07 0.07 0.09 0.10 0.12 0.11 0.10 0.08+ 0.08 0.07 0.07 0.07 0.10 0.13 0.14 0.13 0.12 0.11 0.10 0.08+ 0.07 0.06 0.06 0.06 0.06 0.06 0.08 0.09 0.11 0.11 0.09 0.08+ 0.07 0.06 0.06 0.07 0.10 0.14 0.15 0.14 0.12 0.10 0.08 0.07+ TIME= WEEK+ MULT= 1.00+ ADD = 0.00X Weekly Load TJ = 2.29X Each figure represents average hourly flow rate in std. m3/sX Profile date = 15 June 2009 - 21 June 2009X ==========================================================
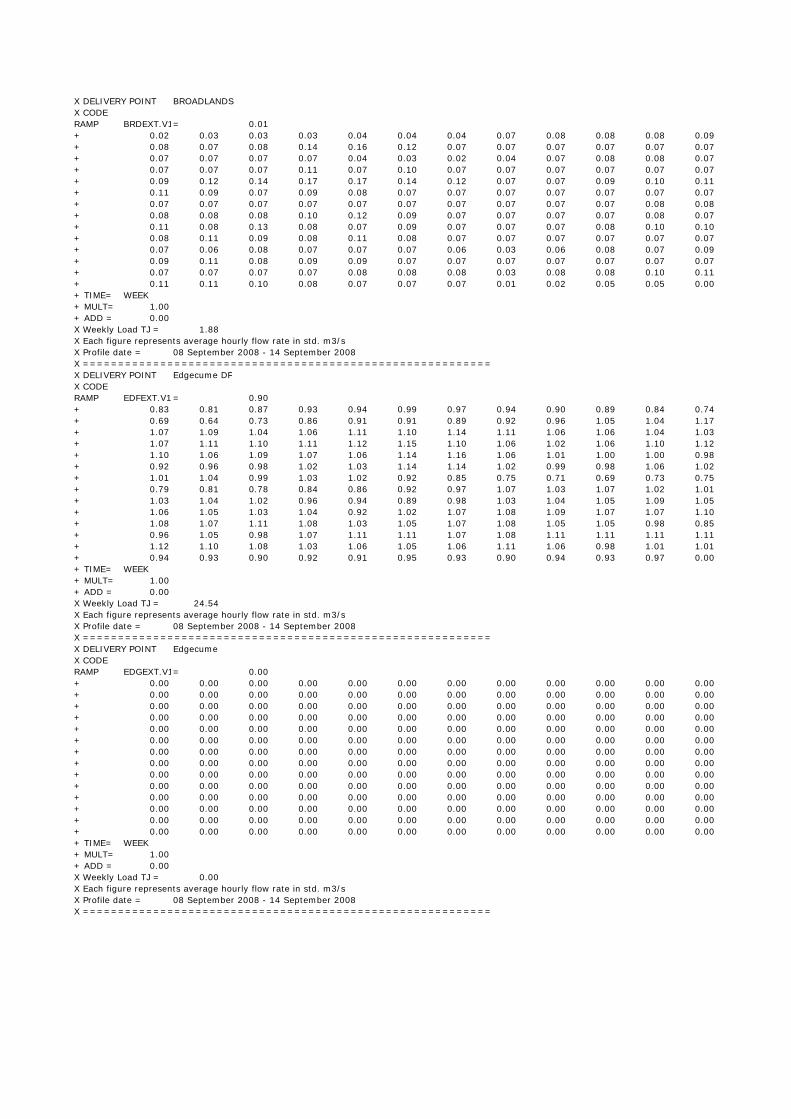
X DELIVERY POINT BROADLANDS X CODERAMP BRDEXT.V1= 0.01+ 0.02 0.03 0.03 0.03 0.04 0.04 0.04 0.07 0.08 0.08 0.08 0.09+ 0.08 0.07 0.08 0.14 0.16 0.12 0.07 0.07 0.07 0.07 0.07 0.07+ 0.07 0.07 0.07 0.07 0.04 0.03 0.02 0.04 0.07 0.08 0.08 0.07+ 0.07 0.07 0.07 0.11 0.07 0.10 0.07 0.07 0.07 0.07 0.07 0.07+ 0.09 0.12 0.14 0.17 0.17 0.14 0.12 0.07 0.07 0.09 0.10 0.11+ 0.11 0.09 0.07 0.09 0.08 0.07 0.07 0.07 0.07 0.07 0.07 0.07+ 0.07 0.07 0.07 0.07 0.07 0.07 0.07 0.07 0.07 0.07 0.08 0.08+ 0.08 0.08 0.08 0.10 0.12 0.09 0.07 0.07 0.07 0.07 0.08 0.07+ 0.11 0.08 0.13 0.08 0.07 0.09 0.07 0.07 0.07 0.08 0.10 0.10+ 0.08 0.11 0.09 0.08 0.11 0.08 0.07 0.07 0.07 0.07 0.07 0.07+ 0.07 0.06 0.08 0.07 0.07 0.07 0.06 0.03 0.06 0.08 0.07 0.09+ 0.09 0.11 0.08 0.09 0.09 0.07 0.07 0.07 0.07 0.07 0.07 0.07+ 0.07 0.07 0.07 0.07 0.08 0.08 0.08 0.03 0.08 0.08 0.10 0.11+ 0.11 0.11 0.10 0.08 0.07 0.07 0.07 0.01 0.02 0.05 0.05 0.00+ TIME= WEEK+ MULT= 1.00+ ADD = 0.00X Weekly Load TJ = 1.88X Each figure represents average hourly flow rate in std. m3/sX Profile date = 08 September 2008 - 14 September 2008X ==========================================================X DELIVERY POINT Edgecume DFX CODERAMP EDFEXT.V1= 0.90+ 0.83 0.81 0.87 0.93 0.94 0.99 0.97 0.94 0.90 0.89 0.84 0.74+ 0.69 0.64 0.73 0.86 0.91 0.91 0.89 0.92 0.96 1.05 1.04 1.17+ 1.07 1.09 1.04 1.06 1.11 1.10 1.14 1.11 1.06 1.06 1.04 1.03+ 1.07 1.11 1.10 1.11 1.12 1.15 1.10 1.06 1.02 1.06 1.10 1.12+ 1.10 1.06 1.09 1.07 1.06 1.14 1.16 1.06 1.01 1.00 1.00 0.98+ 0.92 0.96 0.98 1.02 1.03 1.14 1.14 1.02 0.99 0.98 1.06 1.02+ 1.01 1.04 0.99 1.03 1.02 0.92 0.85 0.75 0.71 0.69 0.73 0.75+ 0.79 0.81 0.78 0.84 0.86 0.92 0.97 1.07 1.03 1.07 1.02 1.01+ 1.03 1.04 1.02 0.96 0.94 0.89 0.98 1.03 1.04 1.05 1.09 1.05+ 1.06 1.05 1.03 1.04 0.92 1.02 1.07 1.08 1.09 1.07 1.07 1.10+ 1.08 1.07 1.11 1.08 1.03 1.05 1.07 1.08 1.05 1.05 0.98 0.85+ 0.96 1.05 0.98 1.07 1.11 1.11 1.07 1.08 1.11 1.11 1.11 1.11+ 1.12 1.10 1.08 1.03 1.06 1.05 1.06 1.11 1.06 0.98 1.01 1.01+ 0.94 0.93 0.90 0.92 0.91 0.95 0.93 0.90 0.94 0.93 0.97 0.00+ TIME= WEEK+ MULT= 1.00+ ADD = 0.00X Weekly Load TJ = 24.54X Each figure represents average hourly flow rate in std. m3/sX Profile date = 08 September 2008 - 14 September 2008X ==========================================================X DELIVERY POINT EdgecumeX CODERAMP EDGEXT.V1= 0.00+ 0.00 0.00 0.00 0.00 0.00 0.00 0.00 0.00 0.00 0.00 0.00 0.00+ 0.00 0.00 0.00 0.00 0.00 0.00 0.00 0.00 0.00 0.00 0.00 0.00+ 0.00 0.00 0.00 0.00 0.00 0.00 0.00 0.00 0.00 0.00 0.00 0.00+ 0.00 0.00 0.00 0.00 0.00 0.00 0.00 0.00 0.00 0.00 0.00 0.00+ 0.00 0.00 0.00 0.00 0.00 0.00 0.00 0.00 0.00 0.00 0.00 0.00+ 0.00 0.00 0.00 0.00 0.00 0.00 0.00 0.00 0.00 0.00 0.00 0.00+ 0.00 0.00 0.00 0.00 0.00 0.00 0.00 0.00 0.00 0.00 0.00 0.00+ 0.00 0.00 0.00 0.00 0.00 0.00 0.00 0.00 0.00 0.00 0.00 0.00+ 0.00 0.00 0.00 0.00 0.00 0.00 0.00 0.00 0.00 0.00 0.00 0.00+ 0.00 0.00 0.00 0.00 0.00 0.00 0.00 0.00 0.00 0.00 0.00 0.00+ 0.00 0.00 0.00 0.00 0.00 0.00 0.00 0.00 0.00 0.00 0.00 0.00+ 0.00 0.00 0.00 0.00 0.00 0.00 0.00 0.00 0.00 0.00 0.00 0.00+ 0.00 0.00 0.00 0.00 0.00 0.00 0.00 0.00 0.00 0.00 0.00 0.00+ 0.00 0.00 0.00 0.00 0.00 0.00 0.00 0.00 0.00 0.00 0.00 0.00+ TIME= WEEK+ MULT= 1.00+ ADD = 0.00X Weekly Load TJ = 0.00X Each figure represents average hourly flow rate in std. m3/sX Profile date = 08 September 2008 - 14 September 2008X ==========================================================
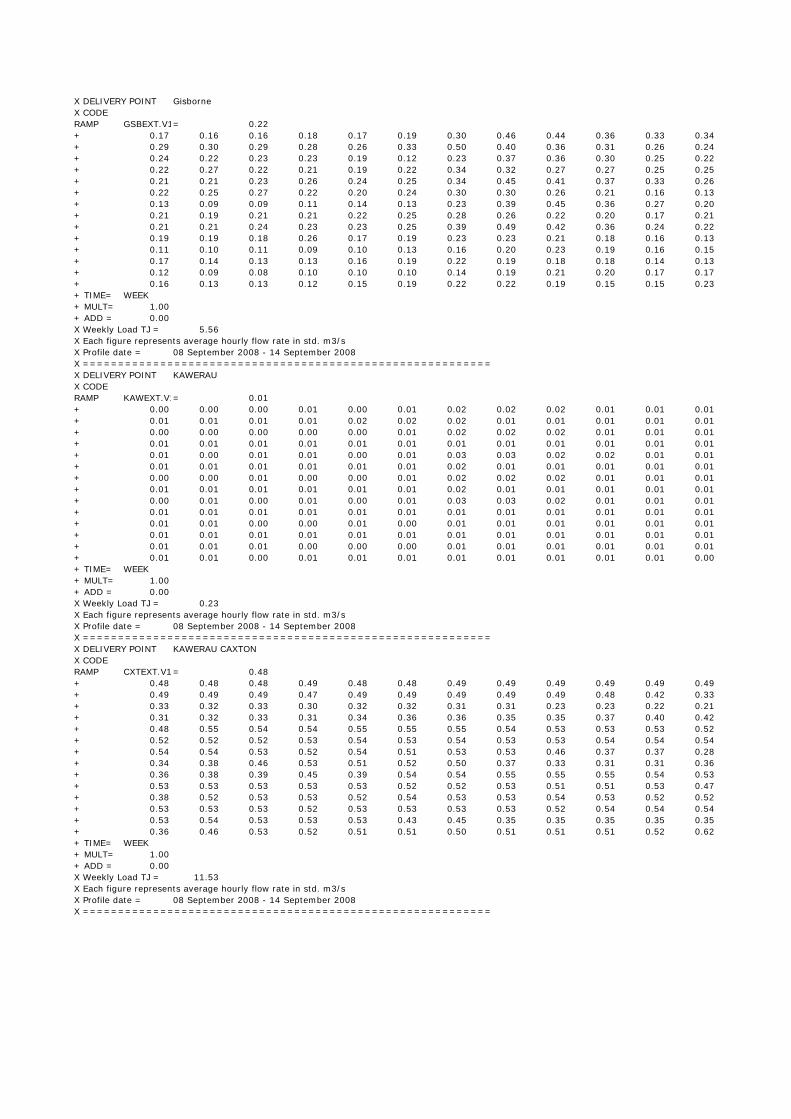
X DELIVERY POINT GisborneX CODERAMP GSBEXT.V1= 0.22+ 0.17 0.16 0.16 0.18 0.17 0.19 0.30 0.46 0.44 0.36 0.33 0.34+ 0.29 0.30 0.29 0.28 0.26 0.33 0.50 0.40 0.36 0.31 0.26 0.24+ 0.24 0.22 0.23 0.23 0.19 0.12 0.23 0.37 0.36 0.30 0.25 0.22+ 0.22 0.27 0.22 0.21 0.19 0.22 0.34 0.32 0.27 0.27 0.25 0.25+ 0.21 0.21 0.23 0.26 0.24 0.25 0.34 0.45 0.41 0.37 0.33 0.26+ 0.22 0.25 0.27 0.22 0.20 0.24 0.30 0.30 0.26 0.21 0.16 0.13+ 0.13 0.09 0.09 0.11 0.14 0.13 0.23 0.39 0.45 0.36 0.27 0.20+ 0.21 0.19 0.21 0.21 0.22 0.25 0.28 0.26 0.22 0.20 0.17 0.21+ 0.21 0.21 0.24 0.23 0.23 0.25 0.39 0.49 0.42 0.36 0.24 0.22+ 0.19 0.19 0.18 0.26 0.17 0.19 0.23 0.23 0.21 0.18 0.16 0.13+ 0.11 0.10 0.11 0.09 0.10 0.13 0.16 0.20 0.23 0.19 0.16 0.15+ 0.17 0.14 0.13 0.13 0.16 0.19 0.22 0.19 0.18 0.18 0.14 0.13+ 0.12 0.09 0.08 0.10 0.10 0.10 0.14 0.19 0.21 0.20 0.17 0.17+ 0.16 0.13 0.13 0.12 0.15 0.19 0.22 0.22 0.19 0.15 0.15 0.23+ TIME= WEEK+ MULT= 1.00+ ADD = 0.00X Weekly Load TJ = 5.56X Each figure represents average hourly flow rate in std. m3/sX Profile date = 08 September 2008 - 14 September 2008X ==========================================================X DELIVERY POINT KAWERAUX CODERAMP KAWEXT.V1= 0.01+ 0.00 0.00 0.00 0.01 0.00 0.01 0.02 0.02 0.02 0.01 0.01 0.01+ 0.01 0.01 0.01 0.01 0.02 0.02 0.02 0.01 0.01 0.01 0.01 0.01+ 0.00 0.00 0.00 0.00 0.00 0.01 0.02 0.02 0.02 0.01 0.01 0.01+ 0.01 0.01 0.01 0.01 0.01 0.01 0.01 0.01 0.01 0.01 0.01 0.01+ 0.01 0.00 0.01 0.01 0.00 0.01 0.03 0.03 0.02 0.02 0.01 0.01+ 0.01 0.01 0.01 0.01 0.01 0.01 0.02 0.01 0.01 0.01 0.01 0.01+ 0.00 0.00 0.01 0.00 0.00 0.01 0.02 0.02 0.02 0.01 0.01 0.01+ 0.01 0.01 0.01 0.01 0.01 0.01 0.02 0.01 0.01 0.01 0.01 0.01+ 0.00 0.01 0.00 0.01 0.00 0.01 0.03 0.03 0.02 0.01 0.01 0.01+ 0.01 0.01 0.01 0.01 0.01 0.01 0.01 0.01 0.01 0.01 0.01 0.01+ 0.01 0.01 0.00 0.00 0.01 0.00 0.01 0.01 0.01 0.01 0.01 0.01+ 0.01 0.01 0.01 0.01 0.01 0.01 0.01 0.01 0.01 0.01 0.01 0.01+ 0.01 0.01 0.01 0.00 0.00 0.00 0.01 0.01 0.01 0.01 0.01 0.01+ 0.01 0.01 0.00 0.01 0.01 0.01 0.01 0.01 0.01 0.01 0.01 0.00+ TIME= WEEK+ MULT= 1.00+ ADD = 0.00X Weekly Load TJ = 0.23X Each figure represents average hourly flow rate in std. m3/sX Profile date = 08 September 2008 - 14 September 2008X ==========================================================X DELIVERY POINT KAWERAU CAXTONX CODERAMP CXTEXT.V1= 0.48+ 0.48 0.48 0.48 0.49 0.48 0.48 0.49 0.49 0.49 0.49 0.49 0.49+ 0.49 0.49 0.49 0.47 0.49 0.49 0.49 0.49 0.49 0.48 0.42 0.33+ 0.33 0.32 0.33 0.30 0.32 0.32 0.31 0.31 0.23 0.23 0.22 0.21+ 0.31 0.32 0.33 0.31 0.34 0.36 0.36 0.35 0.35 0.37 0.40 0.42+ 0.48 0.55 0.54 0.54 0.55 0.55 0.55 0.54 0.53 0.53 0.53 0.52+ 0.52 0.52 0.52 0.53 0.54 0.53 0.54 0.53 0.53 0.54 0.54 0.54+ 0.54 0.54 0.53 0.52 0.54 0.51 0.53 0.53 0.46 0.37 0.37 0.28+ 0.34 0.38 0.46 0.53 0.51 0.52 0.50 0.37 0.33 0.31 0.31 0.36+ 0.36 0.38 0.39 0.45 0.39 0.54 0.54 0.55 0.55 0.55 0.54 0.53+ 0.53 0.53 0.53 0.53 0.53 0.52 0.52 0.53 0.51 0.51 0.53 0.47+ 0.38 0.52 0.53 0.53 0.52 0.54 0.53 0.53 0.54 0.53 0.52 0.52+ 0.53 0.53 0.53 0.52 0.53 0.53 0.53 0.53 0.52 0.54 0.54 0.54+ 0.53 0.54 0.53 0.53 0.53 0.43 0.45 0.35 0.35 0.35 0.35 0.35+ 0.36 0.46 0.53 0.52 0.51 0.51 0.50 0.51 0.51 0.51 0.52 0.62+ TIME= WEEK+ MULT= 1.00+ ADD = 0.00X Weekly Load TJ = 11.53X Each figure represents average hourly flow rate in std. m3/sX Profile date = 08 September 2008 - 14 September 2008X ==========================================================
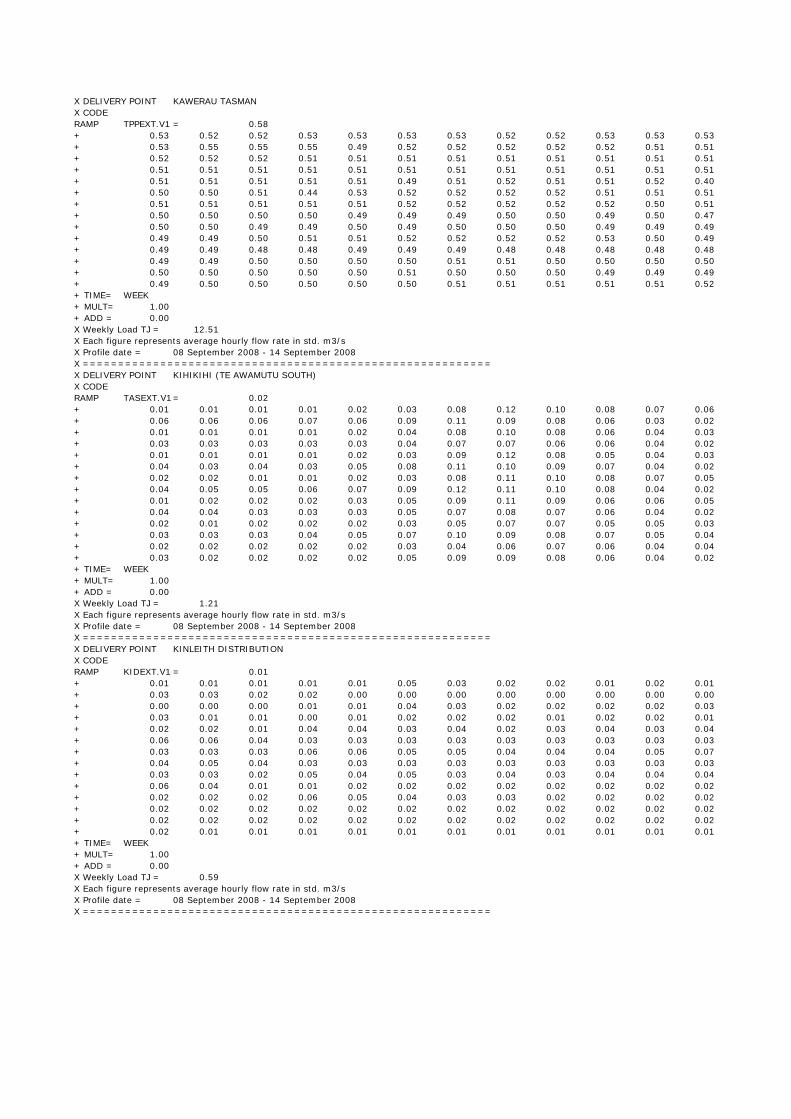
X DELIVERY POINT KAWERAU TASMANX CODERAMP TPPEXT.V1 = 0.58+ 0.53 0.52 0.52 0.53 0.53 0.53 0.53 0.52 0.52 0.53 0.53 0.53+ 0.53 0.55 0.55 0.55 0.49 0.52 0.52 0.52 0.52 0.52 0.51 0.51+ 0.52 0.52 0.52 0.51 0.51 0.51 0.51 0.51 0.51 0.51 0.51 0.51+ 0.51 0.51 0.51 0.51 0.51 0.51 0.51 0.51 0.51 0.51 0.51 0.51+ 0.51 0.51 0.51 0.51 0.51 0.49 0.51 0.52 0.51 0.51 0.52 0.40+ 0.50 0.50 0.51 0.44 0.53 0.52 0.52 0.52 0.52 0.51 0.51 0.51+ 0.51 0.51 0.51 0.51 0.51 0.52 0.52 0.52 0.52 0.52 0.50 0.51+ 0.50 0.50 0.50 0.50 0.49 0.49 0.49 0.50 0.50 0.49 0.50 0.47+ 0.50 0.50 0.49 0.49 0.50 0.49 0.50 0.50 0.50 0.49 0.49 0.49+ 0.49 0.49 0.50 0.51 0.51 0.52 0.52 0.52 0.52 0.53 0.50 0.49+ 0.49 0.49 0.48 0.48 0.49 0.49 0.49 0.48 0.48 0.48 0.48 0.48+ 0.49 0.49 0.50 0.50 0.50 0.50 0.51 0.51 0.50 0.50 0.50 0.50+ 0.50 0.50 0.50 0.50 0.50 0.51 0.50 0.50 0.50 0.49 0.49 0.49+ 0.49 0.50 0.50 0.50 0.50 0.50 0.51 0.51 0.51 0.51 0.51 0.52+ TIME= WEEK+ MULT= 1.00+ ADD = 0.00X Weekly Load TJ = 12.51X Each figure represents average hourly flow rate in std. m3/sX Profile date = 08 September 2008 - 14 September 2008X ==========================================================X DELIVERY POINT KIHIKIHI (TE AWAMUTU SOUTH)X CODERAMP TASEXT.V1= 0.02+ 0.01 0.01 0.01 0.01 0.02 0.03 0.08 0.12 0.10 0.08 0.07 0.06+ 0.06 0.06 0.06 0.07 0.06 0.09 0.11 0.09 0.08 0.06 0.03 0.02+ 0.01 0.01 0.01 0.01 0.02 0.04 0.08 0.10 0.08 0.06 0.04 0.03+ 0.03 0.03 0.03 0.03 0.03 0.04 0.07 0.07 0.06 0.06 0.04 0.02+ 0.01 0.01 0.01 0.01 0.02 0.03 0.09 0.12 0.08 0.05 0.04 0.03+ 0.04 0.03 0.04 0.03 0.05 0.08 0.11 0.10 0.09 0.07 0.04 0.02+ 0.02 0.02 0.01 0.01 0.02 0.03 0.08 0.11 0.10 0.08 0.07 0.05+ 0.04 0.05 0.05 0.06 0.07 0.09 0.12 0.11 0.10 0.08 0.04 0.02+ 0.01 0.02 0.02 0.02 0.03 0.05 0.09 0.11 0.09 0.06 0.06 0.05+ 0.04 0.04 0.03 0.03 0.03 0.05 0.07 0.08 0.07 0.06 0.04 0.02+ 0.02 0.01 0.02 0.02 0.02 0.03 0.05 0.07 0.07 0.05 0.05 0.03+ 0.03 0.03 0.03 0.04 0.05 0.07 0.10 0.09 0.08 0.07 0.05 0.04+ 0.02 0.02 0.02 0.02 0.02 0.03 0.04 0.06 0.07 0.06 0.04 0.04+ 0.03 0.02 0.02 0.02 0.02 0.05 0.09 0.09 0.08 0.06 0.04 0.02+ TIME= WEEK+ MULT= 1.00+ ADD = 0.00X Weekly Load TJ = 1.21X Each figure represents average hourly flow rate in std. m3/sX Profile date = 08 September 2008 - 14 September 2008X ==========================================================X DELIVERY POINT KINLEITH DISTRIBUTIONX CODERAMP KIDEXT.V1 = 0.01+ 0.01 0.01 0.01 0.01 0.01 0.05 0.03 0.02 0.02 0.01 0.02 0.01+ 0.03 0.03 0.02 0.02 0.00 0.00 0.00 0.00 0.00 0.00 0.00 0.00+ 0.00 0.00 0.00 0.01 0.01 0.04 0.03 0.02 0.02 0.02 0.02 0.03+ 0.03 0.01 0.01 0.00 0.01 0.02 0.02 0.02 0.01 0.02 0.02 0.01+ 0.02 0.02 0.01 0.04 0.04 0.03 0.04 0.02 0.03 0.04 0.03 0.04+ 0.06 0.06 0.04 0.03 0.03 0.03 0.03 0.03 0.03 0.03 0.03 0.03+ 0.03 0.03 0.03 0.06 0.06 0.05 0.05 0.04 0.04 0.04 0.05 0.07+ 0.04 0.05 0.04 0.03 0.03 0.03 0.03 0.03 0.03 0.03 0.03 0.03+ 0.03 0.03 0.02 0.05 0.04 0.05 0.03 0.04 0.03 0.04 0.04 0.04+ 0.06 0.04 0.01 0.01 0.02 0.02 0.02 0.02 0.02 0.02 0.02 0.02+ 0.02 0.02 0.02 0.06 0.05 0.04 0.03 0.03 0.02 0.02 0.02 0.02+ 0.02 0.02 0.02 0.02 0.02 0.02 0.02 0.02 0.02 0.02 0.02 0.02+ 0.02 0.02 0.02 0.02 0.02 0.02 0.02 0.02 0.02 0.02 0.02 0.02+ 0.02 0.01 0.01 0.01 0.01 0.01 0.01 0.01 0.01 0.01 0.01 0.01+ TIME= WEEK+ MULT= 1.00+ ADD = 0.00X Weekly Load TJ = 0.59X Each figure represents average hourly flow rate in std. m3/sX Profile date = 08 September 2008 - 14 September 2008X ==========================================================

X DELIVERY POINT KINLEITH MILLX CODERAMP KINEXT.V1 = 2.08+ 2.19 2.49 2.31 2.23 2.73 2.23 2.69 2.77 2.53 2.42 2.35 2.38+ 2.57 2.50 2.24 2.28 3.19 2.99 2.45 2.38 2.39 2.38 2.45 2.30+ 2.18 2.14 2.03 1.95 1.99 1.99 2.15 2.18 1.99 1.84 2.23 1.96+ 2.11 2.29 2.52 2.33 2.68 2.60 2.22 2.64 2.80 2.57 2.76 2.49+ 2.37 2.33 2.52 2.33 2.49 2.60 2.45 2.45 2.41 2.14 2.64 2.44+ 2.68 3.05 2.81 2.38 2.57 2.49 2.53 2.80 2.73 2.69 2.62 2.69+ 2.62 2.47 2.55 2.69 2.78 2.70 2.81 2.93 2.70 2.95 2.96 2.50+ 2.35 2.57 2.19 2.45 2.69 2.58 2.42 2.38 2.64 2.41 2.61 2.61+ 2.43 2.54 2.46 2.57 2.57 2.15 2.47 2.38 2.46 2.87 3.79 5.86+ 6.27 5.81 2.39 2.56 2.22 1.84 2.22 2.57 2.41 2.30 2.60 2.38+ 2.53 2.53 2.42 2.26 2.41 1.95 1.76 1.65 2.52 2.89 3.98 3.90+ 4.10 4.07 4.13 4.12 4.94 4.46 4.80 2.43 2.19 2.37 2.98 3.87+ 3.68 4.03 4.53 4.92 4.70 5.39 6.49 6.57 4.82 5.61 6.19 6.07+ 6.10 5.90 6.28 6.56 6.51 5.41 5.20 4.67 3.08 2.57 2.49 0.00+ TIME= WEEK+ MULT= 1.00+ ADD = 0.00X Weekly Load TJ = 73.55X Each figure represents average hourly flow rate in std. m3/sX Profile date = 08 September 2008 - 14 September 2008X ==========================================================X DELIVERY POINT LICHFIELDX CODERAMP LDFEXT.V1 = 0.36+ 0.38 0.43 0.42 0.46 0.42 0.45 0.47 0.50 0.45 0.38 0.45 0.37+ 0.37 0.34 0.35 0.39 0.41 0.45 0.40 0.42 0.53 0.55 0.53 0.51+ 0.50 0.49 0.49 0.51 0.49 0.44 0.44 0.54 0.52 0.35 0.39 0.32+ 0.29 0.40 0.35 0.41 0.45 0.55 0.57 0.55 0.57 0.49 0.46 0.59+ 0.61 0.53 0.54 0.49 0.48 0.49 0.50 0.51 0.57 0.62 0.56 0.54+ 0.56 0.56 0.53 0.56 0.62 0.59 0.50 0.46 0.41 0.43 0.49 0.41+ 0.49 0.48 0.47 0.45 0.42 0.36 0.46 0.54 0.55 0.52 0.56 0.51+ 0.49 0.50 0.50 0.52 0.54 0.55 0.55 0.58 0.63 0.60 0.56 0.50+ 0.50 0.50 0.51 0.50 0.53 0.52 0.52 0.56 0.58 0.58 0.54 0.61+ 0.59 0.57 0.47 0.46 0.45 0.51 0.52 0.54 0.48 0.41 0.46 0.46+ 0.49 0.50 0.50 0.52 0.54 0.51 0.47 0.53 0.58 0.55 0.58 0.62+ 0.62 0.57 0.51 0.45 0.55 0.54 0.56 0.58 0.57 0.51 0.48 0.51+ 0.50 0.60 0.57 0.61 0.56 0.61 0.54 0.49 0.51 0.51 0.56 0.52+ 0.47 0.48 0.39 0.40 0.42 0.47 0.44 0.43 0.37 0.41 0.42 0.54+ TIME= WEEK+ MULT= 1.00+ ADD = 0.00X Weekly Load TJ = 12.25X Each figure represents average hourly flow rate in std. m3/sX Profile date = 08 September 2008 - 14 September 2008X ==========================================================X DELIVERY POINT MT MANGANUIX CODERAMP MMGEXT.V = 0.52+ 0.48 0.49 0.57 0.62 0.64 0.62 0.63 0.70 0.77 0.71 0.62 0.64+ 0.72 0.60 0.62 0.63 0.60 0.61 0.65 0.64 0.59 0.45 0.42 0.43+ 0.43 0.42 0.46 0.60 0.66 0.64 0.64 0.72 0.74 0.79 0.78 0.72+ 0.64 0.63 0.74 0.74 0.67 0.68 0.63 0.63 0.61 0.58 0.55 0.59+ 0.58 0.60 0.60 0.65 0.61 0.63 0.66 0.74 0.68 0.60 0.59 0.60+ 0.65 0.67 0.65 0.66 0.61 0.62 0.63 0.56 0.53 0.50 0.50 0.54+ 0.60 0.64 0.64 0.67 0.62 0.62 0.63 0.75 0.68 0.72 0.71 0.70+ 0.72 0.79 0.72 0.66 0.62 0.62 0.68 0.67 0.62 0.55 0.54 0.54+ 0.63 0.61 0.65 0.65 0.72 0.67 0.71 0.77 0.74 0.64 0.64 0.72+ 0.71 0.58 0.64 0.55 0.48 0.50 0.52 0.49 0.47 0.46 0.44 0.35+ 0.28 0.36 0.37 0.39 0.41 0.42 0.40 0.45 0.45 0.42 0.42 0.44+ 0.48 0.46 0.44 0.42 0.45 0.47 0.35 0.35 0.35 0.34 0.31 0.30+ 0.29 0.28 0.32 0.32 0.31 0.33 0.47 0.43 0.51 0.50 0.49 0.48+ 0.50 0.50 0.49 0.44 0.45 0.44 0.47 0.57 0.50 0.48 0.44 0.48+ TIME= WEEK+ MULT= 1.00+ ADD = 0.00X Weekly Load TJ = 13.88X Each figure represents average hourly flow rate in std. m3/sX Profile date = 08 September 2008 - 14 September 2008X ==========================================================

X DELIVERY POINT OPOTIKIX CODERAMP OPKEXT.V1= 0.01+ 0.02 0.01 0.00 0.00 0.00 0.01 0.01 0.03 0.02 0.01 0.00 0.00+ 0.00 0.00 0.00 0.01 0.00 0.00 0.00 0.01 0.00 0.00 0.00 0.01+ 0.00 0.01 0.02 0.01 0.02 0.02 0.04 0.04 0.03 0.01 0.01 0.00+ 0.00 0.00 0.00 0.00 0.00 0.00 0.01 0.00 0.00 0.00 0.00 0.02+ 0.03 0.01 0.01 0.01 0.02 0.03 0.04 0.03 0.01 0.01 0.00 0.00+ 0.00 0.00 0.00 0.00 0.00 0.01 0.00 0.00 0.00 0.00 0.00 0.03+ 0.01 0.00 0.01 0.00 0.01 0.01 0.01 0.01 0.01 0.02 0.00 0.00+ 0.00 0.00 0.00 0.00 0.00 0.01 0.00 0.00 0.01 0.00 0.00 0.00+ 0.00 0.02 0.01 0.02 0.03 0.03 0.02 0.02 0.01 0.01 0.01 0.00+ 0.00 0.00 0.00 0.00 0.00 0.00 0.01 0.00 0.00 0.01 0.00 0.00+ 0.00 0.00 0.00 0.00 0.00 0.00 0.00 0.00 0.00 0.00 0.00 0.00+ 0.00 0.00 0.00 0.00 0.00 0.00 0.01 0.00 0.00 0.00 0.00 0.00+ 0.00 0.00 0.00 0.00 0.00 0.00 0.00 0.03 0.02 0.00 0.00 0.00+ 0.00 0.00 0.00 0.00 0.00 0.00 0.00 0.00 0.00 0.00 0.00 0.00+ TIME= WEEK+ MULT= 1.00+ ADD = 0.00X Weekly Load TJ = 0.15X Each figure represents average hourly flow rate in std. m3/sX Profile date = 08 September 2008 - 14 September 2008X ==========================================================X DELIVERY POINT PAPAMOAX CODERAMP PAPEXT.V1 = 0.05+ 0.05 0.04 0.05 0.06 0.05 0.08 0.13 0.17 0.15 0.13 0.14 0.13+ 0.13 0.13 0.14 0.14 0.16 0.18 0.19 0.18 0.16 0.12 0.08 0.06+ 0.05 0.06 0.05 0.06 0.07 0.08 0.13 0.16 0.14 0.13 0.11 0.10+ 0.10 0.08 0.08 0.09 0.10 0.13 0.15 0.14 0.12 0.11 0.09 0.07+ 0.06 0.06 0.06 0.07 0.07 0.09 0.14 0.18 0.16 0.13 0.10 0.10+ 0.09 0.09 0.09 0.10 0.11 0.14 0.17 0.16 0.15 0.11 0.09 0.07+ 0.06 0.06 0.06 0.07 0.06 0.07 0.12 0.16 0.13 0.11 0.09 0.09+ 0.10 0.09 0.09 0.09 0.10 0.13 0.17 0.17 0.15 0.12 0.09 0.05+ 0.05 0.05 0.05 0.05 0.06 0.08 0.13 0.17 0.15 0.11 0.10 0.10+ 0.10 0.08 0.10 0.09 0.09 0.11 0.14 0.14 0.13 0.11 0.08 0.05+ 0.04 0.04 0.04 0.05 0.05 0.06 0.09 0.13 0.14 0.13 0.11 0.10+ 0.10 0.08 0.08 0.08 0.09 0.13 0.15 0.14 0.14 0.12 0.10 0.08+ 0.06 0.05 0.04 0.05 0.05 0.06 0.08 0.11 0.14 0.14 0.11 0.10+ 0.09 0.09 0.07 0.08 0.08 0.11 0.13 0.14 0.13 0.10 0.08 0.06+ TIME= WEEK+ MULT= 1.00+ ADD = 0.00X Weekly Load TJ = 2.50X Each figure represents average hourly flow rate in std. m3/sX Profile date = 08 September 2008 - 14 September 2008X ==========================================================X DELIVERY POINT PUTARURUX CODERAMP PUTEXT.V1 = 0.09+ 0.06 0.08 0.07 0.07 0.08 0.08 0.07 0.07 0.07 0.06 0.05 0.06+ 0.06 0.07 0.08 0.09 0.09 0.09 0.10 0.09 0.09 0.08 0.07 0.07+ 0.07 0.07 0.06 0.06 0.07 0.07 0.07 0.07 0.09 0.10 0.10 0.09+ 0.08 0.09 0.09 0.09 0.10 0.10 0.10 0.09 0.09 0.08 0.08 0.07+ 0.07 0.07 0.07 0.05 0.05 0.06 0.12 0.13 0.12 0.09 0.11 0.10+ 0.10 0.11 0.11 0.12 0.12 0.13 0.11 0.12 0.12 0.11 0.09 0.10+ 0.09 0.10 0.11 0.10 0.10 0.10 0.11 0.10 0.10 0.09 0.10 0.09+ 0.09 0.09 0.09 0.09 0.08 0.09 0.09 0.09 0.08 0.07 0.06 0.08+ 0.07 0.06 0.06 0.06 0.06 0.10 0.09 0.10 0.11 0.10 0.09 0.06+ 0.07 0.06 0.06 0.06 0.06 0.06 0.07 0.10 0.11 0.11 0.09 0.08+ 0.11 0.11 0.11 0.11 0.09 0.09 0.10 0.12 0.13 0.12 0.11 0.11+ 0.12 0.12 0.11 0.11 0.12 0.11 0.12 0.11 0.11 0.10 0.09 0.09+ 0.09 0.09 0.09 0.09 0.09 0.09 0.08 0.07 0.07 0.05 0.05 0.04+ 0.03 0.05 0.04 0.05 0.07 0.04 0.06 0.07 0.06 0.05 0.05 0.11+ TIME= WEEK+ MULT= 1.00+ ADD = 0.00X Weekly Load TJ = 2.11X Each figure represents average hourly flow rate in std. m3/sX Profile date = 08 September 2008 - 14 September 2008X ==========================================================

X DELIVERY POINT RAINBOW MOUNTAINX CODERAMP RBMEXT.V1= 0.00+ 0.00 0.00 0.00 0.00 0.00 0.00 0.00 0.00 0.00 0.00 0.00 0.00+ 0.00 0.00 0.00 0.00 0.00 0.00 0.00 0.00 0.00 0.00 0.00 0.00+ 0.00 0.00 0.00 0.00 0.00 0.00 0.00 0.00 0.00 0.00 0.00 0.00+ 0.00 0.00 0.00 0.00 0.00 0.00 0.00 0.00 0.00 0.00 0.00 0.00+ 0.00 0.00 0.00 0.00 0.00 0.00 0.00 0.00 0.00 0.00 0.00 0.00+ 0.00 0.00 0.00 0.00 0.00 0.00 0.00 0.00 0.00 0.00 0.00 0.00+ 0.00 0.00 0.00 0.00 0.00 0.00 0.00 0.00 0.00 0.00 0.00 0.00+ 0.00 0.00 0.00 0.00 0.00 0.00 0.00 0.00 0.00 0.00 0.00 0.00+ 0.00 0.00 0.00 0.00 0.00 0.00 0.00 0.00 0.00 0.00 0.00 0.00+ 0.00 0.00 0.00 0.00 0.00 0.00 0.00 0.00 0.00 0.00 0.00 0.00+ 0.00 0.00 0.00 0.00 0.00 0.00 0.00 0.00 0.00 0.00 0.00 0.00+ 0.00 0.00 0.00 0.00 0.00 0.00 0.00 0.00 0.00 0.00 0.00 0.00+ 0.00 0.00 0.00 0.00 0.00 0.00 0.00 0.00 0.00 0.00 0.00 0.00+ 0.00 0.00 0.00 0.00 0.00 0.00 0.00 0.00 0.00 0.00 0.00 0.12+ TIME= WEEK+ MULT= 1.00+ ADD = 0.00X Weekly Load TJ = 0.02X Each figure represents average hourly flow rate in std. m3/sX Profile date = 08 September 2008 - 14 September 2008X ==========================================================X DELIVERY POINT RANGIURUX CODERAMP RGUEXT.V1= 0.00+ 0.00 0.00 0.00 0.01 0.02 0.06 0.08 0.10 0.15 0.14 0.15 0.15+ 0.15 0.15 0.15 0.17 0.15 0.14 0.13 0.10 0.07 0.00 0.00 0.00+ 0.00 0.00 0.00 0.00 0.03 0.11 0.15 0.13 0.13 0.13 0.13 0.12+ 0.12 0.13 0.12 0.12 0.10 0.10 0.06 0.08 0.08 0.09 0.08 0.05+ 0.00 0.00 0.00 0.00 0.04 0.11 0.15 0.13 0.13 0.13 0.12 0.13+ 0.12 0.12 0.12 0.12 0.12 0.10 0.10 0.09 0.09 0.09 0.07 0.00+ 0.00 0.00 0.00 0.00 0.03 0.10 0.11 0.13 0.13 0.16 0.14 0.12+ 0.12 0.12 0.12 0.12 0.11 0.10 0.10 0.09 0.08 0.09 0.08 0.03+ 0.00 0.00 0.00 0.00 0.02 0.06 0.12 0.14 0.12 0.15 0.13 0.12+ 0.13 0.14 0.13 0.13 0.12 0.10 0.10 0.09 0.09 0.09 0.09 0.01+ 0.00 0.00 0.00 0.00 0.00 0.00 0.00 0.00 0.00 0.00 0.00 0.00+ 0.00 0.00 0.00 0.00 0.00 0.00 0.00 0.00 0.00 0.00 0.00 0.00+ 0.00 0.00 0.00 0.00 0.00 0.00 0.00 0.00 0.00 0.00 0.00 0.00+ 0.00 0.00 0.00 0.00 0.00 0.00 0.00 0.00 0.00 0.00 0.00 0.00+ TIME= WEEK+ MULT= 1.00+ ADD = 0.00X Weekly Load TJ = 1.51X Each figure represents average hourly flow rate in std. m3/sX Profile date = 08 September 2008 - 14 September 2008X ==========================================================X DELIVERY POINT REPOROAX CODERAMP RPREXT.V1= 0.50+ 0.51 0.50 0.50 0.53 0.53 0.53 0.52 0.49 0.49 0.50 0.51 0.50+ 0.51 0.43 0.28 0.28 0.31 0.30 0.29 0.35 0.48 0.47 0.41 0.43+ 0.50 0.50 0.50 0.53 0.53 0.54 0.55 0.55 0.55 0.55 0.56 0.55+ 0.55 0.40 0.34 0.36 0.43 0.53 0.54 0.54 0.56 0.60 0.59 0.61+ 0.61 0.62 0.62 0.62 0.64 0.52 0.22 0.41 0.42 0.51 0.59 0.60+ 0.59 0.62 0.63 0.62 0.59 0.60 0.62 0.61 0.58 0.58 0.60 0.63+ 0.63 0.64 0.64 0.60 0.64 0.63 0.66 0.59 0.58 0.56 0.60 0.64+ 0.65 0.66 0.68 0.65 0.59 0.60 0.60 0.64 0.64 0.69 0.68 0.72+ 0.70 0.69 0.68 0.70 0.69 0.68 0.62 0.57 0.43 0.22 0.16 0.19+ 0.28 0.39 0.43 0.43 0.44 0.65 0.66 0.68 0.68 0.69 0.69 0.69+ 0.69 0.72 0.68 0.67 0.67 0.67 0.67 0.67 0.60 0.59 0.59 0.61+ 0.62 0.63 0.65 0.67 0.63 0.42 0.41 0.40 0.57 0.63 0.65 0.68+ 0.67 0.69 0.67 0.69 0.68 0.68 0.69 0.67 0.67 0.69 0.67 0.65+ 0.65 0.64 0.63 0.64 0.68 0.68 0.64 0.62 0.61 0.68 0.67 0.58+ TIME= WEEK+ MULT= 1.00+ ADD = 0.00X Weekly Load TJ = 14.05X Each figure represents average hourly flow rate in std. m3/sX Profile date = 08 September 2008 - 14 September 2008X ==========================================================

X DELIVERY POINT ROTORUAX CODERAMP ROTEXT.V1= 0.25+ 0.21 0.20 0.20 0.21 0.22 0.27 0.49 0.67 0.60 0.51 0.51 0.50+ 0.50 0.48 0.45 0.49 0.52 0.56 0.58 0.51 0.43 0.36 0.27 0.21+ 0.21 0.20 0.19 0.20 0.21 0.26 0.48 0.63 0.53 0.47 0.47 0.45+ 0.42 0.41 0.33 0.34 0.34 0.36 0.44 0.42 0.38 0.34 0.26 0.19+ 0.17 0.16 0.18 0.18 0.22 0.27 0.51 0.72 0.60 0.49 0.42 0.39+ 0.41 0.42 0.44 0.38 0.40 0.47 0.57 0.55 0.52 0.43 0.31 0.23+ 0.22 0.21 0.20 0.22 0.22 0.27 0.52 0.68 0.60 0.52 0.50 0.48+ 0.46 0.47 0.40 0.40 0.45 0.51 0.57 0.53 0.48 0.40 0.29 0.24+ 0.22 0.20 0.22 0.22 0.22 0.29 0.56 0.71 0.57 0.47 0.44 0.39+ 0.37 0.35 0.34 0.29 0.36 0.39 0.45 0.46 0.44 0.39 0.31 0.24+ 0.20 0.18 0.18 0.18 0.19 0.21 0.29 0.41 0.41 0.36 0.32 0.32+ 0.31 0.28 0.26 0.24 0.27 0.37 0.44 0.46 0.45 0.40 0.33 0.28+ 0.25 0.22 0.21 0.22 0.22 0.25 0.36 0.46 0.46 0.43 0.38 0.34+ 0.32 0.29 0.27 0.24 0.25 0.31 0.40 0.40 0.39 0.32 0.25 0.24+ TIME= WEEK+ MULT= 1.00+ ADD = 0.00X Weekly Load TJ = 9.03X Each figure represents average hourly flow rate in std. m3/sX Profile date = 08 September 2008 - 14 September 2008X ==========================================================X DELIVERY POINT TAUPOX CODERAMP TAPEXT.V1 = 0.05+ 0.04 0.04 0.04 0.04 0.05 0.09 0.15 0.21 0.20 0.19 0.17 0.15+ 0.15 0.13 0.13 0.14 0.21 0.21 0.22 0.20 0.17 0.12 0.07 0.04+ 0.03 0.03 0.03 0.03 0.04 0.06 0.12 0.17 0.16 0.15 0.13 0.15+ 0.14 0.11 0.10 0.09 0.11 0.12 0.17 0.17 0.16 0.13 0.09 0.05+ 0.04 0.05 0.05 0.05 0.06 0.09 0.16 0.22 0.22 0.17 0.15 0.13+ 0.12 0.12 0.14 0.14 0.16 0.17 0.23 0.22 0.21 0.16 0.10 0.07+ 0.05 0.05 0.05 0.04 0.05 0.07 0.13 0.21 0.21 0.19 0.16 0.16+ 0.15 0.12 0.10 0.10 0.13 0.16 0.22 0.22 0.20 0.16 0.10 0.06+ 0.05 0.04 0.04 0.05 0.05 0.08 0.14 0.22 0.19 0.16 0.14 0.13+ 0.12 0.11 0.10 0.10 0.12 0.15 0.19 0.21 0.20 0.17 0.12 0.08+ 0.06 0.05 0.05 0.05 0.05 0.06 0.11 0.17 0.20 0.16 0.13 0.12+ 0.10 0.11 0.09 0.10 0.11 0.15 0.20 0.20 0.19 0.17 0.12 0.10+ 0.07 0.05 0.05 0.05 0.06 0.06 0.10 0.16 0.17 0.16 0.13 0.11+ 0.09 0.09 0.07 0.07 0.08 0.11 0.15 0.17 0.16 0.12 0.09 0.06+ TIME= WEEK+ MULT= 1.00+ ADD = 0.00X Weekly Load TJ = 2.97X Each figure represents average hourly flow rate in std. m3/sX Profile date = 08 September 2008 - 14 September 2008X ==========================================================X DELIVERY POINT TAURANGAX CODERAMP TRGEXT.V1= 0.10+ 0.09 0.08 0.08 0.10 0.10 0.13 0.26 0.43 0.41 0.35 0.33 0.33+ 0.33 0.32 0.31 0.32 0.34 0.37 0.39 0.36 0.30 0.23 0.15 0.11+ 0.09 0.08 0.08 0.08 0.10 0.17 0.25 0.40 0.37 0.31 0.27 0.25+ 0.28 0.22 0.22 0.21 0.19 0.22 0.29 0.27 0.23 0.20 0.16 0.12+ 0.10 0.10 0.10 0.10 0.12 0.19 0.30 0.44 0.39 0.30 0.28 0.25+ 0.25 0.27 0.24 0.19 0.19 0.24 0.30 0.29 0.27 0.22 0.15 0.11+ 0.10 0.08 0.08 0.08 0.10 0.14 0.28 0.42 0.36 0.30 0.27 0.28+ 0.25 0.26 0.23 0.20 0.20 0.24 0.32 0.32 0.29 0.24 0.17 0.11+ 0.10 0.09 0.09 0.09 0.09 0.15 0.26 0.40 0.35 0.28 0.26 0.26+ 0.23 0.23 0.20 0.18 0.17 0.20 0.26 0.27 0.25 0.22 0.16 0.11+ 0.10 0.09 0.08 0.08 0.08 0.09 0.14 0.21 0.25 0.24 0.21 0.19+ 0.18 0.17 0.15 0.14 0.16 0.21 0.27 0.27 0.26 0.23 0.19 0.16+ 0.12 0.10 0.09 0.09 0.09 0.10 0.14 0.20 0.23 0.24 0.21 0.19+ 0.18 0.15 0.15 0.12 0.14 0.18 0.23 0.24 0.22 0.18 0.13 0.18+ TIME= WEEK+ MULT= 1.00+ ADD = 0.00X Weekly Load TJ = 5.12X Each figure represents average hourly flow rate in std. m3/sX Profile date = 08 September 2008 - 14 September 2008X ==========================================================

X DELIVERY POINT TE PUKEX CODERAMP TPKEXT.V1 = 0.01+ 0.01 0.01 0.01 0.01 0.01 0.01 0.02 0.04 0.04 0.04 0.03 0.05+ 0.04 0.04 0.03 0.04 0.04 0.04 0.05 0.04 0.03 0.02 0.01 0.01+ 0.01 0.01 0.01 0.01 0.01 0.01 0.02 0.04 0.04 0.03 0.03 0.03+ 0.02 0.02 0.02 0.01 0.02 0.02 0.03 0.03 0.03 0.02 0.02 0.01+ 0.01 0.01 0.01 0.01 0.01 0.01 0.03 0.04 0.04 0.04 0.03 0.03+ 0.03 0.02 0.02 0.02 0.02 0.03 0.04 0.04 0.04 0.03 0.01 0.01+ 0.01 0.01 0.01 0.01 0.01 0.01 0.02 0.04 0.03 0.03 0.02 0.03+ 0.03 0.03 0.02 0.02 0.03 0.03 0.05 0.05 0.04 0.03 0.02 0.01+ 0.01 0.01 0.01 0.01 0.01 0.01 0.03 0.04 0.04 0.03 0.03 0.02+ 0.02 0.03 0.02 0.02 0.02 0.02 0.03 0.03 0.03 0.02 0.01 0.01+ 0.01 0.01 0.01 0.01 0.01 0.01 0.02 0.03 0.03 0.03 0.03 0.02+ 0.02 0.02 0.01 0.01 0.02 0.02 0.03 0.04 0.03 0.03 0.02 0.01+ 0.01 0.01 0.01 0.01 0.01 0.01 0.02 0.03 0.03 0.03 0.02 0.02+ 0.02 0.01 0.01 0.01 0.01 0.02 0.03 0.03 0.03 0.02 0.01 0.01+ TIME= WEEK+ MULT= 1.00+ ADD = 0.00X Weekly Load TJ = 0.54X Each figure represents average hourly flow rate in std. m3/sX Profile date = 08 September 2008 - 14 September 2008X ==========================================================X DELIVERY POINT TE TEKOX CODERAMP TTKEXT.V1 = 0.00+ 0.00 0.00 0.00 0.00 0.00 0.00 0.00 0.00 0.00 0.00 0.00 0.00+ 0.00 0.00 0.00 0.00 0.00 0.00 0.00 0.00 0.00 0.00 0.00 0.00+ 0.00 0.00 0.00 0.00 0.00 0.00 0.00 0.00 0.00 0.00 0.00 0.00+ 0.00 0.00 0.00 0.00 0.00 0.00 0.00 0.00 0.00 0.00 0.00 0.00+ 0.00 0.00 0.00 0.00 0.00 0.00 0.00 0.00 0.00 0.00 0.00 0.00+ 0.00 0.00 0.00 0.00 0.00 0.00 0.00 0.00 0.00 0.00 0.00 0.00+ 0.00 0.00 0.00 0.00 0.00 0.00 0.00 0.00 0.00 0.00 0.00 0.00+ 0.00 0.00 0.00 0.00 0.00 0.00 0.00 0.00 0.00 0.00 0.00 0.00+ 0.00 0.00 0.00 0.00 0.00 0.00 0.00 0.00 0.00 0.00 0.00 0.00+ 0.00 0.00 0.00 0.00 0.00 0.00 0.00 0.00 0.00 0.00 0.00 0.00+ 0.00 0.00 0.00 0.00 0.00 0.00 0.00 0.00 0.00 0.00 0.00 0.00+ 0.00 0.00 0.00 0.00 0.00 0.00 0.00 0.00 0.00 0.00 0.00 0.00+ 0.00 0.00 0.00 0.00 0.00 0.00 0.00 0.00 0.00 0.00 0.00 0.00+ 0.00 0.00 0.00 0.00 0.00 0.00 0.00 0.00 0.00 0.00 0.00 0.00+ TIME= WEEK+ MULT= 1.00+ ADD = 0.00X Weekly Load TJ = 0.08X Each figure represents average hourly flow rate in std. m3/sX Profile date = 08 September 2008 - 14 September 2008X ==========================================================X DELIVERY POINT TIRAU DAIRY FACTORYX CODERAMP TDFEXT.V1= 0.17+ 0.16 0.17 0.18 0.17 0.20 0.20 0.26 0.52 0.52 0.52 0.51 0.51+ 0.36 0.39 0.36 0.37 0.38 0.35 0.32 0.27 0.21 0.16 0.15 0.17+ 0.18 0.16 0.14 0.06 0.17 0.19 0.24 0.45 0.52 0.49 0.49 0.52+ 0.50 0.49 0.50 0.49 0.43 0.41 0.41 0.40 0.43 0.39 0.34 0.31+ 0.26 0.26 0.13 0.24 0.22 0.19 0.27 0.36 0.54 0.56 0.52 0.54+ 0.55 0.54 0.59 0.58 0.58 0.54 0.48 0.43 0.24 0.19 0.22 0.22+ 0.22 0.20 0.19 0.18 0.18 0.19 0.22 0.45 0.53 0.54 0.51 0.50+ 0.55 0.53 0.49 0.53 0.47 0.45 0.46 0.42 0.42 0.38 0.33 0.26+ 0.23 0.18 0.18 0.16 0.17 0.18 0.25 0.42 0.53 0.50 0.52 0.50+ 0.49 0.49 0.52 0.39 0.51 0.47 0.38 0.32 0.27 0.23 0.24 0.24+ 0.24 0.23 0.21 0.22 0.21 0.23 0.30 0.47 0.57 0.56 0.59 0.64+ 0.61 0.60 0.46 0.48 0.51 0.50 0.48 0.44 0.45 0.39 0.26 0.29+ 0.24 0.20 0.16 0.16 0.17 0.20 0.29 0.53 0.53 0.49 0.50 0.49+ 0.48 0.50 0.52 0.49 0.45 0.44 0.43 0.42 0.39 0.39 0.34 0.52+ TIME= WEEK+ MULT= 1.00+ ADD = 0.00X Weekly Load TJ = 9.13X Each figure represents average hourly flow rate in std. m3/sX Profile date = 08 September 2008 - 14 September 2008X ==========================================================

X DELIVERY POINT TIRAU DISTRIBUTIONX CODERAMP TIREXT.V1 = 0.00+ 0.00 0.00 0.00 0.00 0.00 0.00 0.01 0.01 0.01 0.01 0.01 0.01+ 0.01 0.01 0.01 0.01 0.01 0.01 0.00 0.00 0.00 0.00 0.00 0.00+ 0.00 0.00 0.00 0.00 0.00 0.00 0.01 0.01 0.01 0.01 0.00 0.00+ 0.00 0.00 0.00 0.00 0.00 0.01 0.00 0.00 0.00 0.00 0.00 0.00+ 0.00 0.00 0.00 0.00 0.00 0.00 0.00 0.00 0.01 0.01 0.01 0.01+ 0.00 0.00 0.01 0.01 0.00 0.01 0.01 0.01 0.00 0.00 0.00 0.00+ 0.00 0.00 0.00 0.00 0.00 0.00 0.01 0.01 0.01 0.00 0.00 0.00+ 0.00 0.00 0.00 0.00 0.00 0.00 0.01 0.01 0.00 0.00 0.00 0.00+ 0.00 0.00 0.00 0.00 0.00 0.00 0.00 0.00 0.00 0.00 0.00 0.00+ 0.00 0.00 0.00 0.00 0.00 0.00 0.00 0.00 0.01 0.00 0.00 0.00+ 0.00 0.00 0.00 0.00 0.00 0.00 0.00 0.01 0.01 0.01 0.00 0.01+ 0.01 0.00 0.00 0.01 0.01 0.00 0.01 0.00 0.01 0.00 0.00 0.00+ 0.00 0.00 0.00 0.00 0.00 0.00 0.00 0.01 0.01 0.01 0.01 0.01+ 0.01 0.00 0.01 0.00 0.01 0.00 0.01 0.00 0.00 0.00 0.00 0.00+ TIME= WEEK+ MULT= 1.00+ ADD = 0.00X Weekly Load TJ = 0.08X Each figure represents average hourly flow rate in std. m3/sX Profile date = 08 September 2008 - 14 September 2008X ==========================================================X DELIVERY POINT TOKOROAX CODERAMP TOKEXT.V1= 0.03+ 0.02 0.02 0.02 0.02 0.02 0.07 0.14 0.16 0.13 0.10 0.13 0.12+ 0.12 0.12 0.11 0.12 0.12 0.12 0.13 0.12 0.11 0.09 0.07 0.07+ 0.06 0.02 0.01 0.01 0.02 0.07 0.13 0.15 0.13 0.12 0.11 0.10+ 0.11 0.10 0.09 0.08 0.09 0.10 0.11 0.11 0.11 0.10 0.08 0.07+ 0.06 0.02 0.02 0.02 0.02 0.08 0.14 0.17 0.15 0.13 0.11 0.10+ 0.11 0.12 0.12 0.11 0.09 0.14 0.15 0.14 0.13 0.10 0.10 0.07+ 0.07 0.03 0.02 0.02 0.03 0.08 0.15 0.18 0.16 0.14 0.13 0.13+ 0.13 0.12 0.12 0.12 0.13 0.13 0.14 0.15 0.13 0.11 0.08 0.07+ 0.07 0.02 0.02 0.02 0.02 0.04 0.10 0.13 0.11 0.13 0.13 0.12+ 0.10 0.09 0.09 0.09 0.09 0.10 0.13 0.13 0.12 0.10 0.05 0.03+ 0.03 0.02 0.02 0.02 0.02 0.07 0.09 0.10 0.12 0.11 0.08 0.05+ 0.04 0.04 0.03 0.03 0.04 0.05 0.07 0.07 0.07 0.06 0.05 0.05+ 0.03 0.03 0.02 0.02 0.03 0.03 0.04 0.05 0.06 0.06 0.05 0.03+ 0.03 0.02 0.02 0.03 0.02 0.04 0.06 0.07 0.07 0.06 0.04 0.03+ TIME= WEEK+ MULT= 1.00+ ADD = 0.00X Weekly Load TJ = 1.99X Each figure represents average hourly flow rate in std. m3/sX Profile date = 08 September 2008 - 14 September 2008X ==========================================================X DELIVERY POINT WAIKERIAX CODERAMP WRAEXT.V1= 0.02+ 0.02 0.02 0.02 0.02 0.02 0.02 0.03 0.04 0.04 0.04 0.04 0.04+ 0.04 0.04 0.04 0.04 0.04 0.03 0.03 0.03 0.02 0.02 0.02 0.02+ 0.02 0.02 0.02 0.02 0.02 0.02 0.03 0.03 0.04 0.04 0.04 0.04+ 0.04 0.04 0.03 0.04 0.03 0.03 0.03 0.03 0.03 0.03 0.02 0.02+ 0.02 0.02 0.02 0.02 0.02 0.02 0.03 0.03 0.04 0.04 0.04 0.04+ 0.04 0.04 0.04 0.04 0.04 0.03 0.03 0.03 0.03 0.02 0.02 0.02+ 0.02 0.02 0.02 0.02 0.02 0.02 0.03 0.04 0.04 0.04 0.04 0.04+ 0.04 0.04 0.04 0.04 0.04 0.03 0.03 0.03 0.02 0.02 0.02 0.02+ 0.02 0.02 0.02 0.02 0.02 0.02 0.03 0.04 0.04 0.04 0.04 0.04+ 0.04 0.03 0.03 0.03 0.03 0.03 0.03 0.03 0.03 0.02 0.02 0.02+ 0.02 0.02 0.02 0.02 0.02 0.03 0.03 0.03 0.04 0.04 0.04 0.04+ 0.04 0.03 0.03 0.03 0.03 0.03 0.03 0.03 0.03 0.03 0.02 0.03+ 0.02 0.03 0.02 0.02 0.02 0.02 0.03 0.03 0.03 0.03 0.03 0.03+ 0.04 0.03 0.03 0.03 0.03 0.03 0.03 0.02 0.03 0.03 0.02 0.03+ TIME= WEEK+ MULT= 1.00+ ADD = 0.00X Weekly Load TJ = 0.73X Each figure represents average hourly flow rate in std. m3/sX Profile date = 08 September 2008 - 14 September 2008X ==========================================================

X DELIVERY POINT WHAKATANEX CODERAMP WHKEXT.V = 0.34+ 0.32 0.33 0.33 0.32 0.34 0.33 0.37 0.38 0.41 0.41 0.48 0.54+ 0.37 0.37 0.37 0.38 0.46 0.37 0.36 0.36 0.37 0.33 0.33 0.31+ 0.32 0.33 0.34 0.34 0.36 0.34 0.38 0.42 0.41 0.40 0.22 0.34+ 0.36 0.38 0.31 0.29 0.35 0.28 0.19 0.26 0.25 0.37 0.35 0.17+ 0.21 0.30 0.31 0.32 0.38 0.30 0.31 0.45 0.40 0.41 0.45 0.42+ 0.42 0.42 0.39 0.42 0.39 0.35 0.36 0.36 0.35 0.40 0.33 0.32+ 0.32 0.34 0.28 0.34 0.38 0.31 0.32 0.41 0.48 0.52 0.42 0.32+ 0.32 0.37 0.39 0.46 0.42 0.29 0.45 0.45 0.38 0.39 0.43 0.38+ 0.33 0.42 0.40 0.40 0.48 0.36 0.43 0.48 0.49 0.49 0.51 0.55+ 0.52 0.52 0.38 0.50 0.54 0.38 0.50 0.43 0.45 0.51 0.46 0.38+ 0.37 0.47 0.49 0.44 0.50 0.47 0.50 0.56 0.53 0.49 0.46 0.41+ 0.43 0.48 0.50 0.50 0.49 0.42 0.37 0.40 0.44 0.40 0.26 0.28+ 0.26 0.13 0.04 0.04 0.04 0.04 0.04 0.09 0.18 0.19 0.21 0.29+ 0.27 0.34 0.34 0.36 0.36 0.35 0.36 0.36 0.37 0.40 0.37 0.10+ TIME= WEEK+ MULT= 1.00+ ADD = 0.00X Weekly Load TJ = 9.06X Each figure represents average hourly flow rate in std. m3/sX Profile date = 08 September 2008 - 14 September 2008X ==========================================================X DELIVERY POINT WHAKATANE (BOARD MILLS CHH )X CODERAMP CHHEXT.V1= 0.32+ 0.30 0.31 0.32 0.31 0.31 0.28 0.30 0.30 0.33 0.32 0.40 0.44+ 0.29 0.29 0.29 0.31 0.39 0.32 0.32 0.32 0.34 0.31 0.31 0.29+ 0.30 0.31 0.32 0.33 0.35 0.33 0.33 0.35 0.34 0.33 0.15 0.27+ 0.30 0.32 0.26 0.24 0.30 0.26 0.15 0.23 0.22 0.35 0.33 0.15+ 0.18 0.29 0.29 0.30 0.36 0.27 0.25 0.37 0.31 0.34 0.39 0.34+ 0.35 0.34 0.33 0.37 0.35 0.31 0.32 0.33 0.32 0.37 0.31 0.31+ 0.31 0.33 0.26 0.33 0.36 0.29 0.25 0.33 0.40 0.43 0.34 0.24+ 0.23 0.29 0.32 0.39 0.36 0.26 0.41 0.41 0.35 0.37 0.41 0.36+ 0.32 0.39 0.39 0.39 0.47 0.34 0.37 0.40 0.41 0.41 0.44 0.48+ 0.44 0.45 0.33 0.45 0.49 0.36 0.47 0.40 0.41 0.49 0.44 0.36+ 0.35 0.45 0.46 0.42 0.47 0.45 0.46 0.52 0.47 0.44 0.40 0.35+ 0.39 0.45 0.47 0.48 0.46 0.39 0.35 0.37 0.41 0.37 0.23 0.25+ 0.25 0.11 0.00 0.00 0.00 0.00 0.00 0.04 0.12 0.13 0.16 0.24+ 0.23 0.30 0.31 0.33 0.34 0.32 0.34 0.33 0.35 0.38 0.36 0.00+ TIME= WEEK+ MULT= 1.00+ ADD = 0.00X Weekly Load TJ = 8.03X Each figure represents average hourly flow rate in std. m3/sX Profile date = 08 September 2008 - 14 September 2008X ==========================================================X DELIVERY POINT PYES PAX CODERAMP PYPEXT.V1 = 0.01+ 0.01 0.01 0.01 0.01 0.02 0.02 0.04 0.06 0.06 0.05 0.04 0.04+ 0.05 0.04 0.04 0.05 0.05 0.05 0.05 0.05 0.04 0.03 0.02 0.01+ 0.01 0.01 0.01 0.01 0.02 0.02 0.04 0.06 0.05 0.04 0.04 0.05+ 0.04 0.03 0.03 0.03 0.03 0.03 0.04 0.03 0.03 0.02 0.02 0.02+ 0.02 0.02 0.02 0.02 0.02 0.03 0.04 0.06 0.05 0.04 0.03 0.03+ 0.03 0.04 0.03 0.02 0.02 0.03 0.03 0.03 0.03 0.03 0.02 0.02+ 0.02 0.02 0.02 0.02 0.02 0.02 0.04 0.06 0.04 0.03 0.03 0.03+ 0.03 0.03 0.03 0.02 0.02 0.03 0.03 0.03 0.03 0.03 0.02 0.02+ 0.02 0.02 0.02 0.02 0.02 0.02 0.03 0.05 0.03 0.03 0.03 0.03+ 0.02 0.03 0.02 0.02 0.02 0.02 0.03 0.03 0.03 0.02 0.02 0.02+ 0.01 0.01 0.01 0.02 0.02 0.02 0.02 0.03 0.03 0.02 0.02 0.02+ 0.02 0.01 0.01 0.01 0.02 0.02 0.03 0.03 0.03 0.02 0.02 0.02+ 0.02 0.01 0.02 0.02 0.02 0.02 0.02 0.03 0.03 0.02 0.02 0.01+ 0.01 0.01 0.01 0.01 0.02 0.02 0.03 0.02 0.02 0.02 0.02 0.11+ TIME= WEEK+ MULT= 1.00+ ADD = 0.00X Weekly Load TJ = 0.66X Each figure represents average hourly flow rate in std. m3/sX Profile date = 08 September 2008 - 14 September 2008X ==========================================================

X DELIVERY POINT KAPUNI SUPPLYX CODERAMP KAPEXT.V1= 6.47+ 6.97 7.20 7.34 7.27 7.09 6.93 6.78 6.85 7.47 8.14 8.98 9.43+ 10.02 10.31 10.55 10.65 10.72 10.76 10.73 10.90 11.16 11.42 11.72 11.87+ 11.97 12.00 11.77 11.47 11.21 11.01 10.71 8.27 8.27 4.15 5.63 8.59+ 8.64 8.85 8.85 6.45 5.57 6.41 4.49 6.33 8.80 10.56 11.34 11.74+ 12.88 12.36 12.67 12.64 12.41 12.60 12.35 12.72 12.61 13.15 13.17 13.09+ 12.80 13.30 13.42 13.25 13.22 13.03 12.67 12.98 13.23 13.28 13.35 13.49+ 13.53 13.58 13.87 13.73 13.48 13.18 12.98 12.84 12.22 10.78 9.82 11.88+ 12.80 12.90 12.99 12.38 10.99 11.55 11.71 11.80 12.08 12.21 12.48 12.78+ 12.96 13.17 13.53 13.79 14.00 13.91 14.10 14.13 14.17 14.20 14.25 13.22+ 13.20 14.03 14.52 14.52 14.15 14.22 13.33 12.35 12.21 12.18 12.38 12.56+ 12.56 12.65 12.61 12.56 12.47 12.33 12.22 12.09 11.99 11.88 11.89 11.94+ 11.94 11.97 12.02 11.95 12.00 11.81 11.15 10.87 10.95 11.01 11.16 11.05+ 10.94 11.17 11.09 10.94 10.88 10.72 10.58 10.38 9.83 10.02 9.38 9.42+ 9.53 9.53 9.78 9.48 9.27 9.17 9.00 8.87 8.87 8.96 8.80 0.00+ TIME= WEEK+ MULT= 1.00+ ADD = 0.00X Weekly Load TJ = 272.45X Each figure represents average hourly flow rate in std. m3/sX Profile date = 15 JUNE 2009 - 21 JUNE 2009X ==========================================================X DELIVERY POINT RIMU INJECTION X CODERAMP RIMEXT.V1= 1.19+ 1.17 1.12 1.17 1.09 1.17 1.10 1.19 1.10 1.18 1.07 1.13 1.10+ 1.02 1.01 0.97 0.96 0.96 1.04 1.04 1.02 1.03 1.01 1.00 1.01+ 1.01 1.02 1.00 1.00 1.00 1.00 1.01 1.04 1.08 1.06 1.05 1.03+ 1.02 1.02 1.01 1.01 1.00 1.01 1.03 1.02 1.03 1.03 1.03 1.04+ 1.03 1.03 1.01 1.04 1.02 1.03 1.02 1.03 1.02 1.03 1.03 1.22+ 1.13 1.07 1.11 1.08 1.07 1.06 1.05 1.05 1.04 1.04 1.05 1.05+ 1.06 1.06 1.04 1.02 1.05 1.02 1.03 1.02 1.01 1.01 1.00 1.07+ 1.19 1.16 1.01 1.08 1.39 1.36 1.25 1.18 1.13 1.09 1.12 1.16+ 1.08 1.08 1.05 1.03 1.02 1.03 1.02 1.01 1.03 1.04 1.04 1.07+ 1.02 1.00 1.02 1.02 1.01 1.01 1.01 1.00 1.01 1.01 1.01 1.01+ 1.02 1.01 1.02 1.00 1.01 1.02 1.01 1.00 1.01 1.01 1.01 1.09+ 1.08 1.02 1.12 1.26 1.21 1.20 1.24 1.25 1.28 1.29 1.31 1.32+ 1.33 1.33 1.34 1.34 1.33 1.35 1.35 1.36 1.35 1.36 1.35 1.37+ 1.35 1.36 1.36 1.38 1.34 1.35 1.35 1.33 1.33 1.37 1.36 0.00+ TIME= WEEK+ MULT= 1.00+ ADD = 0.00X Weekly Load TJ = 27.69X Each figure represents average hourly flow rate in std. m3/sX Profile date = 15 JUNE 2009 - 21 JUNE 2009X ==========================================================X DELIVERY POINT ASHURSTX CODERAMP ASHEXT.V1 = 0.00222+ 0.00 0.00 0.00 0.00 0.00 0.00 0.01 0.02 0.01 0.01 0.01 0.01+ 0.01 0.01 0.01 0.01 0.01 0.02 0.02 0.01 0.01 0.01 0.01 0.00+ 0.00 0.00 0.00 0.00 0.00 0.00 0.01 0.01 0.02 0.01 0.01 0.01+ 0.01 0.02 0.01 0.02 0.02 0.02 0.02 0.02 0.02 0.01 0.01 0.01+ 0.00 0.00 0.00 0.00 0.00 0.00 0.01 0.02 0.03 0.02 0.02 0.02+ 0.01 0.02 0.01 0.01 0.01 0.02 0.02 0.02 0.02 0.01 0.01 0.00+ 0.00 0.00 0.00 0.00 0.00 0.01 0.01 0.02 0.02 0.02 0.01 0.02+ 0.01 0.01 0.01 0.01 0.01 0.01 0.02 0.02 0.01 0.01 0.01 0.01+ 0.00 0.00 0.00 0.01 0.00 0.00 0.01 0.02 0.03 0.02 0.01 0.01+ 0.01 0.01 0.01 0.01 0.01 0.01 0.02 0.01 0.02 0.01 0.01 0.00+ 0.00 0.00 0.00 0.00 0.00 0.00 0.00 0.01 0.01 0.01 0.01 0.01+ 0.01 0.01 0.01 0.01 0.01 0.01 0.01 0.01 0.01 0.01 0.01 0.01+ 0.00 0.00 0.00 0.00 0.00 0.00 0.00 0.00 0.01 0.01 0.01 0.01+ 0.01 0.01 0.01 0.01 0.01 0.01 0.02 0.01 0.01 0.01 0.01 0.00+ TIME= WEEK+ MULT= 1.00+ ADD = 0.00X Weekly Load TJ = 0.24X Each figure represents average hourly flow rate in std. m3/sX Profile date = 15 JUNE 2009 - 21 JUNE 2009X ==========================================================

X DELIVERY POINT BELMONTX CODERAMP BMTEXT.V1= 0.71+ 0.71 0.71 0.66 0.60 0.77 1.09 2.24 3.05 2.89 2.29 1.86 1.59+ 1.48 1.37 1.15 1.15 1.58 2.18 2.51 2.45 2.24 1.86 1.37 0.93+ 0.66 0.66 0.55 0.66 0.71 1.15 2.30 3.00 3.00 2.40 2.35 2.35+ 2.51 2.73 2.73 2.79 3.11 3.39 3.49 3.39 3.06 2.68 1.81 1.15+ 0.93 0.82 0.82 0.88 0.99 1.37 2.57 3.54 3.38 2.78 2.62 2.57+ 2.51 2.35 1.86 1.91 2.24 2.89 3.22 3.16 2.95 2.51 1.75 1.15+ 0.88 0.77 0.77 0.77 0.93 1.31 2.56 3.54 3.32 2.84 2.62 2.51+ 2.13 2.02 1.80 1.86 2.18 2.94 3.32 3.21 3.05 2.62 1.86 1.26+ 0.93 0.88 0.88 0.93 1.04 1.53 2.78 3.98 3.92 3.32 2.95 2.40+ 2.08 1.75 1.64 1.59 2.08 2.73 3.00 2.78 2.57 2.18 1.64 1.15+ 0.82 0.71 0.71 0.77 0.71 0.88 1.20 1.80 2.40 2.73 2.78 2.62+ 2.35 2.35 2.19 2.24 2.40 2.67 2.62 2.46 2.19 1.97 1.65 1.26+ 0.88 0.77 0.66 0.71 0.66 0.71 0.99 1.48 2.03 2.41 2.46 2.24+ 2.13 2.02 1.97 2.02 2.30 2.62 2.68 2.51 2.24 1.91 1.48 0.00+ TIME= WEEK+ MULT= 1.00+ ADD = 0.00X Weekly Load TJ = 47.65X Each figure represents average hourly flow rate in std. m3/sX Profile date = 15 JUNE 2009 - 21 JUNE 2009X ==========================================================X DELIVERY POINT DANNEVIRKEX CODERAMP DANEXT.V1= 0.01+ 0.01 0.02 0.03 0.01 0.01 0.02 0.05 0.10 0.07 0.09 0.07 0.09+ 0.08 0.07 0.09 0.09 0.06 0.08 0.06 0.08 0.09 0.07 0.07 0.06+ 0.07 0.06 0.07 0.08 0.04 0.07 0.07 0.07 0.07 0.07 0.07 0.06+ 0.07 0.06 0.07 0.07 0.06 0.05 0.06 0.06 0.06 0.06 0.07 0.08+ 0.08 0.06 0.07 0.06 0.04 0.07 0.08 0.07 0.09 0.10 0.09 0.10+ 0.08 0.09 0.11 0.10 0.07 0.09 0.08 0.08 0.09 0.09 0.07 0.09+ 0.09 0.07 0.08 0.07 0.06 0.08 0.11 0.09 0.11 0.11 0.10 0.12+ 0.09 0.09 0.10 0.09 0.08 0.09 0.08 0.08 0.09 0.09 0.07 0.09+ 0.09 0.07 0.09 0.07 0.04 0.08 0.08 0.09 0.10 0.11 0.09 0.09+ 0.10 0.08 0.10 0.09 0.08 0.08 0.05 0.05 0.05 0.05 0.05 0.05+ 0.04 0.04 0.04 0.04 0.03 0.02 0.04 0.05 0.06 0.06 0.04 0.06+ 0.05 0.03 0.05 0.05 0.04 0.04 0.02 0.01 0.01 0.01 0.01 0.01+ 0.01 0.01 0.01 0.01 0.01 0.01 0.02 0.05 0.05 0.06 0.04 0.05+ 0.05 0.04 0.06 0.05 0.04 0.05 0.04 0.02 0.01 0.01 0.01 0.00+ TIME= WEEK+ MULT= 1.00+ ADD = 0.00X Weekly Load TJ = 1.51X Each figure represents average hourly flow rate in std. m3/sX Profile date = 15 JUNE 2009 - 21 JUNE 2009X ==========================================================X DELIVERY POINT FEILDINGX CODERAMP ELSEXT.V1 = 0.10+ 0.10 0.09 0.08 0.09 0.11 0.13 0.19 0.28 0.26 0.26 0.27 0.24+ 0.25 0.21 0.21 0.22 0.24 0.29 0.28 0.28 0.25 0.21 0.17 0.14+ 0.12 0.12 0.09 0.09 0.12 0.13 0.23 0.30 0.33 0.33 0.31 0.31+ 0.29 0.27 0.29 0.29 0.33 0.35 0.35 0.30 0.30 0.26 0.19 0.15+ 0.16 0.15 0.12 0.13 0.14 0.17 0.25 0.37 0.36 0.34 0.34 0.31+ 0.30 0.31 0.29 0.27 0.31 0.36 0.34 0.35 0.34 0.30 0.23 0.18+ 0.18 0.16 0.15 0.15 0.14 0.17 0.26 0.39 0.44 0.41 0.36 0.31+ 0.29 0.29 0.29 0.29 0.33 0.37 0.38 0.35 0.33 0.30 0.23 0.19+ 0.17 0.17 0.16 0.15 0.15 0.18 0.27 0.39 0.41 0.38 0.35 0.31+ 0.28 0.27 0.24 0.24 0.29 0.35 0.32 0.31 0.29 0.26 0.19 0.15+ 0.13 0.12 0.12 0.12 0.12 0.14 0.14 0.20 0.26 0.27 0.25 0.22+ 0.20 0.19 0.19 0.20 0.21 0.25 0.24 0.24 0.21 0.20 0.16 0.13+ 0.10 0.10 0.10 0.11 0.10 0.12 0.13 0.17 0.21 0.24 0.26 0.21+ 0.18 0.16 0.16 0.18 0.21 0.28 0.25 0.24 0.21 0.19 0.14 0.00+ TIME= WEEK+ MULT= 1.00+ ADD = 0.00X Weekly Load TJ = 5.61X Each figure represents average hourly flow rate in std. m3/sX Profile date = 15 JUNE 2009 - 21 JUNE 2009X ==========================================================

X DELIVERY POINT FOXTONX CODERAMP FXNEXT.V1= 0.02+ 0.02 0.03 0.02 0.03 0.03 0.04 0.04 0.05 0.05 0.04 0.04 0.03+ 0.05 0.07 0.07 0.08 0.07 0.06 0.06 0.06 0.06 0.06 0.05 0.04+ 0.05 0.04 0.04 0.04 0.05 0.07 0.07 0.08 0.10 0.10 0.09 0.06+ 0.04 0.05 0.06 0.06 0.05 0.04 0.06 0.08 0.08 0.07 0.06 0.05+ 0.05 0.05 0.05 0.05 0.06 0.08 0.09 0.10 0.11 0.10 0.09 0.05+ 0.05 0.05 0.04 0.04 0.06 0.08 0.08 0.08 0.08 0.06 0.06 0.06+ 0.06 0.06 0.06 0.07 0.08 0.09 0.09 0.11 0.13 0.11 0.11 0.10+ 0.09 0.09 0.09 0.09 0.09 0.09 0.09 0.08 0.07 0.05 0.03 0.02+ 0.04 0.06 0.06 0.07 0.07 0.08 0.10 0.11 0.12 0.11 0.10 0.10+ 0.08 0.07 0.08 0.08 0.08 0.05 0.07 0.07 0.07 0.06 0.06 0.05+ 0.05 0.05 0.05 0.05 0.05 0.05 0.06 0.08 0.09 0.08 0.08 0.07+ 0.07 0.06 0.06 0.06 0.07 0.05 0.05 0.06 0.06 0.06 0.06 0.05+ 0.05 0.04 0.01 0.02 0.02 0.01 0.02 0.03 0.03 0.03 0.02 0.02+ 0.02 0.02 0.02 0.02 0.02 0.03 0.03 0.03 0.03 0.02 0.02 0.02+ TIME= WEEK+ MULT= 1.00+ ADD = 0.00X Weekly Load TJ = 1.46X Each figure represents average hourly flow rate in std. m3/sX Profile date = 15 JUNE 2009 - 21 JUNE 2009X ==========================================================X DELIVERY POINT HASTINGSX CODERAMP HSTEXT.V1= 1.09+ 1.00 0.86 0.91 1.13 1.42 1.47 1.83 2.11 2.29 2.15 2.05 1.93+ 1.93 2.02 1.95 1.86 1.87 1.77 1.87 1.85 1.74 1.71 1.70 1.61+ 1.78 1.65 1.72 1.56 1.75 1.81 2.11 2.65 2.65 2.58 2.41 2.31+ 2.26 2.23 2.04 2.02 2.11 2.14 2.14 2.18 1.93 1.93 1.81 1.68+ 1.81 1.71 1.70 1.75 1.83 1.94 2.25 2.58 2.67 2.54 2.55 2.58+ 2.62 2.44 2.34 2.18 2.18 2.12 2.17 2.02 2.09 1.99 1.80 1.66+ 1.78 1.60 1.69 1.76 1.79 1.98 2.20 2.36 2.51 2.50 2.44 2.26+ 2.32 2.38 2.21 2.21 2.25 2.27 2.36 2.22 2.21 2.05 1.88 1.68+ 1.83 1.81 1.71 1.61 1.71 1.88 2.22 2.50 2.50 2.45 2.24 2.24+ 2.04 1.99 1.83 1.87 1.96 2.04 2.14 1.98 2.01 1.81 1.49 1.33+ 1.42 1.26 1.21 1.22 1.13 1.19 1.23 1.47 1.46 1.43 1.45 1.30+ 1.26 1.25 1.27 1.23 1.30 1.33 1.38 1.28 1.11 1.08 0.93 0.77+ 0.86 0.79 0.79 0.76 0.80 0.83 0.99 0.98 1.07 1.10 1.13 1.11+ 1.08 1.13 1.06 1.16 1.23 1.27 1.40 1.33 1.17 1.06 1.25 0.00+ TIME= WEEK+ MULT= 1.00+ ADD = 0.00X Weekly Load TJ = 42.67X Each figure represents average hourly flow rate in std. m3/sX Profile date = 15 JUNE 2009 - 21 JUNE 2009X ==========================================================X DELIVERY POINT HAWERAX CODERAMP HAWEXT.V = 0.04+ 0.03 0.04 0.04 0.04 0.09 0.29 0.38 0.38 0.37 0.39 0.37 0.34+ 0.35 0.35 0.32 0.33 0.39 0.47 0.51 0.50 0.46 0.39 0.32 0.23+ 0.18 0.17 0.16 0.17 0.18 0.21 0.28 0.44 0.42 0.39 0.39 0.37+ 0.36 0.36 0.36 0.43 0.51 0.57 0.60 0.56 0.50 0.41 0.32 0.23+ 0.20 0.20 0.20 0.22 0.20 0.25 0.33 0.50 0.53 0.48 0.43 0.39+ 0.33 0.32 0.30 0.31 0.36 0.45 0.49 0.55 0.50 0.44 0.36 0.30+ 0.22 0.23 0.21 0.25 0.24 0.27 0.36 0.51 0.51 0.46 0.42 0.37+ 0.34 0.29 0.27 0.27 0.34 0.45 0.52 0.50 0.46 0.38 0.28 0.20+ 0.19 0.17 0.15 0.20 0.18 0.27 0.37 0.51 0.54 0.45 0.39 0.27+ 0.23 0.24 0.24 0.22 0.24 0.27 0.29 0.26 0.24 0.20 0.16 0.11+ 0.09 0.07 0.07 0.06 0.06 0.07 0.10 0.16 0.22 0.23 0.20 0.16+ 0.15 0.15 0.16 0.19 0.23 0.28 0.28 0.26 0.23 0.20 0.15 0.11+ 0.08 0.07 0.07 0.06 0.06 0.07 0.09 0.12 0.20 0.19 0.16 0.13+ 0.12 0.11 0.09 0.13 0.20 0.25 0.27 0.26 0.22 0.19 0.12 0.00+ TIME= WEEK+ MULT= 1.00+ ADD = 0.00X Weekly Load TJ = 6.71X Each figure represents average hourly flow rate in std. m3/sX Profile date = 15 JUNE 2009 - 21 JUNE 2009X ==========================================================

X DELIVERY POINT KAIRANGAX CODERAMP KAIEXT.V1 = 0.01+ 0.01 0.01 0.01 0.01 0.01 0.01 0.00 0.00 0.00 0.00 0.01 0.01+ 0.01 0.01 0.01 0.01 0.01 0.00 0.00 0.00 0.00 0.00 0.00 0.00+ 0.00 0.00 0.00 0.00 0.00 0.00 0.00 0.00 0.01 0.01 0.01 0.01+ 0.01 0.02 0.01 0.02 0.01 0.00 0.00 0.00 0.00 0.00 0.00 0.00+ 0.00 0.00 0.00 0.00 0.00 0.00 0.00 0.00 0.02 0.02 0.01 0.02+ 0.01 0.02 0.02 0.02 0.02 0.02 0.02 0.02 0.02 0.02 0.02 0.01+ 0.02 0.02 0.02 0.02 0.01 0.00 0.00 0.00 0.00 0.02 0.02 0.01+ 0.02 0.02 0.02 0.02 0.02 0.02 0.02 0.02 0.02 0.02 0.02 0.02+ 0.02 0.02 0.02 0.02 0.02 0.02 0.02 0.02 0.02 0.02 0.01 0.02+ 0.02 0.01 0.02 0.01 0.01 0.01 0.01 0.01 0.01 0.01 0.01 0.01+ 0.01 0.01 0.01 0.01 0.01 0.00 0.00 0.00 0.00 0.01 0.01 0.01+ 0.00 0.00 0.00 0.00 0.00 0.00 0.00 0.00 0.00 0.00 0.00 0.00+ 0.00 0.00 0.00 0.00 0.00 0.00 0.00 0.00 0.00 0.00 0.00 0.01+ 0.01 0.01 0.01 0.01 0.01 0.01 0.01 0.01 0.01 0.01 0.01 0.00+ TIME= WEEK+ MULT= 1.00+ ADD = 0.00X Weekly Load TJ = 0.21X Each figure represents average hourly flow rate in std. m3/sX Profile date = 15 JUNE 2009 - 21 JUNE 2009X ==========================================================X DELIVERY POINT KAITOKEX CODERAMP KKEEXT.V1= 0.02+ 0.02 0.02 0.02 0.02 0.02 0.02 0.02 0.03 0.03 0.04 0.03 0.03+ 0.03 0.03 0.03 0.03 0.03 0.03 0.03 0.03 0.02 0.02 0.02 0.02+ 0.02 0.02 0.02 0.02 0.02 0.02 0.03 0.03 0.03 0.04 0.03 0.03+ 0.03 0.03 0.03 0.03 0.03 0.03 0.03 0.02 0.03 0.02 0.02 0.02+ 0.02 0.02 0.02 0.02 0.02 0.03 0.03 0.03 0.03 0.04 0.04 0.03+ 0.03 0.03 0.03 0.03 0.03 0.03 0.03 0.03 0.03 0.02 0.02 0.02+ 0.02 0.02 0.02 0.02 0.02 0.03 0.03 0.03 0.03 0.04 0.03 0.03+ 0.04 0.03 0.03 0.03 0.03 0.03 0.03 0.03 0.03 0.02 0.02 0.02+ 0.02 0.02 0.02 0.02 0.02 0.03 0.03 0.03 0.03 0.04 0.04 0.04+ 0.03 0.03 0.03 0.03 0.03 0.03 0.03 0.03 0.03 0.02 0.02 0.02+ 0.02 0.02 0.02 0.02 0.02 0.02 0.02 0.03 0.03 0.02 0.03 0.03+ 0.03 0.03 0.02 0.03 0.03 0.03 0.03 0.02 0.02 0.02 0.02 0.02+ 0.02 0.02 0.02 0.02 0.02 0.02 0.03 0.02 0.03 0.03 0.03 0.03+ 0.03 0.03 0.02 0.03 0.03 0.03 0.03 0.02 0.02 0.02 0.02 0.02+ TIME= WEEK+ MULT= 1.00+ ADD = 0.00X Weekly Load TJ = 0.63X Each figure represents average hourly flow rate in std. m3/sX Profile date = 15 JUNE 2009 - 21 JUNE 2009X ==========================================================X DELIVERY POINT KAKARIKIX CODERAMP KAKEXT.V1= 0.00+ 0.01 0.01 0.00 0.01 0.00 0.01 0.00 0.01 0.01 0.01 0.00 0.01+ 0.00 0.01 0.00 0.00 0.01 0.03 0.03 0.03 0.02 0.00 0.01 0.03+ 0.04 0.03 0.01 0.00 0.00 0.00 0.00 0.00 0.00 0.01 0.03 0.03+ 0.03 0.02 0.03 0.03 0.03 0.04 0.03 0.03 0.03 0.03 0.04 0.03+ 0.03 0.03 0.01 0.00 0.00 0.00 0.00 0.00 0.00 0.01 0.01 0.01+ 0.01 0.00 0.01 0.02 0.03 0.03 0.03 0.04 0.03 0.03 0.03 0.02+ 0.03 0.03 0.01 0.00 0.00 0.00 0.00 0.00 0.00 0.01 0.01 0.01+ 0.00 0.01 0.01 0.01 0.03 0.03 0.03 0.03 0.04 0.03 0.03 0.03+ 0.03 0.03 0.03 0.00 0.00 0.00 0.00 0.00 0.00 0.01 0.01 0.01+ 0.01 0.01 0.03 0.03 0.03 0.03 0.04 0.03 0.03 0.03 0.03 0.03+ 0.03 0.03 0.01 0.00 0.00 0.00 0.00 0.00 0.00 0.01 0.00 0.01+ 0.01 0.01 0.01 0.01 0.01 0.01 0.00 0.00 0.00 0.00 0.00 0.00+ 0.00 0.00 0.00 0.00 0.00 0.00 0.00 0.00 0.00 0.00 0.00 0.00+ 0.00 0.00 0.00 0.00 0.00 0.00 0.00 0.00 0.00 0.00 0.00 0.00+ TIME= WEEK+ MULT= 1.00+ ADD = 0.00X Weekly Load TJ = 0.30X Each figure represents average hourly flow rate in std. m3/sX Profile date = 15 JUNE 2009 - 21 JUNE 2009X ==========================================================
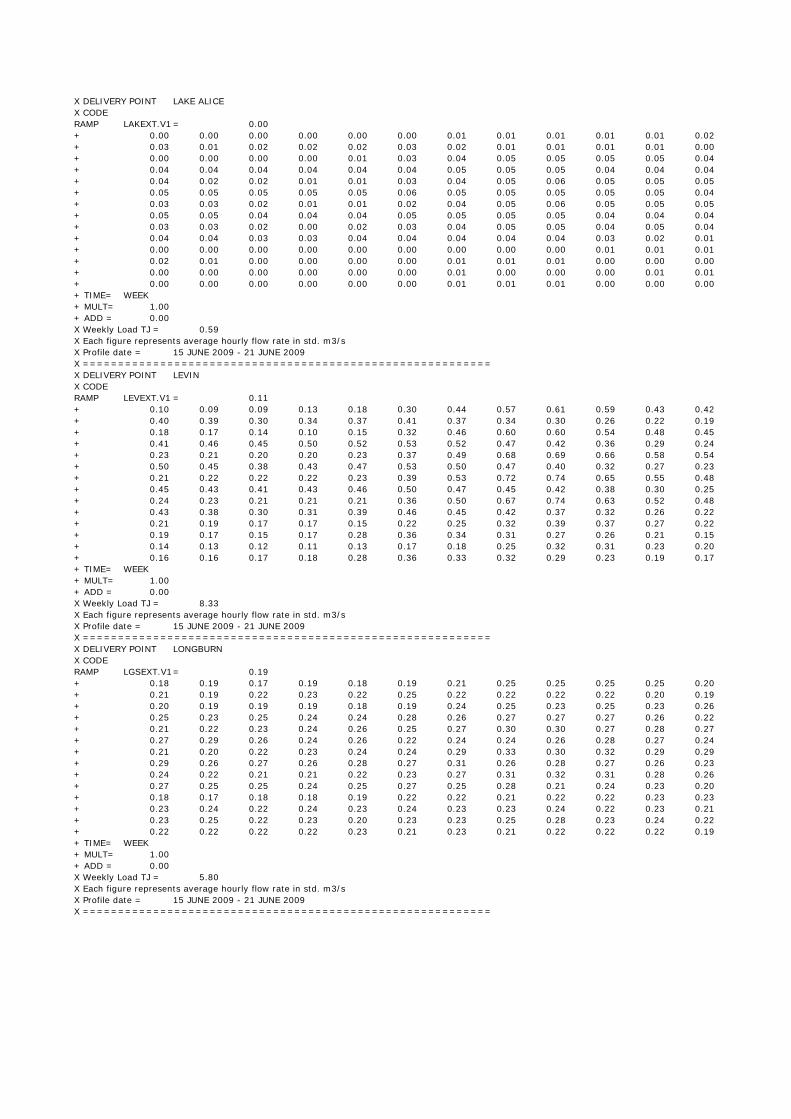
X DELIVERY POINT LAKE ALICEX CODERAMP LAKEXT.V1 = 0.00+ 0.00 0.00 0.00 0.00 0.00 0.00 0.01 0.01 0.01 0.01 0.01 0.02+ 0.03 0.01 0.02 0.02 0.02 0.03 0.02 0.01 0.01 0.01 0.01 0.00+ 0.00 0.00 0.00 0.00 0.01 0.03 0.04 0.05 0.05 0.05 0.05 0.04+ 0.04 0.04 0.04 0.04 0.04 0.04 0.05 0.05 0.05 0.04 0.04 0.04+ 0.04 0.02 0.02 0.01 0.01 0.03 0.04 0.05 0.06 0.05 0.05 0.05+ 0.05 0.05 0.05 0.05 0.05 0.06 0.05 0.05 0.05 0.05 0.05 0.04+ 0.03 0.03 0.02 0.01 0.01 0.02 0.04 0.05 0.06 0.05 0.05 0.05+ 0.05 0.05 0.04 0.04 0.04 0.05 0.05 0.05 0.05 0.04 0.04 0.04+ 0.03 0.03 0.02 0.00 0.02 0.03 0.04 0.05 0.05 0.04 0.05 0.04+ 0.04 0.04 0.03 0.03 0.04 0.04 0.04 0.04 0.04 0.03 0.02 0.01+ 0.00 0.00 0.00 0.00 0.00 0.00 0.00 0.00 0.00 0.01 0.01 0.01+ 0.02 0.01 0.00 0.00 0.00 0.00 0.01 0.01 0.01 0.00 0.00 0.00+ 0.00 0.00 0.00 0.00 0.00 0.00 0.01 0.00 0.00 0.00 0.01 0.01+ 0.00 0.00 0.00 0.00 0.00 0.00 0.01 0.01 0.01 0.00 0.00 0.00+ TIME= WEEK+ MULT= 1.00+ ADD = 0.00X Weekly Load TJ = 0.59X Each figure represents average hourly flow rate in std. m3/sX Profile date = 15 JUNE 2009 - 21 JUNE 2009X ==========================================================X DELIVERY POINT LEVINX CODERAMP LEVEXT.V1 = 0.11+ 0.10 0.09 0.09 0.13 0.18 0.30 0.44 0.57 0.61 0.59 0.43 0.42+ 0.40 0.39 0.30 0.34 0.37 0.41 0.37 0.34 0.30 0.26 0.22 0.19+ 0.18 0.17 0.14 0.10 0.15 0.32 0.46 0.60 0.60 0.54 0.48 0.45+ 0.41 0.46 0.45 0.50 0.52 0.53 0.52 0.47 0.42 0.36 0.29 0.24+ 0.23 0.21 0.20 0.20 0.23 0.37 0.49 0.68 0.69 0.66 0.58 0.54+ 0.50 0.45 0.38 0.43 0.47 0.53 0.50 0.47 0.40 0.32 0.27 0.23+ 0.21 0.22 0.22 0.22 0.23 0.39 0.53 0.72 0.74 0.65 0.55 0.48+ 0.45 0.43 0.41 0.43 0.46 0.50 0.47 0.45 0.42 0.38 0.30 0.25+ 0.24 0.23 0.21 0.21 0.21 0.36 0.50 0.67 0.74 0.63 0.52 0.48+ 0.43 0.38 0.30 0.31 0.39 0.46 0.45 0.42 0.37 0.32 0.26 0.22+ 0.21 0.19 0.17 0.17 0.15 0.22 0.25 0.32 0.39 0.37 0.27 0.22+ 0.19 0.17 0.15 0.17 0.28 0.36 0.34 0.31 0.27 0.26 0.21 0.15+ 0.14 0.13 0.12 0.11 0.13 0.17 0.18 0.25 0.32 0.31 0.23 0.20+ 0.16 0.16 0.17 0.18 0.28 0.36 0.33 0.32 0.29 0.23 0.19 0.17+ TIME= WEEK+ MULT= 1.00+ ADD = 0.00X Weekly Load TJ = 8.33X Each figure represents average hourly flow rate in std. m3/sX Profile date = 15 JUNE 2009 - 21 JUNE 2009X ==========================================================X DELIVERY POINT LONGBURNX CODERAMP LGSEXT.V1= 0.19+ 0.18 0.19 0.17 0.19 0.18 0.19 0.21 0.25 0.25 0.25 0.25 0.20+ 0.21 0.19 0.22 0.23 0.22 0.25 0.22 0.22 0.22 0.22 0.20 0.19+ 0.20 0.19 0.19 0.19 0.18 0.19 0.24 0.25 0.23 0.25 0.23 0.26+ 0.25 0.23 0.25 0.24 0.24 0.28 0.26 0.27 0.27 0.27 0.26 0.22+ 0.21 0.22 0.23 0.24 0.26 0.25 0.27 0.30 0.30 0.27 0.28 0.27+ 0.27 0.29 0.26 0.24 0.26 0.22 0.24 0.24 0.26 0.28 0.27 0.24+ 0.21 0.20 0.22 0.23 0.24 0.24 0.29 0.33 0.30 0.32 0.29 0.29+ 0.29 0.26 0.27 0.26 0.28 0.27 0.31 0.26 0.28 0.27 0.26 0.23+ 0.24 0.22 0.21 0.21 0.22 0.23 0.27 0.31 0.32 0.31 0.28 0.26+ 0.27 0.25 0.25 0.24 0.25 0.27 0.25 0.28 0.21 0.24 0.23 0.20+ 0.18 0.17 0.18 0.18 0.19 0.22 0.22 0.21 0.22 0.22 0.23 0.23+ 0.23 0.24 0.22 0.24 0.23 0.24 0.23 0.23 0.24 0.22 0.23 0.21+ 0.23 0.25 0.22 0.23 0.20 0.23 0.23 0.25 0.28 0.23 0.24 0.22+ 0.22 0.22 0.22 0.22 0.23 0.21 0.23 0.21 0.22 0.22 0.22 0.19+ TIME= WEEK+ MULT= 1.00+ ADD = 0.00X Weekly Load TJ = 5.80X Each figure represents average hourly flow rate in std. m3/sX Profile date = 15 JUNE 2009 - 21 JUNE 2009X ==========================================================

X DELIVERY POINT MANAIAX CODERAMP MIAEXT.V1 = 0.02+ 0.03 0.03 0.03 0.03 0.02 0.03 0.03 0.04 0.04 0.03 0.04 0.03+ 0.03 0.03 0.03 0.03 0.02 0.02 0.02 0.02 0.02 0.04 0.03 0.03+ 0.03 0.03 0.03 0.03 0.03 0.03 0.04 0.04 0.04 0.03 0.04 0.04+ 0.03 0.03 0.02 0.02 0.02 0.03 0.03 0.02 0.02 0.02 0.02 0.04+ 0.04 0.03 0.04 0.04 0.03 0.04 0.04 0.04 0.05 0.05 0.04 0.04+ 0.04 0.04 0.03 0.02 0.02 0.03 0.03 0.03 0.03 0.03 0.04 0.03+ 0.03 0.03 0.03 0.03 0.03 0.03 0.04 0.05 0.05 0.04 0.04 0.04+ 0.04 0.03 0.03 0.02 0.02 0.02 0.03 0.04 0.05 0.03 0.03 0.04+ 0.03 0.04 0.04 0.03 0.04 0.03 0.04 0.05 0.04 0.04 0.03 0.04+ 0.04 0.02 0.01 0.01 0.02 0.02 0.03 0.04 0.04 0.03 0.03 0.03+ 0.03 0.04 0.03 0.03 0.03 0.03 0.03 0.04 0.04 0.04 0.03 0.02+ 0.02 0.02 0.02 0.02 0.02 0.02 0.04 0.05 0.03 0.03 0.03 0.03+ 0.03 0.04 0.03 0.03 0.03 0.03 0.03 0.03 0.04 0.04 0.04 0.04+ 0.03 0.02 0.01 0.01 0.02 0.02 0.04 0.04 0.03 0.03 0.03 0.01+ TIME= WEEK+ MULT= 1.00+ ADD = 0.00X Weekly Load TJ = 0.76X Each figure represents average hourly flow rate in std. m3/sX Profile date = 15 JUNE 2009 - 21 JUNE 2009X ==========================================================X DELIVERY POINT MANGAROAX CODERAMP MNGEXT.V1= 0.02+ 0.02 0.02 0.02 0.02 0.02 0.03 0.03 0.03 0.03 0.03 0.03 0.03+ 0.03 0.03 0.03 0.02 0.02 0.03 0.03 0.02 0.02 0.02 0.02 0.02+ 0.02 0.02 0.02 0.02 0.02 0.03 0.03 0.03 0.03 0.03 0.03 0.03+ 0.03 0.03 0.03 0.03 0.03 0.03 0.03 0.03 0.02 0.02 0.02 0.02+ 0.02 0.02 0.02 0.02 0.03 0.03 0.03 0.03 0.04 0.03 0.03 0.03+ 0.03 0.03 0.03 0.03 0.03 0.03 0.03 0.03 0.03 0.02 0.02 0.02+ 0.02 0.02 0.02 0.02 0.03 0.03 0.03 0.03 0.03 0.03 0.03 0.03+ 0.03 0.03 0.03 0.03 0.03 0.03 0.03 0.02 0.02 0.02 0.02 0.02+ 0.02 0.02 0.02 0.02 0.03 0.03 0.03 0.03 0.03 0.03 0.03 0.03+ 0.03 0.03 0.03 0.03 0.03 0.03 0.03 0.03 0.02 0.02 0.02 0.02+ 0.02 0.02 0.02 0.02 0.02 0.02 0.02 0.03 0.03 0.03 0.03 0.03+ 0.03 0.03 0.03 0.03 0.03 0.02 0.02 0.02 0.02 0.02 0.02 0.02+ 0.02 0.02 0.02 0.02 0.02 0.03 0.02 0.02 0.03 0.03 0.03 0.03+ 0.03 0.03 0.02 0.02 0.02 0.03 0.03 0.02 0.02 0.02 0.02 0.02+ TIME= WEEK+ MULT= 1.00+ ADD = 0.00X Weekly Load TJ = 0.63X Each figure represents average hourly flow rate in std. m3/sX Profile date = 15 JUNE 2009 - 21 JUNE 2009X ==========================================================X DELIVERY POINT MANGATAINOKAX CODERAMP MANEXT.V1= 0.00+ 0.00 0.00 0.00 0.00 0.02 0.02 0.02 0.02 0.02 0.02 0.02 0.01+ 0.02 0.01 0.01 0.01 0.01 0.01 0.01 0.01 0.00 0.00 0.00 0.00+ 0.00 0.00 0.01 0.02 0.07 0.04 0.03 0.05 0.07 0.05 0.03 0.07+ 0.07 0.05 0.03 0.06 0.06 0.04 0.01 0.02 0.02 0.01 0.00 0.00+ 0.00 0.00 0.00 0.00 0.02 0.01 0.01 0.01 0.01 0.02 0.01 0.01+ 0.01 0.01 0.01 0.01 0.01 0.00 0.00 0.00 0.00 0.00 0.00 0.00+ 0.00 0.00 0.00 0.00 0.02 0.02 0.02 0.02 0.02 0.02 0.01 0.01+ 0.01 0.01 0.01 0.02 0.00 0.00 0.00 0.00 0.00 0.01 0.00 0.00+ 0.00 0.00 0.00 0.00 0.00 0.02 0.05 0.08 0.10 0.09 0.07 0.07+ 0.05 0.06 0.05 0.05 0.03 0.00 0.00 0.00 0.00 0.00 0.00 0.00+ 0.00 0.00 0.00 0.00 0.00 0.00 0.00 0.00 0.00 0.00 0.00 0.00+ 0.00 0.00 0.00 0.00 0.00 0.00 0.00 0.00 0.00 0.00 0.00 0.00+ 0.00 0.00 0.00 0.00 0.00 0.00 0.00 0.00 0.00 0.00 0.00 0.00+ 0.00 0.00 0.00 0.00 0.00 0.00 0.00 0.00 0.00 0.00 0.00 0.00+ TIME= WEEK+ MULT= 1.00+ ADD = 0.00X Weekly Load TJ = 0.33X Each figure represents average hourly flow rate in std. m3/sX Profile date = 15 JUNE 2009 - 21 JUNE 2009X ==========================================================

X DELIVERY POINT MARTONX CODERAMP MONEXT.V = 0.23+ 0.23 0.20 0.19 0.17 0.16 0.16 0.19 0.20 0.16 0.09 0.19 0.19+ 0.19 0.19 0.21 0.22 0.23 0.25 0.26 0.27 0.27 0.27 0.26 0.27+ 0.26 0.26 0.27 0.25 0.27 0.26 0.29 0.27 0.27 0.26 0.25 0.26+ 0.12 0.10 0.10 0.10 0.11 0.10 0.10 0.10 0.09 0.09 0.07 0.07+ 0.07 0.08 0.07 0.07 0.11 0.26 0.27 0.29 0.30 0.29 0.30 0.29+ 0.29 0.31 0.30 0.32 0.31 0.32 0.33 0.33 0.34 0.34 0.32 0.32+ 0.30 0.30 0.27 0.24 0.23 0.21 0.12 0.12 0.12 0.12 0.10 0.10+ 0.09 0.09 0.09 0.08 0.08 0.10 0.10 0.10 0.09 0.08 0.07 0.06+ 0.06 0.05 0.05 0.05 0.06 0.08 0.10 0.12 0.11 0.11 0.10 0.09+ 0.08 0.11 0.08 0.07 0.06 0.06 0.06 0.05 0.04 0.04 0.03 0.01+ 0.01 0.00 0.01 0.00 0.04 0.18 0.18 0.19 0.20 0.20 0.20 0.21+ 0.21 0.21 0.21 0.23 0.24 0.27 0.26 0.25 0.26 0.26 0.24 0.23+ 0.23 0.21 0.20 0.18 0.16 0.15 0.08 0.03 0.04 0.05 0.04 0.03+ 0.16 0.16 0.17 0.17 0.20 0.21 0.23 0.23 0.24 0.23 0.23 0.14+ TIME= WEEK+ MULT= 1.00+ ADD = 0.00X Weekly Load TJ = 4.15X Each figure represents average hourly flow rate in std. m3/sX Profile date = 15 JUNE 2009 - 21 JUNE 2009X ==========================================================X DELIVERY POINT OKAIAWAX CODERAMP OKIEXT.V1 = 0.18+ 0.26 0.22 0.18 0.12 0.09 0.09 0.09 0.08 0.08 0.07 0.03 0.02+ 0.12 0.15 0.16 0.18 0.17 0.20 0.27 0.31 0.37 0.38 0.38 0.38+ 0.37 0.36 0.29 0.22 0.21 0.22 0.19 0.14 0.13 0.13 0.16 0.16+ 0.15 0.14 0.13 0.12 0.24 0.30 0.36 0.40 0.40 0.40 0.33 0.33+ 0.41 0.41 0.37 0.30 0.31 0.36 0.39 0.38 0.40 0.35 0.36 0.36+ 0.33 0.23 0.20 0.19 0.20 0.30 0.32 0.42 0.42 0.39 0.38 0.40+ 0.39 0.42 0.41 0.41 0.37 0.35 0.33 0.32 0.34 0.35 0.35 0.33+ 0.33 0.25 0.18 0.17 0.13 0.12 0.13 0.29 0.35 0.36 0.39 0.34+ 0.38 0.39 0.39 0.39 0.39 0.39 0.38 0.30 0.39 0.41 0.37 0.33+ 0.09 0.08 0.11 0.20 0.16 0.29 0.19 0.22 0.28 0.32 0.34 0.34+ 0.34 0.34 0.34 0.32 0.32 0.32 0.32 0.31 0.30 0.23 0.27 0.30+ 0.27 0.26 0.30 0.31 0.31 0.30 0.25 0.22 0.27 0.34 0.34 0.33+ 0.32 0.32 0.32 0.31 0.26 0.24 0.29 0.31 0.31 0.31 0.22 0.19+ 0.19 0.16 0.16 0.13 0.15 0.15 0.16 0.15 0.22 0.29 0.31 0.00+ TIME= WEEK+ MULT= 1.00+ ADD = 0.00X Weekly Load TJ = 6.62X Each figure represents average hourly flow rate in std. m3/sX Profile date = 15 JUNE 2009 - 21 JUNE 2009X ==========================================================X DELIVERY POINT OROUA DOWNSX CODERAMP ORUEXT.V1= 0.00+ 0.00 0.00 0.00 0.00 0.00 0.00 0.00 0.00 0.00 0.00 0.00 0.00+ 0.00 0.00 0.02 0.05 0.05 0.04 0.05 0.05 0.05 0.05 0.05 0.00+ 0.00 0.00 0.00 0.00 0.00 0.00 0.00 0.00 0.03 0.05 0.05 0.05+ 0.03 0.00 0.00 0.02 0.06 0.06 0.06 0.06 0.06 0.06 0.06 0.06+ 0.03 0.00 0.00 0.00 0.00 0.00 0.00 0.00 0.00 0.04 0.06 0.06+ 0.06 0.06 0.06 0.06 0.06 0.06 0.06 0.06 0.06 0.06 0.06 0.06+ 0.06 0.00 0.00 0.00 0.00 0.05 0.06 0.06 0.06 0.06 0.06 0.06+ 0.06 0.05 0.05 0.06 0.06 0.06 0.06 0.06 0.06 0.06 0.06 0.06+ 0.03 0.00 0.00 0.00 0.00 0.02 0.06 0.06 0.06 0.06 0.06 0.06+ 0.06 0.06 0.05 0.06 0.06 0.06 0.06 0.05 0.00 0.00 0.00 0.00+ 0.00 0.00 0.00 0.00 0.00 0.00 0.00 0.01 0.06 0.06 0.06 0.06+ 0.06 0.05 0.06 0.06 0.06 0.06 0.06 0.06 0.06 0.06 0.06 0.06+ 0.06 0.06 0.06 0.06 0.06 0.06 0.06 0.06 0.06 0.06 0.06 0.06+ 0.06 0.06 0.06 0.06 0.06 0.06 0.06 0.06 0.06 0.06 0.06 0.01+ TIME= WEEK+ MULT= 1.00+ ADD = 0.00X Weekly Load TJ = 0.92X Each figure represents average hourly flow rate in std. m3/sX Profile date = 15 JUNE 2009 - 21 JUNE 2009X ==========================================================

X DELIVERY POINT OTAKIX CODERAMP OTKEXT.V1= 0.01+ 0.01 0.01 0.01 0.01 0.01 0.01 0.02 0.05 0.06 0.04 0.03 0.02+ 0.02 0.02 0.02 0.02 0.03 0.03 0.06 0.04 0.03 0.03 0.02 0.02+ 0.02 0.02 0.02 0.02 0.02 0.02 0.03 0.05 0.05 0.04 0.03 0.03+ 0.03 0.03 0.04 0.04 0.06 0.05 0.05 0.05 0.04 0.03 0.03 0.02+ 0.02 0.01 0.02 0.02 0.02 0.02 0.04 0.06 0.06 0.06 0.05 0.05+ 0.03 0.04 0.02 0.03 0.05 0.05 0.06 0.05 0.05 0.04 0.03 0.02+ 0.02 0.02 0.02 0.02 0.02 0.03 0.05 0.07 0.06 0.06 0.05 0.06+ 0.04 0.04 0.04 0.03 0.04 0.05 0.05 0.05 0.05 0.04 0.03 0.02+ 0.02 0.02 0.01 0.01 0.01 0.02 0.04 0.06 0.06 0.05 0.04 0.04+ 0.04 0.02 0.02 0.01 0.03 0.04 0.04 0.04 0.04 0.03 0.02 0.02+ 0.01 0.01 0.01 0.01 0.01 0.01 0.01 0.02 0.03 0.02 0.03 0.03+ 0.03 0.03 0.02 0.03 0.03 0.05 0.04 0.04 0.03 0.03 0.02 0.02+ 0.01 0.01 0.01 0.01 0.01 0.01 0.01 0.02 0.03 0.04 0.03 0.03+ 0.03 0.03 0.03 0.03 0.04 0.04 0.04 0.04 0.03 0.03 0.02 0.02+ TIME= WEEK+ MULT= 1.00+ ADD = 0.00X Weekly Load TJ = 0.74X Each figure represents average hourly flow rate in std. m3/sX Profile date = 15 JUNE 2009 - 21 JUNE 2009X ==========================================================X DELIVERY POINT PAHIATUAX CODERAMP PAHEXT.V1= 0.26+ 0.25 0.25 0.25 0.25 0.26 0.25 0.26 0.29 0.18 0.11 0.08 0.06+ 0.05 0.07 0.09 0.05 0.04 0.05 0.04 0.04 0.05 0.04 0.04 0.03+ 0.03 0.04 0.03 0.04 0.04 0.05 0.06 0.06 0.06 0.06 0.06 0.07+ 0.05 0.07 0.07 0.09 0.11 0.15 0.22 0.28 0.26 0.27 0.27 0.27+ 0.28 0.27 0.27 0.26 0.27 0.27 0.15 0.13 0.07 0.06 0.06 0.06+ 0.05 0.05 0.06 0.06 0.06 0.04 0.06 0.05 0.05 0.05 0.05 0.04+ 0.04 0.04 0.04 0.04 0.05 0.06 0.08 0.07 0.07 0.06 0.05 0.05+ 0.04 0.05 0.04 0.04 0.05 0.04 0.04 0.05 0.05 0.05 0.05 0.05+ 0.04 0.04 0.04 0.04 0.04 0.04 0.07 0.07 0.07 0.06 0.07 0.06+ 0.06 0.06 0.15 0.13 0.31 0.28 0.28 0.27 0.28 0.28 0.29 0.28+ 0.30 0.27 0.27 0.26 0.27 0.27 0.27 0.14 0.12 0.10 0.11 0.05+ 0.06 0.06 0.06 0.06 0.06 0.06 0.05 0.05 0.05 0.05 0.04 0.04+ 0.04 0.04 0.04 0.04 0.04 0.04 0.04 0.04 0.04 0.04 0.05 0.06+ 0.07 0.07 0.05 0.05 0.05 0.05 0.04 0.04 0.05 0.04 0.04 0.00+ TIME= WEEK+ MULT= 1.00+ ADD = 0.00X Weekly Load TJ = 2.51X Each figure represents average hourly flow rate in std. m3/sX Profile date = 15 JUNE 2009 - 21 JUNE 2009X ==========================================================X DELIVERY POINT PALMERSTON NORTHX CODERAMP PNTEXT.V1= 0.55+ 0.48 0.45 0.43 0.46 0.58 0.75 1.36 1.93 1.81 1.55 1.44 1.41+ 1.37 1.33 1.21 1.24 1.40 1.72 1.82 1.73 1.53 1.23 0.89 0.61+ 0.51 0.50 0.50 0.48 0.54 0.75 1.41 1.99 2.00 1.67 1.52 1.53+ 1.36 1.37 1.54 1.75 1.92 2.11 2.19 2.11 1.94 1.63 1.19 0.84+ 0.70 0.68 0.66 0.67 0.72 1.02 1.78 2.58 2.63 2.37 2.15 2.02+ 1.82 1.76 1.61 1.52 1.78 2.21 2.35 2.24 2.10 1.81 1.33 0.89+ 0.72 0.70 0.67 0.68 0.73 1.00 1.78 2.58 2.60 2.31 2.08 1.91+ 1.73 1.48 1.28 1.30 1.61 2.07 2.22 2.15 1.98 1.70 1.25 0.89+ 0.73 0.70 0.69 0.70 0.78 1.04 1.80 2.60 2.66 2.31 2.04 1.81+ 1.57 1.38 1.25 1.25 1.55 1.90 2.03 1.98 1.84 1.61 1.27 0.91+ 0.72 0.62 0.60 0.61 0.66 0.70 0.94 1.33 1.71 1.77 1.61 1.46+ 1.29 1.21 1.07 1.15 1.45 1.78 1.82 1.69 1.56 1.43 1.19 0.92+ 0.71 0.63 0.59 0.57 0.61 0.68 0.83 1.13 1.49 1.75 1.62 1.37+ 1.09 0.97 0.97 1.02 1.27 1.68 1.77 1.73 1.53 1.33 0.98 0.00+ TIME= WEEK+ MULT= 1.00+ ADD = 0.00X Weekly Load TJ = 33.43X Each figure represents average hourly flow rate in std. m3/sX Profile date = 15 JUNE 2009 - 21 JUNE 2009X ==========================================================
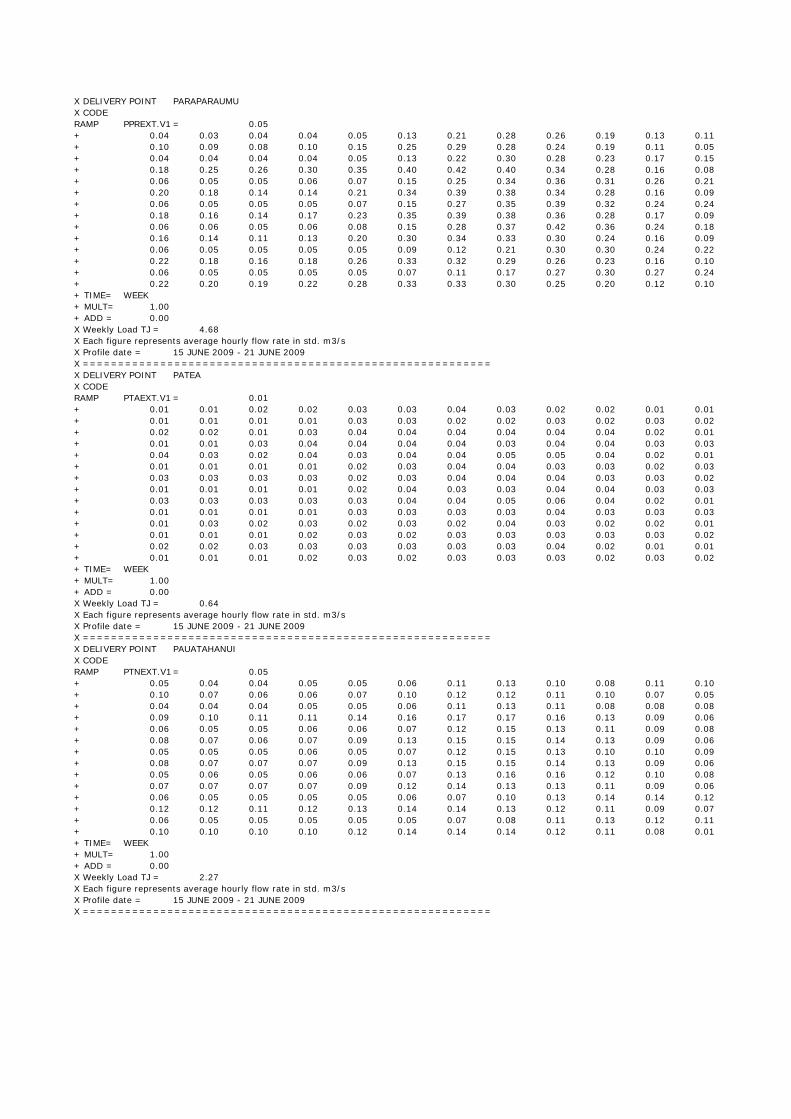
X DELIVERY POINT PARAPARAUMUX CODERAMP PPREXT.V1 = 0.05+ 0.04 0.03 0.04 0.04 0.05 0.13 0.21 0.28 0.26 0.19 0.13 0.11+ 0.10 0.09 0.08 0.10 0.15 0.25 0.29 0.28 0.24 0.19 0.11 0.05+ 0.04 0.04 0.04 0.04 0.05 0.13 0.22 0.30 0.28 0.23 0.17 0.15+ 0.18 0.25 0.26 0.30 0.35 0.40 0.42 0.40 0.34 0.28 0.16 0.08+ 0.06 0.05 0.05 0.06 0.07 0.15 0.25 0.34 0.36 0.31 0.26 0.21+ 0.20 0.18 0.14 0.14 0.21 0.34 0.39 0.38 0.34 0.28 0.16 0.09+ 0.06 0.05 0.05 0.05 0.07 0.15 0.27 0.35 0.39 0.32 0.24 0.24+ 0.18 0.16 0.14 0.17 0.23 0.35 0.39 0.38 0.36 0.28 0.17 0.09+ 0.06 0.06 0.05 0.06 0.08 0.15 0.28 0.37 0.42 0.36 0.24 0.18+ 0.16 0.14 0.11 0.13 0.20 0.30 0.34 0.33 0.30 0.24 0.16 0.09+ 0.06 0.05 0.05 0.05 0.05 0.09 0.12 0.21 0.30 0.30 0.24 0.22+ 0.22 0.18 0.16 0.18 0.26 0.33 0.32 0.29 0.26 0.23 0.16 0.10+ 0.06 0.05 0.05 0.05 0.05 0.07 0.11 0.17 0.27 0.30 0.27 0.24+ 0.22 0.20 0.19 0.22 0.28 0.33 0.33 0.30 0.25 0.20 0.12 0.10+ TIME= WEEK+ MULT= 1.00+ ADD = 0.00X Weekly Load TJ = 4.68X Each figure represents average hourly flow rate in std. m3/sX Profile date = 15 JUNE 2009 - 21 JUNE 2009X ==========================================================X DELIVERY POINT PATEAX CODERAMP PTAEXT.V1 = 0.01+ 0.01 0.01 0.02 0.02 0.03 0.03 0.04 0.03 0.02 0.02 0.01 0.01+ 0.01 0.01 0.01 0.01 0.03 0.03 0.02 0.02 0.03 0.02 0.03 0.02+ 0.02 0.02 0.01 0.03 0.04 0.04 0.04 0.04 0.04 0.04 0.02 0.01+ 0.01 0.01 0.03 0.04 0.04 0.04 0.04 0.03 0.04 0.04 0.03 0.03+ 0.04 0.03 0.02 0.04 0.03 0.04 0.04 0.05 0.05 0.04 0.02 0.01+ 0.01 0.01 0.01 0.01 0.02 0.03 0.04 0.04 0.03 0.03 0.02 0.03+ 0.03 0.03 0.03 0.03 0.02 0.03 0.04 0.04 0.04 0.03 0.03 0.02+ 0.01 0.01 0.01 0.01 0.02 0.04 0.03 0.03 0.04 0.04 0.03 0.03+ 0.03 0.03 0.03 0.03 0.03 0.04 0.04 0.05 0.06 0.04 0.02 0.01+ 0.01 0.01 0.01 0.01 0.03 0.03 0.03 0.03 0.04 0.03 0.03 0.03+ 0.01 0.03 0.02 0.03 0.02 0.03 0.02 0.04 0.03 0.02 0.02 0.01+ 0.01 0.01 0.01 0.02 0.03 0.02 0.03 0.03 0.03 0.03 0.03 0.02+ 0.02 0.02 0.03 0.03 0.03 0.03 0.03 0.03 0.04 0.02 0.01 0.01+ 0.01 0.01 0.01 0.02 0.03 0.02 0.03 0.03 0.03 0.02 0.03 0.02+ TIME= WEEK+ MULT= 1.00+ ADD = 0.00X Weekly Load TJ = 0.64X Each figure represents average hourly flow rate in std. m3/sX Profile date = 15 JUNE 2009 - 21 JUNE 2009X ==========================================================X DELIVERY POINT PAUATAHANUI X CODERAMP PTNEXT.V1= 0.05+ 0.05 0.04 0.04 0.05 0.05 0.06 0.11 0.13 0.10 0.08 0.11 0.10+ 0.10 0.07 0.06 0.06 0.07 0.10 0.12 0.12 0.11 0.10 0.07 0.05+ 0.04 0.04 0.04 0.05 0.05 0.06 0.11 0.13 0.11 0.08 0.08 0.08+ 0.09 0.10 0.11 0.11 0.14 0.16 0.17 0.17 0.16 0.13 0.09 0.06+ 0.06 0.05 0.05 0.06 0.06 0.07 0.12 0.15 0.13 0.11 0.09 0.08+ 0.08 0.07 0.06 0.07 0.09 0.13 0.15 0.15 0.14 0.13 0.09 0.06+ 0.05 0.05 0.05 0.06 0.05 0.07 0.12 0.15 0.13 0.10 0.10 0.09+ 0.08 0.07 0.07 0.07 0.09 0.13 0.15 0.15 0.14 0.13 0.09 0.06+ 0.05 0.06 0.05 0.06 0.06 0.07 0.13 0.16 0.16 0.12 0.10 0.08+ 0.07 0.07 0.07 0.07 0.09 0.12 0.14 0.13 0.13 0.11 0.09 0.06+ 0.06 0.05 0.05 0.05 0.05 0.06 0.07 0.10 0.13 0.14 0.14 0.12+ 0.12 0.12 0.11 0.12 0.13 0.14 0.14 0.13 0.12 0.11 0.09 0.07+ 0.06 0.05 0.05 0.05 0.05 0.05 0.07 0.08 0.11 0.13 0.12 0.11+ 0.10 0.10 0.10 0.10 0.12 0.14 0.14 0.14 0.12 0.11 0.08 0.01+ TIME= WEEK+ MULT= 1.00+ ADD = 0.00X Weekly Load TJ = 2.27X Each figure represents average hourly flow rate in std. m3/sX Profile date = 15 JUNE 2009 - 21 JUNE 2009X ==========================================================

X DELIVERY POINT TAKAPAUX CODERAMP TAKEXT.V1= 0.00+ 0.00 0.00 0.00 0.00 0.00 0.00 0.00 0.00 0.00 0.00 0.00 0.00+ 0.00 0.00 0.00 0.00 0.00 0.00 0.00 0.00 0.00 0.00 0.00 0.00+ 0.00 0.00 0.00 0.00 0.00 0.00 0.00 0.00 0.00 0.00 0.02 0.02+ 0.02 0.03 0.05 0.04 0.08 0.07 0.07 0.09 0.15 0.12 0.07 0.06+ 0.08 0.09 0.05 0.05 0.03 0.05 0.11 0.15 0.15 0.10 0.10 0.16+ 0.16 0.18 0.17 0.15 0.12 0.13 0.13 0.12 0.10 0.10 0.11 0.11+ 0.09 0.10 0.05 0.04 0.06 0.06 0.13 0.17 0.18 0.18 0.18 0.18+ 0.20 0.21 0.21 0.18 0.17 0.17 0.08 0.08 0.12 0.14 0.12 0.11+ 0.15 0.16 0.13 0.12 0.11 0.14 0.14 0.16 0.17 0.17 0.17 0.17+ 0.16 0.13 0.13 0.16 0.15 0.15 0.14 0.11 0.10 0.10 0.05 0.02+ 0.02 0.02 0.00 0.00 0.00 0.01 0.00 0.00 0.00 0.00 0.00 0.00+ 0.00 0.00 0.00 0.00 0.00 0.00 0.00 0.00 0.00 0.00 0.00 0.00+ 0.00 0.00 0.00 0.00 0.00 0.00 0.00 0.01 0.02 0.02 0.02 0.01+ 0.02 0.03 0.04 0.09 0.06 0.06 0.06 0.06 0.06 0.06 0.06 0.02+ TIME= WEEK+ MULT= 1.00+ ADD = 0.00X Weekly Load TJ = 1.56X Each figure represents average hourly flow rate in std. m3/sX Profile date = 15 JUNE 2009 - 21 JUNE 2009X ==========================================================X DELIVERY POINT TAWAX CODERAMP TAWEXT.V1= 1.15+ 1.04 1.04 0.99 1.04 1.32 1.93 3.72 5.54 5.33 4.01 3.49 3.09+ 2.97 2.97 2.91 2.80 3.15 3.79 4.13 3.90 3.44 2.92 2.14 1.48+ 1.21 0.99 0.99 1.04 1.21 1.82 3.72 5.69 5.69 5.00 4.71 4.71+ 4.80 5.13 5.11 5.14 5.37 5.66 5.73 5.48 5.06 4.24 3.13 1.98+ 1.65 1.48 1.43 1.43 1.70 2.31 4.13 6.42 6.74 5.53 4.81 4.58+ 4.22 3.89 3.62 3.73 4.11 4.74 5.14 4.95 4.55 3.84 2.85 1.81+ 1.48 1.32 1.32 1.32 1.59 2.09 3.96 6.31 6.39 5.18 4.87 4.34+ 4.05 3.78 3.56 3.56 3.84 4.66 4.99 4.87 4.44 3.78 2.90 1.97+ 1.54 1.43 1.37 1.43 1.65 2.47 4.21 6.46 7.01 5.70 4.77 4.28+ 3.94 3.78 3.40 3.34 3.67 4.39 4.55 4.44 4.06 3.56 2.69 1.87+ 1.54 1.32 1.32 1.21 1.32 1.49 2.05 3.07 4.23 4.69 4.66 4.30+ 4.31 4.08 3.91 3.90 4.07 4.42 4.40 4.11 3.59 3.26 2.70 2.14+ 1.59 1.32 1.26 1.15 1.26 1.43 1.88 2.62 3.44 4.07 4.06 3.64+ 3.29 3.41 3.24 3.07 3.54 4.12 4.19 3.94 3.48 3.02 2.23 0.00+ TIME= WEEK+ MULT= 1.00+ ADD = 0.00X Weekly Load TJ = 81.94X Each figure represents average hourly flow rate in std. m3/sX Profile date = 15 JUNE 2009 - 21 JUNE 2009X ==========================================================X DELIVERY POINT WAIKANAEX CODERAMP WKNEXT.V = 0.03+ 0.02 0.02 0.02 0.01 0.02 0.02 0.06 0.10 0.12 0.09 0.05 0.04+ 0.03 0.03 0.03 0.03 0.05 0.10 0.12 0.12 0.11 0.09 0.06 0.03+ 0.02 0.02 0.02 0.02 0.02 0.02 0.06 0.11 0.12 0.10 0.07 0.05+ 0.05 0.08 0.09 0.11 0.14 0.17 0.18 0.17 0.16 0.13 0.08 0.05+ 0.03 0.03 0.03 0.03 0.03 0.04 0.08 0.13 0.15 0.13 0.11 0.08+ 0.07 0.07 0.05 0.05 0.08 0.14 0.18 0.18 0.15 0.13 0.08 0.04+ 0.03 0.03 0.03 0.03 0.03 0.04 0.08 0.13 0.15 0.13 0.10 0.08+ 0.06 0.06 0.05 0.05 0.08 0.13 0.16 0.16 0.15 0.13 0.08 0.04+ 0.03 0.03 0.03 0.03 0.03 0.04 0.08 0.13 0.16 0.15 0.10 0.07+ 0.05 0.05 0.04 0.04 0.08 0.14 0.15 0.15 0.14 0.12 0.08 0.04+ 0.03 0.03 0.02 0.02 0.02 0.03 0.04 0.09 0.13 0.14 0.11 0.09+ 0.09 0.07 0.06 0.07 0.11 0.14 0.15 0.14 0.13 0.12 0.08 0.05+ 0.03 0.03 0.03 0.02 0.02 0.02 0.04 0.08 0.12 0.13 0.11 0.09+ 0.08 0.07 0.07 0.08 0.11 0.14 0.14 0.14 0.12 0.10 0.06 0.03+ TIME= WEEK+ MULT= 1.00+ ADD = 0.00X Weekly Load TJ = 1.93X Each figure represents average hourly flow rate in std. m3/sX Profile date = 15 JUNE 2009 - 21 JUNE 2009X ==========================================================

X DELIVERY POINT WAITANGIRUAX CODERAMP WTREXT.V1= 0.11+ 0.09 0.08 0.08 0.08 0.08 0.08 0.54 0.74 0.62 0.47 0.61 0.55+ 0.48 0.29 0.19 0.19 0.26 0.45 0.52 0.50 0.43 0.35 0.22 0.12+ 0.09 0.09 0.08 0.08 0.08 0.12 0.55 0.69 0.69 0.50 0.45 0.44+ 0.52 0.56 0.58 0.58 0.64 0.77 0.80 0.75 0.65 0.52 0.33 0.17+ 0.12 0.10 0.09 0.11 0.13 0.24 0.62 0.84 0.75 0.63 0.54 0.49+ 0.42 0.34 0.28 0.26 0.37 0.58 0.69 0.67 0.60 0.51 0.33 0.17+ 0.12 0.09 0.10 0.12 0.13 0.25 0.62 0.87 0.75 0.60 0.56 0.47+ 0.36 0.30 0.27 0.25 0.35 0.55 0.67 0.67 0.61 0.51 0.33 0.19+ 0.13 0.12 0.11 0.15 0.17 0.28 0.66 0.92 0.85 0.69 0.55 0.46+ 0.37 0.31 0.27 0.26 0.35 0.51 0.58 0.56 0.51 0.44 0.31 0.19+ 0.12 0.09 0.09 0.09 0.09 0.13 0.22 0.35 0.51 0.62 0.59 0.53+ 0.49 0.46 0.44 0.46 0.52 0.58 0.55 0.52 0.45 0.40 0.32 0.22+ 0.14 0.11 0.09 0.09 0.08 0.09 0.16 0.27 0.42 0.53 0.48 0.44+ 0.40 0.39 0.38 0.34 0.44 0.56 0.57 0.54 0.47 0.39 0.24 0.00+ TIME= WEEK+ MULT= 1.00+ ADD = 0.00X Weekly Load TJ = 9.33X Each figure represents average hourly flow rate in std. m3/sX Profile date = 15 JUNE 2009 - 21 JUNE 2009X ==========================================================X DELIVERY POINT WAITOTARAX CODERAMP WTTEXT.V1= 0.01+ 0.01 0.01 0.01 0.01 0.01 0.02 0.05 0.05 0.05 0.05 0.06 0.05+ 0.06 0.05 0.04 0.01 0.01 0.01 0.01 0.01 0.01 0.01 0.01 0.02+ 0.01 0.01 0.01 0.01 0.01 0.02 0.05 0.05 0.05 0.05 0.05 0.05+ 0.05 0.05 0.05 0.01 0.01 0.01 0.01 0.01 0.01 0.00 0.01 0.02+ 0.01 0.01 0.01 0.01 0.01 0.03 0.05 0.06 0.06 0.05 0.06 0.06+ 0.06 0.05 0.04 0.01 0.01 0.01 0.01 0.01 0.01 0.01 0.01 0.01+ 0.01 0.01 0.01 0.01 0.01 0.03 0.05 0.05 0.05 0.05 0.05 0.05+ 0.05 0.05 0.03 0.01 0.01 0.01 0.01 0.01 0.01 0.01 0.01 0.01+ 0.01 0.01 0.01 0.01 0.01 0.01 0.01 0.01 0.01 0.01 0.01 0.01+ 0.01 0.01 0.01 0.01 0.01 0.01 0.01 0.01 0.01 0.01 0.01 0.01+ 0.01 0.01 0.01 0.01 0.01 0.01 0.01 0.01 0.01 0.01 0.01 0.01+ 0.01 0.01 0.01 0.01 0.01 0.01 0.01 0.01 0.01 0.01 0.01 0.01+ 0.01 0.01 0.01 0.01 0.01 0.01 0.01 0.01 0.01 0.01 0.01 0.01+ 0.01 0.01 0.01 0.01 0.01 0.01 0.01 0.01 0.01 0.01 0.01 0.01+ TIME= WEEK+ MULT= 1.00+ ADD = 0.00X Weekly Load TJ = 0.44X Each figure represents average hourly flow rate in std. m3/sX Profile date = 15 JUNE 2009 - 21 JUNE 2009X ==========================================================X DELIVERY POINT WANGANUIX CODERAMP WANEXT.V = 0.32+ 0.26 0.23 0.20 0.23 0.30 0.34 0.60 0.94 1.04 0.92 0.84 0.80+ 0.70 0.75 0.75 0.66 0.68 0.88 1.01 0.99 0.90 0.79 0.64 0.42+ 0.38 0.30 0.27 0.30 0.30 0.35 0.65 1.00 1.09 1.05 0.89 0.90+ 0.77 0.79 0.86 0.80 0.95 1.13 1.26 1.22 1.09 1.02 0.79 0.55+ 0.45 0.38 0.35 0.33 0.36 0.45 0.73 1.20 1.32 1.16 1.00 0.96+ 0.86 0.80 0.77 0.69 0.81 1.05 1.24 1.24 1.15 1.04 0.83 0.56+ 0.50 0.42 0.33 0.37 0.40 0.46 0.80 1.30 1.37 1.25 1.16 0.99+ 0.88 0.85 0.79 0.70 0.82 1.06 1.22 1.23 1.18 1.02 0.85 0.60+ 0.47 0.43 0.41 0.37 0.43 0.50 0.79 1.26 1.50 1.34 1.15 0.96+ 0.82 0.79 0.67 0.58 0.69 1.05 1.18 1.14 1.08 0.94 0.77 0.55+ 0.37 0.35 0.30 0.30 0.30 0.34 0.47 0.56 0.79 0.87 0.77 0.68+ 0.59 0.59 0.54 0.53 0.66 0.89 0.95 0.87 0.82 0.73 0.63 0.49+ 0.37 0.28 0.29 0.28 0.27 0.34 0.40 0.51 0.67 0.81 0.79 0.72+ 0.70 0.68 0.68 0.69 0.74 0.90 1.00 0.98 0.88 0.74 0.55 0.37+ TIME= WEEK+ MULT= 1.00+ ADD = 0.00X Weekly Load TJ = 17.92X Each figure represents average hourly flow rate in std. m3/sX Profile date = 15 JUNE 2009 - 21 JUNE 2009X ==========================================================