piperonyl butoxide (062) explanation · 607 piperonyl butoxide (062) explanation piperonyl butoxide...
TRANSCRIPT
607
PIPERONYL BUTOXIDE (062)
EXPLANATION
Piperonyl butoxide (PBO) is a synergist used to prolong the effects of the natural insecticides pyrethrin and rotenone, and many synthetic insecticides. The compound was reviewed by the 1992 JMPR for residues and toxicology, but the Meeting could not then evaluate the compound fully because the critical data were incomplete, particularly in relation to the metabolism of plants and animals. Stability and processing studies were reported for commercially stored wheat and wheat products only. The withdrawal of all MRLs was therefore recommended.
At its 26th Session (1994) the CCPR decided to withdraw the CXL for cereal grains and all other commodities except for wheat, which was advanced to step 5/8 (ALINORM 95/24). At its 27th Session the CCPR tentatively scheduled piperonyl butoxide under its Periodic Review Programme for residue re-evaluation by the 1999 JMPR but it was postponed to 2000 by the CCPR at its 30th Session (ALINORM 99/24 App.VII).
The present Meeting received information on physical and chemical properties, metabolism and environmental fate, analytical methods, freezer storage stability, registered uses, data from supervised trials on pre-and post-harvest uses, processing and animal feeding studies, residues in food in commerce and national residue limits from the manufacturer. The governments of Australia and Germany provided information on registered uses and national residue limits.
IDENTITY
ISO common name: piperonyl butoxide (accepted in lieu of common name)
Chemical name:
IUPAC: 5-[2-(2-butoxyethoxy)ethoxymethyl]-6-propyl-1,3-benzodioxole 2-(2-butoxyethoxy)ethyl 6-propylpiperonyl ether
CA: 5-[[2-(2-butoxyethoxy)ethoxy]methyl]-6-propyl-1,3-benzodioxole
CAS No.: 51-03-6
CIPAC No: not listed
Other names: α-(2-butoxyethoxy)ethoxy-4,5-(methylenedioxy)-2-propyltoluene
α-(2-n-butoxyethoxy)ethoxy-4,5-(methylenedioxy)-2-propyltoluene
6-propylpiperonyl butyl diethyleneglycol ether

piperonyl butoxide 608
Structural formula:
Molecular formula: C19H30O5
Molecular weight: 338.43
Physical and chemical properties (Endura, 1999)
Physical form: oily liquid at room temperature
Colour: pale to deep yellow (4.5 max Gardner scale)
Odour: faint characteristic odour
Boiling point: 180°C at 1 mm Hg
Melting point: liquid at room temperature
Flash point: 179°C (EEC method A9)
Autoflammability (ignition point): >245°C
Explosion hazard: none
Oxidizing properties: none
Vapour pressure: 1.33 x 10⁻² mPa at 25°C
Solubility in water: 14.3 mg/l at 25°C
Solubility: highly soluble in most organic solvents
Purity : 90% min
Relative density: 1.05-1.07 (20°C)
Refractive index: 1.497-1.512 at 20°C
Stability: the shelf life exceeds 2 years
Octanol-water partition coefficient (Log Pow):
4.62
Henry’s Law constant: <2.35 x 10⁻⁴ l-atm/mole
Hydrolysis: stable at pH 5-9 at 25oC
Photolysis: half-life at pH 7 8.4 hours

piperonyl butoxide 609
METABOLISM AND ENVIRONMENTAL FATE
Piperonyl butoxide radiolabelled with 14C in the glycol-derived side chain (Figure 1) or uniformly in the benzene ring was used in the studies.
Figure 1. Site of radiolabel in [14C]piperonyl butoxide
The names of the metabolites with the abbreviations found in the metabolism and environmental fate studies are listed below. The structures of metabolites A-Z are shown in Figure 2, those of M2-M12 and M14-M17 in Figure 3, M13 and HMDs in Figure 5, M20-M22 in Figure 9, and M23-M27 in Figure 11.
Metabolite A (MA): 1,3-benzodioxole-5,6-dicarboxylic acid MB: 5,6-dihydroxyphthalide (4,5-dihydroxy-2-hydroxymethylbenzoic acid) MC: lactone of (6-hydroxymethyl-1,3-benzodioxol-5-yl)acetic acid MD: (6-propyl-1,3-benzodioxole-5-yl)methoxyacetic acid ME: 6-propyl-1,3-benzodioxole-5-carboxylic acid or 4,5-methylenedioxy-2-propylbenzoic acid MF: (2-{2-[(6-propyl-1,3-benzodioxol-5-yl)methoxy]ethoxy}ethoxy)acetic acid MG: 4-{[2-(2-butoxyethoxy)ethoxy]methyl}-5-propyl-1,2-benzenediol MZ: 2-oxa-5,6-methylenedioxyindane M2: 4-{[2-(2-butoxyethoxy)ethoxy]methyl}-2-methoxy-5-propylphenol M4: 2-(2-{2-[(6-propyl-1,3-benzodioxol-5-yl)methoxy]ethoxy}ethoxy)ethanol M5: 2-{2-[(6-propyl-1,3-benzodioxol-5-yl)methoxy]ethoxy}ethanol M7: 2-{2-[(6-propyl-1,3-benzodioxol-5-yl)methoxy]ethoxy}acetic acid M8: 4-{[2-(2-butoxyethoxy)ethoxy]methyl}-5-propyl-1,2-benzenediol glucuronide M9: 4-{[2-(2-butoxyethoxy)ethoxy]methyl}-2-methoxy-5-propylphenol glucuronide M10: 2-{2-[(6-propyl-1,3-benzodioxol-5-yl)methoxy]ethoxy}ethanol glucuronide M11: 2-[2-(4-hydroxy-5-methoxy-2-propylbenzyloxy)ethoxy]ethoxyacetic acid M12: 2-(4-hydroxy-5-methoxy-2-propylbenzyloxy)ethoxyacetic acid M13: 4-{2-[2-(hydroxyethoxy)ethoxy]methyl}-5-propyl-1,2-benzenediol M14: 2-[2-(5-hydroxy-2-propyl-4-sulfooxybenzyloxy)ethoxy]ethoxyacetic acid M16: 4,5-dihydroxy-2-propylbenzyloxyacetic acid phenolic glucuronide M17: 2-[2(4-hydroxy-5-methoxy-2-propylbenzyloxy)ethoxy]ethanol glucuronide HMDS: hydroxymethyldihydrosafrole M20: Glucose conjugate of HMDS M21: Glucose conjugate of 2-[(6-propyl-1,3-benzodioxol-5-yl)methoxy]ethanol M22: Glucose conjugate of 4-{2-[z-(6-propyl-1,3-benzodioxol-5-ylmethoxy)ethoxy]ethoxy}butan-1-ol M23:4,5-methylenedioxy-2-propylbenzaldehyde M24: bis(3,4-methylenedioxy-6-propylbenzyl) ether M25: 2'-[2-(2-butoxyethoxy)ethoxy(hydroxy)methyl]4',5'-methylenedioxypropiophenone M26: 2'-[2-(2-butoxyethoxy)ethoxymethyl]4',5'methylenedioxypropiophenone M27: 2-ethylcarbonyl-4,5-methylenedioxybenzaldehyde
Animal metabolism
Rats. Lin and Selim (1991) dosed five male and five female Charles River DC rats orally with [14C]PBO in three ways: single low doses at 50 mg/kg bw, single high doses at 500 mg/kg bw, and 13 daily doses with unlabelled piperonyl butoxide at 50 mg/kg bw followed by one radioactive dose at the same level.

piperonyl butoxide 610
Urine and faeces were collected at intervals and the rats were killed seven days after the (last) dose. Approximately two-thirds of the dosed 14C in both male and female rats was excreted in the faeces, and the remainder in the urine, regardless of the dosage regimen. Recoveries from the tissues and carcase were less than 1.5% of the administered dose (Table 1).
Table 1. Radioactivity in the urine, faeces and tissues of rats (Lin and Selim, 1991).
14C, % of dose
Single low dose Single high dose Repeated low dose
Time (hours)
Male Female Male Female Male Female
URINE
0-4 2.38 2.0 0.87 0.51 1.68 3.12
4-8 7.16 4.2 1.99 0.81 9.74 8.03
8-12 3.57 4.15 2.73 3.25 5.8 4.83
12-24 8.34 9.21 8.59 6.91 8.62 8.4
24-36 6.82 4.99 6.02 6.66 3.39 5.14
36-48 2.61 3.92 2.8 5.15 2.07 3.43
48-72 2.38 3.67 2.02 4.11 2.62 4.07
72-96 0.72 1.74 1.0 2.08 1.16 2.31
96-120 0.67 0.89 0.61 1.32 0.55 0.97
120-144 0.42 0.53 0.33 0.72 0.31 0.47
144-168 0.22 0.36 0.19 0.55 0.20 0.27
Final rinse 0.06 0.07 0.06 0.23 0.05 0.03
Total 35.6 35.7 27.2 32.3 36.2 38.1
FAECES
0-4 NS 0.09 NS NS 0.01 NS
4-8 NS 0.11 0.11 0.21 NS 0.10
8-12 NS 3.5 NS 0.06 2.1 6.05
12-24 20.6 28.3 28.6 25.4 31.8 26.7
24-36 13.4 9.17 14.0 11.09 8.7 4.04
36-48 15.4 7.64 11.4 10.4 7.55 7.16
48-72 6.06 3.88 6.78 7.32 5.41 5.41
72-96 3.3 2.89 2.66 4.13 2.01 3.0
96-120 2.05 1.21 1.6 2.04 1.14 1.35
120-144 0.97 0.63 0.70 0.82 0.57 0.59
144-168 0.61 0.34 0.40 0.37 0.54 0.40
Total 63.0 56.2 66.2 61.6 59.8 54.8
CARCASE AND TISSUES
Total 1.49 0.89 1.0 1.19 1.14 0.77
NS: no sample excreted
In the tissues the highest residue levels were found in the liver (1.1-1.2 mg/kg) and gastro-
intestinal tract (up to 2.0 mg/kg) and were 0.10-1.0 mg/kg in the kidneys, gastro-intestinal tract

piperonyl butoxide 611
contents, and residual carcases of the male rats and in the fat, spleen, adrenal and thyroid glands, gastro-intestinal tract contents, uterus, ovaries and residual carcase of female rats.
Piperonyl butoxide was extensively metabolized. There were only trace amounts of
unchanged PB0 in the urine (Selim, 1991) (Table 2). Metabolism can occur at the propyl and glycol-derived side chains to produce the three metabolites MB, MC and MZ by cyclization, and in the heterocyclic ring (Figure 2). Oxidation on the glycol side chain is the main degradation pathway. In male rats MC was found to be the main metabolite in the urine. In females, MB and MZ predominated in the urine at the low dose, and MF at the high dose. Piperonyl butoxide, MF, MH and MD were the main compounds in the faeces of both sexes.
Table 2. Distribution of piperonyl butoxide and metabolites in rat excreta (Selim, 1991).
14C, % of dose, in Dose group PBO MA MB MC MD ME MF MG MZ
Urine
SOL-M ND 2.6 2.1 6.8 0.7 1.7 0.5 ND 1.3
SOL-F 0.3 1.8 3.7 1.6 0.9 1.1 1.4 0.6 3.4
ROL-M <0.2 2.7 2.4 6.7 1.2 1.1 1.1 <0.2 1.7
ROL-F <0.2 1.2 4.1 2.1 1.4 1.2 2.1 2.4 3.5
SOH-M <0.2 1.4 2.5 5.2 0.8 1.9 3.5 <0.2 1.8
SOH-F <0.2 0.8 3.4 1.1 0.6 1.8 6.9 0.8 1.8
Faeces
SOL-M 11.0 <0.2 <0.2 1.9 9.7 <0.2 7.2 13.8 <0.2
SOL-F 9.7 <0.2 <0.2 <0.2 3.1 <0.2 9.5 9.4 <0.2
ROL-M 2.2 <0.2 <0.2 2.1 8.3 <0.2 2.3 21.4 <0.2
ROL-F 3.6 <0.2 <0.2 <0.2 2.7 <0.2 4.8 26.1 <0.2
SOH-M 12.3 <0.2 <0.2 1.7 6.0 <0.2 4.3 15.5 <0.2
SOH-F 30.6 <0.2 <0.2 <0.2 <0.2 <0.2 2.6 15.0 <0.2
M: male; F: female; SOL: single oral low of 50 mg/kg bw; SOH: single oral high of 500 mg/kg bw; ROL: repeat oral low, 14 x 50 mg/kg bw.
piperonyl butoxide 612
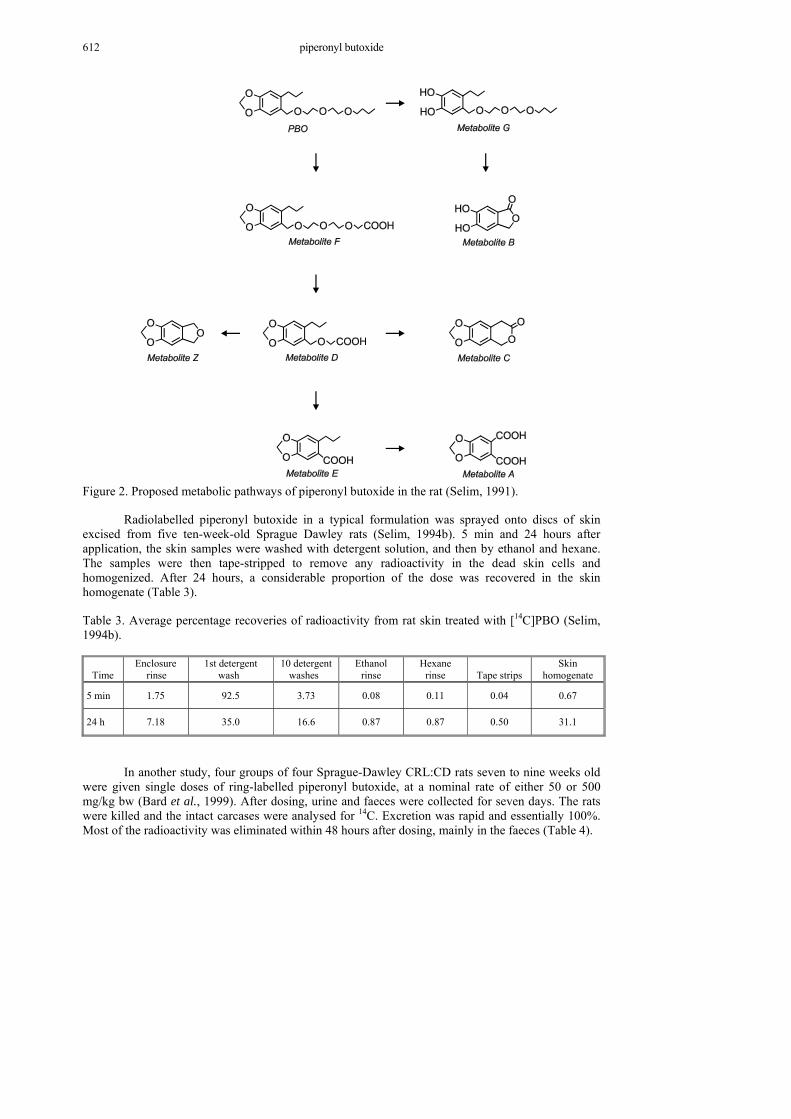
Figure 2. Proposed metabolic pathways of piperonyl butoxide in the rat (Selim, 1991).
Radiolabelled piperonyl butoxide in a typical formulation was sprayed onto discs of skin excised from five ten-week-old Sprague Dawley rats (Selim, 1994b). 5 min and 24 hours after application, the skin samples were washed with detergent solution, and then by ethanol and hexane. The samples were then tape-stripped to remove any radioactivity in the dead skin cells and homogenized. After 24 hours, a considerable proportion of the dose was recovered in the skin homogenate (Table 3).
Table 3. Average percentage recoveries of radioactivity from rat skin treated with [14C]PBO (Selim, 1994b).
Time
Enclosure rinse
1st detergent wash
10 detergent washes
Ethanol rinse
Hexane rinse
Tape strips
Skin homogenate
5 min 1.75 92.5 3.73 0.08 0.11 0.04 0.67
24 h 7.18 35.0 16.6 0.87 0.87 0.50 31.1
In another study, four groups of four Sprague-Dawley CRL:CD rats seven to nine weeks old were given single doses of ring-labelled piperonyl butoxide, at a nominal rate of either 50 or 500 mg/kg bw (Bard et al., 1999). After dosing, urine and faeces were collected for seven days. The rats were killed and the intact carcases were analysed for 14C. Excretion was rapid and essentially 100%. Most of the radioactivity was eliminated within 48 hours after dosing, mainly in the faeces (Table 4).

piperonyl butoxide 613
Table 4. Distribution of radioactivity in rats dosed with piperonyl butoxide (Bard et al., 1999).
14C, % of dose
50 mg/kg bw 500 mg/kg bw Sample
Male Female Male Female
Urine 11.1 14.4 19.5 23.1
Faeces 85.1 82.9 75.9 69.9
Cage Wash 1.65 1.95 1.98 3.16
Carcase 0.44 0.37 0.30 0.28
Total 1 98.3 99.6 97.9 97.4
1 Calculated using unrounded percentages. Analysis by HPLC showed little difference in metabolic profiles in the excreta at either dose, but radioactivity was higher in the excreta from the high-dose groups. HPLC with mass spectrometric detection was used to determine the structures of all major and many minor metabolites. Nuclear magnetic resonance spectrometry was used to confirm identities and to establish the position of functional groups in specific metabolites. Piperonyl butoxide is vulnerable to metabolic attack in the dioxole ring and at the glycolate side chain (Figure 3). The former can open, producing either a pyrocatechol or an o-hydroxyanisole moiety. These products, either per se or conjugated, generally persist throughout subsequent metabolism. The pyrocatechol aglycones could be conjugated to gluconuride or sulfate at either of the two phenolic sites. Only one of each pair is shown in Figure 3. Metabolites in the excreta collected in the first 48 hours after dosing at the higher rate were quantified by HPLC with UV and radiocarbon detection. The distribution of piperonyl butoxide and metabolites as percentages of the applied dose in male and female rats is shown in Table 5. Only piperonyl butoxide and M3 exceeded 10% of the applied dose in animals of either sex. Table 5. Distribution of piperonyl butoxide and its metabolites in excreta from rats dosed at 500 mg/kg bw (Bard et al., 1999).
14C, % of dose
PBO M2 MG M4 M5 MF M7 M8 M9 M10 M11 M12 M14 M16 M17
Female 15.6 4.36 17.6 6.62 4.98 9.271 0.62 0.28 NQ NQ 0.78 0.98 NQ
Male 23.9 3.74 19.8 4.68 1.32 NQ2 NQ NQ NQ NQ 3.07 0.78 NQ
1 Total concentration of two metabolites unresolved by HPLC 2 Not quantifiable by HPLC: identified by mass spectrometry

piperonyl butoxide 614
PBO
MG M8
M14
M16
M4
M5
M9
M2
O O
HO
CH3OO OH
M10
M12
O O
HO
CH3OOH
O COOHHO
HO
M11
OHO O O
M7
OHO O O COOH
M17
MF
OH
HO
HO
Figure 3. Proposed metabolic pathways of piperonyl butoxide in rats (Bard et al., 1999). Figure 4 shows the main steps in the metabolism of the glycolate side chain, showing the carbons remaining after each step. Initial hydroxylation followed by oxidation at the terminus of the original 9-carbon side chain produces C9-OH and then C8-COOH, from which is eliminated a 2-carbon (acetate) moiety; oxidation then results in the formation of 7-OH and 6-COOH. Successive losses of acetate followed by oxidation finally produce 1-OH and ring-COOH. In some cases the acid has been identified as an animal metabolite, but the corresponding alcohol is not found at a concentration high enough to measure although it is judged to be a necessary precursor. Figure 4. Truncation of glycolate side chain of PBO in rats.
piperonyl butoxide 615
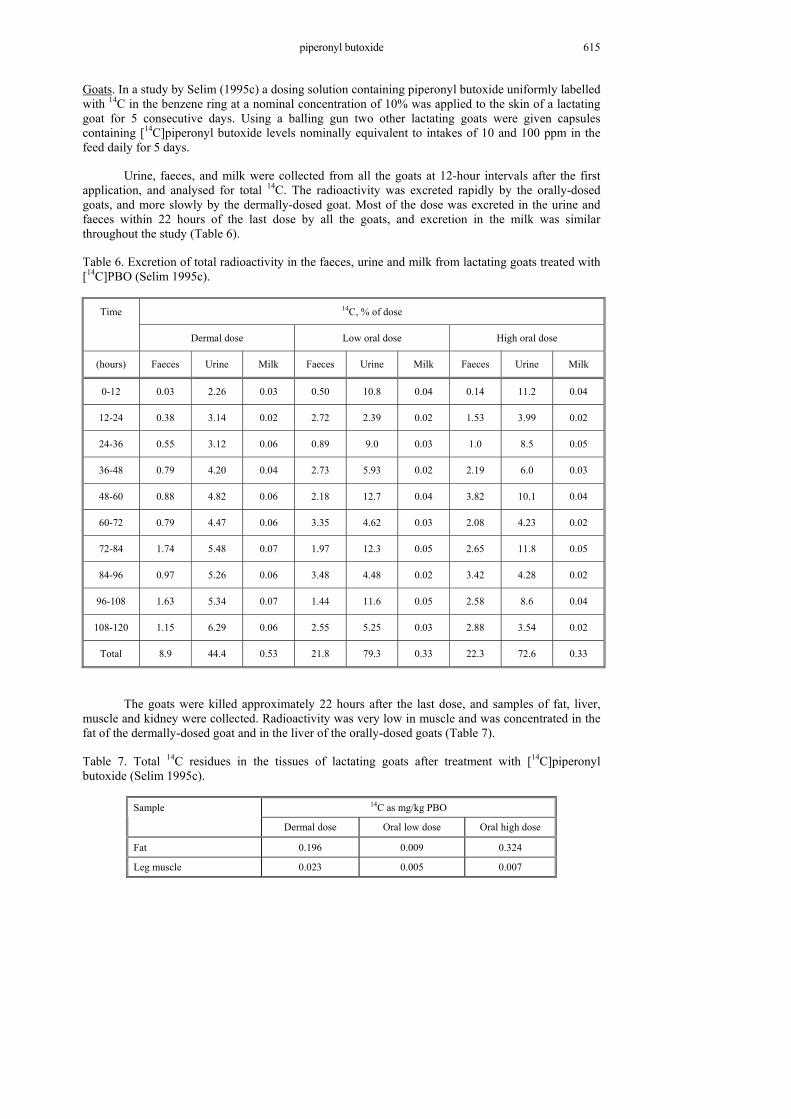
Goats. In a study by Selim (1995c) a dosing solution containing piperonyl butoxide uniformly labelled with 14C in the benzene ring at a nominal concentration of 10% was applied to the skin of a lactating goat for 5 consecutive days. Using a balling gun two other lactating goats were given capsules containing [14C]piperonyl butoxide levels nominally equivalent to intakes of 10 and 100 ppm in the feed daily for 5 days.
Urine, faeces, and milk were collected from all the goats at 12-hour intervals after the first application, and analysed for total 14C. The radioactivity was excreted rapidly by the orally-dosed goats, and more slowly by the dermally-dosed goat. Most of the dose was excreted in the urine and faeces within 22 hours of the last dose by all the goats, and excretion in the milk was similar throughout the study (Table 6).
Table 6. Excretion of total radioactivity in the faeces, urine and milk from lactating goats treated with [14C]PBO (Selim 1995c).
14C, % of dose Time
Dermal dose Low oral dose High oral dose
(hours) Faeces Urine Milk Faeces Urine Milk Faeces Urine Milk
0-12 0.03 2.26 0.03 0.50 10.8 0.04 0.14 11.2 0.04
12-24 0.38 3.14 0.02 2.72 2.39 0.02 1.53 3.99 0.02
24-36 0.55 3.12 0.06 0.89 9.0 0.03 1.0 8.5 0.05
36-48 0.79 4.20 0.04 2.73 5.93 0.02 2.19 6.0 0.03
48-60 0.88 4.82 0.06 2.18 12.7 0.04 3.82 10.1 0.04
60-72 0.79 4.47 0.06 3.35 4.62 0.03 2.08 4.23 0.02
72-84 1.74 5.48 0.07 1.97 12.3 0.05 2.65 11.8 0.05
84-96 0.97 5.26 0.06 3.48 4.48 0.02 3.42 4.28 0.02
96-108 1.63 5.34 0.07 1.44 11.6 0.05 2.58 8.6 0.04
108-120 1.15 6.29 0.06 2.55 5.25 0.03 2.88 3.54 0.02
Total 8.9 44.4 0.53 21.8 79.3 0.33 22.3 72.6 0.33
The goats were killed approximately 22 hours after the last dose, and samples of fat, liver, muscle and kidney were collected. Radioactivity was very low in muscle and was concentrated in the fat of the dermally-dosed goat and in the liver of the orally-dosed goats (Table 7).
Table 7. Total 14C residues in the tissues of lactating goats after treatment with [14C]piperonyl butoxide (Selim 1995c).
14C as mg/kg PBO Sample
Dermal dose Oral low dose Oral high dose
Fat 0.196 0.009 0.324
Leg muscle 0.023 0.005 0.007

piperonyl butoxide 616
14C as mg/kg PBO Sample
Dermal dose Oral low dose Oral high dose
Loin muscle 0.023 0.004 0.009
Liver 0.149 0.363 2.00
Kidney 0.113 0.071 0.398
The same metabolites were found in the tissues as in the urine by HPLC, and the urine from the goat dosed orally at 100 ppm was used as a source of materials for metabolite isolation and identification. Thus, metabolites in the milk and tissues from all three goats were characterized by comparison with metabolites identified in the urine.
The four main metabolites in the urine were isolated by semi-preparative HPLC, and their
structures elucidated by LC-MS and GC-MS. A minor component in one of the purified fractions was identified as hydroxymethyldihydrosafrole (3,4-methylenedioxy-6-propylbenzyl alcohol, HMDS). It was not found in any of the analysed tissues.
Piperonyl butoxide was metabolized by cleavage of the glycol-derived side chain to produce a number of alcohols, and the alcohols were partially oxidized to the corresponding carboxylic acids. The proposed metabolic pathways for the metabolism of [14C]piperonyl butoxide in lactating goats are shown in Figure 5.
Levels of piperonyl butoxide and metabolites identified in the milk, liver and kidneys are shown in Table 8. In milk, the residues consisted of the parent compound, M7 and MD.
Up to 11 metabolites were identified in liver, an indication of the extensive metabolism. The parent compound was a minor component in the liver from the oral low-dose goat and the dermally-dosed goat, but a major component in the oral high-dose goat.
Table 8. Piperonyl butoxide and metabolites in milk, liver and kidney from goats dosed with [14C]piperonyl butoxide, in mg/kg PBO equivalents
14C, mg/kg as PBO
Sample
Dose PBO MD M5 M13 M7
Milk Oral 10 ppm 0.002 0.002 -1 - 0.001
Oral 100 ppm 0.006 0.005 - - 0.016
Dermal 0.012 0.001 - - 0.001
Liver Oral 10 ppm 0.002 <0.002 0.009 0.019 0.024
Oral 100 ppm 0.115 0.040 <0.002 0.136 0.075
Dermal 0.007 0.006 0.01 0.018 0.014
Kidney Oral 10 ppm <0.005 0.002 0.004 - 0.005
Oral 100 ppm 0.010 0.024 0.023 - 0.045
Dermal 0.007 <0.002 0.010 - 0.006
Fat Oral 10 ppm 0.006 - - - -
Oral 100 ppm 0.129 - - - -
Dermal 0.155 - - - -

piperonyl butoxide 617
1 Not detected. Detection limits were not reported but can be assumed to be below the lowest concentration reported for detected residues.
In kidney the metabolic profiles were similar to those in liver, but concentrations were much lower. The parent compound was not detected in kidneys from the oral low-dose goat. Fourteen minor metabolite peaks were observed at or below 0.005 mg/kg.
The parent compound was the only radioactive component in the fat samples from the oral low-dose and dermal-dose goats, and in the leg and loin muscle from the dermal-dosed (0.31 mg/kg PBO equivalents), whereas the fat from the oral high-dose goat contained metabolite 15 (0.047 mg/kg PBO equivalents) as well, whose structure was not elucidated. Metabolites were not identified in muscle from the oral dose goats.
Hens. Selim (1995d) applied a solution containing [14C]piperonyl butoxide uniformly labelled in the benzene ring dermally at a level nominally equivalent to 10 ppm piperonyl butoxide in the feed for 5 consecutive days to a group of 10 hens. About 24 hours earlier, feathers had been plucked from the hens’ backs and the areas wiped with acetone. Containers 2.5 cm x 5 cm x 1.3 cm (maximum height) were stuck to their backs with cyanoacrylate glue and sealed with a medical adhesive silicone seal. The dosing solution contained 498 µCu, and 13.72 mg of piperonyl butoxide per g. Two other groups of 10 hens were dosed with capsules containing [14C]piperonyl butoxide at nominal levels of 10 and 100 ppm piperonyl butoxide in the feed for 5 days.
Excreta and eggs were collected from each hen at 24-hour intervals after the first dose and analysed for 14C. Excreta from the dermally-dosed hens contained 59% of the applied radioactivity, from the oral low dose group 89%, and from the oral high dose group 94%. In eggs, levels of radioactivity were low but were higher in whites than in yolks in the first 48 hours. After 48 hours, this pattern inverted and at day 5 the radioactivity in the yolks was approximately 5 times that in the whites (Table 9).
Table 9. Radioactive residues in the eggs of laying hens treated with [14C]PBO (Selim 1995d).
14C, mg/kg as PBO Time
Dermal dose Oral low dose Oral high dose
(hours) White Yolk White Yolk White Yolk
0-24 <0.001 <0.001 <0.001 <0.001 0.052 0.004
24-48 0.014 0.005 0.005 0.006 0.629 0.330
48-72 0.015 0.033 0.006 0.023 0.335 0.727
72-96 0.013 0.068 0.006 0.041 0.240 1.355
96-120 0.013 0.093 0.011 0.076 0.442 1.933
The hens were killed approximately 22 hours after the last dose, and samples of fat, liver, muscle, kidney and skin collected. In all groups, radioactivity was lower in muscle and skin and concentrated in fat. The total radioactive residues (TRR) in kidney and liver increased in proportion to oral dose levels (Table 10).

piperonyl butoxide 618
Table 10. Mean total radioactive residues in tissues of laying hens after treatment with 14C piperonyl butoxide (Selim 1995d).
14C, mg/kg as PBO Sample
Dermal dose Oral low dose Oral high dose
Breast muscle 0.003 0.002 0.032
Thigh muscle 0.007 0.008 0.124
Fat 0.295 0.134 4.82
Kidney 0.192 0.136 1.19
Liver 0.147 0.109 1.59
Skin 0.077 0.029 0.807
Metabolites in the eggs and tissues were identified by comparison with urinary metabolites
identified in a companion study with goats, using chemical tests, chromatography, LC-MS and GC-MS. The levels of piperonyl butoxide and the main metabolites found in eggs and most tissues from the three dose regimes are shown in Table 11. Total radioactive residues in breast muscle, skin from the low oral dose, and thigh muscle from the dermal and the oral low dose were too low (<0.05 mg/kg) for characterization of metabolites to be possible.
Table 11. Piperonyl butoxide and identified metabolites in the eggs and tissues of hens dosed with [14C]PBO.
14C, mg/kg as PBO Sample Dose
PBO MD M5 M13 M7
Egg whites Oral-10 ppm 0.006 -1 - - -
Oral-100 ppm 0.445 - - - -
Dermal 0.010 - - - -
Egg yolks Oral-10 ppm 0.035 0.026 - - -
Oral-100 ppm 1.181 - 0.014 0.015 0.180
Dermal 0 058 - - - 0.009
Fat Oral-10 ppm 0.124 - - - -
Oral-100 ppm 4.295 - - - -
Dermal 0.274 - - - -
Liver Oral-10 ppm - 0.003 0.002 0.003 0.016
Oral-100 ppm - 0.050 - 0.057 0.146
Dermal 0.013 - 0.002 0.001 0.008
Kidney Oral-10 ppm - - 0.008 - 0.040
Oral-100 ppm 0.136 - - - 0.193
Dermal 0.024 - 0.007 - 0.018
Untreated skin Oral-100 ppm 0.445 - - 0.123 0.130
Dermal 0.060 - - - -
Thigh muscle Oral-100 ppm 0.115 - - - 0.001 1 Not detected. Detection limits were not reported but can be assumed to be below the lowest concentration reported for detected residues.

piperonyl butoxide 619
In egg whites and yolks, the radioactive residue was mainly piperonyl butoxide and M7, an acid formed by oxidative metabolism (Figure 5). In all the fat samples piperonyl butoxide was the only radioactive component found, and in liver it was extensively metabolized and the predominant metabolite was M7. Kidney showed a metabolite profile similar to liver.
Piperonyl butoxide was the only radioactive component found in the untreated skin of the dermally-treated hens. The residue in thigh muscle from the oral high-dose hens was primarily piperonyl butoxide, with low amounts of M7. Breast muscle, thigh muscle from dermal or oral low dose, and skin from oral low dose did not contain enough total radioactivity to allow characterization of residues.
O OH
O
O
OHO
O
O
HO
HO O OH
PBO MF
M13 M5
M7
MDHMDSO COOH
O
O
Figure 5. Metabolic pathways of piperonyl butoxide in goats and hens.
Plant metabolism
The metabolism of [14C]PBO labelled in the glycol-derived side chain was studied in cotton (Selim 1994a), potatoes (Selim 1996e), and leaf lettuce (Selim 1995a). Plants were treated foliarly at the maximum label rate of 0.56 kg ai/ha. Five applications were made to lettuce at ten-day intervals, four to potatoes at fifteen-day intervals, and six to cotton five of which were at fifteen-day intervals and the sixth 2.5 months later.

piperonyl butoxide 620
The stability of the 14C label at carbon 1 of the glycol side chain during metabolism was confirmed by the absence of dihydrosafrole (Figure 6) at a limit of detection of 0.05 mg/kg.
O
O
Figure 6. Dihydrosafrole.
Mild acid hydrolysis converts piperonyl butoxide and metabolites that retain the propyl side chain, the phenyl and dioxole rings, and the benzyl carbon into hydroxymethyldihydrosafrole (Figure 7). This is the basis for the analytical method for the determination of total metabolite residues.
Figure 7. Conversion of piperonyl butoxide and its metabolites to HMDS.
Potato leaves and tubers were collected eight days after the last application, lettuce leaves on the day of the last application and ten days later, cotton leaves five weeks after the fifth application, and bolls sixteen days after the last (sixth) application. The bolls were separated into hulls, lint and seed. The samples were analysed by LSC and HPLC and metabolites identified by GC-MS. The distribution of radioactivity in the commodities is shown in Table 12.
Table 12. Distribution of radioactivity in plants foliar-sprayed with [14C]piperonyl butoxide (Selim 1994a; 1995a; 1996e).
Lettuce leaves Potato Cotton
0-Day PHI 10-Day PHI Leaves Tuber Leaves Hulls Lint Seed
TRR (mg/kg as PBO)
20.4 25.8 617 0.47 142 7.14 0.53 0.41
PBO (mg/kg) 10.4 6.3 241 <0.01 26.3 1.23 0.047 0.086
PBO (% of TRR) 51 24.4 39.1 <2 18.5 17 8.9 21
Bound (% of TRR) 19 29 18 51 25.9 51.0 35.9 84.5
TRR: Total radioactive residue
Uptake and translocation of parent or degradation products was minimal. The highest TRR in the cotton bolls was found in the hulls (5% of that on the leaves). In potatoes, the total radioactivity in the tubers was about 0.1% of that on the leaves. For undegraded piperonyl butoxide, levels in cotton lint, seed, and hulls were 0.2, 0.3 and 5%, respectively, of the levels in leaves.

piperonyl butoxide 621
In lettuce leaves, metabolism of piperonyl butoxide resulted in the formation of a series of related conjugates (Figure 8). At day 0, half of the radioactivity was present as the parent compound (petroleum ether extract) and 24.2 % remained in the aqueous fraction. At least 3 metabolites were found, including the glucose conjugate of HMDS and M10 (Figure 8), plus a small amount of PBO (1.5% of the radioactivity). The levels of the metabolites were not determined.
O Glu
O
O O O GluO
O
O O O Conjugate
O
O O O O Conjugate
O
O
O O O Glu
O
OO O O
O
O ConjugateO
M21
M5 conjugated M5 conjugated 21
M10 M22
HMDS glucose conjugate
Figure 8. Metabolites of piperonyl butoxide in leaf lettuce.
A composite sample from plants 10 days after treatment was extracted with acetonitrile (71% of radioactivity), the extracts partitioned with petroleum ether containing piperonyl butoxide, and the aqueous fraction (40% of the radioactivity) analysed for metabolites. Five main plus at least 5 minor metabolites were identified (Table 13). Further investigation of the post-extraction solids (PES) of the lettuce leaves revealed small amounts of parent, some of the metabolites (Figure 8) and up to seven highly-polar degradation products at low levels (<10% of the TRR each).
Table 13. Distribution of [14C]PBO and metabolites in lettuce aqueous extracts 10 days after last application (Selim 1995a).
PBO M20 M21 M5 conj1 M5 conj 2 M22 M10
Concentration (mg/kg) 6.3 2.0 0.6 0.2 0.5 1.8
% TRR 24.4 7.6 2.4 0.9 1.8 6.9
The potato leaf extracts contained at least seven organosoluble degradation products of high to moderate polarity, none exceeding 3% of the TRR. About 82% of the TRR was extracted from the tubers by organic solvent. The ethyl acetate extract of the unacidified aqueous fraction had at least five metabolite peaks (0.06-0.016 mg/kg) and the acidified aqueous fraction at least ten metabolite peaks with concentrations up to 0.018 mg/kg. No parent compound was found in either extract. The metabolite profile in the tubers was different from that of the leaves, indicating that further metabolism of PBO occurs in the tubers an/or during translocation to the tubers.
Bound residues in the PES from potato tubers were almost completely solubilized by mild acid hydrolysis. Degradation products were characterized as highly polar materials, most likely products of oxidation of one or both side chains to benzyl alcohols or carboxylic acids and of opening of the dioxole ring to a pyrocatechol structure (Figure 10). Bound materials did not include conjugates of aglycones, as mild hydrolysis did not result in the formation of HMDS.
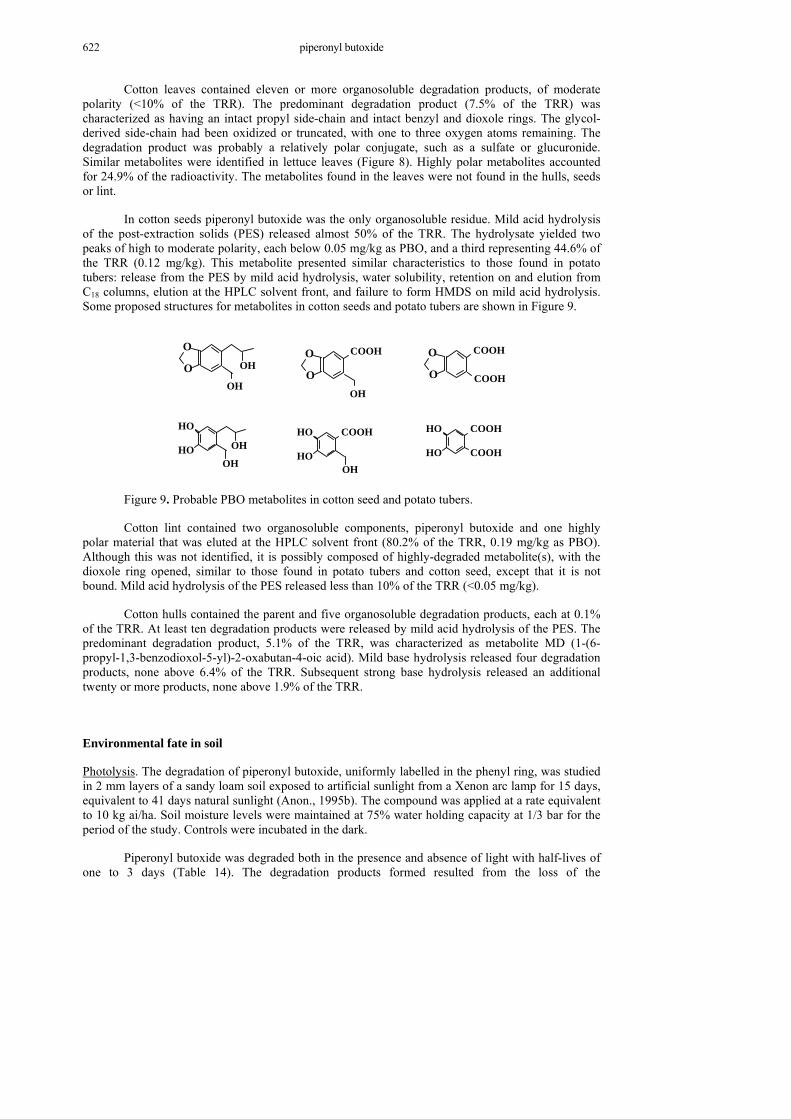
piperonyl butoxide 622
Cotton leaves contained eleven or more organosoluble degradation products, of moderate polarity (<10% of the TRR). The predominant degradation product (7.5% of the TRR) was characterized as having an intact propyl side-chain and intact benzyl and dioxole rings. The glycol-derived side-chain had been oxidized or truncated, with one to three oxygen atoms remaining. The degradation product was probably a relatively polar conjugate, such as a sulfate or glucuronide. Similar metabolites were identified in lettuce leaves (Figure 8). Highly polar metabolites accounted for 24.9% of the radioactivity. The metabolites found in the leaves were not found in the hulls, seeds or lint.
In cotton seeds piperonyl butoxide was the only organosoluble residue. Mild acid hydrolysis of the post-extraction solids (PES) released almost 50% of the TRR. The hydrolysate yielded two peaks of high to moderate polarity, each below 0.05 mg/kg as PBO, and a third representing 44.6% of the TRR (0.12 mg/kg). This metabolite presented similar characteristics to those found in potato tubers: release from the PES by mild acid hydrolysis, water solubility, retention on and elution from C18 columns, elution at the HPLC solvent front, and failure to form HMDS on mild acid hydrolysis. Some proposed structures for metabolites in cotton seeds and potato tubers are shown in Figure 9.
COOH
COOH
HO
HO
HO
HOOH
OHCOOHHO
HOOH
COOHO
OOH
O
O OH
OHCOOH
COOHO
O
Figure 9. Probable PBO metabolites in cotton seed and potato tubers.
Cotton lint contained two organosoluble components, piperonyl butoxide and one highly polar material that was eluted at the HPLC solvent front (80.2% of the TRR, 0.19 mg/kg as PBO). Although this was not identified, it is possibly composed of highly-degraded metabolite(s), with the dioxole ring opened, similar to those found in potato tubers and cotton seed, except that it is not bound. Mild acid hydrolysis of the PES released less than 10% of the TRR (<0.05 mg/kg).
Cotton hulls contained the parent and five organosoluble degradation products, each at 0.1% of the TRR. At least ten degradation products were released by mild acid hydrolysis of the PES. The predominant degradation product, 5.1% of the TRR, was characterized as metabolite MD (1-(6-propyl-1,3-benzodioxol-5-yl)-2-oxabutan-4-oic acid). Mild base hydrolysis released four degradation products, none above 6.4% of the TRR. Subsequent strong base hydrolysis released an additional twenty or more products, none above 1.9% of the TRR.
Environmental fate in soil
Photolysis. The degradation of piperonyl butoxide, uniformly labelled in the phenyl ring, was studied in 2 mm layers of a sandy loam soil exposed to artificial sunlight from a Xenon arc lamp for 15 days, equivalent to 41 days natural sunlight (Anon., 1995b). The compound was applied at a rate equivalent to 10 kg ai/ha. Soil moisture levels were maintained at 75% water holding capacity at 1/3 bar for the period of the study. Controls were incubated in the dark.
Piperonyl butoxide was degraded both in the presence and absence of light with half-lives of one to 3 days (Table 14). The degradation products formed resulted from the loss of the
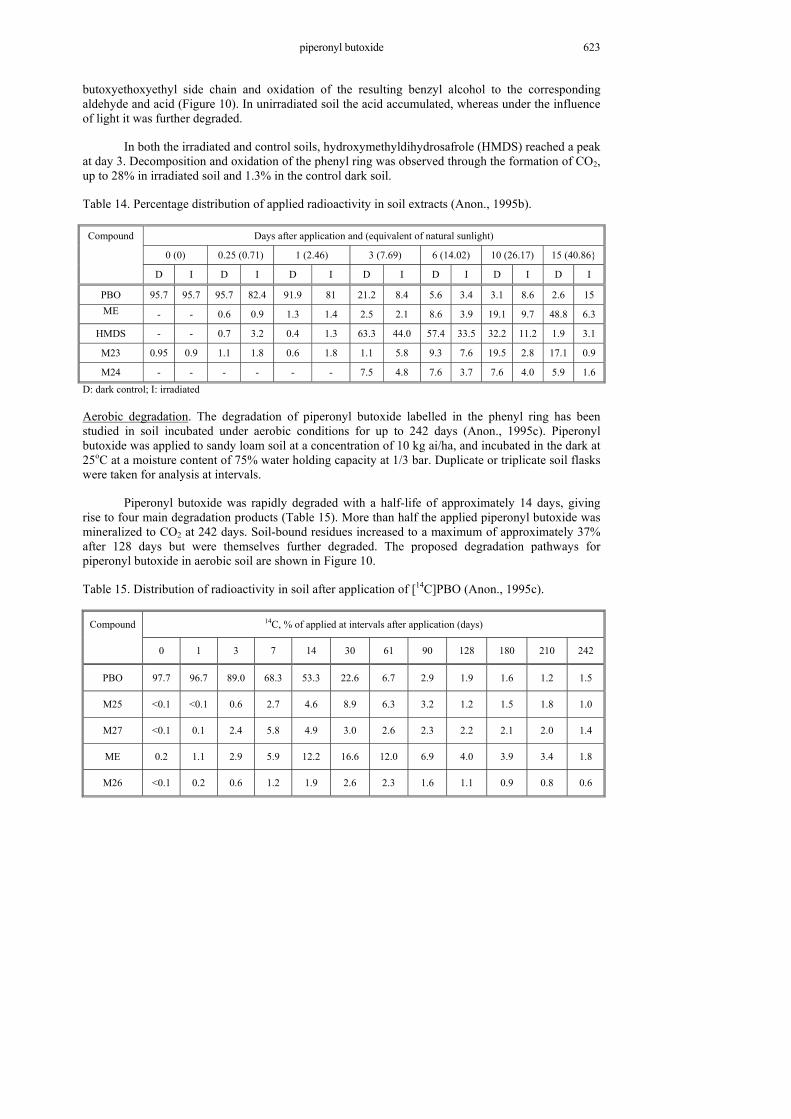
piperonyl butoxide 623
butoxyethoxyethyl side chain and oxidation of the resulting benzyl alcohol to the corresponding aldehyde and acid (Figure 10). In unirradiated soil the acid accumulated, whereas under the influence of light it was further degraded.
In both the irradiated and control soils, hydroxymethyldihydrosafrole (HMDS) reached a peak at day 3. Decomposition and oxidation of the phenyl ring was observed through the formation of CO2, up to 28% in irradiated soil and 1.3% in the control dark soil.
Table 14. Percentage distribution of applied radioactivity in soil extracts (Anon., 1995b).
Days after application and (equivalent of natural sunlight)
0 (0) 0.25 (0.71) 1 (2.46) 3 (7.69) 6 (14.02) 10 (26.17) 15 (40.86}
Compound
D I D I D I D I D I D I D I
PBO 95.7 95.7 95.7 82.4 91.9 81 21.2 8.4 5.6 3.4 3.1 8.6 2.6 15 ME - - 0.6 0.9 1.3 1.4 2.5 2.1 8.6 3.9 19.1 9.7 48.8 6.3
HMDS - - 0.7 3.2 0.4 1.3 63.3 44.0 57.4 33.5 32.2 11.2 1.9 3.1
M23 0.95 0.9 1.1 1.8 0.6 1.8 1.1 5.8 9.3 7.6 19.5 2.8 17.1 0.9
M24 - - - - - - 7.5 4.8 7.6 3.7 7.6 4.0 5.9 1.6
D: dark control; I: irradiated
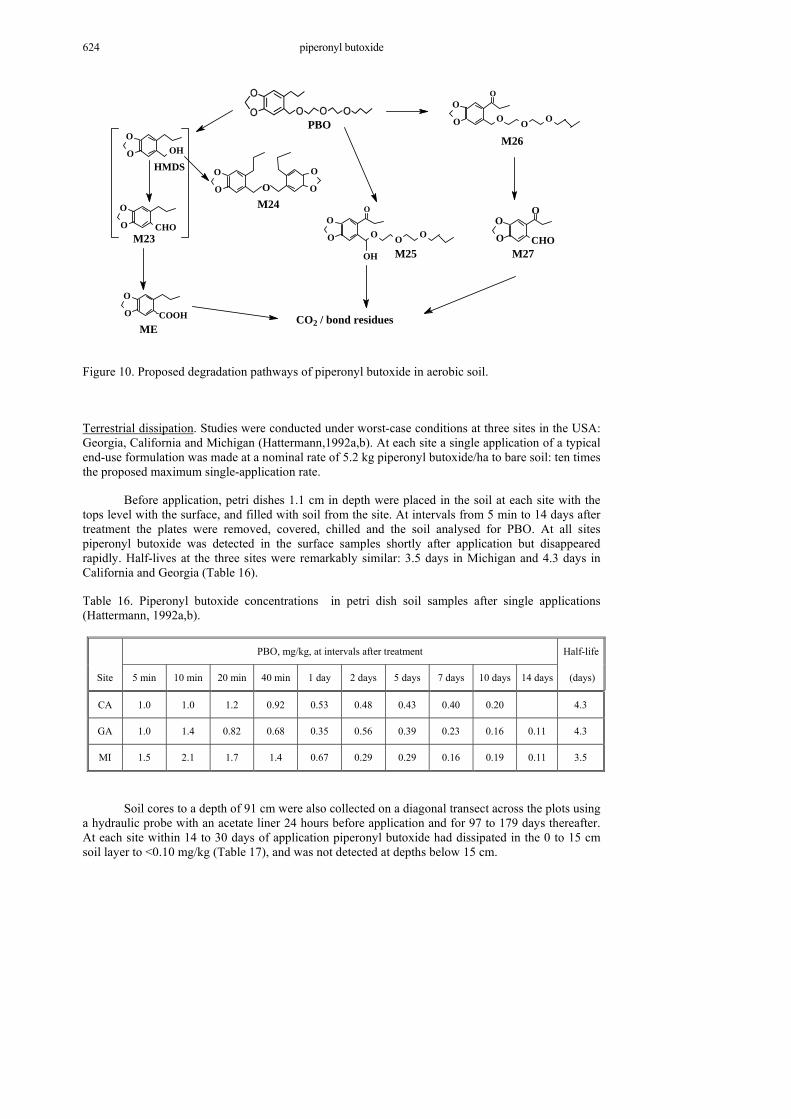
Aerobic degradation. The degradation of piperonyl butoxide labelled in the phenyl ring has been studied in soil incubated under aerobic conditions for up to 242 days (Anon., 1995c). Piperonyl butoxide was applied to sandy loam soil at a concentration of 10 kg ai/ha, and incubated in the dark at 25oC at a moisture content of 75% water holding capacity at 1/3 bar. Duplicate or triplicate soil flasks were taken for analysis at intervals.
Piperonyl butoxide was rapidly degraded with a half-life of approximately 14 days, giving rise to four main degradation products (Table 15). More than half the applied piperonyl butoxide was mineralized to CO2 at 242 days. Soil-bound residues increased to a maximum of approximately 37% after 128 days but were themselves further degraded. The proposed degradation pathways for piperonyl butoxide in aerobic soil are shown in Figure 10.
Table 15. Distribution of radioactivity in soil after application of [14C]PBO (Anon., 1995c).
14C, % of applied at intervals after application (days) Compound
0 1 3 7 14 30 61 90 128 180 210 242
PBO 97.7 96.7 89.0 68.3 53.3 22.6 6.7 2.9 1.9 1.6 1.2 1.5
M25 <0.1 <0.1 0.6 2.7 4.6 8.9 6.3 3.2 1.2 1.5 1.8 1.0
M27 <0.1 0.1 2.4 5.8 4.9 3.0 2.6 2.3 2.2 2.1 2.0 1.4
ME 0.2 1.1 2.9 5.9 12.2 16.6 12.0 6.9 4.0 3.9 3.4 1.8
M26 <0.1 0.2 0.6 1.2 1.9 2.6 2.3 1.6 1.1 0.9 0.8 0.6
piperonyl butoxide 624
HMDS
ME
M25
CO2 / bond residues
M26
M27
PBO
M24
M23
OHO
O
CHO
O
O
COOH
O
O
O
O
OH
O
O O OO
O
CHO
O
OO O OO
O
O
O
O
O
O
Figure 10. Proposed degradation pathways of piperonyl butoxide in aerobic soil.
Terrestrial dissipation. Studies were conducted under worst-case conditions at three sites in the USA: Georgia, California and Michigan (Hattermann,1992a,b). At each site a single application of a typical end-use formulation was made at a nominal rate of 5.2 kg piperonyl butoxide/ha to bare soil: ten times the proposed maximum single-application rate.
Before application, petri dishes 1.1 cm in depth were placed in the soil at each site with the tops level with the surface, and filled with soil from the site. At intervals from 5 min to 14 days after treatment the plates were removed, covered, chilled and the soil analysed for PBO. At all sites piperonyl butoxide was detected in the surface samples shortly after application but disappeared rapidly. Half-lives at the three sites were remarkably similar: 3.5 days in Michigan and 4.3 days in California and Georgia (Table 16).
Table 16. Piperonyl butoxide concentrations in petri dish soil samples after single applications (Hattermann, 1992a,b).
PBO, mg/kg, at intervals after treatment Half-life
Site 5 min 10 min 20 min 40 min 1 day 2 days 5 days 7 days 10 days 14 days (days)
CA 1.0 1.0 1.2 0.92 0.53 0.48 0.43 0.40 0.20 4.3
GA 1.0 1.4 0.82 0.68 0.35 0.56 0.39 0.23 0.16 0.11 4.3
MI 1.5 2.1 1.7 1.4 0.67 0.29 0.29 0.16 0.19 0.11 3.5
Soil cores to a depth of 91 cm were also collected on a diagonal transect across the plots using a hydraulic probe with an acetate liner 24 hours before application and for 97 to 179 days thereafter. At each site within 14 to 30 days of application piperonyl butoxide had dissipated in the 0 to 15 cm soil layer to <0.10 mg/kg (Table 17), and was not detected at depths below 15 cm.

piperonyl butoxide 625
Table 17. Piperonyl butoxide concentration in soil at 0-15 cm depth after application of 5.2 kg ai/ha (Hattermann, 1992a,b).
PBO, mg/kg, at days after treatment Site
-1 0 1 2 3 5 7 10 14 30 60
CA <0.10 - 0.53 0.48 0.43 0.40 0.20 0.25 0.22 <0.10 <0.10
MI - <0.10 0.67 0.20 0.29 0.161 0.202 <0.10 0.11 <0.10 <0.10
GA <0.10 - 0.35 0.56 0.39 0.23 0.16 0.15 0.11 <0.10 <0.10
1 Sampled on day 4 2 Sampled on day 8 Adsorption/desorption. The adsorption and desorption of piperonyl butoxide labelled in the phenyl ring were determined by batch equilibrium (Anon., 1995f). Four concentrations, 0.4, 2.0, 3.0, and 4.0 mg/l, were equilibrated on four soils: sand, clay loam, sandy loam, and silt loam for 24 hours at 25oC in the dark using a soil:solution ratio of 1:10. After the adsorption phase, the soil and solution were separated and two sequential desorption steps were carried out on the soil residue.
Piperonyl butoxide has low to moderate mobility in sandy loam, clay loam and silt loam soils and high mobility in sand (Table 18). Freundlich adsorption constants (Ka) ranged from 0.98 in sand to 29.9 in silt loam, and Koc values from 399 in sand to 830 in silt loam. No desorption value (Kd) was determined for sand because of the low adsorption.
Table 18. Adsorption and desorption characteristics of piperonyl butoxide in four soils.
Organic Adsorption Desorption1
Soil matter (%) Ka Koc 1/n Kd Koc 1/n
Sandy loam 2.1 8.37 399 0.67 8.2/6.32 390/301 0.63/0.57
Sand 0.2 0.98 490 0.90 - - -
Clay loam 1.7 12.0 706 1.57 16.8/94.7 988/5571 1.28/2.07
Silt loam 3.6 29.9 830 0.84 41.5/58.1 1152/1614 0.87/0.83
1 First/second desorption Column leaching. The leaching behaviour of piperonyl butoxide labelled in the phenyl ring was investigated with unaged material in sand, silt loam, sandy loam, and clay loam, and with aged residues in sandy loam (Anon., 1995g).
For unaged leaching, [14C]piperonyl butoxide was applied at a rate equivalent to 5 kg ai/ha to the tops of 30-cm columns and eluted with 0.01 M calcium chloride. Piperonyl butoxide did not leach readily in loam soils (Table 19). A distribution coefficient of 0.42 ml/g was calculated for sand soil, but not for the other soils as less than 5% of the radioactivity was eluted.

piperonyl butoxide 626
Table 19. Recoveries of 14C from soil columns after application of [14C]PBO at 1 mg/column (Anon., 1995g).
14C, % of applied Fraction
Sand Clay loam Sandy loam Silt loam
Leachate 74.1 1.3 0.2 0.6
Extracted 16.9 88.4 96.0 94.4
Residues 2.8 5.1 1.4 5.2
Total 93.8 94.8 97.6 100.2
The unleached radioactivity was distributed fairly evenly throughout the columns (1.4-4.6% of the applied radioactivity) in the sand soil, but was in the top 10 cm of the loam soil columns.
Aged soil residues were prepared by incubation of [14C]piperonyl butoxide in sandy loam soil under aerobic conditions for 18 days. After this period, 61% of the applied radioactivity was extracted from the soil, and 44.8% of the AR was piperonyl butoxide (Table 20). A mean of 4% was trapped as volatiles. The aged soil was placed on top of 30-cm soil columns and eluted with 0.01 M calcium chloride. Approximately 14% of the applied radioactivity was found in the column effluent. Most of the radioactivity remained in the aged soil applied to the soil columns. All three degradation products were more mobile than the parent compound (Table 20).
Table 20. Radioactive components in aged soil extract and column leachate after application and elution of [14C]PBO (Anon., 1995g).
14C, % of applied1 Fraction
PBO HMDS M23 ME
0-5 cm 7.6/42.8 5.2/2.8 2.4/1.8 1.8/2.5
5-10 cm 0.1/2.5 0.2/1.1 0.1/0.2 3.7/1.3
10-15 cm <0.1/<0.1 0.7/0.6 0.1/0.1 3.8/1.3
15-20 cm <0.1/<0.1 0.1/0.4 0.1/0.1 5.3/1.3
20-25 cm <0.1/<0.1 0.5/0.5 0.1/<0.1 5.4/0.9
25-30 cm <0.1/<0.1 <0.1/0.2 0.1/<0.1 7.1/0.6
Leachate2 0.1 4.7 1.6 7.4
Soil extract3 44.8 5.7 3.4 7.0
1 Column 1/column 2 2 Only from column 1 3 Extract of a soil sample aged for 18 days. Environmental fate in water/sediment systems
Hydrolysis. The stability of piperonyl butoxide labelled in the phenyl ring was investigated at a concentration of 1 mg/l at pH 5, 7, and 9 in sterile aqueous buffers (Anon., 1995a). Test systems were
piperonyl butoxide 627
incubated at 25oC in the dark for 30 days and 97 to 100 % of the applied radioactivity was recovered at the end of the experiment in each case.
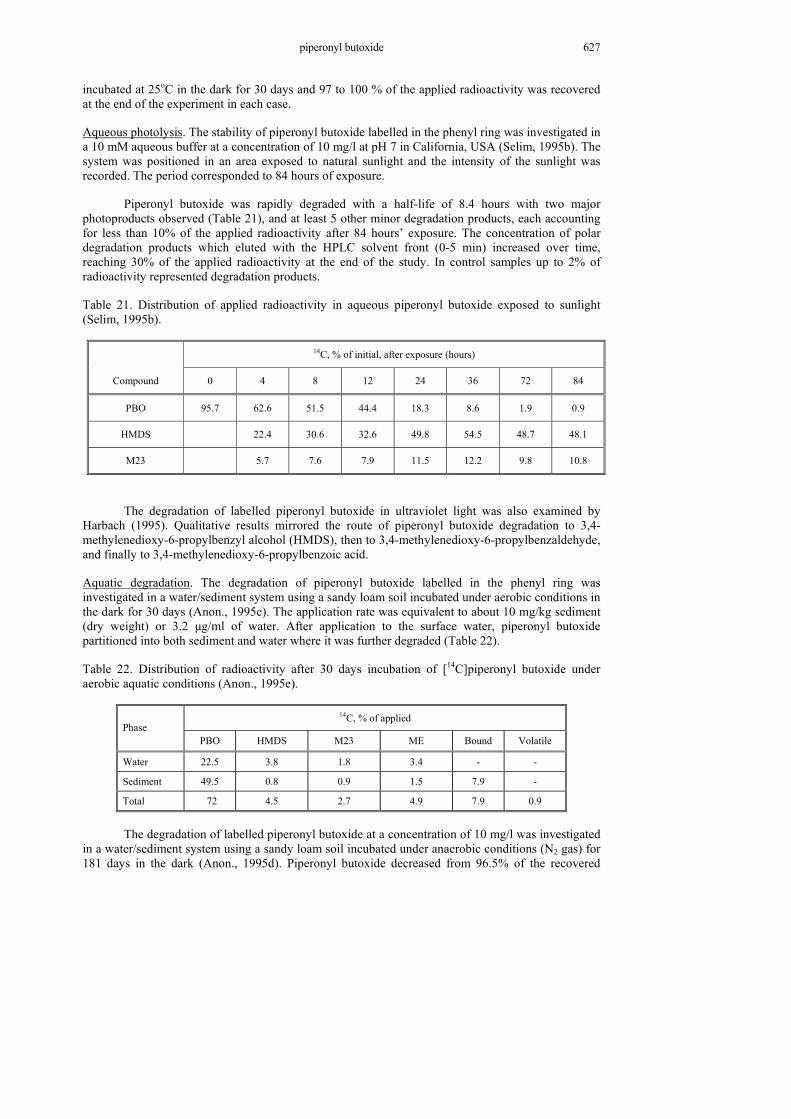
Aqueous photolysis. The stability of piperonyl butoxide labelled in the phenyl ring was investigated in a 10 mM aqueous buffer at a concentration of 10 mg/l at pH 7 in California, USA (Selim, 1995b). The system was positioned in an area exposed to natural sunlight and the intensity of the sunlight was recorded. The period corresponded to 84 hours of exposure.
Piperonyl butoxide was rapidly degraded with a half-life of 8.4 hours with two major photoproducts observed (Table 21), and at least 5 other minor degradation products, each accounting for less than 10% of the applied radioactivity after 84 hours’ exposure. The concentration of polar degradation products which eluted with the HPLC solvent front (0-5 min) increased over time, reaching 30% of the applied radioactivity at the end of the study. In control samples up to 2% of radioactivity represented degradation products.
Table 21. Distribution of applied radioactivity in aqueous piperonyl butoxide exposed to sunlight (Selim, 1995b).
14C, % of initial, after exposure (hours)
Compound 0 4 8 12 24 36 72 84
PBO 95.7 62.6 51.5 44.4 18.3 8.6 1.9 0.9
HMDS 22.4 30.6 32.6 49.8 54.5 48.7 48.1
M23 5.7 7.6 7.9 11.5 12.2 9.8 10.8
The degradation of labelled piperonyl butoxide in ultraviolet light was also examined by Harbach (1995). Qualitative results mirrored the route of piperonyl butoxide degradation to 3,4-methylenedioxy-6-propylbenzyl alcohol (HMDS), then to 3,4-methylenedioxy-6-propylbenzaldehyde, and finally to 3,4-methylenedioxy-6-propylbenzoic acid.
Aquatic degradation. The degradation of piperonyl butoxide labelled in the phenyl ring was investigated in a water/sediment system using a sandy loam soil incubated under aerobic conditions in the dark for 30 days (Anon., 1995e). The application rate was equivalent to about 10 mg/kg sediment (dry weight) or 3.2 µg/ml of water. After application to the surface water, piperonyl butoxide partitioned into both sediment and water where it was further degraded (Table 22).
Table 22. Distribution of radioactivity after 30 days incubation of [14C]piperonyl butoxide under aerobic aquatic conditions (Anon., 1995e).
14C, % of applied Phase
PBO HMDS M23 ME Bound Volatile
Water 22.5 3.8 1.8 3.4 - -
Sediment 49.5 0.8 0.9 1.5 7.9 -
Total 72 4.5 2.7 4.9 7.9 0.9
The degradation of labelled piperonyl butoxide at a concentration of 10 mg/l was investigated
in a water/sediment system using a sandy loam soil incubated under anaerobic conditions (N2 gas) for 181 days in the dark (Anon., 1995d). Piperonyl butoxide decreased from 96.5% of the recovered

piperonyl butoxide 628
radioactivity at day 0 to 91.2 % at day 181. Two degradation products, 3,4-methylenedioxy-6-propylbenzyl alcohol (HMDS) and 3,4-methylenedioxy-6-propylbenzoic acid (ME) were detected (2.4% of the TRR or less as a combined residue).
METHODS OF RESIDUE ANALYSIS
Analytical methods
One method to determine residues of piperonyl butoxide and metabolites in raw and processed plant commodities involves extraction with acetonitrile, partition of piperonyl butoxide into petroleum ether, and analysis by HPLC with fluorescence detection. For dry samples such as sugar and sugar beet molasses, water is added before extraction. The solvent is evaporated and the aqueous fraction extracted with petroleum ether. PBO goes into the organic phase and the more polar metabolites remain in the aqueous phase, which is then subjected to mild acid hydrolysis to convert the metabolites quantitatively to HMDS. After neutralization, the reaction mixture is extracted with acetonitrile and the solution analysed for HMDS. Residues are expressed as piperonyl butoxide. Recovery was evaluated by fortification with piperonyl butoxide, which itself is degraded quantitatively to HMDS upon mild acid hydrolysis. PBO is determined as such in the petroleum ether fraction.
The limit of quantification (LOQ) for piperonyl butoxide and for total metabolites was 0.10 mg/kg in all samples. In grapes and cranberries, preliminary validation was unsuccessful for metabolites, as recoveries from fortified controls of these commodities were below 70%. The results of the method validation are shown on Table 23.
Untreated controls typically produced no elution peaks that interfered with piperonyl butoxide. Control orange oil contained a minor interferent, but the level of piperonyl butoxide in oil from treated oranges was more than twice as high. In all except two substrates, controls did not produce elution peaks that interfered with HMDS. Interferences were observed for metabolites in mustard greens from one of two trials and lemons from each of two trials, at levels that prevented determination of metabolite concentrations.
Table 23. Recoveries of piperonyl butoxide and metabolites in method validation and procedural verification.1
Analysis % Recovery, overall mean Var CV N
Piperonyl butoxide
Method validation 90.9 1.5 1.7% 596
Procedural verification 94.2 4.3 4.5% 112
Total metabolites determined as HMDS
Method validation2 90.9 1.6 1.7% 647
Procedural verification 92.6 3.3 3.5% 42
Var.: pooled variance for all analyses CV: pooled coefficient of variation N: No. of analyses. 1.Method performance during each series of analyses 2 Does not include data on legumes, citrus, cranberries or grapes
Residues of piperonyl butoxide in treated stored grains were determined by a variety of methods. Wheat and milled fractions were extracted with methanol (Halls, 1981; Ardley et al., 1982;

piperonyl butoxide 629
Anon., 1999; Turnbull), hexane (Anon., 1999; Molinari, 1987; Australian Wheat Board, 1988) or ethyl acetate (Molinari, 1987), followed by HPLC analysis.
In studies on the treatment of warehouses (Meinen, 1991a,b) samples were extracted with an
organic solvent and water. After clean-up by liquid-solid partition and partial evaporation of the eluate, the entire extract, including piperonyl butoxide, was brominated. The solution containing brominated piperonyl butoxide was further cleaned up in a solid phase extraction (SPE) column. The eluate was analysed by gas chromatography with electron-capture detection. The LOQ was 0.10 mg/kg, and the limit of detection 0.05 mg/kg, with average recoveries ranging from 56% in beans to 67% in peanuts. Control samples in general produced no interferents.
In the method used to determine residues of piperonyl butoxide in milk, eggs, and tissues of livestock in the feeding studies, samples were extracted with acetonitrile and fat was removed by partition with hexane. The acetonitrile fraction was concentrated, aqueous 1.5% NaCl was added, and piperonyl butoxide was partitioned into hexane. The hexane solution was cleaned up on a silica gel column and the eluate was analysed by GC-MS and GC-MS-MS. Untreated controls occasionally produced elution peaks that interfered with piperonyl butoxide. Overall, however, the specificity was considered adequate for the parent compound in all samples. LOQs were validated at 0.05 mg/kg in liver, kidney, muscle and fat with recoveries ranging from 70 to 108%, and at 0.01 mg/kg and 0.05 mg/kg in milk and in eggs from 67 to 120% and 71 to 104% respectively. Stability of pesticide residues in stored analytical samples
The stability of piperonyl butoxide was examined by analyses at intervals of samples of raw and processed commodities fortified at 1.0 or 0.2 mg/kg, and stored under the same conditions of light and temperature as were used for the treated commodities in the field and processing studies. Analytical recoveries were checked with freshly fortified samples (Table 24).
Table 24. Stability of piperonyl butoxide in frozen raw and processed agricultural commodities stored in the dark.
Sample Interval (months) Analytical recoveries % remaining
Fortified at 1 mg/kg
Potato (Winkler, 1997) Tuber 0; 3; 6; 12 91; 97; 93.5; 86.5 93.5; 89.5; 87.5; 87.5
Granules 0; 3; 6; 12 95.5; 97.5; 93; 91.5 94; 93.5; 85; 53
Chips 0; 3; 6; 12 92; 100.5; 93; 96.5 93.5; 99; 90; 93.5
Wet peel 0; 3; 6; 12 84; 90.5; 85; 88.5 84; 74; 73; 68.5
Leaf lettuce (Hattermann, 1996f) 3; 6; 12 107.4; 97.2; 93.6 101.1; 102; 96.4
Broccoli (Selim, 1996d) 3; 6; 12 75; 89; 90.7 80.4; 79; 70.6
Cucumber (Hattermann, 1996I) 3; 6; 12 90.7; 91.7; 95.8 95.6; 92.8; 93.2
Grapes (Hattermann, 1996b) 3; 6; 12 88.9; 92.1; 80.4 91.4; 86.4; 81.7
Orange (Selim, 1996a) Fruit 3; 6; 12 86.0; 112.5; 87.9 85; 102.6; 89.5
Molasses 3; 6; 12 110; 95.2; 85.4 99.6; 94; 86.6
Juice 3; 6; 12 110; 82.4; 106.9 112; 87.5; 96.7
Dry pulp 3; 6; 12 95.2; 85; 86 95; 97.4; 97.1
Tomato (Hattermann, 1995m) Fruit 3; 6; 12 92; 94.7; 100.8 98.1; 100.9; 91.9
Juice 3; 6; 12 95.1; 103.5; 138 72.7; 76.9; 96.7
Dry pomace 3; 6; 12 99.2; 81; 105.9 88.4; 69.8; 95.3
piperonyl butoxide 630
Sample Interval (months) Analytical recoveries % remaining
Purée 3; 6; 12 69.7; 88.5; 117.1 66.2; 55; 93.2
Wet pomace 3; 6; 12 97.1; 76.1; 101.3 96.7; 95; 93.3
Succulent Bean (Hattermann, 1995c) Vine 3; 6; 12 110; 85; 92.4 96.9; 90.9; 84.2
Pod 3; 6; 12 88.3; 91.4; 93.7 83; 90; 86
Hay 3; 6; 12 76; 77.3; 67 72; 61.8; 68.3
Cotton (Selim, 1996c) Oil-crude 3; 6; 12 107.2; 95.1; 100.8 106.2; 107.8; 108.5
Seed 3; 6; 12 99.2; 89; 76.2 89; 85.9; 75.7
Meal 3; 6; 12 80.0; 78; 85.7 75.6; 66.5; 65.8
Soapstock 3; 6; 12 74.6; 95.6; 93 106.3; 107.8; 85
Fortified at 0.2 mg/kg
Candy (Meinen, 1991) 12 58-107 66
Meat (Meinen, 1991) 12 80-116 55.5
Bread (Meinen, 1991) 12 70-93 50.5
Sugar (Meinen, 1991) 12 58-65 63
Peanuts (Meinen, 1991) 12 65-85 69
Beans (Meinen, 1991) 12 80-107 81
DEFINITION OF THE RESIDUE
On the day of application, piperonyl butoxide accounted for 51% of the TRR in lettuce, and two metabolites for 24% in approximately equal amounts. After 10 days, levels of PBO decreased by 50% and 10 or more metabolites were formed at levels <10 % of the TRR. Piperonyl butoxide was not translocated to potato tubers or cotton products when applied to leaves of the plants. Some very polar material was found in cotton seed and lint, at 44 and 80% of the TRR respectively. Although these metabolites were not identified, they were highly degraded from piperonyl butoxide, and owing to their high polarity would not accumulate in animals if ingested.
The Meeting agreed that the definition of the residue for compliance with MRLs and for the estimation of dietary intake in plants should continue to be piperonyl butoxide.
Piperonyl butoxide has a log Pow of 4.6, which indicates fat-solubility.
USE PATTERN
Tables 25, 26 and 27 summarize information on GAP for the uses of pesticides that contain piperonyl butoxide as a synergist
Table 25. Summary of GAP for pre-harvest uses.
Application Crop Country Form.
Method kg ai/hl kg ai/ha No.
PHI
(days)
Almonds in bulk or bags Costa Rica NS Surface treatment 0.62 NA 1 NS2 NA
Almonds (shell-nuts) Italy LC Spray, broadcast 0.032 to 0.0375 NS NS 2
Italy EC Spray, broadcast 0.032 to 0.04 NS NS 2

piperonyl butoxide 631
Application Crop Country Form.
Method kg ai/hl kg ai/ha No.
PHI
(days)
Apple Italy NS Spray, broadcast 0.04 NS NS 2
Artichoke Italy NS Spray, broadcast 0.04 NS NS 2
Italy LC Spray, broadcast 0.032 to 0.0375 NS NS 2
Italy EC Spray, broadcast 0.032 to 0.04 NS NS 2
Asparagus Italy NS Spray, broadcast 0.04 NS NS 2
Italy LC Spray, broadcast 0.032 to 0.0375 NS NS 2
Italy EC Spray, broadcast 0.032 to 0.04 NS NS 2
USA NS Spray, broadcast NS 0.045 to 0.56 NS 0.5
Costa Rica NS Spray, broadcast NS 0.56 NS 0
Aubergine Italy LC Spray, broadcast 0.0375 NS NS 2
Italy EC Spray, broadcast 0.04 NS NS 2
Avocado Costa Rica NS Spray, broadcast NS 0.56 NS 0
Beans Italy NS Spray, broadcast 0.04 NS NS 2
Italy LC Spray, broadcast 0.032 to 0.0375 NS NS 2
Italy EC Spray, broadcast 0.032 to 0.04 NS NS 2
Berries USA NS Spray, broadcast NS 0.045 to 0.56 NS 0.5
Germany Liquid Spray, broadcast 0.4 NS 3 max. 2
Costa Rica NS Spray, broadcast NS 0.56 NS 0
Berries (except strawberries)
Germany NS Spray, broadcast 0.017 NS NS 2
Brocolli USA NS Spray, broadcast NS 0.045 to 0.56 NS 0.5
Costa Rica NS Spray, broadcast NS 0.56 NS 0
Brassica plants Netherlands Liquid Spray, broadcast 0.048 NS NS 2
Broad bean Italy NS Spray, broadcast 0.04 NS NS 2
Brussels sprouts USA NS Spray, broadcast NS 0.045 to 0.56 NS 0.5
Costa Rica NS Spray, broadcast NS 0.56 NS 0
Bulb vegetables Costa Rica NS Spray, broadcast NS 0.56 NS 0
Bush-beans, etc. Germany DP Spray, broadcast NS 0.75 NS 1
Bush-beans Germany DP Dusting NS 0.75 NS NS
Cabbage Italy LC Spray, broadcast 0.032 to 0.375 NS NS 2
Italy EC Spray, broadcast 0.032 to 0.12 NS NS 2
Germany DP Spray, broadcast NS 0.75 NS 3
USA NS Spray, broadcast NS 0.045 to 0.56 NS 0.5
Costa Rica NS Spray, broadcast NS 0.56 NS 0
Carrots Italy NS Spray, broadcast 0.04 NS NS 2
Italy LC Spray, broadcast 0.032 to 0.0375 NS NS 2
Italy EC Spray, broadcast 0.032 to 0.04 NS NS 2
Cauliflower Italy NS Spray, broadcast 0.04 NS NS 2
USA NS Spray, broadcast NS 0.045 to 0.56 NS 0.5
Costa Rica NS Spray, broadcast NS 0.56 NS 0
Cereal grains Costa Rica NS Spray, broadcast NS 0.56 NS 0
Chayote Costa Rica NS Spray, broadcast NS 0.56 NS 0
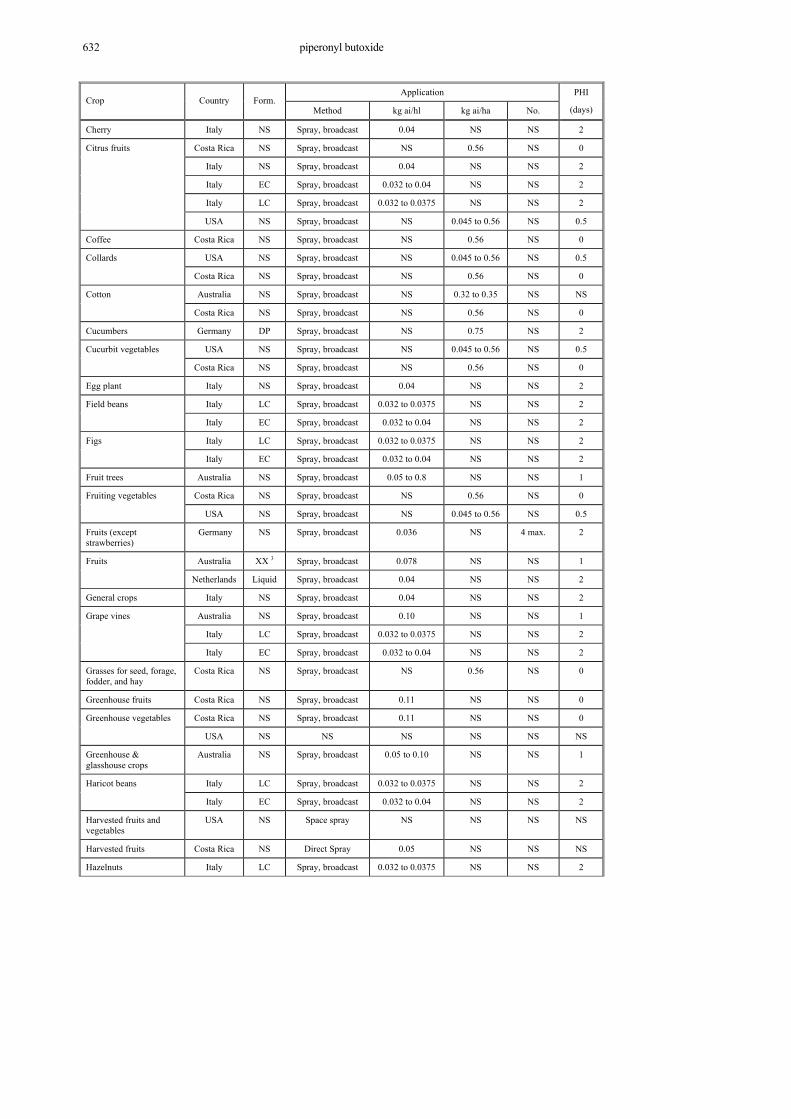
piperonyl butoxide 632
Application Crop Country Form.
Method kg ai/hl kg ai/ha No.
PHI
(days)
Cherry Italy NS Spray, broadcast 0.04 NS NS 2
Citrus fruits Costa Rica NS Spray, broadcast NS 0.56 NS 0
Italy NS Spray, broadcast 0.04 NS NS 2
Italy EC Spray, broadcast 0.032 to 0.04 NS NS 2
Italy LC Spray, broadcast 0.032 to 0.0375 NS NS 2
USA NS Spray, broadcast NS 0.045 to 0.56 NS 0.5
Coffee Costa Rica NS Spray, broadcast NS 0.56 NS 0
Collards USA NS Spray, broadcast NS 0.045 to 0.56 NS 0.5
Costa Rica NS Spray, broadcast NS 0.56 NS 0
Cotton Australia NS Spray, broadcast NS 0.32 to 0.35 NS NS
Costa Rica NS Spray, broadcast NS 0.56 NS 0
Cucumbers Germany DP Spray, broadcast NS 0.75 NS 2
Cucurbit vegetables USA NS Spray, broadcast NS 0.045 to 0.56 NS 0.5
Costa Rica NS Spray, broadcast NS 0.56 NS 0
Egg plant Italy NS Spray, broadcast 0.04 NS NS 2
Field beans Italy LC Spray, broadcast 0.032 to 0.0375 NS NS 2
Italy EC Spray, broadcast 0.032 to 0.04 NS NS 2
Figs Italy LC Spray, broadcast 0.032 to 0.0375 NS NS 2
Italy EC Spray, broadcast 0.032 to 0.04 NS NS 2
Fruit trees Australia NS Spray, broadcast 0.05 to 0.8 NS NS 1
Fruiting vegetables Costa Rica NS Spray, broadcast NS 0.56 NS 0
USA NS Spray, broadcast NS 0.045 to 0.56 NS 0.5
Fruits (except strawberries)
Germany NS Spray, broadcast 0.036 NS 4 max. 2
Fruits Australia XX 3 Spray, broadcast 0.078 NS NS 1
Netherlands Liquid Spray, broadcast 0.04 NS NS 2
General crops Italy NS Spray, broadcast 0.04 NS NS 2
Grape vines Australia NS Spray, broadcast 0.10 NS NS 1
Italy LC Spray, broadcast 0.032 to 0.0375 NS NS 2
Italy EC Spray, broadcast 0.032 to 0.04 NS NS 2
Grasses for seed, forage, fodder, and hay
Costa Rica NS Spray, broadcast NS 0.56 NS 0
Greenhouse fruits Costa Rica NS Spray, broadcast 0.11 NS NS 0
Greenhouse vegetables Costa Rica NS Spray, broadcast 0.11 NS NS 0
USA NS NS NS NS NS NS
Greenhouse & glasshouse crops
Australia NS Spray, broadcast 0.05 to 0.10 NS NS 1
Haricot beans Italy LC Spray, broadcast 0.032 to 0.0375 NS NS 2
Italy EC Spray, broadcast 0.032 to 0.04 NS NS 2
Harvested fruits and vegetables
USA NS Space spray NS NS NS NS
Harvested fruits Costa Rica NS Direct Spray 0.05 NS NS NS
Hazelnuts Italy LC Spray, broadcast 0.032 to 0.0375 NS NS 2
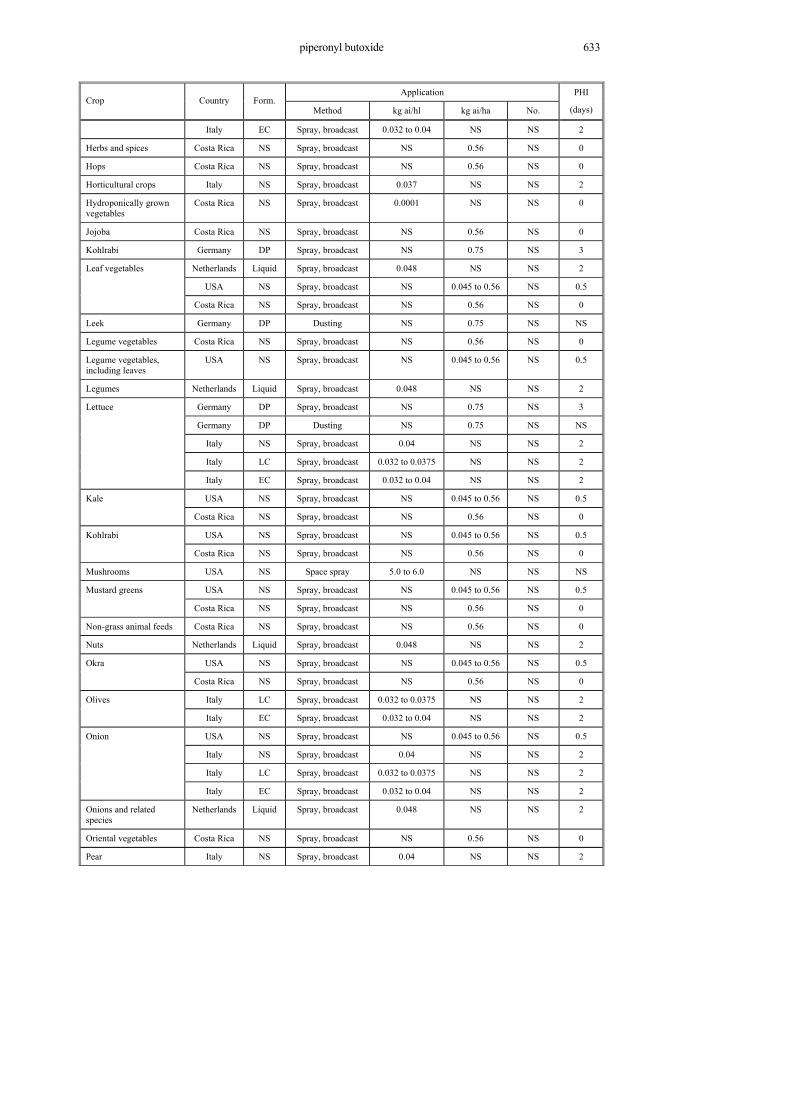
piperonyl butoxide 633
Application Crop Country Form.
Method kg ai/hl kg ai/ha No.
PHI
(days)
Italy EC Spray, broadcast 0.032 to 0.04 NS NS 2
Herbs and spices Costa Rica NS Spray, broadcast NS 0.56 NS 0
Hops Costa Rica NS Spray, broadcast NS 0.56 NS 0
Horticultural crops Italy NS Spray, broadcast 0.037 NS NS 2
Hydroponically grown vegetables
Costa Rica NS Spray, broadcast 0.0001 NS NS 0
Jojoba Costa Rica NS Spray, broadcast NS 0.56 NS 0
Kohlrabi Germany DP Spray, broadcast NS 0.75 NS 3
Leaf vegetables Netherlands Liquid Spray, broadcast 0.048 NS NS 2
USA NS Spray, broadcast NS 0.045 to 0.56 NS 0.5
Costa Rica NS Spray, broadcast NS 0.56 NS 0
Leek Germany DP Dusting NS 0.75 NS NS
Legume vegetables Costa Rica NS Spray, broadcast NS 0.56 NS 0
Legume vegetables, including leaves
USA NS Spray, broadcast NS 0.045 to 0.56 NS 0.5
Legumes Netherlands Liquid Spray, broadcast 0.048 NS NS 2
Lettuce Germany DP Spray, broadcast NS 0.75 NS 3
Germany DP Dusting NS 0.75 NS NS
Italy NS Spray, broadcast 0.04 NS NS 2
Italy LC Spray, broadcast 0.032 to 0.0375 NS NS 2
Italy EC Spray, broadcast 0.032 to 0.04 NS NS 2
Kale USA NS Spray, broadcast NS 0.045 to 0.56 NS 0.5
Costa Rica NS Spray, broadcast NS 0.56 NS 0
Kohlrabi USA NS Spray, broadcast NS 0.045 to 0.56 NS 0.5
Costa Rica NS Spray, broadcast NS 0.56 NS 0
Mushrooms USA NS Space spray 5.0 to 6.0 NS NS NS
Mustard greens USA NS Spray, broadcast NS 0.045 to 0.56 NS 0.5
Costa Rica NS Spray, broadcast NS 0.56 NS 0
Non-grass animal feeds Costa Rica NS Spray, broadcast NS 0.56 NS 0
Nuts Netherlands Liquid Spray, broadcast 0.048 NS NS 2
Okra USA NS Spray, broadcast NS 0.045 to 0.56 NS 0.5
Costa Rica NS Spray, broadcast NS 0.56 NS 0
Olives Italy LC Spray, broadcast 0.032 to 0.0375 NS NS 2
Italy EC Spray, broadcast 0.032 to 0.04 NS NS 2
Onion USA NS Spray, broadcast NS 0.045 to 0.56 NS 0.5
Italy NS Spray, broadcast 0.04 NS NS 2
Italy LC Spray, broadcast 0.032 to 0.0375 NS NS 2
Italy EC Spray, broadcast 0.032 to 0.04 NS NS 2
Onions and related species
Netherlands Liquid Spray, broadcast 0.048 NS NS 2
Oriental vegetables Costa Rica NS Spray, broadcast NS 0.56 NS 0
Pear Italy NS Spray, broadcast 0.04 NS NS 2
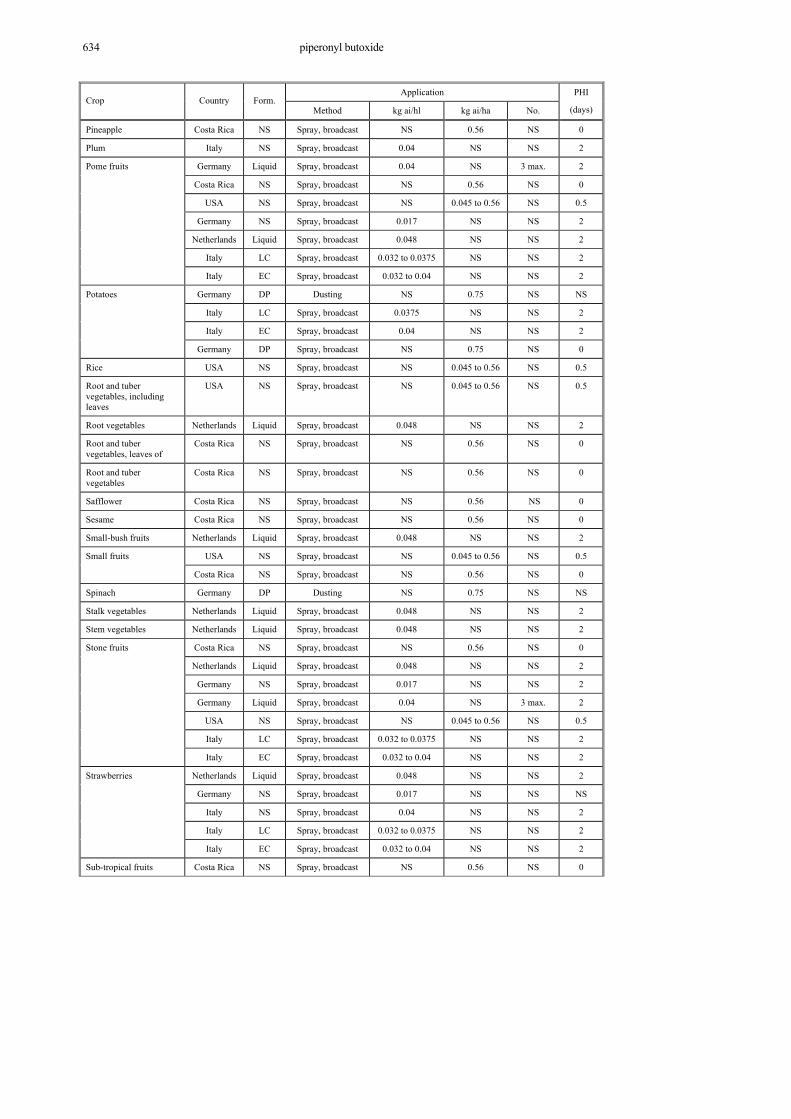
piperonyl butoxide 634
Application Crop Country Form.
Method kg ai/hl kg ai/ha No.
PHI
(days)
Pineapple Costa Rica NS Spray, broadcast NS 0.56 NS 0
Plum Italy NS Spray, broadcast 0.04 NS NS 2
Pome fruits Germany Liquid Spray, broadcast 0.04 NS 3 max. 2
Costa Rica NS Spray, broadcast NS 0.56 NS 0
USA NS Spray, broadcast NS 0.045 to 0.56 NS 0.5
Germany NS Spray, broadcast 0.017 NS NS 2
Netherlands Liquid Spray, broadcast 0.048 NS NS 2
Italy LC Spray, broadcast 0.032 to 0.0375 NS NS 2
Italy EC Spray, broadcast 0.032 to 0.04 NS NS 2
Potatoes Germany DP Dusting NS 0.75 NS NS
Italy LC Spray, broadcast 0.0375 NS NS 2
Italy EC Spray, broadcast 0.04 NS NS 2
Germany DP Spray, broadcast NS 0.75 NS 0
Rice USA NS Spray, broadcast NS 0.045 to 0.56 NS 0.5
Root and tuber vegetables, including leaves
USA NS Spray, broadcast NS 0.045 to 0.56 NS 0.5
Root vegetables Netherlands Liquid Spray, broadcast 0.048 NS NS 2
Root and tuber vegetables, leaves of
Costa Rica NS Spray, broadcast NS 0.56 NS 0
Root and tuber vegetables
Costa Rica NS Spray, broadcast NS 0.56 NS 0
Safflower Costa Rica NS Spray, broadcast NS 0.56 NS 0
Sesame Costa Rica NS Spray, broadcast NS 0.56 NS 0
Small-bush fruits Netherlands Liquid Spray, broadcast 0.048 NS NS 2
Small fruits USA NS Spray, broadcast NS 0.045 to 0.56 NS 0.5
Costa Rica NS Spray, broadcast NS 0.56 NS 0
Spinach Germany DP Dusting NS 0.75 NS NS
Stalk vegetables Netherlands Liquid Spray, broadcast 0.048 NS NS 2
Stem vegetables Netherlands Liquid Spray, broadcast 0.048 NS NS 2
Stone fruits Costa Rica NS Spray, broadcast NS 0.56 NS 0
Netherlands Liquid Spray, broadcast 0.048 NS NS 2
Germany NS Spray, broadcast 0.017 NS NS 2
Germany Liquid Spray, broadcast 0.04 NS 3 max. 2
USA NS Spray, broadcast NS 0.045 to 0.56 NS 0.5
Italy LC Spray, broadcast 0.032 to 0.0375 NS NS 2
Italy EC Spray, broadcast 0.032 to 0.04 NS NS 2
Strawberries Netherlands Liquid Spray, broadcast 0.048 NS NS 2
Germany NS Spray, broadcast 0.017 NS NS NS
Italy NS Spray, broadcast 0.04 NS NS 2
Italy LC Spray, broadcast 0.032 to 0.0375 NS NS 2
Italy EC Spray, broadcast 0.032 to 0.04 NS NS 2
Sub-tropical fruits Costa Rica NS Spray, broadcast NS 0.56 NS 0

piperonyl butoxide 635
Application Crop Country Form.
Method kg ai/hl kg ai/ha No.
PHI
(days)
Sugar cane Costa Rica NS Spray, broadcast NS 0.56 NS 0
Sunflower Costa Rica NS Spray, broadcast NS 0.56 NS 0
Tea Costa Rica NS Spray, broadcast NS 0.56 NS 0
Tobacco Italy NS Spray, broadcast 0.04 NS NS 2
Italy LC Spray, broadcast 0.032 to 0.0375 NS NS 2
Tomato Italy NS Spray, broadcast 0.032 to 0.04 NS NS 2
Italy LC Spray, broadcast 0.0375 NS NS 2
Italy NS Spray, broadcast 0.032 to 0.04 NS NS 2
Germany DP Spray, broadcast NS 0.75 NS 2
Tree nuts Costa Rica NS Spray, broadcast NS 0.56 NS 0
Tuber vegetables Netherlands Liquid Spray, broadcast 0.048 NS NS 2
Vegetables (except capsicums and lettuce)
Australia NS Spray, broadcast 0.05 NS NS 1
Vegetables Australia XX Spray, broadcast 0.078 NS NS 1
Netherlands Liquid Spray, broadcast 0.04 NS NS 2
Australia NS Spray, broadcast 0.08 NS NS 1
1 Not applicable 2 Not specified 3 Microencapsulated timed release liquid concentrate
Table 26. Summary of GAP for post-harvest uses.
Application Crop Country Form.
Method kg ai/hl mg ai/kg grain No.
PHI
(days)
Milking rooms Costa Rica NS Space spray 0.94 NA NS NA
Milking parlours Costa Rica NS Space spray 0.94 NA NS NA
Peanuts in bulk or in bags
Costa Rica NS Surface treatment 0.62 NA NS NA
Stored fruits Italy NS Spray, broadcast 0.032 NS NS 2
Stored fruits and vegetables
USA NS Space spray NS NS NS NS
USA NS Direct spray NS NS NS NS
Stored cereals and legumes
Germany RTU Space spray Max. 0.132 kg/1000m3
NS NS NS
Stored food product in cloth bags, sacks, multi-walled paper bags, cardboard cartons
Australia RTU 0.58 kg/hl NS NS NS
Stored grain Australia EC Spray, broadcast 0.43-0.85 4.3-8.5 NS 1
EC Spray, broadcast 0.8 8.0 NS
RTU Surface treatment 0.43 0.215/m2 NS 1

piperonyl butoxide 636
Application Crop Country Form.
Method kg ai/hl mg ai/kg grain No.
PHI
(days)
Stored grain and seed
Costa Rica NS Surface treatment 3 NA NS NA
Italy ULV Direct spray 5.4 2.63-4.5* NS 42
USA NS Direct spray NS NA NS NA
Stored sweet potatoes
Costa Rica NS Space spray 3 NS Max 10
NS
USA NS Space spray NS NS NS NS
Walnuts in bulk or in bags
Costa Rica NS Surface treatment 0.62 NA NS NA
Warehouse & storage-dried foods
USA NS Space spray 5.0 0.25 kg/1000m3
NS NS
USA NS Aerosol surface spray
3.0 to 5.0 NS NS NS
USA NS Automatic sequential spray
17.7 NS NS NS
USA NS Gas operated liquid dispenser
NS NS NS NS
USA NS Surface spray 5.0 0.30 kg/100 m2 NS NS
USA NS Aerosol surface spray
1.25 NS NS NS
USA Dust Dust crack and crevice
NS NS NS NS
Warehouses Costa Rica NS Space spray 1.25 to 5.0 NS NS NS
Costa Rica NS Surface spray 1.0 NA NS NA
Table 27. Summary of GAP for use on animals and their living quarters.
Application Crop Country Form.
Method kg ai/hl kg ai/ha No.
Barns Costa Rica NS Space spray 0.94 NA NS
Cattle Costa Rica NS Direct app. 0.1 NA NS
Dairies Costa Rica NS Space spray 0.94 NA NS
Goats Costa Rica NS Direct app. 0.1 NA NS
Hogs Costa Rica NS Direct app. 0.1 NA NS
Horses Costa Rica NS Direct app. 0.1 NA NS
Livestock quarters and dairies
USA NS Space spray 0.62 to 1.25 NA NS
Livestock and Poultry Costa Rica NS Direct app. 0.23 to 1.0 NA NS
Livestock and Poultry USA NS Direct app. 1.0 NS NS
Livestock Costa Rica NS Direct app. 0.18 NA NS
Poultry Costa Rica NS Space spray 0.94 NA NS
Poultry Costa Rica NS Direct app. 0.94 NA NS

piperonyl butoxide 637
Application Crop Country Form.
Method kg ai/hl kg ai/ha No.
Poultry Houses Costa Rica NS Space spray 0.94 NA NS
Sheep Costa Rica NS Direct app. 0.1 to 0.12 NA NS
RESIDUES RESULTING FROM SUPERVISED TRIALS
Pre-harvest uses
Crops were grown in the field in various locations in the USA, using typical agricultural practices. An insecticide containing piperonyl butoxide was applied ten to twelve times at the US maximum GAP rate of 0.56 kg/ha by broadcast ground spray at intervals of three to seven days. Raw agricultural commodities were collected on the day of the last spraying. In each trial, three plots were treated and the highest residue from the plots was selected for estimating maximum and median residue levels. The selected residues are double-underlined in the Tables.
Citrus fruits. Seven trials were conducted in 1992 in the USA (Hattermann, 1994a,b). Residues of PBO ranged from 0.90 to 3.1 mg/kg (Table 28). Table 28. Residues of piperonyl butoxide in citrus fruits after 10 applications of 0.56 kg ai/ha, 0-day PHI.
Crop Application rate Residues Location (Variety) Water (l/ha) kg ai/hl (mg/kg) AZ, Yuma Lemons (Frost Newseller) 1337 0.042 1.7, 1.1, 1.3
CA, Porterville Lemons (Lisbon) 2467 0.023 2.2, 2.6, 3.1
Oranges (Washington Navel) 2454 0.026 0.90, 0.54, 0.65
FL, Oviedo Oranges (Carrizo) 4072
0.014 0.84, 1.0, 0.77
TX, Raymondville Oranges (Everhard Navel) 2365 0.024 0.82, 0.98, 0.73
FL, Oviedo Grapefruit (Flame) 4072 0.014 1.4, 1.0, 1.2
TX, Raymondville Grapefruit (Rio Red) 2369 0.024 0.49, 0.27, 0.45
Berries and small fruits. In seven trials in 1992/93 in different locations in the USA, one on blackberries, two on blueberries, one on cranberries, one on grapes and two on strawberries (Hattermann, 1994c) three plots were treated identically. Residues in the fruit ranged from 2.8 to 9.6 mg/kg (Table 29).
Table 29. Residues of piperonyl butoxide in grapes and berries after 10 applications of 0.56 kg ai/ha, 0-day PHI.
Application rate Location Crop (variety) Water (l/ha) kg ai/hl
Residues (mg/kg)
OR, Salem Blackberry (Evergreen) 823 0.068 2.6, 2.7, 2.8 MI, Conklin Blueberry (Blue Crop) 1402 0.039 4.6, 4.9, 5.0 NC, Kenly Blueberry (Woodard Rabbiteye) 490 0.11 4.2, 5.0, 5.5

piperonyl butoxide 638
Application rate Location Crop (variety) Water (l/ha) kg ai/hl
Residues (mg/kg)
MA, East Wareham Cranberry (Early Black) 303 0.19 4.2, 3.8, 2.8 NY, Phelps Grape (Catawba) 935 0.060 7.8, 7.7, 9.6 FL, Oviedo Strawberry (Chandler) 281 0.20 3.0, 2.8, 2.4 OR , Weston Strawberry (Benton) 220 0.26 3.1, 1.3, 2.6
Brassica vegetables. In eight trials on broccoli and cabbages in 1992/93 (Hattermann, 1994h,i) residues varied from 0.08 to 6.4 mg/kg. Cabbage heads with wrapper leaves had the highest residues (Table 30).
Table 30. Residues of piperonyl butoxide in broccoli and cabbages after 10-12 applications at 0.56 kg ai/ha, 0-day PHI.
Application rate Location Crop (variety) No. Water (l/ha) kg ai/hl
Sample Residues, mg/kg
AK, Newport
Broccoli (Sultan F1 hybrid)
10 187 0.30 Heads 1.7, 1.6, 1.7
CA, Poplar Broccoli (Early green sprouting)
10 287 0.20 Heads 1.8, 2.3, 1.7
OR, Salem Broccoli (Pirate)
12 196 0.29 Heads 0.63, 0.65, 0.69
CA, Poplar Cabbage (Copenhagen market)
10 266 0.21 Heads with wrapper leaves 2.7, 0.79, 2.5
Heads without wrapper leaves
0.23, 0.10, 0.17
FL, Oviedo Cabbage (Tenacity)
11 280 0.20 Heads with wrapper leaves 3.4, 6.4, 4.5
Heads without wrapper leaves
0.46, 0.28, 0.29
NY, Waterloo
Cabbage (Market prize)
10 234 0.24 Heads with wrapper leaves 0.92, 1.0, 1.1
Heads without wrapper leaves
0.08, 0.09, <0.1
Fruiting vegetables, cucurbits. In eight trials on curcurbits in 1992/93 (Hattermann, 1996h) residues ranged from 0.07 to 0.83 mg/kg (Table 31).
Table 31. Residues of piperonyl butoxide in cantaloupes, cucumbers and squash after 10 applications of 0.56 kg ai/ha, 0-day PHI.
Crop Application rate Residues Location (variety) Water (l/ha) kg ai/hl (mg/kg)
AZ, Somerton Cantaloupe (Topmark crowset) 236 0.24 0.42, 0.83, 0.73 CA, Porterville Cantaloupe (Hales best jumbo) 289 0.19 0.60, 0.61, 0.39
MI, Mason Cucumber (Dasher II) 236 0.24 0.07, 0.06, <0.1 NC, Lucama1 Cucumber (General Lee) 219 0.26 0.68, 0.58, 0.49 FL, Oviedo Squash (Early summer
crookneck) 275 0.20 0.23, 0.26, 0.27
GA, Montezuma Squash (Ely yellow) 187 0. 30 0.05, 0.20, 0.11 NJ, Baptistown Squash (Black beauty) 238 0.24 0.17, 0.08, 0.10
TX, Uvalde Squash (Aztec) 154 0.37 0.19, 0.18, 0.25
111 applications
Other fruiting vegetables. In six trials on peppers and tomatoes in 1992/1993 (Hattermann, 1995k), residues ranged from 0.25 to 1.4 mg/kg (Table 32).
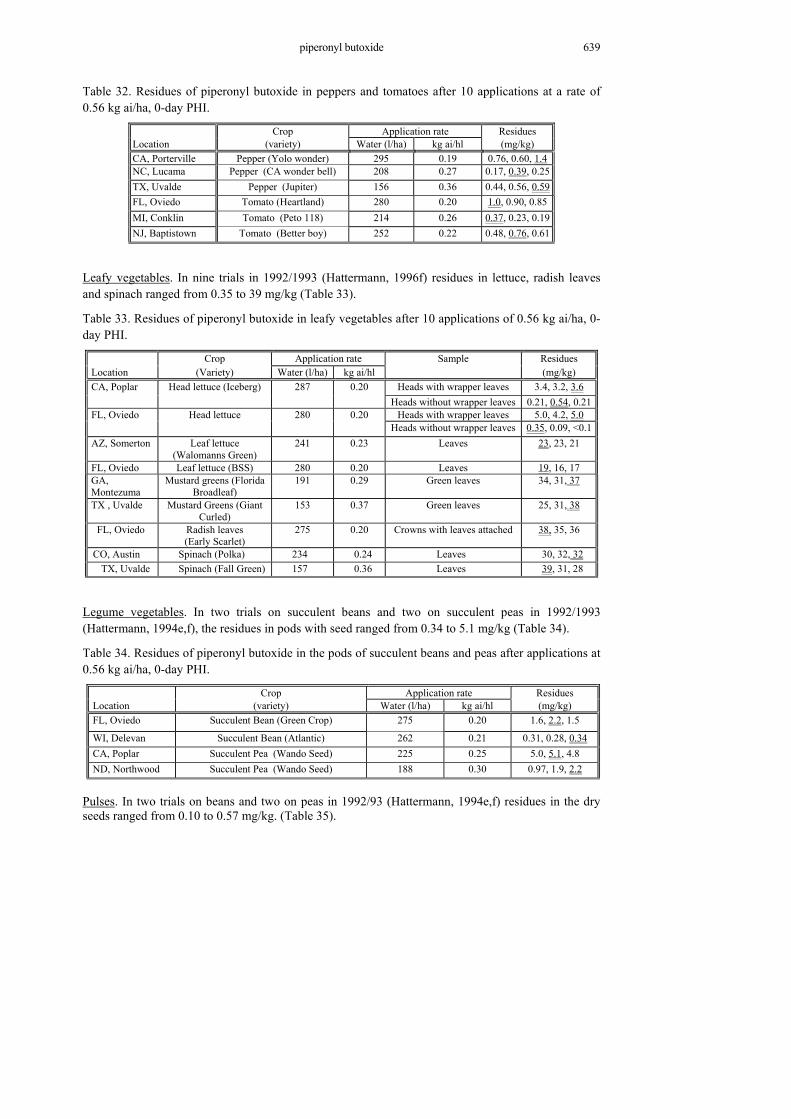
piperonyl butoxide 639
Table 32. Residues of piperonyl butoxide in peppers and tomatoes after 10 applications at a rate of 0.56 kg ai/ha, 0-day PHI.
Crop Application rate Residues Location (variety) Water (l/ha) kg ai/hl (mg/kg) CA, Porterville Pepper (Yolo wonder) 295 0.19 0.76, 0.60, 1.4NC, Lucama Pepper (CA wonder bell) 208 0.27 0.17, 0.39, 0.25TX, Uvalde Pepper (Jupiter) 156 0.36 0.44, 0.56, 0.59FL, Oviedo Tomato (Heartland) 280 0.20 1.0, 0.90, 0.85MI, Conklin Tomato (Peto 118) 214 0.26 0.37, 0.23, 0.19NJ, Baptistown Tomato (Better boy) 252 0.22 0.48, 0.76, 0.61
Leafy vegetables. In nine trials in 1992/1993 (Hattermann, 1996f) residues in lettuce, radish leaves and spinach ranged from 0.35 to 39 mg/kg (Table 33).
Table 33. Residues of piperonyl butoxide in leafy vegetables after 10 applications of 0.56 kg ai/ha, 0-day PHI.
Crop Application rate Sample Residues Location (Variety) Water (l/ha) kg ai/hl (mg/kg) CA, Poplar Head lettuce (Iceberg) 287 0.20 Heads with wrapper leaves 3.4, 3.2, 3.6 Heads without wrapper leaves 0.21, 0.54, 0.21 FL, Oviedo Head lettuce 280 0.20 Heads with wrapper leaves 5.0, 4.2, 5.0 Heads without wrapper leaves 0.35, 0.09, <0.1 AZ, Somerton Leaf lettuce
(Walomanns Green) 241 0.23 Leaves 23, 23, 21
FL, Oviedo Leaf lettuce (BSS) 280 0.20 Leaves 19, 16, 17 GA, Montezuma
Mustard greens (Florida Broadleaf)
191 0.29 Green leaves 34, 31, 37
TX , Uvalde
Mustard Greens (Giant Curled)
153 0.37 Green leaves 25, 31, 38
FL, Oviedo Radish leaves (Early Scarlet)
275 0.20 Crowns with leaves attached 38, 35, 36
CO, Austin Spinach (Polka) 234 0.24 Leaves 30, 32, 32 TX, Uvalde Spinach (Fall Green) 157 0.36 Leaves 39, 31, 28
Legume vegetables. In two trials on succulent beans and two on succulent peas in 1992/1993 (Hattermann, 1994e,f), the residues in pods with seed ranged from 0.34 to 5.1 mg/kg (Table 34).
Table 34. Residues of piperonyl butoxide in the pods of succulent beans and peas after applications at 0.56 kg ai/ha, 0-day PHI.
Crop Application rate Residues Location (variety) Water (l/ha) kg ai/hl (mg/kg) FL, Oviedo Succulent Bean (Green Crop) 275 0.20 1.6, 2.2, 1.5
WI, Delevan Succulent Bean (Atlantic) 262 0.21 0.31, 0.28, 0.34 CA, Poplar Succulent Pea (Wando Seed) 225 0.25 5.0, 5.1, 4.8 ND, Northwood Succulent Pea (Wando Seed) 188 0.30 0.97, 1.9, 2.2
Pulses. In two trials on beans and two on peas in 1992/93 (Hattermann, 1994e,f) residues in the dry seeds ranged from 0.10 to 0.57 mg/kg. (Table 35).
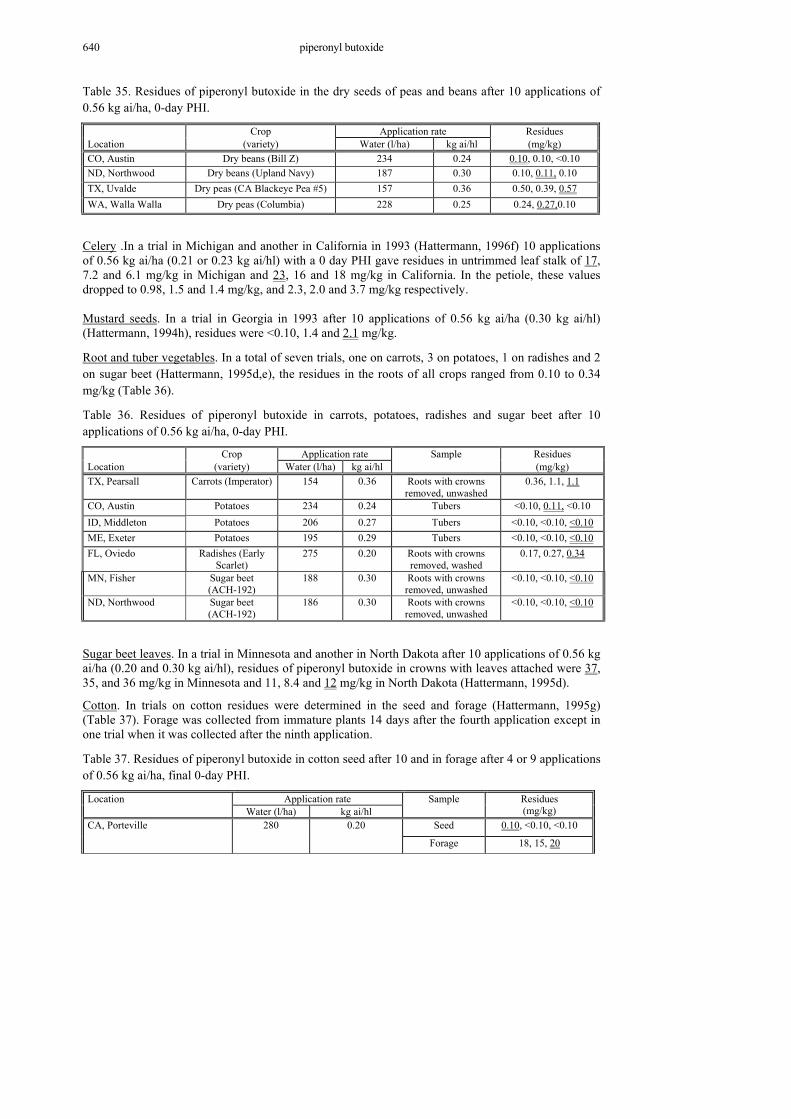
piperonyl butoxide 640
Table 35. Residues of piperonyl butoxide in the dry seeds of peas and beans after 10 applications of 0.56 kg ai/ha, 0-day PHI.
Crop Application rate Residues Location (variety) Water (l/ha) kg ai/hl (mg/kg) CO, Austin Dry beans (Bill Z) 234 0.24 0.10, 0.10, <0.10 ND, Northwood Dry beans (Upland Navy) 187 0.30 0.10, 0.11, 0.10 TX, Uvalde Dry peas (CA Blackeye Pea #5) 157 0.36 0.50, 0.39, 0.57 WA, Walla Walla Dry peas (Columbia) 228 0.25 0.24, 0.27,0.10
Celery .In a trial in Michigan and another in California in 1993 (Hattermann, 1996f) 10 applications of 0.56 kg ai/ha (0.21 or 0.23 kg ai/hl) with a 0 day PHI gave residues in untrimmed leaf stalk of 17, 7.2 and 6.1 mg/kg in Michigan and 23, 16 and 18 mg/kg in California. In the petiole, these values dropped to 0.98, 1.5 and 1.4 mg/kg, and 2.3, 2.0 and 3.7 mg/kg respectively. Mustard seeds. In a trial in Georgia in 1993 after 10 applications of 0.56 kg ai/ha (0.30 kg ai/hl) (Hattermann, 1994h), residues were <0.10, 1.4 and 2.1 mg/kg.
Root and tuber vegetables. In a total of seven trials, one on carrots, 3 on potatoes, 1 on radishes and 2 on sugar beet (Hattermann, 1995d,e), the residues in the roots of all crops ranged from 0.10 to 0.34 mg/kg (Table 36).
Table 36. Residues of piperonyl butoxide in carrots, potatoes, radishes and sugar beet after 10 applications of 0.56 kg ai/ha, 0-day PHI.
Crop Application rate Sample Residues Location (variety) Water (l/ha) kg ai/hl (mg/kg) TX, Pearsall Carrots (Imperator) 154 0.36 Roots with crowns
removed, unwashed 0.36, 1.1, 1.1
CO, Austin Potatoes 234 0.24 Tubers <0.10, 0.11, <0.10 ID, Middleton Potatoes 206 0.27 Tubers <0.10, <0.10, <0.10 ME, Exeter Potatoes 195 0.29 Tubers <0.10, <0.10, <0.10 FL, Oviedo Radishes (Early
Scarlet) 275 0.20 Roots with crowns
removed, washed 0.17, 0.27, 0.34
MN, Fisher Sugar beet (ACH-192)
188 0.30 Roots with crowns removed, unwashed
<0.10, <0.10, <0.10
ND, Northwood Sugar beet (ACH-192)
186 0.30 Roots with crowns removed, unwashed
<0.10, <0.10, <0.10
Sugar beet leaves. In a trial in Minnesota and another in North Dakota after 10 applications of 0.56 kg ai/ha (0.20 and 0.30 kg ai/hl), residues of piperonyl butoxide in crowns with leaves attached were 37, 35, and 36 mg/kg in Minnesota and 11, 8.4 and 12 mg/kg in North Dakota (Hattermann, 1995d).
Cotton. In trials on cotton residues were determined in the seed and forage (Hattermann, 1995g) (Table 37). Forage was collected from immature plants 14 days after the fourth application except in one trial when it was collected after the ninth application.
Table 37. Residues of piperonyl butoxide in cotton seed after 10 and in forage after 4 or 9 applications of 0.56 kg ai/ha, final 0-day PHI.
Application rate Location Water (l/ha) kg ai/hl
Sample Residues (mg/kg)
Seed 0.10, <0.10, <0.10 CA, Porteville 280 0.20
Forage 18, 15, 20
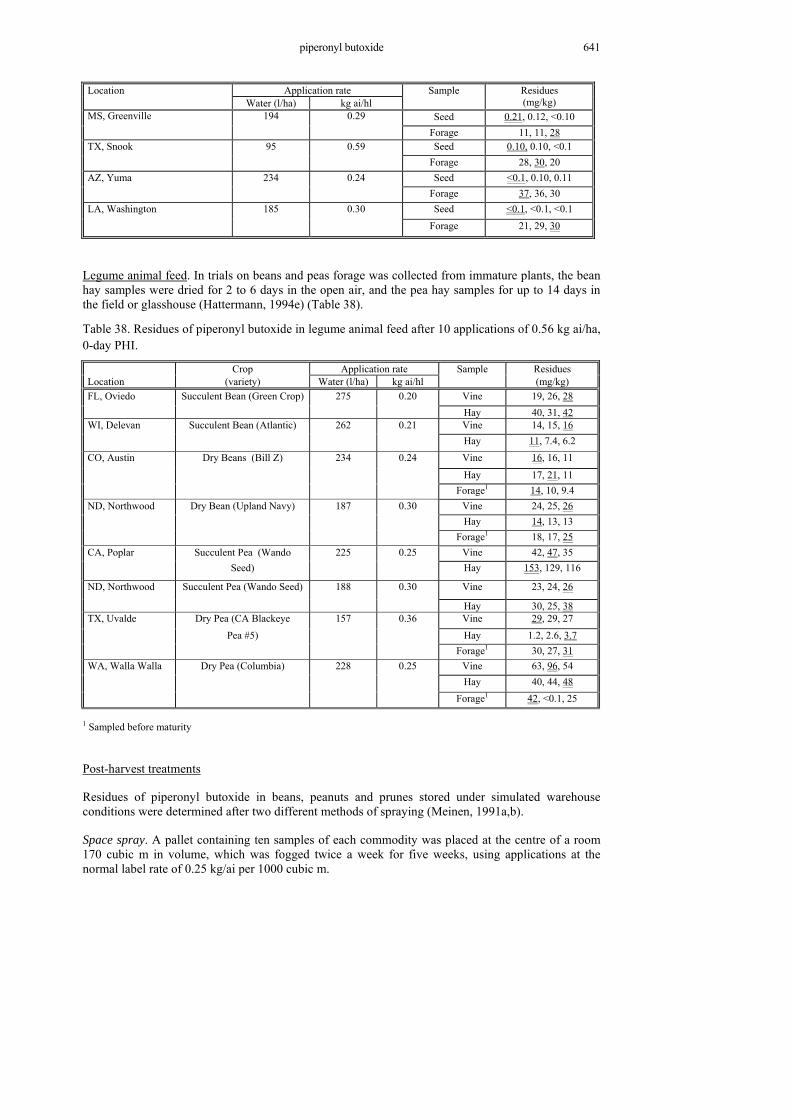
piperonyl butoxide 641
Application rate Location Water (l/ha) kg ai/hl
Sample Residues (mg/kg)
Seed 0.21, 0.12, <0.10 MS, Greenville 194 0.29 Forage 11, 11, 28 Seed 0.10, 0.10, <0.1 TX, Snook 95 0.59
Forage 28, 30, 20 Seed <0.1, 0.10, 0.11 AZ, Yuma 234 0.24
Forage 37, 36, 30 Seed <0.1, <0.1, <0.1 LA, Washington 185 0.30
Forage 21, 29, 30
Legume animal feed. In trials on beans and peas forage was collected from immature plants, the bean hay samples were dried for 2 to 6 days in the open air, and the pea hay samples for up to 14 days in the field or glasshouse (Hattermann, 1994e) (Table 38).
Table 38. Residues of piperonyl butoxide in legume animal feed after 10 applications of 0.56 kg ai/ha, 0-day PHI.
Crop Application rate Sample Residues Location (variety) Water (l/ha) kg ai/hl (mg/kg) FL, Oviedo Succulent Bean (Green Crop) 275 0.20 Vine 19, 26, 28 Hay 40, 31, 42 WI, Delevan Succulent Bean (Atlantic) 262 0.21 Vine 14, 15, 16 Hay 11, 7.4, 6.2 CO, Austin Dry Beans (Bill Z) 234 0.24 Vine 16, 16, 11
Hay 17, 21, 11 Forage1 14, 10, 9.4 ND, Northwood Dry Bean (Upland Navy) 187 0.30 Vine 24, 25, 26 Hay 14, 13, 13 Forage1 18, 17, 25 CA, Poplar Succulent Pea (Wando 225 0.25 Vine 42, 47, 35 Seed) Hay 153, 129, 116
ND, Northwood Succulent Pea (Wando Seed) 188 0.30 Vine 23, 24, 26
Hay 30, 25, 38 TX, Uvalde Dry Pea (CA Blackeye 157 0.36 Vine 29, 29, 27 Pea #5) Hay 1.2, 2.6, 3.7 Forage1 30, 27, 31 WA, Walla Walla Dry Pea (Columbia) 228 0.25 Vine 63, 96, 54 Hay 40, 44, 48 Forage1 42, <0.1, 25
1 Sampled before maturity
Post-harvest treatments
Residues of piperonyl butoxide in beans, peanuts and prunes stored under simulated warehouse conditions were determined after two different methods of spraying (Meinen, 1991a,b).
Space spray. A pallet containing ten samples of each commodity was placed at the centre of a room 170 cubic m in volume, which was fogged twice a week for five weeks, using applications at the normal label rate of 0.25 kg/ai per 1000 cubic m.

piperonyl butoxide 642
Contact spray. A similar pallet was placed at the centre of a 3.05 m x 4.0 m room which was sprayed around its edges and around the pallet twice a week for five weeks at the normal label rate of 0.30 kg ai/100 square m.
Single samples of 0.9 kg of navy beans and 0.9 kg of Spanish peanuts in cotton cloth bags and 0.34 kg of dried prunes in a commercial foil bag were collected for analysis after each treatment. Each value is the result of a single analysis unless otherwise indicated (Table 39).
Table 39. PBO residues, mg/kg, in food commodities after space (SS) and contact (CS) sprayings under simulated warehouse conditions.
Commodity No of applications
1 2 3 4 5 6 7 8 9 10
Beans (SS) <0.05 TR <0.05 0.10 TR 0.13 0.16 0.13 TR 0.17
(CS) <0.05 <0.05 <0.05 <0.05 <0.05 <0.05 <0.05 <0.05 <0.05 <0.05
Prunes (SS) 0.051 <0.05 <0.05 0.111 TR <0.051 <0.05 TR TR TR
(CS) TR1 <0.05 TR <0.05 <0.05 <0.05 <0.05 <0.05 TR TR
Peanuts (SS) TR TR TR 0.20 0.24 0.29 0.36 0.28 0.54 0.54
(CS) <0.05 0.151 <0.05 TR <0.05 TR1 TR1 TR TR 0.12
TR: Trace, >0.05 mg/kg, <0.10 mg/kg 1Mean of duplicate analyses.
In trials in Germany, 1993-94, a 200 m3 room was space-sprayed eight times with pyrethrum/piperonyl butoxide at 21.3 g PBO/1000 m3 at 14-days intervals, or twice at 128 g PBO/1000m3. Samples were taken from immediately after the last treatment until 90 days later (Nedvidek, 1994a,b). GAP for space spraying in Germany is 0.375 to 132 g ai/1000 m3. The results are given in Table 40.
Table 40. Residues of piperonyl butoxide after space-spraying treatments in Germany.
Time (days) Bulk wheat Wheat flour in paper sacks Cacao beans in jute sacks Raisins in polythene/cardboard
8 x 21.3 g PBO/1000 m3
0 2.5 - 0.21 -
14 1.2 - 0.25 -
30 0.71 - 0.07 -
60 1.2 - 0.16 -
90 1.4 - 0.08 -
2 x 128 g PBO/1000 m3
0 2.2 0.16 0.52 <0.01
14 2.0 0.12 0.53 <0.01
30 1.3 0.15 0.75 <0.01
60 1.5 0.46 0.58 <0.01
90 1.7 0.44 0.65 <0.01
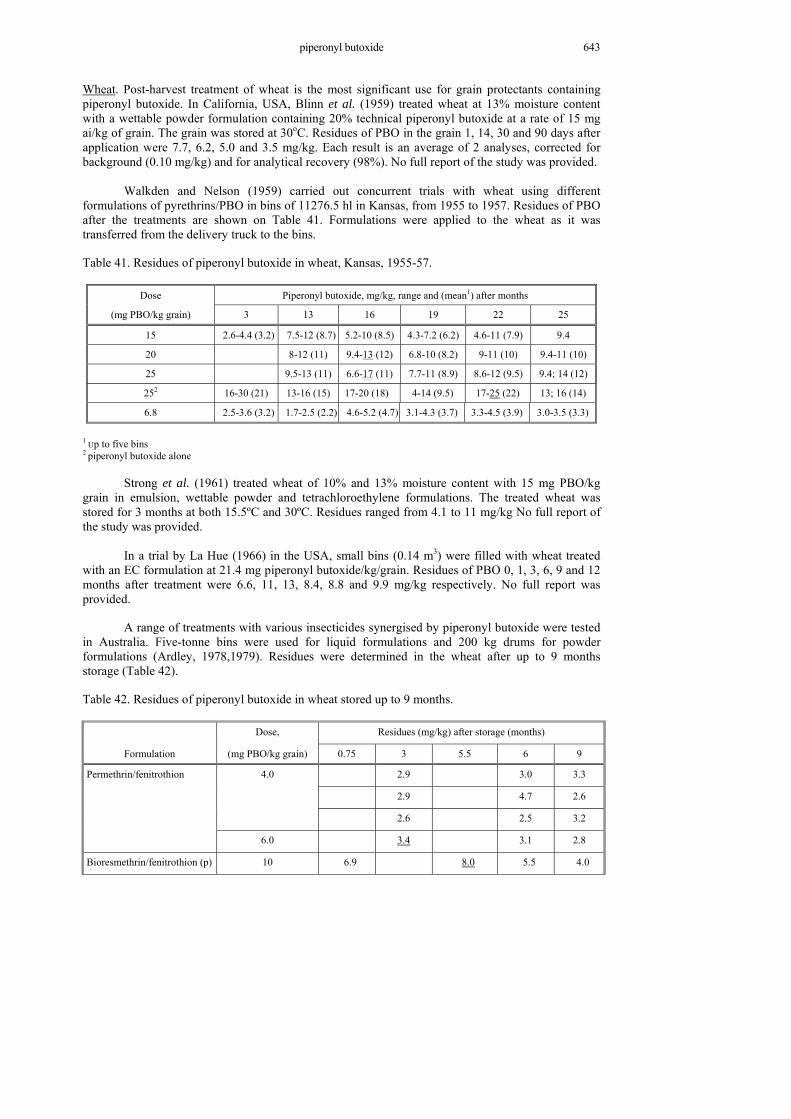
piperonyl butoxide 643
Wheat. Post-harvest treatment of wheat is the most significant use for grain protectants containing piperonyl butoxide. In California, USA, Blinn et al. (1959) treated wheat at 13% moisture content with a wettable powder formulation containing 20% technical piperonyl butoxide at a rate of 15 mg ai/kg of grain. The grain was stored at 30oC. Residues of PBO in the grain 1, 14, 30 and 90 days after application were 7.7, 6.2, 5.0 and 3.5 mg/kg. Each result is an average of 2 analyses, corrected for background (0.10 mg/kg) and for analytical recovery (98%). No full report of the study was provided.
Walkden and Nelson (1959) carried out concurrent trials with wheat using different formulations of pyrethrins/PBO in bins of 11276.5 hl in Kansas, from 1955 to 1957. Residues of PBO after the treatments are shown on Table 41. Formulations were applied to the wheat as it was transferred from the delivery truck to the bins.
Table 41. Residues of piperonyl butoxide in wheat, Kansas, 1955-57.
Dose Piperonyl butoxide, mg/kg, range and (mean1) after months
(mg PBO/kg grain) 3 13 16 19 22 25
15 2.6-4.4 (3.2) 7.5-12 (8.7) 5.2-10 (8.5) 4.3-7.2 (6.2) 4.6-11 (7.9) 9.4
20 8-12 (11) 9.4-13 (12) 6.8-10 (8.2) 9-11 (10) 9.4-11 (10)
25 9.5-13 (11) 6.6-17 (11) 7.7-11 (8.9) 8.6-12 (9.5) 9.4; 14 (12)
252 16-30 (21) 13-16 (15) 17-20 (18) 4-14 (9.5) 17-25 (22) 13; 16 (14)
6.8 2.5-3.6 (3.2) 1.7-2.5 (2.2) 4.6-5.2 (4.7) 3.1-4.3 (3.7) 3.3-4.5 (3.9) 3.0-3.5 (3.3)
1 Up to five bins 2 piperonyl butoxide alone
Strong et al. (1961) treated wheat of 10% and 13% moisture content with 15 mg PBO/kg grain in emulsion, wettable powder and tetrachloroethylene formulations. The treated wheat was stored for 3 months at both 15.5ºC and 30ºC. Residues ranged from 4.1 to 11 mg/kg No full report of the study was provided.
In a trial by La Hue (1966) in the USA, small bins (0.14 m3) were filled with wheat treated with an EC formulation at 21.4 mg piperonyl butoxide/kg/grain. Residues of PBO 0, 1, 3, 6, 9 and 12 months after treatment were 6.6, 11, 13, 8.4, 8.8 and 9.9 mg/kg respectively. No full report was provided.
A range of treatments with various insecticides synergised by piperonyl butoxide were tested in Australia. Five-tonne bins were used for liquid formulations and 200 kg drums for powder formulations (Ardley, 1978,1979). Residues were determined in the wheat after up to 9 months storage (Table 42).
Table 42. Residues of piperonyl butoxide in wheat stored up to 9 months.
Dose, Residues (mg/kg) after storage (months)
Formulation (mg PBO/kg grain) 0.75 3 5.5 6 9 Permethrin/fenitrothion 4.0 2.9 3.0 3.3
2.9 4.7 2.6
2.6 2.5 3.2
6.0 3.4 3.1 2.8
Bioresmethrin/fenitrothion (p) 10 6.9 8.0 5.5 4.0

piperonyl butoxide 644
Dose, Residues (mg/kg) after storage (months)
Formulation (mg PBO/kg grain) 0.75 3 5.5 6 9 Bioresmethrin/fenitrothion 10 7.1 5.0 4.5 4.0
4 3.6 3.4 3.5 3.5
2.6 2.8 2.2
Pyrethrins/fenitrothion (p) 20 9.3 14 16 12
Pyrethrins/fenitrothion 20 12 13 14 12
10 7.2 5.8 6.5 4.0
Permethrin 4 3.8 3.3 2.3 1.5
Deltamethrin/fenitrothion 10 6.2 5.8 2.5 2.0
Deltamethrin 10 5.8 9.1 5.6 5.0
Phenothrin/fenitrothion 10 4.7 3.0 7.5 5.5
Fenvalerate/fenitrothion 10 6.6 5.4 7.5 7.0
Fenvalerate 10 6.2 7.3 8.0 5.0
2 2.4 1.4 1.3 0.8
4 3.7 2.1 3.0 1.5
(p): powder formulations. The remainder are liquid.
Halls (1981) reported trials in which piperonyl butoxide was applied at 10 mg ai/kg in various formulations to wheat in Australia. Five tonnes of wheat were treated in a steel silo or a 200 kg metal drum. Samples were taken from the surface and at depths of 1-2 m in the silos and from the top, middle and bottom of the drums. Samples from the different levels were mixed and analysed during 8 months (Table 43). Ardley et al. (1982) carried out trials in Australia in 1980 on wheat stored in five-tonne bins and 200 kg drums, applying piperonyl butoxide in various EC formulations at 10 mg ai/kg grain; the results of these are also shown in Table 43.
Table 43. Piperonyl butoxide residues in wheat treated in Australia at 10 mg PBO/kg grain.
Residues (mg/kg) after storage (months) Formulation
0 1 2 3 6 8 9
Halls (1981)
permethrin/fenitrothion 3.9 4.5 4.4 5.0 5.7 3.8
7.9 4.6 4.1 5.5 6.7 4.0
permethrin 4.2 3.4 3.0 4.0 4.0 3.5
5.6 7.3 6.9 6.6 6.4 5.9
Ardley et al. (1982)
bioresmethrin/fenitrothion 7.3 7.3 5.0 4.7 2.9 3.7 5.2
phenothrin/fenitrothion 4.5 4.5 5.3 4.5 5.3 4.6 3.5
fenvalerate/fenitrothion 4.5 4.2 3.4 4.8 5.0 4.3 3.8
7.0 4.2 3.6 4.7 6.7 3.3 3.6

piperonyl butoxide 645
Residues (mg/kg) after storage (months) Formulation
0 1 2 3 6 8 9
fenvalerate 3.9 4.1 4.5 4.5 4.1 3.5 4.3
5.9 7.3 7.8 6.1 4.7 6.2 7.8
deltamethrin/fenitrothion 3.9 4.5 3.3 4.3 5.2 3.1 3.3
3.1 3.0 4.5 3.9 4.8 2.9 4.1
deltamethrin susp conc 6.5 5.9 7.5 6.9 5.4 6.8 6.4
deltamethrin oil 6.5 7.8 7.2 8.1 5.5 6.9 5.2
permethrin/fenitrothion 3.9 4.5 4.4 5.0 5.7 3.8 3.0
7.9 4.6 4.1 5.5 6.2 4.0 4.0
permethrin 4.2 3.4 3.0 4.0 4.0 3.5 2.7
5.6 7.3 6.9 6.6 6.4 5.9 62
300H78 7.3 8.2 6.6 7.9 5.2 6.9 6.7
5.3 5.9 4.2 6.4 5.1 4.2 10
7.9 6.2 6.1 6.9 4.6 6.6 5.8
different sampling intervals 0 0.5 3.5 5.5 6.5 - -
fenvalerate/fenitrothion 8.3 8.0 9.0 7.9 10
8.6 7.2 7.7 6.6 6.8
fenvalerate 7.7 6.1 9.2 8.0 -
7.0 4.5 5.2 5.5 -
6.5 6.0 5.0 5.5 11
fenvalerate/fenitrothion 7.5 7.4 8.0 - 5.7
8.8 7.6 9.4 - 8.2
fenvalerate 7.4 5.8 7.8 6.0 6.4
7.2 6.1 8.3 6.2 10
17 30 6.5 9.3 14
A long-term study was also conducted by Ardley et al. (1982) using different formulations of
piperonyl butoxide at 10 mg PBO/kg grain (Table 44).
Table 44. Residues of piperonyl butoxide from trials conducted in Australia at 10 mg ai/kg grain.
Residues of piperonyl butoxide (mg/kg) after storage (months)
Formulation 10 11 12 13 16 18 19 25 26 27 28 31
deltamethrin/fenithrothion 7.3 6.5 4.7 7.0 5.5 5.3 5.0 - - - -
deltamethrin oil 5.6 6.7 5.3 6.6 5.0 5.3 5.3 - - - -
4.5 3.6 1.9 3.5 4.7 2.4 2.5 2.8 2.8 3.1 5.9 4.5
deltamethrin flowable 5.9 3.6 4.5 8.1 4.0 5.3 4.8 - - - - -
Nicholls et al. (1984) evaluated further grain protectant combinations in EC formulations in
Australia in 1978/80, storing the wheat in five-tonne bins and 200 kg drums. Residues were determined immediately after application and for up to 9 months afterwards (Table 45).

piperonyl butoxide 646
Table 45. Piperonyl butoxide residues in wheat stored for 9 months in Australia.
Piperonyl butoxide residues (mg/kg) after storage for (months) Formulation Dose, (mg/kg
PBO grain) 0 1 2 3 4 6 7 9
phenothrin/fenvalerate/fenitrothion 5 - 2.2 2.2 3.1 3.3 3.6 4.2 4.5
10 7.3 6.3 6.6 6.5 6.7 7.5 5.6 9.7
phenothrin/fenitrothion 10 5.4 6.3 6.4 - 6.3 8.6 6.0 6.5
6.3 5.8 6.3 6.2 7.7 5.3 6.9 -
5.6 5.2 5.3 7.9 5.6 9.2 8.5 8.7
deltamethrin/permethrin 3 1.4 2.3 1.5 - 1.8 1.2 1.8 1.6
deltamethrin/fenitrothion1 10 1.9 7.9 8.7 8.6 8.4 8.9 5.1 7.8
deltamethrin 10 3.5 9.3 6.5 5.1 8.1 6.2 7.3 9.3
12 4.6 6.1 6.6 9.5 8.9 5.6 4.5
7.6 8.4 8.5 8.7 7.4 7.3 5.2 10
9.7 12 13 16 11 9.7 12 8.7
bioresmethrin/fenitrothion 10 5.8 3.5 4.9 5.0 5.7 6.4 4.4 7.3
fenvalerate/fenitrothion 10 4.7 7.9 8.1 7.7 8.4 7.0 5.8 8.3
cypermethrin 10 7.9 10 9.5 14 11 5.5 8.7 6.4
4.5 8.6 8.2 8.2 8.1 7.8 10 6.3
1 powder formulation
A series of trials were conducted in Australia from 1988 to 1998 at various sites using different formulations of piperonyl butoxide (Table 46). Except for Crampton et al. (1990), no full reports were provided.
Table 46. Residues of piperonyl butoxide in wheat from trials in Australia, 1988-98.
Residues of piperonyl butoxide (mg/kg)* after (months) Site
Report Formulation PBO dose (mg ai/kg
grain) 0 1.5 3 4.5 6 9
Bangalla, NSW Crampton et al., 1990
bioresmethrin/ chlorpyrifos-methyl 8.0 11 9.8 10 13 7.5
bioresmethrin /fenitrothion 8.0 9.9 9.7 10 16 13
Wail, Vic 8.0 3.7 5.4 5.0 5.4
bioresmethrin/ chlorpyrifos-methyl
4.6 1.3 1.6 1.7
Malu, Qld Bengston, 1991a
methacrifos/ bioresmethrin 7.39 4.8 4.4 4.4 4.1 3.8 3.2
Bengston, 1991b
methacrifos/ permethrin 9.5 7.5 5.7 6.2 5.5 5.3 4.5
Greenethorpe, NSW
Bengston, 1991a
methacrifos/ bioresmethrin 7.8 5.1 4.9 5.3 4.8 5.1
Bengston, 1991b
methacrifos/ permethrin 7.5 7.3 3.7 6.3 5.8 5.7

piperonyl butoxide 647
Residues of piperonyl butoxide (mg/kg)* after (months) Site
Report Formulation PBO dose (mg ai/kg
grain) 0 1.5 3 4.5 6 9
Arkona, Vic Bengston, 1991a
methacrifos/ bioresmethrin 8.2 3.6 3.8 3.4 3.3 4.4
Vectis, Vic Bengston, 1991b
methacrifos/ permethrin 10.7 7.6 7.9 7.3 6.2 5.6
North Freemantle, WA
Bengston, 1991a
methacrifos/ bioresmethrin 5.8 5.3 4.8 3.9 3.8 4.3 3.4
Bengston, 1991b
methacrifos/ permethrin 8.3 7.4 7.2 3.2 5.6 5.5 2.8
Bengston, 1993c
chlorpyrifos-methyl/deltamethrin 8.0 3.0 3.8 4.3 3.7 4.8
Thevenard Bengston, 1991b
methacrifos/ permethrin 7.4 5.5 4.1 3.4 2.1 2.0 1.8
Cecil Plains, Qld Crampton et al., 1990
bioresmethrin/ chlorpyrifos-methyl 8.0 7.8 5.6 7.6 5.6 7.3
Bengston, 1993c
chlorpyrifos-methyl/deltamethrin 6.01 5.6 3.4 3.3 2.7 2.9
Bengston, 1993d
chlorpyrifos-methyl/deltamethrin** 7.8 6.4 8.9 7.4 8.2 8.3
Premer, NSW Bengston, 1993c
chlorpyrifos-methyl/deltamethrin 6.1 4.0 4.0 3.4 3.8 4.2#
Bengston, 1993d
chlorpyrifos-methyl/deltamethrin** 3.24 1.9 1.8 1.7 <1.1 2.4
Ardrossan, SA Bengston, 1993c
chlorpyrifos-methyl/deltamethrin 7.04 2.2 5.8 2.6 3.8 2.8
Grenfell, NSW Bengston, 1994b
chlorpyrifos-methyl/deltamethrin** 6.5 2.9 4.3 2.2
Nyrang Creek, NSW
Bengston, 1996b deltamethrin 8.0 5.2
Bribbaree, NSW 4.0 1.5
The Rock, NSW Bengston, 1997
chlorpyrifos-methyl/deltamethrin** 4.5 2.1 1.5
Anon., 1999
bifenthrin/ chlorpyrifos methyl 8.3 5.6 5.4 6.1 3.9 5.0 5.8
Daglish et al., 1999 7.30 5.4 6.4 3.7 5.8 3.3
Millmerran Qld Anon., 1999 8.0 11 6.4 6.7 6.8 6.1
Daglish et al., 1999 6.98 6.2 4.9 5.1 4.2 4.0 7.5
Sutherland Vic Anon., 1999 8.0 1.8 2.4 2.4 2.3
Wychitella Vic Daglish et al., 1999 8.0 5.1 5.5 3.5 2.2 4.6
Wirrabarra SA Daglish et al., 1999 8.0 5.2 4.4 4.9 4.3
*average of 2 or 3 laboratory results **7 months sample

piperonyl butoxide 648
Molinari (1987) in Italy applied 2 different deltamethrin/piperonyl butoxide products at 3 dosage levels to wheat stored either in vertical silos or warehouses for 3-12 months (Table 47).
Table 47. Trials on wheat in Italy, 1985/86.
Dose Residue (mg/kg) after storage (months)
Location (mg ai/kg grain) 0 1.4 3 6 12
2.5 0.58 1.0 0.8 2.0 San Giorgio di Piano1,2
5 0.53 3.3 4.9 8.7
10 2.0 9.8 12 13
Montepascali1,2 2.5 0.97 0.84 0.65 0.86 1.4
5 0.89 2.3 0.21 0.98 3.0
10 1.0 3.7 0.20 2.1 3.9
Ponte a Rigo1,3 2.5 1.0 1.2 0.89 1.8 0.98
5 2.3 2.1 2.1 2.4 2.1
10 0.14 2.7 4.6 5.2 3.7
La Spezia1,2 2.5 1.2 0.12 0.22 <0.10
5 2.5 0.80 0.65 0.99
10 4.2 1.6 1.7 2.6
Lendinara 1,3 2.5 0.34 0.24 0.18
5 1.0 0.70 0.88
10 3.4 2.1 3.9
Lendinaria 3,4 2.5 1.3 1.7 2.7
5 1.6 1.2 1.5
10 2.8 4.5 2.7
1 vertical silo 2 hard wheat 3 soft wheat 4 warehouse
Barley. Post-harvest trials were conducted on barley in Australia at various sites from 1992 to 1996 using different PBO formulations (Table 48). Final, but not full, reports were provided.

piperonyl butoxide 649
Table 48. Residues of piperonyl butoxide in barley from trials in Australia 1992-96.
Residues of piperonyl butoxide (mg/kg)1 after (months) Site
(trial size) Report Formulation
PBO dose
(mg ai/kg grain) 0 1.5 3 4.5 6 6.5
Ardrossan, WA (pilot scale)
Bengston, 1993a
Methacrifos/ bioresmethrin 7.0 4.6 6.5 3.8 4.8 3.7
(concrete silos) Bengston,
1993b fenitrothion/
bioresmethrin 3.52
1.8 2.0 2.6
(pilot scale) Bengston, 1994a
Methacrifos/ bioresmethrin 7.05 2.9 6.0 4.2 3.8 3.6
Port Adelaide, SA (pilot scale)
6.76 3.9 6.4 6.7 3.3
Jeparit, Vic (pilot scale)
6.78 6.6 6.4 5.6 6.6 5.4 4.4
Murray Bridge SA (field)
Bengston, 1996c deltamethrin 6.33 7.2 4.3 4.3 4.6 4.2
Brim, Victoria Bengston, 1997c 8 0.9 0.8 - <1.0
1average of 2 or 3 laboratory results Maize. In the USA Quinlan and Miller (1958) investigated residues of PBO after surface-layer treatment with pyrethrins synergised with piperonyl butoxide, applied half-weekly, weekly, and bi-weekly to maize in 1177 hl metal silos 5.5 m diameter. One litre of spray was applied to the surface of the grain and an additional half-litre was applied to the space above from the outside (Table 49).
Table 49. Residues of piperonyl butoxide in maize after surface application.
Residue, as % of total applied g PBO ai/100 m2 (frequency of application)
3 months after treatment 6 months after treatment
49.7 (half-weekly/weekly/bi-weekly) 26/27/27 12/11/12
99.3 (half-weekly/weekly/bi-weekly) 25/33/38 12/11/13
149 (half-weekly/weekly/bi-weekly) 41/30/31 11/13/12
Walkden and Nelson (1959) carried out trials using different pyrethrins/PBO formulations in
bins of 11276.5 hl in Kansas, from 1952 to 1957. The formulations were applied to the maize as it was transferred from the delivery truck to the bins.
Residues of PBO after the treatments are shown on Tables 50-52. There is no approved use for dust formulation of PBO in the USA.
Table 50. Residues of piperonyl butoxide in maize (1952-1956).
Formulation Piperonyl butoxide residue (mg/kg) after months
(mg PBO/kg grain) 2 4 6 50
6.0 3.0
6.0 3.0
dust on talc
(14.2)
8.0 7.0

piperonyl butoxide 650
Formulation Piperonyl butoxide residue (mg/kg) after months
(mg PBO/kg grain) 2 4 6 50
dust on corncob flour
(14.2)
2.5 2.0 10
(19.7) 12 2.0
8.0 1.0
7.0 2.0
Solution spray
(10.4)
1.0 -
4.0 3.0
21 1.5 3.3
Emulsion spray (12.3)
3.0 - 3.0
Table 51. Residues of piperonyl butoxide in maize. (1954-1957).
Piperonyl butoxide residue (mg/kg) found after (months) Formulation
(mg PBO/kg grain) 1 3 6 9 12 16 19 22 26 28 31
Spray 3.0 5.5 5.0
(11.6) 7.0
8.0
(17.4) 3.0
(23.2) 11
4.0
8.0 8.0 8.0
dust on 7.0
corncob flour 3.0 2.0 9.0
(14.7) 4.0
3.0 8.0
3.0 2.0 8.0
3.0
8.0 15 (29.4)
7.0
8.0 2.0 25 10 16 17 12 6.3 5.0 5.6 17
6.0
4.0 2.0 9.0
6.0 2.0 13 8.9
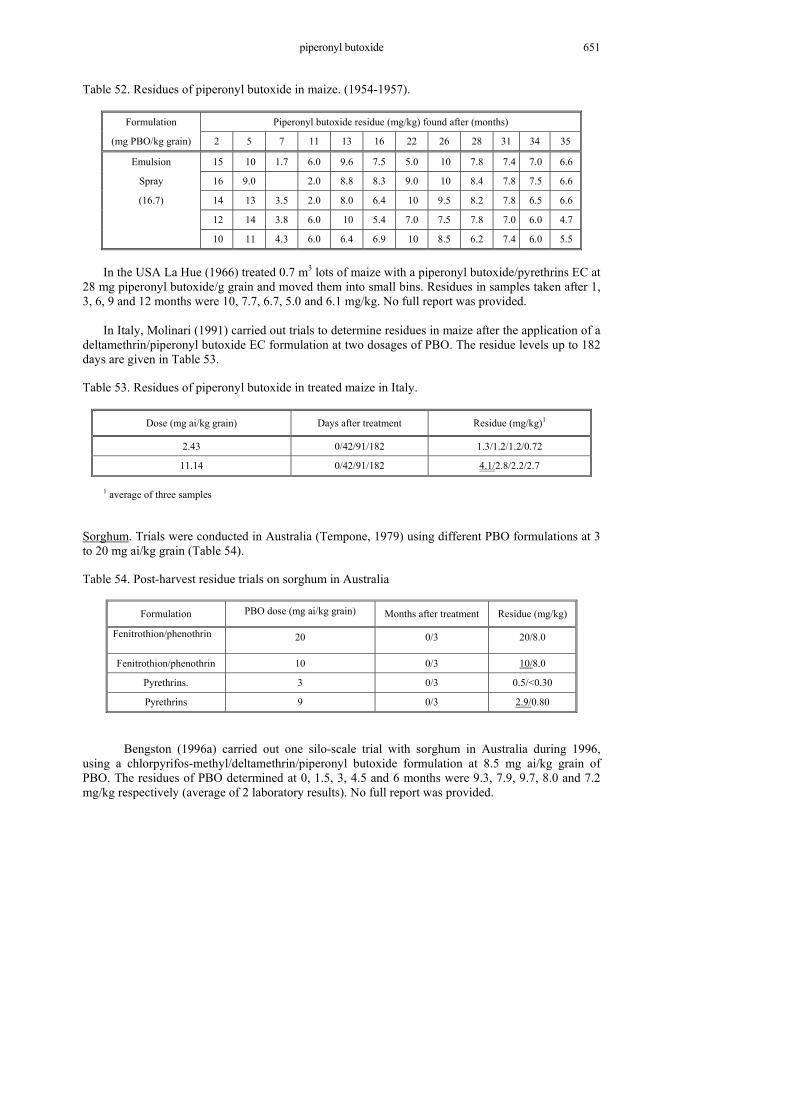
piperonyl butoxide 651
Table 52. Residues of piperonyl butoxide in maize. (1954-1957).
Formulation Piperonyl butoxide residue (mg/kg) found after (months)
(mg PBO/kg grain) 2 5 7 11 13 16 22 26 28 31 34 35
Emulsion 15 10 1.7 6.0 9.6 7.5 5.0 10 7.8 7.4 7.0 6.6
Spray 16 9.0 2.0 8.8 8.3 9.0 10 8.4 7.8 7.5 6.6
(16.7) 14 13 3.5 2.0 8.0 6.4 10 9.5 8.2 7.8 6.5 6.6
12 14 3.8 6.0 10 5.4 7.0 7.5 7.8 7.0 6.0 4.7
10 11 4.3 6.0 6.4 6.9 10 8.5 6.2 7.4 6.0 5.5
In the USA La Hue (1966) treated 0.7 m3 lots of maize with a piperonyl butoxide/pyrethrins EC at
28 mg piperonyl butoxide/g grain and moved them into small bins. Residues in samples taken after 1, 3, 6, 9 and 12 months were 10, 7.7, 6.7, 5.0 and 6.1 mg/kg. No full report was provided.
In Italy, Molinari (1991) carried out trials to determine residues in maize after the application of a deltamethrin/piperonyl butoxide EC formulation at two dosages of PBO. The residue levels up to 182 days are given in Table 53.
Table 53. Residues of piperonyl butoxide in treated maize in Italy.
Dose (mg ai/kg grain) Days after treatment Residue (mg/kg)1
2.43 0/42/91/182 1.3/1.2/1.2/0.72
11.14 0/42/91/182 4.1/2.8/2.2/2.7
1 average of three samples
Sorghum. Trials were conducted in Australia (Tempone, 1979) using different PBO formulations at 3 to 20 mg ai/kg grain (Table 54).
Table 54. Post-harvest residue trials on sorghum in Australia
Formulation PBO dose (mg ai/kg grain) Months after treatment Residue (mg/kg)
Fenitrothion/phenothrin 20 0/3 20/8.0
Fenitrothion/phenothrin 10 0/3 10/8.0
Pyrethrins. 3 0/3 0.5/<0.30
Pyrethrins 9 0/3 2.9/0.80
Bengston (1996a) carried out one silo-scale trial with sorghum in Australia during 1996, using a chlorpyrifos-methyl/deltamethrin/piperonyl butoxide formulation at 8.5 mg ai/kg grain of PBO. The residues of PBO determined at 0, 1.5, 3, 4.5 and 6 months were 9.3, 7.9, 9.7, 8.0 and 7.2 mg/kg respectively (average of 2 laboratory results). No full report was provided.

piperonyl butoxide 652
FATE OF RESIDUES IN STORAGE AND PROCESSING
Processing
A series of processing studies was conducted on oranges, grapes, tomatoes, beans, potatoes, sugar beet and cotton. Ten or more applications of an insecticide containing piperonyl butoxide were made by broadcast ground spray, following typical agricultural practices, to maturing crops at intervals of three to seven days, at a rate of 2.8 kg ai/ha per application, 5 times the intended maximum use rate. Mature raw commodities were collected as soon as the spray had dried after the last application, except for cotton which was collected 14 days after the last application. Bulk samples were processed into the required products using procedures that simulated commercial practice. Processing procedures are summarized below for each commodity.
Oranges. The fruit was sorted and extraneous material such as leaves and stems removed, before processing into juice, molasses, dry peel (dry pulp), and oil (Hattermann, 1995a,b). The fruit was washed on a Pennwalt/Decco Tiltbelt fruit washer-drier, a standard commercial foam detergent cleaner was applied in a brush washer and the washed fruit rinsed again to remove the detergent (Figure 11). Samples of unwashed oranges were also collected for analysis and stored at 23°C.
Juice. To extract juice a commercial FMC 391B In-Line-Juice Extractor (equipped with continuous water-spray nozzles for maximum recovery of peel oil) is used to produce juice, peel, and oil/water/peel-frit emulsion. Peel and oil/water/peel-frit emulsion then undergo further processing in separate steps. The extracted juice drains down a strainer tube to a manifold under the extractor where it is collected and passed continuously through a modified FMC Model 35 finisher that screens excess pulp from the juice (as in commercial practice). Juice is then collected in a 570 l stainless steel tank fitted with a motor, stirrer and volume-measuring device. At the end of the run, two cases (24 cans/case) of juice are canned and stored at 23°C.
Oil. The oil/water/peel-frit emulsion from the extractor is passed through an Automatic Machinery Co. finisher, Model TRF, with a 0.05 cm screen and variable clearance. The solids are collected and combined with peel from the extractor for further processing. The oil emulsion is passed over a Syntron Model SF 152 shaker screen feeder equipped with a double deck vibrating screening trough. The filtrate is collected in a 190 l stainless steel tank. After a minimum of 5 hours under ambient conditions, the lower unemulsified water phase is drained off. The remaining concentrated oil emulsion is kept at 0°C until processed (normally at least 16 hours).
After storage, any remaining water phase is siphoned off. The concentrated oil emulsion is centrifuged in a laboratory De Laval Gyro Tester continuous centrifuge. The oil fraction is stored at -18°C for at least 16 hours to freeze out any remaining water. The thawed cold-pressed oil is filtered to remove suspended solids. Anhydrous sodium sulfate is added to the oil to remove any remaining water and the mixture is again filtered. The resulting cold-pressed oil is stored at ambient temperature in sealed nitrogen-purged glass bottles.
Dried pulp. The peel-membrane-seed fraction from the FMC extractor and the solids from the oil/water/peel-frit emulsion finisher are combined and stored at ambient conditions (about 2-3 h). In processing, the peel is transferred to the hopper in the pilot plant feed mill. As peel leaves the hopper, a liquid lime slurry is added continuously at a rate of 0.3% lime per weight of peel. The peel is shredded to a more uniform particle size of approximately 12 mm, then passed down a reaction conveyor and up an elevator (~15 min) to the press. The limed-chopped-reacted peel is passed through a continuous press having 1 atmosphere back-pressure of air, that separates the peel into presscake and press liquor.
The presscake is fed to a triple pass direct-fired dryer adjusted to produce a dried citrus pulp of approximately 8-10% moisture with a minimum of charring. The temperature of the exhaust air
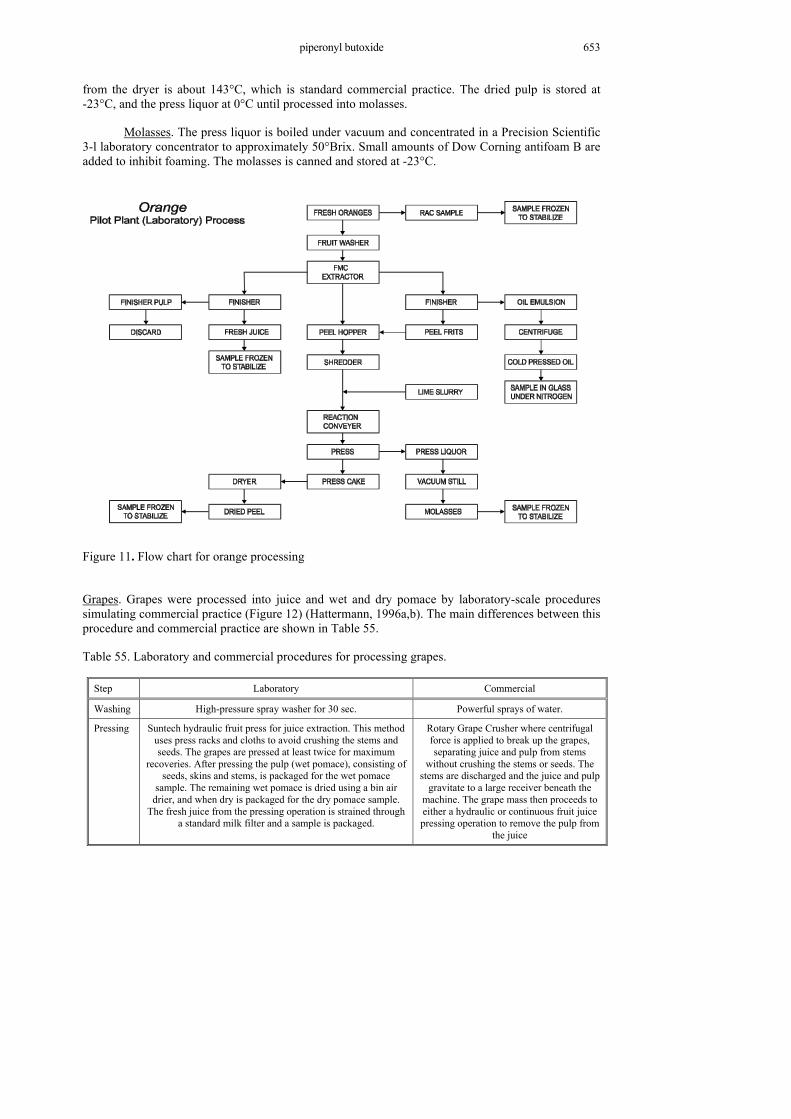
piperonyl butoxide 653
from the dryer is about 143°C, which is standard commercial practice. The dried pulp is stored at -23°C, and the press liquor at 0°C until processed into molasses.
Molasses. The press liquor is boiled under vacuum and concentrated in a Precision Scientific 3-l laboratory concentrator to approximately 50°Brix. Small amounts of Dow Corning antifoam B are added to inhibit foaming. The molasses is canned and stored at -23°C.
Figure 11. Flow chart for orange processing
Grapes. Grapes were processed into juice and wet and dry pomace by laboratory-scale procedures simulating commercial practice (Figure 12) (Hattermann, 1996a,b). The main differences between this procedure and commercial practice are shown in Table 55.
Table 55. Laboratory and commercial procedures for processing grapes.
Step Laboratory Commercial
Washing High-pressure spray washer for 30 sec. Powerful sprays of water.
Pressing Suntech hydraulic fruit press for juice extraction. This method uses press racks and cloths to avoid crushing the stems and seeds. The grapes are pressed at least twice for maximum
recoveries. After pressing the pulp (wet pomace), consisting of seeds, skins and stems, is packaged for the wet pomace
sample. The remaining wet pomace is dried using a bin air drier, and when dry is packaged for the dry pomace sample.
The fresh juice from the pressing operation is strained through a standard milk filter and a sample is packaged.
Rotary Grape Crusher where centrifugal force is applied to break up the grapes, separating juice and pulp from stems
without crushing the stems or seeds. The stems are discharged and the juice and pulp
gravitate to a large receiver beneath the machine. The grape mass then proceeds to either a hydraulic or continuous fruit juice pressing operation to remove the pulp from
the juice

piperonyl butoxide 654
Figure 12. Flow chart for production of juice and pomace from grapes.
Raisins. Grapes were processed by sun-drying in greenhouses for 24 days. After drying, raisins were separated from raisin waste by screening. Figure 13 shows the procedures.
Figure 13. Flow chart for production of raisins from grapes.
Tomatoes. Simulating commercial operations, typical canning variety tomatoes were processed into wet and dry pomace, purée, and juice (Hattermann, 1995m, 1999) (Figure 14). Table 56 shows the main differences between the laboratory and commercial procedures.

piperonyl butoxide 655
Table 56. Laboratory and commercial procedures for tomato processing.
Step Laboratory Commercial
Inspection Sorted by hand and discarded material retained as cannery waste. All material used.
Moving inspection belt to sort and remove stones, loose leaves, grossly contaminated and defective fruit
(green, decomposed or unfit). Inspected tomatoes proceed to size grading machinery to sort different
sizes according to their specified use
Washing and rising
Soak kettle with 0.5% lye solution for 3 min at 54°C and batch rinsed by high-pressure spray for
30 sec per batch.
Soak tank to aid in the removal of drosophila eggs and larvae and other contaminants. A lye (NaOH)
solution at 0.5% is sometimes used. The tomatoes are soaked for 3 min at 54°C, and rinsed through a series
of spray nozzles
Sorting and trimming
Fruit inspected and, if necessary, trimmed by hand. The sorting step was omitted as all available
material was processed together.
Defective fruit or parts (rotten areas, mould portions, insect damage or sunscald) are removed. The fruit is
then sorted so that large perfect fruit goes to the scalder, the rotten fruit to the dump and small and
misshapen fruit to the pulping line.
Coring Omitted because canned whole tomatoes are not a required fraction.
The tomatoes for canning proceed to a coring operation
Peeling An atmospheric steam cabinet at 55-7 kg/cm2 for 30 sec per batch.
Steam, lye or infrared peeling
Final inspection
Omitted as all material used. Final inspection before canning to assess defects for grade classification
Crushing/chopping
Tomatoes hand-fed into a pulper finisher and the pulp/pomace separated from the juice. The juice was then frozen for concentration at a later date. The wet pomace sample was packaged from the
wet pomace recovered. The remaining wet pomace was then dried for the dry pomace sample. There is no commercial practice for drying wet pomace or
cannery waste.
The tomatoes drop into the chopper at the end of the trimming belt. The chopped tomatoes proceed to
either a screw or paddle type extractor for the extraction of juice.
Juice concen-tration
Groen vacuum pan batch concentrator. Purée packed, sealed, heated for 20 min at 98-100°C and then cooled under running cold tap water before
packaging for purée sample.
Under reduced pressure and usually using double and multiple-effect evaporators (continuous machines,
handling the juice and discharging the finished purée at 10.6 ± 1% solids and paste at approximately 30-
32% solids). The purée is packed in cans, immediately sealed and the cans cooled before casing
Paste Portion of the finished paste set aside for juice from concentrate manufacture. 1% salt added to a
portion of the finished paste, the temperature raised to 88-91°C, and the paste canned and sealed. The
sealed can is kept for 20 min at 98-100°C and then cooled under cold running tap water before
packaging.
The finished paste is heated to approximately 90°C before being packed in cans, which are sealed
immediately and cooled before casing
Juice The finished paste is reconstituted with water, salt and ascorbic acid (vitamin C), heated to 88-91°C, packaged, sealed, heated to 98-100°C for 20 min,
and cooled in cold running tap water before canning as the juice from concentrate sample
fraction.
The tomato juice from concentrate must contain a minimum of 5.5% tomato solids. The paste is
prepared as the previous step and then bulk-packaged in 208 l drums for products such as ketchup, juice
from concentrate, and sauce

piperonyl butoxide 656
Figure 14. Flow chart for tomato processing.
Succulent beans. Pods and plants were processed into cannery waste (Hattermann 1995c, 1996c). Waste samples were made by collecting whole plants from at least 12 plot locations, stripping the leaves and pods, cutting approximately 2.5 cm off each end of some pods and discarding the middle section. A composite sample of leaves, whole pods, and pod tips was collected for the 2.2 kg cannery waste sample that consisted of 0.22 kg of leaves, 0.45 kg of whole pods and 1.6 kg of pod tips.
Potatoes. Potatoes were processed on a laboratory scale simulating commercial practices into chips, wet peel from the granule-making process, and granules, equivalent to flakes (Hattermann 1995f, 1996e).
Figure 15 shows the laboratory procedure for granules. The main differences between this procedure and commercial operations are shown in Table 57.
Table 57. Laboratory and commercial procedures for producing potato granules.
Step Laboratory Commercial
Washing tub washing for 5-10 min water flume and/or barrel washer and destoner machine
Peeling continuous batch 13 k/cm2 pressure steam peeler for ~10-20 sec
continuous batches using a pilot plant 5.5-6 kg/cm2 pressure steam peeler for ~45-60 sec
Cutting ~1-1.3 cm slices using a restaurant-style food cutter
1.3 cm slices using a commercial model cutter
Starch removal
batch spray washing the slices for ~30 sec in cold water
continuous cold water spray washer
piperonyl butoxide 657
Step Laboratory Commercial
Pre-cooking
at 70-77°C while targeting 71-74°C for 20-22 min using a batch 150 l steam-jacketed kettle,
cooled down to less than 32°C with cold running tap water
At 71-74°C continuous auger style pre-cooker for 20 min, proceed to a cold running tap water continuous
auger style cooler to cool slices down to less than 32°C for 20 min
Cooking At 94-100°C, for 40-42 min using a batch atmospheric steam cooker.
continuous auger steam cooker at 96-100°C for 35-45 min.
Ricing mashed using a restaurant-style meat grinder without the grinding attachment.
auger containing a ricing/mashing grid
Add-back process
pre-weighed additives are added with the mashed potatoes and mixed for ~60 sec. Packaged in
approximately 1 kg plastic containers and frozen for later dehydration
continuous primary mixer where additives are added. Dry potato granules (0.13 mm) are added to the wet
mash at the rate of 1 kg of dry granules to 0.5 kg of wet mash
Drying fluidized-bed dried 38-43°C conditioning belt for 30 min. Flash-dried at 260-304°C for ~30 sec to 13-17% moisture. Fluidized-
bed dried to 8-10% moisture.
Granule screened using a 30 and 60 mesh screen. The plus 60 mesh fraction is added to the added to
the add-back supply. The minus 60 mesh product is packaged into the potato granule sample
fraction.
sifted through a 32 mesh sieve, the <32 mesh product is cooled at 38°C to 7-7.5% moisture on an ambient fluid-bed cooler. The cooled product is sifted through a 105
mesh screen, the plus 105 mesh product is used for add-back “seed” supply and the minus 105 mesh product is
packed.

piperonyl butoxide 658
Figure 15. Flow chart for the production of granules.

piperonyl butoxide 659
Figure 16 shows the laboratory procedures for the production of potato chips. The main differences between this procedure and the commercial operation are shown in Table 58.
Figure 16. Flow chart for the production of potato chips. Table 58. Laboratory and commercial procedures for processing potatoes to chips.
Step Laboratory Commercial
washing tub washing for 5-10 min water flume and/or barrel washer and destoner machine
peeling peeled for 25-35 sec in batches using an abrasive peeler
continuous abrasive peeler
cutting restaurant-style food cutter/slicer Urschel Model CC cutter
frying electrically heated restaurant-style deep fat fryer at ~163-191°C for 60-90 sec
continuous deep fat fryer and chain conveyer through hot oil at 185°C for ~60 sec
draining and packing
draining free oil in a restaurant-style draining tray and salting the chips by hand
chain conveyor to allow oil to drain, salting conveyor, inspection and then to packaging
Sugar beet. Beets were processed under simulated commercial conditions in a laboratory into dehydrated pulp, molasses, and refined sugar (Hattermann 1994g, 1995f). Although there are variations in the methods of producing beet sugar, all processes use essentially the same basic method.
The main differences between the laboratory procedures and commercial operations are shown in Table 59. Figure 17 is a flow chart of the laboratory processing of sugar beet.
piperonyl butoxide 660
Table 59. Laboratory and commercial procedures for processing sugar beet.
Step Laboratory Commercial
Sample Beets stored frozen at 15 ± 8°C until processing.
Fresh or frozen outside in piles before processing
Washing Washed in warm water in stainless steel tub
Water flume and a washing section where trash and field dirt are removed
Cutting Into 1-3 mm thickness using a LanElec vegetable slicer
Into cossettes (strips) by large rotary wheels fitted with cutting knives having V-corrugated cutting edges. The
thickness of cossettes produced depends partly on the type of diffuser used. The thickness could be as much as 4 mm
Diffusing Batches of cossettes in stainless steel mesh baskets are moved by hand from cell to
cell in one direction while diffusion liquid is transferred from cell to cell in the
opposite direction. Temperature maintained at 70°C.
Continuous screw or chain, or a series of individual cells with means to transfer pulp and water from cell to cell
Pressing Suntech fruit press removes free juice, which is then returned to the diffuser
Pressed to remove free juice which is then returned to the diffuser for thin juice recovery
Drying Laboratory bin air dryer to <10% moisture Heated rotary dryers to <10% moisture
First
carbonation
Batch fashion using a 75 l steam jacketed stainless steel kettle. A milk of lime slurry
containing about 11% CaO is added slowly while gassing with bottled CO2.
The pH is ~10 to keep alkalinity as close to 0.100% CaO/100 ml as possible.
Alkalinity and CaO content are checked by titration.
Raw juice of 10-15% Brix is purified by the addition of lime and carbon dioxide gas, either continuously or
batchwise. The first carbonation is done at 80-85°C. Lime addition may vary depending on beet quality from 1.4-
2.0%.
Clarification Settle in the 114 l stainless steel kettle. Supernatant liquor is decanted and the
sludge filtered through Buchner funnels
Multi-tray clarifiers and rotary vacuum filters
Second carbonation
Batch fashion using a 75 l steam-jacketed stainless steel kettle at 90-95°C. Gassing is regulated by use of phenolphthalein and by
laboratory titration.
Continuously in a large tank. The juice is gassed at 90-95°C to an optimum alkalinity, about 0.015 gm CaO/100
ml, to minimize lime salts
Filtering Buchner funnels Various types of industrial filters such as pressure leaf filters
Concentration Groen steam-jacketed vacuum pan. Steam temperature automatically regulated at
approximately 3°C. Vacuum is maintained at approximately 460 mm Hg
Multiple-effect evaporators of various designs
Increase Brix Boiled directly to sugar in a small laboratory vacuum pan of a design similar
to full scale vacuum pans. Vacuum is maintained at 10 cm Hg absolute
Addition of lower grade sugar such as intermediate and raw sugars from a three-boiling scheme. The enriched thick juice is called standard liquor and it is from this
liquor that white sugar is made. Liquor is boiled to sugar in large vacuum pans of various designs and under conditions
that cause the syrup to be supersaturated
Molasses Massecuite (remaining materials) from the vacuum pan is centrifuged for white sugar recovery. It is washed and the initial spin-
off syrup is molasses.
Large centrifuges to separate the white sugar from mother liquor. The sugar in the centrifuge basket is washed with hot clean water. The spin-off syrup is subjected to further processing for additional sugar recovery. The syrup after
further sugar recovery is molasses
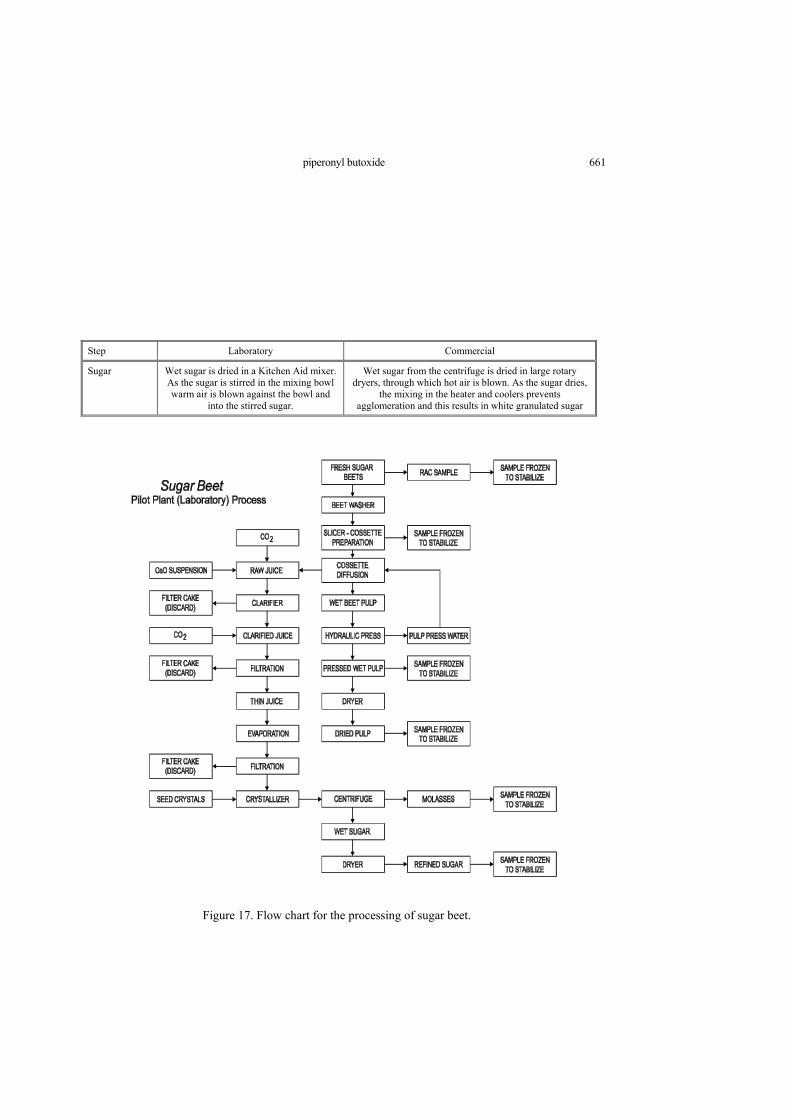
piperonyl butoxide 661
Step Laboratory Commercial
Sugar Wet sugar is dried in a Kitchen Aid mixer. As the sugar is stirred in the mixing bowl warm air is blown against the bowl and
into the stirred sugar.
Wet sugar from the centrifuge is dried in large rotary dryers, through which hot air is blown. As the sugar dries,
the mixing in the heater and coolers prevents agglomeration and this results in white granulated sugar
Figure 17. Flow chart for the processing of sugar beet.
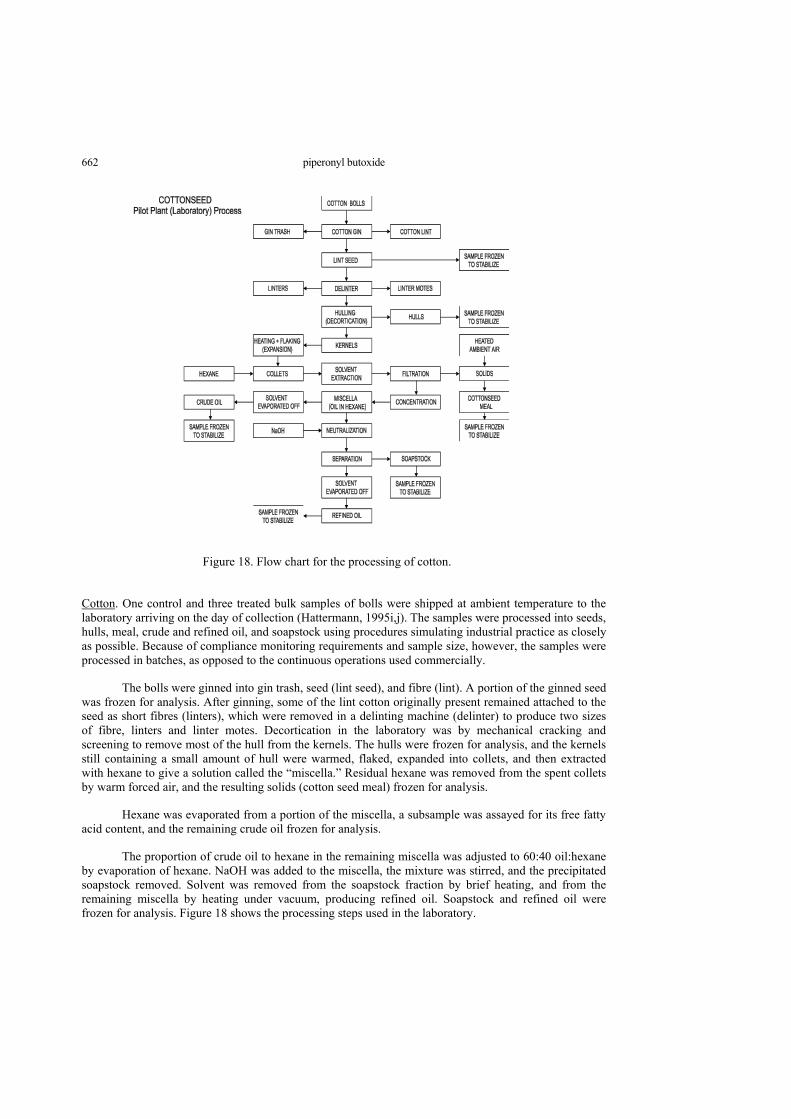
piperonyl butoxide 662
Figure 18. Flow chart for the processing of cotton.
Cotton. One control and three treated bulk samples of bolls were shipped at ambient temperature to the laboratory arriving on the day of collection (Hattermann, 1995i,j). The samples were processed into seeds, hulls, meal, crude and refined oil, and soapstock using procedures simulating industrial practice as closely as possible. Because of compliance monitoring requirements and sample size, however, the samples were processed in batches, as opposed to the continuous operations used commercially.
The bolls were ginned into gin trash, seed (lint seed), and fibre (lint). A portion of the ginned seed was frozen for analysis. After ginning, some of the lint cotton originally present remained attached to the seed as short fibres (linters), which were removed in a delinting machine (delinter) to produce two sizes of fibre, linters and linter motes. Decortication in the laboratory was by mechanical cracking and screening to remove most of the hull from the kernels. The hulls were frozen for analysis, and the kernels still containing a small amount of hull were warmed, flaked, expanded into collets, and then extracted with hexane to give a solution called the “miscella.” Residual hexane was removed from the spent collets by warm forced air, and the resulting solids (cotton seed meal) frozen for analysis.
Hexane was evaporated from a portion of the miscella, a subsample was assayed for its free fatty acid content, and the remaining crude oil frozen for analysis.
The proportion of crude oil to hexane in the remaining miscella was adjusted to 60:40 oil:hexane by evaporation of hexane. NaOH was added to the miscella, the mixture was stirred, and the precipitated soapstock removed. Solvent was removed from the soapstock fraction by brief heating, and from the remaining miscella by heating under vacuum, producing refined oil. Soapstock and refined oil were frozen for analysis. Figure 18 shows the processing steps used in the laboratory.
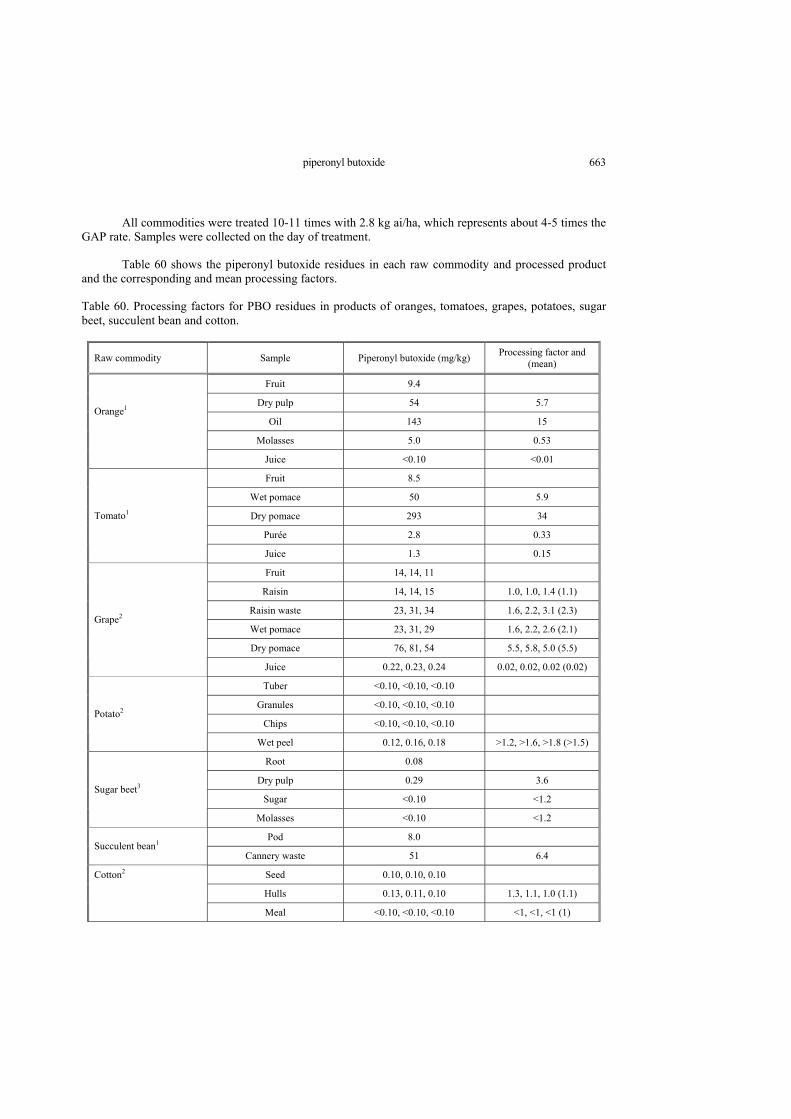
piperonyl butoxide 663
All commodities were treated 10-11 times with 2.8 kg ai/ha, which represents about 4-5 times the GAP rate. Samples were collected on the day of treatment.
Table 60 shows the piperonyl butoxide residues in each raw commodity and processed product and the corresponding and mean processing factors.
Table 60. Processing factors for PBO residues in products of oranges, tomatoes, grapes, potatoes, sugar beet, succulent bean and cotton.
Raw commodity Sample Piperonyl butoxide (mg/kg) Processing factor and (mean)
Fruit 9.4
Dry pulp 54 5.7
Oil 143 15 Orange1
Molasses 5.0 0.53
Juice <0.10 <0.01
Fruit 8.5
Wet pomace 50 5.9
Dry pomace 293 34
Purée 2.8 0.33
Tomato1
Juice 1.3 0.15
Fruit 14, 14, 11
Raisin 14, 14, 15 1.0, 1.0, 1.4 (1.1)
Raisin waste 23, 31, 34 1.6, 2.2, 3.1 (2.3)
Wet pomace 23, 31, 29 1.6, 2.2, 2.6 (2.1)
Dry pomace 76, 81, 54 5.5, 5.8, 5.0 (5.5)
Grape2
Juice 0.22, 0.23, 0.24 0.02, 0.02, 0.02 (0.02)
Tuber <0.10, <0.10, <0.10
Granules <0.10, <0.10, <0.10
Chips <0.10, <0.10, <0.10 Potato2
Wet peel 0.12, 0.16, 0.18 >1.2, >1.6, >1.8 (>1.5)
Root 0.08
Dry pulp 0.29 3.6
Sugar <0.10 <1.2 Sugar beet3
Molasses <0.10 <1.2
Pod 8.0 Succulent bean1
Cannery waste 51 6.4
Seed 0.10, 0.10, 0.10
Hulls 0.13, 0.11, 0.10 1.3, 1.1, 1.0 (1.1)
Cotton2
Meal <0.10, <0.10, <0.10 <1, <1, <1 (1)
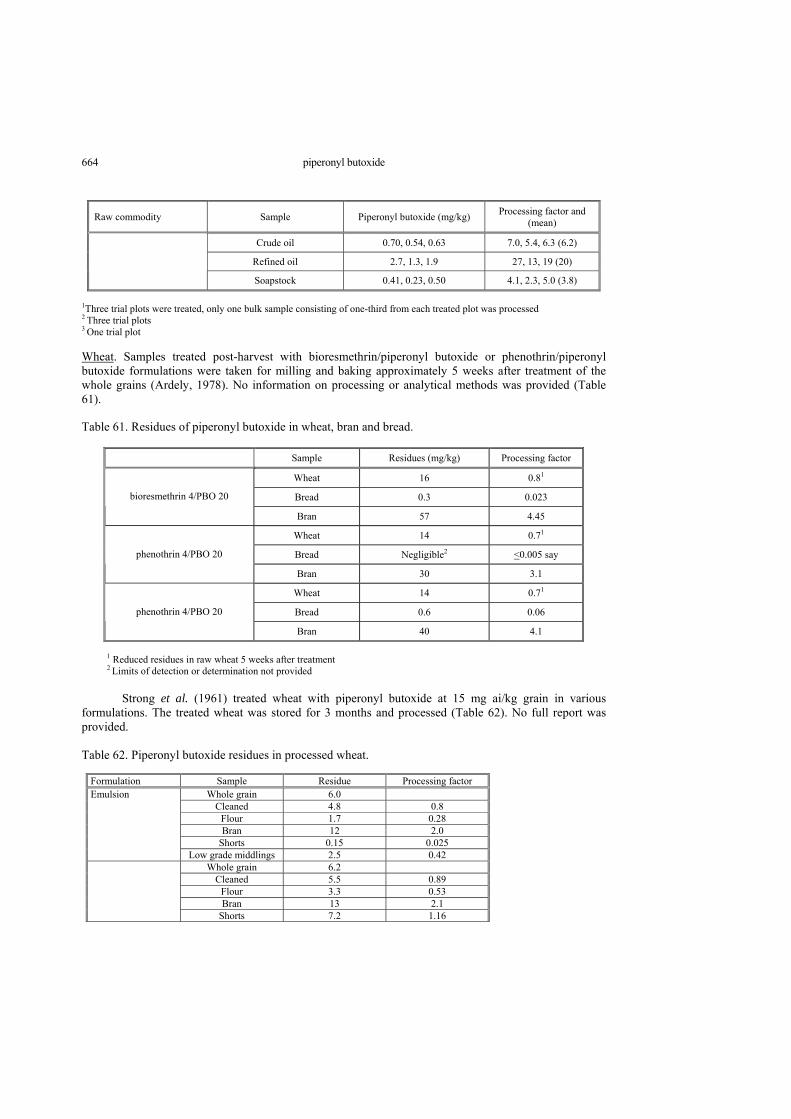
piperonyl butoxide 664
Raw commodity Sample Piperonyl butoxide (mg/kg) Processing factor and (mean)
Crude oil 0.70, 0.54, 0.63 7.0, 5.4, 6.3 (6.2)
Refined oil 2.7, 1.3, 1.9 27, 13, 19 (20)
Soapstock 0.41, 0.23, 0.50 4.1, 2.3, 5.0 (3.8)
1Three trial plots were treated, only one bulk sample consisting of one-third from each treated plot was processed 2 Three trial plots
3 One trial plot Wheat. Samples treated post-harvest with bioresmethrin/piperonyl butoxide or phenothrin/piperonyl butoxide formulations were taken for milling and baking approximately 5 weeks after treatment of the whole grains (Ardely, 1978). No information on processing or analytical methods was provided (Table 61).
Table 61. Residues of piperonyl butoxide in wheat, bran and bread.
Sample Residues (mg/kg) Processing factor
Wheat 16 0.81
Bread 0.3 0.023 bioresmethrin 4/PBO 20
Bran 57 4.45
Wheat 14 0.71
Bread Negligible2 <0.005 say phenothrin 4/PBO 20
Bran 30 3.1
Wheat 14 0.71
Bread 0.6 0.06 phenothrin 4/PBO 20
Bran 40 4.1
1 Reduced residues in raw wheat 5 weeks after treatment 2 Limits of detection or determination not provided
Strong et al. (1961) treated wheat with piperonyl butoxide at 15 mg ai/kg grain in various
formulations. The treated wheat was stored for 3 months and processed (Table 62). No full report was provided.
Table 62. Piperonyl butoxide residues in processed wheat.
Formulation Sample Residue Processing factor Emulsion Whole grain 6.0 Cleaned 4.8 0.8 Flour 1.7 0.28 Bran 12 2.0 Shorts 0.15 0.025 Low grade middlings 2.5 0.42 Whole grain 6.2 Cleaned 5.5 0.89 Flour 3.3 0.53 Bran 13 2.1 Shorts 7.2 1.16
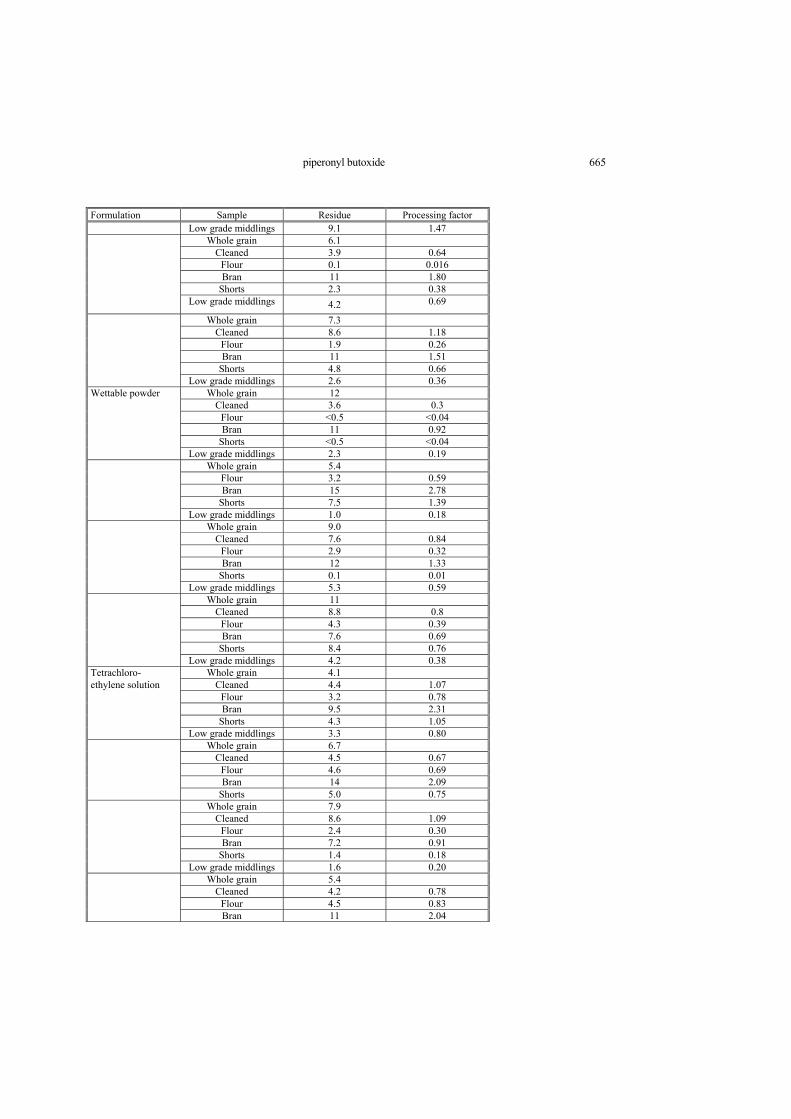
piperonyl butoxide 665
Formulation Sample Residue Processing factor Low grade middlings 9.1 1.47 Whole grain 6.1 Cleaned 3.9 0.64 Flour 0.1 0.016 Bran 11 1.80 Shorts 2.3 0.38 Low grade middlings 4.2 0.69
Whole grain 7.3 Cleaned 8.6 1.18 Flour 1.9 0.26 Bran 11 1.51 Shorts 4.8 0.66 Low grade middlings 2.6 0.36 Wettable powder Whole grain 12 Cleaned 3.6 0.3 Flour <0.5 <0.04 Bran 11 0.92 Shorts <0.5 <0.04 Low grade middlings 2.3 0.19 Whole grain 5.4 Flour 3.2 0.59 Bran 15 2.78 Shorts 7.5 1.39 Low grade middlings 1.0 0.18 Whole grain 9.0 Cleaned 7.6 0.84 Flour 2.9 0.32 Bran 12 1.33 Shorts 0.1 0.01 Low grade middlings 5.3 0.59 Whole grain 11 Cleaned 8.8 0.8 Flour 4.3 0.39 Bran 7.6 0.69 Shorts 8.4 0.76 Low grade middlings 4.2 0.38 Tetrachloro- Whole grain 4.1 ethylene solution Cleaned 4.4 1.07 Flour 3.2 0.78 Bran 9.5 2.31 Shorts 4.3 1.05 Low grade middlings 3.3 0.80 Whole grain 6.7 Cleaned 4.5 0.67 Flour 4.6 0.69 Bran 14 2.09 Shorts 5.0 0.75 Whole grain 7.9 Cleaned 8.6 1.09 Flour 2.4 0.30 Bran 7.2 0.91 Shorts 1.4 0.18 Low grade middlings 1.6 0.20 Whole grain 5.4 Cleaned 4.2 0.78 Flour 4.5 0.83 Bran 11 2.04

piperonyl butoxide 666
Formulation Sample Residue Processing factor Shorts 1.9 0.35 Low grade middlings 1.1 0.20 Cleaned Average processing 0.82 Flour factor 0.42 Bran 1.71 Shorts 0.56 Low grade middlings 0.50
In trials in Italy Molinari (1987) applied two different deltamethrin/piperonyl butoxide products to wheat stored either in vertical silos or warehouses for 3-12 months at rates from 2.5 to 10 mg PBO/kg grain. Milling trials were carried out with a flour roller mill with at least 90 kg of hard or soft wheat. The dry treatment involved first cleaning the wheat by sifters and dust collectors, a wheat humidification followed by rest to balance humidity, and a second cleaning by rubbing to eliminate the particles attached to the caryopsis and the pericarp roughness. The wheat was ground in seven steps for bran and flour production. Residues in the grain and processed products are shown in Table 63.
Table 63. Processing factors (PF) for wheat products from trials conducted in Italy.
45 days storage 180 days storage Location, mg PBO/kg grain
Sample
Residue (mg/kg) PF Residue (mg/kg) PF
Average PF
Grain 0.37, 1.8 0.29, 1.2
Cleaned <0.10, 0.74 <0.27, 0.41 <0.10, 0.64 <0.34, 0.53
S. Giorgio de Piano
5.0, 10 Decorticated <0.10, 0.55 <0.27, 0.31 <0.10, 0.74 <0.34, 0.62
Bran 0.45, 2.0 1.2, 1.1 0.69, 2.4 2.4, 2.0
Flour <0.10, 0.17 <0.27, 0.09 <0.10, <0.10 <0.34, <0.08
Porto a Rigo Grain 0.64, 4.4 1.2, 4.4
2.5, 10 Cleaned 0.32, 1.8 0.5, 0.41 0.49, 5.9 0.41, 1.34
Decorticated 0.30, 2.1 0.47, 0.48 0.80, 2.4 0.67, 0.54
Bran 2.0, 4.9 3.1, 1.1 1.8, 5.1 1.5, 1.16
Flour 0.40, 0.48 0.62, 0.11 0.14, <0.1 0.12, <0.02
La Spezia Grain <0.10, 2.4 <0.10, 2.4
2.5, 10 Cleaned <0.10, 0.96 -, 0.4 0.18, 1.5 >1.8, 0.63
Decorticated <0.10, 0.59 -, 0.25 <0.10, 3.2 -, 1.33
Bran <0.10, 4.6 -, 1.9 <0.10, 5.1 -, 2.13
Flour <0.10, 0.86 -, 0.36 <0.10, 0.28 -, 0.12
Landinara Grain 0.67, - , 3.1 0.32, 0.82, 4.2
2.5, 5.0, 10 Cleaned 0.42, - , 0.28 0.63, - , 0.09 <0.10, 0.10, 0.60 0.31, 0.12, 0.14 0.535
Decorticated <0.10, - , 1.1 <0.15, - , 0.35 <0.10, <0.10, 1.6 <0.31, <0.12, 0.38 0.44
Bran <0.10, - , 5.7 <0.15, - , 1.84 <0.10, <0.10, <0.10 <0.31, <0.12, <0.02 1.3
Flour 0.11, - , 0.24 0.16, - , 0.078 <0.10, <0.10, <0.10 <0.31, <0.12, <0.02 0.19

piperonyl butoxide 667
Turnbull and Ardley (1987) processed wheat treated with 8 mg/PBO/kg grain in an 800 tonne vertical silo in Australia. Flour extraction rates of 80% and 75% were used and 50:50 blends of the two were also used. Samples were examined after 1, 3 and 6 months (Turnbull, 1988). The residues and the processing factors (PF) are shown in Table 64.
Table 64. Residues of piperonyl butoxide in wheat and derived fractions.
1 month storage 3 months storage 6 months storage Sample, extraction rate Residue, mg/kg PF Residue, mg/kg PF Residue, mg/kg PF
Average
PF
Wheat 5.3 5.6 7.0
Bran 80% 22 4.2 23 4.1 23 3.3 3.9
Bran 75% 19 3.6 28 5.0 21 3.0 3.9
Pollard 80% - - - - 15 2.1 2.1
Pollard 75% 10 1.9 - - 16 2.3 2.1
Germ 80% - - 18 3.2 28 4.0 3.6
Germ 75% - - 16 2.9 29 4.1 3.5
Germ 50:50 11 2.1 - - - - 2.1
Gluten 80% - - - - 10 1.4 1.4
Gluten 75% - - - - 11 1.6 1.6
Gluten 50:50 7.3 1.4 - - - - 1.4
90:10 meal 80% - - - - 6.0 0.86 0.86
90:10 meal 75% - - 4.7 0.84 5.9 0.84 0.84
Flour 80% 1.6 0.30 2.0 0.36 2.4 0.34 0.33
Flour 75% 1.2 0.23 1.8 0.32 2.1 0.30 0.28
Wholemeal bread 80%
- - 2.7 0.48 3.8 0.54 0.51
Wholemeal bread 50:50
2.7 0.51 - - - - 0.51
White bread 80% 1.0 0.19 1.2 0.21 1.5 0.21 0.20
White bread 75% 0.9 0.17 1.2 0.21 1.5 0.21 0.20
Turnbull (1987) treated approximately 540 tonnes of wheat with two PBO formulations before milling. The output proportions were bran 18%, pollard 5% and flour 77%. The residues from the two treatments and the processing factors (PF) during 9 months storage are shown in Table 65.

piperonyl butoxide 668
Table 65. Piperonyl butoxide residues, mg/kg, in wheat fractions from treatments A and B, during 9 months storage.
Residues, mg/kg
1.5 months 3 months 4.5 months 6 months 9 months Sample
A PF A, B PF A PF A, B PF A, B PF
Average
PF
Wheat 6.9 5.9, 7.1 6.5 6.5, 4.7 5.5, 5.4
Bran 18 2.6 21, 21 3.6, 3.0 17 2.6 20, 17 3.1, 3.6 20, 16 3.6, 3.0 3.1
Pollard 8.1 1.2 6.3, 8.3 1.1, 1.2 10 1.5 13, 7.4 2.0, 1.6 14, 12 2.5, 2.2 1.7
90:10 meal 4.0 0.58 - , 7.0 - , 0.99 4.0 0.62 5.6, 5.7 0.86, 1.2 - 0.85
Flour 0.7 0.10 1.2, 1.0 0.20, 0.14 0.7 0.11 1.4, 1.6 0.22, 0.34 1.1, 1.3 0.20, 0.24
0.19
Wholemeal bread
2.9 0.42 3.1, 3.0 0.53, 0.42
2.4 0.37 4.2, 3.4 0.65, 0.72
4.9, 2.6 0.89, 0.48
0.56
White bread
0.6 0.09 0.4, <0.5
0.07 <0.07
0.4 0.06 0.4, <0.5
0.06, <0.11
0.4, <0.5 0.07, <0.09
<0.08
A: deltamethrin/PBO formulation B: bioresmethrin/fenitrothion/PBO formulation
In a full-scale milling trial 500 tonnes of wheat in concrete silos were treated with two different formulations at two application rates and stored for 24 weeks (Australian Wheat Board, 1988). Samples were delivered to commercial mills A, B and C (50 t per sample) and to pilot mill D (1 t per sample) (Table 66).
Table 66. Residues of piperonyl butoxide, mg/kg, and processing factors in wheat fractions.
Rate mg/kg Mill Storage (weeks) Wheat Flour Wholemeal Bran Germ Pollard
Commercial milling
10 A 10 4.7 1.8 7.3 26 12
PF 0.38 1.6 5.5 2.6 -
10 B 12 5.2 3.4 2.5 25 18 -
PF 0.65 0.48 4.8 3.5 -
10 C 10 5.2 3.0 6.4 24 19 9.3
PF 0.58 1.2 4.6 3.6 1.8
13.6 A 12 7.4 3.4 21 34 32 -
PF 0.46 2.8 4.6 4.3 -
13.6 B 26 6.4 4.2 - 28 18 35
PF 0.66 - 4.4 2.8 5.5
13.6 C 24 8.4 3.9 11 32 33 -
PF 0.46 1.3 3.8 3.9 -

piperonyl butoxide 669
Rate mg/kg Mill Storage (weeks) Wheat Flour Wholemeal Bran Germ Pollard
Pilot milling
10 D 8 6.8 3.4 10 21 24 12
PF 0.50 1.5 3.1 3.5 1.8
10 D 20 9.4 4.3 8.8 29 20 21
PF 0.46 0.94 3.1 2.1 2.2
13.6 D 15 11 4.4 9.5 36 36 21
PF 0.40 0.86 3.3 3.3 1.9
13.6 D 23 11 3.0 11 42 28 36
PF 0.27 1.0 3.8 2.5 3.3
Average processing factor 0.48 1.3 4.1 3.2 2.8
Hong Nguyen (1988) determined residues in wheat grain sampled 2 and 4 hours after treatment
with a nominal dose of 1 mg/kg deltamethrin plus 10 mg/kg piperonyl butoxide. Samples were milled and wheat fractions and bread analysed (Table 67).
Table 67. Residues of piperonyl butoxide in wheat milling fractions and bread.
2 h sample 4 h sample Average Fraction
mg/kg PF mg/kg PF PF
Wheat 7.3 6.7
Bran 26 3.6 27 4.0 3.8
Pollard 17 2.3 16 2.4 2.4
Germ 20 2.7 17 2.5 2.6
90:10 meal 5.5 0.75 5.5 0.82 0.78
Flour 1.4 0.19 1.6 0.24 0.22
Wholemeal bread 2.9 0.40 2.8 0.42 0.41
White bread 0.81 0.11 0.73 0.11 0.11
In a wheat admixture trial in Australia Webley (1994) treated 500 tonnes of wheat at the GAP
rate and at twice the GAP rate. 50 tonne samples were delivered to two commercial mills and a pilot mill within 4 weeks and a second delivery was made to the pilot mill after 3 more months. Samples of wheat, straight run flour, bran and wheat germ were taken during milling for analysis by two independent laboratories. Wholemeal was prepared using 4.1 kg flour, 0.18 kg bran, and 0.27 kg pollard. The results are given in Table 68. A full report of the study was not provided.
Table 68. Residues of piperonyl butoxide in wheat and its processed products.
PBO dose (mg ai/kg grain)
Sample Residue (mg/kg) Processing factor
Average processing factor
9 Wheat 5.1
(7 weeks storage) Bran 17 3.33

piperonyl butoxide 670
PBO dose (mg ai/kg grain)
Sample Residue (mg/kg) Processing factor
Average processing factor
Germ 6.8 1.33
Flour 2.1 0.41
Wholemeal 4.7 0.92
White pan bread 1.1 0.21
Wholemeal pan bread 2.7 0.53
Flat Arabic bread 1.4 0.27
Steamed bread 1.1 0.22
Yellow alkaline noodles 0.5 0.10
White noodles 1.1 0.22
9 Wheat 4.5
(26 weeks storage) Bran 16 3.56
Germ 13 2.89
Flour 2.3 0.51
Wholemeal 5.0 1.11
White pan bread 1.6 0.36
Wholemeal pan bread 2.9 0.64
Flat Arabic bread 2.2 0.49
Steamed bread 3.2 0.71
Yellow alkaline noodles 0.9 0.20
White noodles 1.7 0.38
16 Wheat 6.6
(7 weeks storage) Bran 31 4.7
Germ 14 2.12
Flour 2.9 0.44
Wholemeal 8.5 1.29
White pan bread 1.2 0.18
Wholemeal pan bread 5.5 0.83
Flat Arabic bread 4.5 0.68
Steamed bread 1.8 0.27
Yellow alkaline noodles 2.6 0.39
White noodles 2.3 0.35
Not stated Wheat 5.3 Flour 1.4 0.26 Gluten. 7.3 1.4 1.4
16 Wheat 6.1 (26 weeks storage) Bran 22 3.61 3.8
Germ 15 2.46 2.2
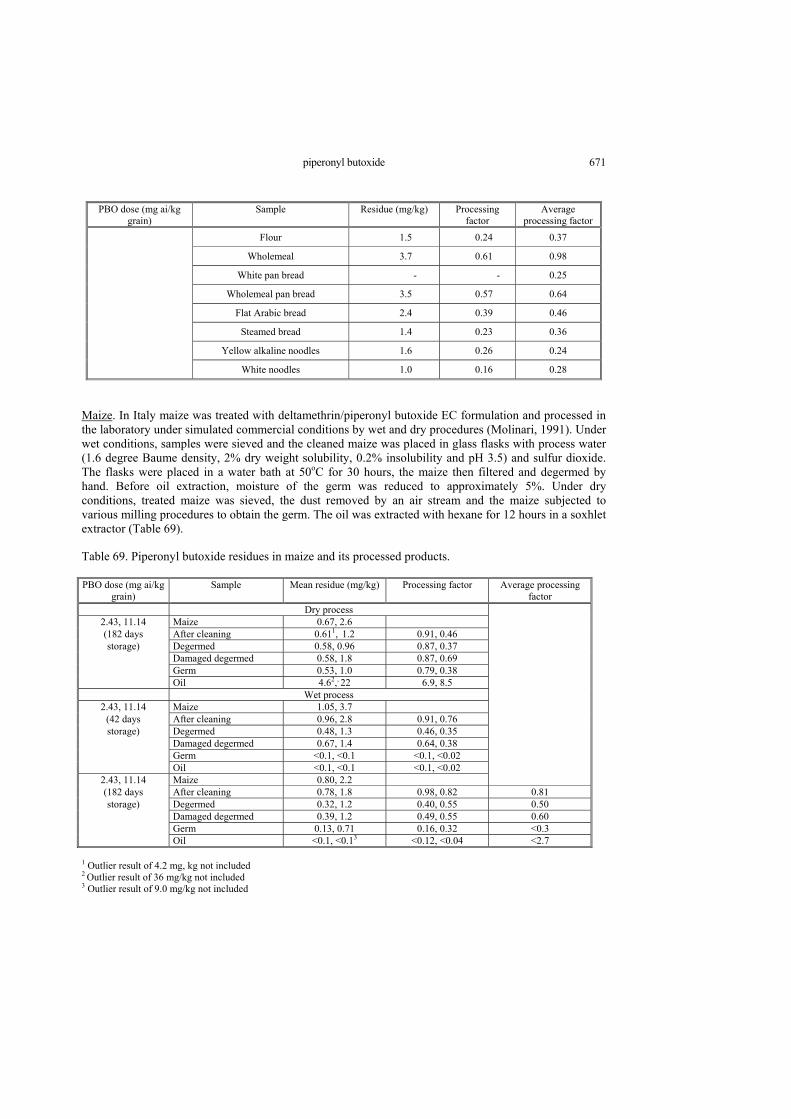
piperonyl butoxide 671
PBO dose (mg ai/kg grain)
Sample Residue (mg/kg) Processing factor
Average processing factor
Flour 1.5 0.24 0.37 Wholemeal 3.7 0.61 0.98 White pan bread - - 0.25 Wholemeal pan bread 3.5 0.57 0.64 Flat Arabic bread 2.4 0.39 0.46 Steamed bread 1.4 0.23 0.36 Yellow alkaline noodles 1.6 0.26 0.24 White noodles 1.0 0.16 0.28
Maize. In Italy maize was treated with deltamethrin/piperonyl butoxide EC formulation and processed in the laboratory under simulated commercial conditions by wet and dry procedures (Molinari, 1991). Under wet conditions, samples were sieved and the cleaned maize was placed in glass flasks with process water (1.6 degree Baume density, 2% dry weight solubility, 0.2% insolubility and pH 3.5) and sulfur dioxide. The flasks were placed in a water bath at 50oC for 30 hours, the maize then filtered and degermed by hand. Before oil extraction, moisture of the germ was reduced to approximately 5%. Under dry conditions, treated maize was sieved, the dust removed by an air stream and the maize subjected to various milling procedures to obtain the germ. The oil was extracted with hexane for 12 hours in a soxhlet extractor (Table 69).
Table 69. Piperonyl butoxide residues in maize and its processed products. PBO dose (mg ai/kg
grain) Sample Mean residue (mg/kg) Processing factor Average processing
factor Dry process
2.43, 11.14 Maize 0.67, 2.6 (182 days After cleaning 0.611, 1.2 0.91, 0.46 storage) Degermed 0.58, 0.96 0.87, 0.37
Damaged degermed 0.58, 1.8 0.87, 0.69 Germ 0.53, 1.0 0.79, 0.38 Oil 4.62,, 22 6.9, 8.5 Wet process
2.43, 11.14 Maize 1.05, 3.7 (42 days After cleaning 0.96, 2.8 0.91, 0.76 storage) Degermed 0.48, 1.3 0.46, 0.35
Damaged degermed 0.67, 1.4 0.64, 0.38 Germ <0.1, <0.1 <0.1, <0.02 Oil <0.1, <0.1 <0.1, <0.02
2.43, 11.14 Maize 0.80, 2.2 (182 days After cleaning 0.78, 1.8 0.98, 0.82 0.81 storage) Degermed 0.32, 1.2 0.40, 0.55 0.50
Damaged degermed 0.39, 1.2 0.49, 0.55 0.60 Germ 0.13, 0.71 0.16, 0.32 <0.3 Oil <0.1, <0.13 <0.12, <0.04 <2.7
1 Outlier result of 4.2 mg, kg not included 2 Outlier result of 36 mg/kg not included 3 Outlier result of 9.0 mg/kg not included
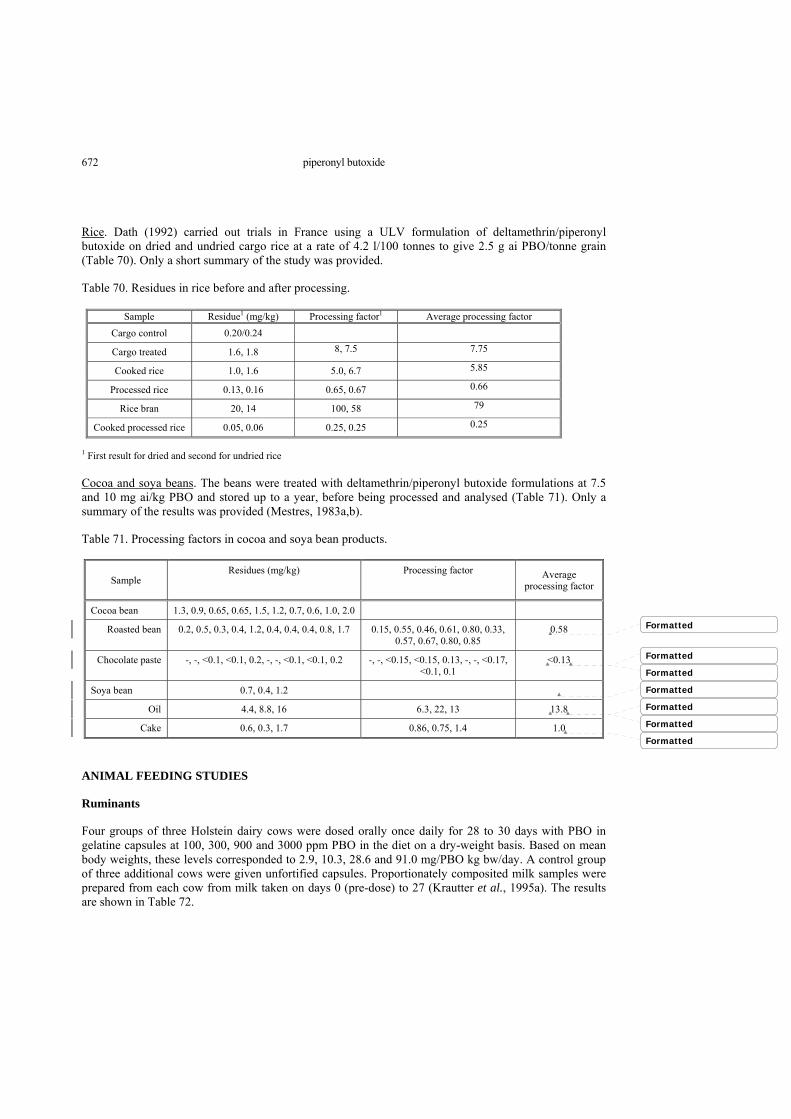
piperonyl butoxide 672
Rice. Dath (1992) carried out trials in France using a ULV formulation of deltamethrin/piperonyl butoxide on dried and undried cargo rice at a rate of 4.2 l/100 tonnes to give 2.5 g ai PBO/tonne grain (Table 70). Only a short summary of the study was provided.
Table 70. Residues in rice before and after processing.
Sample Residue1 (mg/kg) Processing factor1 Average processing factor
Cargo control 0.20/0.24
Cargo treated 1.6, 1.8 8, 7.5 7.75
Cooked rice 1.0, 1.6 5.0, 6.7 5.85
Processed rice 0.13, 0.16 0.65, 0.67 0.66
Rice bran 20, 14 100, 58 79
Cooked processed rice 0.05, 0.06 0.25, 0.25 0.25
1 First result for dried and second for undried rice Cocoa and soya beans. The beans were treated with deltamethrin/piperonyl butoxide formulations at 7.5 and 10 mg ai/kg PBO and stored up to a year, before being processed and analysed (Table 71). Only a summary of the results was provided (Mestres, 1983a,b).
Table 71. Processing factors in cocoa and soya bean products.
Sample Residues (mg/kg) Processing factor Average
processing factor
Cocoa bean 1.3, 0.9, 0.65, 0.65, 1.5, 1.2, 0.7, 0.6, 1.0, 2.0
Roasted bean 0.2, 0.5, 0.3, 0.4, 1.2, 0.4, 0.4, 0.4, 0.8, 1.7 0.15, 0.55, 0.46, 0.61, 0.80, 0.33, 0.57, 0.67, 0.80, 0.85
0.58
Chocolate paste -, -, <0.1, <0.1, 0.2, -, -, <0.1, <0.1, 0.2 -, -, <0.15, <0.15, 0.13, -, -, <0.17, <0.1, 0.1
<0.13
Soya bean 0.7, 0.4, 1.2
Oil 4.4, 8.8, 16 6.3, 22, 13 13.8
Cake 0.6, 0.3, 1.7 0.86, 0.75, 1.4 1.0
ANIMAL FEEDING STUDIES
Ruminants
Four groups of three Holstein dairy cows were dosed orally once daily for 28 to 30 days with PBO in gelatine capsules at 100, 300, 900 and 3000 ppm PBO in the diet on a dry-weight basis. Based on mean body weights, these levels corresponded to 2.9, 10.3, 28.6 and 91.0 mg/PBO kg bw/day. A control group of three additional cows were given unfortified capsules. Proportionately composited milk samples were prepared from each cow from milk taken on days 0 (pre-dose) to 27 (Krautter et al., 1995a). The results are shown in Table 72.
Formatted
Formatted
Formatted
Formatted
Formatted
Formatted
Formatted

piperonyl butoxide 673
Table 72. Residues of PBO in milk from orally dosed cows (Krautter et al., 1995).
PBO, mg/kg and (mean)
Day 100 ppm dose 300 ppm dose 900 ppm dose 3,000 ppm dose
1 0.01, 0.03, 0.01
(0.02)
0.04, 0.03, 0.03
(0.03)
0.12, 0.33, 0.42
(0.29)
3.2, 11, 3.8
(6.0)
3 <0.01, 0.02, 0.02
(0.01)
0.05, 0.03, 0.04
(0.04)
0.10, 0.44, 0.61
(0.38)
10, 10, 2.8
(7.6)
7 0.04, 0.02, <0.01
(0.02)
0.05, 0.09, 0.551
(0.07)
0.12, 121, 0.16
(0.14)
0.98, 12, 2.3
(5.1)
11 <0.01, 0.02, <0.01
(0.01)
0.03, 0.03, 0.03
(0.03)
0.19, 0.48, 0.34
(0.34)
8.8, 6.9, 1.5
(5.7)
14 <0.01, 0.02, 0.01
(0.01)
0.04, 0.04, 0.03
(0.04)
0.16, 0.72, 0.47
(0.45)
3.4, 10, 3.8
(5.7)
18 <0.01, <0.01, <0.01
(<0.01)
0.03, 0.03, 0.02
(0.03)
0.20, 0.78, 0.68
(0.55)
5.9, 8.8, 4.2
(6.3)
21 0.04, 0.01, 0.02
(0.02)
0.07, 0.07, 0.04
(0.06)
0.32, 0.70, 0.57
(0.53)
5.4, 5.7, 5.2
(5.4)
24 <0.01, 0.02, <0.01
(0.01)
0.02, 0.08, 0.03
(0.04)
0.18, 0.50, 0.63
(0.44)
5.1, 4.0, 3.1
(4.1)
27 <0.01, 0.01, <0.01
(0.01)
0.05, 0.06, 0.04
(0.05)
0.15, 0.56, 0.52
(0.41)
221, 3.8, 3.8
(3.8)
Mean of means 0.01 0.04 0.39 5.5
1 Sample considered an outlier and not used in mean (no explanation)
After treatment the cows were slaughtered over 3 days within 16 to 24 hours of the last dose. No significant tissue abnormalities were noted in any of the cows. Liver, kidney, composite round and tenderloin muscle, and composite perineal and omental fat were collected, homogenized with dry ice and stored frozen. The residues are shown in Table 73.
Table 73. Residues of piperonyl butoxide in tissues of orally-dosed cows (Krautter et al., 1995a).
PBO, mg/kg and (mean) in Dose
(group) Liver Kidney Muscle Fat
Low
(100 ppm)
0.15; 0.15; 0.12
(0.14)
<0.05; <0.05; <0.05
(<0.05)
<0.05; <0.05; <0.05
(<0.05)
0.08; 0.42; 0.14
(0.21)
Medium low
(300 ppm)
0.73; 0.33; 0.59
(0.55)
0.05; 0.14; 0.06
(0.08)
<0.05; 0.06; <0.05
(0.05)
0.95; 1.7; 0.99
(1.2)
Medium 1.4; 1.5; 1.2 0.61; 0.82; 0.28 <0.05; 0.67; 0.06 7.1; 15; 1.6

piperonyl butoxide 674
PBO, mg/kg and (mean) in Dose
(group) Liver Kidney Muscle Fat
(900 ppm) (1.4) (0.57) (0.26) (7.9)
High
(3000 ppm)
13; 9.0; 13
(12)
4.8; 11; 15
(10)
1.7; 12; 9.0
(7.6)
86; 220; 132
(146)
In another study the backs of three Holstein dairy cows were sprayed with piperonyl butoxide twice daily for 28-30 days with a formulated product at 2.28 g piperonyl butoxide/day. Based on mean body weight, this corresponds to a dose of 3.78 mg piperonyl butoxide/kg bw/day. An additional three cows were sprayed twice daily with the mineral oil diluent as a control (Krautter et al., 1995b).
Proportionately composited milk samples from each cow taken from days 0 (pre-dose) to 27 were analysed (Table 74).
Table 74. Residues of piperonyl butoxide in milk samples from cows treated dermally (Krautter et al., 1995b).
Day 1 3 7 11 14 18 21 24 27
Residues, mg/l
(mean)
0.07, 0.07, 0.03
(0.06)
0.17, 0.19, 0.07
(0.14)
0.14, 0.14, 0.08
(0.12)
0.14, 0.11, 0.07
(0.11)
0.14, 0.13, 0.07
(0.11)
0.16, 0.13, 0.17
(0.15)
0.18, 0.11, 0.09
(0.13)
0.24, 0.17, 0.11
(0.17)
0.20, 0.15, 0.13
(0.16)
After the 28 to 30 days, cows were slaughtered 16 to 24 hours after the last dose. There were no significant tissue abnormalities in any of the control or treated cows. Liver, kidneys, composite round and loin muscle, and composite perineal and omental fat samples were analysed (Table 75).
Table 75. Residues of piperonyl butoxide in the tissues of cows after dermal application (Krautter et al., 1995b).
Tissue Liver Kidney Muscle Fat
Residues, in mg/kg, and (mean)
0.02; 0.14; 0.03
(0.06)
0.21; 0.19; 0.21
(0.20)
0.16; 0.21; 0.16
(0.18)
2.6; 2.7; 2.3
(2.5)
Poultry. Groups of White Leghorn laying hens were dosed orally once daily for 28 to 30 days at three levels (10 hens/dose group) equivalent to 20.4, 61.2 or 198.8 ppm piperonyl butoxide in the diet (as-fed basis), corresponding to 1, 3, and 10 times the predicted maximum dietary burden (Krautter et al., 1995c). Based on mean body weights, the doses corresponded to 1.58, 4.41 and 15.01 mg/kg piperonyl butoxide bw/day respectively. A control group of ten additional hens were given unfortified capsules. Hens within each dose group were divided into three subgroups (3 or 4 hens/subgroup), and eggs and tissues composited by subgroup. Egg samples taken on days 0 (pre-dose) to 27 were analysed with the results shown in Table 76.

piperonyl butoxide 675
Table 76. Residues of piperonyl butoxide in egg samples, mg/l, from orally-dosed laying hens (Krautter et al., 1995c).
PBO, mg/kg, and (mean)
Day Low
(20.4 ppm)
Medium
(61.2 ppm)
High
(198.8 ppm)
1 <<0.01; <0.01; <0.01
(<0.01)
0.02; 0.01; 0.01
(0.01)
<0.01; 0.01; 0.02
(0.01)
3 0.01; <0.01; 0.03
(0.02)
0.08; 0.06; 0.13
(0.09)
0.48; 0.67; 0.68
(0.61)
7 0.02; 0.02; 0.02
(0.02)
0.14; 0.14; 0.23
(0.17)
1.4; 1.4; 1.6
(1.5)
11 0.03; 0.02; 0.02
(0.02)
0.13; 0.22; 0.14
(0.16)
1.2; 1.3; 1.5
(1.3)
14 0.03; 0.02; 0.03
(0.03)
0.13; 0.13; 0.25
(0.17)
1.35; 1.0; 1.6
(1.3)
18 0.03; 0.03; 0.02
(0.03)
0.16; 0.18; 0.28
(0.21)
1.2; 1.1; 1.4
(1.2)
21 0.02; 0.01; 0.03
(0.02)
0.15; 0.13; 0.23
(0.17)
1.3; 1.1; 1.0
(1.1)
24 0.02; 0.02; 0.03
(0.02)
0.12; 0.14; 0.14
(0.13)
1.2; 1.4; 1.4
(1.3)
27 0.03; 0.03; 0.04
(0.03)
0.19; 0.16; 0.35
(0.23)
1.9; 1.7; 1.7
(1.8)
Mean 0.02 0.15 1.4
After the 28 to 30 days, the hens were killed within three days, 16 to 24 hours after the last dose. Two hens in the low-dose group had gross abnormalities of the digestive and/or reproductive systems. Liver, composite breast and thigh muscle, and fat samples were composited by subgroup, frozen, homogenized with dry ice, and stored until analysis (Table 77).
Table 77. Residues of PBO in tissues of orally-dosed laying hens (Krautter et al., 1995c).
Dose PBO, mg/kg, and (mean) in
group Liver Muscle Fat
Low - <0.05; <0.05; <0.05
(<0.05)
0.25; 0.27; 0.38
(0.30)
Medium <0.05; <0.05; <0.05
(<0.05)
<0.05; 0.10; 0.12
(0.09)
0.86; 1.7; 1.2
(1.3)
High 0.12; 0.15; 0.13 0.67; 0.88; 0.66 13; 10; 13
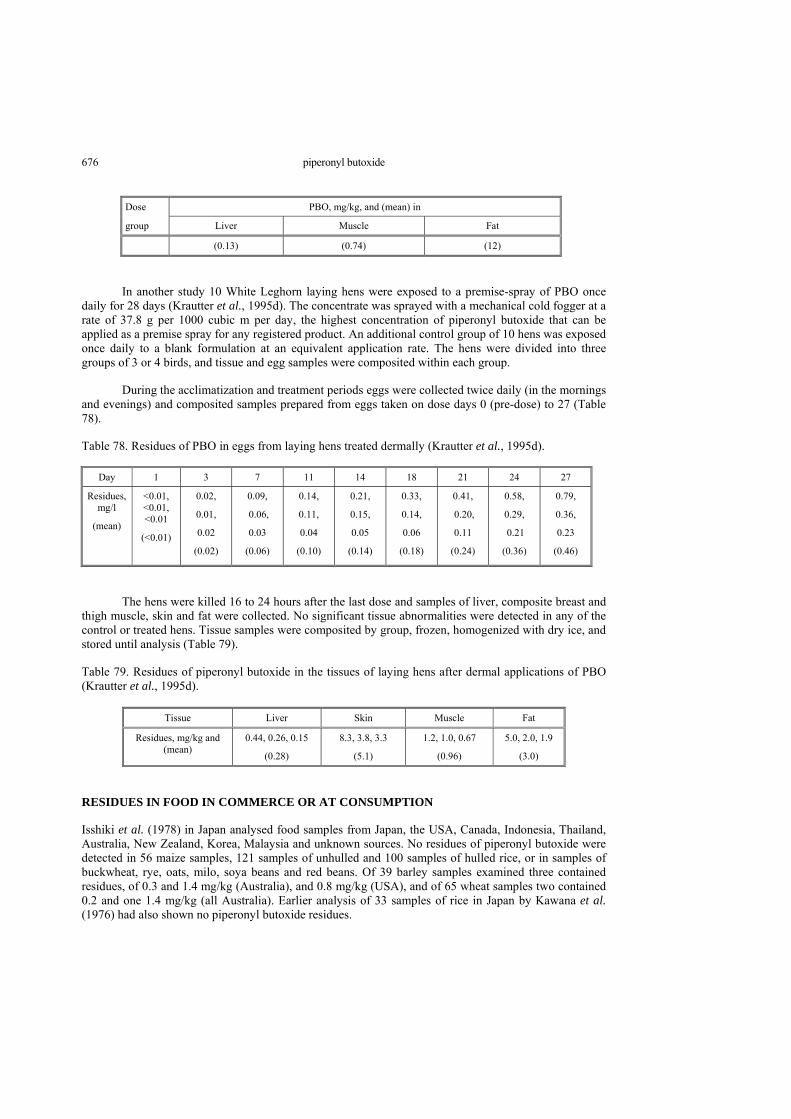
piperonyl butoxide 676
Dose PBO, mg/kg, and (mean) in
group Liver Muscle Fat
(0.13) (0.74) (12)
In another study 10 White Leghorn laying hens were exposed to a premise-spray of PBO once daily for 28 days (Krautter et al., 1995d). The concentrate was sprayed with a mechanical cold fogger at a rate of 37.8 g per 1000 cubic m per day, the highest concentration of piperonyl butoxide that can be applied as a premise spray for any registered product. An additional control group of 10 hens was exposed once daily to a blank formulation at an equivalent application rate. The hens were divided into three groups of 3 or 4 birds, and tissue and egg samples were composited within each group.
During the acclimatization and treatment periods eggs were collected twice daily (in the mornings and evenings) and composited samples prepared from eggs taken on dose days 0 (pre-dose) to 27 (Table 78).
Table 78. Residues of PBO in eggs from laying hens treated dermally (Krautter et al., 1995d).
Day 1 3 7 11 14 18 21 24 27
Residues, mg/l
(mean)
<0.01, <0.01, <0.01
(<0.01)
0.02,
0.01,
0.02
(0.02)
0.09,
0.06,
0.03
(0.06)
0.14,
0.11,
0.04
(0.10)
0.21,
0.15,
0.05
(0.14)
0.33,
0.14,
0.06
(0.18)
0.41,
0.20,
0.11
(0.24)
0.58,
0.29,
0.21
(0.36)
0.79,
0.36,
0.23
(0.46)
The hens were killed 16 to 24 hours after the last dose and samples of liver, composite breast and thigh muscle, skin and fat were collected. No significant tissue abnormalities were detected in any of the control or treated hens. Tissue samples were composited by group, frozen, homogenized with dry ice, and stored until analysis (Table 79).
Table 79. Residues of piperonyl butoxide in the tissues of laying hens after dermal applications of PBO (Krautter et al., 1995d).
Tissue Liver Skin Muscle Fat
Residues, mg/kg and (mean)
0.44, 0.26, 0.15
(0.28)
8.3, 3.8, 3.3
(5.1)
1.2, 1.0, 0.67
(0.96)
5.0, 2.0, 1.9
(3.0)
RESIDUES IN FOOD IN COMMERCE OR AT CONSUMPTION
Isshiki et al. (1978) in Japan analysed food samples from Japan, the USA, Canada, Indonesia, Thailand, Australia, New Zealand, Korea, Malaysia and unknown sources. No residues of piperonyl butoxide were detected in 56 maize samples, 121 samples of unhulled and 100 samples of hulled rice, or in samples of buckwheat, rye, oats, milo, soya beans and red beans. Of 39 barley samples examined three contained residues, of 0.3 and 1.4 mg/kg (Australia), and 0.8 mg/kg (USA), and of 65 wheat samples two contained 0.2 and one 1.4 mg/kg (all Australia). Earlier analysis of 33 samples of rice in Japan by Kawana et al. (1976) had also shown no piperonyl butoxide residues.

piperonyl butoxide 677
In 1997, a total of 1047 samples were analysed for residues of piperonyl butoxide in the USA (USDA 1999). 12 samples in all, one peach, eight sweet potato, one tomato, and two fresh winter squash, contained residues (Table 80).
Table 80. Residues of piperonyl butoxide in food in the USA, 1997.
Commodity Total no. of samples Samples with residues1 Range of residues, mg/kg
Peaches 115 1 0.122
Sweet potatoes 179 8 0.067 to 0.18
Tomatoes 108 1 0.0672
Winter squash, fresh 55 2 0.0672
1 Limit of detection 0.04 mg/kg 2 Residue detected in only 1 of duplicate subsamples
In 1998, the United States Food and Drug Administration (FDA) analysed 271 domestic samples and two imported samples for residues of piperonyl butoxide (USFDA 1999). Two domestic samples contained piperonyl butoxide: apples, with 0.041 mg/kg, and cherries, with 0.017 mg/kg. The samples of imported beans, peas, dried corn, corn paste, and lentils from Australia contained <0.01 mg/kg, and vegetables and vegetable products from Canada 0.02 mg/kg.
In 1999, the most recent year for which data are available from the USDA, 1599 samples were analysed (USDA, 2000), and 21 samples had detectable residues of piperonyl butoxide (Table 81).
Table 81. Residues of piperonyl butoxide in food in the USA, 1999.
Samples Commodity
No. % with residues
No. with residues
Range of residues, mg/kg
Limit of detection, mg/kg
Cucumbers 180 0 0 0.050
Spinach frozen 353 1.9 7 0.067-4.0 0.040-0.050
Strawberries, fresh 338 0.6 2 0.058-0.067 0.040-0.050
Strawberries, frozen 12 0 0 0.050
Sweet bell pepper 356 0.6 2 0.067 1 0.040-0.050
Tomatoes, canned 180 0 0 NA 0.040-0.050
Tomatoes, fresh 180 5.6 10 0.053-0.35 0.040-0.050
Total 1599 1.3 21 0.053-4.0 0.040-0.050
1 Residue detected in only 1 of duplicate subsamples.
The results of the National Residue Survey (NRS) in Australia on stored grains, 1993-1999, are shown in Table 82. All samples analysed complied with Australian MRLs.
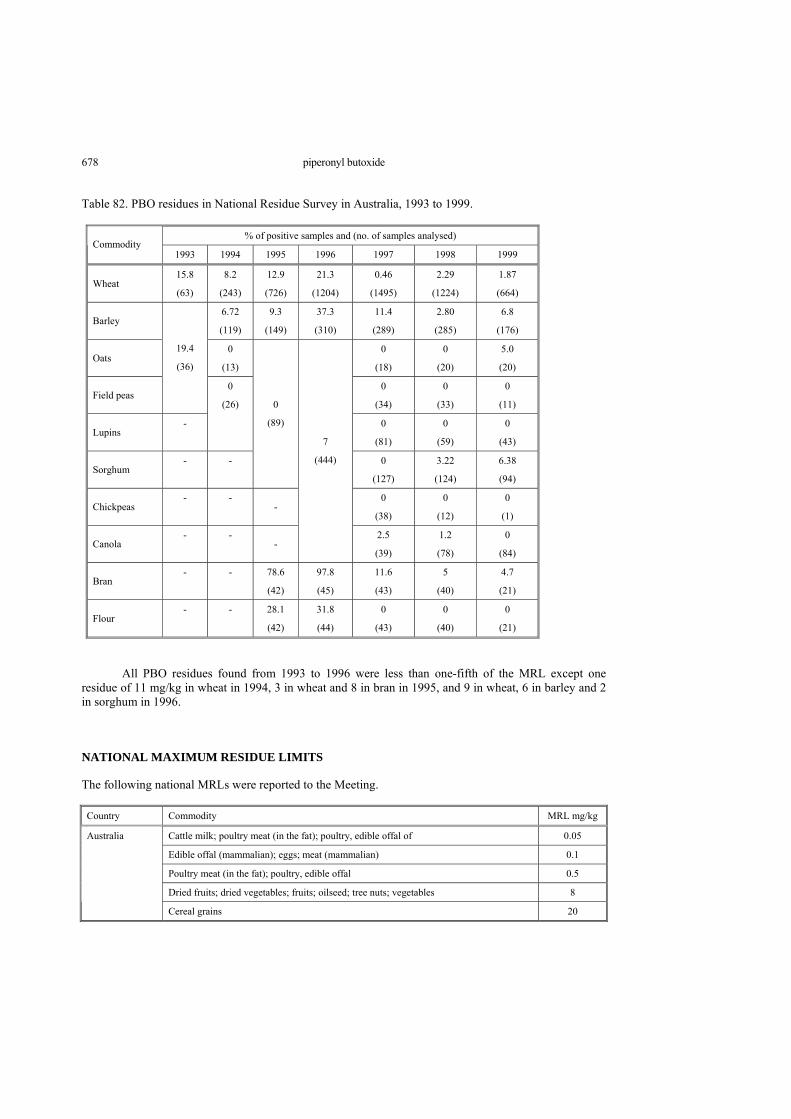
piperonyl butoxide 678
Table 82. PBO residues in National Residue Survey in Australia, 1993 to 1999.
% of positive samples and (no. of samples analysed) Commodity
1993 1994 1995 1996 1997 1998 1999
Wheat 15.8
(63)
8.2
(243)
12.9
(726)
21.3
(1204)
0.46
(1495)
2.29
(1224)
1.87
(664)
Barley 6.72
(119)
9.3
(149)
37.3
(310)
11.4
(289)
2.80
(285)
6.8
(176)
Oats 0
(13)
0
(18)
0
(20)
5.0
(20)
Field peas
19.4
(36)
0
(34)
0
(33)
0
(11)
Lupins -
0
(26)
0
(81)
0
(59)
0
(43)
Sorghum - -
0
(89)
0
(127)
3.22
(124)
6.38
(94)
Chickpeas - -
- 0
(38)
0
(12)
0
(1)
Canola - -
-
7
(444)
2.5
(39)
1.2
(78)
0
(84)
Bran - - 78.6
(42)
97.8
(45)
11.6
(43)
5
(40)
4.7
(21)
Flour - - 28.1
(42)
31.8
(44)
0
(43)
0
(40)
0
(21)
All PBO residues found from 1993 to 1996 were less than one-fifth of the MRL except one residue of 11 mg/kg in wheat in 1994, 3 in wheat and 8 in bran in 1995, and 9 in wheat, 6 in barley and 2 in sorghum in 1996.
NATIONAL MAXIMUM RESIDUE LIMITS
The following national MRLs were reported to the Meeting.
Country Commodity MRL mg/kg
Cattle milk; poultry meat (in the fat); poultry, edible offal of 0.05
Edible offal (mammalian); eggs; meat (mammalian) 0.1
Poultry meat (in the fat); poultry, edible offal 0.5
Dried fruits; dried vegetables; fruits; oilseed; tree nuts; vegetables 8
Australia
Cereal grains 20

piperonyl butoxide 679
Country Commodity MRL mg/kg
Bran, unprocessed, of cereal grain 40
Wheat germ 50
Cereals 10
Fruit; oilseed; roasted coffee; spices; tea; tea like products; vegetables 3
Austria
Other 0.5
Cereals 10
Nuts; oily seeds 8
Other fruits; vegetables 3
Belgium
Others 0*(0.05)
Dried codfish 1 Almonds; apples; beans; blackberries; blueberries; boysenberries; cherries; cocoa beans; copra; crab apples; currants; dewberries; figs; gooseberries; grapes; guavas; huckleberries; loganberries; mangoes; muskmelons; oranges; peaches; peanuts; pears; peas; pineapple; plums; raspberries; tomatoes; walnuts
8
Canada
Raw cereals 20
Pepper; potato; tomato; vegetables 0.1
Fruits (apple, cherry, pear) 1
Czech Republic
Cereals; grain 10
Finland Food products 10.00
France Cereals 10
Other foods of plant origin 1
Fruits; oilseeds; vegetables other than root and tuber veg. 3
Germany
Cereal 10
Corn; rape; sorghum; sugar beet; tobacco; unpeeled potato; 5
Dried fruit; fruit; peanut; vegetables 8
Hungary
Barley grain; corn; oat grain; rice (brown); rye grain; triticale; wheat grain 20
Iceland Bulbs; cane fruit; citrus fruit; cucurbits-edible skin; cucurbits-inedible skin; flowering Brassica; fruiting vegetables; fungi; grapes, table/wine; herbs; kohlrabi; leafy Brassica; legume vegetables; lettuce and similar; miscellaneous; oilseeds; other small fruit and berries; pome fruit; pulses; root and tuber vegetables; spinach; stem vegetables; stone fruit; strawberry; sweet corn; tree nuts; watercress; wild berries and wild fruit; witloof chicory
8
Fish/fish products 20
Italy Forage legumes; fruit; garden vegetables; potatoes; sugar beet; sunflower seeds; tobacco 3
Cereals in bulk; legumes in bulk 20
Dried fruits; dried vegetables; oilseeds, except peanut; peanut; tree nuts 8 Kenya
Cereal grains; dried fish 20
Almonds; chestnuts; dehydrated fruit; dehydrated vegetables; gingko nuts; peanuts; pecans; seedcrop plants; walnuts
8 Korea
African millet; barley; buckwheat; corn (maize); oats; other grains; rye 20
Malaysia Coffee; tea 3

piperonyl butoxide 680
Country Commodity MRL mg/kg
Cocoa beans; copra; fresh and dried fruits; leafy vegetables (dried); non-leafy vegetables (dried)
8
Cereal grains; milled products from raw grains 20
Tropical seed 1
Other fruit; vegetables 3
Nuts; oilseed 8
Cereals 10
Netherlands
Other 0*(0.05)
New Zealand Fruit; vegetables 8
Dry fish; grain seeds 20 Romania
Dry vegetables and fruits; nuts; peanuts 8
Meat and meat products 0.1
Dried fruits; dried vegetables; fruits; nuts; oilseeds; vegetables 8
Singapore
Cereal grains; dried fish 20
Rice 1
Fruit; fruit (dried); nuts; oil seeds; peanuts; vegetables; vegetables (dried) 8
Cereals in bulk 10
Cereals in bulk 20
Slovak Republic
Fish, dried 20
Cotton seed; fruit (dried); groundnuts; nuts (dried); other oil seeds; sunflower seeds; vegetables (dried)
10 South Africa
Cereal grains 20
Berries and small fruit; bulb vegetables; cacao beans; citrus fruit; cola beans; dried products; fresh aromatic herbs and leaf vegetables; cucurbits and peppers; fungi; green vegetables (fresh); hay and forage crops; hops; other fruits; other infusions; other products for consumption (tobacco, sugar beet, sugar cane, other); root and tuber vegetables; seed fruit; stone fruit; vegetables of the genus Brassica; young stalks
0.5
Coffee beans; fruit with or without shell; oilseeds; potatoes; spices; tea 5
Spain
Grains; legumes 15
Milk 0.02
Berries; unspecified foodstuffs; pip fruit; stone fruit; vegetables 0.5
Cereal products 2
Infusion plants; tea 3
Dried fruits; dried vegetables; oil seeds; shell fruit 8
Switzerland
Cereals 20
Sweden All kinds of cabbages and lettuces; citrus fruits; fruiting vegetables with edible peel; fruiting vegetables without edible peel; legumes, fresh; misc. fruits, e.g. banana, kiwifruit, mango, etc; mushrooms; nuts; onions, all kinds; pome fruits; root vegetables; small fruits and berries, both cultivated and wild; solanaceae vegetables; spices; stem vegetables; stone fruits; sucker maize; table grapes
8

piperonyl butoxide 681
Country Commodity MRL mg/kg
Cattle, fat; cattle, meat; cattle, meat by-products; goat, fat; goat, meat; goat, meat by-products; hog, fat; hog, meat; hog, meat by-products; horse, fat; horse, meat; horse, meat by-products; sheep, fat; sheep, meat; sheep, meat by-products
0.1
Milk fat 0.252
Potatoes; sweet potatoes 0.25
Eggs 1
USA1
Poultry, fat; poultry, meat; poultry, meat by-products 3
Almonds; apples; beans; blackberries; blueberries (huckleberries); boysenberries; buckwheat; cherries; cocoa beans; copra; cotton seed; crab apples; currants; dewberries; figs; flaxseed; gooseberries; grain sorghum; grapes; guavas; loganberries; mangoes; muskmelons; oats; oranges; peaches; peanuts (with shell removed); pears; peas; pineapples; plums; raspberries; tomatoes; walnuts
8
Barley; bird seed mixture; corn; rice; rye; wheat 20
Yugoslavia Fruit; processed cereals; vegetables 8
Cereals 20
1 Post-harvest uses except animal products 2 Reflecting negligible residues in milk
APPRAISAL NOTE As some incorrect figures were used in evaluating some of the data, the compound will be reconsidered at the 2002 Meeting.
This Appraisal is a reproduction of the “Residue and analytical aspects” section of the published report of the 2001 Meeting without amendment as the forthcoming re-evaluation is likely to result in changes to the current text. Piperonyl butoxide is a synergist used to prolong the effects of insecticides. The compound was reviewed by the 1992 JMPR for both residues and toxicology. As some critical data were not submitted, in particular studies on metabolism in plants and animals, and as the studies of stability and processing that were received related only to commercially stored wheat and wheat products, withdrawal of all the MRLs was recommended. At its Twenty-sixth Session (1994), the CCPR decided to withdraw the CXLs for cereal grains and for all other commodities (ALINORM 95/24), except for wheat, which was advanced to step 5/8. The 1995 JMPR established an ADI of 0–0.2 mg/kg bw per day.
At its Twenty-ninth Session, the CCPR scheduled piperonyl butoxide for periodic review at the 1999 JMPR, but at its Thirtieth Session it re-scheduled the review for 2000 (ALINORM 99/24 App.VII). The compound was reviewed by the current Meeting within the CCPR periodic review programme.
The Meeting received information from the manufacturer on physical and chemical properties, metabolism and environmental fate, analytical methods, stability in freezer storage, registered uses, the results of supervised trials on pre- and post-harvest uses, studies of processing, studies of animal transfer, residues in food in commerce and national residue limits. The Australian Government provided information on registered uses and national residue limits.

piperonyl butoxide 682
Metabolism Animals Three studies were conducted on metabolism in rats. In the first study, rats were dosed with [14C]piperonyl butoxide labelled in the glycol side-chain at a single dose of 50 or 500 mg/kg bw or repeated doses of 50 mg/kg bw per day. Seven days after treatment, 27–38% of the radiolabel had been excreted in urine, 55–66% in faeces and 0.89–1.5% in carcass and tissues, with no specific trends by sex or dose. The highest concentration of residue was found in the gastrointestinal tract (≤ 2.0 mg/kg). Piperonyl butoxide was detected only in urine from female rats dosed with 50 mg/kg bw, and eight metabolites were identified (representing 0.8–6.7% of the administered dose). Piperonyl butoxide can be metabolized at the propyl side-chain, the glycolate side-chain and the dioxole ring. A product of cyclization of the propyl and glycolate chain (lactone of 6-methoxy-1,3-benzodioxol-5-yl acetic acid) was the main compound in male rat urine (5.2–6.8%). In faeces, piperonyl butoxide accounted for 2.2–31% of the administered dose. Of the four metabolites detected, 4-{[[2-(hydroxymethoxy)ethoxy]ethoxy]methyl}-5-propyl-1,2-benzenediol, a catechol with an intact glycolate chain, was the main one, representing 9.4–26% of the administered dose.
In a second study, formulated [14C]piperonyl butoxide applied to discs of skin excised from rats showed a potential for adsorption through skin. After 24 h, 31% of the radiolabel was recovered in the skin homogenate. In a third study, rats received a single dose of ring-labelled piperonyl butoxide at a dose of 50 or 500 mg/kg bw. Most of the radiolabel was eliminated within the first 48 h after dosing, primarily in the faeces. During the 7 days of collection, 11–23% of the administered dose was found in urine and 70–85% in faeces, with a mean of 97% in the excreta of animals at the high dose and 98% in the excreta of those at the low dose. The carcass accounted for 0.28–0.44% of the administered dose. The metabolite profiles in excreta were similar at the two doses, piperonyl butoxide being metabolized at the dioxole ring to produce either a catechol or a substituted anisole moiety, and at the glycolate side-chain. At the glycolate side-chain, metabolism occurred by hydroxylation at the terminal carbon, oxidation to acid, followed by successive losses of the acetate moiety to form alcohols and acids. At least 15 metabolites were identified in excreta of both male and female rats, the main metabolite being 4-{[[2-(hydroxymethoxy)ethoxy]ethoxy}-methyl-5-propyl-1,2-benzenediol, representing 19% of the administered dose.
One goat received a dermal application of a 10% solution of [14C]piperonyl butoxide uniformly labelled in the benzene ring for 5 days, and two other goats were given feed containing 10 or 100 ppm for 5 days. The radiolabel was excreted rapidly by the orally dosed goats and more slowly by the dermally dosed goat. Within 22 h after administration of the last dose, most of the dose had been excreted in urine (73% and 79% after oral and 44% after dermal administration) and faeces (22% and 22% after oral and 8.9% after dermal administration). The amounts excreted in milk were similar throughout the study, with all dose regimens: 0.33% of the applied dose was found in milk of orally dosed goats and 0.53% in milk of the dermally dosed goat. Little radiolabel was found in muscle, and radiolabel was concentrated in the fat of dermally dosed animal (0.20 mg/kg) and in the liver of the orally dosed animals (0.36 and 2.0 mg/kg at the low and high doses, respectively). The same metabolite profiles were found in tissues and urine. Piperonyl butoxide was detected at > 0.02 mg/kg only in liver and fat from the animals given the high oral dose (0.12 and 0.13 mg/kg) and in fat from the dermally treated animal (0.16 mg/kg). It was metabolized primarily at the glycolate side-chain. Two metabolites were detected in milk, at concentrations of 0.001–0.016 mg/kg, which had a carboxylic acid moiety at C-2 or C-4 of the glycolate chain (1-(6-propyl-1,3-benzodioxol-5-yl)-2-oxabutan-4-oic acid and 2-{2-[(6-propyl-1,3-benzodioxol-5-yl)methoxy]ethoxy}acetic acid). In kidney, the metabolites were found at concentrations of 0.001–0.045 mg/kg, and the alcohol precursor of the carboxylic acid at C-4 (2-{2-[(6-propyl-1,3-benzodioxol-5-yl)methoxy]ethoxy}ethanol) was detected. In liver, a catechol of the latter metabolite (4-{[2-(hydroxymethoxy)ethoxy]methyl}-5-propyl-1,2-benzenediol) was detected at 0.14 mg/kg.

piperonyl butoxide 683
In two studies, laying hens received [14C]piperonyl butoxide uniformly labelled in the benzene ring for 5 consecutive days by dermal application at a dose of 14 mg/g under an occluded patch of 2.5 x 530 cm or in the feed at 10 or 100 ppm. Excreta from hens dosed dermally contained 59% of the applied radiolabel, and those from the hens dosed orally at the low and high doses contained 89% and 94%, respectively. In eggs, the concentration of radiolabel was higher in the white during the first 48 h (up to 0.63 mg/kg) and then concentrated in the yolk (≤ 1.7 mg/kg at the higher oral dose). In tissues, the least radiolabel was found in muscle (0.002–0.124 mg/k) and the most in fat (0.13–4.8 mg/kg). The concentrations in kidney and liver were 0.11–1.6 mg/kg. At the end of the study, piperonyl butoxide was found in eggs and tissues at 0.006–1.2 mg/kg (the latter in egg yolk from hens given the high oral dose), but not in liver or kidney from hens given the low oral dose. No metabolites were found in egg white or fat. Of the four metabolites found in egg yolk, liver, kidney and thigh muscle (1-(6-propyl-1,3-benzodioxol-5-yl)-2-oxabutan-4-oic acid, 2-{2-[(6-propyl-1,3-benzodioxol-5-yl)methoxy]ethoxy}ethanol, 2-{2-[(6-propyl-1,3-benzodioxol-5-yl)methoxy]ethoxy}acetic acid and 4-{[2-(hydroxymethoxy)ethoxy]methyl}-5-propyl-1,2-benzenediol), the last predominated, reaching 0.19 mg/kg in kidney from animals at the high oral dose.
Thus, in animals, piperonyl butoxide can be metabolized at the glycolate side-chain, through hydroxylation at the terminal carbon, oxidation to acid, followed by successive losses of the acetate moiety to form alcohols and acids, which can be conjugated; at the propyl side-chain, through cyclization with the hydrolysed glycolate chain; and through opening of the dioxole ring. The main residue in animal tissues, egg and milk is piperonyl butoxide. Plants The behavior of [14C]piperonyl butoxide labelled in the glycolate chain was studied after foliar application to cotton, potato and lettuce, leaf at the maximum rate of 0.56 kg ai/ha. Only minimal uptake or translocation of parent or degradates occurred in cotton and potato. The concentration of TRR found in potato tubers was 0.076% of that found in the leaves (617 mg/kg) 8 days after the fourth and last application. Cotton leaves collected 5 weeks after the fifth application had 142 mg/kg of total radiolabel. Hulls, lint and seed from cotton bolls collected 16 days after the sixth and last application contained 5, 0.4 and 0.3% of the radiolabel found in leaves. Piperonyl butoxide was not detected in potato tubers. The concentrations in cotton products ranged from 0.047 in lint to 1.23 mg/kg TRR in hulls, corresponding to 0.2–5% of that found in leaves (26.3 mg/g). In lettuce leaves, piperonyl butoxide was responsible for 51% of TRR on the day of the fifth application, but the percentage dropped to 24.4% after 10 days.
The aqueous fraction of the lettuce extract at day 0 (24.2% of TRR) contained at least three conjugated metabolites, two of which were identified, and a small amount of piperonyl butoxide (1.5% TRR). An aqueous extract from plants on day 10 contained five identified metabolites at concentrations of 0.2–2.0 mg/kg (0.9–7.6% TRR), consisting of conjugated alcohols formed after hydrolysis and truncation of the glycosate side-chain, with an intact dioxole ring.
Potato leaves contained at least seven degradates of high to moderate polarity, none of which
represented more than 3% TRR. About 82% of the TRR was extracted into organic solvent, and more than 30 degradates were present, each at < 0.02 mg/kg (4% TRR). The metabolite profile was different in potato leaves and tubers. The degradates in post-extraction solids of potato tubers were characterized as highly polar materials, probably the products of oxidation of one or both side-chains to benzyl alcohols or carboxylic acids and of opening of the dioxole ring to a catechol structure.
Cotton leaves contained 11 or more degradates soluble in organic solvents; the predominant one
(7.5% TRR) was similar to compounds found in lettuce, with one to three oxygen atoms remaining in the glycolate side-chain. The metabolites observed in the leaves were not observed in hulls, seeds or lint. In cotton seed, parent piperonyl butoxide was the only residue soluble in organic solvents. Mild acid hydrolysis of the post-extraction solids released almost 50% of the TRR, which presented two minor peaks (< 0.05
piperonyl butoxide 684
mg/kg) on the HPLC and a third, comprising 45% TRR (0.12 mg/kg), with characteristics similar to those in potato tubers. Cotton lint extract also contained a highly polar material that eluted at the HPLC solvent front (80% TRR, 0.19 mg/kg), which may have been the same dioxole ring-opened metabolite found in potato tubers and cotton seed, except that it was not bound. Cotton hulls contained five degradates soluble in organic solvents (0.1% TRR). The predominant degradate released by mild acid hydrolysis of the post-extraction solids was 1-(6-propyl-1,3-benzodioxol-5-yl)-2-oxabutan-4-oic acid (5.1% TRR).
Thus, piperonyl butoxide is metabolized in plants in a manner similar to that in animals, except that more polar metabolites are formed, which are fully degraded molecules resulting from hydrolysis of the glycolate side-chain, oxidation of the propyl side-chain and opening of the dioxole ring. The main residue found in lettuce, potato and cotton leaves was piperonyl butoxide, and minimal translocation occurred to potato tubers and cotton products. Environmental fate Soil A 2-mm layer of a sandy loam soil treated with [phenyl ring-14C]piperonyl butoxide at a rate equivalent to 10 kg ai/ha was exposed to artificial sunlight for ≤ 15 days (corresponding to 41 days of natural sunlight) or kept in the dark. The half-time in both soils was 1–3 days. Four degradates were identified, resulting from loss of the glycolate side-chain and oxidation of the resulting benzyl alcohol to the corresponding aldehyde and acid. The concentration of hydroxymethyl dihydrosafrole, a benzyl alcohol, reached a peak at day 3 (63 and 44% of the applied radiolabel in unirradiated and irradiated soil, respectively) and fell to 1.9 and 3.1% after 15 days. Hydroxymethyl dihydrosafrole was oxidized to an acid (6-propyl-,3-benzodioxol-5-carboxylic acid) which accumulated in unexposed soil after 15 days (49% of applied radiolabel). More decomposition and oxidation of the phenyl ring, observed as formation of CO2, occurred in irradiated soil (28%) than in the control dark soil (1.3%). In another experiment, piperonyl butoxide incubated in the dark for 242 days degraded with a half-time of approximately 14 days, in a pathway similar to that discussed above. Two additional metabolites with oxidized propyl side-chains were detected at 0.1–5.8% of the applied radiolabel during the incubation period. More than one-half the applied piperonyl butoxide had been mineralized to CO2 by 242 days.
Terrestrial dissipation of piperonyl butoxide was studied in soil treated at rate of 5.2 kg ai/ha in the
USA. The half-times were 4.3 in California and Georgia and 3.5 in Michigan. At 15 cm depth, the concentration of piperonyl butoxide after 14 days was 0.11–0.22 mg/kg and fell to < 0.10 mg/kg after 30 days of application. No parent compound was detected at any site in soil collected at depths below 15 cm.
Water–sediment systems A solution of 1 mg/L radiolabelled piperonyl butoxide was stable when incubated at 25oC in the dark for 30 days at pH 5, 7 or 9 in sterile aqueous buffers (97–100 % of the applied radiolabel recovered). In another experiment, a 10 mg/L solution of [14C]piperonyl butoxide (at pH 7) exposed to natural sunlight for 84 h degraded with a half-time of 8.4 h. Two main photoproducts were observed: hydroxymethyl dihydrosafrole (22% and 48% of the applied radiolabel after 4 and 84 h, respectively) and its aldehyde oxidation product (3,4-methylenedioxy-6-propylbenzyl aldehyde; 5.7–11% of the applied radiolabel). At least five other minor degradates were found, each representing < 10% of the applied radiolabel. Unexposed samples contained ≤ 2% of radiolabel associated with metabolites.
Radiolabelled piperonyl butoxide in a sandy loam soil water–sediment system incubated under aerobic conditions in the dark (10 mg/kg sediment or 3.2 µg/ml of water) degraded slowly, and 72% of the piperonyl butoxide remained after 30 days. Under anaerobic conditions, 91% of the parent compound was still present after 181 days. In both systems, it degraded to hydroxymethyl dihydrosafrole and further to 3,4-methylenedioxy-6-propylbenzyl aldehyde and acid, which represented ≤ 3.8% of the applied radiolabel.

piperonyl butoxide 685
The adsorption and desorption characteristics of piperonyl butoxide radiolabelled in the phenyl ring
were assessed in sand, clay loam, sandy loam and silt loam soils at a concentration of 0.4, 2, 3 or 4 mg/l. The systems were equilibrated for 24 h at 25 oC in darkness at a soil:solution ratio of 1:10. Piperonyl butoxide showed low to moderate mobility in sandy loam, clay loam and silt loam (Ka, 8.4, 12 and 30, respectively) and high mobility in sandy soil (Ka, 0.98). The Koc values ranged from 399 in sand to 830 in silt loam. A Kd value was not determined for sandy soil, but in the other soils it ranged from 8.2 to 42 after the first desorption step and from 6.3 to 95 after the second.
The leaching behaviour of [14C]piperonyl butoxide was investigated in sand, silt loam, sandy loam and clay loam soils after application at a rate equivalent to 5 kg ai/ha to the top of 30-cm columns (1 mg/column) and eluted with 0.01 mol/L calcium chloride. Piperonyl butoxide did not leach readily into loam soils (0.2–1.3% of the applied radiolabel in the leachate), but it was highly mobile in sandy soil (74% in the leachate), with a distribution coefficient of 0.42 ml/g. When the experiment was conducted with a sandy loam soil aged for 18 days and treated with [14C]piperonyl butoxide, 33% of the applied radiolabel remained in the top of the column (up to 5 cm) and 14% was recovered in the leachate. The three degradates found (hydroxymethyl dihydrosafrole, 3,4-methylenedioxy-6-propylbenzyl aldehyde and the acid) were more mobile than the parent compound, being detected at 20–25 cm of the column. An extract of the aged soil contained 45% of the applied radiolabel as piperonyl butoxide.
Methods of analysis One method for determining residues of piperonyl butoxide and its metabolites in raw and processed plant commodities involves extraction with acetonitrile, partition of piperonyl butoxide into petroleum ether and analysis by HPLC with fluorescence detection. The more polar metabolites remain in the aqueous phase, which is subjected to mild acid hydrolysis to convert the metabolites quantitatively to hydroxymethyl dihydrosafrole, which is extracted and analysed by HPLC with fluorescence detection. The LOQ for piperonyl butoxide and for total metabolites was 0.10 mg/kg, with an average recovery of 91–94%. In grapes and cranberries, < 70% of metabolites were recovered. In another method, the extract containing piperonyl butoxide was brominated and cleaned up by liquid–solid partition, and the eluate was analysed by GC with ECD. The LOQ for piperonyl butoxide was 0.10 mg/kg, and average recovery was 56% in beans to 67% in peanuts. Other solvents can be used to extract piperonyl butoxide from wheat and the milled fraction, including methanol, hexane and ethyl acetate.
In the method used to determine residues of piperonyl butoxide in milk, eggs and tissues, samples were extracted with acetonitrile, the fat was removed, and piperonyl butoxide was partitioned into hexane. The hexane solution was cleaned up on silica gel with solid-phase extraction, and piperonyl butoxide was determined by GC–MS. The LOQ was validated at 0.05 mg/kg for tissues (liver, kidney, muscle and fat), with recovery of 70–108%. The recovery at 0.01 and 0.05 mg/kg from milk was 67–120%, and that from eggs was 71–104%. Stability of residues in stored analytical samples Piperonyl butoxide at 1.0 mg/kg was stable in samples stored frozen in the dark for up to 12 months. In potato tubers and chips, leaf lettuce, broccoli, cucumber, grapes, orange fruit, molasses, juice and dry pulp, tomato fruit, juice, puree, dry and wet pomace, succulent beans pod and vine, cotton seed, oil and soapstock and beans, 70–108% of the added piperonyl butoxide remained after a 12-month storage. In potato granules, potato wet peel and cotton meal, these values varied from 53 to 68%. When piperonyl butoxide was added to sweets, meat, bread, sugar and peanuts at a concentration of 0.2 mg/kg, 50–69% remained after 12 months of frozen storage.
piperonyl butoxide 686
Definition of the residue On the day of application, piperonyl butoxide accounted for 51% of the TRR in lettuce, two metabolites being formed in approximately equal amounts and accounting for 24% of the radiolabel. After 10 days, the concentration of piperonyl butoxide had decreased by half, and at least 10 metabolites were formed, each representing < 10% of the TRR. Piperonyl butoxide was not translocated to potato tubers or cotton products when applied to the leaves of these plants. Some highly polar material was found in cotton seed and in lint, representing 44 and 80% TRR, respectively. Although these metabolites were not identified, they were highly degraded compounds and, owing to their high polarity, would probably not accumulate in animals if ingested. Although no studies of metabolism in stored plant commodities were conducted, the Meeting agreed that piperonyl butoxide is degraded mainly by photolysis and considered that such studies were not necessary, as the residues are very stable in cereal grains in storage. No major metabolite was found in edible animal commodities. The main compound in both plant and animal commodities is piperonyl butoxide.
The Meeting agreed that the residue definition for compliance with MRL and for estimating dietary intake in plant and animal commodities continues to be piperonyl butoxide.
Piperonyl butoxide has a log Pow of 4.6 and is concentrated in the fat of animals dosed orally and dermally. The Meeting concluded that piperonyl butoxide is fat-soluble. Results of supervised trials Pre-harvest trials were conducted in crops in various regions of the USA between 1992 and 1996, with 10–12 applications of pyrethrins containing piperonyl butoxide, according to maximum GAP for piperonyl butoxide (0.56 kg/ha; no PHI). Citrus Seven supervised trials were conducted on citrus. The concentrations of residues of piperonyl butoxide in lemon were 3.1 and 1.7 mg/kg, those in oranges were 0.90, 0.98 and 1.0 mg/kg and those in grapefruit were 0.49 and 1.4 mg/kg. The concentrations in citrus were, in ranked order (median underlined): 0.49, 0.90, 0.98, 1.0, 1.4, 1.7 and 3.1 mg/kg. Although there were fewer trials on citrus fruits than would be required for a major crop, piperonyl butoxide is used to only a minor extent as a synergist in pre-harvest treatment in pyrethrin formulations. Recommendations for pyrethrins in citrus were made by the 2000 JMPR on the basis of trials conducted with a pyrethrin–piperonyl butoxide formulation. Therefore, the Meeting agreed to recommend a maximum residue level of 5 mg/kg and a STMR of 1.0 mg/kg for piperonyl butoxide in citrus. Berries and small fruits Seven supervised trials were conducted on berries and small fruits. The concentrations of residues of piperonyl butoxide were 2.8 mg/kg in blackberry, 5.0 and 5.0 mg/kg in blueberry, 4.2 mg/kg in cranberry, 9.6 mg/kg in grapes and 3.0 and 3.1 in strawberry. As insufficient data from trials performed according to GAP were submitted, the Meeting agreed not recommend a maximum residue level for piperonyl butoxide in berries, strawberry and grapes. There is no current recommendation for pyrethrins in berries and small fruits. Brassica vegetables Three supervised trials were conducted on broccoli, giving rise to concentrations of residues of piperonyl butoxide of 0.69, 1.7 and 2.3 mg/kg. In three trials conducted on cabbage, the concentrations were 0.09, 0.23 and 0.46 mg/kg, while those in cabbage with wrapper leaves were 1.1, 6.4 and 2.7 mg/kg. As insufficient data from trials performed according to GAP were submitted, the Meeting agreed not recommend a maximum

piperonyl butoxide 687
residue level for piperonyl butoxide in broccoli and cabbage. There is no current recommendation for pyrethrins in broccoli and cabbage. Cucurbits Eight supervised trials were conducted on cucurbits. The concentrations of residues of piperonyl butoxide were 0.83 and 0.61 mg/kg in cantaloupe, 0.07 and 0.68 mg/kg in cucumber and 0.10, 0.20, 0.25 and 0.27 mg/kg in squash. The Meeting agreed that the data on residues in cucurbits could be combined as 0.07, 0.10, 0.20, 0.25, 0.27 0.61, 0.68 and 0.83 mg/kg, and estimated a maximum residue level of 1 mg/kg and a STMR of 0.26 mg/kg for piperonyl butoxide in cucurbits. Peppers and tomato In three supervised trials conducted on peppers, the concentrations of residues of piperonyl butoxide were 0.39, 0.59 and 1.4 mg/kg. In three trials conducted in tomato, the values were 0.37, 0.76 and 1.0 mg/kg. Although there were fewer trials on peppers and tomato than required for these crops, the Meeting agreed to consider the data sufficient to recommend maximum residue levels, for the reasons outlined for citrus fruits. The data for peppers and tomato were combined, in ranked order, as 0.37, 0.39, 0.59, 0.76, 1.0 and 1.4 mg/kg. The Meeting estimated a maximum residue level of 2 mg/kg and a STMR of 0.675 mg/kg for piperonyl butoxide in peppers and tomato. Leafy vegetables Eleven supervised trials were conducted on leafy vegetables. In lettuce, head, the concentrations of residues of piperonyl butoxide were 0.54 and 0.35 mg/kg ; when the wrapper leaves were attached, the values were 5.0 and 3.6 mg/kg. Lettuce, leaf contained concentrations of 19 and 23 mg/kg, mustard greens contained 37 and 38 mg/kg, radish leaves (crowns with leaves) contained 38 mg/kg and spinach contained 32 and 39 mg/kg. The concentrations in mustard greens, radish leaves and spinach are within the same range and provide mutual support. They were, in ranked order: 32, 37, 38 (2) and 39 mg/kg. The Meeting recommended a maximum residue level of 50 mg/kg and a STMR of 38 mg/kg for piperonyl butoxide in mustard greens, radish leaves, leaf lettuce and spinach. Legume vegetables Two supervised trials were conducted on succulent beans, giving concentrations of piperonyl butoxide in pods of 0.34 and 2.2 mg/kg: In two trials conducted in succulent peas, the values were 2.2 and 5.5 mg/kg. As insufficient data from trials performed according to GAP were submitted, the Meeting agreed not recommend a maximum residue level for piperonyl butoxide in succulent beans and peas. Root and tuber vegetables In one supervised trial conducted on carrot, the concentration of residues of piperonyl butoxide in roots was 1.1 mg/kg. Three trials conducted on potato gave values in tubers of < 0.10 (2) and 0.11 mg/kg, one trial on radish gave a value in roots of 0.34 mg/kg and two trials conducted on sugar beet gave concentrations in roots of < 0.10 mg/kg. In a study of metabolism conducted with labelled piperonyl butoxide on potato at maximum GAP, no residues were detected in tubers. Although there were fewer trials on root and tuber vegetables than would be required for this group, the Meeting agreed to consider the data sufficient to recommend residue levels, for the reasons outlined for citrus fruits. As only one trial was conducted on carrots, giving a much higher value than for the other commodities in the group, the Meeting agreed to combine the values for all commodities except carrots. Those are, in ranked order: < 0.10 (3), 0.11 and 0.34 mg/kg. The Meeting estimated a maximum residue level of 0.5 mg/kg and a STMR of 0.10 mg/kg for piperonyl butoxide in root and tuber vegetables, except carrots.

piperonyl butoxide 688
Pulses In two supervised field trials on dry beans and two on dry peas at GAP rate, the concentrations of piperonyl butoxide residues in seed were 0.10 and 0.11 mg/kg in beans and 0.27 and 0.57 mg/kg in peas. As insufficient data from trials performed according to GAP were submitted, the Meeting agreed not recommend a maximum residue level for piperonyl butoxide in pulses due to pre-harvest use. Celery In two supervised trials on celery, the concentrations of residues of piperonyl butoxide were 17 and 23 mg/kg in untrimmed leaf stalk and 0.98 and 2.3 mg/kg in the petiole. As insufficient data from trials performed according to GAP were submitted, the Meeting agreed not recommend a maximum residue level for piperonyl butoxide in celery. Mustard seed One supervised trial was conducted on mustard seed, which gave a concentration of piperonyl butoxide residues of 2.1 mg/kg. As insufficient data from trials performed according to GAP were submitted, the Meeting agreed not recommend a maximum residue level for piperonyl butoxide in mustard seeds. Cotton seed In five supervised trials conducted on cotton seed, the concentrations of residues of piperonyl butoxide were < 0.10 (2), 0.10 (2) and 0.21 mg/kg. As insufficient data from trials performed according to GAP were submitted, the Meeting agreed not recommend a maximum residue level for piperonyl butoxide in cotton seed. There is no current recommendation for pyrethrins in cotton seed. Animal feed In four trials conducted on succulent or dry beans, the concentrations of residues in vine were 16 (2), 26 and 28 mg/kg. In hay samples dried for 2–6 days in the open air, the values were 11, 14, 21 and 42 mg/kg, and those in forage were 14 and 25 mg/kg. In four trials on succulent or dry pea, the concentrations in vine were 26, 29, 47 and 96 mg/kg. In hay samples dried for up to 14 days in the field or in a greenhouse, the values were 3.7, 38, 48 and 153 mg/kg, and those in forage were 31 and 42 mg/kg.
The Meeting agreed that the data on residues in bean vines represent the same population as those for pea vines and could be used to support a recommendation for pea vines. The concentrations were, in ranked order: 16 (2), 26 (2), 28, 29, 47 and 96 mg/kg. When the median (27 mg/kg) and the maximum values (96 mg/kg) were corrected for moisture content (75%, FAO Manual, p. 125), the values were 108 mg/kg and 384 mg/kg, respectively, in dry matter. The Meeting recommended a maximum residue level of 400 mg/kg and a STMR of 108 mg/kg for piperonyl butoxide in pea vines, green (dry basis).
The Meeting agreed that the data on residues in bean and pea hay represented a single population and
could be combined, in ranked order, as 3.8, 11, 14, 21, 38, 42, 48 and 153 mg/kg. The median (17.5 mg/kg) and the maximum (153 mg/kg) values were corrected for the moisture content of pea hay (12%, FAO Manual, p. 125), and became 19.9 and 174 mg/kg, respectively, on a dried base. The Meeting estimated a maximum residue level of 200 mg/kg and a STMR of 19.9 mg/kg for piperonyl butoxide in bean hay and pea hay or fodder.
As insufficient data from trials performed according to GAP were submitted, the Meeting agreed not
recommend a maximum residue level for piperonyl butoxide in pea and bean forage.
piperonyl butoxide 689
In five supervised trials conducted on cotton forage, the concentrations of residues of piperonyl
butoxide were 20, 28, 30 (2) and 37 mg/kg. As insufficient data from trials performed according to GAP were submitted, the Meeting agreed not recommend a maximum residue level for piperonyl butoxide in cotton forage.
In two trials conducted with sugar beet leaf, the concentrations of residues of piperonyl butoxide in
crowns with leaves attached were 37 and 12 mg/kg. As insufficient data from trials performed according to GAP were submitted, the Meeting agreed not recommend a maximum residue level for piperonyl butoxide in sugar beet leaves.
Post-harvest treatment Trials were conducted in which navy beans in cloth bags underwent treatment with up to 10 applications of piperonyl butoxide at the label rate in a warehouse by a space spray (0.25 kg ai/1000 m3) and a contact spray (0.3 kg ai/100 m2). One bag was collected for analysis after each application, for a total of 10 bags from each treatment. The concentrations of residues were < 0.05 (2) (LOD), < 0.10 (3) (LOQ), 0.10, 0.13 (2), 0.16 and 0.17 mg/kg in samples collected after the space spray treatment and < 0.05 (10) mg/kg in samples after the contact spray treatment. The concentrations of residues after post-harvest use were, in ranked order, < 0.05 (12), < 0.10 (3), 0.10, 0.13 (2), 0.16 and 0.17 mg/kg.
The Meeting estimated a maximum residue level of 0.2 mg/kg, an STMR value of 0.05 and a highest residue of 0.17 mg/kg for piperonyl butoxide in pulses after post-harvest use.
Trials were conducted with harvested peanuts in cloth bags treated in a warehouse with 10 applications at the label rate by a space spray (0.25 kg ai/1000 m3) and a contact spray (0.3 kg ai/100 m2). One bag was collected for analysis after each application, for a total of 10 bags from each treatment. The concentrations of residues in samples collected after each space spray treatment were < 0.10 (3), 0.20, 0.24, 0.28, 0.29, 0.36 and 0.54 (2) mg/kg, while those after contact spray treatment were < 0.05 (6) and < 0.10 (4) mg/kg. The concentrations after post-harvest use were, in ranked order: < 0.05 (6), < 0.10 (7), 0.20, 0.24, 0.28, 0.29, 0.36 and 0.54 (2) mg/kg.
The Meeting estimated a maximum residue level of 1 mg/kg and an STMR value of 0.10 mg/kg for piperonyl butoxide in peanuts after post-harvest treatment.
Trials were conducted with prunes treated in a warehouse with 10 applications at the label rate by a
space spray (0.25 kg ai/1000 m3) or a contact spray (0.3 kg ai/100 m2). One bag was collected for analysis after each application, for a total of 10 bags from each treatment. The concentrations of residues in samples collected after each space spray treatment were < 0.05 (5), < 0.10 (4) and 0.11 mg/kg, while those after contact spray were < 0.05 (6) and < 0.10 (4) mg/kg. The concentrations of residues after post-harvest use were, in ranked order, < 0.05 (11), < 0.10 (8) and 0.11 mg/kg.
The Meeting agreed that the values for residues in prunes could be extended, and estimated a maximum residue level of 0.2 mg/kg and an STMR value of 0.05 mg/kg for piperonyl butoxide in dried fruits after post-harvest treatment.
Post-harvest trials were conducted on cacao beans, raisins and wheat flour in Germany during 1993–
94 with eight space spray applications of pyrethrum–piperonyl butoxide formulation containing piperonyl butoxide at 21.3 g/1000 m3 at 14-day intervals, or two applications of piperonyl butoxide at 128 g/1000 m3. Samples were taken on days 0, 14, 30, 60 and 90 after treatment. In Germany, GAP for space spray treatment of stored products consists of 0.375–132 g ai/1000 m3.
piperonyl butoxide 690
Two trials were conducted on cacao beans in jute sacks. At the lower rate, the concentrations of residues in beans 0 and 14 days after the last application were 0.21 and 0.25 mg/kg and then fell to 0.08 mg/kg at day 90. At the higher rate, the concentrations varied from 0.52 mg/kg on day 0 to 0.75 mg/kg on day 30. In one trial conducted at the higher rate (128 g ai/1000 m3) on raisins in stored polythene and cardboard, the concentration was < 0.01 mg/kg at all sampling times. In one trial on wheat flour at the same rate, the concentrations ranged from 0.12 mg/kg at day 14 to 0.46 mg/kg at day 60.
As insufficient data from trials performed according to GAP were submitted, the Meeting agreed not to recommend a maximum residue level for piperonyl butoxide in cacao beans or wheat flour after post-harvest treatment. The maximum residue level, STMR value and highest residue for raisins are covered by the recommendations for dried fruits after post-harvest treatment.
Two trials were conducted on wheat in Germany. The concentrations in grain after the lower rate of
treatment (21.3 g/1000 m3) varied from 0.71 mg/kg after 30 days to 2.5 mg/kg on day 0. Samples taken after the higher rate of treatment (128 g/1000 m3) contained concentrations of 1.3 mg/kg on day 30 and 2.2 mg/kg on day 0.
In the USA, there are two further approved post-harvest uses for piperonyl butoxide as a pyrethrin
formulation on stored grains: direct treatment of grain as it is carried to a silo (11.1–26 mg ai/kg of grain) or application to grain in storage (0.12–0.24 kg ai/100 m2). A series of trials was conducted in the USA in 1959 with various formulations of piperonyl butoxide applied to wheat at various rates as it was transferred to the bins. Up to five bins were treated at each application rate, and samples were taken 3–25 months after application. In three trials conducted at maximum GAP, the highest concentrations of piperonyl butoxide residues in all bins were 12, 17 and 25 mg/kg. One trial at lower rate gave similar results (maximum, 12 mg/kg), and the highest value in one trial conducted at a rate below GAP was 5.2 mg/kg.
Although trials were conducted on wheat in the USA according to GAP in 1959–61, full reports were
not provided. The concentrations of piperonyl butoxide residues during storage for up to 12 months ranged from 4.1 to 13 mg/kg.
In Australia, piperonyl butoxide can be used on grain in various insecticide formulations for post-harvest treatment at a rate of 2.4–8.5 mg ai/kg of grain. In a series of trials conducted in 1978–79, treated wheat was sampled after up to 9 months of storage. In nine trials conducted at maximum GAP, the highest concentrations during sampling were 3.4, 8.0, 7.1, 7.2, 6.2, 9.1, 7.5 (2) and 8.0 mg/kg. In 10 trials conducted at a lower GAP rate or at a higher rate, the concentrations ranged from 2.4 to 16 mg/kg.
In 31 trials conducted in Australia in 1981–82, wheat treated with piperonyl butoxide at 10 mg/kg of
grain in various formulations was sampled up to 9 months after treatment. The highest concentrations of residues found were 5.7 (2), 7.9 (3), 4.2 (2), 7.3 (3), 5.3, 5.0, 7.0 (2), 4.5, 7.8 (2), 5.2, 4.8, 7.5, 8.1, 8.2, 10 (3), 8.6, 9.2, 11, 8.0, 9.4 and 30 mg/kg. In four further trials conducted under the same conditions, treated wheat was sampled after 10–31 months of storage. The highest concentrations during this period were 7.3, 6.7 and 5.9 (2) mg/kg.
In a series of 13 trials conducted in Australia in 1979–80, wheat grain treated with various piperonyl
butoxide formulations at 10 mg ai/kg of grain were sampled after up to 9 months of storage. The highest concentrations were 9.7 (2), 8.6, 7.7, 8.7, 8.9, 9.3, 9.5, 10 (2), 7.3, 8.4 and 14 mg/kg. In two other trials conducted at lower GAP the concentrations were 4.5 and 2.3 mg/kg.
In three trials conducted in Australia in 1998 at 8 mg ai/kg of grain in various formulations, the
highest concentrations of piperonyl butoxide residues found during a 9-month storage period were 13, 16 and 5.4 mg/kg. In a trial conducted at a lower GAP, the concentration was 1.7 mg/kg. Although another 27 trials

piperonyl butoxide 691
were conducted between 1990 and 1998, at rates of 4–10.7 mg ai/kg of grain, full reports of the studies were not provided. The highest concentrations found in each trial ranged from 1.5 to 8.9 mg/kg.
In Italy, piperonyl butoxide can be used after harvest in various formulations at a rate of 2.3–12.5 mg ai/kg of grain. In 18 trials conducted at various locations in Italy at a rate of 2.5, 5.0 or 10 mg/kg, samples were taken after up to 12 months of storage. The concentrations of residues in the trial at the highest GAP rate were 13, 3.9, 5.2, 4.2, 3.9 and 4.5 mg/kg. The highest concentrations in trials conducted at lower rates were 0.37–8.7 mg/kg.
Six post-harvest trials were conducted on barley in Australia in 1992–96 according to maximum GAP (6.33–8 mg ai/kg of grain) in three formulations. The grain was stored for up to 6.5 months. The highest concentrations of piperonyl butoxide residues were, in ranked order, 0.9, 6.0, 6.4, 6.5, 6.6 and 7.2 mg/kg. One trial at a lower rate gave values within the same range, but a full report of the study was not provided.
In 30 trials on maize in the USA conducted in 1952–57 with dust and spray formulation at rates of
10.4–29.4 mg ai/kg of grain, samples were taken after 1–50 months of storage. The highest concentrations of piperonyl butoxide found during storage in samples from the 10 trials conducted according to maximum GAP were 12, 11, 4.0, 8.0, 7.0, 8.0, 25, 6.0, 9.0 and 13 mg/kg, while those in trials conducted at lower GAP rates were 1–21 mg/kg. In another study, for which a full report was not provided, conducted at maximum GAP, the highest concentration found during 12 months of storage was 10 mg/kg.
Trials were conducted in maize with three concentrations of piperonyl butoxide applied by surface
spray (49.7–149 g ai/m2) at various frequencies of application. Three months after treatment, 25–41% of the total applied remained in the maize; after 6 months, this value had dropped to 11–13%.
In Italy, two trials were conducted on maize at the lowest and highest GAP rates, and samples were taken for analysis after up to 6 months of storage. The highest concentrations of piperonyl butoxide found were 1.3 mg/kg at the lowest GAP rate and 4.1 mg/kg at the highest rate.
In two trials conducted on sorghum in Australia at maximum GAP, the concentrations of piperonyl butoxide residues on day 0 were 2.9 and 10 mg/kg; these were reduced after 3 months of storage. Two trials at lower and higher rates gave highest values of 0.50 and 20 mg/kg. In another trial conducted at maximum GAP, the highest concentration found during a 6-month storage period was 9.7 mg/kg. A full report of this trial was not provided.
GAP for post-harvest use of piperonyl butoxide on cereal grains is 10 mg/kg of grain in Australia, ≤ 12.5 mg/kg of grain in Italy and ≤ 26 mg/kg of grain in the USA. The Meeting agreed that the estimates should be derived from the critical GAP, that of the USA. The concentrations of residues in trials conducted according to GAP in the USA (10 trials on wheat, three on maize) were, in ranked order: 4.0, 6.0, 7.0, 8.0 (2), 11, 12 (2), 8.0, 9.0, 13 and 25 mg/kg. The Meeting estimated a maximum residue level of 30 mg/kg and a STMR value of 11 mg/kg for piperonyl butoxide in cereal grains after post-harvest treatment.
Fate of residues during processing A series of studies was conducted on processing of orange, grapes, tomato, beans, potato, sugar beets and cotton that had been treated with at least 10 applications at five times the GAP rate. Samples were collected on the day of the last application, except for cotton, samples of which were collected after 14 days. Bulk samples were processed into the required products by procedures that simulated commercial practice.
Three orange plots were treated and one bulk sample consisting of one-third of each treated plot was
processed. The concentration of piperonyl butoxide residues in orange was 9.4 mg/kg. The residues concentrated in orange dry pulp and orange oil, with processing factors of 5.7 and 15. In orange molasses, the
piperonyl butoxide 692
concentration of residues was reduced by a processing factor of 0.53, and no residue was found in orange juice (processing factor, < 0.01). On the basis of the recommended maximum residue level of 5 mg/kg and the STMR value of 1.0 mg/kg, the Meeting estimated an STMR-P value of 5.7 mg/kg and a maximum residue level of 0.05 mg/kg in orange dried pulp and an STMR-P value of 0.01 mg/kg in orange juice.
Three tomato plots were treated, and one bulk sample consisting of one-third of each treated plot was processed. The concentration of residues in tomato was 8.5 mg/kg, and was found in wet and dry pomace, with processing factors of 5.9 and 34, respectively. The concentrations of residues in tomato purée and juice were reduced, with processing factors of 0.33 and 0.15, respectively. On the basis of the recommended maximum residue level of 2 mg/kg and the STMR value of 0.675 mg/kg in tomato, the Meeting estimated a maximum residue level of 0.3 mg/kg and an STMR-P value of 0.10 mg/kg for tomato juice and a STMR-P of 0.223 mg/kg for tomato purée.
Three grape plots were treated, and samples were collected for processing. The concentrations of residues in fruit were 14 (2) and 11 mg/kg. In all samples, the concentration increased in raisin, raisin waste and wet and dry grape pomace, giving average processing factors of 1.1, 2.3, 2.1 and 5.5, respectively. The concentration in juice decreased to 0.22–0.24 mg/kg, giving a processing factor of 0.02. As no STMR value was recommended for grapes, the Meeting could not estimate a STMR-P value for grape products.
Samples from three treated potato plots contained no detectable residues (< 0.10 mg/kg), and no
residues were found in granules or chips. The residues were concentrated in wet potato peel, giving an average processing factor > 1.5. On the basis of the STMR value of 0.10 mg/kg recommended for root and tuber vegetables, the Meeting estimated a STMR-P value for wet potato peel of 0.15 mg/kg.
The concentration of residues in sugar beet root in one treated plot was 0.08 mg/kg. The concentration increased after processing to dry pulp, with a processing factor of 3.44. No residues were detected in sugar or molasses (< 0.10 mg/kg), giving an estimated processing factor for both commodities of < 1.2.
In one treated plot of succulent bean, the concentration of residues in pods was 8.0 mg/kg. The residues concentrated in cannery waste, with a processing factor of 6.4.
Three treated cotton plots had concentrations of residues in seed of 0.10 mg/kg (3). Each sample
was processed, and the residues were found mainly in hulls with an average processing factor of 1.1, in crude oil with an average processing factor of 6.3, in refined oil with an average processing factor of 20 and in soapstock with an average processing factor of 3.8. Residues were not detected in cotton meal (< 0.10 mg/kg). As no STMR value was recommended for cotton, the Meeting could not estimate a STMR-P value for cotton products.
Various studies were conducted on processing of wheat at various locations. In three studies
conducted in Australia, wheat treated with piperonyl butoxide at 8.0 mg ai/kg of grain was processed into bread and bran. The concentrations of residues in grain were 16 and 14 (2) mg/kg and residues were found mainly in bran, giving processing factors of 2.85, 1.5 and 2 (average, 2.1); the values were reduced in bread, with average processing factors of 0.015 and 0.03 (average, 0.225). No residues were detected in one bread sample. No information of the processing or analytical method was provided.
In a series of 12 studies in Australia, wheat was treated at a 15 mg ai/kg of grain, stored for 3 months
and processed to bran and flour. The concentration of residues decreased after cleaning in flour and short and low-grade middlings, with average processing factors of 0.82, 0.42, 0.56 and 0.56, respectively. In bran, the concentration increased, with an average processing factor of 1.7. A full report of the studies was not provided.
piperonyl butoxide 693
Eighteen processing studies were conducted in Italy with wheat treated at various rates and stored for 45 or 180 days. The processing factors of cleaned, decorticated grain ranged from 0.27 to > 1.8 (average, 0.549) and from < 0.27 to 1.33 (average, 0.506), respectively. On average, the concentrations of residues in bran increase, with an average processing factor of 1.3 (< 0.02–3.1). In all studies, the concentrations of residues in flour decreased, with an average processing factor of 0.285, ranging from < 0.24 to 0.78.
In one study conducted in Australia, treated wheat was processed to bran, pollard, germ, gluten,
flour, wholemeal bread and white bread at various extraction rates. Piperonyl butoxide residues were determined 1 month after processing. The residues concentrated in bran with processing factors of 4.2 and 4.3, in pollard with a processing factor of 2.7, in germ with a processing factor of 2.6 and in gluten with a processing factor of 1.8. The concentration decreased in flour with processing factors of 0.30 and 0.23, in wholemeal bread with a processing factor of 0.51 and in white bread with processing factors of 0.19 and 0.20.
In one study conducted in Australia, wheat treated with piperonyl butoxide at 8 mg ai/kg of grain was stored for 1, 3 or 6 months and processed to bran, pollard, germ, gluten, meal, flour and bread. Two flour extraction rates and a 1:1 blend of the two were used. The concentrations of residues increased in bran, pollard, germ and gluten, with average processing factors of 3.95 (n = 6), 2.3 (n = 3), 3.3 (n = 5) and 1.57 (n = 3), respectively. In meal, flour and bread, the concentrations decreased with average processing factors of 0.85 (n = 3), 0.3 (n = 6) and 0.36 (n = 9), respectively, from wheat wholemeal to white bread.
Wheat treated with two formulations at application rates of 10 and 13 mg/kg of grain and stored for
up to 24 weeks was processed in three commercial mills (50 t per sample) and a pilot mill (1 t per sample). The concentrations of residues increased in bran with processing factors of 3.1–4.8 (average, 4.1; n = 10), in germ with processing factors of 2.1–4.3 (average, 3.2; n = 10) and in pollard with processing factors of 1.8–5.5 (average, 2.8; n = 6). On average, the concentration increased in wholemeal, with processing factors of 0.48–2.8 (average, 1.3; n = 9), but decreased in flour, with processing factors of 0.27–1.1 (average, 0.53; n = 10).
Wheat treated with piperonyl butoxide at 10 mg/kg of grain was stored for 2 or 4 h and processed to
bran, pollard, germ, meal, flour and bread. The concentration of residues increased in bran, pollard and germ, with average processing factors of 3.8, 2.6 and 2.6, respectively. The concentrations decreased in flour, meal, wholemeal bread and white bread, with processing factors of 0.22, 0.78, 0.41 and 0.11, respectively.
Five processing studies were conducted in Australia with wheat treated at the GAP rate or higher and
stored for 1–26 weeks. The concentrations of residues increased in bran with an average processing factor of 3.8 (3.33–4.7, n = 4), in germ with an average processing factor of 2.2 (1.12–2.89, n = 4) and in gluten with a processing factor of 1.4. The concentrations decrease in flour with an average processing factor of 0.34 (0.24–0.51, n = 5), in bread (white pan, wholemeal, flat Arabic and steamed) with average processing factors of 0.19–0.36 (average, 0.47) and in noodles (yellow alkaline and white) with average processing factors of 0.24 and 0.28. On average, the concentrations of residues decreased in wheat wholemeal, with processing factors of 0.61–1.29 (n = 5; average, 0.98).
In summary, the concentrations of piperonyl butoxide residues increased in wheat bran, with an
average processing factor of 3.5 (n = 42), in germ with an average processing factor of 2.8 (n = 20), in pollard with an average processing factor of 2.6 (n = 10) and in gluten with an average processing factor of 1.5 (n = 4). The concentrations decreased in wheat flour with an average processing factor of 0.32 (n = 42), in wheat wholemeal with an average processing factor of 0.98 (n = 18), in bread with an average processing factor of 0.32 (n = 18) and in noodles, with an average processing factor of 0.26 (n = 2).
On the basis of the processing factors derived and the recommended MRL of 30 mg/kg and the STMR value of 11 mg/kg for cereal grains, the Meeting estimated a maximum residue level of 100 mg/kg and an STMR-P value of 38.5 mg/kg for wheat bran; a maximum residue level of 10 mg/kg and an STMR-P value of 3.5 mg/kg for wheat flour; a maximum residue level of 30 mg/kg and an STMR-P value of 10.8

piperonyl butoxide 694
mg/kg for wheat wholemeal and a maximum residue level of 100 mg/kg and an STMR-P value of 30.8 mg/kg for piperonyl butoxide in wheat germ.
In Italy, six processing studies were conducted on maize treated with piperonyl butoxide at two rates and stored for 42 or 182 days. Degermination was conducted in the laboratory under conditions that matched the industrial procedure, by starch processing (wet conditions) and mill processing (dry conditions). The concentrations of residues in germ and oil decreased, with average processing factors of < 0.3 and < 2.7, respectively (n = 6). On the basis of the recommended MRL and the STMR value for cereal grains, the Meeting recommended a maximum residue level of 80 mg/kg and an STMR-P value of 29.7 mg/kg for maize oil, crude.
Two processing studies were conducted in France on dried and undried cargo rice treated with piperonyl butoxide at 2.5 mg/kg of grain, but only a short summary of the study was provided.
Cocoa beans and soya beans were treated with piperonyl butoxide formulations at 7.5 or 10 mg ai/kg
and stored for up to 1 year. Samples were then processed and analysed. The processing factors were 0.15–0.85 (average, 0.58; n = 10) for roasted cocoa beans and < 0.15–0.53 (average, < 0.20; n = 6) for chocolate paste. The concentration of residues increased in soya oil, with processing factors of 6.18, 22 and 13 (average, 13.9), and decreased in soya cake, with processing factors of 0.86, 0.75 and 0.10 (average, 0.57). Only a summary of the studies was provided. Residues in animal commodities Dietary burden of farm animals The Meeting estimated the dietary burden of piperonyl butoxide residues in cows and poultry on the basis of the diets listed in Appendix IX of the FAO Manual (FAO, 1997; pp. 121–127) and the maximum residue levels and STMR values estimated by the current Meeting. Estimate of maximum dietary burden of farm animals
Residues (mg/kg)
Basis Dry matter (%)
Residues, dry weight (mg/kg)
% of diet
Residue contribution (mg/kg)
Commodity Group
Beef cattle
Dairy cows
Poultry Beef cattle
Dairy cows
Poultry
Citrus, dried pulp AB 5.7 STMR-P 91 6.2 20 10 – 1.2 0.6 – Potato peel, wet AB 0.15 STMR-P 20 0.27 – – Sorghum GC 30 MRL 86 34.2 5 20 1.7 27.4 Wheat GC 30 MRL 89 33.3 Wheat bran GC 100 MRL 89 111 50 40 80 55.5 44.4 88.8 Rice GC 30 MRL 88 33.6 Maize GC 30 MRL 88 33.6 Pea vines AL 400 MRL – 400 25 50 – 100 200 – Pea hay AL 200 MRL – 200 – Total 100 100 100 158 245 116
Estimated STMR value for dietary burden of farm animals

piperonyl butoxide 695
Group
Residues (mg/kg)
Basis
Dry matter (%)
Residues, dry weight (mg/kg)
% of diet
Residue contribution (mg/kg)
Commodity
Beef cattle
Dairy cows
Poultry
Beef cattle
Dairy cows
Poultry
Citrus, dried pulp AB 5.7 STMR-P 91 6.2 20 10 – 1.2 0.6 – Potato peel, wet AB 0.15 STMR-P 20 0.27 – – Sorghum GC 11 STMR 86 12.5 5 20 0.6 2.5 Wheat GC 11 STMR 89 12.2 Wheat bran GC 38.5 STMR 89 42.7 50 40 80 21.3 17.1 34.2 Rice GC 11 STMR 88 12.3 Maize GC 11 STMR 88 12.3 Pea vines AL 108 STMR – 108 25 50 – 27 54 – Pea hay AL 19.9 STMR – 19.9 –
Total 100 100 100 50.1 71.7 36.7
Feeding and dermal application to animals Cows were given diets containing piperonyl butoxide at a concentration of 100, 300, 900 or 3000 mg/kg (dry weight basis) once daily for 28–30 consecutive days. The average concentration of residues in milk from three cows at 100 and 300 ppm remained approximately constant throughout the dosing period within ranges of < 0.01–0.02 mg/kg and 0.03–0.07 mg/kg, respectively. The concentrations in milk reached a plateau rapidly at higher doses. The average concentration of piperonyl butoxide in milk from cows at 900 ppm was 0.41 mg/kg, and that in milk from cows at the highest dose was 6.2 mg/kg. The residues in all treated animals were concentrated in liver and fat, and none were detected in kidney or muscle at the lower dose. In liver, the mean concentration ranged from 0.14 mg/kg at 100 ppm to 12 mg/kg at 300 ppm. The concentrations in animals at 100 ppm and 3000 ppm were 0.21 and 146 mg/kg in fat, 0.08 and 10 mg/kg in kidney and 0.05 and 7.6 mg/kg in muscle.
In Costa Rica and the USA, piperonyl butoxide may be sprayed directly onto livestock and poultry at
a rate of 0.42–8.9 g ai/animal. Three cows were treated dermally twice daily for 28 consecutive days at a maximum GAP dose of 2.28 g/day (3.78 mg/kg bw per day). The average concentration of residues in milk was 0.06 mg/kg on the first day and increased to 0.14 mg/kg on day 3, 0.12 mg/kg on day 7 and 0.16 mg/kg on day 27.
Laying hens were given diets containing 20.4, 61.2 or 196 ppm piperonyl butoxide equivalents. The
concentrations of residues in eggs from hens at 61.2 ppm reached a plateau on day 7, at 0.16–0.21 mg/kg on days 7–21 and an increase on day 27. Residues were detected in liver only at the highest dietary level (at a concentration of 0.13 mg/kg). In muscle, residues were present in hens at the two higher dietary levels at mean concentrations of 0.09 and 0.74 mg/kg, respectively. The mean concentration in fat ranged was 0.30 mg/kg at the lowest dietary level and 12 mg/kg at the highest.
Laying hens exposed dermally for 28 consecutive days to piperonyl butoxide at a GAP application rate of 37.8 g/1000 m3 had residues in their eggs from day 3, at a concentration of 0.02 mg/kg, which increased steadily up to day 27 (0.46 mg/kg) and did not reach a plateau. The average concentrations in tissues ranged from 0.96 mg/kg in muscle to 3.0 mg/kg in fat.

piperonyl butoxide 696
Maximum residue levels The maximum calculated dietary burden of piperonyl butoxide for cattle was 158 mg/kg for beef cattle and 245 mg/kg for dairy cows. The highest dietary burden was used to estimate the maximum residue level in milk and tissues of cattle. The mean intake calculated for dairy cattle (71.7 mg/kg) was higher than that for beef cattle (50.1 mg/kg) and was used to estimate the STMR value for milk and cattle tissue. The calculated maximum and mean intakes of piperonyl butoxide for poultry, 116 mg/kg and 36.7 mg/kg, respectively, were used to estimate the maximum residue level and STMR value, respectively. The highest concentrations of residues in tissues in the feeding studies and the mean value in milk after the plateau were used to estimate the maximum residue level. For eggs, the highest and the mean values at day 27 were used to calculate the maximum residue level and the STMR value, respectively. For cattle, the values at the calculated dietary burden (254 mg/kg) were estimated by interpolation of values for residues found at 100 and 300 ppm in feed. For poultry, these values (at a dietary burden of 116 mg/kg) were estimated by interpolation of concentrations found at 61.2 and 196 ppm. The mean concentrations of residues in tissues, milk and eggs were used to estimate the STMR value. For cattle, the concentration of residue at the calculated dietary burden (71.7 mg/kg) was estimated by ‘proportioning’ residues found at 100 ppm. For poultry, the concentration at 36.7 mg/kg was estimated by interpolation of data at 20.4 and 61.7 ppm.
The mean concentration of residue in milk after dermal treatment was used to estimate the maximum residue level and the STMR value for cattle milk. The highest and median concentrations of residues in eggs at day 27 (no plateau reached) were used to estimate the maximum residue level and the STMR value, respectively, in eggs, and the highest and median concentrations in tissues were used to estimate the maximum residue level and the STMR value, respectively, for both cattle and poultry. Residues in cattle milk and tissues from animals treated orally
Piperonyl butoxide concentration (mg/kg) Milk (mean)
Liver
Kidney
Muscle
Fat
Dose (ppm) Interpolated / actual
Highest Mean Highest Mean Highest Mean Highest Mean
MRL 245 / 100 300
0.037 / 0.01 0.04
0.71 / 0.15 0.73
0.11 / < 0.05 0.14
0.0 / < 0.05 0.05
1.57 / 0.42 1.7
STMR 71.7 / 100
(0.007) 0.01
(0.10) 0.14
(<0.04) <0.05
(<0.04) <0.05
(0.15) 0.21

piperonyl butoxide 697
Residues in cattle milk and tissues from animals treated dermally
Piperonyl butoxide concentration (mg/kg) Milk (mean)
Liver Kidney Muscle Fat
Highest
Median
Highest
Median
Highest
Median
Highest
Median
0.14 0.14 0.03 0.21 0.21 0.21 0.16 2.7 2.6
The Meeting estimated a maximum residue level of 1 mg/kg and an STMR value of 0.10 mg/kg for piperonyl butoxide in cattle liver, on the basis of the data from the feeding study. The concentrations of residues in milk, kidney, muscle and fat after dermal treatment were higher than those in the feeding study and were used in the estimations. The Meeting estimated a maximum residue level for piperonyl butoxide of 0.2 mg/kg in cattle milk, 0.3 mg/kg in cattle kidney and 5 mg/kg in cattle meat (fat).
The STMR concept is designed for supervised field trials on crops to obtain a typical residue value
when a pesticide is used at maximum GAP and is not applicable to a trial with a single direct treatment. The Meeting agreed that, in this case, a typical residue value can be derived from the median concentrations in tissues and in milk. The Meeting estimated values for typical piperonyl butoxide residues after direct use (at maximum label conditions) of 0.14 mg/kg in cattle milk, 0.21 mg/kg in cattle kidney and 0.16 mg/kg in cattle meat. These values can be used in the same way as STMR values for estimating the effect of long-term dietary intake on residue concentrations in tissues and of long-term and short-term intake on concentrations in milk.
Residues in poultry products from poultry treated orally
Piperonyl butoxide (mg/kg) Eggs
Liver
Muscle
Fat
Dose (ppm) Interpolated / actual
Highest
Mean
Highest
Mean
Highest
Mean
Highest
Mean
MRL 116 / 61.2 196
0.55 / 0.35 1.0
< 0.02 / – < 0.05
0.06 / < 0.05 0.12
1.14 / 0.38 1.7
STMR 36.7 / 20.4 61.2
0.18 / 0.03 0.23
< 0.045 / – < 0.05
0.035 / < 0.05 0.09
0.90 / 0.30 1.3
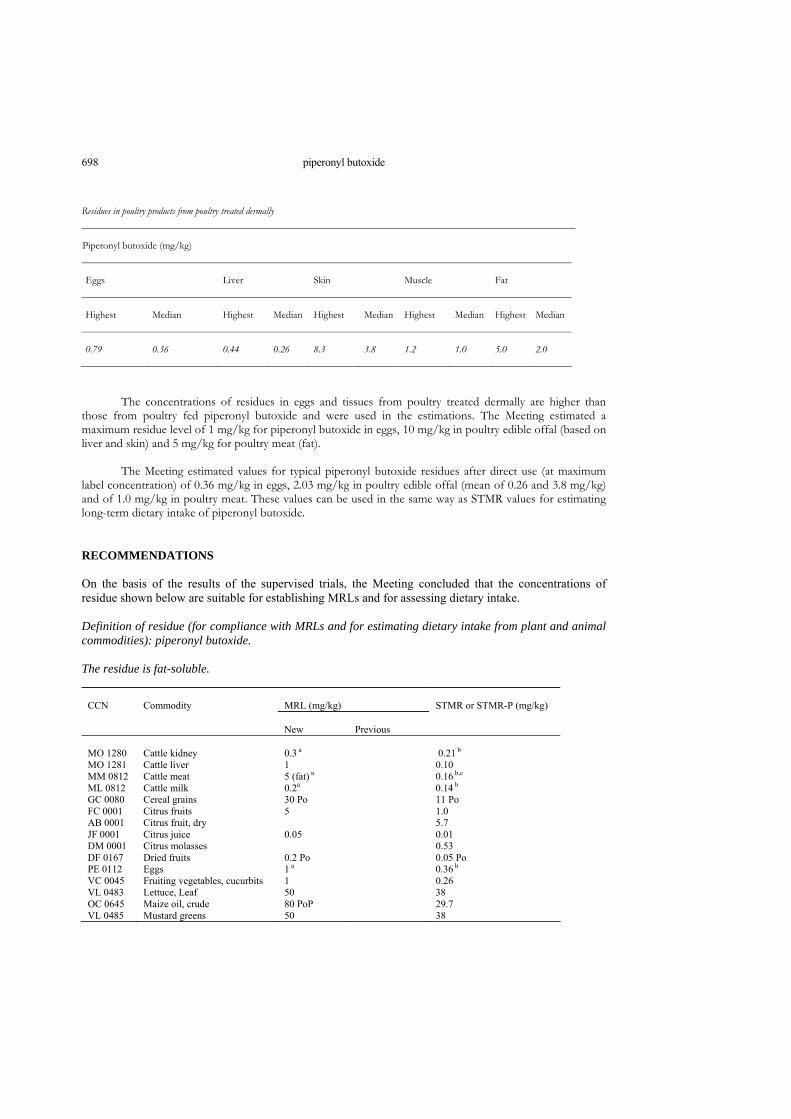
piperonyl butoxide 698
Residues in poultry products from poultry treated dermally Piperonyl butoxide (mg/kg) Eggs
Liver
Skin
Muscle
Fat
Highest
Median
Highest
Median
Highest
Median
Highest
Median
Highest
Median
0.79 0.36 0.44 0.26 8.3 3.8 1.2 1.0 5.0 2.0
The concentrations of residues in eggs and tissues from poultry treated dermally are higher than those from poultry fed piperonyl butoxide and were used in the estimations. The Meeting estimated a maximum residue level of 1 mg/kg for piperonyl butoxide in eggs, 10 mg/kg in poultry edible offal (based on liver and skin) and 5 mg/kg for poultry meat (fat).
The Meeting estimated values for typical piperonyl butoxide residues after direct use (at maximum
label concentration) of 0.36 mg/kg in eggs, 2.03 mg/kg in poultry edible offal (mean of 0.26 and 3.8 mg/kg) and of 1.0 mg/kg in poultry meat. These values can be used in the same way as STMR values for estimating long-term dietary intake of piperonyl butoxide. RECOMMENDATIONS On the basis of the results of the supervised trials, the Meeting concluded that the concentrations of residue shown below are suitable for establishing MRLs and for assessing dietary intake. Definition of residue (for compliance with MRLs and for estimating dietary intake from plant and animal commodities): piperonyl butoxide. The residue is fat-soluble.
CCN
Commodity
MRL (mg/kg)
STMR or STMR-P (mg/kg)
New
Previous
MO 1280 Cattle kidney 0.3 a 0.21 b MO 1281 Cattle liver 1 0.10 MM 0812 Cattle meat 5 (fat) a 0.16 b,c ML 0812 Cattle milk 0.2a 0.14 b GC 0080 Cereal grains 30 Po 11 Po FC 0001 Citrus fruits 5 1.0 AB 0001 Citrus fruit, dry 5.7 JF 0001 Citrus juice 0.05 0.01 DM 0001 Citrus molasses 0.53 DF 0167 Dried fruits 0.2 Po 0.05 Po PE 0112 Eggs 1 a 0.36 b VC 0045 Fruiting vegetables, cucurbits 1 0.26 VL 0483 Lettuce, Leaf 50 38 OC 0645 Maize oil, crude 80 PoP 29.7 VL 0485 Mustard greens 50 38
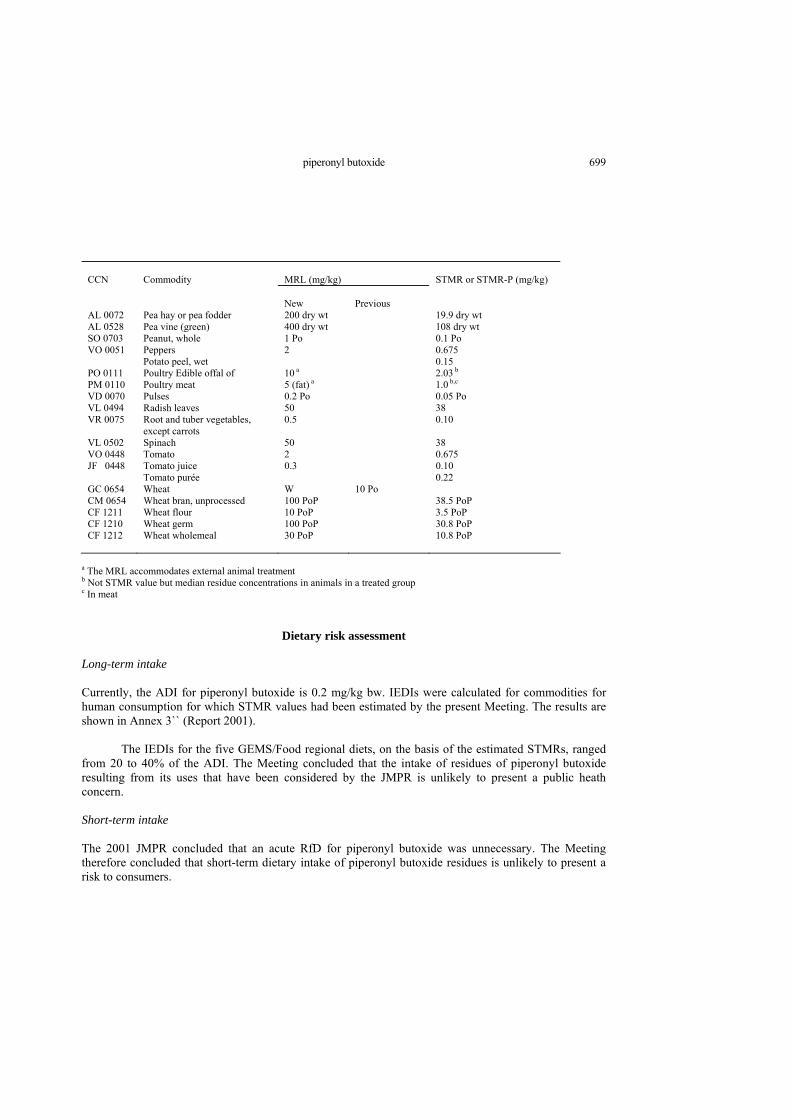
piperonyl butoxide 699
CCN
Commodity
MRL (mg/kg)
STMR or STMR-P (mg/kg)
New
Previous
AL 0072 Pea hay or pea fodder 200 dry wt 19.9 dry wt AL 0528 Pea vine (green) 400 dry wt 108 dry wt SO 0703 Peanut, whole 1 Po 0.1 Po VO 0051 Peppers 2 0.675 Potato peel, wet 0.15 PO 0111 Poultry Edible offal of 10 a 2.03 b PM 0110 Poultry meat 5 (fat) a 1.0 b,c VD 0070 Pulses 0.2 Po 0.05 Po VL 0494 Radish leaves 50 38 VR 0075 Root and tuber vegetables,
except carrots 0.5 0.10
VL 0502 Spinach 50 38 VO 0448 Tomato 2 0.675 JF 0448 Tomato juice 0.3 0.10 Tomato purée 0.22 GC 0654 Wheat W 10 Po CM 0654 Wheat bran, unprocessed 100 PoP 38.5 PoP CF 1211 Wheat flour 10 PoP 3.5 PoP CF 1210 Wheat germ 100 PoP 30.8 PoP CF 1212 Wheat wholemeal 30 PoP 10.8 PoP
a The MRL accommodates external animal treatment b Not STMR value but median residue concentrations in animals in a treated group c In meat
Dietary risk assessment Long-term intake Currently, the ADI for piperonyl butoxide is 0.2 mg/kg bw. IEDIs were calculated for commodities for human consumption for which STMR values had been estimated by the present Meeting. The results are shown in Annex 3`` (Report 2001).
The IEDIs for the five GEMS/Food regional diets, on the basis of the estimated STMRs, ranged from 20 to 40% of the ADI. The Meeting concluded that the intake of residues of piperonyl butoxide resulting from its uses that have been considered by the JMPR is unlikely to present a public heath concern. Short-term intake The 2001 JMPR concluded that an acute RfD for piperonyl butoxide was unnecessary. The Meeting therefore concluded that short-term dietary intake of piperonyl butoxide residues is unlikely to present a risk to consumers.
piperonyl butoxide 700
REFERENCES
Anon. 1995a. Piperonyl Butoxide Hydrolysis as a Function of pH at 25oC. Huntington Research Centre Ltd. Study No. PBT4. Unpublished. Anon. 1995b. Piperonyl Butoxide Photodegradation on Soil. Huntingdon Research Centre Lit. Study No. PBT 6. Unpublished. Anon. 1995c. Piperonyl Butoxide Aerobic Soil Metabolism. Huntingdon Research Centre Lit. Study No. PBT7. Unpublished Anon. 1995d. Piperonyl Butoxide Anaerobic Aquatic Metabolism. Huntingdon Research Centre Lit. Study No. PBT8. Unpublished. Anon. 1995e. Piperonyl Butoxide Aerobic Aquatic Metabolism. Huntingdon Research Centre Lit. Study No. PBT9. Unpublished. Anon. 1995f. Piperonyl Butoxide Adsorption/Desorption on Soil. Huntingdon Research Centre Lit. Study No. PBT/10A. Unpublished. Anon. 1995g. 14C-Piperonyl Butoxide Soil Column Leaching of Non-aged and Aged Residues of 14C-Piperonyl Butoxide. Huntingdon Research Centre Lit. Study No. PBT/10B. Unpublished. Anon. 1999. Final report on pilot usage experiment using a combination of bifenthrin with piperonyl butoxide plus chlorpyrifos-methyl on wheat 1996-97 Ardley, J.H. 1978. Grain protection. Evaluation of phenothrin, decamethrin and permethrin as potential grain protectants. Wellcome Foundation Report AIBE 78-2 (A97428). Ardley, J.H. 1979. A report on grain protection. Evaluation of phenothrin, fenvalerate, permethrin and decamethrin, each synergised with piperonyl butoxide and each combined with fenitrothion in comparison with pyrethrins and various bioresmethrin mixtures on Australian hard wheat. Wellcome Foundation Report AESE 79-2 (A97429). Ardley, J.H., Nicholls, A.W. and Roubos, H. 1982. A report on chemical grain protection. Evaluation, by comparison with standard bioresmethrin formulation, of phenothrin, fenvalerate (standard, A-alpha and Y-rich), deltamethrin (suspension concentrate and flowable), permethrin, 300H78, at different rates, synergised by piperonyl butoxide or unsynergised, with or without the addition of organophosphate, fenitrothion, on Australian wheat. Wellcome Foundation Report AESE 82-3 (A99191).
Australian Wheat Board. 1988. Results of residue studies on d-phenothrin and piperonyl butoxide in wheat and milled wheat products (C005240, C005242, C005241). Bard, J., D. Needham, and L. G. Giulianotti, 1999. Piperonyl Butoxide-[14C]: Rat-Metabolism following oral dosing at 50 and 500 mg/kg bodyweight. AgrEvo UK Limited Study No. TOX 97173. Unpublished. Bengston, M. 1991a. Final report on pilot usage trials using a combination of methacrifos plus bioresmethrin plus piperonyl butoxide 1990-91. Australian Wheat Board’s Working Party on Grain Protection Report (C003935). Bengston, M. 1991b. Final report on silo scale experiments using a combination of methacrifos plus permethrin plus piperonyl butoxide 1990-91. Australian Wheat Board’s Working Party on Grain Protection Report (C009396). Bengston, 1993a. Final report on pilot usage trials using a combination of methacrifos plus bioresmethrin plus piperonyl butoxide on barley 1992-93. Australian Wheat Board’s Working Party on Grain Protection Report (C003937). Bengston, M. 1993b. Final report on field evaluations using fenitrothion 6 mg/kg plus bioresmethrin 0.45 mg/kg plus piperonyl butoxide 3.6 mg/kg on barley 1992-93. Australian Wheat Board’s Working Party on Grain Protection Report (C003939). Bengston, M. 1993c. Final report on silo scale experiment using chlorpyrifos-methyl 5 mg/kg in combination with deltamethrin 0.25 mg/kg plus piperonyl butoxide 8mg/kg 1992-93. Australian Wheat Board’s Working Party on Grain Protection Report (C003938 Bengston, M. 1993d. Final report on silo scale experiment using deltamethrin 0.04 mg/kg in combination with piperonyl butoxide 5.4 mg/kg applied in a diatomaceous earth carrier plus chlorpyrifos-methyl 5 mg/kg 1992-93. Australian Wheat Board’s Working Party on Grain Protection Report (C003941). Bengston, M. 1994a. Final report on pilot usage trials using a combination of methacrifos plus bioresmethrin plus piperonyl butoxide on barley 1993-94. Australian Wheat Board’s National Working Party on Grain Protection Report (C003940). Bengston, M. 1994b. Final report on silo scale experiment using deltamethrin 0.04 mg/kg in combination with piperonyl butoxide 5.4 mg/kg applied in a diatomaceous earth carrier plus chlorpyrifos-methyl 5 mg/kg 1993-94. Australian Wheat Board’s National Working Party on Grain Protection Report (C003942).

piperonyl butoxide 701
Bengston, M. 1996a. Final report on silo scale experiment using chlorpyrifos-methyl plus deltamethrin plus piperonyl butoxide on sorghum 1996. Australian Wheat Board’s National Working Party on Grain Protection Report (C003945). Bengston, M. 1996b. Final report on pilot use of deltamethrin plus piperonyl butoxide on wheat 1995-96. Australian Wheat Board’s National Working Party on Grain Protection Report (C003943). Bengston, M. 1996c. Final report on a field experiment using deltamethrin plus piperonyl butoxide on barley 1995-96. Australian Wheat Board’s National Working Party on Grain Protection Report (C003943). Bengston, M. 1997a. Final report on field experiment using deltamethrin 0.04 mg/kg with piperonyl butoxide 4 mg/kg applied in a diatomaceous earth carrier plus chlorpyrifos-methyl 5 mg/kg 1996-97. Australian Wheat Board’s National Working Party on Grain Protection Report (C003947). Bengston, M. 1997b. Final report on pilot use of deltamethrin plus piperonyl butoxide on wheat 1996-97. Australian Wheat Board’s National Working Party on Grain Protection Report (C003946). Bengston, M. 1997c. Final report on a field experiment using deltamethrin plus piperonyl butoxide on barley 1996-97. Australian Wheat Board’s National Working Party on Grain Protection Report (C003948). Blinn, R.C.; Dorner, R.W. and Gunther, F.A. 1959. Comparative residual behaviour of pyrethrins and piperonyl butoxide on wheat. J. Econ. Entomol. 52: 703-704 (C003646). Bureau of Resource Sciences, 1997a. Report on the National Residue Survey 1993-1994 Results. Bureau of Resource Sciences, Canberra. Bureau of Resource Sciences, 1997b. Report on the National Residue Survey 1995 Results. Bureau of Resource Sciences, Canberra. Bureau of Resource Sciences, 1997c. Report on the National Residue Survey 1996 Results. Bureau of Resource Sciences, Canberra. Bureau of Resource Sciences, 1998. Report on the National Residue Survey 1997 Results. Bureau of Resource Sciences, Canberra. Bureau of Resource Services, 1999. Report on the National Residue Survey 1998 Results. Department of Agriculture, Fisheries and Forestry-Australia, Canberra. Collins, P.J. 1990. A new resistance to pyrethroids in Tribolium castaneum (Herbst). Pestic. Sci. 28: 101-115 (C006123).
Crampton, P. L., Huson, A. J. and Nicholls, A.W. 1990. A new formulation liquid grain protectant based on deltamethrin and chlorpyrifos-methyl. Wellcome Foundation Ltd. report HESE 90-8 (A97457). Curry, K.K., Smith, C.A. and D.J. Brookman, 1996. Final Response to Chemistry Branch Review Dated December 19, 1994 regarding “Nature of 14C-Piperonyl Butoxide (PBO) Residues in Cotton, MRID No. 43227702" Discussion and Conclusions. Biological Test Center Study No. P0892003. Unpublished. Daglish, G.J., Wallbank, B.E., and Desmarchelier, J.M. 1999. Progress report. Pilot usage experiment-bifenthrin with piperonyl butoxide plus chlorpyrifos-methyl on wheat, 1997-98. National Working Party on Grain Protection, Australia. Dath, J. M. 1992. Residue tests on rice treated with K-Obiol ULV 6 (C003800). Desmarchelier, J.M. and Bengston, M. 1979a. Chemical residues of newer grain protectants. In : Evans, D.E. , Ed., Australian Contributions to the Symposium on the Protection of Grain against Insect Damage during Storage, Moscow 1978. CSIRO Aust. Div. Entomol. Canberra. pp 108-115 (C006122). Desmarchelier, J.M. and Bengston, M. 1979b. The residual behaviour of chemicals on stored grain. Proc. 2nd Int. Working Conf. Stored-Products Entomol., Ibadan, Nigeria 10-16 Sept 1978. pp 138-151 (A94491). Endura, 1999. Dr. Marco Mazza Endura SpA, Viale Pietramellara, 5, 40121 Bologna, Italy. Halls, G.R.H. 1981. The fate of permethrin residues on wheat during 9 months storage in Australia. Welcome Foundation Ltd. report HEFH 81-1 (A95217). Harbach, C.A.J. 1995. GC/EIMS analysis of PBO exposed to UV light in the presence and absence of moisture (Certificate of Analysis). M-Scan Ltd. Study No. 9506/7804. Unpublished (A92509). Hattermann, D.R. 1992a. Field Phase for Pyrenone Crop Spray (Pyrethrum + Piperonyl Butoxide) Field Dissipation-Terrestrial Study Applied to Bareground in California, Georgia, and Michigan. Landis Study No. 18021E08. Unpublished. Hattermann, D.R. 1992b . Piperonyl Butoxide Analytical Phase for Pyrenone Crop Spray (Pyrethrum + Piperonyl Butoxide) Field Dissipation-Terrestrial Study Applied to Bareground in California, Georgia, and Michigan. Landis Study No. 18021E08. Unpublished.

piperonyl butoxide 702
Hattermann, D.R. 1994a. Field Phase for LX1180-02 (Pyrethrin + Piperonyl Butoxide) Raw Agricultural Commodity Trials on Citrus in Florida, California, Texas, and Arizona. Paragon Global Services Study No. 18001A014. Unpublished. Hattermann, D.R. 1994b. Piperonyl Butoxide Analytical Phase on the Raw Agricultural Commodity Residue Evaluation of Piperonyl Butoxide Applied as Pyrenone Crop Spray to Citrus. Paragon Global Services Study No. 18001A014. Unpublished. Hattermann, D.R. 1994c. Field Phase for LX1180-02 (Pyrethrin + Piperonyl Butoxide) Raw Agricultural Commodity Trials on Small Fruits in New York, Oregon, Michigan, North Carolina, Florida, and Massachusetts. Paragon Global Services Study No. 18003A020. Unpublished. Hattermann, D.R. 1994d. Piperonyl Butoxide Analytical Phase on the Raw Agricultural Commodity Residue Evaluation of Pyrethrin + Piperonyl Butoxide Applied as Pyrenone Crop Spray to Small Fruits. Paragon Global Services Study No. 18003A020. Unpublished. Hattermann, D.R. 1994e. Field Phase for LX1180-02 (Pyrethrin + Piperonyl Butoxide) Raw Agricultural Commodity Trials on Legumes in Florida, Wisconsin, North Dakota, Colorado, California, Minnesota, Texas, and Washington. Paragon Global Services Study No. 18007A012. Unpublished. Hattermann, D.R. 1994f. Piperonyl Butoxide Analytical Phase on the Raw Agricultural Commodity Residue Evaluation of Pyrethrin + Piperonyl Butoxide Applied as Pyrenone Crop Spray to Legume Crops. Paragon Global Services Study No. 18007A012. Unpublished. Hattermann, D.R. 1994g. Field and Processing Phases for LX1180-02 (Pyrethrin + Piperonyl Butoxide) Processed Commodity Trials on Potatoes and Sugarbeets in Washington and California. Paragon Global Services Study No. 18008A002. Unpublished. Hattermann, D.R. 1994h. Field Phase for LX1180-02 (Pyrethrin + Piperonyl Butoxide) Raw Agricultural Commodity Trials on Brassica in Arkansas, California, Oregon, New York, Florida, Texas, and Georgia. Paragon Global Services Study No. 18014A004. Unpublished. Hattermann, D.R. 1994i. Piperonyl Butoxide Analytical Phase on the Raw Agricultural Commodity Residue Evaluation of Pyrethrin + Piperonyl Butoxide Applied as Pyrenone Crop Spray to Brassica. Paragon Global Services Study No. 18014A004. Unpublished. Hattermann, D.R. 1995a. Field and Processing Phases for LX1180-02 (Pyrethrin + Piperonyl Butoxide) Processed Commodity Trial on Oranges in Florida. Paragon Global Services Study No. 18001B015. Unpublished.
Hattermann, D.R. 1995b. Amended Piperonyl Butoxide Analytical Phase on the Processed Commodity Residue Evaluation of Piperonyl Butoxide Applied as Pyrenone Crop Spray to Oranges. Paragon Global Services Study No. 18001B015. Unpublished. Hattermann, D.R. 1995c. Piperonyl Butoxide Analytical Phase on the Processed Commodity Residue Evaluation of Piperonyl Butoxide Applied as Pyrenone Crop Spray to Succulent Beans. Paragon Global Services Study No. 18007E013. Unpublished. Hattermann, D.R. 1995d. Field Phase for LX1180-02 (Pyrethrin + Piperonyl Butoxide) Raw Agricultural Commodity Trials on Root and Tuber Crops in Texas, Florida, Idaho, Colorado, Maine, North Dakota, and Minnesota (Amended). Paragon Global Services Study No. 18008A001. Unpublished. Hattermann, D.R. 1995e. Amended Report for Piperonyl Butoxide (PBO) and PBO Metabolites Analytical Phase on the Raw Agricultural Commodity Residue Evaluation of Piperonyl Butoxide Applied as Pyrenone Crop Spray to Root and Tuber Crops (Amended). Paragon Global Services Study No. 18008A001. Unpublished. Hattermann, D.R. 1995f. Piperonyl Butoxide Analytical Phase on the Processed Commodity Residue Evaluation of Pyrethrins and Piperonyl Butoxide Applied as Pyrenone Crop Spray to Root and Tuber Crops. Paragon Global Services Study No. 18008A002. Unpublished. Hattermann, D.R. 1995g. Field Phase for LX1180-02 (Pyrethrin + Piperonyl Butoxide) Raw Agricultural Commodity Trials on Cotton in California, Mississippi, Texas, Arizona and Louisiana (Amended). Paragon Global Services Study No. 18011B017. Unpublished. Hattermann, D.R. 1995h. Piperonyl Butoxide Analytical Phase on the Raw Agricultural Commodity Residue Evaluation of Piperonyl Butoxide Applied as Pyrenone Crop Spray to Cotton (Amended). Paragon Global Services Study No. 18011B017. Unpublished. Hattermann, D.R. 1995i. Field and Processing Phases for LX1180-02 (Pyrethrin and Piperonyl Butoxide) Processed Commodity Trial on Cotton in Texas. Paragon Global Services Study No. 18011B018. Unpublished. Hattermann, D.R. 1995j. Piperonyl Butoxide Analytical Phase on the Processed Commodity Residue Evaluation of Piperonyl Butoxide Applied as Pyrenone Crop Spray to Cotton. Paragon Global Services Study No. 18011B018. Unpublished. Hattermann, D.R. 1995k. Field Phase for LX1180-02 (Pyrethrin + Piperonyl Butoxide) Raw Agricultural Commodity Trials on Fruiting Vegetable in Florida, Michigan, New Jersey, North Carolina, California, and Texas (Amended). Paragon Global Services Study No. 18015A005. Unpublished.
piperonyl butoxide 703
Hattermann, D.R. 1995l. Amended Piperonyl Butoxide (PBO) and PBO Metabolites Analytical Phase on the Raw Agricultural Commodity Residue Evaluation of Piperonyl Butoxide Applied as Pyrenone Crop Spray to Fruiting Vegetables. Paragon Global Services Study No. 18015A005. Unpublished. Hattermann, D.R. 1995m. Amended Piperonyl Butoxide Analytical Phase on the Processed Commodity Residue Evaluation of Pyrethrin and Piperonyl Butoxide Applied as Pyrenone Crop Spray to Tomato. Paragon Global Services Study No. 18015B006 Unpublished. Hattermann, D.R. 1996a. Field and Processing Phases for LX1180-02 (Pyrethrin + Piperonyl Butoxide) Processed Commodity Trial on Grape in California (Amended). Paragon Global Services Study No. 18003B019. Unpublished. Hattermann, D.R. 1996b. Piperonyl Butoxide Analytical Phase on the Processed Commodity Residue Evaluation of Piperonyl Butoxide Applied as Pyrenone Crop Spray to Grape (Amended). Paragon Global Services Study No. 18003B019. Unpublished. Hattermann, D.R. 1996c. Field and Processing Phases for LX1180-02 (Pyrethrin + Piperonyl Butoxide) Processed Commodity Trial on Succulent Beans in New York (Amended). Paragon Global Services Study No. 18007E013. Unpublished. Hattermann, D.R. 1996d. Field and Processing Phases for LX1180-02 (Pyrethrin + Piperonyl Butoxide) Processed Commodity Trial on Potatoes in Washington. Landis International, Inc. Study No. 18008D022 Unpublished. Hattermann, D.R. 1996e. Piperonyl Butoxide Analytical Phase on the Processed Commodity Residue Evaluation of Pyrethrin + Piperonyl Butoxide Applied as Pyrenone Crop Spray to Root and Tuber Crops (Potato). Landis International, Inc. Study No. 18008D022 Unpublished. Hattermann, D.R. 1996f. Amended Piperonyl Butoxide Analytical Phase on the Raw Agricultural Commodity Residue Evaluation of Piperonyl Butoxide + Pyrethrins Applied as Pyrenone Crop Spray to Leafy Vegetables. Paragon Global Services Study No. 18009A003 Unpublished. Hattermann, D.R. 1996g. Field Phase for LX1180-02 (Pyrethrin + Piperonyl Butoxide) Raw Agricultural Commodity Trials on Leafy Vegetables in California, Florida, Arizona, Michigan, Colorado, and Texas (Amended). Paragon Global Services Study No. 18009A003. Unpublished. Hattermann, D.R. 1996h. Field Phase for LX1180-02 (Pyrethrin + Piperonyl Butoxide) Raw Agricultural Commodity Trials on Cucurbits in Michigan, North Carolina, Arizona, California, Florida, Texas, New Jersey and Georgia (Amended). Paragon Global Services Study No. 18013A007. Unpublished.
Hattermann, D.R. 1996i. Amended Piperonyl Butoxide Analytical Phase on the Raw Agricultural Commodity Residue Evaluation of Pyrethrin + Piperonyl Butoxide Applied as Pyrenone Crop Spray to Cucurbits. Paragon Global Services Study No. 18013A007. Unpublished. Hattermann, D.R. 1999. Field and Processing Phases for LX1180-02 (Pyrethrin + Piperonyl Butoxide) Processed Commodity Trial on Tomato in California (Amended). Paragon Global Services Study No. 18015B006 Unpublished. Hodgson, E. and P. E. Levi, 1998. “Interactions of Piperonyl Butoxide with Cytochrome P450,” Chapter 3 of Piperonyl Butoxide-The Insecticide Synergist. Academic Press, London. ISBN: 0-12-286975-3. Hong Nguyen. 1988. Determination of deltamethrin and piperonyl butoxide (Emulflow) residues in wheat, wheat fractions and breads. An AWB working party trial of 4 tonne millings at the Bread Research Institute. Wellcome Foundation Report AESH 88-4 (A97687). Isshiki, K., Tsumura, S. and Watanabe, T. 1978. Residual piperonyl butoxide in agricultural products. Bull. Environ. Contam. Toxicol. 19: 518-523 (C006121). Kawana, K., Nakaoka, T. and Fukui, S. 1976. Detection of Piperonyl Butoxide from Rice Grains in the Markets, . Bull. Kanagawa P. H. Lab. 6: 33 (C006179). Krautter, G.R., Downs, J.H, Marsh, T.J. and Class, T.J. 1995a. Magnitude of Residues in Meat and Milk of Lactating Dairy Cows Orally Administered Piperonyl Butoxide. PTRL East Project No.: 933. Unpublished. Krautter, G.R., Downs, J.H, Marsh, T.J. and Class, T.J. 1995b. Magnitude of Residues in Meat and Milk of Lactating Dairy Cows Dermally Administered Piperonyl Butoxide. PTRL East Project No.: 939. Unpublished. Krautter, G.R., Downs, J.H, Marsh, T.J. and Class, T.J. 1995c. Magnitude of Residues in Meat and Eggs of Laying Hens Orally Administered Piperonyl Butoxide. PTRL East Project No.: 940. Unpublished. Krautter, G.R., Downs, J.H, Marsh, T.J. and Class, T.J.1995d. Magnitude of Residues in Meat and Eggs of Laying Hens Exposed to Piperonyl Butoxide as a Premise Spray. PTRL East Project No.: 941. Unpublished. LaHue, D.W. 1965. Evaluation of malathion, synergised pyrethrum, and diatomaceous earth as wheat protectants in small bins. USDA, Marketing Research Report No. 726, 13 pp (C003670). LaHue, D.W. 1966. Evaluation of malathion, synergised pyrethrum, and diatomaceous earth on shelled corn as protectants against insects- in small bins. USDA, Marketing Research Report No. 768, 13 pp (C003660).
piperonyl butoxide 704
Lin, P. and Selim, S. 1991. Absorption, Distribution, Metabolism and Excretion (ADME) Studies of Piperonyl Butoxide in the Rat. Biological Test Center Study No. PO1825. Unpublished. Marsh, S.E. 1992. Study into the residuality of Aqua Pybuthrin and D291 on ceramic tiles under ‘light’ and ‘dark’ conditions. Roussel Uclaf Environmental health Ltd Report RTQA/92/0001 (A97266). Meinen, V.J. 1991a. Residue Study of Pyrethrins, Piperonyl Butoxide, and MGK(R) 264 in Certain Food Commodities Resulting From Use as a Contact Spray in a Simulated Warehouse Situation. McLaughlin Gormley King Company Study No. GLP-076. Unpublished. Meinen, V.J. 1991b. Residue Study of Pyrethrins, Piperonyl Butoxide, and MGK(R) 264 in Certain Food Commodities Resulting From Use as a Space Spray in a Warehouse Situation. McLaughlin Gormley King Company Study No. GLP-077. Unpublished. Mestres, R. 1983a. Residues analysis; Commercial Product, K-Othrine CE 15/PB; Decamethrine 15g/L and piperonyl butoxide 150g/L; Cacao bean (stored). Wellcome Foundation Report (A97757). Mestres, R. 1983b. Residues analysis; Commercial Product, K-Othrine CE 15/PB; Decamethrine 15g/L and piperonyl butoxide 150g/L; Soya bean (stored). Wellcome Foundation Report (A97773). Molinari, G.P. 1987. Use of deltamethrin in grains storage: efficacy and residue assessment in the treated products and in the derived foodstuffs: wheat area. Final Research Report Roussel Hoechst Agrovet (A97697). Molinari, G.P. 1991. Use of deltamethrin in grain storage: evaluation of residues in the treated products and in by-products for feeding use: maize area. Final Research Report Roussel Hoechst Agrovet (A97791). Moore, J.B. 1973. Residue and tolerance considerations with pyrethrum, piperonyl butoxide and MGK-264. In: Casida, J.E., Ed., Pyrethrum, the Natural Insecticide. Academic Press, New York. pp 293-306. National Cottonseed Products Association, Inc. (NCPA) 1999. Cotton Seed and Its Products, 10th Edition, 1999 Digital Edition, Published on http://www.cottonseed.com. Nedvidek, W. 1994a. "Final report: Testing the residual behaviour of Detmolin P in stored food-analysis of residue samples"; Biochem GmbH, Germany; unpublished report No. 93 50 12 529 B sponsored by Frowein GmbH & Co, Germany; 82 pages. Nedvidek, W. 1994b. "Final report: Testing the residual behaviour of Detmolin P in stored food-analysis of residue samples"; Biochem GmbH, Germany; unpublished report No. 93 50 12 529 C sponsored by Frowein GmbH & Co, Germany; 78 pages.
Nicholls, A.W., Ardley, J.H. and Roubos, H. 1984. A second report on new grain insect protectant combinations and their “disinsecting” potential. Evaluation of bioresmethrin, carbaryl, phenothrin 50:50, fenvalerate, deltamethrin, permethrin 25:75 and cypermethrin, singly or in various combinations, some with piperonyl butoxide, one with pirimiphos methyl, some with, others without fenitrothion on Australian wheat containing live insects. Wellcome Foundation Report AESE 84-7 (A99222). Quinlan, J.K. and Miller, R.F. 1958. Evaluation of synergised pyrethrum for the control of Indian meal moth in stored shelled corn. USDA AMS Marketing Research Report 222, 13 pp (C006120). Rowlands, D.G. 1967. The metabolism of contact insecticides in stored grains. Residue Rev. 17: 105 (C003648). Samson, P.R., Parker, R.J. and Hall, E.A. 1990. Synergised deltamethrin as a protectant against Sitophilus zeamais Motsch. and S. oryzae (L.) (Coleoptera: Curculionidae) on stored maize. J. Stored Prod. Res. 26 (3): 155-161 (C006119). Selim, S. 1991. Addendum to Report Entitled "Absorption, Distribution, Metabolism and Excretion, (ADME )Studies of Piperonyl Butoxide in the Rat." Biological Test Center Study No. PO1825. Unpublished. Selim, S. 1994a. Nature of 14C-Piperonyl Butoxide (PBO) Residues in Cotton. Biological Test Center Study No. P0892003. Unpublished. Selim, S. 1994b. Recovery Study of (14)C Piperonyl Butoxide from Rat Skin. Biological Test Center Study No. T92609. Unpublished. Selim, S. 1995a. Nature of 14C-Piperonyl Butoxide (PBO) Residues in Leaf Lettuce, Amended. Biological Test Center Study No. P0792010. Unpublished. Selim, S. 1995b. Isolation and Identification of Major Degradates of Piperonyl Butoxide (PBO) Following Aqueous Photolysis. Biological Test Center Study No. P059410. Unpublished. Selim, S. 1995c. Nature of the Residue in Meat and Milk of 14C-Piperonyl Butoxide in the Goat Following Oral and Dermal Administrations. Biological Test Center Study No. P0993007. Unpublished. Selim, S. 1995d. Nature of the Residue in Meat and Eggs of 14C-Piperonyl Butoxide in Laying Hens Following Oral and Dermal Administrations. Biological Test Center Study No. P0993008. Unpublished.

piperonyl butoxide 705
Selim, S. 1995e. Metabolites of Piperonyl Butoxide Analytical Phase on the Raw Agricultural Commodity Residue Evaluation of Pyrethrin + Piperonyl Butoxide Applied as Pyrenone Crop Spray to Brassica. Protocol No. 1804A004. Selim, S. 1996a. Addendum II to the Report Entitled “Piperonyl Butoxide Analytical Phase on the Processed Commodity Residue Evaluation of Pyrethrin + Piperonyl Butoxide Applied as Pyrenone Crop Spray to Orange.” Protocol No. 18001B015, Unpublished. Selim, S. 1996b. Metabolites of Piperonyl butoxide Analytical Phase on the Raw Agricultural Commodity Residue Evaluation of Pyrethrin + Piperonyl Butoxide Applied as Pyrenone Crop Spray to Cotton. Protocol No. 18011B017. Selim, S. 1996c. Addendum to Piperonyl Butoxide Analytical Phase on the Raw Agricultural Commodity Residue Evaluation of Pyrethrin + Piperonyl Butoxide Applied as Pyrenone Crop Spray to Cotton.” Protocol No. 18011B018, Unpublished. Selim, S. 1996d. Addendum to Piperonyl Butoxide Analytical Phase on the Raw Agricultural Commodity Residue Evaluation of Pyrethrin + Piperonyl Butoxide Applied as Pyrenone Crop Spray to Brassica.” Protocol No. 18004A004, Unpublished. Selim, S. 1996e. [Amended ] Nature of 14C-Piperonyl Butoxide (PBO) Residues in Potato. Biological Test Center Study No. P0892002. Unpublished. Strong, R.G., Sbur, D.E. and Arndt, R.G. 1961. Influence of formulation on the effectiveness of malathion, methoxychlor, and synergised pyrethrum protective sprays for stored wheat. J. Econ. Ent. 54: 489 (C006051). Tempone, M.J. 1979. Studies on the effects of insecticides on barley malting. Division of Agricultural Chemistry, Victoria Research Project Series No. 50. Wellcome Foundation report HEY 79-C27 (A95220).
Turnbull, S.R. 1987. Determination of deltamethrin and piperonyl butoxide residues in wheat, cereal fractions and breads compared with bioresmethrin, piperonyl butoxide and fenitrothion residues in like samples. Wellcome Foundation Report AESH 87-12 (A95751). Turnbull, S.R. 1988. Piperonyl butoxide and fenitrothion residues in wheat, derived fractions and breads six months post treatment. Wellcome Foundation Ltd., Report AESH 88-1 (C000266). Turnbull, S.R. and Ardley, J.H. 1987. Determination of d-phenothrin, piperonyl butoxide and fenitrothion residues in wheat, derived fractions and breads at appoximately one, three and six months post treatment. Wellcome Foundation Ltd., Report AESH 87-11 (C000265). USDA, 1999. United States Department of Agriculture Agricultural Marketing Service Science & Technology, Pesticide Data Program Annual Summary Calendar Year 1997. USFDA 1999. United States Food and Drug Administration Pesticide Monitoring Data Base for Fiscal Year 1998. Available through http://vm.cfsan.fda.gov/ Not available in hard-copy form for residues of a particular pesticide. USDA, 2000. United States Department of Agriculture Agricultural Marketing Service Science & Technology, Pesticide Data Program Annual Summary Calendar Year 1999. Walkden, H.H. and Nelson, H.D. 1959. Evaluation of synergised pyrethrum for the protection of stored wheat and shelled corn from insect attack. USDA Market Research Report No. 322, 48 pp (C003657). Webley, D. J. 1994. Grain protectants and pesticide residues. Proc. 6th Int. Working Conf. Stored-product Protection. 2: 857-862 (C006114). Winkler, D. A. 1997. Processed Commodity (PC) Residue Evaluation of Pyrethrum + Piperonyl Butoxide Applied as Pyrenone Crop Spray to Root and Tuber Crops. Protocol No. 18008D022. Unpublished.