pisa 2015 field trial goals, assessment design, … f1_ftanalysisplan-cognitive_1.pdf · oecd...
TRANSCRIPT

OECD Programme for International Student Assessment 2015
PISA 2015 FIELD TRIAL GOALS, ASSESSMENT DESIGN, AND ANALYSIS PLAN FOR COGNITIVE ASSESSMENT Doc: CY6_GEN_FTAnalysisPlan-Cognitive_1 (2) (Note: This document is the same report as GB(2014)2 Field Trial Analysis Plan for the Cognitive Assessmen from the 37th meeting of the PISA Governing Board) May 2014 Produced by ETS, Core 3
PISA 2015 Contractors

CY6_GEN_FTAnalysisPlan-Cognitive_1 (2)
2
TABLE OF CONTENTS
SUMMARY OF ANALYSIS PLAN .............................................................................................................. 3
PISA 2015 FIELD TRIAL GOALS, ASSESSMENT DESIGN, AND ANALYSIS PLAN FOR THE COGNITIVE ASSESSMENT ......................................................................................................................... 4
1. Field Trial goals ....................................................................................................................................... 4 2. Assessment design and innovation .......................................................................................................... 7 3. IRT models for PISA 2015 .................................................................................................................... 13 4. IRT scaling of the PISA 2015 Field Trial data ...................................................................................... 19 5. Summary of Field Trial analysis goals .................................................................................................. 25
REFERENCES .............................................................................................................................................. 27
Tables
Table 1. Domain coverage for the PISA 2015 Field Trial and Main Study .......................................... 7 Table 2. An example of a completion table ......................................................................................... 23 Table 3. Response distribution ............................................................................................................ 24 Table 4. Summary classic statistics per country .................................................................................. 24 Table 5. Summary of item parameters report ...................................................................................... 25
Figures
Figure 1. Left side: construct coverage in prior PISA designs by major and minor domains; right side: new approach in PISA 2015 ........................................................................................................................ 9 Figure 2. Comparison of the approach to measuring trends in the domain science in prior PISA cycles with the new approach in PISA 2015 .......................................................................................................... 9 Figure 3. Field Trial CBA design.......................................................................................................... 11 Figure 4. Field Trial PBA design .......................................................................................................... 12 Figure 5. Item response curve (ICC) for an item where the common item parameter is not appropriate for one country ............................................................................................................................................... 16

CY6_GEN_FTAnalysisPlan-Cognitive_1 (2)
3
SUMMARY OF ANALYSIS PLAN
1. The PISA 2015 Field Trial analysis plan is designed to yield information crucial to meeting four main goals: survey operations, the quality of the instruments, the overall performance of the computer delivery platform, and the psychometric characteristics of the items and scales to determine the invariance of the item parameters across countries, over time and across modes. Collectively, the proposed analyses of the Field Trial data will be used to assemble and recommend the set of instruments for the PISA 2015 Main Study and to modify or refine any operational or platform issues in order to increase the overall quality and efficiency of the data collection process.
2. More specifically, the proposed analysis plan will:
a. Evaluate data yield and quality: this includes examining response rate, item completion rates, statistical equivalence of the samples collected in the three Field Trial groups —Group 1-PBA Trend, Group 2-CBA Trend, Group3-new CBA— in order to ensure that the intended random assignment of students to these groups was successful, functioning of the computer platform, missing data and timing information.
b. Apply classical item analysis procedures including: calculating P+ values, biserial correlations, missing rates, score category distributions and timing.
c. Assess the invariance of PBA item parameters compared with previous cycles based on an evaluation of the data collected on Group 1-PBA Trend.
d. Assesses the invariance of PBA and CBA item parameters of trend items based on the evaluation of the data collected on Group1-PBA Trend and Group 2-CBA Trend.
e. Assess and identify notable item X country interactions
f. Estimate initial item parameters for new Science and Collaborative Problem Solving items
g. Uses multiple sources of evidence to compile the recommended clusters for the Main Study to optimize construct coverage, reliability, validity and comparability of each cognitive domain.
3. While the Field Trial design and analysis plan serves multiple purposes, the main goal is to optimize the platform, operations and instruments for the main survey. This will ensure that the cognitive instruments used in PISA 2018 meet the highest standards and support the goals of the Main Study.

CY6_GEN_FTAnalysisPlan-Cognitive_1 (2)
4
PISA 2015 FIELD TRIAL GOALS, ASSESSMENT DESIGN, AND ANALYSIS PLAN FOR THE COGNITIVE ASSESSMENT
4. The purpose of this document is to describe and illustrate the Field Trial goals and designs for the PISA direct assessment measures and to provide an initial plan for the analysis of the Field Trial data. The designs are complex because PISA measures four domains—reading, mathematics, science, and Collaborative Problem Solving (CPS)—across two modes of administration—paper-based and computer-based—while also offering participating countries both core and optional components. PISA also intends to link the results to its previous surveys; hence, these designs assume that the large number of items administered in previous paper-based PISA surveys retain essential psychometric characteristics across both modes for all domains. New items based on the revised framework have also been developed for the science domain along with new measures for CPS based on the 2015 frameworks.
5. The Field Trial design is based on an administration time of 120 minutes for the direct assessments, which includes pairwise sets of items from the four domains (two domains per form) and an additional 30 minutes for the background questionnaire. A total of 1,950 students from multiple schools will be randomly assigned (but with unequal, prescribed probabilities) to one of three groups: 1) paper administration of trend items, 2) computer administration of trend items, and 3) computer administration of new items.
6. The first section summarizes the Field Trial goals in terms of operational and psychometric questions that need to be answered before assembling the instruments and proceeding to the Main Study. Next, the assessment design for PISA 2015 is described. This design is premised on the introduction of a technology-based assessment that allows a better coverage of the minor domains while maintaining the full precision on major domains. In order to assess the viability of trend measures across past paper-based and future technology-based assessments, a mode effect study is needed. The details of this study are presented as part of the assessment design. Section 4 describes the IRT models and psychometric analyses that will be carried out in order to evaluate that Field Trial goals are met, together with a timeline for the activities and a list of deliverables that document the analyses. Section 5 summarizes the overall goals and data that will be used to select and recommend the item pool and clusters for the Main Study.
1. Field Trial goals
7. The PISA 2015 Field Trial is designed to yield information crucial for instrument assembly and design of the Main Study instruments. This concerns information about survey operations, the quality of the instruments, operational characteristics of data collection using the computer delivery platform, and items that are either newly developed for computer-based delivery or re-implemented for both paper- and computer-based delivery. The collected data will also be used to evaluate the item characteristics against existing data from previous rounds through item response theory scaling and psychometric analysis. The outcomes of the Field Trial will be used to inform the assembly of the final test instruments that will be used in the PISA 2015 Main Study and to modify or refine any operational issues in order to increase the overall quality of the data collection.
1.1 Operational goals
8. One of the purposes of the Field Trial is to evaluate the survey operation procedures. This includes an examination of the efficiency and accuracy of data collection procedures, response rates for various

CY6_GEN_FTAnalysisPlan-Cognitive_1 (2)
5
subpopulations of interest, efficiency and accuracy of data processing (including recoding), and data transmission. In particular, the following issues related to field operations will be examined with regard to the cognitive assessment:
• Evaluate the coding of nonresponses
• Identify and remediate operational and technical difficulties
• Summarize and evaluate statistics of administration timing data
• Evaluate the efficacy of scoring items from the paper-based assessment (PBA)
• Evaluate the efficacy of data capture
• Evaluate the efficacy and accuracy of data transmission
• Review refinement and approval of quality assurance procedures
9. The results of these analyses will be utilized to examine the quality of data and whether the expected data structure agrees with the observed data capture (see section 3.3.1).
1.2 Instrumentation
10. In addition to the examination of quality control measures on survey operations, the Field Trial must also provide measures of the quality of the survey instruments, including the adequacy of scoring procedures, translation and adaptation quality, and scaling and analytic procedures. In particular, the evidence collected in the Field Trial will be used to address the following issues related to the cognitive instrumentation:
• Accuracy and comparability of survey instruments (including the translation of scoring guides and all related manuals)
• Timing and flow of cluster-level and item-level responses
• Appropriateness of items across participating countries
• Response and nonresponse distributions for items and clusters
11. These issues will be examined using different approaches such as item fit based on item response theory (IRT) scaling (cf. section 1.4 and section 3), item analyses (IA) based on classical test theory (CTT), score frequencies, correlations, response time information, or Kappa analyses (see section 3).
1.3 Computer delivery platform
12. An elaborate computer-based assessment (CBA) will be introduced in PISA 2015 for the majority of countries. Thus, in addition to examining the cognitive instruments and survey operations, the Field Trial also must address the following issues related to the computer-delivery platform:

CY6_GEN_FTAnalysisPlan-Cognitive_1 (2)
6
• Evaluation of response capture and automatic scoring
• Evaluation of the flow of cluster assignment and item presentation
• Evaluation of the efficiency and accuracy of the computer platform in capturing information
• Evaluation of the accuracy and efficiency of test-taker instructions
• Examination of stability and effectiveness of the delivery system during the assessment
• Accuracy of information and contents of the process data in log files
13. Statistical analysis of timing and process data as well as analyses from the IRT scaling and item analyses based on CTT will be used to reveal possible problems related to the computer platform with regard to response capture of items.
1.4 Scaling and psychometric item characteristics
14. In order to support the comparability of inferences of PISA 2015 results across countries, including trend results, the equivalency of the psychometric characteristics of the items needs to be established. The PISA 2015 Field Trial data will be used to examine the psychometric characteristics of the items and scales, evaluate the equivalence of item parameters with respect to linking items that provide a connection to prior PISA cycles (PISA 2000-PISA 2012), and evaluate the equivalence of item parameters between computer-based and paper-based assessment modes. In addition, the Field Trial data provide initial data on the functioning of items that have been introduced for the 2015 cycle. These data will be used to estimate preliminary IRT item parameters that will serve as a basis for selecting new items and constructing booklets for the Main Study. In particular, the Field Trial will address the following issues associated with the IRT scaling and psychometric analyses:
• Examination of the equivalency of item characteristics for the reading, mathematics, and science linking items based on PBA trend data
• Examination of the equivalency of item characteristics of reading, mathematics, and science items across paper- and computer-based modes based on the comparison between PBA trend and CBA trend data
• Examination of the equivalency of item characteristics across countries and language versions primarily based on CBA trend data
• Identification of items in the reading, mathematics, science, and CPS to guide the selection of items for the Main Study
• Examination of the expected proportions for subsamples routed to the different forms and delivery modes

CY6_GEN_FTAnalysisPlan-Cognitive_1 (2)
7
15. The issues around equivalency and item selection will be mainly addressed via IRT scaling using an innovative approach combining the Rasch model and the two-parameter logistic (2PL) model (see section 3) as well as item analysis based on CTT.
2. Assessment design and innovation
16. The PISA 2015 assessment design includes a PBA and CBA. The PBA comprises items from the three core domains of reading, mathematics, and science administered in the past PISA surveys (2000 through 2012), while the CBA includes newly developed items based on the 2015 science framework and the CPS framework in addition to the items included in the PBA (see Table 1). The PISA 2015 test design includes items from the previous studies linking all of the different PISA cycles (2000 through 2015). Some items exist in paper- and computer-based versions that allow the PBA and CBA scales to be linked. CPS, as a new optional domain, comprises only computer-based items (due to its interactive features). Because it is a new domain, there are no linking items.
Table 1. Domain coverage for the PISA 2015 Field Trial and Main Study
Domain Coverage NEW (CBA only)
TREND (CBA and PBA)
Field Trial Main Study Field Trial Main Study
Reading Literacy NO NO 6
30-min clusters
6
30-min clusters
Mathematical Literacy NO NO
6
30-min clusters
6
30-min clusters
Scientific Literacy 12
30-min clusters
9
30-min clusters
6
30-min clusters
6
30-min clusters
Collaborative Problem Solving
4
30-min clusters
3
30-min clusters NO NO
17. Because the main focus of PISA 2015 will be on the CBA, the Field Trial aims to examine the equivalency of the two assessment modes (PBA and CBA) in terms of measurement characteristics for trend material as well as the linking between the modes. Countries that plan to use the CBA in the Main Study will need to use PBA booklets in the Field Trial in addition to CBA booklets to allow the examination of mode effects. As such, the Field Trial design includes more PBA booklets than the Main Study design. Without testing for mode effects, it would not be possible for these countries to measure trends with regard to previous PISA cycles when PBA was used. The Field Trial design will allow for an evaluation of the assessments as
CY6_GEN_FTAnalysisPlan-Cognitive_1 (2)
8
they relate to trend measures assessed in two different modes, paper and computer-based. In Section 2.3 we review overall design of the Field Trial that will allow this evaluation.
2.1 Summary of assessment design features
18. The main features of the PISA 2015 assessment design are as follows:
• The CBA includes all core domains and all linking items (providing a link between PBA and CBA, and between the previous PISA cycles) as well as new items. The CBA will comprise the following item sets:
− Reading and mathematics: Intact clusters of paper-based items from previous cycles, reauthored for computer delivery
− Science: intact clusters of paper-based items from previous cycles, reauthored for computer delivery, plus new items developed for computer delivery
− CPS: new items developed for computer delivery only
• The PBA contains only existing items from pre-2015 administrations (i.e., there is no new item development) and is available for countries that are unable to administer a CBA or choose not to take the CBA in 2015.
• Both the paper- and computer-based assessments will use a rotated design (with optional adaptive features for the CBA) that allows for full construct coverage while limiting the individual testing time to a maximum of 120 minutes. This means that each student will take only a subset of items across the assessed domains.
19. Within the rotated CBA test design, previously used reading, math, and science item clusters (PISA 2000-2012) will be combined with new science and CPS item clusters.
2.2 Reducing systematic errors and improving the measurement of trends
20. An important goal in large-scale assessments is to reduce systematic errors that could lead to the identification of false group differences and misinterpretation of results a new approach to measuring trends is applied. One potential source of error was identified in the effects of item-by-country interactions (e.g., Glas & Jehangir, 2013; Oliveri & von Davier, 2011, 2014) and was found to be amplified in minor domains due to decreased construct coverage (Weeks, Yamamoto, & von Davier, 2013). Instead of covering the minor domain with a limited set of link clusters compared to the major domain in each PISA cycle, the PISA 2015 test design includes all (or almost all) of the previously used—but not released—items from each minor domain while reducing the number of students responding to each minor domain cluster (see Figure 1). The result is that the construct representation for each minor domain is at a level comparable to the major domain cycle. This approach will reduce the potential for systematic error (bias) introduced due to item-by-country interactions and the switch from major to minor domains in the current design while slightly increasing uncertainty due to sampling. The expected result is a stabilization and improvement of the measurement of trend.

CY6_GEN_FTAnalysisPlan-Cognitive_1 (2)
9
Figure 1. Left side: construct coverage in prior PISA designs by major and minor domains; right side: new approach in PISA 2015
The vertical bars represent the construct coverage, and the reduced number of students per item is represented by the narrowing bars of the two minor domains.
21. In order to measure trends over longer periods of time, an additional feature is introduced in the PISA 2015 test design. Every time the framework is renewed for a major domain (i.e., with the beginning of each domain rotation), a new set of items is developed to reflect the evolution of the construct. For PISA 2015, it is anticipated that the new framework for science will broaden the construct and enable PISA to measure skills in a way that was not possible in 2006, the last time that scientific literacy was a major domain. This means that a new scale based on the renewed framework and the existing scale represented by the previous framework need to be linked. Figure 2 provides an illustration of the design for linking the science framework from 2006 with the new framework in 2015.
Figure 2. Comparison of the approach to measuring trends in the domain science in prior PISA cycles with the new approach in PISA 2015
22. The left side of Figure 2 represents the domain rotation for science from 2006 through 2012 as major and minor domains. The height of the bars represents the coverage of the scientific literacy construct; the width of each bar represents the proportion of students responding to each item. The right side of Figure 2 represents the next domain rotation for science beginning in 2015. It has two important functions: it must link back to the previous domain rotation and lay the foundation for the trend that will move forward to 2021 and beyond. The bar representing the 2015 cycle, when science again is a major domain, is divided into three sections, and is explained below.

CY6_GEN_FTAnalysisPlan-Cognitive_1 (2)
10
23. The narrow bar for 2015 represents the construct of the science domain from the previous domain rotation. Notice that it is taller than the bars shown for 2009 and 2012, representing an increase in construct coverage. This means that an increased number of clusters from the previous major domain assessment cycles will be included in 2015 and following assessments. This covers the constructs more fully for minor domains in contrast to the subset of clusters in minor domains than were included under the major/minor approach used prior to 2015. As mentioned above, this is important because it will reduce the potential for bias and is expected to stabilize and improve the measurement of trend.
24. The wider bar represents new items created for the 2015 assessment in the science domain. The top portion of that bar represents new items that reflect the revised 2015 construct. The bottom portion of the bar represents items that reflect the old construct.
25. Finally, the bars for 2018 and 2021 represent science as a minor domain, establishing a new trend line from a construct point of view. The smaller, bottom sections represent the overlap
between the old 2006 and the new 2015 construct, either based on trend or new items. The top section represents new items reflecting the new 2015 construct.
26. The PISA 2015 linking design, as outlined above, avoids systematic errors in trend measures introduced by the new framework and by the reduction of the minor domain item pool by providing a backward-looking trend with greater coverage of the construct. For the forward-looking trend, a “new scale” is created that contains items representing the previous framework definition of the construct along with items added to reflect the new framework. This new approach will enable one to disentangle changes in average proficiency that result from either the old or the revised framework, and provides regular opportunities to introduce important and innovative ideas into (renewed) major assessment domains.
27. The successful implementation of the design above also depends on the sample size and the strict random assignment of students across booklets and assessment modes. Both will be described in the following two sections.
2.3 Assessment design for the Field Trial
28. The Field Trial design includes an administration time of 120 minutes for the direct assessments that includes pairwise sets of items from the four domains (two domains per form) and an additional 30 minutes for the background questionnaire. A total of 1,950 students from multiple schools were randomly assigned to one of three groups according to prescribed probabilities:1) paper administration of trend items, referred to as Group1-PBA Trend, 2) computer administration of trend items, referred to as Group2-CBA Trend, and 3) computer administration of new items, referred to as Group3-CBA and New Science/CPS. Based to this design, 18 of the 78 students sampled in each school (23%) will be assigned to one of the forms in Group 1-PBA Trend; 27 of the 78 students (35%) will be assigned to one of the test forms in Group 2-CBA Trend; and, 33 of the 78 students (42%) will be assigned to one of the test forms in Group 3-CBA New Science/CPS. The successful implementation of the design above rests on strict random assignment of students to one of the three groups identified in Figure 3 below.
29. In order to test for mode effects, a set of 18 paper-based forms covering the domains of reading, mathematics, and science were constructed for Group1-PBA Trend from items administered in the past PISA surveys. The “identical” set of tasks from the 18 paper-based forms were adapted and re-authored for computer

CY6_GEN_FTAnalysisPlan-Cognitive_1 (2)
11
administration yielding 18 equivalent computer-based test forms. In addition, there are 12 test forms consisting of the new 2015 science tasks and 12 new test forms combining those 2015 science tasks with the new CPS tasks. The schematic for the CBA design is shown in Figure 3.
30. A small sample of students will also be selected to assess financial literacy. Approximately six students per school from Group 1-PBA Trend will take this domain as a PBA instrument and approximately nine students per school from Group 2-CBA Trend will take this domain as a CBA instrument. (This design will provide a sample size of approximately 375 students—150 students taking the PBA version and 225 students taking the CBA version).
Figure 3. Field Trial CBA design
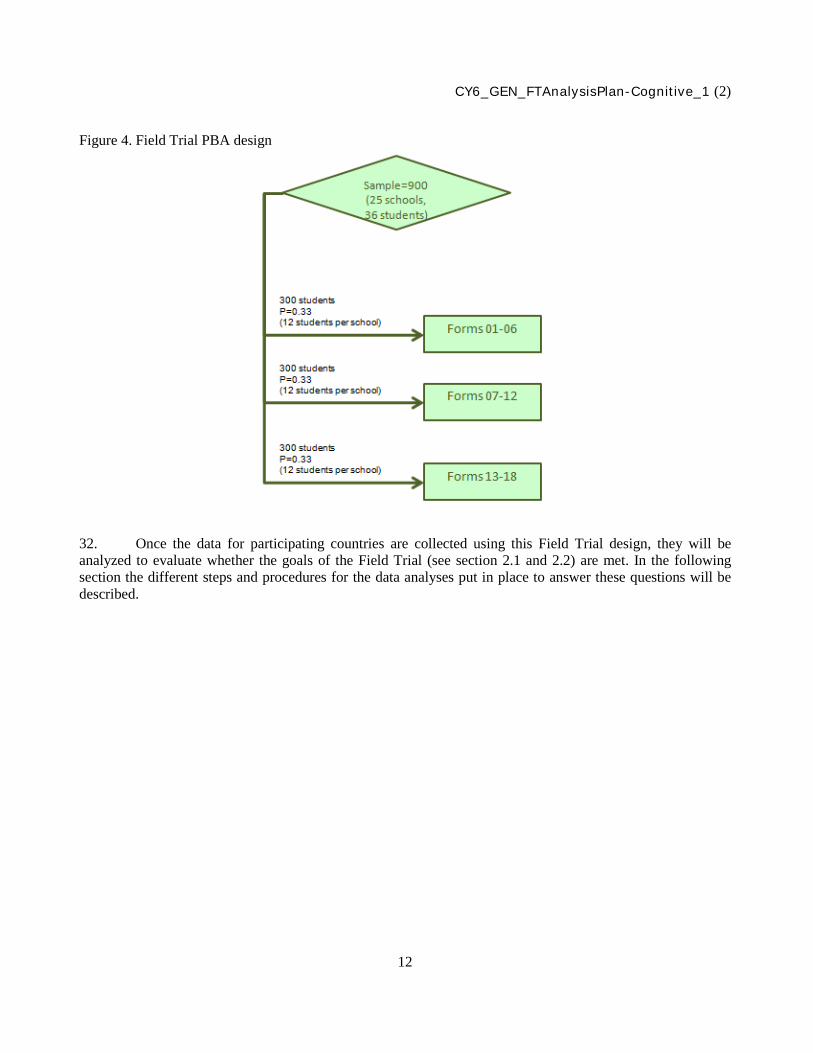
31. Countries that choose the PBA design for the Main Study will be measuring student performance with only paper-and-pencil forms in the Field Trial. These students will be randomly assigned one of the 18 paper-based forms containing the trend items from two of the three core domains for PISA—reading, mathematics, and science (see Figure 4).
CY6_GEN_FTAnalysisPlan-Cognitive_1 (2)
12
Figure 4. Field Trial PBA design
32. Once the data for participating countries are collected using this Field Trial design, they will be analyzed to evaluate whether the goals of the Field Trial (see section 2.1 and 2.2) are met. In the following section the different steps and procedures for the data analyses put in place to answer these questions will be described.
CY6_GEN_FTAnalysisPlan-Cognitive_1 (2)
13
3. IRT models for PISA 2015
33. International large-scale assessment (ILSA) data is a challenge in size, complexity, and comparability for many standard methods of test analysis. The analysis of the Field Trial data follows best practices outlined in, for example, Yamamoto and Mazzeo (1992), Mislevy and Sheehan (1987), Glas and Verhelst (1995), and Adams, Wilson, and Wu (1997). More recent overviews of the different aspects of the methodology can be found in von Davier, Sinharay, Oranje and Beaton (2006), Glas and Jehangir (2013), Weeks, Yamamoto and von Davier (2013), von Davier and Sinharay (2013) and Mazzeo & von Davier (2013). The methods used in PISA as well as other assessments are based on models originally developed within the framework of IRT that have evolved into very flexible approaches for the analysis of large scale, multi-level categorical data (e.g., Skrondal & Rabe-Hesketh, 2004; von Davier & Yamamoto, 2004, 2007; Adams, Wu & Carstensen, 2007). This section describes the IRT models that will be used for scaling the PISA 2015 Field Trial data, how the quality of the Field Trial data will be evaluated before starting with statistical analyses, and how the quality of the trend measure (from PISA 2000 to PISA 2015) will be ensured with regard to the introduction of state of the art IRT models, new assessment modes (CBA) and test design innovations to PISA 2015. An overview will be given of the different analyses that will be conducted to examine the PISA 2015 Field Trial data.
3.1 Evaluation of item by country interactions
34. Some have raised concerns over the insufficiencies of the Rasch model to adequately address the complexity of the PISA data. These researchers believe that these complexities can be better addressed through the use of a more general item response model. This section provides a general description of the Rasch model. It then introduces the more general 2-pl model and describes tools that will be used to monitor and address item by country interactions.
35. In all prior PISA cycles (2000-2012), the Rasch model (1960) was used to calibrate and scale the items. The Rasch model for dichotomous data postulates that the probability of response x to item i by
respondent v depends on only two parameters, on the difficulty of the item and the respondent’s ability or
trait level :
(1)
36. The probability of a positive response (e.g., solving an item) is strict monotonic increasing in and decreasing in . If a respondent’s ability matches the item difficulty, the expected probability of a correct response is equal to 0.50. Stated differently, item difficulty under the Rasch model can be interpreted as the threshold at which a person is just as likely to answer the item correctly or incorrectly.
37. The 2PL model (Birnbaum, 1968) is a generalization of the Rasch model. Like the Rasch model, the 2PL assumes that the probability of response x to item i by respondent v depends on the difference between the respondent’s trait level and the difficulty of the item . In addition, the 2PL postulates that for every
iβ
vθ
vθ
iβ
vθ iβ

CY6_GEN_FTAnalysisPlan-Cognitive_1 (2)
14
item, the association between this difference and the response probability depends on an additional item discrimination parameter :
(2)
38. The probability of a positive response (e.g., solving an item correctly) is strictly monotonic, increasing in and decreasing in . The item discrimination parameter , sometimes scaled by a constant D=1.7, characterizes how fast the probability of solving endorsing the item approaches 1.00 with increasing trait level when compared to other items. In other words, the model accounts for the possibility that
responses to different items are not equally strongly related to the latent trait. The discrimination parameter describes how well a certain item discriminates between examinees with different trait levels compared to other items on the test.
39. The approach that will be taken for the PISA 2015 analysis is a model that combines features of the Rasch model and the 2PL. This more general model will be applied to the PISA 2015 field and main test data. As a first step, all items will be fit using the Rasch/partial credit model (PCM; Masters, 1982). For items that show poor fit to the Rasch model, a more general item characteristic in the shape of the 2PL (Birnbaum, 1968) or the generalized partial credit model (GPCM; Muraki, 1992) will be used. Moreover, in order to account for cultural and language differences in the multiple populations tested, procedures outlined in Glas and Verhelst (1995), Yamamoto (1997), Glas and Jehangir (2013), as well as Oliveri and von Davier (2001, 2014) will be applied. Based on the research studies just cited, the approach can be expected to help to retain linking items across modes or to prior assessments that would otherwise be excluded from the trend measure (the more link items with good fit across groups, the more stable the link becomes). Additionally, this design avoids a minor-major-domain problem that is likely to occur if different numbers of items associated with each construct are administered in different test cycles (e.g., if a domain was a minor domain in a certain cycle it was measured with fewer clusters of items, and thus reported estimates are less reliable).
40. For a review of the PCM and GPCM used for items with more than two response categories, refer to the Handbook of Modern Item Response Theory (van der Linden & Hambleton, 1997) or their new 2nd Edition of the Handbook (van der Linden & Hambleton, 2004), or to von Davier and Sinharay (2013) for the use of these models in the context of international comparative assessments.
41. In order to examine the appropriateness of the Rasch model and common item parameters, item fit statistics will be calculated. More specifically, the proposed approach is based on the mean deviation (MD) and the root mean square deviation (RMSD). Both measures quantify the magnitude and direction of deviations in the observed data from the estimated item characteristic curve (ICC) for each single item. While the MD is most sensitive to the deviations of observed item difficulty parameters from the estimated ICC, the RMSD is sensitive to the deviations of both the observed item difficulty parameters and item slope parameters. In contrast to other measures that provide confidence intervals for the evaluation of model data fit, the MD and RMSD indices are not affected by sample size issues that tend to result in many significant deviations observed in large samples when using Rasch based infit and outfit measures. Moreover, MD and RMSD are available for a range of IRT models, while infit and outfit are typically only provided for the Rasch model.
iα
vθ iβ iα
vθ
iα

CY6_GEN_FTAnalysisPlan-Cognitive_1 (2)
15
42. IRT models and item fit statistics will be used to examine item-by-country interaction, that is, the fit of trend (linking) items across PISA cycles and countries as well as the fit of new items in PISA 2015 across countries (all separately for each domain). To examine item-by-country and item-by-country-by-cycle interactions, model constraints in both cases (i.e. constraints on linking items and new items) will be utilized to estimate item parameters across cycles and countries in a concurrent calibration. In a first round of analyses, all linking items in PISA 2015 will be fixed to the value obtained from analyses of prior PISA cycles (see section 2). If an item shows deviations from these common (or international) item parameters, unique item parameters will be estimated by releasing the equality constraints from these items in subsequent rounds of analyses. Common and unique item parameters will be estimated simultaneously using the software mdltm (von Davier, 2005). This is the same software application that will be used for the IRT analyses in PISA 2015. The end result of the concurrent calibration is that all item parameters in each domain are situated on one common scale.
43. The need for assigning unique parameters is an issue that is likely to affect only a small number of items; the vast majority of items are expected to fit well for all or almost all countries using international item parameters. A similar approach was already successfully implemented in the Adult Literacy and Lifeskills survey, the International Adult Literacy Survey, and the Programme for the International Assessment of Adult Competencies (PIAAC; OECD, 2000, 2013).
44. To demonstrate the use of item fit statistics (RMSD, MD), Figure 5 shows a typical plot of a case (for the 2PL) to illustrate how the data from one country might not support the use of common item parameters.
CY6_GEN_FTAnalysisPlan-Cognitive_1 (2)
16
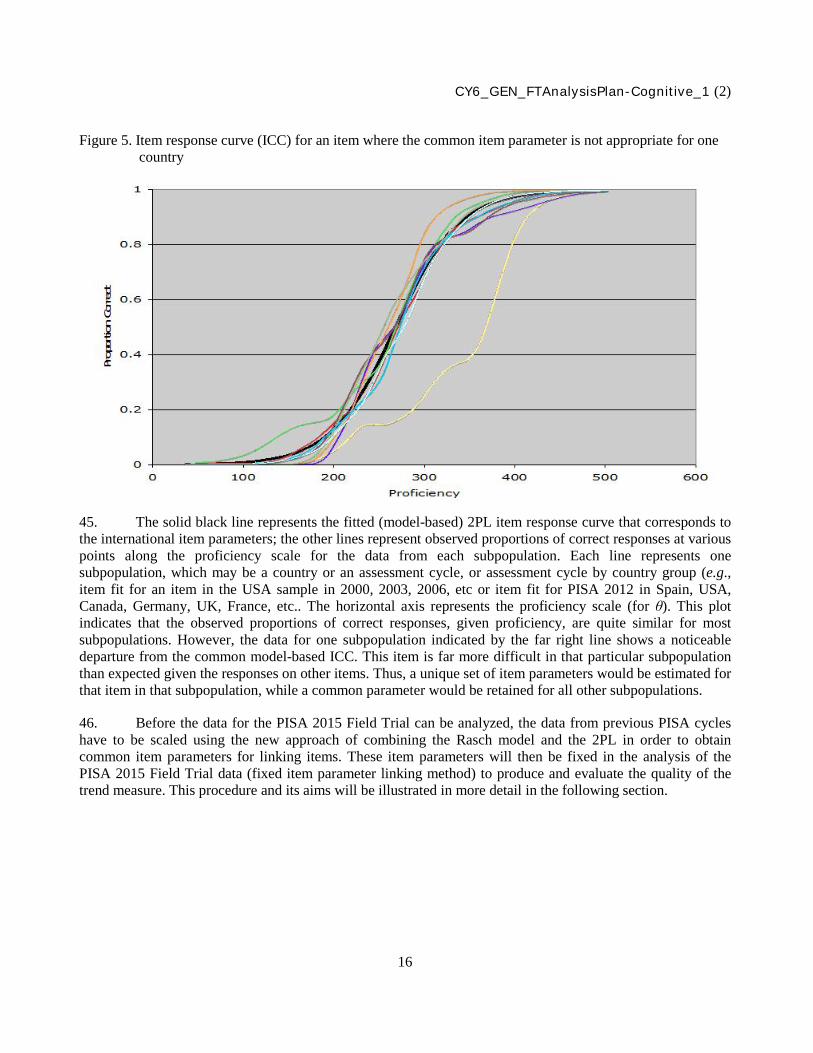
Figure 5. Item response curve (ICC) for an item where the common item parameter is not appropriate for one country
45. The solid black line represents the fitted (model-based) 2PL item response curve that corresponds to the international item parameters; the other lines represent observed proportions of correct responses at various points along the proficiency scale for the data from each subpopulation. Each line represents one subpopulation, which may be a country or an assessment cycle, or assessment cycle by country group (e.g., item fit for an item in the USA sample in 2000, 2003, 2006, etc or item fit for PISA 2012 in Spain, USA, Canada, Germany, UK, France, etc.. The horizontal axis represents the proficiency scale (for θ). This plot indicates that the observed proportions of correct responses, given proficiency, are quite similar for most subpopulations. However, the data for one subpopulation indicated by the far right line shows a noticeable departure from the common model-based ICC. This item is far more difficult in that particular subpopulation than expected given the responses on other items. Thus, a unique set of item parameters would be estimated for that item in that subpopulation, while a common parameter would be retained for all other subpopulations.
46. Before the data for the PISA 2015 Field Trial can be analyzed, the data from previous PISA cycles have to be scaled using the new approach of combining the Rasch model and the 2PL in order to obtain common item parameters for linking items. These item parameters will then be fixed in the analysis of the PISA 2015 Field Trial data (fixed item parameter linking method) to produce and evaluate the quality of the trend measure. This procedure and its aims will be illustrated in more detail in the following section.

CY6_GEN_FTAnalysisPlan-Cognitive_1 (2)
17
3.2 Reanalysis of PISA 2000-2012 data prior to the 2015 Field Trial analyses1
47. The reanalysis of PISA data from prior cycles (2000-2012) aims to stabilize the trend measure and to ensure its quality. PISA 2015 introduces a number of significant changes and innovations to the assessment program. Some of them, such as the introduction of CBA as the main mode of assessment, might influence the item parameter estimates for the linking items. Moreover, some linking items might not work equally well for all of the populations assessed in PISA 2015. Linking items that do not work equally well across subgroups (i.e., are not measuring the same construct in all populations) reduce the comparability of the trend measure. They need to be identified and excluded from the Main Study item pool. However, given the new scaling approach for PISA 2015 (the combined Rasch and 2PL model), it may be possible to retain some of these items.
48. Results from prior analyses (PISA 2000-2012) were replicated and then reexamined using the combined Rasch and 2PL model. The reanalysis produced a common parameter for each of the previously used items that is contained in the databases from PISA 2000 to 2012 and that can be considered as a starting point of scaling in PISA 2015 Field Trial data. This will ensure a solid database of item characteristics on a common international scale based on the past frameworks of each domain.
49. In a next step, scoring reliability, as well as mode and position effects will be examined to evaluate the quality of the data that are to be scaled. The following section will describe this process.
3.3 Evaluation of data quality and scoring of the PISA 2015 Field Trial
50. Before the PISA 2015 Field Trial data are scaled using the IRT models and item-by-country interactions are evaluated (as outlined above), the data will be examined for possible effects of different assessment modes (PBA, CBA) and position effects. Additionally, the different codes for response scoring used in prior PISA cycles will be translated into a common coding so that the data are comparable. The contractor for PISA Core 3 (Educational Testing Service; ETS) will analyze this unified database for PBA and CBA for mode and cluster position and order effects of various kinds.
51. The PISA 2015 assessment continues to require human scoring for both paper- and computer-based open-ended items. This additional translation of the raw response to a scored response has to be evaluated. For this purpose, a double scoring design was developed that is executed after data collection and will provide two scores for human-scored item responses. This double scoring database is the raw material for statistical evaluation of rater (marker) agreement and will be utilized to provide the basis for the steps outlined in section 3.3.2 below.
52. There are various effects associated with moving test administrations mode to the computer that can be anticipated based on previous experience. Results from PIAAC indicate that the data quality of item responses captured and automatically scored with CBA is superior to responses captured on the PBA, thus improving reliability and validity of survey. Another often observed mode effect is the improved response rate and completion rate for CBA administration. PISA historically has been administered on paper. While the increased response rate of CBA improves reliability and validity of 2015 PISA, it may reduce comparability to the historical results. This is especially critical due to the impact on calibration as well as proficiency estimation if nonresponse correlates with proficiency. Section 3.3.3 outlines the details of the analytic 1 These analyses were planned and implemented using ETS funding outside the PISA scope of work. ETS conducted these analyses to ensure that the
proposed approach was feasible for PISA 2015 before actually proposing it in the Field Trial analysis plan.

CY6_GEN_FTAnalysisPlan-Cognitive_1 (2)
18
approach taken to evaluate these effects. The potential effects of administration mode will be examined again during IRT scaling and described in section 4.2.
3.3.1 Data quality and structure
53. The first step of the Field Trial data analysis is to evaluate the data quality and structure of data in terms of the amount of data and how well the Field Trial design is reflected in the data structure. If the Field Trial design was not implemented well, subsequent analyses may not be able to assert the equivalency of trend scale, the evaluation of mode effect, the accurate estimation of IRT parameters for the new items, and construction of main test booklets. For example, the response rate at each school should be high and consistent across all three groups. The number of students and the demographic characteristics of students in each group represent how well the administration operation adhered to the Field Trial design. The completion rate of students in each group should be high and consistent. Timing of administration should be consistent across three groups, across schools, and across countries. Various pieces of data for every student can be matched, complete and consistent.
3.3.2 Scoring reliability
54. Accurate and reliable scoring of items, especially for open-ended items coded by human scorers, are key components of quality control and are necessary for ensuring valid assessment results. The scales on which we build the PISA statistical framework are only as good as the scores that compose them. Items are scored to classify responses into predefined response categories and to determine whether respondents have answered the questions correctly. Some items are double scored as a measure of quality assurance to determine whether the coding rubrics are being applied consistently. The ability to compare results among scorers as well as across countries has as a prerequisite the consistent application of scoring rules by all personnel responsible for human scoring of item responses both within and across countries.
55. Cohen’s Kappa (Cohen, 1960) is a statistical measure of rater agreement analyses that is used in many applications of scoring reliability studies. Kappa provides a correction for agreement by chance. Kappa, as well as the percent of direct scoring agreement, will be calculated for every item and over all items per country. Scoring reliability will be computed within and across countries, as well as across assessment modes (PBA, CBA). This information will be used to evaluate scoring procedures, scorers, the scoring guide and items based on the consistency of scoring. Scoring issues might be the underlying reason for item misfit or country by item interactions in the IRT scaling and should be identified and fixed before scoring wherever possible.
3.3.3 Item analyses, mode effects, position effects before IRT scaling
56. Item analyses will be conducted using classical test theory at both the national and international level to identify outliers, as well as human- and machine-scoring issues and other technical issues with regard to the CBA collected data. The same analyses be conducted for PBA items then combined and compared with the CBA classical item statistics. Potential mode effects will be examined together with effects of cluster position, context, and the different missing data treatments. All descriptive statistics will be provided for observed responses as well as the various missing response codes and compared across modes and cluster positions for each item.
57. More specifically, item difficulties (proportion correct, P+), frequencies of scores (number of: respondents attempted, correct and incorrect responses, omitted items, not-reached items), logit, point biserial

CY6_GEN_FTAnalysisPlan-Cognitive_1 (2)
19
correlations, and response time information within each domain per item and item cluster will be examined in the PISA 2015 Field Trial and will be compared to results from prior PISA cycles. This will be done separately for data from the PBA and the CBA to account for possible mode effects. These analyses will also be done separately for each country in order to identify outliers (single items that seem to work differently across assessment cycles and countries). Comparisons will be made at a language-by-country level and irregular cases such as outliers as well as cases with obvious scoring rule deviations will be identified.
58. The comparison of results from the PBA and CBA for each item will be conducted for each core domain—science, reading, mathematics—and for each item response type—multiple-choice or closed response formats (mostly computer based scores)—and open-ended response formats (human rater based scores).
59. Possible item position and block position effects will be examined for each domain by starting with the last item per block and looking at the item statistics as well as missing responses. As position effects could also interact with mode effects or even be responsible for mode effects, they will be examined with regard to assessment mode (PBA, CBA) as well. Analyses will be done on a language-by-country level, and materials summarizing the results for platform improvement or country-level verification will be prepared.
4. IRT scaling of the PISA 2015 Field Trial data
60. This section describes the IRT analyses and the enhanced scaling approach to be executed on the basis of the PISA 2015 Field Trial. Utilizing the model general approach to IRT scaling as outlined above allows testing the quality and dimensional alignment of items and scales, as well as the different goals of the PISA 2015 Field Trial with regard to the implementation in the main study. Analyses will be conducted for each PISA domain examining item-by-country and item-by-language interactions, as well as item-by-cycle and item-by-mode interaction to test the comparability of scales and assessment modes (PBA, CBA) within and across countries. IRT scaling results for the PISA 2015 Field Trial also provide vital information required to select items for the main study, and for developing branching rules for a possible multi-stage adaptive testing—if the Field Trial data indicate that sufficient difficulty variation is available in the new cluster data to enable such an approach in the Main Study.
4.1 Timeline for scaling
61. PISA 2015 Field Trial data from the first set of countries are expected to arrive in May 2014. Only data from Field Trial countries that will be received and cleaned by August 2014 will be included in the international IRT scaling. Data from Field Trial countries with a later date of delivery cannot be included in the initial IRT scaling. However, data from these additional countries will be checked by calculating classical item statistics, as well as by conducting item analyses and examination of mode and position effects. Analyses involving IRT scaling have to be finalized as early as the beginning of September 2014 as these results are needed in the assembly of the item pool for the Main Study data collection. In order to best influence the Main Study item pool for the 2015 data collection, it is imperative that countries supply their Field Trial data following this timeline.
4.2 Evaluating the PISA 2015 FT data against 2000-2012 data
62. In the PISA 2015 Field Trial, a new scaling approach is applied by introducing the 2PL model where necessary in addition to the Rasch model (see section 1). The evaluation of the FT data will rely on a study conducted at ETS that combines all data from prior PISA cycles 2000-2012 and utilizes this combined

CY6_GEN_FTAnalysisPlan-Cognitive_1 (2)
20
database to estimate parameters with the approach outlined above. This ensures that item parameters for trend task materials are based on the largest possible evidence base. The generated parameters will be used as fixed quantities to evaluate the FT data since the FT data alone would not suffice to estimate sufficiently accurate parameters for all items as the sample size per country is not large enough. This will allow to estimate new item parameters on the same scale only for the CBA material, and to evaluate trend material against item parameters estimated based on all of the history of PISA.
63. The fixed item parameters approach results in linking the trend items to the previous PISA scale and allows examination of the linking. This technique will produce results that indicate whether trend items are functioning equally across cycles and participating countries. The fixed item parameters are additionally constraint to be estimated equally across all prior PISA assessment cycles as outlined in section 2 in order to ensure the comparison of Field Trial data against the most accurate estimate of common item parameters. For items that appear not to be appropriately fitted when applying these international parameters from previous rounds, the deviation of the item characteristic in the 2015 Field Trial will be used as an indication that these work differently across assessment cycles. Further examination of these items involving inspection of log files and raw data may reveal reasons for these deviations. If no remedial actions can be taken in the PISA timeline, the affected item(s) will be removed from the trend measure. It is assumed that the fixed item parameters should fit data from the PISA 2015 Field Trial data well, but close monitoring of the functioning of all trend items in the PBA and the CBA assessment modes will ensure that potential mode effects can be detected and effectively dealt with.
64. IRT calibrations will be carried out separately for each of the PISA 2015 domains science, reading, financial literacy, mathematics, and CPS. With regard to science, the major domain in 2015, there will be PBA items from prior cycles (old items), which will be administered either as PBA or (new for PISA 2015) as CBA items; these CBA items are PBA items that are reauthored for computer delivery in order to provide a link between PBA and CBA. An evaluation of potential mode effects on trend items will be carried out through examining item by mode interaction on data from Group 1-PBA Trend and Group 2-CBA Trend. In addition, new science items were developed for 2015 based on a revised science assessment framework. These new items exist in the CBA mode only because PISA is moving forward to a complete rollout of computer-based assessment in the next few cycles. Dimensionality analyses will ensure that the differences between new and old science items are well understood. Based on the results of these analyses, suggestions for reporting of trend relative to the new science framework based scale will be prepared.
4.3 CPS as new domain in PISA 2015
65. CPS will be introduced as a new domain in PISA 2015. Item fit and appropriateness of international parameters facilitating comparative analyses will be conducted for the CPS scale in the same way it is tested for the core scales of PISA. Also, item analyses based on classical test theory will be conducted and the automated scoring rules will be evaluated, and if necessary, refined. Current psychometric methodologies will be applied to examine the scoring of strings of actions deemed to be indicative of collaboration in addition to more traditional scoring approaches that assign correct or incorrect choices. These analyses will be exploratory and will help to validate the approach taken when developing the scoring guidelines for the CPS items.
66. More specifically, in contrast to other PISA domains, the partly sequential response formats in this new domain could lead to conditional dependencies in certain response paths (this means, a certain response is chosen depending on the response to the prior item). Possible conditional dependencies will be examined via crosstabs and correlations as well as an exploration of scaling methods that model and quantify the loss of
CY6_GEN_FTAnalysisPlan-Cognitive_1 (2)
21
information due to potential dependencies of responses. In addition, process data from the log files will be utilized to gather information about student behavior at a more fine-grained level. The process data will be analyzed with respect to association with responses to the set of problem solving data as well as to relevant background characteristics of students.
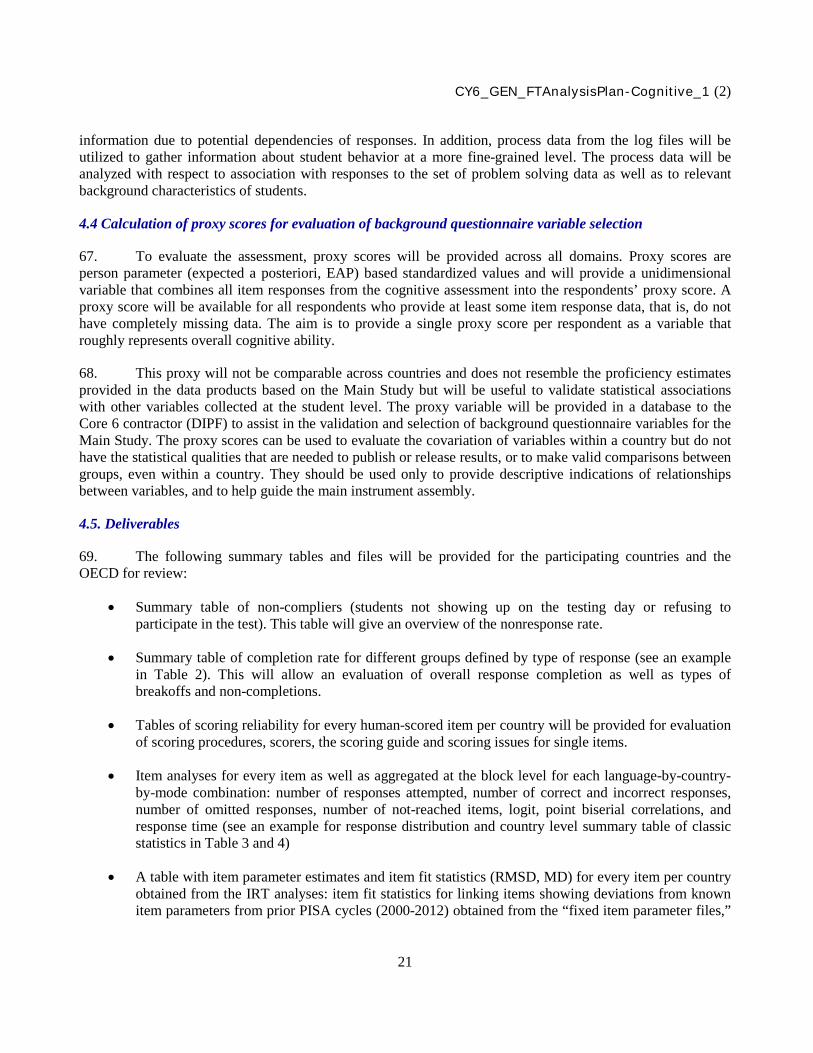
4.4 Calculation of proxy scores for evaluation of background questionnaire variable selection
67. To evaluate the assessment, proxy scores will be provided across all domains. Proxy scores are person parameter (expected a posteriori, EAP) based standardized values and will provide a unidimensional variable that combines all item responses from the cognitive assessment into the respondents’ proxy score. A proxy score will be available for all respondents who provide at least some item response data, that is, do not have completely missing data. The aim is to provide a single proxy score per respondent as a variable that roughly represents overall cognitive ability.
68. This proxy will not be comparable across countries and does not resemble the proficiency estimates provided in the data products based on the Main Study but will be useful to validate statistical associations with other variables collected at the student level. The proxy variable will be provided in a database to the Core 6 contractor (DIPF) to assist in the validation and selection of background questionnaire variables for the Main Study. The proxy scores can be used to evaluate the covariation of variables within a country but do not have the statistical qualities that are needed to publish or release results, or to make valid comparisons between groups, even within a country. They should be used only to provide descriptive indications of relationships between variables, and to help guide the main instrument assembly.
4.5. Deliverables
69. The following summary tables and files will be provided for the participating countries and the OECD for review:
• Summary table of non-compliers (students not showing up on the testing day or refusing to participate in the test). This table will give an overview of the nonresponse rate.
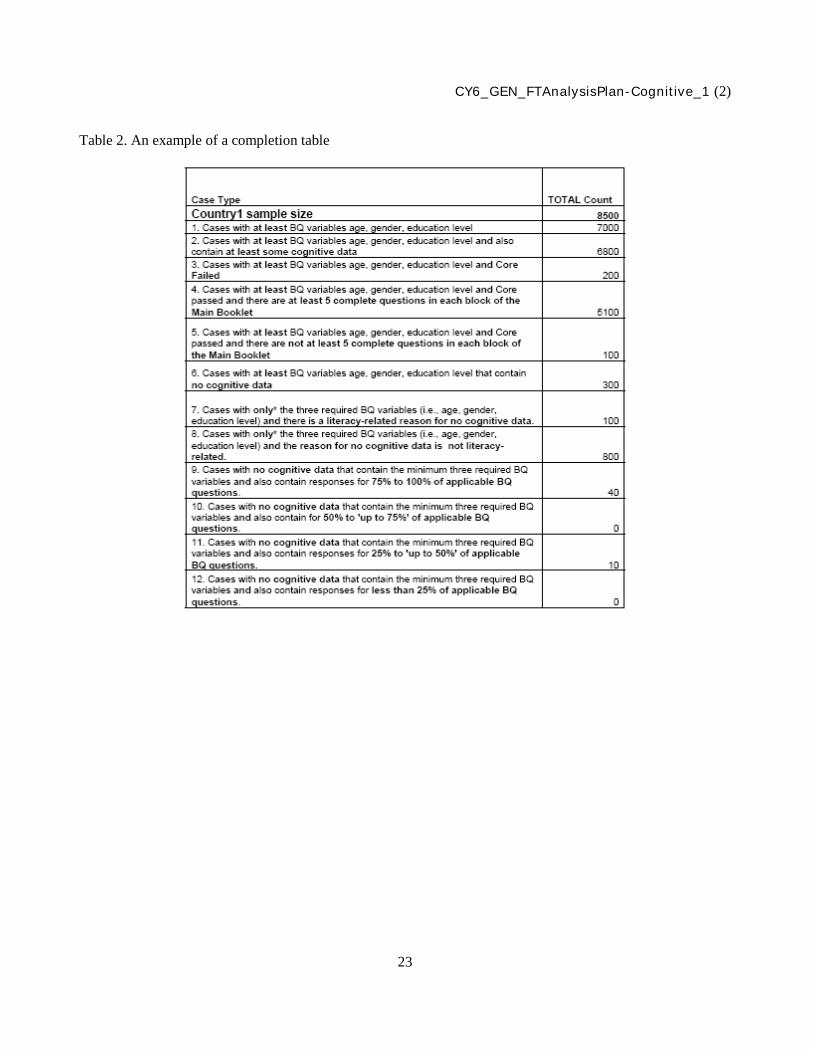
• Summary table of completion rate for different groups defined by type of response (see an example in Table 2). This will allow an evaluation of overall response completion as well as types of breakoffs and non-completions.
• Tables of scoring reliability for every human-scored item per country will be provided for evaluation of scoring procedures, scorers, the scoring guide and scoring issues for single items.
• Item analyses for every item as well as aggregated at the block level for each language-by-country-by-mode combination: number of responses attempted, number of correct and incorrect responses, number of omitted responses, number of not-reached items, logit, point biserial correlations, and response time (see an example for response distribution and country level summary table of classic statistics in Table 3 and 4)
• A table with item parameter estimates and item fit statistics (RMSD, MD) for every item per country obtained from the IRT analyses: item fit statistics for linking items showing deviations from known item parameters from prior PISA cycles (2000-2012) obtained from the “fixed item parameter files,”

CY6_GEN_FTAnalysisPlan-Cognitive_1 (2)
22
and item fit statistics for new items showing deviations from common (international) item parameters in terms of item-by-language-by-mode interactions (see an example of an item parameter report in Table 5)
• Tables showing the distribution proxy scores per respondent subgroup, standardized by country. This will allow a review of subgroup differences and an evaluation of results in relation to expectations based on prior cycles.
• A list of items designated for inclusion in the final item pool and booklet design for the PISA 2015 Main Study. This will be the basis for a recommended main test booklet set to be presented to the PGB and OECD Secretary for approval.
4.6 Schedule for item selection
70. The proposed item selection for the Main Survey instruments will be presented to the following:
• PGB members and NPMs (by written consultation): end of September 2014, with possibility to give feedback on proposed item selection until October 15th, 2014;
• TAG, SEG, and CPEG during their respective meetings in October 2014;
• Final item selection will be presented to the PGB and NPMs for information, at their meetings in early November 2014.
CY6_GEN_FTAnalysisPlan-Cognitive_1 (2)
23
Table 2. An example of a completion table

CY6_GEN_FTAnalysisPlan-Cognitive_1 (2)
24
Table 3. Response distribution
Table 4. Summary classic statistics per country

CY6_GEN_FTAnalysisPlan-Cognitive_1 (2)
25
Table 5. Summary of item parameters report
5. Summary of Field Trial analysis goals
71. The Field Trial analysis goals are complex, ranging from studying mode effects to finalization of instrumentation to the testing and evaluation of operational procedures and standards. In light of the analytical goals of the Field Trial, these can be summarized in terms of the major psychometric analyses described in some detail above. Each of these major analytical steps is executed to support evaluations that help finalize the instruments of the main test and will generate the Field Trial database and deliverables for PGB and country level review. More specifically:
1. The statistical equivalence of the samples collected in the three Field Trial groups —Group 1-PBA Trend, Group 2-CBA Trend, Group3-new CBA—will be evaluated in order to ensure that the intended random assignment of students to these groups was successful. This will be asserted primarily based on the equivalence of administrative conditions and by comparing distributions of demographic variables across the three groups. This equivalency verification allows using the assumption of identical proficiency distributions for the three groups to place item parameters of new science items on a comparable scale together with the CBA trend items.
2. The invariance of PBA item parameters will be assessed based on an evaluation of the data collected on Group 1-PBA Trend. This analysis will take place aggregated across all countries and will be compared against the item parameters estimated based on the historical data of PISA from 2000 to 2012 for each domain. Item-by-country interactions will be recorded and appropriately addressed by item treatments if necessary. These results will be reviewed in regard to how scoring standards were implemented and to assess the quality of translation and adaptation of the item material.
3. The invariance of PBA and CBA item parameters of trend items will be assessed based on the evaluation of the data collected on Group1-PBA Trend and Group 2-CBA Trend. The data will be aggregated across all countries. Item-by-country interactions will be recorded and appropriately addressed by item treatments. Results will be reviewed in regard to implementation of scoring standards and the quality translation and adaptation.
4. Multiple sources of evidence will be used to compile the recommended booklets for the Main Study data collection. This includes the estimated item parameters as well as item information

CY6_GEN_FTAnalysisPlan-Cognitive_1 (2)
26
functions and item characteristics and information about the coverage of the assessment framework. This information will be used to construct the item pool for the Main Study. Given the statistical information available for each item, this approach allows us to project the expected and test characteristics as well as test information for each booklet and cluster, in order to ensure that the Main Study instrumentation meets the requirements of construct coverage and difficulty distribution equivalency.
72. While the Field Trial serves multiple purposes, the main thrust remains that all goals are focused around preparing for the main data collection. This will ensure that the best possible combination of trend blocks and new assessment materials can be found and compiled into booklets that engage students sampled in PISA 2015 at a level that is appropriate for the population of interest. It also provides evidence that supports the reliability, validity and comparability of the cognitive assessment instruments.
CY6_GEN_FTAnalysisPlan-Cognitive_1 (2)
27
REFERENCES
Adams, R. J., Wilson, M. R., & Wu, M. L. (1997). Multilevel item response models: An approach to errors in variables regression. Journal of Educational and Behavioural Statistics, 22, 46–75.
Adams, R. J., Wu, M. L., & Carstensen, C. H. (2007). Application of multivariate Rasch models in international large-scale educational assessments. In M. von Davier, & C. H. Carstensen (Eds.), Multivariate and mixture distribution Rasch models: Extensions and applications (pp. 271-280). New York, NY: Springer.
Birnbaum, A. (1968). On the estimation of mental ability (Series Report No. 15). Randolph Air Force Base, TX: USAF School of Aviation Medicine.
Bock, R. D., & Zimowski, M. F. (1997). Multiple group IRT. In W. J. van der Linden & R. K. Hambleton (Eds.), Handbook of modern item response theory (pp. 433-448). New York, NY: Springer-Verlag.
Cohen, J. (1960). A coefficient of agreement for nominal scales. Educational and Psychological Measurement, 20, 37-46.
Glas, C. A. W., & Jehangir, K. (2014) Modeling country specific differential item functioning. In L. Rutkowski, M. von Davier, D. Rutkowski (Eds.) Handbook of International large-scale assessment. Boca Raton, FL: CRC Press.
Glas, C. A. W., & Verhelst, N. D. (1995). Testing the Rasch model. In G. H. Fischer & I. W. Molenaar (Eds.), Rasch models: Foundations, recent developments, and applications (pp. 69-95). New York, NY: Springer.
Masters, G. N. (1982). A Rasch model for partial credit scoring. Psychometrika, 47, 149-174.
Mazzeo, J., & von Davier, M. (2013). Linking scales in international large-scale assessments. In L. Rutkowski, M. von Davier, & D. Rutkowski (Eds.), Handbook of international large-scale assessment: background, technical issues, and methods of data analysis Boca Raton, FL: CRC Press.
Mislevy, R. J., & Sheehan, K. M. (1987). Marginal estimation procedures. In A. E. Beaton (Ed.), Implementing the new design: The NAEP 1983-84 technical report. (Report No. 15-TR-20). Princeton, NJ: Educational Testing Service.
Muraki, E. (1992). A generalized partial credit model: Application of an EM algorithm. Applied Psychological Measurement, 16, 159-177.
OECD (2000). Literacy in the information age: final report of the International Adult Literacy Survey, IALS. Retrieved from the OECD website: http://www.oecd.org/edu/innovation-education/39437980.pdf
OECD (2013). Technical report of the Survey of Adult Skills (PIAAC), Ch. 17 (pp. 406-438), PIAAC. Retrieved from the OECD website: http://www.oecd.org/site/piaac/_ Technical%20Report_17OCT13.pdf
CY6_GEN_FTAnalysisPlan-Cognitive_1 (2)
28
Oliveri, M. E. & von Davier, M. (2011). Investigation of model fit and score scale comparability in international assessments. Psychological Test and Assessment Modeling, 53(3), 315-333. Retrieved from http://www.psychologie-aktuell.com/fileadmin/download/ptam/3-2011_20110927/04_Oliveri.pdf
Oliveri, M. E., & von Davier, M. (2014) Toward increasing fairness in score scale calibrations employed in international large-scale assessments. International Journal of Testing, 14(1), pp. 1-21, doi:10.1080/15305058.2013.825265.
Rasch, G. (1960). Probabilistic models for some intelligence and attainment tests. Copenhagen, Denmark: Nielsen & Lydiche (Expanded edition, Chicago, University of Chicago Press, 1980).
Skrondal, A. and Rabe-Hesketh, S. (2004). Generalized Latent variable modeling: Multilevel, longitudinal and structural equation models. Boca Raton, FL: Chapman & Hall/CRC.
van der Linden, W. J., & Hambleton, R. K. (1997). Handbook of modern item response theory. New York, NY: Springer.
van der Linden, W. J., & Hambleton, R. K. (2014). Handbook of modern item response theory, 2nd edition, New York, NY: Springer.
von Davier, M. (2005). A general diagnostic model applied to language testing data (Research report RR-05-16). Princeton, NJ: Educational Testing Service.
von Davier, M., & Sinharay, S. (2013). Analytics in international large-scale assessments: item response theory and population models. In L. Rutkowski, M. von Davier, & D. Rutkowski (Eds.), Handbook of international large-scale assessment: background, technical issues, and methods of data analysis. Boca Raton, FL: CRC Press.
von Davier, M. Sinharay, S., Oranje, A. & Beaton, A. (2006). Statistical procedures used in the National Assessment of Educational Progress (NAEP): Recent developments and future directions. In C. R. Rao and S. Sinharay (Eds.), Handbook of statistics (Vol. 26): Psychometrics. Amsterdam, Netherlands: Elsevier.
von Davier, M., & Yamamoto, K. (2004). Partially observed mixtures of IRT models: an extension of the generalized partial credit model. Applied Psychological Measurement, 28(6), 389-406.
Weeks, J., Yamamoto, K., & von Davier, M. (2013). Design considerations for the program for international student assessment. In L. Rutkowski, M. von Davier, & D. Rutkowski (Eds.), Handbook of international large-scale assessment: Background, technical issues, and methods of data analysis. Boca Raton, FL: CRC Press.
Yamamoto, K. (1997). A chapter: Scaling and scale linking. International Adult Literacy survey technical report. Ottawa, Canada: Statistics Canada.
Yamamoto, K., & Mazzeo, J. (1992). Item response theory scale linking in NAEP. Journal of Educational Statistics, 17(2), 155-174.