pisa 2015 results in focus - oecd. · pdf file... the oecd programme for international student...
TRANSCRIPT

Results in Focus
PISA 2015
PISA 2015 Results in Focus © OECD 20182
Over the past decade, the OECD Programme for International Student Assessment, PISA,
has become the world’s premier yardstick for evaluating the quality, equity and efficiency
of school systems. By identifying the characteristics of high-performing education systems,
PISA allows governments and educators to identify effective policies that they can then adapt
to their local contexts.
The latest PISA assessment in 2015 focused on science. From taking a painkiller to
determining what is a “balanced” meal, from drinking pasteurised milk to deciding whether
or not to buy a hybrid car, science is ubiquitous in our lives. And science is not just test tubes
and the periodic table; it is the basis of nearly every tool we use – from a simple can opener
to the most advanced space explorer. More important, science is not only the domain of
scientists. In the context of massive information flows and rapid change, everyone now needs
to be able to “think like a scientist”: to be able to weigh evidence and come to a conclusion;
to understand that scientific “truth” may change over time, as new discoveries are made, and
as humans develop a greater understanding of natural forces and of technology’s capacities
and limitations.
This brochure highlights some of the results from PISA 2015. PISA shows that every country
has room for improvement, even the top performers. With high levels of youth unemployment,
rising inequality, a significant gender gap, and an urgent need to boost inclusive growth
in many countries, we have no time to lose in providing the best education possible for
all students.
Angel Gurría OECD Secretary-General
““

© OECD 2018 3
Key features of PISA 2015
Content
• The PISA 2015 survey focused on science, with reading, mathematics and collaborative problem solving as minor areas of assessment. PISA 2015 also included an assessment of young people’s financial literacy, which was optional for countries and economies.
Participating students
• Approximately 540 000 students completed the assessment in 2015, representing about 29 million 15-year-olds in the schools of the 72 participating countries and economies.
The assessment
• Computer-based tests were used, with assessments lasting a total of two hours for each student.
• Test items were a mixture of multiple-choice questions and questions requiring students to construct their own responses. The items were organised in groups based on a passage setting out a real-life situation. About 810 minutes of test items for science, reading, mathematics and collaborative problem solving were covered, with different students taking different combinations of test items.
• Students also answered a background questionnaire, which took 35 minutes to complete. The questionnaire sought information about the students themselves, their homes, and their school and learning experiences. School principals completed a questionnaire that covered the school system and the learning environment. For additional information, some countries/economies decided to distribute a questionnaire to teachers. It was the first time that this optional teacher questionnaire was offered to PISA-participating countries/economies. In some countries/economies, optional questionnaires were distributed to parents, who were asked to provide information on their perceptions of and involvement in their child’s school, their support for learning in the home, and their child’s career expectations, particularly in science. Countries could choose two other optional questionnaires for students: one asked students about their familiarity with and use of information and communication technologies; and the second sought information about students’ education to date, including any interruptions in their schooling, and whether and how they are preparing for a future career.
What is PISA?
“What is important for citizens to know and be able to do?” In response to that question and to the need for internationally comparable evidence on student performance, the Organisation for Economic Co-operation and Development (OECD) launched the triennial survey of 15-year-old students around the world known as the Programme for International Students Assessment, or PISA. PISA assesses the extent to which 15-year-old students, near the end of their compulsory education, have acquired key knowledge and skills that are essential for full participation in modern societies. The assessment focuses on the core school subjects of science, reading and mathematics. Students’ proficiency in an innovative domain is also assessed (in 2015, this domain is collaborative problem solving). The assessment does not just ascertain whether students can reproduce knowledge; it also examines how well students can extrapolate from what they have learned and can apply that knowledge in unfamiliar settings, both in and outside of school. This approach reflects the fact that modern economies reward individuals not for what they know, but for what they can do with what they know.
PISA is an ongoing programme that offers insights for education policy and practice, and that helps monitor trends in students’ acquisition of knowledge and skills across countries and in different demographic subgroups within each country. PISA results reveal what is possible in education by showing what students in the highest-performing and most rapidly improving education systems can do. The findings allow policy makers around the world to gauge the knowledge and skills of students in their own countries in comparison with those in other countries, set policy targets against measurable goals achieved by other education systems, and learn from policies and practices applied elsewhere. While PISA cannot identify cause-and-effect relationships between policies/practices and student outcomes, it can show educators, policy makers and the interested public how education systems are similar and different – and what that means for students.
PISA 2015 Results in Focus © OECD 20184
Excellence and equity in education
Students’ performance in reading and mathematics
• About 20% of students in OECD countries, on average, do not attain the baseline level of proficiency in reading. This proportion has remained stable since 2009.
• On average across OECD countries, the gender gap in reading in favour of girls narrowed by 12 points between 2009 and 2015: boys’ performance improved, particularly among the highest-achieving boys, while girls’ performance deteriorated, particularly among the lowest-achieving girls.
• More than one in four students in Beijing-Shanghai-Jiangsu-Guangdong (China), Hong Kong (China), Singapore and Chinese Taipei are top-performing students in mathematics, meaning that they can handle tasks that require the ability to formulate complex situations mathematically, using symbolic representations.
Equity in education
• Canada, Denmark, Estonia, Hong Kong (China) and Macao (China) achieve high levels of performance and equity in education outcomes.
• Socio-economically disadvantaged students across OECD countries are almost three times more likely than advantaged students not to attain the baseline level of proficiency in science. But about 29% of disadvantaged students are considered resilient – meaning that they beat the odds and perform at high levels. And in Macao (China) and Viet Nam, students facing the greatest disadvantage on an international scale outperform the most advantaged students in about 20 other PISA-participating countries and economies.
• While between 2006 and 2015 no country or economy improved its performance in science and equity in education simultaneously, the relationship between socio-economic status and student performance weakened in nine countries where mean science scores remained stable. The United States shows the largest improvements in equity during this period.
• On average across OECD countries, and after taking their socio-economic status into account, immigrant students are more than twice as likely as their non-immigrant peers to perform below the baseline level of proficiency in science. Yet 24% of disadvantaged immigrant students are considered resilient.
• On average across countries with relatively large immigrant student populations, attending a school with a high concentration of immigrant students is not associated with poorer student performance, after accounting for the school’s socio-economic intake.
What the data tell us
Students’ performance in science and attitudes towards science
• Singapore outperforms all other participating countries/economies in science. Japan, Estonia, Finland and Canada, in descending order of mean science performance, are the four highest-performing OECD countries.
• Some 8% of students across OECD countries (and 24% of students in Singapore) are top performers in science, meaning that they are proficient at Level 5 or 6. Students at these levels are sufficiently skilled in and knowledgeable about science to creatively and autonomously apply their knowledge and skills to a wide variety of situations, including unfamiliar ones.
• About 20% of students across OECD countries perform below Level 2, considered the baseline level of proficiency in science. At Level 2, students can draw on their knowledge of basic science content and procedures to identify an appropriate explanation, interpret data, and identify the question being addressed in a simple experiment. All students should be expected to attain Level 2 by the time they leave compulsory education.
• In the majority of countries with comparable data, students’ performance in science remained essentially unchanged since 2006. However, mean performance in science improved between 2006 and 2015 in Colombia, Israel, Macao (China), Portugal, Qatar and Romania. Over this period, Macao (China), Portugal and Qatar increased the share of students performing at or above Level 5 and simultaneously reduced the share of students performing below the baseline level of proficiency (Level 2).
• Even though gender differences in science performance tend to be small, on average, in 33 countries and economies, the share of top performers in science is larger among boys than among girls. Finland is the only country in which girls are more likely to be top performers than boys.
• On average across OECD countries, 25% of boys and 24% of girls reported that they expect to work in a science-related occupation. But boys and girls tend to think of working in different fields of science: girls envisage themselves as health professionals more than boys do; and in almost all countries, boys see themselves as becoming information and communications technologies (ICT) professionals, scientists or engineers more than girls do.

PISA 2015 Results in Focus © OECD 2018 5
Snapshot of performance in science, reading and mathematics
Countries/economies with a mean performance/share of top performers above the OECD average Countries/economies with a share of low achievers below the OECD average
Countries/economies with a mean performance/share of top performers/share of low achievers not significantly different from the OECD average
Countries/economies with a mean performance/share of top performers below the OECD average Countries/economies with a share of low achievers above the OECD average
Science Reading Mathematics Science, reading and mathematics
Mean score in PISA 2015
Average three-year trend
Mean score in PISA 2015
Average three-year trend
Mean score in PISA 2015
Average three-year trend
Share of top performers in at least one subject (Level 5 or 6)
Share of low achievers in all three subjects (below Level 2)
Mean Score dif. Mean Score dif. Mean Score dif. % %OECD average 493 -1 493 -1 490 -1 15.3 13.0
Singapore 556 7 535 5 564 1 39.1 4.8Japan 538 3 516 -2 532 1 25.8 5.6Estonia 534 2 519 9 520 2 20.4 4.7Chinese Taipei 532 0 497 1 542 0 29.9 8.3Finland 531 -11 526 -5 511 -10 21.4 6.3Macao (China) 529 6 509 11 544 5 23.9 3.5Canada 528 -2 527 1 516 -4 22.7 5.9Viet Nam 525 -4 487 -21 495 -17 12.0 4.5Hong Kong (China) 523 -5 527 -3 548 1 29.3 4.5B-S-J-G (China) 518 m 494 m 531 m 27.7 10.9Korea 516 -2 517 -11 524 -3 25.6 7.7New Zealand 513 -7 509 -6 495 -8 20.5 10.6Slovenia 513 -2 505 11 510 2 18.1 8.2Australia 510 -6 503 -6 494 -8 18.4 11.1United Kingdom 509 -1 498 2 492 -1 16.9 10.1Germany 509 -2 509 6 506 2 19.2 9.8Netherlands 509 -5 503 -3 512 -6 20.0 10.9Switzerland 506 -2 492 -4 521 -1 22.2 10.1Ireland 503 0 521 13 504 0 15.5 6.8Belgium 502 -3 499 -4 507 -5 19.7 12.7Denmark 502 2 500 3 511 -2 14.9 7.5Poland 501 3 506 3 504 5 15.8 8.3Portugal 501 8 498 4 492 7 15.6 10.7Norway 498 3 513 5 502 1 17.6 8.9United States 496 2 497 -1 470 -2 13.3 13.6Austria 495 -5 485 -5 497 -2 16.2 13.5France 495 0 499 2 493 -4 18.4 14.8Sweden 493 -4 500 1 494 -5 16.7 11.4Czech Republic 493 -5 487 5 492 -6 14.0 13.7Spain 493 2 496 7 486 1 10.9 10.3Latvia 490 1 488 2 482 0 8.3 10.5Russia 487 3 495 17 494 6 13.0 7.7Luxembourg 483 0 481 5 486 -2 14.1 17.0Italy 481 2 485 0 490 7 13.5 12.2Hungary 477 -9 470 -12 477 -4 10.3 18.5Lithuania 475 -3 472 2 478 -2 9.5 15.3Croatia 475 -5 487 5 464 0 9.3 14.5CABA (Argentina) 475 51 475 46 456 38 7.5 14.5Iceland 473 -7 482 -9 488 -7 13.2 13.2Israel 467 5 479 2 470 10 13.9 20.2Malta 465 2 447 3 479 9 15.3 21.9Slovak Republic 461 -10 453 -12 475 -6 9.7 20.1Greece 455 -6 467 -8 454 1 6.8 20.7Chile 447 2 459 5 423 4 3.3 23.3Bulgaria 446 4 432 1 441 9 6.9 29.6United Arab Emirates 437 -12 434 -8 427 -7 5.8 31.3Uruguay 435 1 437 5 418 -3 3.6 30.8Romania 435 6 434 4 444 10 4.3 24.3Cyprus1 433 -5 443 -6 437 -3 5.6 26.1Moldova 428 9 416 17 420 13 2.8 30.1Albania 427 18 405 10 413 18 2.0 31.1Turkey 425 2 428 -18 420 2 1.6 31.2Trinidad and Tobago 425 7 427 5 417 2 4.2 32.9Thailand 421 2 409 -6 415 1 1.7 35.8Costa Rica 420 -7 427 -9 400 -6 0.9 33.0Qatar 418 21 402 15 402 26 3.4 42.0Colombia 416 8 425 6 390 5 1.2 38.2Mexico 416 2 423 -1 408 5 0.6 33.8Montenegro 411 1 427 10 418 6 2.5 33.0Georgia 411 23 401 16 404 15 2.6 36.3Jordan 409 -5 408 2 380 -1 0.6 35.7Indonesia 403 3 397 -2 386 4 0.8 42.3Brazil 401 3 407 -2 377 6 2.2 44.1Peru 397 14 398 14 387 10 0.6 46.7Lebanon 386 m 347 m 396 m 2.5 50.7Tunisia 386 0 361 -21 367 4 0.6 57.3FYROM 384 m 352 m 371 m 1.0 52.2Kosovo 378 m 347 m 362 m 0.0 60.4Algeria 376 m 350 m 360 m 0.1 61.1Dominican Republic 332 m 358 m 328 m 0.1 70.7
1. Note by Turkey: The information in this document with reference to “Cyprus” relates to the southern part of the Island. There is no single authority representing both Turkish and Greek Cypriot people on the Island. Turkey recognises the Turkish Republic of Northern Cyprus (TRNC). Until a lasting and equitable solution is found within the context of the United Nations, Turkey shall preserve its position concerning the “Cyprus issue”.Note by all the European Union Member States of the OECD and the European Union: The Republic of Cyprus is recognised by all members of the United Nations with the exception of Turkey. The information in this document relates to the area under the effective control of the Government of the Republic of Cyprus.Notes: Values that are statistically significant are marked in bold.The average trend is reported for the longest available period since PISA 2006 for science, PISA 2009 for reading, and PISA 2003 for mathematics.Countries and economies are ranked in descending order of the mean science score in PISA 2015.Source: OECD, PISA 2015 Database, Tables I.2.4a, I.2.6, I.2.7, I.4.4a and I.5.4a.
PISA 2015 Results in Focus © OECD 20186
At a time when science literacy is increasingly linked to economic growth and is necessary for finding solutions to complex social and environmental problems, all citizens, not just future scientists and engineers, need to be willing and able to confront science-related dilemmas.
For most of the 20th century, school science curricula, especially in upper secondary education, tended to focus on providing the foundations for the training of a small number of scientists and engineers. These curricula mostly presented science in a form that focused on providing students with the basic facts, laws or theories related to the various disciplines of science rather than on the broader concepts of scientific enquiry and the evolving nature of scientific “truth”. Based on students’ ability to master those facts and theories, educators tended to identify students who could continue to study science beyond compulsory education, rather than encouraging every student to be engaged with science.
Promoting a positive and inclusive image of science is important. Too often, school science is seen as the first segment of a (leaky) pipeline that will ultimately select those who will work as scientists and engineers. Not only does the “pipeline” metaphor discount the many pathways successful scientists have travelled to reach their career goals, it also conveys a negative image of those who do not end up as scientists and engineers. Because knowledge and understanding of science is useful well beyond the work of scientists and is, as PISA argues, necessary for full participation in a world shaped by science-based technology, school science should be promoted more positively – perhaps as a “springboard” to new sources of interest and enjoyment.
Parents and teachers can challenge gender stereotypes about science-related activities and occupations to allow girls and boys to achieve their potential.
Among the subjects of science, mathematics and reading, science is the one where mean gender differences in performance in PISA are smallest; and these differences vary significantly across countries. This indicates that gender disparities in performance do not stem from innate differences in aptitude, but rather from factors that parents, teachers, policy makers and opinion leaders can influence.
Most students who sat the PISA 2015 test expressed a broad interest in science topics and recognised the important role that science plays in their world; but only a minority of students reported that they participate in science activities. Boys and girls, and students from advantaged and disadvantaged backgrounds, often differ in the ways they engage with science and envisage themselves working in science-related occupations later on. Gender-related differences in science engagement and career expectations appear more related to disparities in what boys and girls think they are good at and is good for them, than to differences in what they actually can do.
Stereotypes about scientists and about work in science-related occupations (computer science is a “masculine” field and biology a “feminine” field; scientists achieve success due to brilliance rather than hard work; scientists are “mad”) can discourage some students from engaging further with science. In addition to challenging gender stereotypes, parents and teachers can help support students’ engagement with science by helping students become more aware of the range of career opportunities that are made available with training in science and technology.
The most immediate way to nurture interest in science among students with less supportive home environments may be to increase early exposure to high-quality science instruction in schools.
PISA 2015 shows that, in most participating countries and economies, socio-economic status and an immigrant background are associated with significant differences in student performance. For example, disadvantaged students score 88 points lower in science than advantaged students, on average across OECD countries. And in more than 40 countries and economies, and after accounting for students’ performance in the science assessment, disadvantaged students remain significantly less likely than their advantaged peers to see themselves pursuing a career in science.
Yet PISA also shows that the relationship between students’ background and their outcomes in education varies widely across countries. In some high-performing countries, this relationship is weaker than average – implying that high achievement and equity in education outcomes are not mutually exclusive. This underlines PISA’s definition of equity as high performance among students from all backgrounds, rather than as small variations in student performance only. In PISA 2015, Canada, Denmark, Estonia, Hong Kong (China) and Macao (China) achieved both high levels of performance and greater equity in education.
PISA 2015 Results in Focus © OECD 2018 7
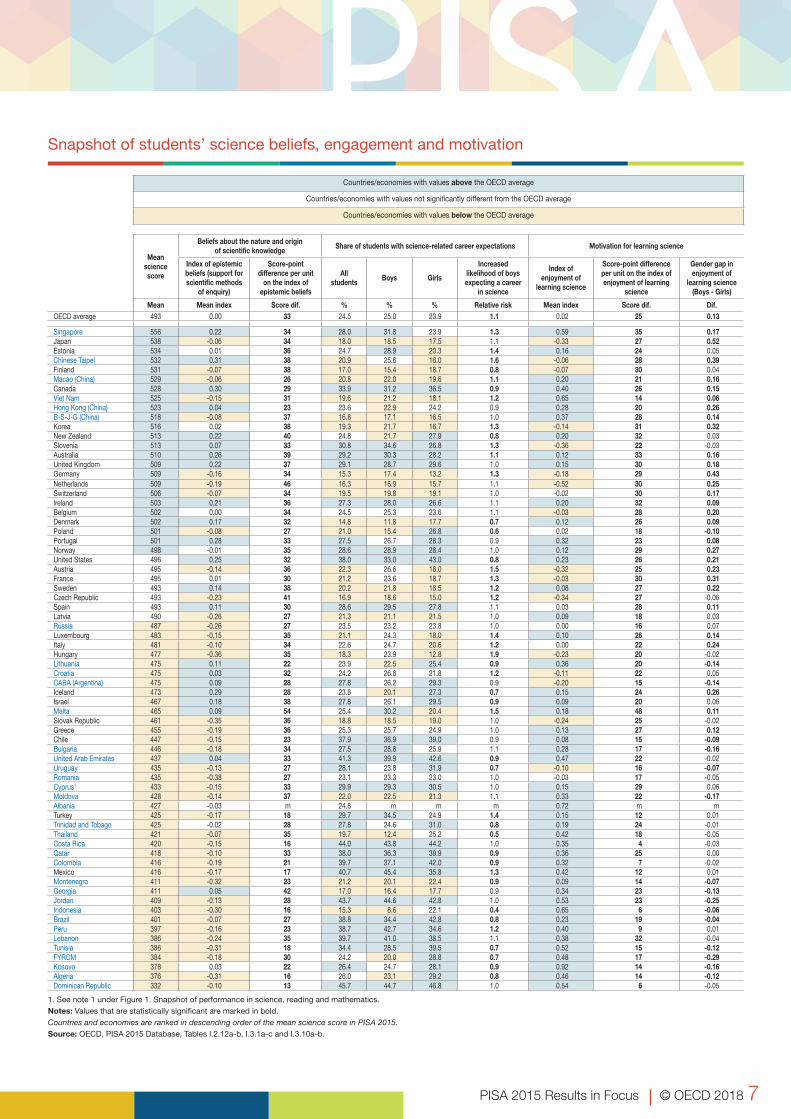
Snapshot of students’ science beliefs, engagement and motivation
Countries/economies with values above the OECD average
Countries/economies with values not significantly different from the OECD average
Countries/economies with values below the OECD average
Mean science score
Beliefs about the nature and origin of scientific knowledge Share of students with science-related career expectations Motivation for learning science
Index of epistemic beliefs (support for scientific methods
of enquiry)
Score-point difference per unit
on the index of epistemic beliefs
All students Boys Girls
Increased likelihood of boys expecting a career
in science
Index of enjoyment of
learning science
Score-point difference per unit on the index of enjoyment of learning
science
Gender gap in enjoyment of
learning science (Boys - Girls)
Mean Mean index Score dif. % % % Relative risk Mean index Score dif. Dif.OECD average 493 0.00 33 24.5 25.0 23.9 1.1 0.02 25 0.13
Singapore 556 0.22 34 28.0 31.8 23.9 1.3 0.59 35 0.17Japan 538 -0.06 34 18.0 18.5 17.5 1.1 -0.33 27 0.52Estonia 534 0.01 36 24.7 28.9 20.3 1.4 0.16 24 0.05Chinese Taipei 532 0.31 38 20.9 25.6 16.0 1.6 -0.06 28 0.39Finland 531 -0.07 38 17.0 15.4 18.7 0.8 -0.07 30 0.04Macao (China) 529 -0.06 26 20.8 22.0 19.6 1.1 0.20 21 0.16Canada 528 0.30 29 33.9 31.2 36.5 0.9 0.40 26 0.15Viet Nam 525 -0.15 31 19.6 21.2 18.1 1.2 0.65 14 0.06Hong Kong (China) 523 0.04 23 23.6 22.9 24.2 0.9 0.28 20 0.26B-S-J-G (China) 518 -0.08 37 16.8 17.1 16.5 1.0 0.37 28 0.14Korea 516 0.02 38 19.3 21.7 16.7 1.3 -0.14 31 0.32New Zealand 513 0.22 40 24.8 21.7 27.9 0.8 0.20 32 0.03Slovenia 513 0.07 33 30.8 34.6 26.8 1.3 -0.36 22 -0.03Australia 510 0.26 39 29.2 30.3 28.2 1.1 0.12 33 0.16United Kingdom 509 0.22 37 29.1 28.7 29.6 1.0 0.15 30 0.18Germany 509 -0.16 34 15.3 17.4 13.2 1.3 -0.18 29 0.43Netherlands 509 -0.19 46 16.3 16.9 15.7 1.1 -0.52 30 0.25Switzerland 506 -0.07 34 19.5 19.8 19.1 1.0 -0.02 30 0.17Ireland 503 0.21 36 27.3 28.0 26.6 1.1 0.20 32 0.09Belgium 502 0.00 34 24.5 25.3 23.6 1.1 -0.03 28 0.20Denmark 502 0.17 32 14.8 11.8 17.7 0.7 0.12 26 0.09Poland 501 -0.08 27 21.0 15.4 26.8 0.6 0.02 18 -0.10Portugal 501 0.28 33 27.5 26.7 28.3 0.9 0.32 23 0.08Norway 498 -0.01 35 28.6 28.9 28.4 1.0 0.12 29 0.27United States 496 0.25 32 38.0 33.0 43.0 0.8 0.23 26 0.21Austria 495 -0.14 36 22.3 26.6 18.0 1.5 -0.32 25 0.23France 495 0.01 30 21.2 23.6 18.7 1.3 -0.03 30 0.31Sweden 493 0.14 38 20.2 21.8 18.5 1.2 0.08 27 0.22Czech Republic 493 -0.23 41 16.9 18.6 15.0 1.2 -0.34 27 -0.06Spain 493 0.11 30 28.6 29.5 27.8 1.1 0.03 28 0.11Latvia 490 -0.26 27 21.3 21.1 21.5 1.0 0.09 18 0.03Russia 487 -0.26 27 23.5 23.2 23.8 1.0 0.00 16 0.07Luxembourg 483 -0.15 35 21.1 24.3 18.0 1.4 0.10 26 0.14Italy 481 -0.10 34 22.6 24.7 20.6 1.2 0.00 22 0.24Hungary 477 -0.36 35 18.3 23.9 12.8 1.9 -0.23 20 -0.02Lithuania 475 0.11 22 23.9 22.5 25.4 0.9 0.36 20 -0.14Croatia 475 0.03 32 24.2 26.8 21.8 1.2 -0.11 22 0.05CABA (Argentina) 475 0.09 28 27.8 26.2 29.3 0.9 -0.20 15 -0.14Iceland 473 0.29 28 23.8 20.1 27.3 0.7 0.15 24 0.26Israel 467 0.18 38 27.8 26.1 29.5 0.9 0.09 20 0.06Malta 465 0.09 54 25.4 30.2 20.4 1.5 0.18 48 0.11Slovak Republic 461 -0.35 36 18.8 18.5 19.0 1.0 -0.24 25 -0.02Greece 455 -0.19 36 25.3 25.7 24.9 1.0 0.13 27 0.12Chile 447 -0.15 23 37.9 36.9 39.0 0.9 0.08 15 -0.09Bulgaria 446 -0.18 34 27.5 28.8 25.9 1.1 0.28 17 -0.16United Arab Emirates 437 0.04 33 41.3 39.9 42.6 0.9 0.47 22 -0.02Uruguay 435 -0.13 27 28.1 23.8 31.9 0.7 -0.10 16 -0.07Romania 435 -0.38 27 23.1 23.3 23.0 1.0 -0.03 17 -0.05Cyprus1 433 -0.15 33 29.9 29.3 30.5 1.0 0.15 29 0.06Moldova 428 -0.14 37 22.0 22.5 21.3 1.1 0.33 22 -0.17Albania 427 -0.03 m 24.8 m m m 0.72 m mTurkey 425 -0.17 18 29.7 34.5 24.9 1.4 0.15 12 0.01Trinidad and Tobago 425 -0.02 28 27.8 24.6 31.0 0.8 0.19 24 -0.01Thailand 421 -0.07 35 19.7 12.4 25.2 0.5 0.42 18 -0.05Costa Rica 420 -0.15 16 44.0 43.8 44.2 1.0 0.35 4 -0.03Qatar 418 -0.10 33 38.0 36.3 39.9 0.9 0.36 25 0.00Colombia 416 -0.19 21 39.7 37.1 42.0 0.9 0.32 7 -0.02Mexico 416 -0.17 17 40.7 45.4 35.8 1.3 0.42 12 0.01Montenegro 411 -0.32 23 21.2 20.1 22.4 0.9 0.09 14 -0.07Georgia 411 0.05 42 17.0 16.4 17.7 0.9 0.34 23 -0.13Jordan 409 -0.13 28 43.7 44.6 42.8 1.0 0.53 23 -0.25Indonesia 403 -0.30 16 15.3 8.6 22.1 0.4 0.65 6 -0.06Brazil 401 -0.07 27 38.8 34.4 42.8 0.8 0.23 19 -0.04Peru 397 -0.16 23 38.7 42.7 34.6 1.2 0.40 9 0.01Lebanon 386 -0.24 35 39.7 41.0 38.5 1.1 0.38 32 -0.04Tunisia 386 -0.31 18 34.4 28.5 39.5 0.7 0.52 15 -0.12FYROM 384 -0.18 30 24.2 20.0 28.8 0.7 0.48 17 -0.29Kosovo 378 0.03 22 26.4 24.7 28.1 0.9 0.92 14 -0.16Algeria 376 -0.31 16 26.0 23.1 29.2 0.8 0.46 14 -0.12Dominican Republic 332 -0.10 13 45.7 44.7 46.8 1.0 0.54 6 -0.05
1. See note 1 under Figure 1. Snapshot of performance in science, reading and mathematics.Notes: Values that are statistically significant are marked in bold.Countries and economies are ranked in descending order of the mean science score in PISA 2015.Source: OECD, PISA 2015 Database, Tables I.2.12a-b, I.3.1a-c and I.3.10a-b.

PISA 2015 Results in Focus © OECD 20188
Snapshot of equity in education
Countries/economies with higher performance or greater equity than the OECD average
Countries with values not statistically different from the OECD average
Countries/economies with lower performance or less equity than the OECD average
Mean science score in PISA 2015
Inclusion and fairness indicators Difference between PISA 2006 and PISA 2015 (PISA 2015 - PISA 2006)
Coverage of the national 15-year-old population
(PISA Coverage index 3)
Percentage of variation in science performance explained by students’ socio-economic status
Score-point difference in science associated with one-unit increase
on the ESCS1 index
Percentage of resilient students3
Difference in science performance between
immigrant and non-immigrant students, after accounting for ESCS and language spoken
at home4
Percentage of variation in science performance
explained by students’ socio-economic status
Score-point difference in science associated with one-unit increase
on the ESCS index
Percentage of resilient students
Difference in science performance between
immigrant and non-immigrant students, after accounting
for ESCS and language spoken at home
Mean Mean index % Score dif.2 % Score dif. % dif. Score dif. % dif. Score dif.OECD average 493 0.89 12.9 38 29.2 19 -1.4 0 1.5 -6
Singapore 556 0.96 17 47 48.8 -13 m m m mJapan 538 0.95 10 42 48.8 53 1.6 2 8.2 mEstonia 534 0.93 8 32 48.3 28 -1.0 2 2.0 -2Chinese Taipei 532 0.85 14 45 46.3 m 1.0 2 2.0 mFinland 531 0.97 10 40 42.8 36 1.8 10 -10.4 -11Macao (China) 529 0.88 2 12 64.6 -19 -0.1 0 5.8 -2Canada 528 0.84 9 34 38.7 -5 0.3 1 0.7 -11Viet Nam 525 0.49 11 23 75.5 m m m m mHong Kong (China) 523 0.89 5 19 61.8 -1 -1.5 -8 -0.7 10B-S-J-G (China) 518 0.64 18 40 45.3 135 m m m mKorea 516 0.92 10 44 40.4 m 3.1 13 -3.2 mNew Zealand 513 0.90 14 49 30.4 -3 -2.0 0 -4.7 -9Slovenia 513 0.93 13 43 34.6 14 -4.0 -5 4.3 1Australia 510 0.91 12 44 32.9 -13 -0.4 2 -0.2 -8United Kingdom 509 0.84 11 37 35.4 15 -2.9 -8 5.0 9Germany 509 0.96 16 42 33.5 28 -4.0 -5 8.7 7Netherlands 509 0.95 13 47 30.7 23 -3.8 3 -1.3 -10Switzerland 506 0.96 16 43 29.1 16 -0.7 0 1.2 -20Ireland 503 0.96 13 38 29.6 3 -0.5 1 0.4 6Belgium 502 0.93 19 48 27.2 28 -0.7 2 1.4 -32Denmark 502 0.89 10 34 27.5 38 -3.6 -7 7.9 7Poland 501 0.91 13 40 34.6 m -1.4 0 3.2 mPortugal 501 0.88 15 31 38.1 8 -1.4 3 4.4 -49Norway 498 0.91 8 37 26.5 23 -0.4 1 9.3 8United States 496 0.84 11 33 31.6 -5 -6.0 -13 12.3 -10Austria 495 0.83 16 45 25.9 18 0.1 0 -2.2 -17France 495 0.91 20 57 26.6 20 -1.9 5 3.0 10Sweden 493 0.94 12 44 24.7 40 1.2 6 0.6 13Czech Republic 493 0.94 19 52 24.9 2 2.7 1 -3.9 -20Spain 493 0.91 13 27 39.2 26 0.9 3 10.7 -23Latvia 490 0.89 9 26 35.2 14 -0.5 -4 6.0 7Russia 487 0.95 7 29 25.5 5 -0.9 0 -1.0 -4Luxembourg 483 0.88 21 41 20.7 22 -1.7 2 1.5 -16Italy 481 0.80 10 30 26.6 11 -0.6 -1 2.8 -32Hungary 477 0.90 21 47 19.3 -11 0.3 2 -6.7 -13Lithuania 475 0.90 12 36 23.1 2 -2.6 -2 -2.1 11Croatia 475 0.91 12 38 24.4 14 -0.1 3 -0.5 7CABA (Argentina) 475 1.04 26 37 14.9 15 m m m mIceland 473 0.93 5 28 17.0 53 -2.6 -3 -1.8 24Israel 467 0.94 11 42 15.7 -9 0.9 0 2.3 1Malta 465 0.98 14 47 21.8 -5 m m m mSlovak Republic 461 0.89 16 41 17.5 40 -3.6 -4 -2.8 mGreece 455 0.91 13 34 18.1 14 -2.1 -2 -2.3 5Chile 447 0.80 17 32 14.6 21 -6.4 -6 -0.4 mBulgaria 446 0.81 16 41 13.6 49 -6.3 -7 4.1 mUnited Arab Emirates 437 0.91 5 30 7.7 -77 m m m mUruguay 435 0.72 16 32 14.0 11 -1.6 -2 -1.8 mRomania 435 0.93 14 34 11.3 m -1.5 -1 4.8 mCyprus5 433 0.95 9 31 10.1 1 m m m mMoldova 428 0.93 12 33 13.4 0 m m m mAlbania 427 0.84 m m m m m m m mTurkey 425 0.70 9 20 21.8 22 -6.1 -7 -1.4 21Trinidad and Tobago 425 0.76 10 31 12.9 19 m m m mThailand 421 0.71 9 22 18.4 -8 -6.5 -5 -5.2 mCosta Rica 420 0.63 16 24 9.4 6 m m m mQatar 418 0.93 4 27 5.7 -77 2.4 15 4.9 -19Colombia 416 0.75 14 27 11.4 60 3.1 4 0.3 mMexico 416 0.62 11 19 12.8 57 -5.2 -5 -1.9 -21Montenegro 411 0.90 5 23 9.4 -7 -2.6 -1 1.8 12Georgia 411 0.79 11 34 7.5 4 m m m mJordan 409 0.86 9 25 7.7 -2 -1.6 0 -6.6 13Indonesia 403 0.68 13 22 10.9 m 3.5 1 -4.1 mBrazil 401 0.71 12 27 9.4 64 -4.5 -1 -0.9 30Peru 397 0.74 22 30 3.2 29 m m m mLebanon 386 0.66 10 26 6.1 18 m m m mTunisia 386 0.93 9 17 4.7 50 0.1 -2 -11.7 -20FYROM 384 0.95 7 25 4.1 23 m m m mKosovo 378 0.71 5 18 2.5 28 m m m mAlgeria 376 0.79 1 8 7.4 33 m m m mDominican Republic 332 0.68 13 25 0.4 26 m m m m
For disadvantaged students and those who struggle with science, additional resources, targeted either to individual students or to disadvantaged schools, can make a difference in helping students acquire a baseline level of science literacy and develop a lifelong interest in the subject. All students, whether immigrant or non-immigrant, advantaged or disadvantaged, would also benefit from a more limited application of policies that sort students into different programme tracks or schools, particularly if these policies are applied in the earliest years of secondary school. These policies often contribute to disparities in the amount and depth of science instruction received by students from different backgrounds. Specific programmes might be needed to spark interest in science among students who may not receive such stimulation outside of school, and to support students’ decision to pursue further studies in science. Giving students more opportunities to learn science will help them to learn to “think like a scientist” – a skill that has become all but essential in the 21s century, even if students choose not to work in a science-related career later on.
1. ESCS refers to the PISA index of economic, social and cultural status.2. All score-point differences in science performance associated with a one-unit increase on the PISA index of economic, social and cultural status are statistically significant.3. A student is classified as resilient if he or she is in the bottom quarter of the PISA index of economic, social and cultural status in the country/economy of assessment and performs in the top quarter of students among all countries/economies, after accounting for socio-economic status.4. A positive score indicates a performance difference in favour of non-immigrant students; a negative score indicates a performance difference in favour of immigrant students.5. See note 1 under Figure 1. Snapshot of performance in science, reading and mathematics.Notes: Values that are statistically significant are marked in bold.Countries and economies are ranked in descending order of the mean science score in PISA 2015.Source: OECD, PISA 2015 Database, Tables I.2.3, I.6.1, I.6.3a, I.6.7, I.6.17, I.7.1 and I.7.15a.

PISA 2015 Results in Focus © OECD 2018 9
Snapshot of equity in education
Countries/economies with higher performance or greater equity than the OECD average
Countries with values not statistically different from the OECD average
Countries/economies with lower performance or less equity than the OECD average
Mean science score in PISA 2015
Inclusion and fairness indicators Difference between PISA 2006 and PISA 2015 (PISA 2015 - PISA 2006)
Coverage of the national 15-year-old population
(PISA Coverage index 3)
Percentage of variation in science performance explained by students’ socio-economic status
Score-point difference in science associated with one-unit increase
on the ESCS1 index
Percentage of resilient students3
Difference in science performance between
immigrant and non-immigrant students, after accounting for ESCS and language spoken
at home4
Percentage of variation in science performance
explained by students’ socio-economic status
Score-point difference in science associated with one-unit increase
on the ESCS index
Percentage of resilient students
Difference in science performance between
immigrant and non-immigrant students, after accounting
for ESCS and language spoken at home
Mean Mean index % Score dif.2 % Score dif. % dif. Score dif. % dif. Score dif.OECD average 493 0.89 12.9 38 29.2 19 -1.4 0 1.5 -6
Singapore 556 0.96 17 47 48.8 -13 m m m mJapan 538 0.95 10 42 48.8 53 1.6 2 8.2 mEstonia 534 0.93 8 32 48.3 28 -1.0 2 2.0 -2Chinese Taipei 532 0.85 14 45 46.3 m 1.0 2 2.0 mFinland 531 0.97 10 40 42.8 36 1.8 10 -10.4 -11Macao (China) 529 0.88 2 12 64.6 -19 -0.1 0 5.8 -2Canada 528 0.84 9 34 38.7 -5 0.3 1 0.7 -11Viet Nam 525 0.49 11 23 75.5 m m m m mHong Kong (China) 523 0.89 5 19 61.8 -1 -1.5 -8 -0.7 10B-S-J-G (China) 518 0.64 18 40 45.3 135 m m m mKorea 516 0.92 10 44 40.4 m 3.1 13 -3.2 mNew Zealand 513 0.90 14 49 30.4 -3 -2.0 0 -4.7 -9Slovenia 513 0.93 13 43 34.6 14 -4.0 -5 4.3 1Australia 510 0.91 12 44 32.9 -13 -0.4 2 -0.2 -8United Kingdom 509 0.84 11 37 35.4 15 -2.9 -8 5.0 9Germany 509 0.96 16 42 33.5 28 -4.0 -5 8.7 7Netherlands 509 0.95 13 47 30.7 23 -3.8 3 -1.3 -10Switzerland 506 0.96 16 43 29.1 16 -0.7 0 1.2 -20Ireland 503 0.96 13 38 29.6 3 -0.5 1 0.4 6Belgium 502 0.93 19 48 27.2 28 -0.7 2 1.4 -32Denmark 502 0.89 10 34 27.5 38 -3.6 -7 7.9 7Poland 501 0.91 13 40 34.6 m -1.4 0 3.2 mPortugal 501 0.88 15 31 38.1 8 -1.4 3 4.4 -49Norway 498 0.91 8 37 26.5 23 -0.4 1 9.3 8United States 496 0.84 11 33 31.6 -5 -6.0 -13 12.3 -10Austria 495 0.83 16 45 25.9 18 0.1 0 -2.2 -17France 495 0.91 20 57 26.6 20 -1.9 5 3.0 10Sweden 493 0.94 12 44 24.7 40 1.2 6 0.6 13Czech Republic 493 0.94 19 52 24.9 2 2.7 1 -3.9 -20Spain 493 0.91 13 27 39.2 26 0.9 3 10.7 -23Latvia 490 0.89 9 26 35.2 14 -0.5 -4 6.0 7Russia 487 0.95 7 29 25.5 5 -0.9 0 -1.0 -4Luxembourg 483 0.88 21 41 20.7 22 -1.7 2 1.5 -16Italy 481 0.80 10 30 26.6 11 -0.6 -1 2.8 -32Hungary 477 0.90 21 47 19.3 -11 0.3 2 -6.7 -13Lithuania 475 0.90 12 36 23.1 2 -2.6 -2 -2.1 11Croatia 475 0.91 12 38 24.4 14 -0.1 3 -0.5 7CABA (Argentina) 475 1.04 26 37 14.9 15 m m m mIceland 473 0.93 5 28 17.0 53 -2.6 -3 -1.8 24Israel 467 0.94 11 42 15.7 -9 0.9 0 2.3 1Malta 465 0.98 14 47 21.8 -5 m m m mSlovak Republic 461 0.89 16 41 17.5 40 -3.6 -4 -2.8 mGreece 455 0.91 13 34 18.1 14 -2.1 -2 -2.3 5Chile 447 0.80 17 32 14.6 21 -6.4 -6 -0.4 mBulgaria 446 0.81 16 41 13.6 49 -6.3 -7 4.1 mUnited Arab Emirates 437 0.91 5 30 7.7 -77 m m m mUruguay 435 0.72 16 32 14.0 11 -1.6 -2 -1.8 mRomania 435 0.93 14 34 11.3 m -1.5 -1 4.8 mCyprus5 433 0.95 9 31 10.1 1 m m m mMoldova 428 0.93 12 33 13.4 0 m m m mAlbania 427 0.84 m m m m m m m mTurkey 425 0.70 9 20 21.8 22 -6.1 -7 -1.4 21Trinidad and Tobago 425 0.76 10 31 12.9 19 m m m mThailand 421 0.71 9 22 18.4 -8 -6.5 -5 -5.2 mCosta Rica 420 0.63 16 24 9.4 6 m m m mQatar 418 0.93 4 27 5.7 -77 2.4 15 4.9 -19Colombia 416 0.75 14 27 11.4 60 3.1 4 0.3 mMexico 416 0.62 11 19 12.8 57 -5.2 -5 -1.9 -21Montenegro 411 0.90 5 23 9.4 -7 -2.6 -1 1.8 12Georgia 411 0.79 11 34 7.5 4 m m m mJordan 409 0.86 9 25 7.7 -2 -1.6 0 -6.6 13Indonesia 403 0.68 13 22 10.9 m 3.5 1 -4.1 mBrazil 401 0.71 12 27 9.4 64 -4.5 -1 -0.9 30Peru 397 0.74 22 30 3.2 29 m m m mLebanon 386 0.66 10 26 6.1 18 m m m mTunisia 386 0.93 9 17 4.7 50 0.1 -2 -11.7 -20FYROM 384 0.95 7 25 4.1 23 m m m mKosovo 378 0.71 5 18 2.5 28 m m m mAlgeria 376 0.79 1 8 7.4 33 m m m mDominican Republic 332 0.68 13 25 0.4 26 m m m m
PISA 2015 Results in Focus © OECD 201810
Policies and practices for successful schools
• Across OECD countries, school principals cited student truancy and staff resisting change as the problems that hinder student learning the most; they also reported that learning in their schools is least hindered by students’ use of alcohol or illegal drugs, or students intimidating or bullying other students.
• Students in school systems that select students into different education programmes or types of schools at a later age reported receiving greater support from their teachers.
School governance, assessment and accountability
• Students in private schools score higher in science than students in public schools; but after accounting for the socio-economic profile of students and schools, students in public schools score higher than students in private schools on average across OECD countries and in 22 education systems.
• Standardised tests are used extensively across PISA-participating countries and economies. In about five out of six school systems, at least half of students are assessed at least once a year with mandatory standardised tests, and in about three out of four countries, at least half of students are assessed at least once a year with non-mandatory standardised tests.
• When choosing a school for their child, parents are more likely to consider important or very important that there is a safe school environment, that the school has a good reputation and that the school has an active and pleasant climate – even more so than the academic achievement of the students in the school.
Selecting and grouping students
• Thirty countries and economies used grade repetition less frequently in 2015 than in 2009; in only five countries did the incidence of grade repetition increase during the period. The use of grade repetition decreased by at least 10 percentage points in Costa Rica, France, Indonesia, Latvia, Macao (China), Malta, Mexico and Tunisia.
• Across OECD countries, socio-economically disadvantaged students, students with an immigrant background and boys are more likely to have repeated a grade, even after accounting for their academic performance, and their self-reported motivation and behaviour.
• The later students are first selected into different schools or education programmes and the less prevalent the incidence of grade repetition, the more equitable the school system, or the weaker the association between students’ socio-economic status and their performance in science.
What the data tell us
Policies about learning science at school and performance in science
• The approximately 6% of students across OECD countries who reported not attending any regular science lessons score 25 points lower than students who reported attending at least one science lesson, after accounting for the socio-economic profile of students and schools. In 34 school systems, particularly in Austria, Belgium, Croatia, France, Germany, the Slovak Republic and Chinese Taipei, the students who reported not attending regular science lessons are more likely to attend socio-economically disadvantaged schools than advantaged schools.
• Across OECD countries, socio-economically advantaged schools are considerably more likely than disadvantaged schools to offer science competitions and a science club as school activities.
• How much time students spend learning and how science is taught are even more strongly associated with science performance and the expectations of pursuing a science-related career than how well-equipped and -staffed the science department is, which extracurricular science activities are offered at school and science teachers’ qualifications.
• According to students’ reports, and on average across OECD countries, teachers in advantaged schools explain or demonstrate a scientific idea (teacher-directed instruction) more frequently than do teachers in disadvantaged schools. Students who reported that their science teachers frequently use these practices and adapt their teaching to meet students’ needs score higher in science, show stronger beliefs about the value of scientific enquiry, and are more likely to expect to pursue a science-related career than students who reported that their teachers use these practices less frequently.
The learning environment
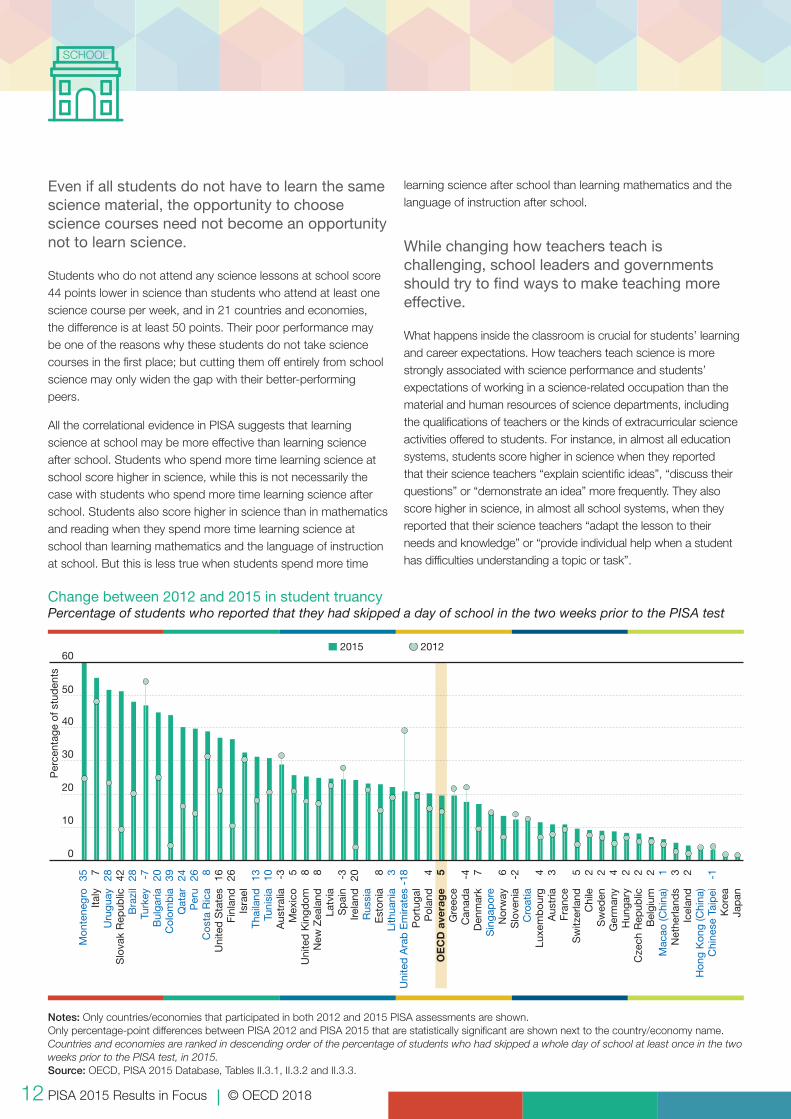
• In most school systems, students in socio-economically disadvantaged schools are more likely to have skipped a day of school than students in advantaged schools. Between 2012 and 2015, the percentage of students who had skipped a whole day of school at least once in the two weeks prior to the PISA test increased by around 5 percentage points across OECD countries.

PISA 2015 Results in Focus © OECD 2018 11
Resources invested in education
• Students in larger schools score higher in science and are more likely than students in smaller schools to expect to work in a science-related occupation in the future. But students in smaller schools reported a better disciplinary climate in their science lessons and they are less likely than students in larger schools to skip days of school and arrive late for school, after accounting for schools’ and students’ socio-economic status.
• On average across OECD countries, students in smaller classes reported more frequently than students in larger classes that their teachers adapt their instruction to students’ needs, knowledge and level of understanding.
• Students score five points higher in science for every additional hour spent per week in regular science lessons, after accounting for socio-economic status.
• School systems where students spend more time learning after school, by doing homework, receiving additional instruction or in private study, tend to perform less well in science.
Differences in the requirement to attend regular science lessons, by schools’ socio-economic profileResults based on students’ self-reports
Notes: Statistically significant differences are marked in a darker tone.The percentage of students who are not required to attend any science course is shown next to the country/economy name.Countries and economies are ranked in descending order of the percentage-point difference between students in socio-economically advantaged and disadvantaged schools who are required to attend at least one science course per week.Source: OECD, PISA 2015 Database, Table II.2.3.
C
roat
ia 1
5.7
B
elgi
um 1
3.5
A
ustr
ia
9.1
Fr
ance
4.
5
Chi
nese
Tai
pei
7.
5
Ger
man
y 4.
8
Slo
vak
Rep
ublic
11.
5
Mal
ta
5.8
S
witz
erla
nd
8.5
Lu
xem
bou
rg
6.8
A
ustr
alia
10.
1
Kos
ovo
8.9
G
reec
e 4.
6
Uru
guay
4.
6
Mon
tene
gro
5.9
K
orea
2.
5
Can
ada
13.7
N
ew Z
eala
nd
5.8
Ire
land
7.
8
Thai
land
6.
9
Italy
2.
9
FYR
OM
24.
9
Jap
an
2.6
Tu
rkey
7.
1
Qat
ar
5.4
C
AB
A (A
rgen
tina)
3.
1
Hon
g K
ong
(Chi
na)
23.8
U
nite
d S
tate
s 6.
4
Bra
zil
8.1
O
EC
D a
vera
ge
6.4
C
osta
Ric
a 3.
3
Slo
veni
a 1.
3
Col
omb
ia
6.4
Trin
idad
and
Tob
ago
8.1
S
inga
por
e 1.
3
Chi
le
1.1
G
eorg
ia
1.5
U
nite
d K
ingd
om
1.6
R
oman
ia
1.6
Uni
ted
Ara
b E
mira
tes
7.0
Fi
nlan
d
3.9
C
zech
Rep
ublic
0.
4
Sp
ain
16.3
Jo
rdan
2.
2
Alb
ania
2.
1 D
omin
ican
Rep
ublic
3.
3
Bul
garia
0.
5
Tuni
sia
3.4
Is
rael
7.
2
Nor
way
0.
5
Den
mar
k 1.
0
Pol
and
0.
4
Est
onia
0.
4
Leb
anon
0.
8
Per
u 1.
3
Rus
sia
0.5
M
old
ova
5.7
A
lger
ia
2.4
La
tvia
0.
7
Sw
eden
0.
9
Net
herla
nds
15.5
H
unga
ry 1
4.0
M
exic
o 3.
8
B-S
-J-G
(Chi
na)
5.9
M
acao
(Chi
na)
18.6
In
don
esia
4.
2
Icel
and
3.
1
Por
tuga
l 30
.0
Per
cent
age-
poi
nt d
iffer
ence
25
30
20
15
10
5
0
-5
-10
-15
Students in socio-economically advantaged schools are more likely to be required to attend at least one science
course per week
Students in socio-economically disadvantaged schools are more likelyto be required to attend at least one science course per week
PISA 2015 Results in Focus © OECD 201812
Even if all students do not have to learn the same science material, the opportunity to choose science courses need not become an opportunity not to learn science.
Students who do not attend any science lessons at school score 44 points lower in science than students who attend at least one science course per week, and in 21 countries and economies, the difference is at least 50 points. Their poor performance may be one of the reasons why these students do not take science courses in the first place; but cutting them off entirely from school science may only widen the gap with their better-performing peers.
All the correlational evidence in PISA suggests that learning science at school may be more effective than learning science after school. Students who spend more time learning science at school score higher in science, while this is not necessarily the case with students who spend more time learning science after school. Students also score higher in science than in mathematics and reading when they spend more time learning science at school than learning mathematics and the language of instruction at school. But this is less true when students spend more time
learning science after school than learning mathematics and the language of instruction after school.
While changing how teachers teach is challenging, school leaders and governments should try to find ways to make teaching more effective.
What happens inside the classroom is crucial for students’ learning and career expectations. How teachers teach science is more strongly associated with science performance and students’ expectations of working in a science-related occupation than the material and human resources of science departments, including the qualifications of teachers or the kinds of extracurricular science activities offered to students. For instance, in almost all education systems, students score higher in science when they reported that their science teachers “explain scientific ideas”, “discuss their questions” or “demonstrate an idea” more frequently. They also score higher in science, in almost all school systems, when they reported that their science teachers “adapt the lesson to their needs and knowledge” or “provide individual help when a student has difficulties understanding a topic or task”.
Change between 2012 and 2015 in student truancyPercentage of students who reported that they had skipped a day of school in the two weeks prior to the PISA test
Notes: Only countries/economies that participated in both 2012 and 2015 PISA assessments are shown.Only percentage-point differences between PISA 2012 and PISA 2015 that are statistically significant are shown next to the country/economy name.Countries and economies are ranked in descending order of the percentage of students who had skipped a whole day of school at least once in the two weeks prior to the PISA test, in 2015. Source: OECD, PISA 2015 Database, Tables II.3.1, II.3.2 and II.3.3.
M
onte
negr
o 35
Ita
ly
7
Uru
guay
28
S
lova
k R
epub
lic
42
Bra
zil
28
Turk
ey
-7
Bul
garia
20
C
olom
bia
39
Q
atar
24
P
eru
26
Cos
ta R
ica
8
Uni
ted
Sta
tes
16
Finl
and
26
Is
rael
Thai
land
13
Tu
nisi
a 10
A
ustr
alia
-3
M
exic
o 5
U
nite
d K
ingd
om
8
New
Zea
land
8
La
tvia
Sp
ain
-3
Irela
nd
20
Rus
sia
E
ston
ia
8
Lith
uani
a 3
U
nite
d A
rab
Em
irate
s -1
8
Por
tuga
l
Pol
and
4
O
EC
D a
vera
ge
5
Gre
ece
C
anad
a -4
D
enm
ark
7
Sin
gap
ore
N
orw
ay
6
Slo
veni
a -2
C
roat
ia
Lu
xem
bou
rg
4
Aus
tria
3
Fr
ance
Sw
itzer
land
5
C
hile
2
S
wed
en
2
Ger
man
y 4
H
unga
ry
2
Cze
ch R
epub
lic
2
Bel
gium
2
M
acao
(Chi
na)
1
Net
herla
nds
3
Icel
and
2
H
ong
Kon
g (C
hina
)
Chi
nese
Tai
pei
-1
K
orea
Jap
an
Per
cent
age
of s
tud
ents
0
10
20
30
40
50
602015 2012
PISA 2015 Results in Focus © OECD 2018 13
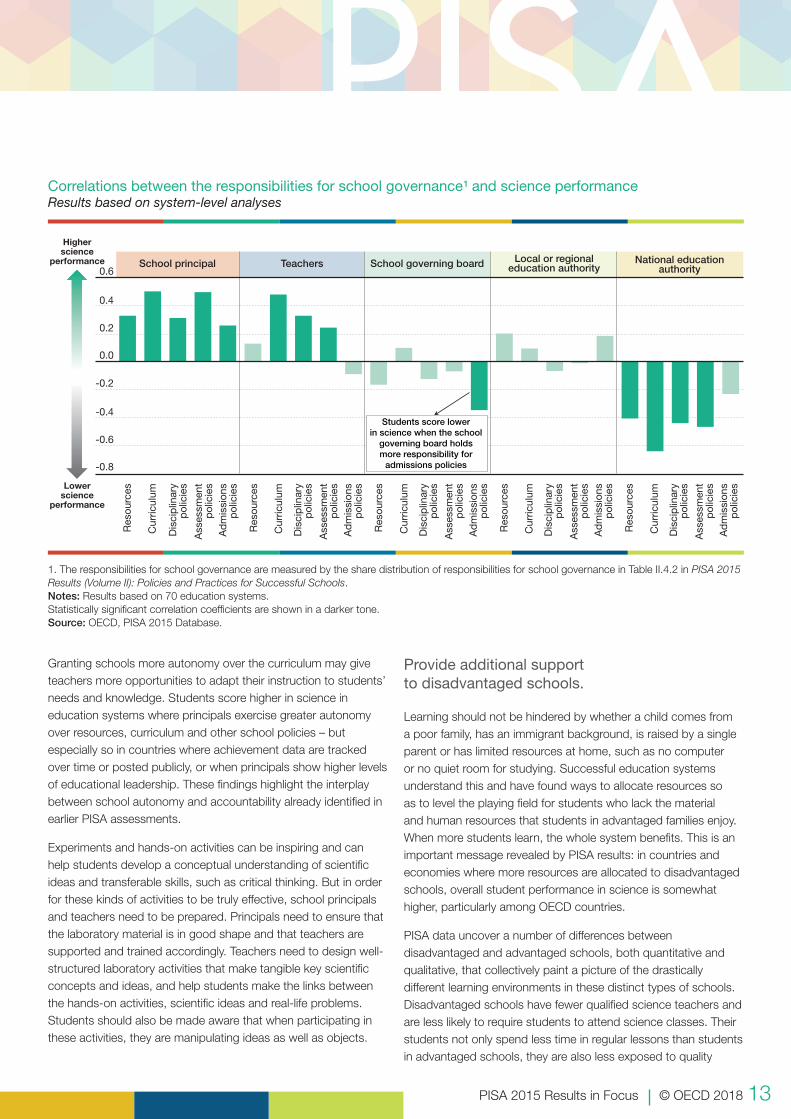
Granting schools more autonomy over the curriculum may give teachers more opportunities to adapt their instruction to students’ needs and knowledge. Students score higher in science in education systems where principals exercise greater autonomy over resources, curriculum and other school policies – but especially so in countries where achievement data are tracked over time or posted publicly, or when principals show higher levels of educational leadership. These findings highlight the interplay between school autonomy and accountability already identified in earlier PISA assessments.
Experiments and hands-on activities can be inspiring and can help students develop a conceptual understanding of scientific ideas and transferable skills, such as critical thinking. But in order for these kinds of activities to be truly effective, school principals and teachers need to be prepared. Principals need to ensure that the laboratory material is in good shape and that teachers are supported and trained accordingly. Teachers need to design well-structured laboratory activities that make tangible key scientific concepts and ideas, and help students make the links between the hands-on activities, scientific ideas and real-life problems. Students should also be made aware that when participating in these activities, they are manipulating ideas as well as objects.
Provide additional support to disadvantaged schools.
Learning should not be hindered by whether a child comes from a poor family, has an immigrant background, is raised by a single parent or has limited resources at home, such as no computer or no quiet room for studying. Successful education systems understand this and have found ways to allocate resources so as to level the playing field for students who lack the material and human resources that students in advantaged families enjoy. When more students learn, the whole system benefits. This is an important message revealed by PISA results: in countries and economies where more resources are allocated to disadvantaged schools, overall student performance in science is somewhat higher, particularly among OECD countries.
PISA data uncover a number of differences between disadvantaged and advantaged schools, both quantitative and qualitative, that collectively paint a picture of the drastically different learning environments in these distinct types of schools. Disadvantaged schools have fewer qualified science teachers and are less likely to require students to attend science classes. Their students not only spend less time in regular lessons than students in advantaged schools, they are also less exposed to quality
Correlations between the responsibilities for school governance¹ and science performanceResults based on system-level analyses
1. The responsibilities for school governance are measured by the share distribution of responsibilities for school governance in Table II.4.2 in PISA 2015 Results (Volume II): Policies and Practices for Successful Schools.Notes: Results based on 70 education systems.Statistically significant correlation coefficients are shown in a darker tone.Source: OECD, PISA 2015 Database.
Res
ourc
es
Cur
ricul
um
Dis
cip
linar
yp
olic
ies
Ass
essm
ent
pol
icie
sA
dm
issi
ons
pol
icie
s
Res
ourc
es
Cur
ricul
um
Dis
cip
linar
yp
olic
ies
Ass
essm
ent
pol
icie
sA
dm
issi
ons
pol
icie
s
Res
ourc
es
Cur
ricul
um
Dis
cip
linar
yp
olic
ies
Ass
essm
ent
pol
icie
sA
dm
issi
ons
pol
icie
s
Res
ourc
es
Cur
ricul
um
Dis
cip
linar
yp
olic
ies
Ass
essm
ent
pol
icie
sA
dm
issi
ons
pol
icie
s
Res
ourc
es
Cur
ricul
um
Dis
cip
linar
yp
olic
ies
Ass
essm
ent
pol
icie
sA
dm
issi
ons
pol
icie
s
-0.8
-0.6
-0.4
-0.2
0.0
0.2
0.4
0.6School principal
Higherscience
performance
Lowerscience
performance
Teachers School governing board National educationauthority
Local or regionaleducation authority
Students score lowerin science when the school
governing board holdsmore responsibility for
admissions policies

PISA 2015 Results in Focus © OECD 201814
teaching. For example, teachers in their schools are less likely to engage in some effective teaching strategies, such as explaining or demonstrating a scientific idea.
The range of learning opportunities beyond regular classes is also much narrower in disadvantaged schools, as these schools tend to offer fewer extracurricular activities, such as science competitions and clubs, sports, and music and arts activities. Disadvantaged schools also tend to be subject to more disciplinary problems and a lack of student engagement, manifested in students arriving late for school or skipping days of school, which compromise students’ opportunities to learn and do well in school. Some of these differences between disadvantaged and advantaged schools are magnified in countries that practice early tracking.
Compensatory measures are essential and, in many ways, they are already in place in various countries. But further steps need to be taken. For example, it is not enough for disadvantaged schools to have more computers per student; these computers need to
be connected to the Internet and, more important, they need to be used in a way that improves learning, not distracts from it. It is not enough for students in these schools to spend more time studying after school; they also need more time in regular lessons with better teaching, which is what their counterparts in advantaged schools already have. And they need more support after class, too, in the form of tutoring, and in enriching extracurricular activities, especially in countries and economies where students in advantaged schools spend more time studying after school, such as Croatia, Italy, Japan, Korea, Macao (China) and Chinese Taipei. Governments may need to provide additional resources for free-of-charge tutoring in disadvantaged schools so as to prevent the development of a shadow education system – and to ensure equity in education opportunities.
Solutions will vary depending on the nature of the deficiency. But even when different schools face similar problems, tailored solutions that capitalise on assets already in place may be needed; and progress towards learning goals should be continuously monitored.
Change between 2009 and 2015 in grade repetition ratesPercentage of students who had repeated a grade in primary, lower secondary or upper secondary school
Notes: Statistically significant differences are shown next to the country/economy name.Only countries and economies with comparable data from PISA 2009 and PISA 2015 are shown.For Costa Rica, Georgia, Malta and Moldova, the change between PISA 2009 and PISA 2015 represents the change between 2010 and 2015 because these countries implemented the PISA 2009 assessment in 2010 as part of PISA 2009+.Countries and economies are ranked in descending order of the percentage of students who had repeated a grade in 2015.Source: OECD, PISA 2015 Database, Tables II.5.9, II.5.10 and II.5.11.
C
olom
bia
5
B
razi
l -6
U
rugu
ay
Tu
nisi
a -1
0
Bel
gium
Mac
ao (C
hina
) 13
Tr
inid
ad a
nd T
obag
o 2
C
osta
Ric
a -1
0
Sp
ain
-4
Por
tuga
l -6
Lu
xem
bou
rg
-9
Per
u -4
C
hile
Fran
ce
-16
N
ethe
rland
s -7
S
witz
erla
nd
-6
Ger
man
y
Qat
ar
2
Hon
g K
ong
(Chi
na)
In
don
esia
-1
9
Mex
ico
-11
A
ustr
ia
3
Italy
U
nite
d A
rab
Em
irate
s -2
O
EC
D a
vera
ge
-3
Uni
ted
Sta
tes
-4
Turk
ey
H
unga
ry
Is
rael
Jord
an
Ire
land
-5
A
ustr
alia
-2
M
alta
-1
3
Slo
vak
Rep
ublic
Thai
land
Rom
ania
Can
ada
-3
Sin
gap
ore
P
olan
d
La
tvia
-1
5
Gre
ece
N
ew Z
elan
d
B
ulga
ria
C
zech
Rep
ublic
Sw
eden
-2
E
ston
ia
-2
Den
mar
k -2
M
old
ova
-2
Finl
and
Uni
ted
Kin
gdom
Alb
ania
-5
Li
thua
nia
-1
Slo
veni
a
Mon
tene
gro
C
roat
ia
-1
Rus
sia
-2
Geo
rgia
-2
Ic
elan
d
C
hine
se T
aip
ei
-1
0
5
10
15
20
25
30
35
40
45
50% 2015 2009

PISA 2015 Results in Focus © OECD 2018 15
Student’s well being
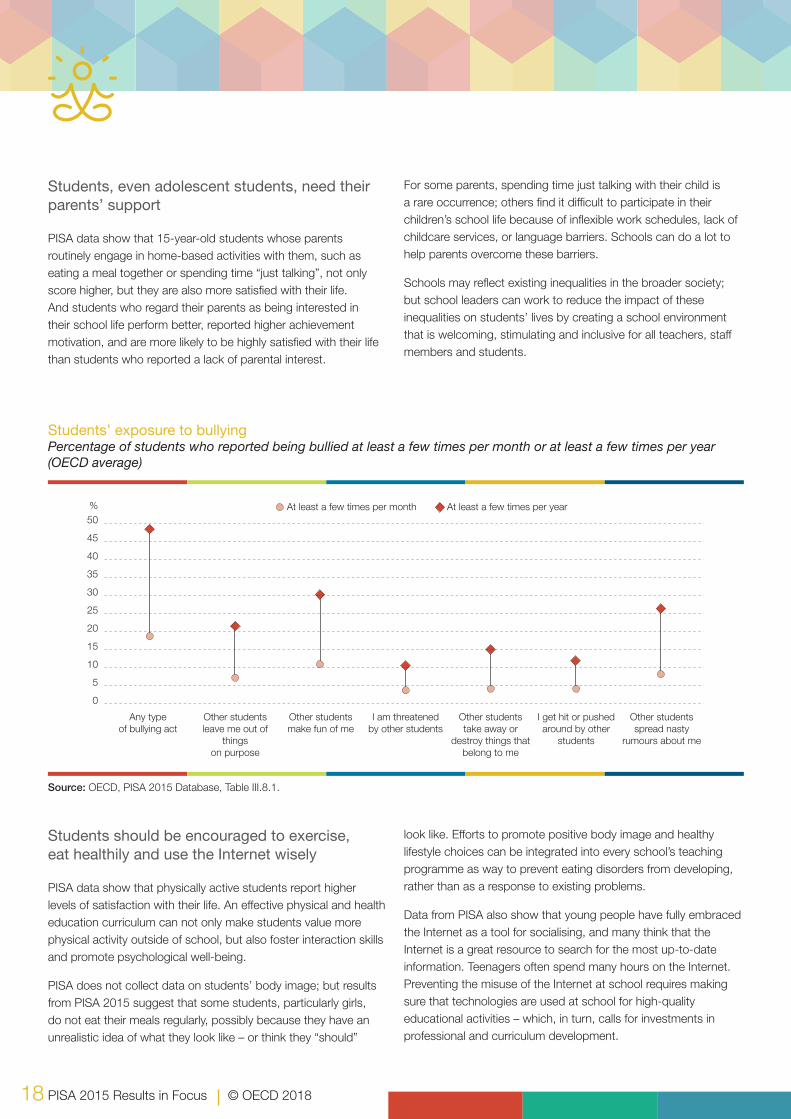
month. Another 8% of students reported that they are hit or pushed a few times per year. Around 11% of students reported that other students make fun of them, and 8% reported that they are the object of nasty rumours at least a few times per month.
• Girls are less likely than boys to become victims of physical aggression, but are more likely to be the object of nasty rumours.
• There is less incidence of bullying in schools where students reported that there is a better disciplinary climate in the classroom and where students perceive that their teachers behave fairly.
• On average across OECD countries, students attending schools where bullying is frequent, by international standards, score 47 points lower in science than students in schools where bullying occurs less frequently. This difference is equal to 25 score points after accounting for the socio-economic profile of the school.
• Students who are frequently bullied were more likely to report that their parents do not help them with difficulties at school than students who are not frequently bullied.
Parents and the home environment
• On average across 18 countries and economies, 82% of parents reported that they eat the main meal with their child around a table, 70% reported that they spend time just talking with their child, and 52% reported that they discuss how well their child is doing at school every day or almost every day. Students whose parents engage in these activities at least once a week score higher in the PISA science test and were more likely to report that they are very satisfied with their life.
• Parents cited the inability to get time off from work (cited by 36% of parents), the inconvenience of school meeting times (cited by 33% of parents) and the lack of knowledge about how to participate in school activities (cited by 17% of parents) as among the most common barriers to their participation in school activities.
• A student’s satisfaction with life is associated with his or her relative status at school, as measured by the difference between his or her wealth and the wealth of the other students in the school.
• Children of blue-collar workers hold higher education and career expectations when they attend schools with a large proportion of children of white-collar workers.
What the data tell us
Performance at school and life satisfaction
• On average across OECD countries, 15-year-old students are satisfied with the life they are living: they report a level of 7.3 on a scale of life satisfaction that ranges from 0 to 10. But around 12% of students, on average, are not satisfied with their life: they report 4 or less on the scale.
• Girls and disadvantaged students were less likely than boys and advantaged students to report high levels of life satisfaction.
• Top-performing students are only slightly more satisfied with their life than students who perform at an average level. There is no clear relationship between study time and life satisfaction.
• Around 64% of girls and 47% of boys reported that they feel very anxious even if they are well prepared for a test. Schoolwork-related anxiety is negatively related to performance at school and to students’ satisfaction with their life.
• Girls were more likely than boys to report that they want top grades at school and that they want to be able to select among the best opportunities when they graduate. But boys were more likely than girls to describe themselves as ambitious.
• On average across OECD countries, 44% of 15-years-old students expect that they will complete university. In Colombia, Korea, Qatar and the United States, more than three out of four students expect so. On average, disadvantaged students were 40 percentage points (or 2.5 times) less likely to expect to complete a university degree than advantaged students.
Students’ social life at school
• The majority of students in 67 countries and economies feel that they belong to the school community. However, in many countries, disadvantaged students and first-generation immigrant students were less likely to report feeling a sense of belonging at school than other students.
• On average across OECD countries, and in many partner countries and economies, students’ sense of belonging at school weakened between 2003 and 2015.
• One in five students reported that they experience some form of unfair treatment by their teachers (they are harshly disciplined, or feel offended or ridiculed in front of others) at least a few times in a given month.
• Some 4% of students across OECD countries (the equivalent of around one student per class) reported that they are hit or pushed around by other students at least a few times per

PISA 2015 Results in Focus © OECD 201816
Students’ use of their time outside of school
• About 6.6% of students across OECD countries do not engage in any kind of moderate or vigorous physical activity outside of school, and the share of physically inactive students is 1.8 percentage points higher among girls than among boys. Physically active students are less likely than those who do not participate in any kind of physical activity outside of school to skip school, feel like an outsider at school, feel very anxious about schoolwork, or be frequently bullied.
• Students who do more physical education at school are also more likely to be physically active outside of school.
• Having dinner regularly is positively associated with adolescents’ satisfaction with life, particularly among girls.
• On average across OECD countries, around 23% of students reported that they work for pay and 73% reported that they work
in the house before or after school. More boys than girls work for pay, and fewer boys than girls do unpaid household chores.
• Students who work for pay were more likely than those who do not work for pay to report feeling like an outsider at school, having low expectations for further education, arriving late for school, and skipping school.
• On average across OECD countries, students spend more than two hours on line during a typical weekday after school, and more than three hours on line during a typical weekend day. Between 2012 and 2015, the time spent on line outside of school increased by 40 minutes per day on both weekdays and weekends.
• Students who spend more than six hours on line per weekday outside of school were more likely than students who spend fewer hours on line to report that they are not satisfied with their life or that they feel lonely at school; they are also less proficient in PISA subjects.
Life satisfaction among 15-year-old studentsPercentage of students who reported a level of life satisfaction of 7 or higher on a scale from 0 to 10
Countries and economies are ranked in descending order of the percentage of students who reported being satisfied with their life (they reported a level of satisfaction with their life of 7 or higher on a scale from 0 to 10).Source: OECD, PISA 2015 Database, Table III.3.1.
Net
herla
nds
7
.8
Mex
ico
8
.3
Dom
inic
an R
epub
lic
8.5
Finl
and
7
.9
Cos
ta R
ica
8
.2
Cro
atia
7
.9
Sw
itzer
land
7
.7
Lith
uani
a
7.9
Icel
and
7
.8
Fran
ce
7.6
Col
ombi
a
7.9
Bel
gium
(exc
l. Fl
emis
h)
7.5
Uru
guay
7
.7
Aus
tria
7
.5
Rus
sia
7
.8
Est
onia
7
.5
Spa
in
7.4
Mon
tene
gro
7
.8
Thai
land
7
.7
Latv
ia
7.4
Ger
man
y
7.4
Bra
zil
7.
6
Por
tuga
l
7.4
Irela
nd
7.3
Luxe
mbo
urg
7
.4
Slo
vak
Rep
ublic
7
.5
OE
CD
ave
rag
e
7.3
Per
u
7.5
Uni
ted
Sta
tes
7
.4
Chi
le
7.4
Hun
gary
7
.2
Bul
garia
7
.4
Qat
ar
7.4
Slo
veni
a
7.2
Pol
and
7
.2
Uni
ted
Ara
b E
mira
tes
7
.3
Cze
ch R
epub
lic
7.1
Uni
ted
Kin
gdom
7
.0
Italy
6
.9
Gre
ece
6
.9
Japa
n
6.8
Tuni
sia
6
.9
B-S
-J-G
(Chi
na)
6.
8
Mac
ao (C
hina
)
6.6
Chi
nese
Tai
pei
6.
6
Hon
g K
ong
(Chi
na)
6.
5
Kor
ea
6.4
Turk
ey
6.1
Ave
rage
life
sat
isfa
ctio
n Sat
isfi
ed w
ith
life
(7 o
r hi
ghe
r o
n th
e lif
e sa
tisf
acti
on
scal
e)
010
2030
4050
6070
8090
100%

PISA 2015 Results in Focus © OECD 2018 17
severe anxiety and teach these students methods to learn from mistakes and manage their stress.
Teachers can also help students set learning goals at an appropriate level of difficulty and reward the progress that students make towards these goals in their feedback and assessment practices.
Schools can function as caring communities only if they have engaged teachers
Teachers who master classroom and relationship management methods have the means to establish rewarding and supportive connections with their students, even in the most difficult contexts.
Such engagement from teachers is particularly crucial in combatting bullying at school. PISA 2015 data show that a large proportion of students reported being victims of bullying. There is no one-size-fits-all approach to preventing bullying. PISA data show that there is less reported bullying in schools where students have positive relationships with their teachers. Analysis of successful anti-bullying programmes around the world suggests that parents need to be involved in school planning and responses to bullying. Schools also need to collaborate with other institutions and services to put in place comprehensive prevention and response plans.
Schools can boost students’ motivation to achieve and build their confidence
Schools are not only places where students acquire academic skills; they are also social environments where children can develop the social and emotional competencies that they need to thrive. Yet despite the global interest in students’ well-being, there is no consensus on which policies or curriculum changes are needed to improve adolescents’ quality of life at school.
The data from PISA 2015 show that students differ greatly, both between and within countries, in how satisfied they are with their life, in their motivation to achieve, in how anxious they feel about their schoolwork, in their participation in physical activities, in their expectations for the future, in their experiences of being bullied by their peers, and in their perceptions of being treated unfairly by their teachers. Many of these differences are related to students’ feelings about the disciplinary climate in the classroom and about the support their teachers give them.
PISA 2015 data show that schoolwork-related anxiety is common among adolescents. Often, this anxiety is students’ reaction to, and interpretation of, the mistakes they make – or are afraid to make. Students whose motivation to do well at school mostly originates from fear of disappointing others or the desire to do better than their peers are more likely to report anxiety at school. It is important that schools identify those students who suffer from
Teachers’ practices and students’ schoolwork-related anxietyLikelihood that students get very tense when they study for a test associated with teachers’ practices
Notes: A logarithmic transformation of the odds ratio is plotted to make the values below one and above one comparable in the graph. The interpretation of the odds ratio (in terms of percentage change in the likelihood of the outcome) is indicated above or below each bar.The values account for students’ differences in the PISA index of economic, social and cultural status (ESCS), and performance in science.All values are statistically significant.Source: OECD, PISA 2015 Database, Table III.4.11.
More likely
As likely
Less likely
60% more likely
44% more likely
17% less likely
9% less likely
Odd
s ra
tio (l
ogar
ithm
ic s
cale
)
“I get very tense when I study for a test”
The teacher adapts the lesson to my class’s needs and
knowledge
The teacher providesindividual help when
a student has difficultiesunderstanding a topic or task
Teachers grade me harderthan they grade other
students
Teachers give me theimpression that they think
I am less smart than I reallyam
PISA 2015 Results in Focus © OECD 201818
Students, even adolescent students, need their parents’ support
PISA data show that 15-year-old students whose parents routinely engage in home-based activities with them, such as eating a meal together or spending time “just talking”, not only score higher, but they are also more satisfied with their life. And students who regard their parents as being interested in their school life perform better, reported higher achievement motivation, and are more likely to be highly satisfied with their life than students who reported a lack of parental interest.
For some parents, spending time just talking with their child is a rare occurrence; others find it difficult to participate in their children’s school life because of inflexible work schedules, lack of childcare services, or language barriers. Schools can do a lot to help parents overcome these barriers.
Schools may reflect existing inequalities in the broader society; but school leaders can work to reduce the impact of these inequalities on students’ lives by creating a school environment that is welcoming, stimulating and inclusive for all teachers, staff members and students.
Students should be encouraged to exercise, eat healthily and use the Internet wisely
PISA data show that physically active students report higher levels of satisfaction with their life. An effective physical and health education curriculum can not only make students value more physical activity outside of school, but also foster interaction skills and promote psychological well-being.
PISA does not collect data on students’ body image; but results from PISA 2015 suggest that some students, particularly girls, do not eat their meals regularly, possibly because they have an unrealistic idea of what they look like – or think they “should”
look like. Efforts to promote positive body image and healthy lifestyle choices can be integrated into every school’s teaching programme as way to prevent eating disorders from developing, rather than as a response to existing problems.
Data from PISA also show that young people have fully embraced the Internet as a tool for socialising, and many think that the Internet is a great resource to search for the most up-to-date information. Teenagers often spend many hours on the Internet. Preventing the misuse of the Internet at school requires making sure that technologies are used at school for high-quality educational activities – which, in turn, calls for investments in professional and curriculum development.
Students’ exposure to bullyingPercentage of students who reported being bullied at least a few times per month or at least a few times per year (OECD average)
At least a few times per month At least a few times per year50
45
40
35
30
25
20
15
10
5
0
Any typeof bullying act
Other students leave me out of
thingson purpose
Other students make fun of me
I am threatenedby other students
Other studentstake away or
destroy things that belong to me
I get hit or pushed around by other
students
Other students spread nasty
rumours about me
%
Source: OECD, PISA 2015 Database, Table III.8.1.

PISA 2015 Results in Focus © OECD 2018 19
Students’ financial literacy
percentage of students performing at or below Level 1 is larger than 20% in Brazil, Chile, Lithuania, Peru, Poland, the Slovak Republic, Spain and the United States. These students can, at best, recognise the difference between needs and wants, make simple decisions about everyday spending, and recognise the purpose of everyday financial documents, such as an invoice.
• On average across the 10 participating OECD countries and economies, around 38% of the variation in financial literacy scores reflects factors that are uniquely captured by the financial literacy assessment, while the remaining 62% of variation in financial literacy reflects skills that can be measured in the mathematics and/or reading assessments.
• In the Flemish Community of Belgium, Beijing-Shanghai-Jiangsu-Guangdong (China), the participating Canadian provinces and the Russian Federation, students perform better in financial literacy than students around the world who perform similarly in mathematics and reading. In contrast, students in Australia, Brazil, Chile, Italy, Lithuania, the Netherlands, Poland, the Slovak Republic and Spain perform worse than expected in financial literacy, based on the performance of students around the world in mathematics and reading.
What the data tell us
Student performance in financial literacy
• Beijing-Shanghai-Jiangsu-Guangdong (China) (B-S-J-G [China]) outperforms all other participating countries/economies in financial literacy. The Flemish Community of Belgium, the participating Canadian provinces (British Columbia, Manitoba, New Brunswick, Newfoundland and Labrador, Nova Scotia, Ontario and Prince Edward Island), the Russian Federation, the Netherlands and Australia, in descending order of mean performance, have mean scores above the OECD average.
• Some 12% of students across OECD countries and economies are top performers in financial literacy, meaning that they are proficient at Level 5. These students can analyse complex financial products and solve non-routine financial problems. They show an understanding of the wider financial landscape, such as the implications of income-tax brackets, and can explain the financial advantages of different types of investments.
• On average across OECD countries and economies, 22% of students perform at or below Level 1 in financial literacy. The
Percentage of students at each level of proficiency in financial literacy
Countries and economies are ranked in descending order of the percentage of students who perform at or above Level 2.Source: OECD, PISA 2015 Database, Table IV.3.2.
B-S-J-G (China)
Russia
Belgium (Flemish)
Canadian provinces
Netherlands
Australia
Italy
Poland
United States
OECD average-10
Spain
Lithuania
Slovak Republic
Chile
Peru
Brazil
566
512
541
533
509
504
483
485
487
489
469
449
445
432
403
393
Mean score
Level 5Level 2, 3, 4Level 1 or below
Students at Level 1 or below Students at Level 2 or above
100% %80 60 40 20 0 20 40 60 80 100

PISA 2015 Results in Focus © OECD 201820
How performance in financial literacy varies within countries and across student characteristics
• Variation within each country/economy is wider than the variation observed between countries/economies at the mean. On average across OECD countries and economies, the gap between students scoring at the 90th percentile and those at the 10th percentile in financial literacy is 285 score points.
• Only in Italy do boys perform better than girls, by 11 score points, in financial literacy. By contrast, in Australia, Lithuania, Poland, the Slovak Republic and Spain, girls perform better than boys. In the remaining countries and economies, the difference in performance between boys and girls is not statistically significant. In 9 out of 15 countries and economies, more boys than girls are low performers.
• In 10 countries and economies with available data, socio-economically disadvantaged students are more likely than advantaged students to be low performers in financial literacy, after accounting for student performance in mathematics and reading and other characteristics. Advantaged students score 89 points higher than disadvantaged students, on average across OECD countries and economies, equivalent to more than one PISA proficiency level.
• Among countries and economies where at least 5% of students have an immigrant background, the difference in financial literacy performance related to immigrant background is larger than 15 score points in the Flemish Community of Belgium, Italy, the Netherlands and Spain, after taking into account students’ socio-economic status.
Students’ experience with money
• In 10 out of 13 countries and economies with available data, discussing money matters with parents at least sometimes is associated with higher financial literacy than never discussing the subject, after taking into account students’ socio-economic status.
• In Australia, the Flemish Community of Belgium, the participating Canadian provinces and the Netherlands, more than 70% of students hold a bank account, while in Chile, Italy, Lithuania, Poland and the Russian Federation, fewer than 40% of students do.
• In Australia, the Flemish Community of Belgium, the participating Canadian provinces, Italy, the Netherlands, Spain and the United States, students who hold a bank account perform better in financial literacy – by over 20 score points – than students of similar socio-economic status who do not have a bank account.
Relative performance in financial literacyDifference between the actual financial literacy score and the score predicted by students’ performance in mathemat-ics and reading
Note: Statistically significant differences are shown in a darker tone.Countries and economies are ranked in descending order of the score-point difference between actual and expected performance.Source: OECD, PISA 2015 Database, Table IV.3.11.
B-S-J-G (China)
Belgium (Flemish)
Russia
Canadian provinces
Peru
United States
Australia
Brazil
Netherlands
OECD average-10
Italy
Chile
Poland
Slovak Republic
Spain
Lithuania
73
60
55
55
52
48
49
47
46
44
42
41
33
37
32
30
-40 -20-30 -10 0 10 20 30 40
Percentage of students who perform above their expected score
Score-point difference
Students’ performance in financial literacy is lower than the performance
of students with similar scores in mathematics and reading
Students’ performance in financial literacy is higher than the performance
of students with similar scores in mathematics and reading

PISA 2015 Results in Focus © OECD 2018 21
• Gifts of money are the most frequent source of money for 15-year-old students. Over 80% of students in 9 countries and economies out of 13 with available data receive money in the form of gifts. More than one in three students, on average in each country/economy, reported that they receive money from an allowance or pocket money for regularly doing chores at home. On average across OECD countries and economies, 64% of students earn money from some formal or informal work activity, such as working outside school hours, working in a family business, or doing occasional informal jobs.
• On average across OECD countries and economies, students who receive gifts of money score 13 points higher in financial literacy than students who do not, after taking into account performance in mathematics and reading, and various student characteristics, including socio-economic status.
Students’ financial literacy, behaviour and expectations
• At least 50% of students, on average, in each of the 13 countries and economies with available data, reported that
they would save if they want to buy something for which they do not have enough money.
• On average across OECD countries and economies, when asked what they would do if they want to buy something for which they do not have enough money, students who perform at Level 4 or 5 in financial literacy are about three times as likely as students performing at or below Level 1 with similar characteristics and performance in core PISA subjects to report that they would save, rather than reporting that they would buy the item anyway with money that should be used for something else.
• In Australia, Chile, Italy, Lithuania, Peru and Spain, students performing at Level 4 or above in financial literacy were at least 70% more likely than students performing at or below Level 1 to report that they expect to complete university education, after taking into account socio-economic status, performance in mathematics and reading, and other student characteristics.
Mean performance in financial literacy, by students’ socio-economic status
Difference in financial literacy performance between students in the top quarter and students in the bottom quarter of this index
Brazil
Peru
Chile
Slovak Republic
Lithuania
Spain
Italy
Poland
Russia
OECD average-10
United States
Australia
Netherlands
Canadian provinces
Belgium (Flemish)
B-S-J-G (China)
78
117
103
80
71
79
60
73
46
89
97
107
104
77
110
132
350 400 450 500 550 600 650300
The PISA index of economic, social and cultural status (ESCS):
Mean score
Top quarterThird quarterSecond quarterBottom quarter
Countries and economies are ranked in descending order of the mean score of advantaged students.Source: OECD, PISA 2015 Database, Table IV.4.11.

PISA 2015 Results in Focus © OECD 201822
As globalisation and digital technologies have made financial services more widely accessible and challenging, and as financial decisions are increasingly common in the lives of young people, everyone needs to be financially literate
Globalisation and digital technologies have made financial services and products more widely accessible and at the same time more complex to handle. Responsibility for investing in higher education or planning for retirement is increasingly assumed by individuals. Young people are now more likely to encounter situations where they need to set their spending priorities, be aware of new types of fraud, know that some items that they want to buy will incur ongoing costs, and be alert that some purchasing offers are simply too good to be true.
On average across OECD countries and economies, as many as 22% of students perform below Level 2 in financial literacy, which can be considered the baseline level of proficiency that is required to participate in society. Perhaps unsurprisingly, disadvantaged students are over-represented among low performers. Financial literacy is relevant not just for those who have large sums of money to invest; everyone needs to be financially literate, especially those who live on tight budgets and have little leeway in case they make financial mistakes.
While disadvantaged students are among the least financially literate, they probably need some financial knowledge and skills the most. Large disparities in skills among 15-year-olds signal that not all students are offered an equal opportunity to develop their financial literacy. If socio-economic disparities are not addressed early, they are likely to lead to even larger gaps in financial literacy as students become adults. Low-performing disadvantaged students need to be supported to ensure that they can safely navigate the (increasingly digital) financial system as they become more independent.
Students should be helped to make the most of learning opportunities in school
Financial literacy performance is strongly correlated with performance in mathematics and reading, even though a significant part of the skills tested in this assessment are unique to financial literacy. Students should be helped to make the most of what they learn in subjects taught in compulsory education, which
could also be complemented with more specific financial literacy content. Several countries have started integrating some financial literacy topics into existing school subjects, such as mathematics or social sciences. However, more evidence is needed to show the extent to which incorporating financial literacy elements into existing subjects is effective as compared to other approaches to improve students’ levels of financial literacy.
Fostering the development of financial literacy skills in school could also be a way to offer students learning opportunities beyond those provided by parents and peers, to help overcome socio-economic inequalities, and to expose students to more balanced messages than those they might receive through media and advertising.
Students are likely to develop their financial skills through direct experience, and they should be provided with safe opportunities to “learn by doing” outside of school
Evidence that there is a positive relationship between performance in financial literacy and holding a bank account or receiving gifts of money might suggest that some kind of experience with money or financial products could provide students with an opportunity to reinforce financial literacy, or that students who are more financially literate are more motivated to use financial products. Parents are very likely to be involved in these experiences, as they may have given their children money through allowances or gifts, opened a bank account for them and taught them how to use it.
Even under the supervision of parents, it is important that young people can access financial products and services that are safe and regulated, and that they start to have an understanding of the risks associated with the different products and services, so that they can safely approach the financial system even before they acquire full legal rights to enter into financial contracts by themselves.
Young people can be further supported to “learn by doing” through after-school initiatives, such as videos, competitions, interactive tools and serious games – via digital and/or traditional platforms. These initiatives are used not so much to disseminate information but to provide young people with applied knowledge and allow them to safely experience financial situations and decisions before they encounter them in real life.
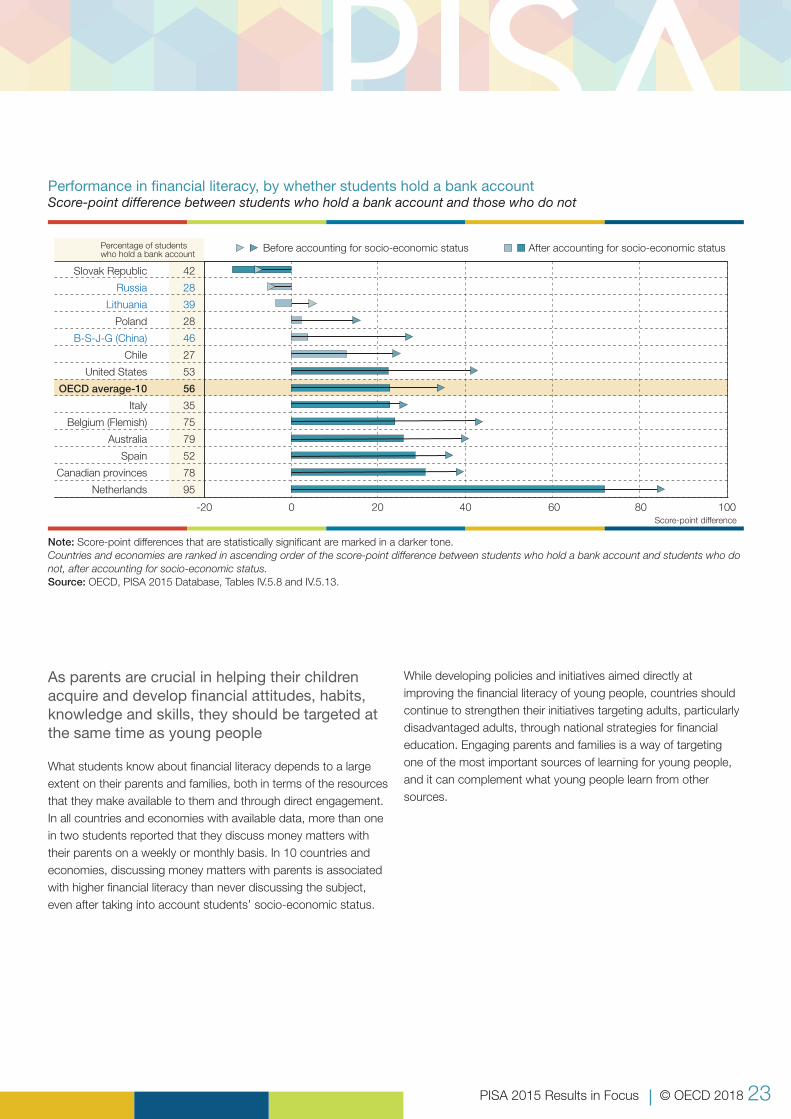
PISA 2015 Results in Focus © OECD 2018 23
As parents are crucial in helping their children acquire and develop financial attitudes, habits, knowledge and skills, they should be targeted at the same time as young people
What students know about financial literacy depends to a large extent on their parents and families, both in terms of the resources that they make available to them and through direct engagement. In all countries and economies with available data, more than one in two students reported that they discuss money matters with their parents on a weekly or monthly basis. In 10 countries and economies, discussing money matters with parents is associated with higher financial literacy than never discussing the subject, even after taking into account students’ socio-economic status.
While developing policies and initiatives aimed directly at improving the financial literacy of young people, countries should continue to strengthen their initiatives targeting adults, particularly disadvantaged adults, through national strategies for financial education. Engaging parents and families is a way of targeting one of the most important sources of learning for young people, and it can complement what young people learn from other sources.
Performance in financial literacy, by whether students hold a bank accountScore-point difference between students who hold a bank account and those who do not
Percentage of students who hold a bank account
Slovak Republic
Russia
Lithuania
Poland
B-S-J-G (China)
Chile
United States
OECD average-10
Italy
Belgium (Flemish)
Australia
Spain
Canadian provinces
Netherlands
42
28
39
28
46
27
53
56
35
75
79
52
78
95
0 20 40 60 80 100-20Score-point difference
After accounting for socio-economic statusBefore accounting for socio-economic status
Note: Score-point differences that are statistically significant are marked in a darker tone.Countries and economies are ranked in ascending order of the score-point difference between students who hold a bank account and students who do not, after accounting for socio-economic status.Source: OECD, PISA 2015 Database, Tables IV.5.8 and IV.5.13.

PISA 2015 Results in Focus © OECD 201824
Collaborative problem solving
25 points higher than boys after accounting for performance in the three core PISA subjects.
Students’ attitudes towards collaboration
• Students in every country and economy have generally positive attitudes towards collaboration. Over 85% of students, on average across OECD countries, agree with the statements “I am a good listener”, “I enjoy seeing my classmates be successful”, “I take into account what others are interested in”, “I enjoy considering different perspectives”, and “I enjoy co-operating with peers”.
• Girls in almost every country and economy tend to value relationships more than boys, meaning that girls agree more often than boys that they are good listeners, enjoy seeing their classmates be successful, take into account what others are interested in, and enjoy considering different perspectives.
• Boys in the majority of countries and economies tend to value teamwork more than girls, meaning that boys agree more often than girls that they prefer working as part of a team to working alone, find that teams make better decisions than individuals, find that teamwork raises their own efficiency, and enjoy co-operating with peers.
• Advantaged students in almost every country and economy tend to value relationships more than disadvantaged students, while disadvantaged students in most countries and economies tend to value teamwork more than advantaged students.
• After accounting for performance in the three core PISA subjects, gender, and socio-economic status, the more students value relationships, the better they perform in collaborative problem solving. A similar relationship is observed the more students value teamwork.
Student activities, school policies and collaboration skills
• Attitudes towards collaboration are generally more positive as students engage in more physical activity or attend more physical education classes per week.
• Students who play video games outside of school score slightly lower in collaborative problem solving than students who do not play video games, on average across OECD countries, after accounting for performance in the three core PISA subjects, gender, and students’ and schools’ socio-economic profile. But students who access the Internet, chat or social networks outside of school score slightly higher than other students.
• Students who work in the household or take care of other family members value both teamwork and relationships more than other students.
What the data tell us
Student performance in collaborative problem solving
• Students in Singapore score higher in collaborative problem solving than students in all other participating countries and economies, followed by students in Japan.
• On average across OECD countries, 28% of students are able to solve only straightforward collaborative problems, if any at all. By contrast, fewer than one in six students in Estonia, Hong Kong (China), Japan, Korea, Macao (China) and Singapore is a low achiever in collaborative problem solving.
• Across OECD countries, 8% of students are top performers in collaborative problem solving, meaning that they can maintain an awareness of group dynamics, ensure team members act in accordance with their agreed-upon roles, and resolve disagreements and conflicts while identifying efficient pathways and monitoring progress towards a solution.
• Collaborative problem-solving performance is positively related to performance in the core PISA subjects (science, reading and mathematics), but the relationship is weaker than that observed among those other domains.
• Students in Australia, Japan, Korea, New Zealand and the United States perform much better in collaborative problem solving than would be expected based on their scores in science, reading and mathematics.
Student demographics and collaborative problem solving
• Girls perform significantly better than boys in collaborative problem solving in every country and economy that participated in the assessment. On average across OECD countries, girls score 29 points higher than boys. The largest gaps – of over 40 points – are observed in Australia, Finland, Latvia, New Zealand and Sweden; the smallest gaps – of less than 10 points – are observed in Colombia, Costa Rica and Peru. This contrasts with the PISA 2012 assessment of individual problem solving, where boys generally performed better than girls.
• Performance in collaborative problem solving is positively related to students’ and schools’ socio-economic profile, although this relationship is weaker than the relationship between socio-economic profile and performance in the three core PISA subjects.
• There are no significant performance differences between advantaged and disadvantaged students, or between immigrant and non-immigrant students, after accounting for performance in science, reading and mathematics. But girls still score

PISA 2015 Results in Focus © OECD 2018 25
Snapshot of performance in collaborative problem solving and attitudes towards collaboration
1. Relative scores are the residuals obtained from a pooled linear regression, across all participating countries/economies, of the performance in collabo-rative problem solving over performance in science, reading and mathematics.2. See note 1 under Figure 1. Snapshot of performance in science, reading and mathematics.Note: At the country/economy level, values that are statistically significant are marked in bold (see Annex A3).Countries and economies are ranked in descending order of the mean collaborative problem-solving score.Source: OECD, PISA 2015 Database, Tables V.3.2, V.3.9a, V.4.3a and V.5.1.
Countries/economies with a mean performance/relative performance above the OECD average
Countries/economies with a mean performance/relative performance not significantly different from the OECD average
Countries/economies with a mean performance/relative performance below the OECD average
Collaborative problem solvingIndex of valuing
relationshipsIndex of valuing
teamworkAll students Relative performance1 Boys Girls Gender difference
(boys – girls)Mean score Score dif. Mean score Mean score Score dif. Mean index Mean index
OECD average-32 500 3 486 515 -29 0.01 0.00Singapore 561 16 552 572 -20 0.32 0.27Japan 552 23 539 565 -26 -0.22 -0.03Hong Kong (China) 541 15 523 559 -36 -0.04 0.05Korea 538 20 522 556 -33 -0.02 0.14Canada 535 10 516 555 -39 0.11 0.00Estonia 535 8 522 549 -27 0.03 -0.10Finland 534 7 511 559 -48 -0.08 -0.22Macao (China) 534 11 515 553 -38 -0.15 0.01New Zealand 533 20 513 553 -41 0.01 0.07Australia 531 23 511 552 -41 0.09 0.01Chinese Taipei 527 5 513 541 -28 0.22 0.37Germany 525 14 510 540 -30 0.15 0.14United States 520 22 507 533 -26 0.13 0.06Denmark 520 14 509 530 -21 0.01 -0.12United Kingdom 519 12 503 536 -34 -0.04 -0.04Netherlands 518 8 504 531 -27 -0.18 -0.26Sweden 510 9 489 531 -42 0.05 -0.19Austria 509 13 498 521 -24 0.24 0.19Norway 502 -5 487 518 -30 0.11 -0.23Slovenia 502 -10 484 521 -36 -0.04 0.02Belgium 501 -4 489 514 -25 -0.06 -0.11Iceland 499 15 485 512 -27 -0.09 -0.20Czech Republic 499 3 486 512 -26 -0.20 0.00Portugal 498 -5 489 507 -19 0.37 0.32Spain 496 -1 485 508 -22 0.19 0.15B-S-J-G (China) 496 -17 486 508 -22 0.01 0.39France 494 -7 480 508 -29 -0.07 0.11Luxembourg 491 2 478 504 -25 0.03 0.00Latvia 485 -9 465 505 -40 -0.30 -0.14Italy 478 -11 466 489 -23 -0.14 0.02Russia 473 -22 460 486 -25 -0.25 -0.18Croatia 473 -12 459 486 -27 0.01 0.21Hungary 472 -10 459 485 -26 -0.03 -0.02Israel 469 -11 459 481 -22 0.24 -0.03Lithuania 467 -15 453 482 -29 0.16 0.33Slovak Republic 463 -7 448 478 -30 -0.34 -0.12Greece 459 -10 444 475 -31 0.03 0.18Chile 457 -3 450 464 -14 0.08 0.21Cyprus2 444 -6 424 464 -40 0.07 0.10Bulgaria 444 -10 429 461 -31 -0.03 -0.07Uruguay 443 -6 434 451 -17 0.11 0.20Costa Rica 441 4 437 445 -7 0.35 0.34Thailand 436 2 416 451 -35 0.10 0.37United Arab Emirates 435 -14 416 454 -38 0.32 0.45Mexico 433 -1 426 440 -14 0.16 0.23Colombia 429 -4 425 433 -8 0.05 0.23Turkey 422 -19 411 434 -23 0.00 -0.04Peru 418 2 414 421 -7 -0.08 0.09Montenegro 416 -18 403 429 -26 -0.05 -0.09Brazil 412 -9 402 421 -18 -0.04 0.20Tunisia 382 -18 375 387 -12 0.12 0.43Ireland m m m m m 0.03 0.04Poland m m m m m -0.21 -0.06Switzerland m m m m m 0.19 0.22Dominican Republic m m m m m 0.27 0.51Qatar m m m m m 0.12 0.23

PISA 2015 Results in Focus © OECD 201826
Collaborative schools
• On average across OECD countries, students who reported not being threatened by other students score 18 points higher in collaborative problem solving than students who reported being threatened at least a few times per year. Students also score 11 points higher for every 10 percentage-point increase in the number of schoolmates who reported that they are not threatened by other students.
• Students score higher in collaborative problem solving when they or their schoolmates reported that teachers treat students fairly, even after accounting for their performance in science, reading and mathematics.
Many school subjects provide opportunities to cultivate skills in and positive attitudes towards collaboration.
Collaboration skills can be taught and practiced in cognitive subjects, such as science, reading and mathematics: students can work and present in groups and can help each other learn
the subject. However, much of the effort to master the material taught is typically made individually by the student. In contrast, collaboration is vital to many activities in physical education class, most obviously team sports, which require individuals to work together in groups to achieve a common goal.
However, there is variation across countries in what is emphasised in physical education class. Some countries, including Finland and Japan, emphasise collaboration instead of competition in physical education class; other countries, such as Germany, Latvia, Hungary and the United Kingdom, place greater emphasis on competition and attaining one’s personal best. Unfortunately, cross-sectional data from PISA cannot indicate which approach is more effective at developing collaboration skills.
What the data do show, though, is that students who attend physical education class once or twice per week score highest in collaborative problem solving. After accounting for performance in the three core PISA subjects, students who attend between zero and three days of physical education class per week score similarly, and score above students who attend four or more days per week.
Physical education class and performance in collaborative problem solving, by genderCollaborative problem-solving performance, OECD average
Source: OECD, PISA 2015 Database, Table V.6.1c.
530
520
510
500
490
480
470
460
450
440
430
Mean score
Days of physical education class per week
Boys GirlsAll students
0 1 2 3 4 5+

PISA 2015 Results in Focus © OECD 2018 27
Students can be encouraged to mingle with others from different backgrounds.
Previous PISA volumes have consistently documented that socio-economically advantaged students perform better in science, reading and mathematics than disadvantaged students. This is also true for performance in collaborative problem solving.
However, this relationship with socio-economic status is not consistently observed across education systems when looking solely at the collaborative aspect of students’ collaborative problem-solving scores (i.e. once performance in science, reading and mathematics is accounted for). If anything, students of lower socio-economic status often do better than students of higher socio-economic status relative to their performance in the three core PISA subjects – although this relationship is highly variable across education systems.
In other words, there is no clear relationship between socio-economic status and students’ ability to work productively with others. Disadvantaged students are more likely to value teamwork, perhaps because they value more the extra boost that teamwork can bring to their own performance. Likewise, there are no large differences between the collaborative skills of immigrant and non-immigrant students.
One of the demographic factors related to the collaborative aspect of performance in this assessment is the concentration of immigrant students in a student’s school. Non-immigrant students tend to perform better in the collaboration-specific aspects of the assessment when they attend schools with a larger proportion of immigrant students. This result cannot be generalised to socio-economic diversity within schools, however. Education systems should investigate whether, in their own context, diversity and students’ contact with those who are different from them and who may hold different points of view can aid in developing collaboration skills.
Boys need help in developing stronger collaboration skills, but don’t forget girls.
Girls outperform boys in collaborative problem solving in every education system, both before and after accounting for performance in science, reading and mathematics. The relative size of the gender gap in collaborative problem-solving performance is even larger than it is in reading, where girls also outperform boys in every education system. This gender gap contrasts with that in the PISA 2012 individual problem-solving assessment, where boys outperform girls.
Girls are found to hold more positive attitudes towards relationships, meaning that they tend to be interested in others’ opinions and want others to succeed. Boys, on the other hand, are found to hold more positive attitudes towards teamwork: they see the instrumental benefits of teamwork and how collaboration can help them work more effectively and efficiently. As positive attitudes towards collaboration – whether towards relationships or towards teamwork – are positively correlated with the collaboration-related component of performance in this assessment, education systems should look into fostering boys’ appreciation of others.
However, although girls outperform boys, on average, there is a large overlap in their score distribution, with many girls also attaining only low levels of proficiency in collaborative problem solving. Schools should support both boys and girls who have trouble in forming healthy, positive and mutually supportive relationships with others.

PISA 2015 Results in Focus © OECD 201828
Attitudes towards collaboration and performance in collaborative problem solvingScore-point difference in performance between those who agreed/strongly agreed with each statement and those who disagreed/strongly disagreed with the statement, OECD average
1. The socio-economic profile is measured by the PISA index of economic, social and cultural status (ESCS).Notes: All differences are statistically significant (see Annex A3).Relative performance refers to the residual performance, attributable to purely “collaborative problem-solving” competencies, after accounting for performance in science, reading and mathematics in a regression performed across students nationally.Statements about attitudes towards collaboration are ranked in descending order of the score-point difference in collaborative problem solving between students who agreed/strongly agreed and those who disagreed/strongly disagreed with the above statements.Source: OECD, PISA 2015 Database, Tables V.5.2a-h.
40
30
20
10
0
-10
-20
-30
15
10
5
0
Sco
re-p
oint
diff
eren
ceS
core
-poi
nt d
iffer
ence
After accounting for gender and students’ and schools’ socio-economic profile
Before accounting for gender and students’ and schools’ socio-economic profile¹
Items comprising the index of valuing relationships
Higher performance among students who agreedwith these statements, even after accounting for gender
and students’ and schools’ socio-economic profile
Lower performance among students who agreedwith these statements, even after accounting for gender
and students’ and schools’ socio-economic profile
Items comprising the index of valuing teamwork
I am a good listener I take into accountwhat others are
interested in
I enjoy consideringdifferent perspectives
I enjoy seeingmy classmatesbe successful
I find that teamsmake better decisions
than individuals
I enjoy co-operatingwith peers
I prefer workingas part of a teamto working alone
I find thatteamwork raises
my own efficiency
Items comprising the index of valuing relationships Items comprising the index of valuing teamwork
I am a good listener I take into accountwhat others are
interested in
I enjoy consideringdifferent perspectives
I enjoy seeingmy classmatesbe successful
I find that teamsmake better decisions
than individuals
I enjoy co-operatingwith peers
I prefer workingas part of a teamto working alone
I find thatteamwork raises
my own efficiency
Per
form
ance
in c
olla
bo
rativ
ep
rob
lem
so
lvin
gR
elat
ive
per
form
ance
in
colla
bo
rativ
e p
rob
lem
so
lvin
g Higher relative performance among students who agreedwith all of these statements, even after accounting for gender
and students’ and schools’ socio-economic profile
The quality of the learning environment at school can influence students’ attitudes towards collaboration.
Results show that students who establish more positive relationships with their peers, teachers and parents tend to score higher in collaborative problem solving, and so do other students in the school. The good news is that most students, teachers and principals reported a positive learning environment in their schools. But too many students reported that they feel isolated at school, are bullied repeatedly or are treated unfairly by teachers. Schools can help by identifying students who are socially isolated, organising activities to foster constructive relationships at school,
providing teacher training on classroom management, and adopting a whole-of-school approach to prevent bullying.
How can students develop strong relationships? On line, at home, but not through video games.
One way in which children develop relationships is on line, through Internet chat rooms or social media. In the past, students would meet friends face-to-face during the lunch break or after school, or would call them and talk on the phone from home. Today, students use Facebook, WeChat, WhatsApp, Twitter, Instagram, and other applications to get in immediate touch with their friends.
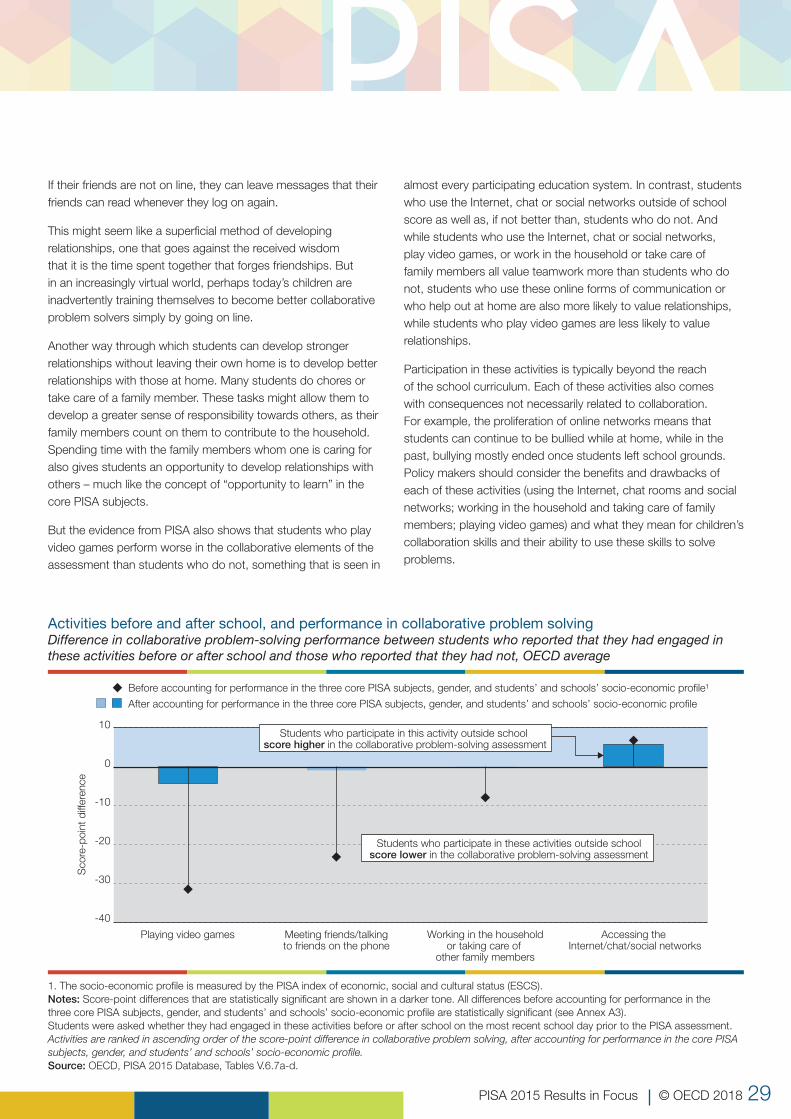
PISA 2015 Results in Focus © OECD 2018 29
If their friends are not on line, they can leave messages that their friends can read whenever they log on again.
This might seem like a superficial method of developing relationships, one that goes against the received wisdom that it is the time spent together that forges friendships. But in an increasingly virtual world, perhaps today’s children are inadvertently training themselves to become better collaborative problem solvers simply by going on line.
Another way through which students can develop stronger relationships without leaving their own home is to develop better relationships with those at home. Many students do chores or take care of a family member. These tasks might allow them to develop a greater sense of responsibility towards others, as their family members count on them to contribute to the household. Spending time with the family members whom one is caring for also gives students an opportunity to develop relationships with others – much like the concept of “opportunity to learn” in the core PISA subjects.
But the evidence from PISA also shows that students who play video games perform worse in the collaborative elements of the assessment than students who do not, something that is seen in
almost every participating education system. In contrast, students who use the Internet, chat or social networks outside of school score as well as, if not better than, students who do not. And while students who use the Internet, chat or social networks, play video games, or work in the household or take care of family members all value teamwork more than students who do not, students who use these online forms of communication or who help out at home are also more likely to value relationships, while students who play video games are less likely to value relationships.
Participation in these activities is typically beyond the reach of the school curriculum. Each of these activities also comes with consequences not necessarily related to collaboration. For example, the proliferation of online networks means that students can continue to be bullied while at home, while in the past, bullying mostly ended once students left school grounds. Policy makers should consider the benefits and drawbacks of each of these activities (using the Internet, chat rooms and social networks; working in the household and taking care of family members; playing video games) and what they mean for children’s collaboration skills and their ability to use these skills to solve problems.
Activities before and after school, and performance in collaborative problem solvingDifference in collaborative problem-solving performance between students who reported that they had engaged in these activities before or after school and those who reported that they had not, OECD average
1. The socio-economic profile is measured by the PISA index of economic, social and cultural status (ESCS).Notes: Score-point differences that are statistically significant are shown in a darker tone. All differences before accounting for performance in the three core PISA subjects, gender, and students’ and schools’ socio-economic profile are statistically significant (see Annex A3).Students were asked whether they had engaged in these activities before or after school on the most recent school day prior to the PISA assessment.Activities are ranked in ascending order of the score-point difference in collaborative problem solving, after accounting for performance in the core PISA subjects, gender, and students’ and schools’ socio-economic profile.Source: OECD, PISA 2015 Database, Tables V.6.7a-d.
10
0
-10
-20
-30
-40
Sco
re-p
oint
diff
eren
ce
After accounting for performance in the three core PISA subjects, gender, and students’ and schools’ socio-economic profile
Before accounting for performance in the three core PISA subjects, gender, and students’ and schools’ socio-economic profile¹
Playing video games Meeting friends/talkingto friends on the phone
Students who participate in this activity outside school score higher in the collaborative problem-solving assessment
Students who participate in these activities outside schoolscore lower in the collaborative problem-solving assessment
Working in the householdor taking care of
other family members
Accessing the Internet/chat/social networks

PISA 2015 Results in Focus © OECD 201830
PISA 2015 Results
Volume I, Excellence and Equity in Education, summarises student performance in PISA 2015, and examines inclusiveness and fairness in participating education systems, http://dx.doi.org/10.1787/9789264266490-en.
Volume II, Policies and Practices for Successful Schools, examines how student performance is associated with various characteristics of individual schools and school systems, http://dx.doi.org/10.1787/9789264267510-en.
Volume III, Students’ Well-Being, describes how well adolescent students are learning and living, http://dx.doi.org/10.1787/9789264267510-en.
Volume IV, Students’ Financial Literacy, examines 15-year-old students’ understanding about money matters in the 15 countries and economies that participated in this optional assessment, http://dx.doi.org/10.1787/9789264270282-en.
Volume V, Collaborative Problem Solving, examines students’ ability to work with two or more people to try to solve a problem, http://dx.doi.org/10.1787/9789264285521-en.
This work is published under the responsibility of the Secretary-General of the OECD. The opinions expressed and arguments employed herein do not
necessarily reflect the official views of OECD member countries.
This document, as well as any data and any map included herein, are without prejudice to the status of or sovereignty over any territory, to the
delimitation of international frontiers and boundaries and to the name of any territory, city or area.
The statistical data for Israel are supplied by and under the responsibility of the relevant Israeli authorities. The use of such data by the OECD is without
prejudice to the status of the Golan Heights, East Jerusalem and Israeli settlements in the West Bank under the terms of international law.
B-S-J-G (China) refers to the four PISA-participating Chinese provinces: Beijing, Shanghai, Jiangsu and Guangdong.
CABA (Argentina) refers to the adjudicated region of Ciudad Autónoma de Buenos Aires (CABA).
FYROM refers to the Former Yugoslav Republic of Macedonia.
Russia refers to the Russian Federation.
© OECD 2018
This work is available under the Creative Commons Attribution-NonCommercial-ShareAlike 3.0 IGO (CC BY-NC-SA 3.0 IGO). For specific information regarding the scope and terms of the licence as well as possible commercial use of this work or the use of PISA data please consult Terms and Conditions on www.oecd.org.
© OECD 2018 31
For more information, contact: Andreas Schleicher
Visit: www.oecd.org/pisa