pisa 2015 results - oecd sa p rogramme for i nternational s tudent a ssessment pisa 2015 results...
TRANSCRIPT

PISAP r o g r a m m e f o r I n t e r n a t i o n a l S t u d e n t A s s e s s m e n t
PISA 2015 Results STUDENTS’ WELL-BEING
VOLUME III OVERVIEW


PISA 2015 Results (Volume III)
STUDENTS’WELL-BEING
PISA

Photo credits: © Geostock / Getty Images © Hero Images Inc. / Hero Images Inc. / Corbis© LIUSHENGFILM / Shutterstock© RelaXimages / Corbis© Shutterstock /Kzenon © Simon Jarratt/Corbis
Corrigenda to OECD publications may be found on line at: www.oecd.org/publishing/corrigenda.
© OECD 2017
This work is available under the Creative Commons Attribution-NonCommercial-ShareAlike 3.0 IGO (CC BY-NC-SA 3.0 IGO). For specific
information regarding the scope and terms of the licence as well as possible commercial use of this work or the use of PISA data please
consult Terms and Conditions on www.oecd.org.
This work is published under the responsibility of the Secretary-General of the OECD. The opinions expressed and the arguments employed herein do not necessarily reflect the official views of the OECD member countries.
This document and any map included herein are without prejudice to the status of or sovereignty over any territory, to the delimitation of international frontiers and boundaries and to the name of any territory, city or area.
The statistical data for Israel are supplied by and under the responsibility of the relevant Israeli authorities. The use of such data by the OECD is without prejudice to the status of the Golan Heights, East Jerusalem and Israeli settlements in the West Bank under the terms of international law.
Please cite this publication as:
OECD (2017), PISA 2015 Results (Volume III): Students’Well-Being, PISA, OECD Publishing, Paris.
http://dx.doi.org/10.1787/9789264273856-en
ISBN (print) 978-92-64-27381-8ISBN (PDF) 978-92-64-27385-6
PISA 2015 RESULTS (VOLUME III): STUDENTS’ WELL-BEING – OVERVIEW © OECD 2017 3
Editorial
Schools are not just places where students acquire academic skills; they also help students become more resilient in the face of adversity, feel more connected with the people around them, and aim higher in their aspirations for their future. Not least, schools are the first place where children experience society in all its facets, and those experiences can have a profound influence on students’ attitudes and behaviour in life.
PISA is best known for its data on learning outcomes, but it also studies students’ satisfaction with life, their relationships with peers, teachers and parents, and how they spend their time outside of school. PISA results show that students differ greatly, both between and within countries, in how satisfied they are with their life, their motivation to achieve, how anxious they feel about their schoolwork, their expectations for the future, and their perceptions of being bullied at school or treated unfairly by their teachers. Students in some of the countries that top the PISA league tables in science and mathematics reported comparatively low satisfaction with life; but Finland, the Netherlands and Switzerland seem able to combine good learning outcomes with highly satisfied students.
It is tempting to equate low levels of life satisfaction among students in East Asia or elsewhere to long study hours, but the data show no relationship between the time students spend studying, whether in or outside of school, and their satisfaction with life. And while educators often argue that anxiety is the natural consequence of testing overload, the frequency of tests is also unrelated to students’ level of schoolwork-related anxiety.
There are other factors that make a difference to student well-being, and much comes down to teachers, parents and schools.
For a start, PISA finds that one major threat to students’ sense of belonging at school is their perception of negative relationships with their teachers. Happier students tended to report positive relations with their teachers. Students in “happy” schools (schools where students’ life satisfaction is above the average in the country) reported much greater support from their teachers than did students in “unhappy” schools.
This is important. Teenagers look for strong social ties and value acceptance, care and support from others. Adolescents who feel that they are part of a school community are more likely to perform better academically and be more motivated in school.
Of course, most teachers care about having positive relationships with their students; but some teachers may be insufficiently prepared to deal with difficult students and classroom environments. A stronger focus on classroom and relationship management in professional development may give teachers better means to connect with their students. Teachers should also be better supported to collaborate and exchange information about students’ difficulties, character and strengths with their colleagues.
On average across OECD countries, 59% of students reported that they often worry that taking a test will be difficult, and 66% reported that they worry about poor grades. Some 55% of students say they are very anxious for a test even if they are well prepared. In all countries, girls reported greater schoolwork-related anxiety than boys; and anxiety about schoolwork, homework and tests is negatively related to performance.

EDITORIAL
4 © OECD 2017 PISA 2015 RESULTS (VOLUME III): STUDENTS’ WELL-BEING – OVERVIEW
PISA suggests that there is much teachers can do about this too. Students were less likely to report anxiety if the science teacher provides individual help when they are struggling. Teachers need to know how to help students develop a good understanding of their strengths and weaknesses, and an awareness of what they can do to mitigate those weaknesses. The design of assessments matters too. More frequent assessments that start with easier goals and gradually increase in difficulty can also help build students’ sense of control, as can opportunities for students to demonstrate their skills in low-stakes tests before taking an assessment that counts.
Parents can make a big difference too. Students whose parents reported “spending time just talking to my child”, “eating the main meal with my child around a table” or “discussing how well my child is doing at school” regularly were between 22% and 39% more likely to report high levels of life satisfaction. “Spending time just talking” is the parental activity most frequently and most strongly associated with students’ life satisfaction. And it seems to matter for performance too: students whose parents reported “spending time just talking” were two-thirds of a school year ahead in science learning; and even after accounting for socio-economic status, the advantage remains at one-third of a school year.
Students’ perceptions of how interested their parents are in them and in their school life is also related to their own attitudes towards education and their motivation to study. Those relationships are particularly strong among low-performing students – and stronger than the impact of most school resources and other factors measured by PISA.
Parents can help children manage test anxiety by encouraging them to trust in their ability to accomplish various academic tasks. PISA results show that girls who perceive that their parents encourage them to be confident in their abilities were less likely to report that they feel tense when they study.
Most parents also want their children to be motivated at school, and motivated students tend to do better at school. On average, students who are among the most motivated score the equivalent of more than one school year higher in PISA than the least-motivated students. Achievement motivation is also related to life satisfaction in a mutually reinforcing way.
But there can also be downsides to achievement motivation, particularly when it is a response to external pressure. PISA results show that countries where students are highly motivated to achieve also tend to be the countries where many students feel anxious about a test, even if they are well prepared for it. Both teachers and parents need to find ways to encourage students’ motivation to learn and achieve without generating an excessive fear of failure.
All in all, a clear way to promote students’ well-being is for schools to encourage all parents to be more involved with their child’s school life. If parents and teachers establish relationships based on trust, schools can rely on parents as valuable partners in the cognitive and socio-emotional education of their students. Schools can also do a lot to help parents overcome barriers to participation in school activities related to inflexible work schedules, lack of childcare services or language. They can open flexible channels of communication, such as scheduled phone or video calls. Governments can also take action by promoting work-life balance policies.
PISA 2015 asked students how much time they spend on line and how they feel when they are engaged in online activities. Across OECD countries, most students agreed that “the Internet is a great resource for obtaining information” (88%) and that “it is very useful to have social networks on the Internet” (84%). The data also show that most students enjoy using various digital devices and the Internet, but some students are at risk of excessive Internet use. On average, 26% of students reported that they spend more than six hours per day on line during weekends, and 16% spend a similar amount of time on line during weekdays. In most participating countries, extreme Internet use – more than six hours per day – has a negative relationship with students’ life satisfaction and engagement at school. And with cyberbullying on the rise, the Internet can be as much a source of harassment as a tool for learning.
There are no quick fixes for the risks of the digital era, but schools can create opportunities for students to use the Internet more responsibly, and develop clear prevention and response plans to counter cyberbullying.
Perhaps the most distressing threat to students’ well-being is bullying, and it can have serious consequences for the victim, the bully and bystanders. PISA highlights a significant prevalence of all forms of bullying. On average across OECD countries, around 11% of students reported that they are frequently (at least a few times per month) made fun of, 7% reported that they are frequently left out of things, and 8% reported that they are frequently the object of nasty rumours in school. Around 4% of students – roughly one per class – reported that they are hit or pushed at least a few times per month, a percentage that varies from 1% to 9.5% across countries. Another 8% of students reported they are physically bullied a few times per year.

EDITORIAL
PISA 2015 RESULTS (VOLUME III): STUDENTS’ WELL-BEING – OVERVIEW © OECD 2017 5
There is no one-size-fits-all approach to preventing bullying. What emerges clearly from the PISA data, however, is that schools must do more to foster an environment of safety, tolerance and respect for children. A co-ordinated, international analysis of existing strategies and support mechanisms can shed light on what schools can do in the difficult struggle to assure students’ safety at school, and what national and local authorities and services can do to support schools in this effort. Anti-bullying programmes must include training for teachers on how to handle bullying and strategies to engage with parents. Teachers need to communicate to students that they will not tolerate any form of bullying; and parents need to be involved in responses to bullying. In fact, being a victim of bullying is less frequently reported among students who said that their parents support them when they face difficulties at school. And yet, only 44% of the parents of frequently bullied students reported that they had exchanged ideas about the child’s development with teachers over the previous academic year.
The challenges to students’ well-being are many, and there are no simple solutions. But the findings from PISA show how teachers, schools and parents can make a real difference. Together they can attend to students’ psychological and social needs and help them develop a sense of control over their future and the resilience they need to be successful in life.
Andreas SchleicherDirector for Education and Skills and Special Advisor on Education Policy to the Secretary-General

PISA 2015 RESULTS (VOLUME III): STUDENTS’ WELL-BEING – OVERVIEW © OECD 2017 7
Overview: Students’ well‑being
Overview: StudentS’ well‑being
8 © OECD 2017 PISA 2015 RESULTS (VOLUME III): STUDENTS’ WELL-BEING – OVERVIEW
Children spend a considerable amount of time in the classroom: following lessons, socialising with classmates, and interacting with teachers and other staff members. What happens in school is therefore key to understanding whether students enjoy good physical and mental health, how happy and satisfied they are with different aspects of their life, how connected to others they feel, and the aspirations they have for their future.
PISA 2015 offers a first-of-its-kind set of well-being indicators for adolescents that covers both negative outcomes (e.g. anxiety) and the positive impulses that promote healthy development (e.g. interest, motivation to achieve). Most of the PISA data on well-being are based on students’ self-reports, and thus give adolescents the opportunity to express how they feel, what they think of their lives, and what aspirations they have for their future.
PISA also allows for those well-being indicators to be related to students’ academic achievement across a large number of economies.
Students’ well-being, as defined in this report, refers to the psychological, cognitive, social and physical functioning and capabilities that students need to live a happy and fulfilling life. Well-being is thus first and foremost defined by the quality of life of students as 15-years-old individuals. While investing in future outcomes of children and adolescents is extremely important, policy makers and educators need to pay attention to students’ well-being now, while they are students. Well-being is also conceptualised in this report as a dynamic state: without sufficient investment to develop their capacities in the present, students are unlikely to enjoy well-being as adults.
PerFOrMAnCe At SCHOOl And liFe SAtiSFACtiOn
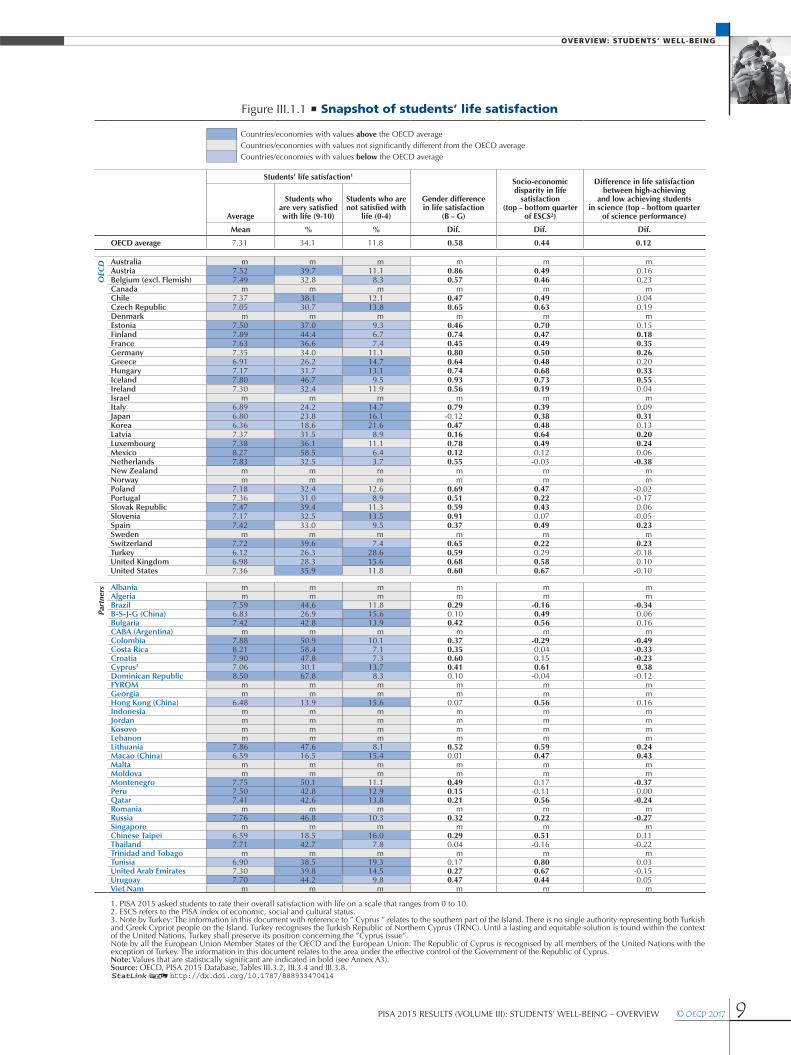
PISA 2015 asked students to rate their life on a scale from 0 to 10, where 0 means the worst possible life, and 10 means the best possible life. On average across OECD countries, students reported a level of 7.3 on a life-satisfaction scale ranging from 0 to 10 (Figure III.3.1). Roughly speaking, this suggests that the “average” adolescent in an OECD country is satisfied with life.
But there are large variations in life satisfaction across countries. For example, while less than 4% of students in the Netherlands reported that they are not satisfied with their life (they reported a level of 4 or below on the scale), more than 20% of students in Korea and Turkey reported so. In Montenegro, and in the Latin American countries of Colombia, Costa Rica, the Dominican Republic and Mexico, more than one in two students reported that they are very satisfied with their life (they reported a life-satisfaction level of 9 or 10 out of 10). Fewer than one in five students in the Asian countries/economies of Hong Kong (China), Korea, Macao (China) and Chinese Taipei reported similar levels of life satisfaction.
Comparing average levels of subjective well-being across countries is challenging. Variations in students’ reports of life satisfaction or happiness across countries might be influenced by cultural or local interpretations of what defines a happy life, and by differences in how life experiences are integrated into judgements of life satisfaction. Regardless of the dominant culture in their country/economy or of the language they speak, however, a large number of students in every education system reported that they are very satisfied with their life, and a smaller, but not negligible, number of students reported that they feel dissatisfied with their life. What lies behind these differences?
Gender, for one thing, is related to adolescents’ life satisfaction. On average across OECD countries, 29% of girls but 39% of boys reported that they are very satisfied with their life – a difference of almost 10 percentage points. Girls were also more likely than boys to report low satisfaction with life. On average across OECD countries, 9% of boys but 14% of girls reported a level of life satisfaction equal to 4 or lower on a scale of 0 to 10 (Table III.3.8).
The relationship between performance at school and life satisfaction is weak. In most countries, top-achieving students (those in the top 10% of the performance distribution) and low-achieving students (those in the bottom 10% of the performance distribution) reported similar levels of life satisfaction (Figure III.3.3). And, on average, there is no significant relationship between the time students spend studying, whether in or outside of school, and their satisfaction with life (Figure III.3.5).
The environment in which students learn can shape students’ development and life satisfaction. Every school has its own distinct climate and there is no universal recipe for creating a “happy” school. But schools, together with other social institutions, can attend to children’s fundamental psychological and social needs, and help students develop a sense of control over their life and resilience in the face of unfavourable situations.
Overview: StudentS’ well‑being
PISA 2015 RESULTS (VOLUME III): STUDENTS’ WELL-BEING – OVERVIEW © OECD 2017 9
Figure III.1.1 • Snapshot of students’ life satisfaction
Countries/economies with values above the OECD averageCountries/economies with values not significantly different from the OECD averageCountries/economies with values below the OECD average
Students’ life satisfaction1
Gender difference in life satisfaction
(B – G)
Socio-economic disparity in life
satisfaction (top – bottom quarter
of ESCS²)
Difference in life satisfaction between high-achieving
and low achieving students in science (top – bottom quarter
of science performance)Average
Students who are very satisfied with life (9-10)
Students who are not satisfied with
life (0-4)
Mean % % Dif. Dif. Dif.
OECD average 7.31 34.1 11.8 0.58 0.44 0.12
OEC
D Australia m m m m m mAustria 7.52 39.7 11.1 0.86 0.49 0.16Belgium (excl. Flemish) 7.49 32.8 8.3 0.57 0.46 0.23Canada m m m m m mChile 7.37 38.1 12.1 0.47 0.49 0.04Czech Republic 7.05 30.7 13.8 0.65 0.63 0.19Denmark m m m m m mEstonia 7.50 37.0 9.3 0.46 0.70 0.15Finland 7.89 44.4 6.7 0.74 0.47 0.18France 7.63 36.6 7.4 0.45 0.49 0.35Germany 7.35 34.0 11.1 0.80 0.50 0.26Greece 6.91 26.2 14.7 0.64 0.48 0.20Hungary 7.17 31.7 13.1 0.74 0.68 0.33Iceland 7.80 46.7 9.5 0.93 0.73 0.55Ireland 7.30 32.4 11.9 0.56 0.19 0.04Israel m m m m m mItaly 6.89 24.2 14.7 0.79 0.39 0.09Japan 6.80 23.8 16.1 -0.12 0.38 0.31Korea 6.36 18.6 21.6 0.47 0.48 0.13Latvia 7.37 31.5 8.9 0.16 0.64 0.20Luxembourg 7.38 36.1 11.1 0.78 0.49 0.24Mexico 8.27 58.5 6.4 0.12 0.12 0.06Netherlands 7.83 32.5 3.7 0.55 -0.03 -0.38New Zealand m m m m m mNorway m m m m m mPoland 7.18 32.4 12.6 0.69 0.47 -0.02Portugal 7.36 31.0 8.9 0.51 0.22 -0.17Slovak Republic 7.47 39.4 11.3 0.59 0.43 0.06Slovenia 7.17 32.5 13.5 0.91 0.07 -0.05Spain 7.42 33.0 9.5 0.37 0.49 0.23Sweden m m m m m mSwitzerland 7.72 39.6 7.4 0.65 0.22 0.23Turkey 6.12 26.3 28.6 0.59 0.29 -0.18United Kingdom 6.98 28.3 15.6 0.68 0.58 0.10United States 7.36 35.9 11.8 0.60 0.67 -0.10
Partners Albania m m m m m m
Algeria m m m m m mBrazil 7.59 44.6 11.8 0.29 -0.16 -0.34B-S-J-G (China) 6.83 26.9 15.6 0.10 0.49 0.06Bulgaria 7.42 42.8 13.9 0.42 0.56 0.16CABA (Argentina) m m m m m mColombia 7.88 50.9 10.1 0.37 -0.29 -0.49Costa Rica 8.21 58.4 7.1 0.35 0.04 -0.33Croatia 7.90 47.8 7.3 0.60 0.15 -0.23Cyprus3 7.06 30.1 13.7 0.41 0.61 0.38Dominican Republic 8.50 67.8 8.3 0.10 -0.04 -0.12FYROM m m m m m mGeorgia m m m m m mHong Kong (China) 6.48 13.9 15.6 0.07 0.56 0.16Indonesia m m m m m mJordan m m m m m mKosovo m m m m m mLebanon m m m m m mLithuania 7.86 47.6 8.1 0.52 0.59 0.24Macao (China) 6.59 16.5 15.4 0.01 0.47 0.43Malta m m m m m mMoldova m m m m m mMontenegro 7.75 50.1 11.1 0.49 0.17 -0.37Peru 7.50 42.8 12.9 0.15 -0.11 0.00Qatar 7.41 42.6 13.8 0.21 0.56 -0.24Romania m m m m m mRussia 7.76 46.8 10.3 0.32 0.22 -0.27Singapore m m m m m mChinese Taipei 6.59 18.5 16.0 0.29 0.51 0.11Thailand 7.71 42.7 7.8 0.04 -0.16 -0.22Trinidad and Tobago m m m m m mTunisia 6.90 38.5 19.3 0.17 0.80 0.03United Arab Emirates 7.30 39.8 14.5 0.27 0.67 -0.15Uruguay 7.70 44.2 9.8 0.47 0.44 0.05Viet Nam m m m m m m
1. PISA 2015 asked students to rate their overall satisfaction with life on a scale that ranges from 0 to 10.2. ESCS refers to the PISA index of economic, social and cultural status.3. Note by Turkey: The information in this document with reference to ” Cyprus ” relates to the southern part of the Island. There is no single authority representing both Turkish and Greek Cypriot people on the Island. Turkey recognises the Turkish Republic of Northern Cyprus (TRNC). Until a lasting and equitable solution is found within the context of the United Nations, Turkey shall preserve its position concerning the ”Cyprus issue”.Note by all the European Union Member States of the OECD and the European Union: The Republic of Cyprus is recognised by all members of the United Nations with the exception of Turkey. The information in this document relates to the area under the effective control of the Government of the Republic of Cyprus.Note: Values that are statistically significant are indicated in bold (see Annex A3).Source: OECD, PISA 2015 Database, Tables III.3.2, III.3.4 and III.3.8.12 http://dx.doi.org/10.1787/888933470414

Overview: StudentS’ well‑being
10 © OECD 2017 PISA 2015 RESULTS (VOLUME III): STUDENTS’ WELL-BEING – OVERVIEW
Teachers can play a particularly important role in creating the conditions for students’ well-being at school. Happier students tend to report positive relations with their teachers (Table III.3.11). PISA results show that students in “happy” schools (schools where students’ life satisfaction is above the average in the country) reported a higher level of support from their science teacher than students in “unhappy” schools (schools where students’ life satisfaction is below the average in the country). In other words, students’ perceptions of support from teachers seem to be a characteristic feature of schools where students reported greater well-being.
Schoolwork-related anxietyIn all education systems, as adolescents progress through schooling, they are required to manage increasing academic demands in relatively more formal classroom settings. The pressure to get higher marks and the concern about receiving poor grades are some of the sources of stress most often cited by school-age children and adolescents.
PISA 2015 asked students to report whether they agree, strongly agree, disagree or strongly disagree with the following statements: “I often worry that it will be difficult for me to take a test”; “I worry I will get poor grades at school”; “I feel very anxious even if I am well prepared for a test”; “I get very tense when I study for a test”; and “I get nervous when I do not know how to solve a task at school”. On average across OECD countries, 59% of students reported that they often worry that taking a test will be difficult, and 66% reported that they worry about poor grades. Some 55% of students reported feeling very anxious for a test even if they are well prepared; 37% reported they get very tense when studying; and 52% reported that they get nervous when they don’t know how to solve a task at school (Table III.4.1).
In all countries and economies that participated in PISA 2015, girls reported greater schoolwork-related anxiety than boys (Table III.4.5). On average across OECD countries, boys were about 13 percentage points less likely than girls to report they get very tense when they study (Figure III.4.1). About 64% of girls but 47% of boys reported feeling very anxious even when they are well prepared for a test (Table III.4.2). One possible explanation may be that girls are less self-confident than boys and, as a result, experience more worry and discomfort before and during evaluations.
PISA 2015 shows that anxiety about schoolwork, homework and tests is negatively related to performance in science, mathematics and reading. On average across OECD countries, 63% of low-achieving students in science (students in the bottom quarter of science performance in a country) and 46% of high-achieving students (students in the top quarter) reported that they feel anxious for a test no matter how well prepared they are (Figure III.4.2). The fear of making mistakes on a test often disrupts the performance of top-performing girls who “choke under pressure”. On average across OECD countries, 55% of girls but 38% of boys who are among the top 25% of students in their country in science performance reported that they feel very anxious for a test even if they are well prepared (Table III.4.4). But gender differences in anxiety are also observed among low-achieving students.
On average across OECD countries, students who reported the highest levels of anxiety also reported a level of life satisfaction that is 1.2 points lower (on a scale from 0 to 10) than students who reported the lowest levels of anxiety (Figure III.4.3).
Both parents and educators often argue that anxiety is the natural consequence of testing overload. In about five out of six school systems, students are assessed at least once a year with mandatory standardised tests; in about three out of four countries/economies, students are assessed at least once a year with non-mandatory standardised tests. However, the frequency of tests as reported by school principals seems unrelated to students’ level of schoolwork-related anxiety. Rather, it is students’ perception of the assessment as more or less threatening that determines how anxious students feel about tests.
PISA results show that teachers’ practices, behaviours and communication in the classroom are associated with students’ level of anxiety. After accounting for students’ performance and socio-economic status, students who reported that their science teachers adapt the lesson to the class’s needs and knowledge were less likely to report feeling anxious even if they are well prepared for a test, or to report that they get very tense when they study (Table III.4.11). Students were also less likely to report anxiety if the science teacher provides individual help when they are struggling. By contrast, negative teacher-student relations can undermine students’ confidence and lead to greater anxiety. On average across OECD countries, students are about 60% more likely to get very tense when they study, and about 29% more likely to feel anxious before a test if they perceive that their teacher thinks they are less smart than they really are (Table III.4.11).

Overview: StudentS’ well‑being
PISA 2015 RESULTS (VOLUME III): STUDENTS’ WELL-BEING – OVERVIEW © OECD 2017 11
Figure III.1.2 [Part 1/2] • Snapshot of students’ achievement motivation and schoolwork‑related anxiety
Countries/economies with values above the OECD averageCountries/economies with values not significantly different from the OECD averageCountries/economies with values below the OECD average
Index of schoolwork-related anxiety
Percentage of students who agreed/strongly agreed with the following statements Difference in life satisfaction between students in the top
and bottom quarter of the index of schoolwork-related anxiety
(top – bottom)
Even if I am well prepared for a test I feel very anxious
I get very tense when I study
Gender difference for ”Even if I am well prepared for a test I feel very anxious”
(B – G)
Mean index % % % dif. Dif.
OECD average 0.01 55.5 36.6 -16.7 -1.18
OEC
D Australia 0.19 67.5 46.9 -17.1 mAustria -0.10 50.8 19.3 -15.3 -1.52Belgium2 -0.16 42.5 28.5 -18.9 -0.75Canada 0.17 63.9 45.5 -19.9 mChile 0.10 56.0 40.2 -11.2 -1.08Czech Republic -0.21 40.3 32.4 -17.0 -1.20Denmark 0.09 64.5 45.5 -23.0 mEstonia -0.22 52.8 27.5 -15.7 -1.12Finland -0.41 48.6 17.8 -15.6 -1.37France -0.10 47.2 29.2 -16.6 -0.91Germany -0.33 41.6 22.4 -20.8 -1.63Greece -0.09 59.0 38.0 -17.6 -1.23Hungary -0.10 54.5 27.1 -17.3 -1.16Iceland -0.12 51.1 36.5 -24.1 -2.25Ireland 0.15 63.2 46.0 -13.8 -1.54Israel -0.27 44.5 33.2 -15.7 mItaly 0.45 70.2 56.4 -17.0 -1.04Japan 0.26 62.1 32.7 -9.9 -0.32Korea 0.10 55.3 41.9 -6.8 -1.56Latvia -0.14 43.2 27.1 -10.8 -0.68Luxembourg -0.16 47.9 28.1 -20.9 -1.34Mexico 0.26 60.1 49.7 -10.6 -0.56Netherlands -0.54 39.1 14.5 -13.1 -0.96New Zealand 0.27 72.0 50.7 -13.5 mNorway 0.07 60.9 45.7 -26.1 mPoland -0.11 45.1 26.0 -16.7 -1.25Portugal 0.48 69.0 46.2 -20.7 -0.56Slovak Republic -0.17 47.1 29.1 -15.4 -0.92Slovenia 0.06 61.9 35.8 -20.6 -1.44Spain 0.40 67.1 48.1 -14.5 -0.46Sweden 0.05 61.1 41.0 -23.3 mSwitzerland -0.44 33.5 20.6 -14.9 -1.32Turkey 0.31 58.8 56.0 -11.8 -1.36United Kingdom 0.25 71.9 52.5 -19.0 -2.09United States 0.19 67.7 43.3 -20.7 -1.47
Partners Albania m m m m m
Algeria m m m m mBrazil 0.60 80.8 56.0 -12.7 -0.08B-S-J-G (China) 0.23 61.8 54.9 -1.6 -0.79Bulgaria -0.09 55.0 46.2 -14.5 -0.90CABA (Argentina) m m m m mColombia 0.52 78.8 57.7 -7.9 -0.10Costa Rica 0.60 81.2 55.2 -6.6 -0.19Croatia 0.00 47.0 36.1 -22.2 -0.93Cyprus* -0.08 57.7 40.0 -12.8 -1.48Dominican Republic 0.41 80.0 53.5 -2.7 -0.22FYROM m m m m mGeorgia m m m m mHong Kong (China) 0.33 67.1 52.7 -7.4 -0.76Indonesia m m m m mJordan m m m m mKosovo m m m m mLebanon m m m m mLithuania -0.07 55.7 42.6 -19.5 -0.94Macao (China) 0.37 65.6 58.5 -7.2 -0.82Malta m m m m mMoldova m m m m mMontenegro 0.09 65.2 46.7 -19.3 -0.69Peru 0.14 71.5 43.2 -2.6 -0.32Qatar 0.22 65.2 49.4 -7.4 -1.21Romania m m m m mRussia -0.05 51.1 38.9 -17.3 -0.65Singapore 0.57 76.3 59.9 -6.4 mChinese Taipei 0.39 66.6 61.5 -8.7 -0.75Thailand 0.11 63.3 46.6 -7.3 -0.84Trinidad and Tobago m m m m mTunisia 0.10 59.7 57.2 -15.6 -1.05United Arab Emirates 0.20 61.8 44.5 -4.3 -1.05Uruguay 0.46 72.8 53.2 -6.6 -0.13Viet Nam m m m m m
*See note 3 under Figure III.1.11. ESCS refers to the PISA index of economic, social and cultural status.2. Data for life satisfaction do not include the Flemish community of Belgium.Note: Values that are statistically significant are indicated in bold (see Annex A3).Source: OECD, PISA 2015 Database, Tables III.4.1, III.4.2, III.4.9, III.5.1, III.5.2 and III.5.3.12 http://dx.doi.org/10.1787/888933470425

Overview: StudentS’ well‑being
12 © OECD 2017 PISA 2015 RESULTS (VOLUME III): STUDENTS’ WELL-BEING – OVERVIEW
Figure III.1.2 [Part 2/2] • Snapshot of students’ achievement motivation and schoolwork‑related anxiety
Countries/economies with values above the OECD averageCountries/economies with values not significantly different from the OECD averageCountries/economies with values below the OECD average
Index of achievement motivation
Percentage of students who agreed/strongly agreed with the following statements
I want to be able to select from among the best opportunities
available when I graduate
I want to be one of the best students
in my class
Gender difference for ”I want to be able to select from among
the best opportunities” (B – G)
Socio-economic disparity for ”I want to be able to select from among
the best opportunities” (top – bottom quarters
of ESCS1)
Mean index % % % dif. % dif.
OECD average -0.01 92.7 59.2 -1.9 5.6
OEC
D Australia 0.33 95.8 74.2 -1.8 4.4Austria -0.26 92.3 46.8 0.3 5.1Belgium2 -0.45 91.9 41.5 0.5 3.7Canada 0.33 95.5 73.1 -2.8 4.6Chile 0.29 95.9 72.0 -0.2 2.5Czech Republic -0.28 93.4 41.7 -1.8 5.9Denmark -0.15 83.2 69.2 -2.0 14.6Estonia -0.04 95.0 51.1 -2.7 3.8Finland -0.63 80.0 40.8 -1.8 14.9France -0.25 94.3 44.8 -2.0 5.5Germany -0.38 90.9 42.7 0.8 5.5Greece -0.10 95.5 63.4 -3.3 3.2Hungary -0.30 93.1 40.4 -0.8 5.5Iceland 0.39 86.6 75.5 -6.4 11.1Ireland 0.39 97.0 72.4 -0.6 3.0Israel 0.83 96.8 86.4 -3.2 1.1Italy -0.17 95.0 52.0 -1.0 2.5Japan -0.51 87.3 32.9 1.6 8.5Korea 0.34 96.1 81.9 -2.9 5.7Latvia -0.03 93.3 58.6 -3.2 2.0Luxembourg -0.17 92.5 53.8 -2.8 4.5Mexico 0.25 96.1 81.2 -1.4 3.9Netherlands -0.44 93.9 29.7 0.1 3.2New Zealand 0.24 94.5 70.0 -0.6 6.3Norway 0.10 95.5 64.3 -3.4 3.2Poland -0.42 86.1 46.4 -1.4 11.2Portugal 0.20 93.1 65.5 -3.0 8.2Slovak Republic -0.28 92.2 44.5 -2.8 8.5Slovenia -0.43 86.1 44.3 -5.8 12.0Spain -0.16 93.8 57.4 -1.0 6.0Sweden 0.15 92.2 63.7 -4.1 4.9Switzerland -0.43 90.6 40.0 -0.8 4.5Turkey 0.62 94.2 89.3 -3.0 3.1United Kingdom 0.51 97.8 75.6 -1.2 1.7United States 0.65 97.3 85.4 -1.7 1.4
Partners Albania m m m m m
Algeria m m m m mBrazil 0.12 96.7 63.9 -2.2 1.1B-S-J-G (China) 0.11 96.6 81.1 -0.6 -1.3Bulgaria -0.06 93.9 67.2 -5.3 6.2CABA (Argentina) m m m m mColombia 0.50 98.3 91.6 -0.3 0.9Costa Rica 0.51 97.9 85.5 -1.3 1.3Croatia -0.24 93.6 61.5 -3.6 5.2Cyprus* 0.16 95.4 72.8 -3.9 2.0Dominican Republic 0.34 93.2 90.4 -0.8 4.3FYROM m m m m mGeorgia m m m m mHong Kong (China) 0.20 93.5 75.4 -4.0 5.5Indonesia m m m m mJordan m m m m mKosovo m m m m mLebanon m m m m mLithuania 0.00 90.8 63.5 -5.6 5.7Macao (China) -0.50 91.1 48.6 -4.9 3.7Malta m m m m mMoldova m m m m mMontenegro -0.16 92.0 54.4 -4.8 2.5Peru 0.34 96.7 88.4 -0.2 1.5Qatar 0.77 94.7 89.4 -5.3 3.9Romania m m m m mRussia -0.09 94.6 55.8 -1.1 4.3Singapore 0.41 96.5 82.3 -1.5 1.5Chinese Taipei -0.01 97.2 68.1 -1.8 4.2Thailand 0.24 97.4 79.7 -2.7 1.1Trinidad and Tobago m m m m mTunisia 0.67 96.5 93.1 -3.2 2.1United Arab Emirates 0.78 95.6 91.5 -3.5 2.8Uruguay -0.05 95.0 49.9 -1.8 4.5Viet Nam m m m m m
*See note 3 under Figure III.1.11. ESCS refers to the PISA index of economic, social and cultural status.2. Data for life satisfaction do not include the Flemish community of Belgium.Note: Values that are statistically significant are indicated in bold (see Annex A3).Source: OECD, PISA 2015 Database, Tables III.4.1, III.4.2, III.4.9, III.5.1, III.5.2 and III.5.3.12 http://dx.doi.org/10.1787/888933470425

Overview: StudentS’ well‑being
PISA 2015 RESULTS (VOLUME III): STUDENTS’ WELL-BEING – OVERVIEW © OECD 2017 13
Parents can help children manage anxiety by encouraging them to trust in their ability to accomplish various academic tasks. PISA results show that, after accounting for differences in performance and socio-economic status, girls who perceive that their parents encourage them to be confident in their abilities were 21% less likely to report that they feel tense when they study, on average across OECD countries (Table III.4.13). This relationship is stronger among girls than among boys, possibly suggesting that parents have more difficulty communicating with and addressing the insecurities of their sons.
Students’ motivation to achievePISA 2015 provides indicators of how motivated students are to achieve – both in school and beyond. Girls were more likely than boys to report that they want top grades at school, and that they care about being able to select among the best opportunities when they graduate. Girls thus seem to care more than boys that their efforts at school are properly recognised, but they were less likely than boys to report that they are ambitious or competitive. On average across OECD countries, 68% of boys and 62% of girls reported that they want to be the best, whatever they do (Figure III.5.1 and Table III.5.2).
Socio-economic status is also related to students’ motivation to achieve and personal ambition. In almost all countries and economies, disadvantaged students have less motivation to achieve than advantaged students do (Table III.5.3). But even though they may come from a relatively disadvantaged background, many immigrant students hold an ambition to succeed that, in most cases, matches, and in some cases surpasses, the aspirations of students who are native to their host country. PISA 2015 shows that, on average across OECD countries, both first- and second-generation immigrant students have a greater motivation to achieve than students without an immigrant background (Table III.5.3).
Motivated students tend to do better at school. On average across OECD countries, students who are among the most motivated score 38 points higher in science (the equivalent of more than one year of schooling) than students who are among the least motivated (Figure III.5.3).
Achievement motivation is related to life satisfaction in a mutually reinforcing way. Students who are highly satisfied with their life tend to have greater resiliency and are more tenacious in the face of academic challenges. A positive view of the world and life circumstances builds their self-efficacy and their motivation to achieve. In turn, a greater motivation to achieve, paired with realised achievements, gives students a sense of purpose in life. It is thus not surprising that, across all countries and economies that participated in PISA 2015, students with greater overall motivation to achieve reported higher satisfaction with life (Table III.5.6).
But there can also be downsides to achievement motivation, particularly when this motivation is a response to external pressure. PISA results show that countries where students are highly motivated to achieve also tend to be the countries where many students feel anxious about a test, even if they are well prepared for it. Students who want to be able to select among the best opportunities when they graduate, who want to be the best in their class, or who want top grades in all courses are more likely to suffer from anxiety (Figure III.5.6 and Table III.5.8). If a certain amount of tension or concern is essential to motivation and high performance, too much pressure can be counterproductive for a child’s cognitive development and psychological well-being. Both teachers and parents have to find ways to encourage students’ motivation to learn and achieve without generating an excessive fear of failure.
Expectation of further educationStudents’ expectations for their future influence what they choose to study and the activities they pursue. The factors that shape students’ expectations include the influence of people close to the student, past academic achievement, the relative flexibility of school systems, and the degree of selectivity of tertiary institutions.
PISA 2015 asked students to report what level of education they expect to complete. Across OECD countries, 44% of students reported that they expect to complete university (ISCED 5a and 6). In Colombia, Korea, Qatar and the United States, more than three out four students reported that they expect to earn a university degree (Figure III.6.1).
In most countries and economies, girls were more likely than boys to report that they expect to complete university; and in all countries and economies, disadvantaged students were much less likely than advantaged students to report so (Table III.6.2). In addition, PISA results show that students’ satisfaction with their life is strongly related to their expectation to complete university education (Figure III.6.2). On average across OECD countries, students who expect to complete university education were 30% more likely than students without such expectations to report high satisfaction with their life (9 or 10 on a scale from 0 to 10).

Overview: StudentS’ well‑being
14 © OECD 2017 PISA 2015 RESULTS (VOLUME III): STUDENTS’ WELL-BEING – OVERVIEW
In most countries, top performers were more likely than low performers to report that they expect to earn a university degree. On average across OECD countries, almost 70% of top-performing students and 20% of low-performing students reported that they expect to complete tertiary education. But large proportions of students hold expectations of further education that do not seem aligned with their performance in school. For example, in Colombia, Costa Rica, the Dominican Republic, Peru, Qatar, Thailand, Turkey, the United Arab Emirates and the United States, more than one in two all-round low performers (students who score below proficiency Level 2 in the PISA reading, mathematics and science tests) expect to complete a university degree (Figure III.6.3 and Table III.6.7). In these countries, the returns in earnings from tertiary education tend to be relatively high. For example, in Colombia in 2014, tertiary-educated workers earned 2.3 times the salary of adult workers with only upper secondary or post-secondary non-tertiary education, on average.
StudentS’ SOCiAl liFe At SCHOOlHuman beings in general, and teenagers in particular, desire strong social ties and value acceptance, care and support from others. Adolescents who feel that they are part of a school community are more likely to perform better academically and be more motivated in school; they are also less likely to engage in risky and antisocial behaviour. PISA 2015 asked students to report whether they feel like an outsider or left out of things at school, whether they make friends easily, they feel that they belong at school, they feel awkward and out of place at school, they feel that other students like them, or they feel lonely. As school is the primary environment for social interactions among 15-year-olds, these subjective evaluations indicate whether education systems are able to foster students’ well-being.
On average across OECD countries in 2015, 73% of students reported that they feel that they belong at school; but that also means that a quarter of students do not share that feeling. Some 78% of students agreed or strongly agreed that they can make friends easily at school; 85% of students disagreed or strongly disagreed that they feel lonely at school; and 83% of students disagreed or strongly disagreed that they feel like an outsider or feel left out of things. Some 82% of students reported that they feel that other students like them, and 81% disagreed or strongly disagreed that they feel awkward and out of place at school. The percentage who report feeling like an outsider at school increased on average and in many countries between 2003 and 2015 (Table III.7.4).
Growing populations of immigrant students pose new challenges to maintaining cohesion at school, as students need to learn how to interact with peers from different cultural backgrounds. In 2015, 12.5% of students in PISA-participating countries and economies had an immigrant background. On average, and in 24 countries and economies, students without an immigrant background reported a stronger sense of belonging than immigrant students, even after accounting for socio-economic status. The opposite pattern is observed in Australia, Qatar and the United Arab Emirates, where both first- and second-generation immigrant students reported a greater sense of belonging at school than non-immigrant students (Figure III.7.2 and Table III.7.6).
Students across OECD countries who reported that they feel like an outsider at school score 22 points lower in science, on average, than those who did not report so. Even after accounting for students’ socio-economic status, this gap remains significant in the large majority of countries (Figure III.7.4).
PISA results also show a strong relationship between the likelihood of reporting low satisfaction with life (a level of 4 or lower on a life-satisfaction scale that ranges from 0 to 10) and feeling like an outsider at school. Students in OECD countries who feel like they are outsiders at school were three times more likely to report that they are not satisfied with their life than those who do not feel like they are outsiders (Figure III.7.5). In Finland, Ireland, Korea, the Netherlands, the United Kingdom and the United States, the likelihood of reporting low satisfaction with life is more than four times higher if the student reported feeling like an outsider. The relationship between belonging at school and life satisfaction remains significant after accounting for students’ socio-economic status.
PISA 2015 results show that, on average across OECD countries, students who reported that their science teacher is willing to provide help and is interested in their learning are about 1.8 times more likely to feel that they belong at school than those students who did not report so (Figure III.7.8). Conversely, students who reported that they are treated unfairly by their teacher are much more likely to feel like an outsider at school (Figure III.7.9). Students who reported some unfair treatment by their teachers were 1.7 times more likely to report feeling isolated at school than those who did not report so, on average across OECD countries.
BullyingFor some students, school is a place of torment. Bullying – a systematic abuse of power – can be inflicted directly, through physical (hitting, punching or kicking) and verbal (name-calling or mocking) abuse. Relational bullying refers to the

Overview: StudentS’ well‑being
PISA 2015 RESULTS (VOLUME III): STUDENTS’ WELL-BEING – OVERVIEW © OECD 2017 15
phenomenon of social exclusion, where some children are ignored, excluded from games or parties, rejected by peers, or are the victims of gossip and other forms of public humiliation and shaming. As teenagers use electronic communications more and more, cyberbullying has become a new form of aggression expressed via online tools, particularly mobile phones. Bullying tends to occur frequently during times of transition in children’s and adolescents’ lives, when they are figuring out where they fit in among new peer groups.
PISA 2015 measured the incidence of bullying using reports from the victim’s perspective. Results show that, in many countries, verbal and psychological bullying occur frequently. On average across OECD countries, around 11% of students reported that they are frequently (at least a few times per month) made fun of, 7% reported that they are frequently left out of things, and 8% reported that they are frequently the object of nasty rumours in school. More than 10% of students in 34 out of 53 countries and economies reported that their peers make fun of them at least a few times per month. A similar proportion of students in 13 of 53 countries and economies reported that others frequently leave them out of things, while in 16 out of 53 countries and economies, more than 10% of students reported that they are frequently the object of nasty rumours (Figure III.8.2 and Table III.8.1).
Physical bullying is probably the most obvious kind of violence in schools, and educators tend to perceive physical bullying as more serious than verbal and relational bullying. On average across OECD countries, around 4% of students reported that they are hit or pushed at least a few times per month, although this percentage varies from 1% to 9.5% across countries. Another 7.7 % of students reported they are physically bullied a few times per year, similar proportions of students reported that they are threatened by others. Around 4% of students reported that their belongings have been destroyed or taken away by other students, and another 11% of students experienced this type of bullying a few times per year (Table III.8.1).
On average across OECD countries, boys were more likely than girls to report being victims of all forms of bullying except being left out of things on purpose and being the object of nasty rumours (Figure III.8.3). Across OECD countries, 9.2% of girls, on average, reported that they have been victims of nasty rumours at least a few times per month, while 7.6% of boys reported so. Results also show that the risk of being bullied increases substantially for immigrant students who arrived in the host country at an older age (13-16 years old).
Across OECD countries, low performers were more likely to report exposure to physical, verbal and relational bullying (Figure III.8.5). Frequent exposure to bullying among low performers might be related to the concentration of these students in schools that lack the resources to address disciplinary problems. Results show that, across OECD countries, schools where the incidence of bullying is high by international standards (more than 10% of students are frequently bullied) score 47 points lower in science, on average, than schools where bullying is less frequent (schools where less than 5% of students are frequently bullied). This difference in performance between the two types of schools remains substantial (around 25 score points) even after accounting for differences in schools’ socio-economic profile (Figure III.8.6).
Students who are frequently bullied may feel constantly insecure and on guard, and have clear difficulties finding their place at school. They tend to feel unaccepted and isolated and, as a result, are often withdrawn. On average across OECD countries, 42% of students who reported that they are frequently bullied – but only 15% of students who reported that they are not frequently bullied – reported feeling like an outsider at school (Figure III.8.8).
PISA result shows that 26% of frequently bullied students reported relatively low satisfaction with life (a value of 4 or lower on a life-satisfaction scale ranging from 0 to 10). Only 10% of students who are not frequently bullied reported such low satisfaction with their lives. And victims of bullying often decide to stay out of school. On average across OECD countries, 9% of frequently bullied students (compared with less than half of that percentage among students who are not frequently bullied) reported that they had skipped school more than three or four times in the two weeks prior to the PISA test (Figure III.8.8).
According to PISA results, the proportion of students who reported being victims of bullying is larger in schools with high percentages of students who had repeated a grade, where students reported a poor disciplinary climate in class, and where students reported that their teachers treat them unfairly (Figure III.8.9). Victimisation is less frequently reported by students who said that their parents support them when they face difficulties at school (Figure III.8.11). But parents of bullies are not always aware that their child is bullying others, and some victims of humiliating treatment are often reluctant to talk about the problem with their parents. On average across 15 countries and economies with available data, only 44% of the parents of frequently bullied students reported that they had exchanged ideas on parenting, family support, or the child’s development with teachers over the previous academic year (the parents of around 39% of students who are not frequently bullied had engaged in such discussions; Table III.8.19).

Overview: StudentS’ well‑being
16 © OECD 2017 PISA 2015 RESULTS (VOLUME III): STUDENTS’ WELL-BEING – OVERVIEW
Figure III.1.3 [Part 1/2] • Snapshot of sense of belonging at school and bullying
Countries/economies with values above the OECD averageCountries/economies with values not significantly different from the OECD averageCountries/economies with values below the OECD average
Index of sense of belonging
Percentage of students who agreed/
strongly agreed with the following statement
Percentage of students who disagreed/
strongly disagreed with the following statement
Socio-economic disparity for the index of sense of belonging (top – bottom
quarters of ESCS1)
Difference between non-immigrant and first-
generation immigrant students in the percentage of students who agreed/strongly agreed with the
following statement: “I feel like I belong at school”
Change between PISA 2015 and 2003 in the percentage of
students who disagreed/strongly disagreed with the following statement: “I feel like an outsider”
I feel like I belong at school
I feel like an outsider (or left out of things)
at school
Mean index % % Dif. % dif. % dif.
OECD average 0.02 73.0 82.8 0.21 4.6 -9.9
OEC
D Australia -0.12 71.9 76.5 0.29 -8.3 -15.9Austria 0.44 76.0 86.1 0.22 9.7 -7.9Belgium 0.01 62.0 87.1 0.15 10.1 -5.2Canada -0.11 71.6 77.5 0.25 -5.4 -13.9Chile -0.04 77.3 79.9 0.28 3.5 mCzech Republic -0.25 70.9 79.8 0.23 6.2 -10.0Denmark 0.14 70.3 87.6 0.24 10.5 -7.2Estonia -0.06 78.0 87.2 0.22 c mFinland 0.09 80.3 87.7 0.23 1.7 -6.9France -0.06 40.9 76.8 0.27 2.7 -15.2Germany 0.29 74.9 85.5 0.18 8.1 -8.4Greece 0.10 83.0 84.4 0.16 6.5 -9.2Hungary 0.06 74.5 82.1 0.30 -4.6 -8.6Iceland 0.19 78.5 82.9 0.19 12.7 -7.2Ireland -0.02 73.3 83.3 0.15 5.3 -11.0Israel m m m m m mItaly 0.05 67.3 88.9 0.09 4.6 -6.4Japan -0.03 81.9 88.1 0.18 c -6.2Korea 0.16 79.5 91.3 0.33 c -0.2Latvia -0.20 78.6 84.2 0.16 c -10.7Luxembourg 0.14 66.0 83.2 0.42 16.4 -9.0Mexico -0.14 76.1 75.2 0.21 10.0 -15.4Netherlands 0.17 80.9 91.0 0.06 1.1 -5.0New Zealand -0.17 73.7 77.7 0.25 -4.1 -14.5Norway 0.21 75.7 87.9 0.29 2.4 -6.6Poland -0.25 62.4 78.5 0.07 c -13.3Portugal 0.10 82.3 87.1 0.27 10.4 -7.0Slovak Republic -0.28 69.7 77.3 0.26 c -14.6Slovenia -0.10 74.5 82.4 0.09 0.7 mSpain 0.47 87.2 89.9 0.17 8.0 -6.4Sweden 0.04 69.3 79.4 0.23 6.6 -15.3Switzerland 0.36 70.8 88.3 0.10 11.5 -4.4Turkey -0.44 61.4 64.3 0.17 c -21.9United Kingdom -0.09 67.8 79.9 0.22 -1.0 -13.1United States -0.09 74.2 76.2 0.30 -0.4 m
Partners Albania 0.40 93.1 94.5 0.17 c m
Algeria -0.21 87.4 72.3 0.12 m mBrazil -0.15 76.1 79.2 0.26 c -14.2B-S-J-G (China) -0.33 64.6 78.0 0.31 c mBulgaria -0.34 68.0 70.3 0.24 c mCABA (Argentina) 0.38 88.7 87.5 0.41 0.0 mColombia -0.31 74.3 71.1 0.14 c mCosta Rica -0.16 74.7 73.2 0.18 0.7 mCroatia 0.05 81.2 86.0 0.14 2.6 mCyprus* 0.10 80.2 82.9 0.08 10.0 mDominican Republic -0.40 66.9 60.4 0.32 c mFYROM 0.35 92.1 87.9 0.36 c mGeorgia 0.20 64.8 95.1 0.28 c mHong Kong (China) -0.35 71.1 75.3 0.21 -0.2 -7.0Indonesia 0.10 92.3 96.3 0.06 c 0.2Jordan 0.19 85.9 76.8 0.30 10.2 mKosovo 0.29 92.5 86.8 0.18 -2.5 mLebanon 0.02 74.9 74.9 0.26 -15.6 mLithuania -0.27 54.5 69.3 0.29 c mMacao (China) -0.40 59.9 79.3 0.02 2.6 -5.1Malta -0.02 69.8 79.6 0.12 19.1 mMoldova 0.04 67.7 91.1 0.17 c mMontenegro -0.10 53.8 82.8 0.04 3.6 mPeru -0.22 71.4 79.4 0.34 c mQatar -0.10 70.7 75.6 0.19 -7.5 mRomania 0.00 52.5 87.8 0.13 c mRussia -0.37 74.6 80.4 0.17 4.8 -13.3Singapore -0.21 76.0 76.5 0.20 -1.2 mChinese Taipei 0.02 89.9 88.7 0.22 c mThailand -0.35 78.4 79.7 0.14 c -13.9Trinidad and Tobago 0.05 79.7 81.9 0.28 3.8 mTunisia -0.20 57.6 80.1 0.10 c -10.3United Arab Emirates -0.10 73.9 78.7 0.21 -1.9 mUruguay -0.09 77.9 76.2 0.37 c -16.5Viet Nam -0.06 80.8 95.3 0.12 c m
*See note 3 under Figure III.1.11. ESCS refers to the PISA index of economic, social and cultural status.2. Schools with a high prevalence of bullying are those where more than 10% of students are frequently bullied. Schools with a low prevalence of bullying are those where 5% of students or less are frequently bullied. A student is frequently bullied if he or she is in the top 10% of the index of exposure to bullying among all countries/economies.Note: Values that are statistically significant are indicated in bold (see Annex A3).Source: OECD, PISA 2015 Database, Tables III.7.1, III.7.3, III.7.4, III.7.6, III.8.1, III.8.6 and III.8.10.12 http://dx.doi.org/10.1787/888933470435

Overview: StudentS’ well‑being
PISA 2015 RESULTS (VOLUME III): STUDENTS’ WELL-BEING – OVERVIEW © OECD 2017 17
Figure III.1.3 [Part 2/2] • Snapshot of sense of belonging at school and bullying
Countries/economies with values above the OECD averageCountries/economies with values not significantly different from the OECD averageCountries/economies with values below the OECD average
Index of exposure to bullying
Percentage of students who reported being bullied at least a few times a month
Socio-economic disparity in the index of exposure
to bullying, by school socio-economic profile
(top-bottom quarter of school ESCS1)
Difference in science performance between
schools with high incidence and low
incidence of bullying2Any type
of bullying actOther students made fun of me
I got hit or pushed around by other students
Mean % % % Dif. Score dif.
OECD average 0.00 18.7 10.9 4.3 -0.10 -47
OEC
D Australia 0.45 24.2 15.1 5.7 -0.35 -46Austria 0.10 19.1 11.9 4.2 0.02 -51Belgium 0.18 18.5 11.1 3.1 -0.16 -82Canada 0.39 20.3 13.4 5.0 -0.16 -33Chile 0.15 18.0 9.6 3.2 -0.06 -48Czech Republic 0.15 25.4 11.1 7.5 -0.11 -48Denmark 0.22 20.1 11.2 3.5 -0.05 -28Estonia 0.24 20.2 13.7 4.7 -0.07 -29Finland 0.23 16.9 10.5 4.6 -0.09 -22France -0.08 17.9 11.7 3.1 -0.27 -113Germany 0.17 15.7 9.2 2.3 -0.09 -61Greece -0.55 16.7 10.0 4.3 -0.15 -83Hungary -0.06 20.3 9.6 3.9 -0.17 -75Iceland -0.43 11.9 6.7 2.4 -0.21 -17Ireland 0.1 14.7 8.5 3.1 0.03 -4Israel m m m m m mItaly m m m m m mJapan -0.21 21.9 17.0 8.9 0.17 -47Korea -1.44 11.9 10.2 0.9 0.12 mLatvia 0.65 30.6 15.0 8.4 -0.14 -20Luxembourg -0.15 15.7 8.6 3.5 -0.10 -91Mexico 0.13 20.2 13.0 5.3 -0.14 -34Netherlands -0.33 9.3 4.3 1.8 -0.08 -88New Zealand 0.61 26.1 17.4 6.7 -0.25 -32Norway -0.01 17.7 9.4 4.6 -0.06 -15Poland 0.27 21.1 11.7 4.1 -0.03 -17Portugal -0.52 11.8 6.7 2.3 -0.11 -64Slovak Republic 0.1 22.5 10.4 4.9 -0.28 -65Slovenia 0.01 16.4 8.8 4.1 -0.14 -63Spain -0.09 14.0 8.0 2.9 -0.01 -21Sweden -0.11 17.9 9.4 5.4 -0.18 -36Switzerland 0.24 16.8 10.7 2.8 -0.11 -44Turkey -0.97 18.6 9.2 4.5 -0.09 -67United Kingdom 0.4 23.9 15.1 5.4 -0.04 -38United States 0.16 18.9 11.4 3.8 0.05 -10
Partners Albania m m m m m m
Algeria m m m m m mBrazil -0.23 17.5 9.3 3.2 0.00 -26B-S-J-G (China) 0.1 22.5 12.3 4.2 -0.30 -92Bulgaria 0.14 24.7 12.4 9.1 -0.17 -81CABA (Argentina) m m m m m mColombia 0.16 22.1 11.5 4.0 -0.06 -29Costa Rica 0.1 20.8 11.8 2.7 0.03 -2Croatia -0.12 17.1 8.0 3.9 -0.19 -53Cyprus* m 18.1 11.2 6.5 m mDominican Republic -0.29 30.1 15.3 4.8 -0.02 -13FYROM m m m m m mGeorgia m m m m m mHong Kong (China) 0.21 32.3 26.1 9.5 -0.06 -42Indonesia m m m m m mJordan m m m m m mKosovo m m m m m mLebanon m m m m m mLithuania -0.10 16.4 9.2 4.4 -0.28 -55Macao (China) 0.49 27.3 19.9 4.2 0.24 mMalta m m m m m mMoldova m m m m m mMontenegro -0.91 16.4 6.8 3.5 0.00 -58Peru -0.23 18.4 7.7 3.6 -0.18 -37Qatar 0.36 25.0 14.6 8.8 -0.33 -61Romania m m m m m mRussia -0.01 27.5 11.8 3.1 0.17 -18Singapore 0.51 25.1 18.3 5.1 -0.35 -96Chinese Taipei -0.57 10.7 6.8 0.8 0.06 -42Thailand 0.11 27.2 19.9 7.1 -0.36 -56Trinidad and Tobago m m m m m mTunisia 0.32 28.2 13.1 8.6 -0.14 -39United Arab Emirates 0.30 27.0 15.9 8.0 -0.20 -59Uruguay -0.05 16.9 10.3 4.0 0.03 -28Viet Nam m m m m m m
*See note 3 under Figure III.1.11. ESCS refers to the PISA index of economic, social and cultural status.2. Schools with a high prevalence of bullying are those where more than 10% of students are frequently bullied. Schools with a low prevalence of bullying are those where 5% of students or less are frequently bullied. A student is frequently bullied if he or she is in the top 10% of the index of exposure to bullying among all countries/economies.Note: Values that are statistically significant are indicated in bold (see Annex A3).Source: OECD, PISA 2015 Database, Tables III.7.1, III.7.3, III.7.4, III.7.6, III.8.1, III.8.6 and III.8.10.12 http://dx.doi.org/10.1787/888933470435

Overview: StudentS’ well‑being
18 © OECD 2017 PISA 2015 RESULTS (VOLUME III): STUDENTS’ WELL-BEING – OVERVIEW
PArentS And tHe HOMe envirOnMentFamilies are the first social unit in which children learn and develop. It is not surprising, then, that interactions with parents have consistently been shown to influence students’ achievement, expectations, attitudes and psychological health. In spite of the difficulties parents encounter in balancing their professional and private lives and their struggle to find “quality time” to spend with their child and to get involved in their child’s education, PISA data paint a positive picture of how parents and children spend time together. Across the 18 countries and economies that distributed the parent questionnaire, an average of 82% of parents reported that they eat the main meal with their child around a table, 70% reported that they spend time just talking to their child, and 52% reported that they discuss how well their child is doing at school every day or almost every day. In Belgium (Flemish community), France, Italy, Portugal and Spain, more than 90% of parents eat a meal with their child daily or nearly every day (Figure III.9.1).
Among school-based activities, the activity most frequently reported by parents is attending a scheduled meeting or conferences for parents in their child’s school. Some 77% of parents, on average, reported having done so during the previous academic year. Slightly more than half of the parents reported that they had “discussed my child’s behaviour with a teacher on my own initiative”, “discussed my child’s progress with a teacher on my own initiative” or “talked about how to support learning at home and homework with my child’s teachers” (Figure III.9.1).
Parents’ activities that typically take place at home or in the context of the family, namely “asking how my child is performing in science class”, “discussing how well my child is doing at school”, “eating the main meal with my child around a table” and “spending time just talking to my child” are all positively related to their child’s science performance in PISA 2015. An activity as simple as eating a meal together at least once a week is associated with an increase of at least 12 score points in science, on average, after accounting for students’ socio-economic status (Figure III.9.2).
Conversely, most activities that reflect parents’ direct involvement in their child’s education have a negative relationship with the student’s performance. Students whose parents reported that they “help my child with his/her science homework” or “obtain science-related materials (e.g. applications, software, study guides, etc.) for my child” at least once a week, score at least 23 points lower in science, on average, than students whose parents engage in these activities less frequently. In these cases, parents might be more directly involved in their child’s school work because their child is performing poorly in science (Figure III.9.2).
PISA data show that certain types of parental activities are positively related not only to students’ performance, but also to students’ satisfaction with their life. Students whose parents reported “spending time just talking to my child”, “eating the main meal with my child around a table” or “discussing how well my child is doing at school” every week were between 22% and 62% more likely to report high levels of life satisfaction (i.e. their responses put them at the equivalent of 9 or 10 on a scale of 0 to 10) than students whose parents reported engaging in these activities less frequently (Figure III.9.4). While countries vary in which parental activities are most strongly related to students’ life satisfaction, “spending time just talking” is the parental activity most frequently and most strongly associated with students’ life satisfaction. In most countries, students were more likely to report being very satisfied with their lives when their parents reported engaging in at least one of these home-based activities on a regular basis.
Parents’ interest in their child’s school lifeIn addition, students’ perceptions of how interested their parents are in them and in their school life can affect their own attitudes towards education. Students who reported that their parents are interested in their school activities perform better in PISA than students who reported a lack of interest from their parents. This is true at all levels of performance in science, although this association is stronger among low-performing students (Figure III.9.6). In fact, students who “agree” or “strongly agree” that their parents are interested in their school activities are also more motivated to do well in school. Across OECD countries, these students were 2.5 times more likely to report that they “want top grades in school”, on average (Figure III.9.7). Likewise, students who hold these perceptions of their parents’ interest were almost twice as likely to report being highly satisfied with their life (reporting 9 or 10 on a scale of 0-10 of life satisfaction) than students who do not hold those perceptions.
A growing understanding that parents and teachers can be effective partners in helping children succeed in school has led policy makers and school leaders in many countries to take deliberate actions to increase parents’ participation in school life. Parents’ involvement not only provides additional support to their child’s learning, but it also brings greater accountability to education systems. But even interested parents are sometimes prevented from being as engaged as they might wish to be.

Overview: StudentS’ well‑being
PISA 2015 RESULTS (VOLUME III): STUDENTS’ WELL-BEING – OVERVIEW © OECD 2017 19
Figure III.1.4 [Part 1/2] • Snapshot of parental support and education expectations
Countries/economies with values above the OECD averageCountries/economies with values not significantly different from the OECD averageCountries/economies with values below the OECD average
Percentage of students who reported talking
to their parents after school
Gender difference in the percentage of students
who reported talking to their parents after school
(B – G):
Percentage of students who agreed/strongly agreed
with the following statement: ”My parents are interested
in my school activities”
Socio-economic disparity for ”My parents are interested
in my school activities” (top – bottom quarter of ESCS1)
% % dif. % % dif.
OECD average 86.1 -2.1 93.5 5.3
OEC
D Australia 90.1 -0.5 94.1 6.9Austria 84.1 -3.4 95.8 2.8Belgium3 85.4 -1.3 93.9 4.8Canada 88.2 -1.1 92.5 7.9Chile 81.2 -1.9 91.1 4.2Czech Republic 85.6 -1.6 91.0 7.0Denmark 87.2 -0.1 94.5 4.6Estonia 87.9 -2.7 91.7 5.2Finland 82.8 -2.1 96.4 3.7France 80.8 -1.6 95.3 6.0Germany 86.9 -2.8 95.6 4.3Greece 88.5 -1.2 94.6 4.6Hungary 89.4 -1.1 96.0 3.4Iceland 90.2 -1.5 93.5 7.2Ireland 92.1 -1.0 96.5 2.4Israel 88.0 -6.6 m mItaly 89.3 -2.0 96.1 2.1Japan 90.2 -4.7 85.9 10.0Korea 79.4 -3.8 96.5 4.0Latvia 89.4 -1.7 92.5 1.6Luxembourg 82.4 -4.3 95.3 4.4Mexico 79.7 -1.8 91.1 4.7Netherlands 89.0 -1.2 97.2 2.7New Zealand 88.8 0.1 92.3 9.1Norway 87.6 -0.6 93.3 7.3Poland 83.4 -2.4 94.5 3.6Portugal 92.0 -0.7 97.6 2.6Slovak Republic 81.8 -4.4 91.8 7.6Slovenia 79.8 -4.9 95.3 3.1Spain 84.0 -3.0 95.2 4.4Sweden 87.4 -1.8 92.6 7.7Switzerland 82.7 -2.7 96.5 1.7Turkey 80.0 -3.4 77.8 13.9United Kingdom 88.7 1.0 93.7 6.8United States 88.2 -1.6 91.7 9.6
Partners Albania m m m m
Algeria m m m mBrazil 85.2 -1.1 93.4 4.0B-S-J-G (China) 72.1 -2.7 93.1 5.2Bulgaria 84.1 -4.1 83.8 4.0CABA (Argentina) m m m mColombia 82.5 -0.5 93.0 2.9Costa Rica 83.5 -1.0 95.4 2.5Croatia 85.8 -3.5 95.6 1.6Cyprus* 86.1 -6.6 94.7 1.5Dominican Republic 86.6 1.5 88.3 7.1FYROM m m m mGeorgia m m m mHong Kong (China) 76.8 -2.6 70.2 21.7Indonesia m m m mJordan m m m mKosovo m m m mLebanon m m m mLithuania 89.7 -3.4 93.8 3.6Macao (China) 72.5 -2.1 72.0 17.6Malta m m m mMoldova m m m mMontenegro 79.8 -3.4 91.8 4.8Peru 81.7 -0.7 92.9 0.9Qatar 88.6 -2.8 86.5 8.6Romania m m 0.0 mRussia 92.6 -0.8 94.6 4.2Singapore 77.2 -1.1 85.9 18.6Chinese Taipei 56.3 -5.5 84.2 13.9Thailand 92.6 -3.6 94.5 0.3Trinidad and Tobago m m m mTunisia 90.6 -1.4 86.5 7.5United Arab Emirates 90.5 -2.3 85.6 8.1Uruguay 81.2 -0.7 94.9 4.8Viet Nam m m m m
*See note 3 under Figure III.1.11. ESCS refers to the PISA index of economic, social and cultural status.2. Blue-collar occupations include skilled agricultural, forestry and fishery workers (ISCO-08 category 6), craft and related trades workers (ISCO-08 category 7), plant and machine operators and assemblers (ISCO-08 category 8) and elementary occupations (ISCO-08 category 9).White-collar occupations include managers (ISCO-08 category 1), professionals (ISCO-08 category 2) and technicians and associate professionals (ISCO-08 category 3)3. Data for life satisfaction do not include the Flemish community of Belgium.Note: Values that are statistically significant are indicated in bold (see Annex A3).Source: OECD, PISA 2015 Database, III.9.16, III.9.17, III.9.18, III.9.19, III.10.9 and III.10.15.12 http://dx.doi.org/10.1787/888933470449

Overview: StudentS’ well‑being
20 © OECD 2017 PISA 2015 RESULTS (VOLUME III): STUDENTS’ WELL-BEING – OVERVIEW
Figure III.1.4 [Part 2/2] • Snapshot of parental support and education expectations
Countries/economies with values above the OECD averageCountries/economies with values not significantly different from the OECD averageCountries/economies with values below the OECD average
Percentage of students who agreed/strongly agreed
with the following statement: ”My parents support me when I am
facing difficulties at school”
Socio-economic disparity for ”My parents support
me when I am facing difficulties at school” (top – bottom quarter
of ESCS1)
Difference in life satisfaction between
students in the top and bottom quarter of the index
of wealth (top – bottom)
Percentage of students who expect to complete
a university degree
Difference in the percentage of children of white-collar workers
and children of blue-collar workers2 who expect
to complete a university degree
(white – blue)
% % dif. Dif. % % dif.
OECD average 90.6 5.8 0.66 44.2 25.5
OEC
D Australia 91.2 6.3 m 54.2 25.7Austria 91.6 8.1 0.75 27.1 25.8Belgium3 91.6 5.0 0.71 32.9 22.8Canada 90.1 7.5 m 63.5 27.4Chile 88.8 5.5 0.72 66.6 27.2Czech Republic 88.6 4.3 0.71 55.6 36.3Denmark 94.3 4.3 m 37.2 20.4Estonia 86.9 6.2 1.08 42.8 32.8Finland 90.9 8.8 0.39 27.1 24.1France 89.9 5.9 0.76 32.0 27.8Germany 91.3 9.9 0.51 17.8 17.2Greece 90.2 5.2 0.79 66.3 32.0Hungary 93.1 2.7 0.92 35.5 39.5Iceland 93.0 7.0 0.84 38.9 18.8Ireland 94.1 2.4 0.60 46.3 24.2Israel m m m 57.0 27.7Italy 89.3 5.7 0.74 38.3 27.0Japan 87.1 3.1 0.31 58.7 28.5Korea 92.9 4.4 0.70 75.3 19.8Latvia 86.2 6.3 0.78 24.7 22.5Luxembourg 88.5 11.9 0.54 41.4 34.6Mexico 87.6 4.4 0.22 58.4 21.2Netherlands 96.6 2.1 0.40 17.4 16.4New Zealand 88.8 9.6 m 45.2 21.5Norway 93.0 5.7 m 24.1 11.3Poland 88.4 6.1 0.83 48.0 35.0Portugal 94.6 5.5 0.65 39.9 32.8Slovak Republic 88.1 6.9 0.67 m mSlovenia 90.1 1.6 0.41 25.8 23.8Spain 90.5 5.2 0.72 51.0 33.7Sweden 92.2 6.0 m 38.7 25.5Switzerland 91.8 5.3 0.24 27.0 23.6Turkey 86.6 5.4 0.73 70.6 15.4United Kingdom 91.5 5.8 0.83 41.8 22.5United States 91.1 5.3 0.89 76.0 20.7
Partners Albania m m m m m
Algeria m m m m mBrazil 88.0 2.3 0.16 46.2 22.3B-S-J-G (China) 91.7 3.3 0.66 37.7 32.6Bulgaria 93.7 5.3 0.99 39.4 28.4CABA (Argentina) m m m m mColombia 87.6 1.0 -0.20 76.3 16.7Costa Rica 94.7 2.0 0.24 54.4 7.4Croatia 95.0 0.8 0.71 36.1 31.0Cyprus* 90.4 4.1 0.72 77.8 27.0Dominican Republic 75.3 9.8 0.16 63.5 6.9FYROM m m m m mGeorgia m m m m mHong Kong (China) 88.5 8.3 0.65 54.9 21.6Indonesia m m m m mJordan m m m m mKosovo m m m m mLebanon m m m m mLithuania 88.0 8.0 1.03 53.6 39.4Macao (China) 83.2 10.6 0.84 46.7 12.0Malta m m m m mMoldova m m m m mMontenegro 91.8 3.6 0.74 65.4 25.9Peru 85.1 3.1 -0.06 64.3 23.3Qatar 89.4 8.0 1.07 76.5 10.1Romania 0.0 m m m mRussia 90.5 1.8 0.69 16.9 13.1Singapore 86.6 9.8 m 62.8 36.3Chinese Taipei 92.1 4.8 0.68 47.1 28.9Thailand 95.7 2.1 0.06 68.9 20.9Trinidad and Tobago m m m m mTunisia 85.5 9.2 1.29 51.5 20.3United Arab Emirates 91.4 7.3 1.10 72.0 12.4Uruguay 89.8 6.6 0.82 42.6 29.5Viet Nam m m m m m
*See note 3 under Figure III.1.11. ESCS refers to the PISA index of economic, social and cultural status.2. Blue-collar occupations include skilled agricultural, forestry and fishery workers (ISCO-08 category 6), craft and related trades workers (ISCO-08 category 7), plant and machine operators and assemblers (ISCO-08 category 8) and elementary occupations (ISCO-08 category 9).White-collar occupations include managers (ISCO-08 category 1), professionals (ISCO-08 category 2) and technicians and associate professionals (ISCO-08 category 3)3. Data for life satisfaction do not include the Flemish community of Belgium.Note: Values that are statistically significant are indicated in bold (see Annex A3). Source: OECD, PISA 2015 Database, III.9.16, III.9.17, III.9.18, III.9.19, III.10.9 and III.10.15.12 http://dx.doi.org/10.1787/888933470449
Overview: StudentS’ well‑being
PISA 2015 RESULTS (VOLUME III): STUDENTS’ WELL-BEING – OVERVIEW © OECD 2017 21
Parents who completed the parent questionnaire in PISA 2015 cited the inability to get time off from work (cited by 36% of parents), the inconvenience of school meeting times (cited by 33% of parents) and the lack of knowledge about how to participate in school activities (cited by 17% of parents) as among the most common barriers to their participation in school activities (Figure III.9.8).
Family wealth and inequalities in well-beingWealth and social status can influence well-being at school, because the family background is often related to the type of school children attend and to how students evaluate themselves in comparison with their peers. PISA data show that there are large differences across countries in the strength of the relationship between socio-economic advantage and students’ outcomes, suggesting that effective policies and school practices can help level the playing field and increase social mobility. Schools can promote social mobility if they help all students develop a positive view of themselves and their future.
The most visible and well-documented impact of wealth and income inequalities on students’ well-being is the relatively low performance of students at the bottom of the socio-economic ladder. PISA consistently finds that disadvantaged students perform worse than advantaged students, even if the strength of the relationship varies greatly across countries. PISA results show a strong relationship between the variation in science performance related to family wealth and the overall income inequality of countries (Figure III.10.3). This association suggests that the inequalities observed more broadly in a country are reflected in student performance. In other words, in all systems, rich parents may use their wealth to provide better education for their children, but in more unequal societies, wealthy parents pass on more of that advantage to their children.
Family affluence and social status are not only related to academic performance but can also affect adolescents’ satisfaction with life, perceptions about themselves and their aspirations for the future. In most countries, a greater proportion of wealthy students (among the 25% most wealthy in their country/economy) reported being “very satisfied” with their lives compared to the share of students who were among the 25% least wealthy who reported the same (Figure III.10.5). And in most countries, students reported less satisfaction with life if they are not as wealthy as the other students in the school (their relative wealth is lower) (Figure III.10.6).
Adolescents form opinions about themselves based on comparisons with their schoolmates. Disadvantaged students who attend advantaged schools may suffer from social isolation or even feel discriminated against if they are not prepared to be a member of a disadvantaged minority in the school. Does this mean that disadvantaged students are better off when they attend disadvantaged schools? When it comes to developing high personal ambitions, PISA results show that the answer to that question is a resounding “no”. On average across 28 countries and economies with available data, the children of blue-collar workers who attend schools where students have parents with white-collar occupations were around twice as likely to expect to earn a tertiary degree and work in a management or professional occupation than children of blue-collar workers who perform similarly but who attend other schools (Figure III.10.8). In other words, the education and career expectations of disadvantaged students are related to the socio-economic profile and composition of their school. This result suggests that in schools with a high concentration of students with pro-school attitudes and high expectations for themselves, students of all social status tend to develop higher ambitions for their future.
HOw StudentS uSe tHeir tiMe OutSide OF SCHOOlPhysical exercise and eating habitsStudents’ overall physical fitness and health are important pre-requisites for social and emotional well-being. People who exercise regularly are less likely to suffer from certain diseases and are in better overall health than people who do not. There is also strong evidence that participating in physical activity reduces depression and anxiety, and boosts self-esteem. Regular physical activity also appears to improve memory, perseverance and self-regulation.
In PISA 2015, students were asked four questions related to physical activities in and outside of school. Students reported the number of days per week they attended physical education classes at school, the number of days per week they engage in moderate physical activity outside of school for at least 60 minutes per day, or in vigorous activity outside of school for at least 20 minutes per day, and whether or not they exercise or practice sports before or after school.
In the majority of the countries and economies that participated in PISA 2015, most students take at least one physical education class per week, on average (Figure III.11.1). Students tend to participate less in physical education at school as they get older. On average across OECD countries, students in upper secondary school (ISCED 3) reported spending almost half a day less per week in physical education than students in lower secondary school (ISCED 2) (Table III.11.3).

Overview: StudentS’ well‑being
22 © OECD 2017 PISA 2015 RESULTS (VOLUME III): STUDENTS’ WELL-BEING – OVERVIEW
On average across OECD countries, 43% of students reported that they exercise or practice sports before school, and 66% reported that they exercise or practice sports after school. Overall, boys were more likely than girls to report that they exercise both before and after school (Figure III.11.2). But, on average across OECD countries, about 5.7% of boys and 7.5% of girls reported that they do not participate in any form of physical activity outside of school. And socio-economic status is also related to adolescents’ level of physical activity. Advantaged students were more likely than disadvantaged students to report that they engage in moderate or vigorous physical activity outside of school (Table III.11.10).
PISA results show that there is a positive relationship between the number of days students engage in moderate physical activity outside of school and a school system’s average science performance (Figure III.11.7). Physical activities, such as walking and cycling can be considered moderate if they raise a person’s heart rate and the person breaks into a sweat. Activities such as hiking, jogging, or playing tennis or football are considered vigorous if breathing becomes difficult and fast, and the heart rate increases rapidly. Within countries, an additional day of moderate physical activity is positively – albeit modestly – associated with students’ science performance, after accounting for gender and socio-economic status; the opposite holds true for vigorous physical activity (Tables III.11.11a and III.11.12a).
A stronger association is found between physical exercise and non-cognitive outcomes. On average across OECD countries, students who reported taking part in some moderate or vigorous physical activity are 2.9 percentage points less likely to feel very anxious about tests, 6.7 percentage points less likely to feel like an outsider at school, 3 percentage points less likely to skip school frequently, and 2.2 percentage points less likely to be frequently bullied than students who do not engage in any form of physical activity outside of school (Table III.11.18). These differences suggest that students who are completely inactive outside of school may potentially enhance their well-being through engaging in some exercise at school.
Like physical exercise, eating well – and regularly – can have an impact on students’ well-being. To learn more about adolescents’ eating habits, PISA 2015 asked students to report whether they ate breakfast before school or ate dinner after school on the most recent day they attended school. On average across OECD countries, 26% of girls and 18% of boys reported that they had skipped breakfast. A considerably smaller proportion of students reported that they had skipped dinner. Still, girls were more likely to have skipped dinner than boys, although the difference between girls and boys was less pronounced than that concerning skipping breakfast (Figure III.11.11 and Table III.11.22).
Eating breakfast is positively related to students’ science performance, on average across OECD countries, but the relationship differs considerably across countries. On average across OECD countries, boys who reported that they had eaten breakfast before school score 10 points higher in science than boys who had skipped breakfast. Girls who reported that they had eaten breakfast score six points higher than girls who reported that they had skipped breakfast (Figure III.11.12).
The family environment can also play a role in shaping adolescents’ eating habits. Research suggests that in households where families eat dinner together, teenagers tend to enjoy better physical and emotional well-being, possibly because dinner provides time for informal discussions, and during that time, parents can promote healthy eating habits. Among students in OECD countries, those who reported that they had eaten dinner reported greater satisfaction with life than those who had skipped dinner. On average, boys who had eaten dinner reported a life satisfaction of 7.6 on a scale from 0 to 10 – 0.7 point higher than boys who had skipped dinner. The relationship is even stronger among girls, with a difference of one point on the scale of life satisfaction (Figure III.11.13).
Working for pay or in the householdFor the first time, PISA 2015 asked students to report whether they worked for pay and/or worked in the home (or cared for family members) before or after school during the most recent day that they attended school. On average across OECD countries, 23% of students reported that they work for pay and 73% reported that they work in the house before or after school (Table III.12.1). Gender and socio-economic status are related to students’ paid work status. In the majority of the countries, more boys than girls reported that they work for pay. The difference between the shares of boys and girls who reported that they work for pay is 11 percentage points in favour of boys, on average across OECD countries. And the share of disadvantaged students across OECD countries who reported that they work for pay is 6.3 percentage points larger than the share of advantaged students who so reported (Figure III.12.2 and Table III.12.7).
In the majority of countries and economies, more than one in two students reported that they help with housework or take care of family members outside of school hours (Table III.12.1). In 39 countries and economies, girls were significantly
Overview: StudentS’ well‑being
PISA 2015 RESULTS (VOLUME III): STUDENTS’ WELL-BEING – OVERVIEW © OECD 2017 23
more likely than boys to report that they help with housework (Table III.12.5). In Beijing-Shanghai-Jiangsu-Guangdong (China) (hereafter “B-S-J-G [China]”) and Colombia disadvantaged girls were over 20 percentage points more likely than advantaged girls to report working in the house.
Students who work for pay or work in the home tend to score lower in science than those who do not work at all (Figures III.12.4 and III.12.5). The performance difference is greater among students who work for pay. On average across OECD countries, the score-point difference in science performance between students who work in the household and those who do not is 13 points, while the difference is 55 points between students who work for pay and those who do not, after accounting for gender and socio-economic status (Tables III.12.3 and III.12.8). The negative relationship between students’ work status and science performance is stronger among advantaged students than among disadvantaged students. On average across OECD countries, advantaged students who reported working for pay score 68 points lower in science than advantaged students who do not work for pay; among disadvantaged students, this difference is 49 points.
Students who work for pay reported a level of satisfaction with life that is similar to that of students who do not work. By contrast, students who work for pay were almost 5 percentage points more likely than students who do not work for pay to report that they feel like an outsider at school, on average across OECD countries, with one in five students who work for pay reporting that he or she feels like an outsider. Students who work for pay are also 11 percentage points more likely to expect to leave formal education at the end of secondary school, 9 percentage points more likely to arrive late for school, and 4 percentage points more likely to skip school frequently, on average across OECD countries (Figure III.12.6 and Table III.12.10). These findings suggest that disengagement from school is correlated with students’ employment status.
Using ICT Over the past two decades, information and communication technologies (ICT) have transformed the ways 15-year-old students learn, socialise and play. Internet tools, including online networks, social media and interactive technologies, are giving rise to new learning styles where young people see themselves as agents of their own learning, where they can produce multimedia content, update and redefine their interests, and learn more about the world, others and themselves. But adolescents’ use of ICT is also a source of concern among parents, teachers and policy makers, as it may lead to dangerous online relationships with strangers, being the victim or perpetrator of cyberbullying, and possibly problematic behaviour, including extreme videogaming, compulsive texting and overuse of smartphones.
According to PISA 2015 data, on average across OECD countries 91% of students have access to a cell phone at home that is connected to the Internet (smartphone), 74% have access to a portable laptop, close to 60% have access to a desktop computer and nearly 55% have access to a tablet that is connected to the Internet (Table III.13.4). Around the world, increasing numbers of children start playing with connected devices even before they can read well. On average across OECD countries, 61% of students reported that they accessed the Internet for the first time when they were younger than 10, and 18% reported they did so at the age of 6 or younger (Table III.13.6).
PISA 2015 asked students how much time they spend using the Internet at home within a typical school week. On average across OECD countries, students spend more than two hours on line during a typical weekday after school, and more than three hours on line during a typical weekend day (Tables III.13.7 and III.13.8). Between 2012 and 2015, the time spent on line outside of school increased by 40 minutes per day on both weekdays and weekends.
Students were also asked how they feel about the time they spend on line and how they feel when they are engaged in online activities. Across OECD countries, most students agreed that “the Internet is a great resource for obtaining information” (88%) and that “it is very useful to have social networks on the Internet” (84%). Some 67% of students reported that they are excited to discover new digital devices and applications. The data also show that most students enjoy using various digital devices and the Internet, but many of them are at risk of excessive Internet use. Across OECD countries, 90% of students enjoy using digital devices and 61% reported that they forget time when using them. More than one in two students (54%) reported that they feel bad if no Internet connection is available (Table III.13.15).
Given the amount of time 15-year-old students spend on the Internet every day, it is crucial to understand whether and how Internet use influences students’ well-being. On the one hand, using the Internet may increase life satisfaction as it provides entertainment and removes logistical obstacles to socialising. On the other hand, online activities pose several risks to well-being. For example, sitting for long hours in front of a screen might be associated with doing less physical activity, sleeping disorders, obesity and weight gain. Extensive use of digital media and videogaming can also undermine students’ motivation and concentration, and could also lead to social isolation.

Overview: StudentS’ well‑being
24 © OECD 2017 PISA 2015 RESULTS (VOLUME III): STUDENTS’ WELL-BEING – OVERVIEW
Figure III.1.5 [Part 1/2] • Snapshot of students’ activities outside of school
Countries/economies with values above the OECD averageCountries/economies with values not significantly different from the OECD averageCountries/economies with values below the OECD average
Percentage of students who reported that they exercise
or practice sports before or after school
Gender difference in students reporting they exercise
or practice sports after school (B – G)
Percentage of students who reported eating breakfast
before school
Gender difference in students reporting they eat breakfast
before school (B – G)
% % dif. % % dif.
OECD average 69.8 12.2 78.0 7.5
OEC
D Australia 71.7 8.9 78.6 11.2Austria 61.4 18.0 64.2 11.3Belgium2 73.1 11.9 79.1 7.2Canada 74.2 8.3 75.8 8.7Chile 65.6 20.8 70.1 11.9Czech Republic 68.1 7.2 70.7 4.3Denmark 65.5 5.9 84.6 6.4Estonia 72.1 5.0 83.0 3.9Finland 69.6 2.6 83.5 3.3France 62.9 15.3 77.9 12.0Germany 70.0 10.5 71.4 6.7Greece 63.0 19.8 79.3 6.7Hungary 80.2 9.1 69.3 12.6Iceland 71.6 7.9 81.2 9.9Ireland 78.6 13.4 82.9 8.9Israel 67.4 17.0 72.1 9.6Italy 68.2 14.8 75.3 11.0Japan 57.7 19.5 92.5 -1.5Korea 46.3 26.3 78.8 5.0Latvia 76.3 8.5 80.9 4.1Luxembourg 75.4 9.2 74.9 5.4Mexico 76.1 18.6 81.7 5.5Netherlands 78.0 5.3 88.8 4.9New Zealand 73.0 5.9 79.8 10.8Norway 71.5 4.0 82.1 5.4Poland 79.0 10.3 80.4 8.3Portugal 70.9 16.9 92.6 5.7Slovak Republic 79.3 10.3 70.4 6.6Slovenia 55.9 10.3 65.5 7.9Spain 73.8 15.1 85.1 7.4Sweden 66.6 5.9 83.4 5.0Switzerland 73.1 8.8 73.6 4.4Turkey 70.7 25.6 79.1 9.8United Kingdom 63.4 18.8 71.1 14.0United States 73.4 12.7 71.7 7.5
Partners Albania m m m m
Algeria m m m mBrazil 66.0 24.1 76.9 4.3B-S-J-G (China) 75.6 17.5 94.0 -1.0Bulgaria 78.3 12.9 74.7 11.7CABA (Argentina) m m m mColombia 73.9 22.6 86.8 3.9Costa Rica 67.4 26.2 86.8 6.1Croatia 65.4 21.5 80.6 8.5Cyprus* 72.8 16.7 74.1 9.8Dominican Republic 76.0 20.2 76.5 6.0FYROM m m 84.6 8.4Georgia m m m mHong Kong (China) 64.7 17.4 m mIndonesia m m 82.7 -0.8Jordan m m m mKosovo m m m mLebanon m m m mLithuania 80.2 13.7 m mMacao (China) 67.8 20.8 80.0 8.0Malta m m 88.4 0.6Moldova m m m mMontenegro 85.2 12.7 m mPeru 75.1 21.9 89.7 1.8Qatar 78.6 12.5 90.2 4.1Romania m m 78.5 9.0Russia 79.8 12.3 m mSingapore 58.7 19.4 88.4 3.8Chinese Taipei 63.6 19.1 65.7 6.9Thailand 76.5 16.3 87.3 1.0Trinidad and Tobago m m m mTunisia 74.4 23.3 82.4 10.9United Arab Emirates 79.1 14.1 76.3 12.2Uruguay 70.3 23.9 81.0 6.9Viet Nam m m m m
*See note 3 under Figure III.1.11. Categories of Internet users are based on students’ responses to questions about how much time they spend on line, outside of school, during a typical weekday. Low Internet users: one hour or less; woderate Internet users: 1 to 2 hours; high Internet users: 2 to 6 hours; extreme Internet users: more than 6 hours.2. Data for life satisfaction do not include the Flemish community of Belgium.Note: Values that are statistically significant are indicated in bold (see Annex A3).Source: OECD, PISA 2015 Database, Tables III.11.6, III.11.7b, III.11.21, III.11.22, III.12.1, III.12.7, III.13.9 and III.13.23.12 http://dx.doi.org/10.1787/888933470458

Overview: StudentS’ well‑being
PISA 2015 RESULTS (VOLUME III): STUDENTS’ WELL-BEING – OVERVIEW © OECD 2017 25
Figure III.1.5 [Part 2/2] • Snapshot of students’ activities outside of school
Countries/economies with values above the OECD averageCountries/economies with values not significantly different from the OECD averageCountries/economies with values below the OECD average
Percentage of students who reported working
for pay before or after school
Gender difference in students reporting they
work for pay before or after school (B – G)
Average time, in minutes per day, students spend on the Internet outside
of school, during weekdays
Average time, in minutes per day, students spend on the Internet outside
of school, during weekend days
Difference in life satisfaction during
weekdays between extreme and other Internet users
(low, moderate and high)1
% % dif. Minutes Minutes Dif.
OECD average 23.3 10.5 146 184 -0.38
OEC
D Australia 34.4 0.2 164 197 mAustria 18.3 12.2 149 179 -0.45Belgium2 21.9 8.8 146 199 -0.49Canada 34.7 5.4 m m mChile 23.5 12.5 195 230 -0.08Czech Republic 18.6 11.0 149 183 -0.33Denmark 33.1 3.2 159 210 mEstonia 16.4 13.7 163 192 -0.66Finland 12.5 8.1 138 174 -0.64France 14.3 9.1 127 191 -0.25Germany 17.9 7.5 m m mGreece 22.5 17.2 126 171 -0.35Hungary 24.0 16.2 161 197 -0.35Iceland 30.3 5.4 145 188 -0.95Ireland 20.0 11.3 144 185 -0.49Israel 32.3 8.5 135 158 mItaly 26.5 15.2 165 169 -0.11Japan 8.1 0.6 90 144 -0.46Korea 5.9 5.0 55 107 -0.64Latvia 18.4 17.3 147 180 -0.38Luxembourg 20.4 10.5 155 192 -0.29Mexico 26.9 18.6 121 136 -0.02Netherlands 38.0 6.9 159 211 -0.21New Zealand 36.1 8.9 163 196 mNorway 32.7 9.6 m m mPoland 18.4 17.1 146 183 -0.33Portugal 15.4 10.1 140 191 -0.17Slovak Republic 27.3 20.3 152 177 -0.42Slovenia 11.6 10.9 120 159 -0.34Spain 30.4 8.5 167 215 -0.22Sweden 16.6 8.5 187 228 mSwitzerland 20.2 9.3 126 168 -0.39Turkey 34.6 21.7 m m mUnited Kingdom 23.2 7.9 188 224 -0.51United States 30.4 11.4 m m m
Partners Albania m m m m m
Algeria m m m m mBrazil 43.7 10.6 190 209 -0.17B-S-J-G (China) 13.4 4.1 42 99 0.05Bulgaria 28.9 20.6 187 211 0.01CABA (Argentina) m m m m mColombia 12.3 15.7 143 159 -0.36Costa Rica 45.3 11.9 182 205 -0.18Croatia 15.2 20.6 141 188 -0.23Cyprus* 20.4 17.4 m m mDominican Republic 34.9 20.3 130 153 0.11FYROM 36.5 m m m mGeorgia m m m m mHong Kong (China) m 8.3 123 167 -0.46Indonesia 14.4 m m m mJordan m m m m mKosovo m m m m mLebanon m m m m mLithuania m 19.1 137 162 -0.19Macao (China) 25.1 -2.6 130 200 -0.20Malta 14.2 m m m mMoldova m m m m mMontenegro m 16.9 m m mPeru 43.8 18.3 92 117 -0.32Qatar 28.1 6.9 m m mRomania 45.3 m m m mRussia m 19.2 161 193 -0.25Singapore 32.7 4.9 147 198 mChinese Taipei 11.6 6.2 120 195 -0.04Thailand 43.9 16.8 122 193 -0.30Trinidad and Tobago m m m m mTunisia 47.2 17.0 m m mUnited Arab Emirates 41.7 10.0 m m mUruguay 24.7 18.2 185 199 -0.23Viet Nam m m m m m
*See note 3 under Figure III.1.11. Categories of Internet users are based on students’ responses to questions about how much time they spend on line, outside of school, during a typical weekday. Low Internet users: one hour or less; woderate Internet users: 1 to 2 hours; high Internet users: 2 to 6 hours; extreme Internet users: more than 6 hours.2. Data for life satisfaction do not include the Flemish community of Belgium.Note: Values that are statistically significant are indicated in bold (see Annex A3).Source: OECD, PISA 2015 Database, Tables III.11.6, III.11.7b, III.11.21, III.11.22, III.12.1, III.12.7, III.13.9 and III.13.23.12 http://dx.doi.org/10.1787/888933470458

Overview: StudentS’ well‑being
26 © OECD 2017 PISA 2015 RESULTS (VOLUME III): STUDENTS’ WELL-BEING – OVERVIEW
PISA 2015 results show that, in most participating countries and economies, extreme Internet use – more than six hours per day – has a negative relationship with students’ life satisfaction. Across OECD countries, “extreme Internet users” reported themselves as 0.4 point lower on the life-satisfaction scale than those who use the Internet less (Figure III.13.7). Some 17% of “extreme Internet users” across OECD countries also reported that they feel lonely at school, compared with 14% of “low Internet users” (students who use the Internet less than one hour a day), 12% of “moderate Internet users” (those who spend between one and two hours per day on Internet) and 13% of “high Internet users” (those who spend between two and six hours per day on Internet). “Low” and “extreme Internet users” were also more likely than “moderate” and “high Internet users” to report that they are bullied at school (Figure III.13.8).
PISA data also reveal that both “extreme” and “high Internet users” are at greater risk of disengagement from school. One in four “extreme Internet users” reported that they had arrived late for school in the two weeks prior to the PISA test – a share 10 percentage points larger than the share of “moderate Internet users” who so reported (Figure III.13.8). “Extreme Internet users” were also more likely to report low expectations of further education than moderate Internet users. And after accounting for students’ socio-economic status, “extreme Internet users” score around 30 points lower in all subjects PISA assesses than students who use the Internet less (Figure III.13.9).
wHAt tHe PiSA reSultS iMPlY FOr POliCYThe data from PISA 2015 show that students differ greatly, both between and within countries, in how satisfied they are with their lives, their motivation to achieve, how anxious they feel about their schoolwork, their participation in physical activities, their expectations for the future, and their perceptions of being bullied at school or treated unfairly by their teachers. Many of these differences are related to students’ perceptions about the disciplinary climate in the classroom or about the support their teachers give them. The data also show that parents can make a big difference to students’ feelings about schoolwork and their performance in PISA.
To try to reduce schoolwork-related anxiety among students, specific professional development can be offered to teachers so that they can identify those students who suffer from anxiety and teach these students how to learn from mistakes. For example, one way to encourage a positive attitude towards mistakes is to take the most common mistakes that the class made on a test or quiz and let the students analyse them together. In addition, teachers can help students set realistic – but challenging – goals for themselves, since students are more likely to value what they are learning, and to enjoy the process of learning, when they can attain the goals they set. Strategies for encouraging goal-setting and enhancing intrinsic motivation to learn include providing meaningful rationales for learning activities, acknowledging students’ feelings about the tasks, and avoiding excessive pressure and control. Providing constructive feedback on the results of assessments can also nurture students’ confidence and intrinsic motivation.
PISA finds that one major threat to students’ feelings of belonging at school are their perceptions of negative relationships with their teachers. To build better teacher-student relations, teachers should be trained in basic methods of observation, listening and intercultural communication so that they can better take into account individual learners’ needs. Teachers should also be encouraged to collaborate and exchange information about students’ difficulties, character and strengths with their colleagues, so that they can collectively find the best approach to make students feel part of the school community.
The data also show that a large proportion of students report being victims of bullying at school. Effective anti-bullying programmes follow a whole-of-school approach that includes training for teachers on bullying behaviour and how to handle it, anonymous surveys of students to monitor the prevalence of bullying, and strategies to provide information to and engage with parents. Teachers and parents have a particularly important role to play in preventing bullying at school: teachers need to communicate to students that they will not tolerate any form of bullying; and parents need to be involved in school planning and responses to bullying.
PISA results from 18 culturally and economically diverse countries show that students whose parents routinely engage in day-to-day home-based activities, such as eating a meal together or spending time “just talking” not only score higher in PISA, but are also more satisfied with their lives. Schools can help parents become more involved in their child’s education by removing any barriers to their participation in school events, such as offering flexible channels of communication for busy working parents, and suggesting ways in which parents can get involved both at home and in school.
To improve students’ well-being, schools should also teach students the benefits of an active and healthy lifestyle through physical and health education. Engaging physical education at school can reduce the number of students who are physically inactive out of school.

Overview: StudentS’ well‑being
PISA 2015 RESULTS (VOLUME III): STUDENTS’ WELL-BEING – OVERVIEW © OECD 2017 27
Too many students spend too much time on the Internet: 26% of students reported that they spend more than six hours per day on line during weekends, and 16% spend a similar amount of time on line during weekdays. And with cyberbullying on the rise, the Internet can be as much a source of harassment as a tool for learning. Schools can consider investing in a comprehensive education and supervision plan to assist students in gaining the knowledge, skills and motivation they need to use the Internet safely and responsibly.

PPISA 2015 Results: STUDENTS’ WELL-BEINGVOLUME III OVERVIEW
The OECD Programme for International Student Assessment (PISA) examines not just what students know in science, reading and mathematics, but what they can do with what they know. Results from PISA show the quality and equity of learning outcomes achieved around the world, and allow educators and policy makers to learn from the policies and practices applied in other countries.
This brochure is an overview of Volume III, Students’ Well-Being that presents the results of the PISA 2015 survey, the sixth round of the triennial assessment. The report examines the well-being of 15-year-old students, what it is and how it can be measured and looks at their overall life satisfaction and performance at school and how they vary across countries. The report examines some of the factors that influence student’s well-being such as the prevalence of schoolwork-related anxiety, and underlying factors that shape students’ motivation to achieve and the decision to continue on to higher education. The report also looks at relations in and outside of school with parents, teachers and friends while looking at their use of time outside of school hours and how it influences their overall well-being.
To find out more, go to:
OECD (2017), PISA 2015 Results (Volume III): Students’ Well-Being, OECD Publishing, Paris.
http://dx.doi.org/10.1787/9789264273856-en