pisa mathematics literacy items
TRANSCRIPT
Mathematics Literacy
PISA Mathematics Literacy Items
The Mathematics Literacy Items document contains, in a ready-to-use format, 27 mathematics assessment units and 43 items associated with these units. These released items from the PISA 2000 and PISA 2003 assessments are distinct from the secure items which are kept confidential so that they may be used in subsequent cycles to monitor trends. This set of PISA Mathematics Literacy Items is designed to be used in tandem with PISA Mathematics Literacy Items and Scoring Guides, which contains both the items and the PISA scoring guides adapted for classroom use.
1
Mathematics Literacy
TABLE OF CONTENTS
UNIT NAME PAGE
APPLES 4
CONTINENT AREA 7
SPEED OF RACING CAR 9
TRIANGLES 12
FARMS 13
CUBES 15
GROWING UP 16
WALKING 18
ROBBERIES 20
CARPENTER 21
INTERNET RELAY CHAT 23
EXCHANGE RATE 24
EXPORTS 26
COLORED CANDIES 28
SCIENCE TESTS 29
BOOKSHELVES 30
LITTER 31
EARTHQUAKE 32
CHOICES 33
TEST SCORES 34
2
Mathematics Literacy
TABLE OF CONTENTS, continued
UNIT NAME PAGE
SKATEBOARD 35
STAIRCASE 38
NUMBER CUBES 39
SUPPORT FOR THE PRESIDENT 40
THE BEST CAR 41
STEP PATTERN 43
FORECAST OF RAINFALL 44
3
Mathematics Literacy
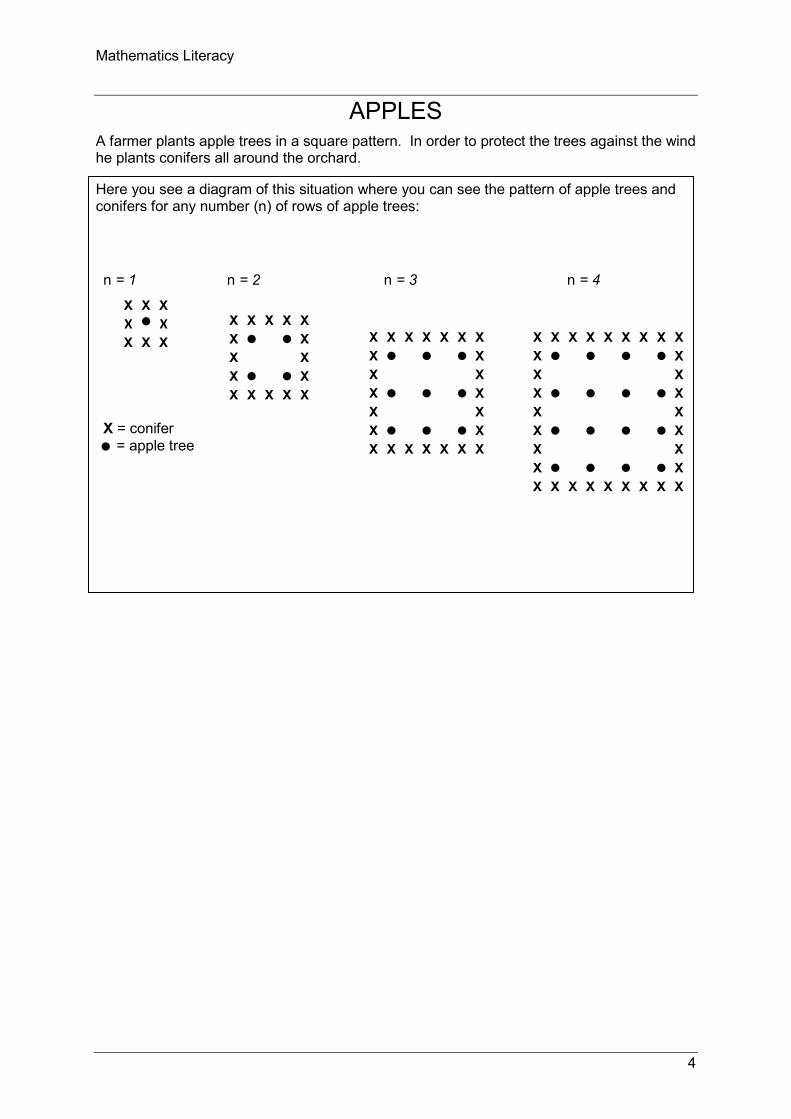
APPLES A farmer plants apple trees in a square pattern. In order to protect the trees against the wind he plants conifers all around the orchard.
Here you see a diagram of this situation where you can see the pattern of apple trees and conifers for any number (n) of rows of apple trees:
X X X X X X X X
X X X X X X X X X X X X X X X X
X X X X X X X X X X X X X X X X X X X X X X X X
X X X X X X X X X X X X X X X X X X X X X X X X X X X X X X X X
n = 1 n = 2 n = 3 n = 4
X = conifer = apple tree
4
Mathematics Literacy
Question 1: APPLES M136Q01- 01 02 11 12 21 99
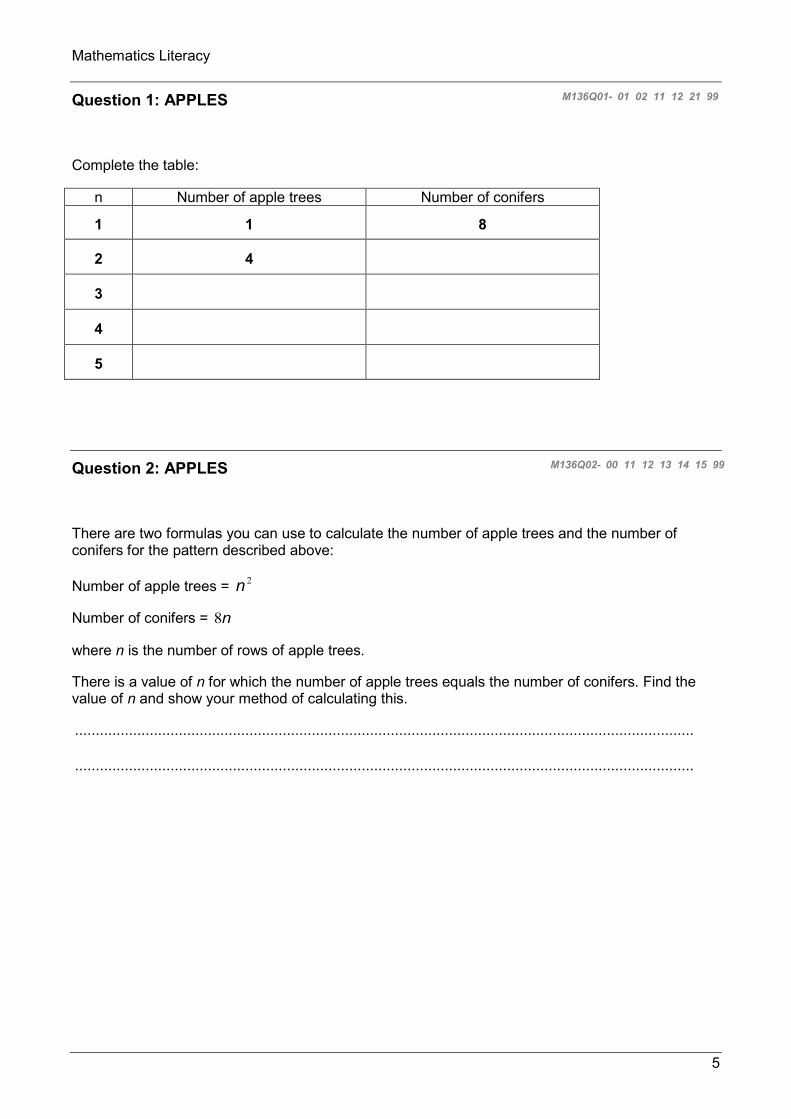
Complete the table:
n Number of apple trees Number of conifers
1 1 8
2 4
3
4
5
Question 2: APPLES M136Q02- 00 11 12 13 14 15 99
There are two formulas you can use to calculate the number of apple trees and the number of conifers for the pattern described above:
Number of apple trees = 2n
Number of conifers = n8
where n is the number of rows of apple trees.
There is a value of n for which the number of apple trees equals the number of conifers. Find the value of n and show your method of calculating this.
.....................................................................................................................................................
.....................................................................................................................................................
5
Mathematics Literacy
Question 3: APPLES M136Q03-01 02 11 12 21 99
Suppose the farmer wants to make a much larger orchard with many rows of trees. As the farmer makes the orchard bigger, which will increase more quickly: the number of apple trees or the number of conifers? Explain how you found your answer.
.....................................................................................................................................................
.....................................................................................................................................................
6
Mathematics Literacy
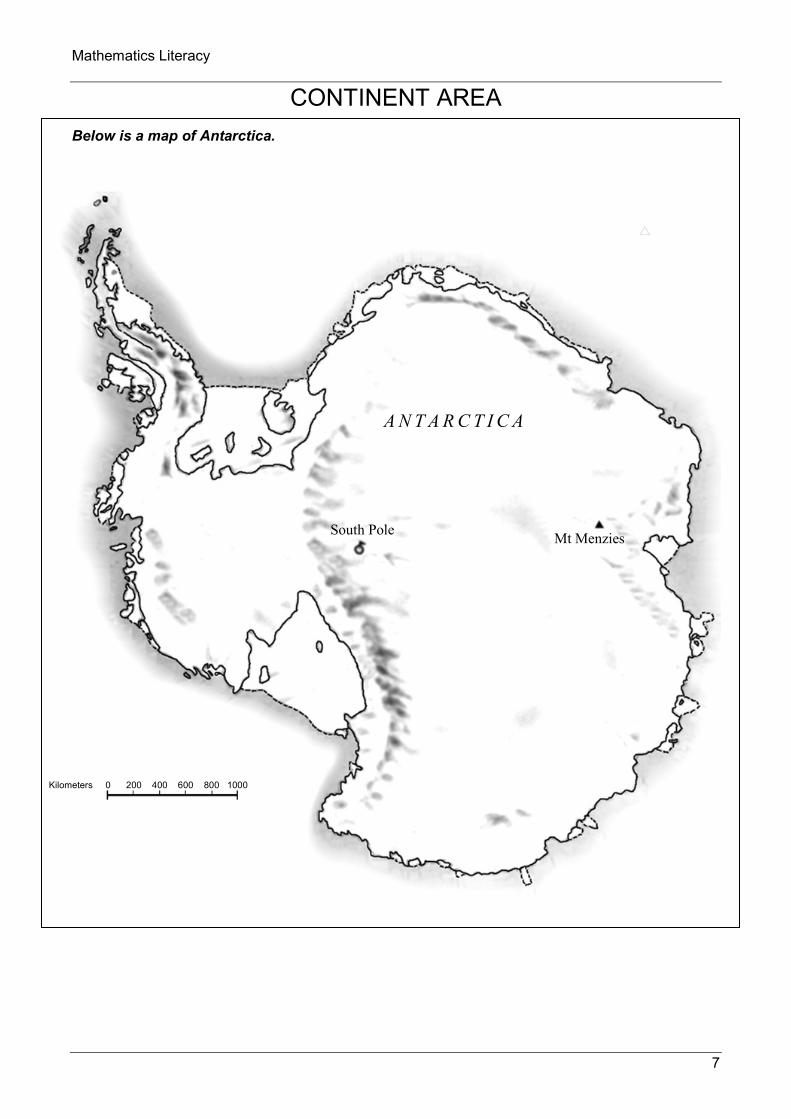
CONTINENT AREA Below is a map of Antarctica.
A N T A R C T I C A
South Pole Mt Menzies
Kilometers 0 200 400 600 800 1000
7

Mathematics Literacy
Question 1: CONTINENT AREA M148Q02
Estimate the area of Antarctica using the map scale.
Show your work and explain how you made your estimate. (You can draw over the map if it helps you with your estimation)
8
Mathematics Literacy
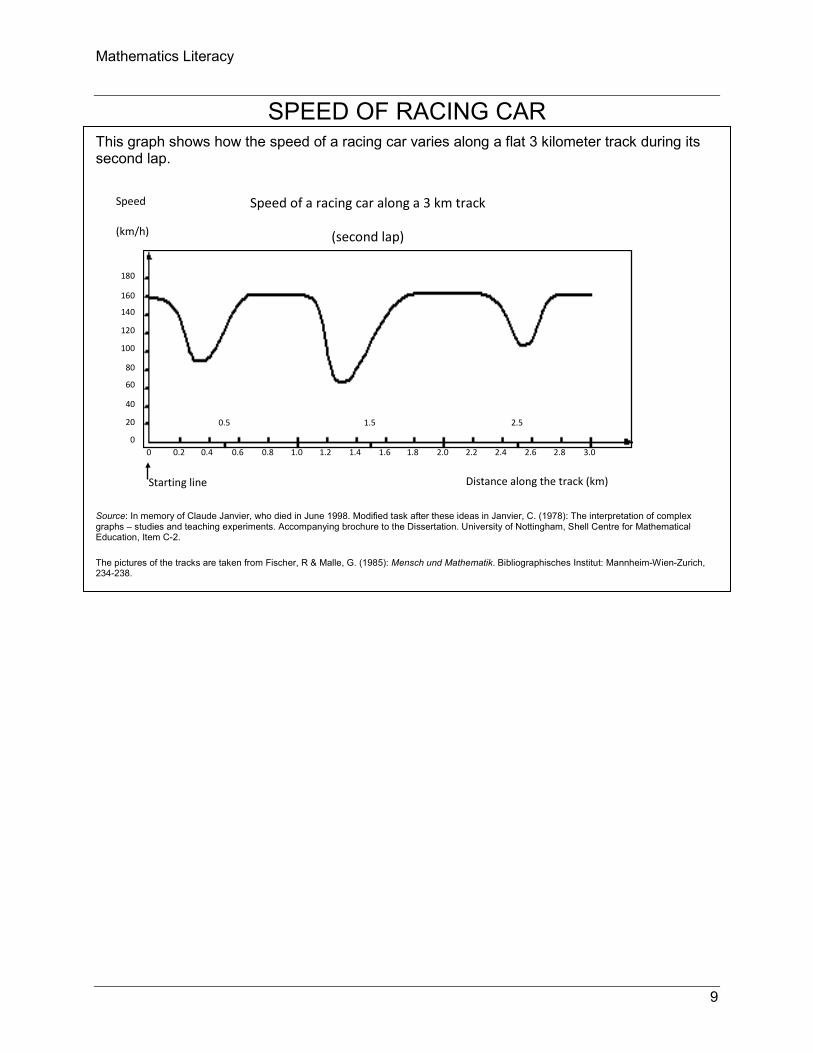
SPEED OF RACING CAR This graph shows how the speed of a racing car varies along a flat 3 kilometer track during its second lap.
Source: In memory of Claude Janvier, who died in June 1998. Modified task after these ideas in Janvier, C. (1978): The interpretation of complex graphs – studies and teaching experiments. Accompanying brochure to the Dissertation. University of Nottingham, Shell Centre for Mathematical Education, Item C-2.
The pictures of the tracks are taken from Fischer, R & Malle, G. (1985): Mensch und Mathematik. Bibliographisches Institut: Mannheim-Wien-Zurich, 234-238.
Speed
(km/h)
180
160
140
120
100
80
60
40
20
0 0 0.2 0.4 0.6 0.8 1.0 1.2 1.4 1.6 1.8 2.0 2.2 2.4 2.6 2.8 3.0
0.5 1.5 2.5
Starting line Distance along the track (km)
Speed of a racing car along a 3 km track
(second lap)
9
Mathematics Literacy
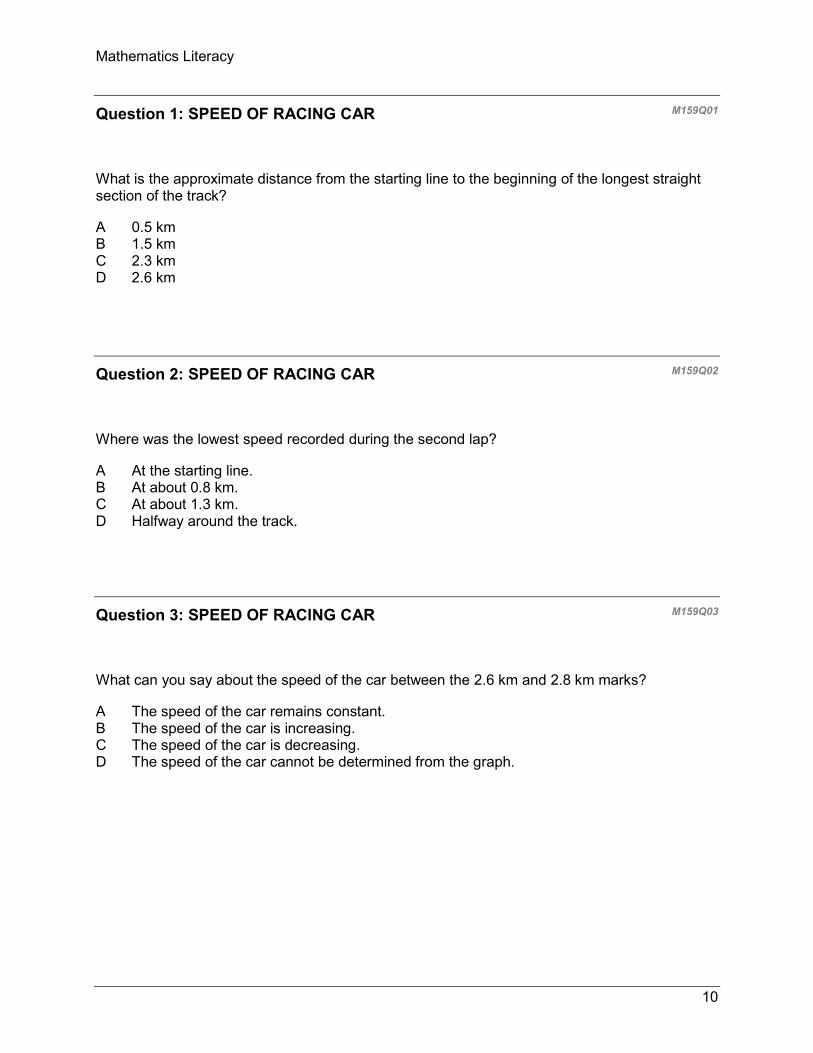
Question 1: SPEED OF RACING CAR M159Q01
What is the approximate distance from the starting line to the beginning of the longest straight section of the track?
A 0.5 km B 1.5 km C 2.3 km D 2.6 km
Question 2: SPEED OF RACING CAR M159Q02
Where was the lowest speed recorded during the second lap?
A At the starting line. B At about 0.8 km. C At about 1.3 km. D Halfway around the track.
Question 3: SPEED OF RACING CAR M159Q03
What can you say about the speed of the car between the 2.6 km and 2.8 km marks?
A The speed of the car remains constant. B The speed of the car is increasing. C The speed of the car is decreasing. D The speed of the car cannot be determined from the graph.
10
Mathematics Literacy
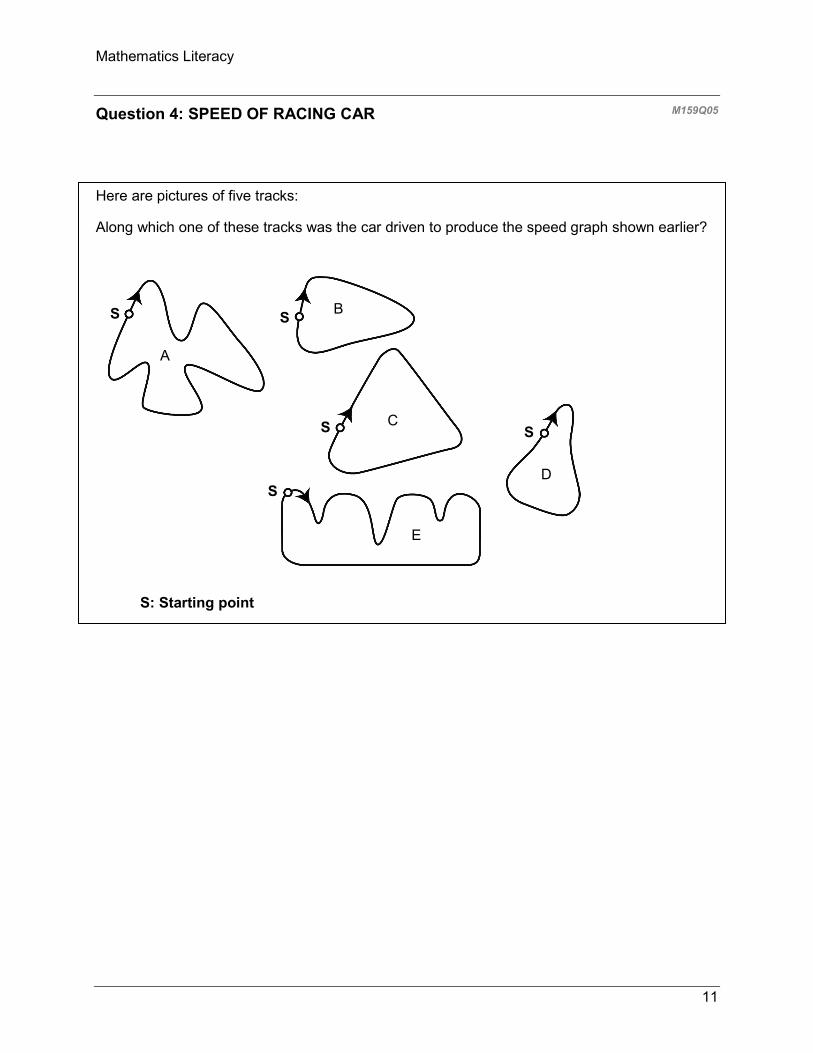
Question 4: SPEED OF RACING CAR M159Q05
Here are pictures of five tracks:
Along which one of these tracks was the car driven to produce the speed graph shown earlier?
S: Starting point
A
B
C
D
E
S
S
S
S
S
11
Mathematics Literacy
TRIANGLES
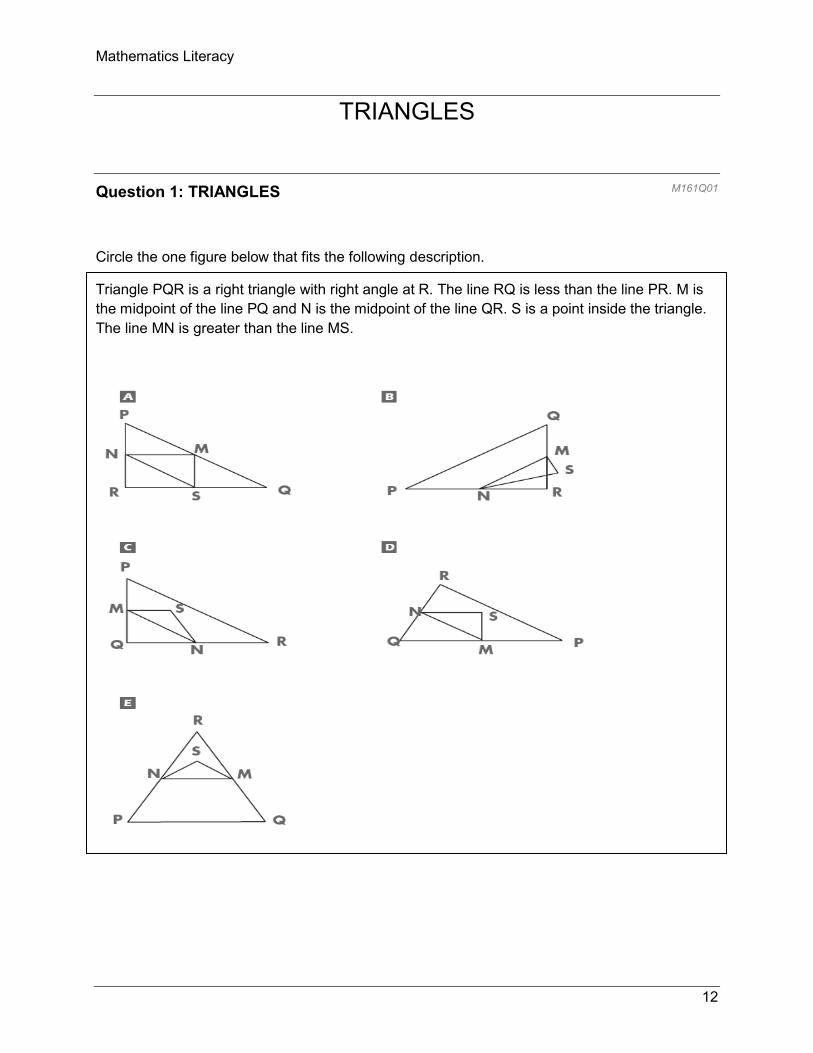
Question 1: TRIANGLES M161Q01
Circle the one figure below that fits the following description.
Triangle PQR is a right triangle with right angle at R. The line RQ is less than the line PR. M is the midpoint of the line PQ and N is the midpoint of the line QR. S is a point inside the triangle. The line MN is greater than the line MS.
12
Mathematics Literacy
FARMS
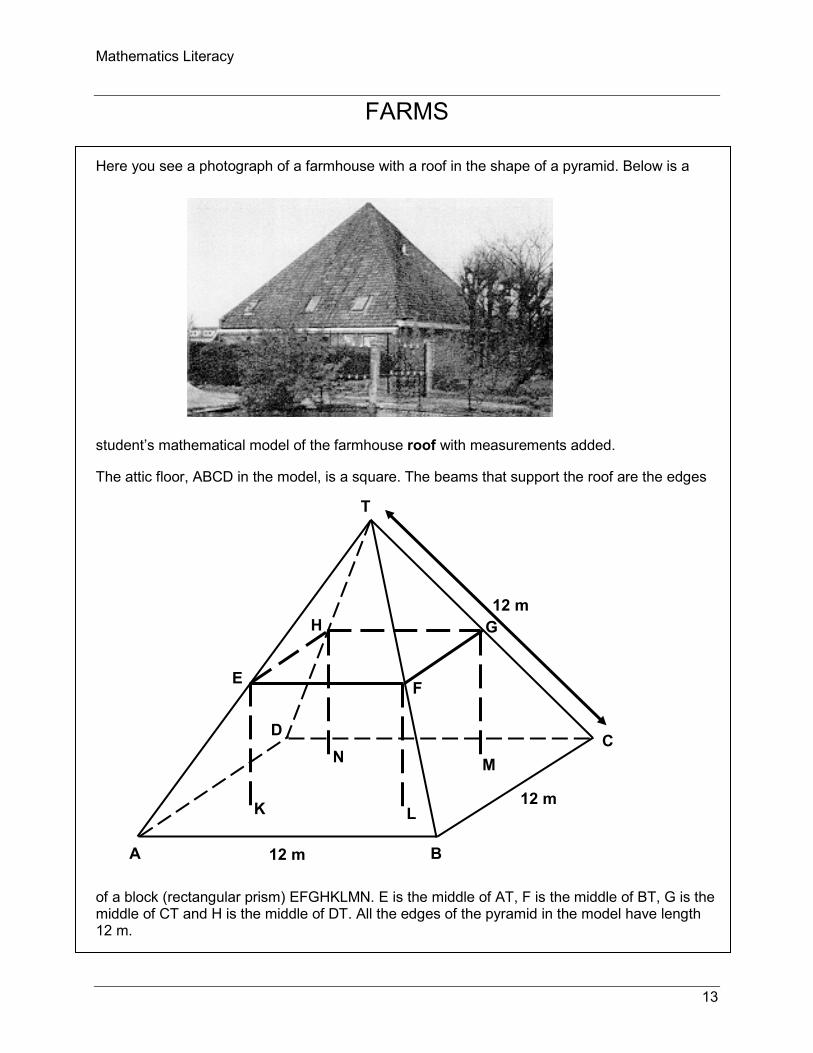
Here you see a photograph of a farmhouse with a roof in the shape of a pyramid. Below is a
student’s mathematical model of the farmhouse roof with measurements added.
The attic floor, ABCD in the model, is a square. The beams that support the roof are the edges
of a block (rectangular prism) EFGHKLMN. E is the middle of AT, F is the middle of BT, G is the middle of CT and H is the middle of DT. All the edges of the pyramid in the model have length 12 m.
T
B A 12 m
G
C
H
F
D
E
N M
K L 12 m
12 m
13
Mathematics Literacy
Question 1: FARMS M037Q01
Calculate the area of the attic floor ABCD.
The area of the attic floor ABCD = ______________ m²
Question 2: FARMS M037Q02
Calculate the length of EF, one of the horizontal edges of the block.
The length of EF = ____________ m
14
Mathematics Literacy
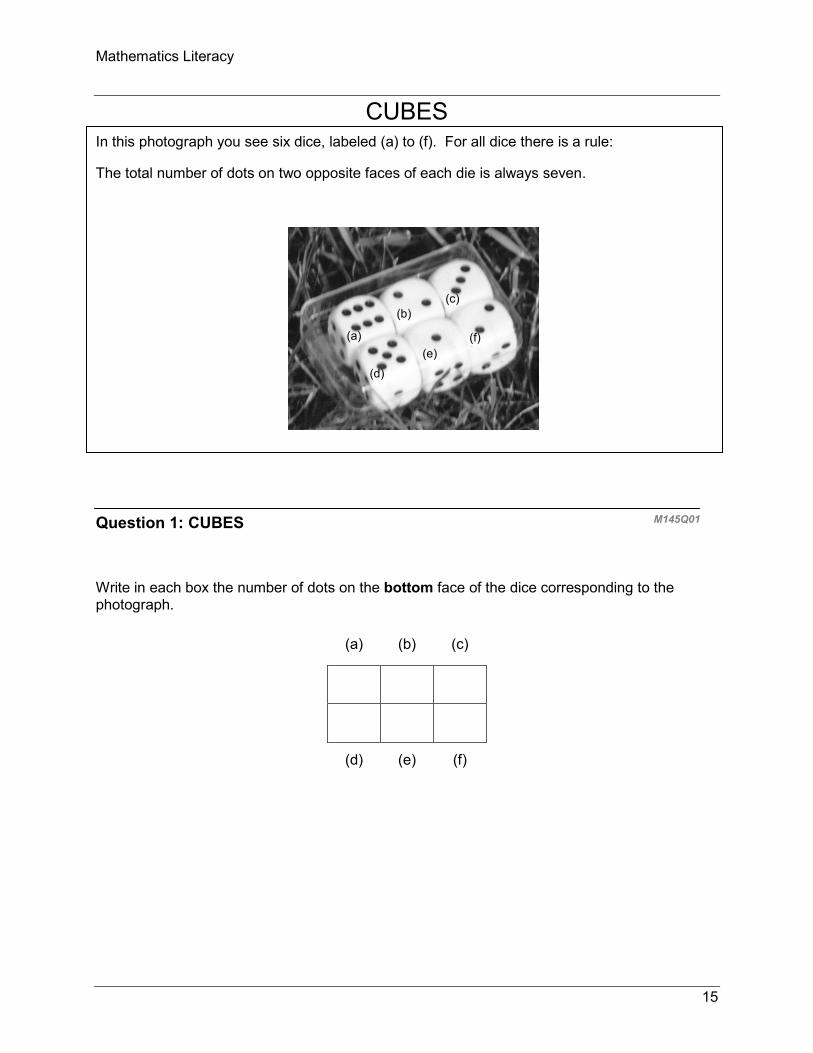
CUBES In this photograph you see six dice, labeled (a) to (f). For all dice there is a rule:
The total number of dots on two opposite faces of each die is always seven.
(d)
(b)
(a) (f)
(c)
(e)
Question 1: CUBES M145Q01
Write in each box the number of dots on the bottom face of the dice corresponding to the photograph.
(a) (b) (c)
(d) (e) (f)
15
Mathematics Literacy
GROWING UP
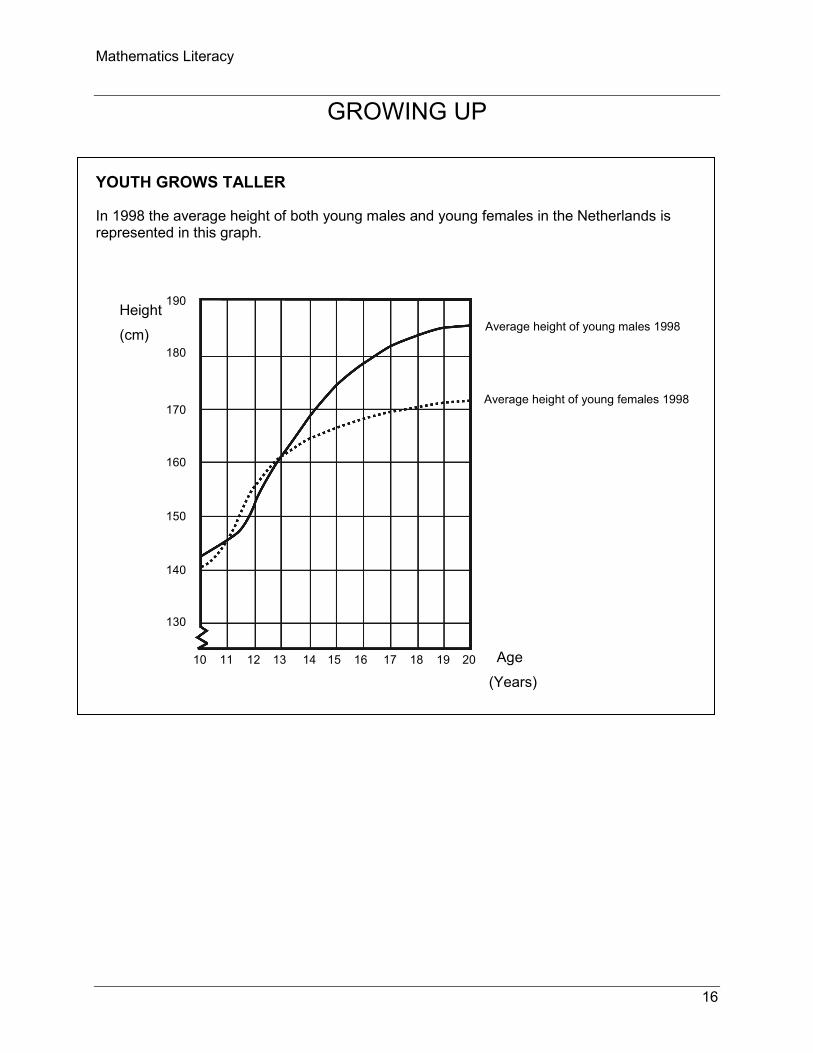
YOUTH GROWS TALLER
In 1998 the average height of both young males and young females in the Netherlands is represented in this graph.
10 11 12 13 14 15 16 17 18 19 20
190
180
170
160
150
130
140
Height
(cm) Average height of young males 1998
Average height of young females 1998
Age
(Years)
16
Mathematics Literacy
Question 1: GROWING UP M150Q01
Since 1980 the average height of 20-year-old females has increased by 2.3 cm, to 170.6 cm. What was the average height of a 20-year-old female in 1980?
.............................................................. Cm
Question 2: GROWING UP M150Q02
Explain how the graph shows that on average the growth rate for girls slows down after 12 years of age.
.....................................................................................................................................................
.....................
.....................................................................................................................................................
Question 3: GROWING UP M150Q03
According to this graph, on average, during which period in their life are females taller than males of the same age?
.....................................................................................................................................................
.....................................................................................................................................................
.....................................................................................................................................................
17
Mathematics Literacy
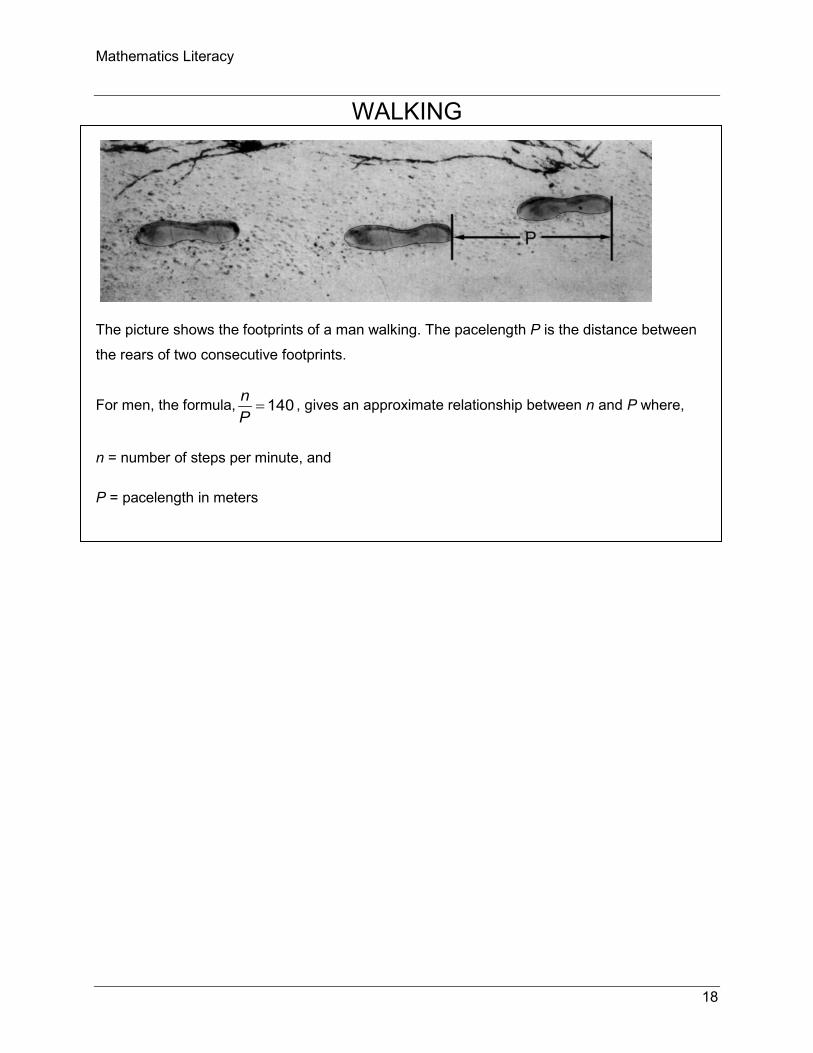
WALKING
The picture shows the footprints of a man walking. The pacelength P is the distance between
the rears of two consecutive footprints.
For men, the formula, 140=Pn , gives an approximate relationship between n and P where,
n = number of steps per minute, and
P = pacelength in meters
18
Mathematics Literacy
Question 1: WALKING M124Q01
If the formula applies to Heiko’s walking and Heiko takes 70 steps per minute, what is Heiko’s pacelength? Show your work.
Question 2: WALKING M124Q03
Bernard knows his pacelength is 0.80 meters. The formula applies to Bernard’s walking.
Calculate Bernard’s walking speed in meters per minute and in kilometers per hour.
Show your work.
19
Mathematics Literacy
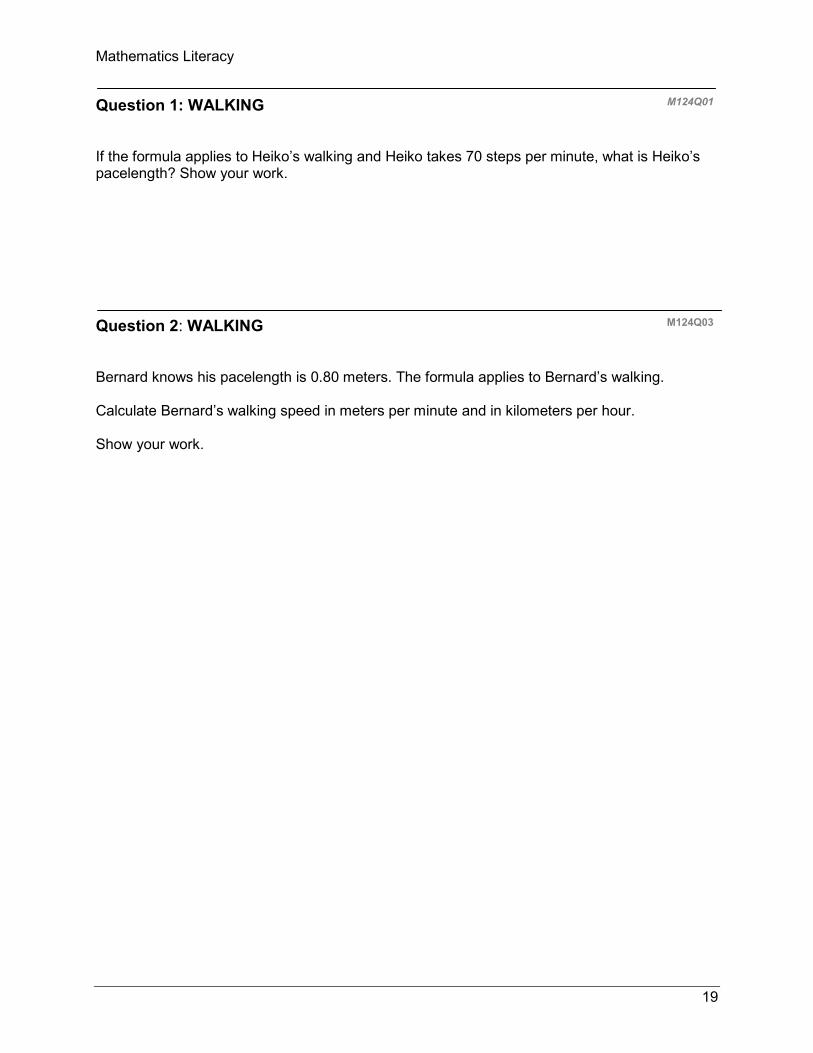
ROBBERIES A TV reporter showed this graph and said:
“The graph shows that there is a huge increase in the number of robberies from 1998 to 1999.”
Number of robberies per year
Year 1999
Year 1998
505
510
515
520
Question 1: ROBBERIES M179Q01
Do you consider the reporter’s statement to be a reasonable interpretation of the graph? Give explanation to support your answer.
20
Mathematics Literacy
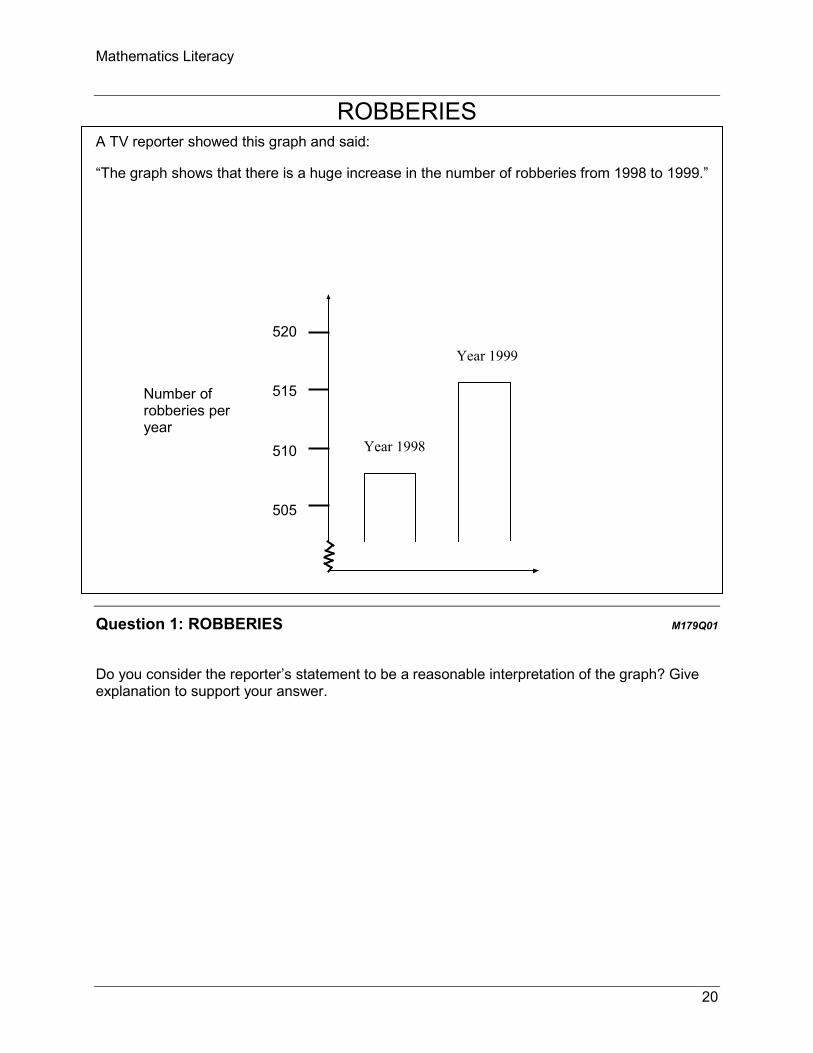
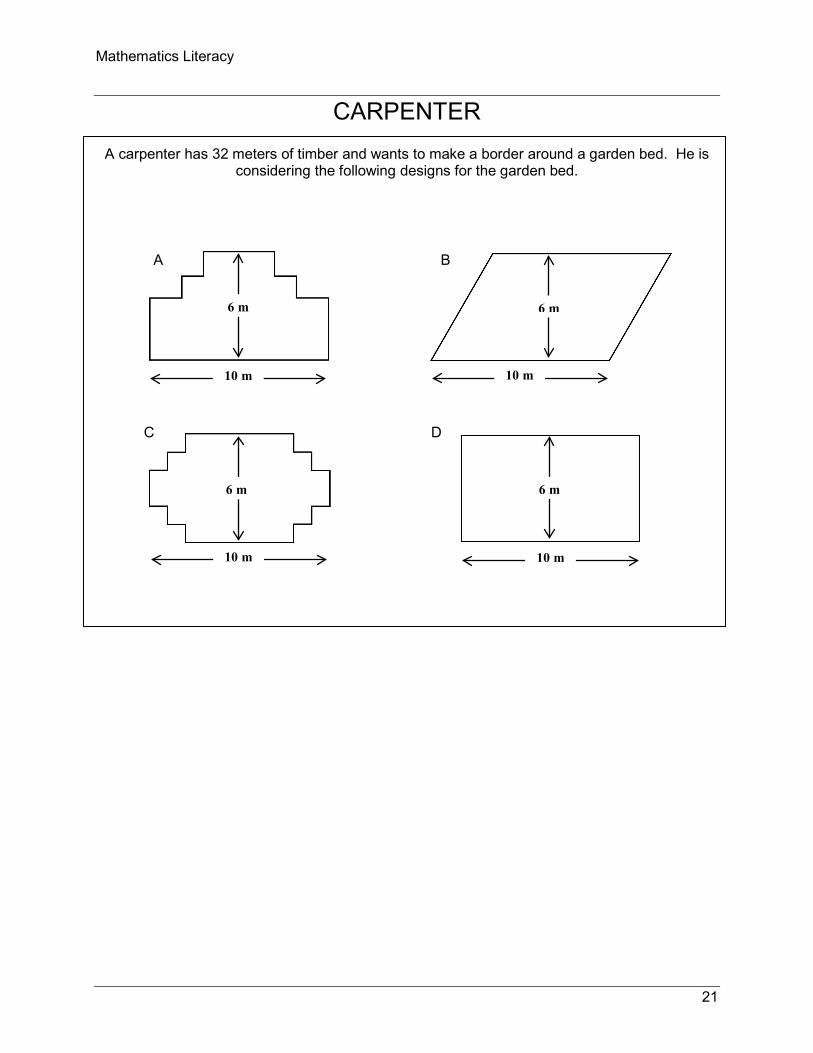
CARPENTER A carpenter has 32 meters of timber and wants to make a border around a garden bed. He is
considering the following designs for the garden bed.
10 m
6 m
10 m
10 m 10 m
6 m
6 m 6 m
A B
D C
21
Mathematics Literacy
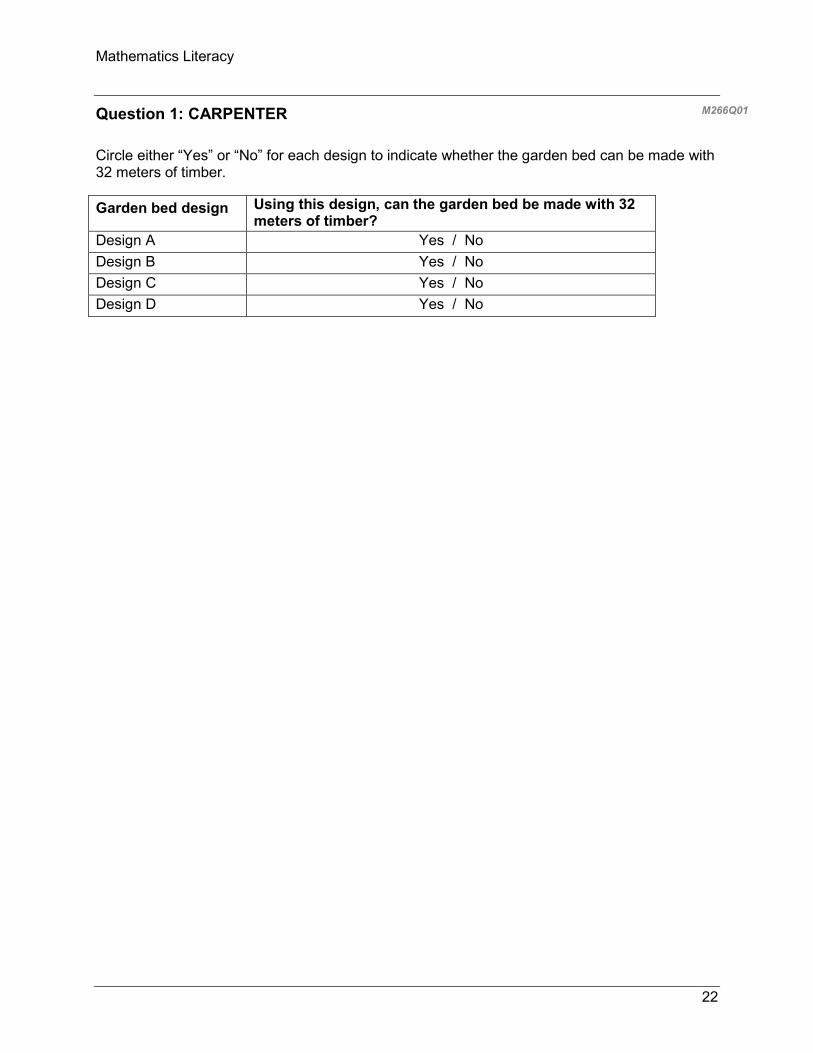
Question 1: CARPENTER M266Q01
Circle either “Yes” or “No” for each design to indicate whether the garden bed can be made with 32 meters of timber.
Garden bed design Using this design, can the garden bed be made with 32 meters of timber?
Design A Yes / No Design B Yes / No Design C Yes / No Design D Yes / No
22
Mathematics Literacy
INTERNET RELAY CHAT
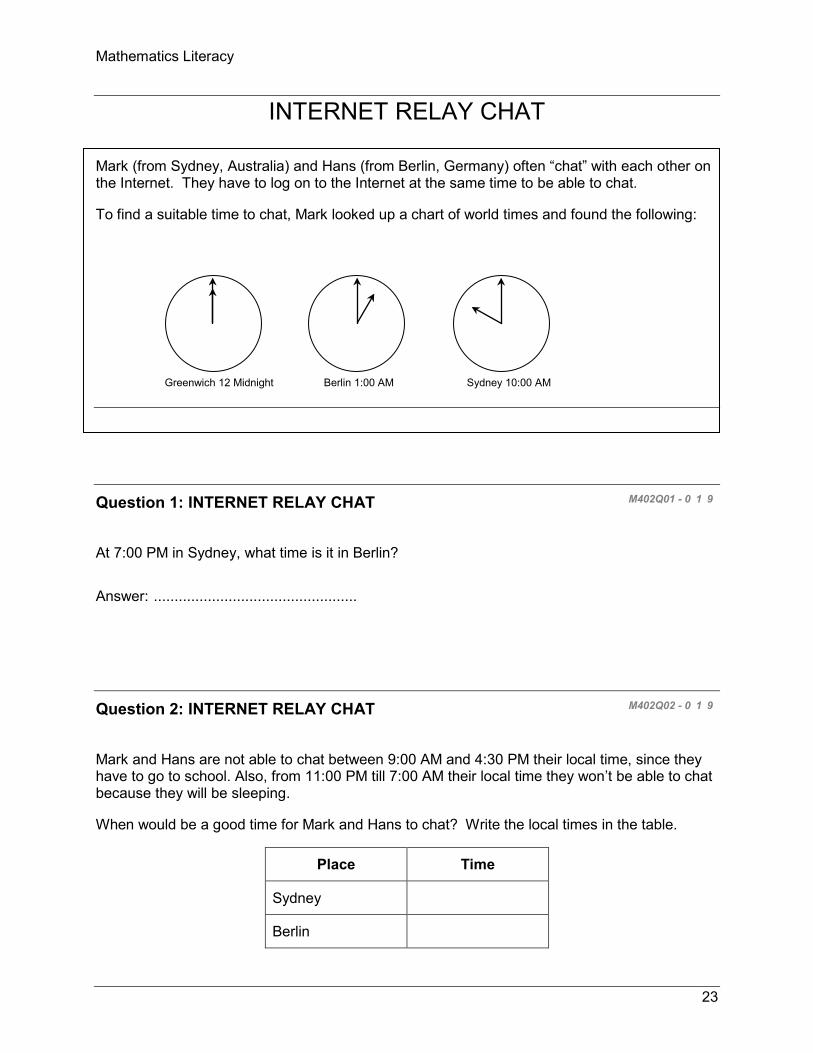
Mark (from Sydney, Australia) and Hans (from Berlin, Germany) often “chat” with each other on the Internet. They have to log on to the Internet at the same time to be able to chat.
To find a suitable time to chat, Mark looked up a chart of world times and found the following:
Greenwich 12 Midnight Berlin 1:00 AM Sydney 10:00 AM
Question 1: INTERNET RELAY CHAT M402Q01 - 0 1 9
At 7:00 PM in Sydney, what time is it in Berlin?
Answer: .................................................
Question 2: INTERNET RELAY CHAT M402Q02 - 0 1 9
Mark and Hans are not able to chat between 9:00 AM and 4:30 PM their local time, since they have to go to school. Also, from 11:00 PM till 7:00 AM their local time they won’t be able to chat because they will be sleeping.
When would be a good time for Mark and Hans to chat? Write the local times in the table.
Place Time
Sydney
Berlin
23
Mathematics Literacy
EXCHANGE RATE
Mei-Ling from Singapore was preparing to go to South Africa for 3 months as an exchange student. She needed to change some Singapore dollars (SGD) into South African rand (ZAR).
Question 1: EXCHANGE RATE M413Q01 - 0 1 9
Mei-Ling found out that the exchange rate between Singapore dollars and South African rand was:
1 SGD = 4.2 ZAR
Mei-Ling changed 3000 Singapore dollars into South African rand at this exchange rate.
How much money in South African rand did Mei-Ling get?
Answer: .................................................
Question 2: EXCHANGE RATE M413Q02 - 019
On returning to Singapore after 3 months, Mei-Ling had 3 900 ZAR left. She changed this back to Singapore dollars, noting that the exchange rate had changed to:
1 SGD = 4.0 ZAR
How much money in Singapore dollars did Mei-Ling get?
Answer: .................................................
24
Mathematics Literacy
Question 3: EXCHANGE RATE M413Q03 - 01 02 11 99
During these 3 months the exchange rate had changed from 4.2 to 4.0 ZAR per SGD.
Was it in Mei-Ling’s favor that the exchange rate now was 4.0 ZAR instead of 4.2 ZAR, when she changed her South African rand back to Singapore dollars? Give an explanation to support your answer.
25
Mathematics Literacy
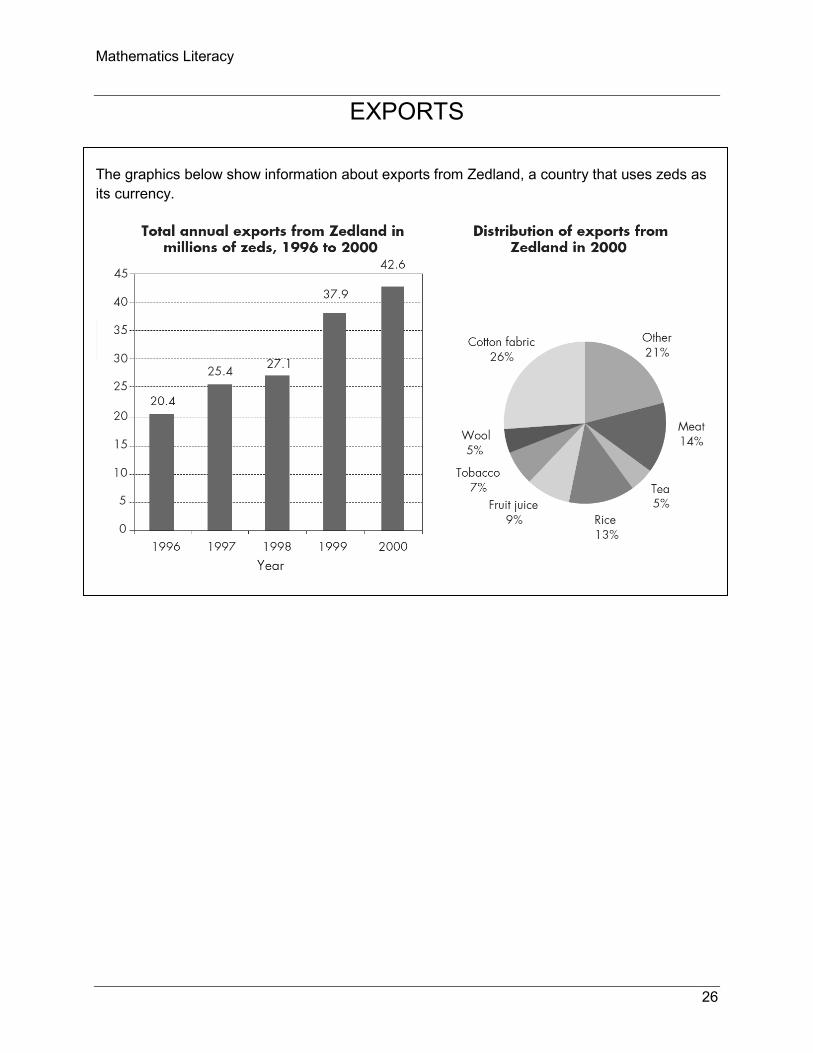
EXPORTS
The graphics below show information about exports from Zedland, a country that uses zeds as its currency.
26
Mathematics Literacy
Question 1: EXPORTS M438Q01 - 0 1 9
What was the total value (in millions of zeds) of exports from Zedland in 1998?
Answer: .................................................
Question 2: EXPORTS M438Q02
What was the value of fruit juice exported from Zedland in 2000?
A 1.8 million zeds. B 2.3 million zeds. C 2.4 million zeds. D 3.4 million zeds. E 3.8 million zeds.
27
Mathematics Literacy
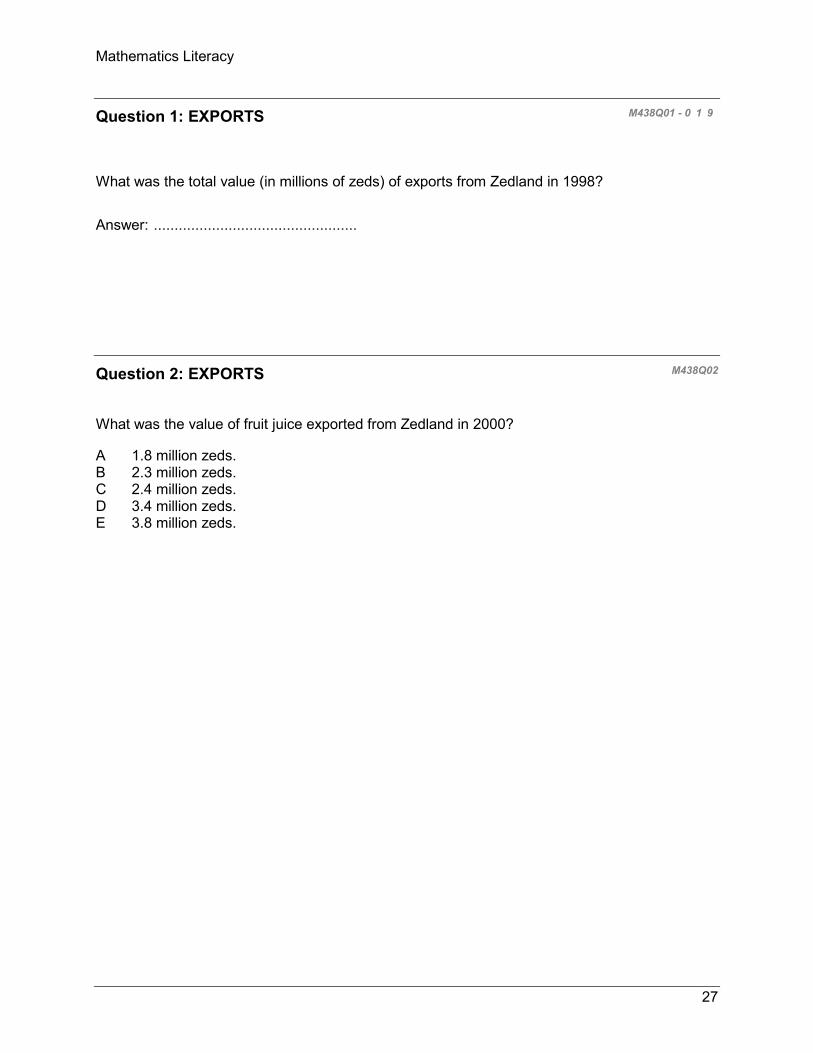
COLORED CANDIES
Robert’s mother lets him pick one candy from a bag. He can’t see the candies. The number of candies of each color in the bag is shown in the following graph.
Question 1: COLORED CANDIES M467Q01
What is the probability that Robert will pick a red candy?
A 10% B 20% C 25% D 50%
28
Mathematics Literacy
SCIENCE TESTS In Mei Lin’s school, her science teacher gives tests that are marked out of 100. Mei Lin has an average of 60 points on her first four Science tests. On the fifth test she got 80 points.
Question 1: SCIENCE TESTS M468Q01
What is the average of Mei Lin’s points in Science after all five tests?
Average: .................................................
29
Mathematics Literacy
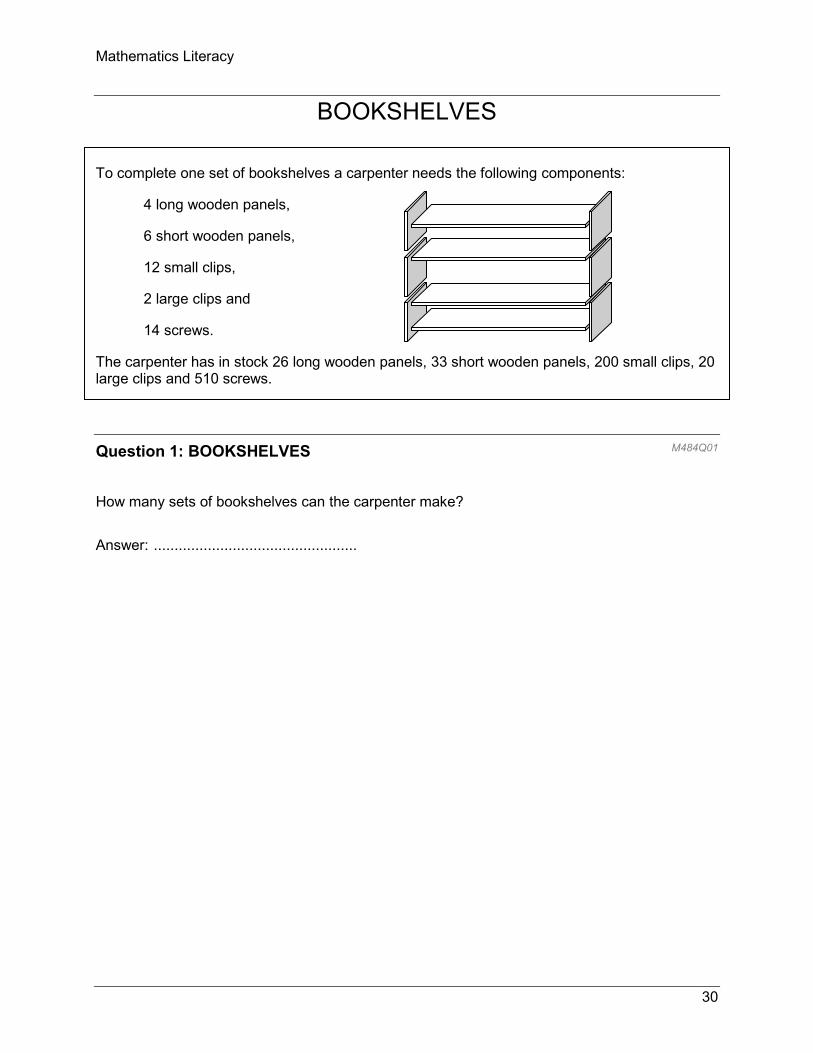
BOOKSHELVES
To complete one set of bookshelves a carpenter needs the following components:
4 long wooden panels,
6 short wooden panels,
12 small clips,
2 large clips and
14 screws.
The carpenter has in stock 26 long wooden panels, 33 short wooden panels, 200 small clips, 20 large clips and 510 screws.
Question 1: BOOKSHELVES M484Q01
How many sets of bookshelves can the carpenter make?
Answer: .................................................
30
Mathematics Literacy
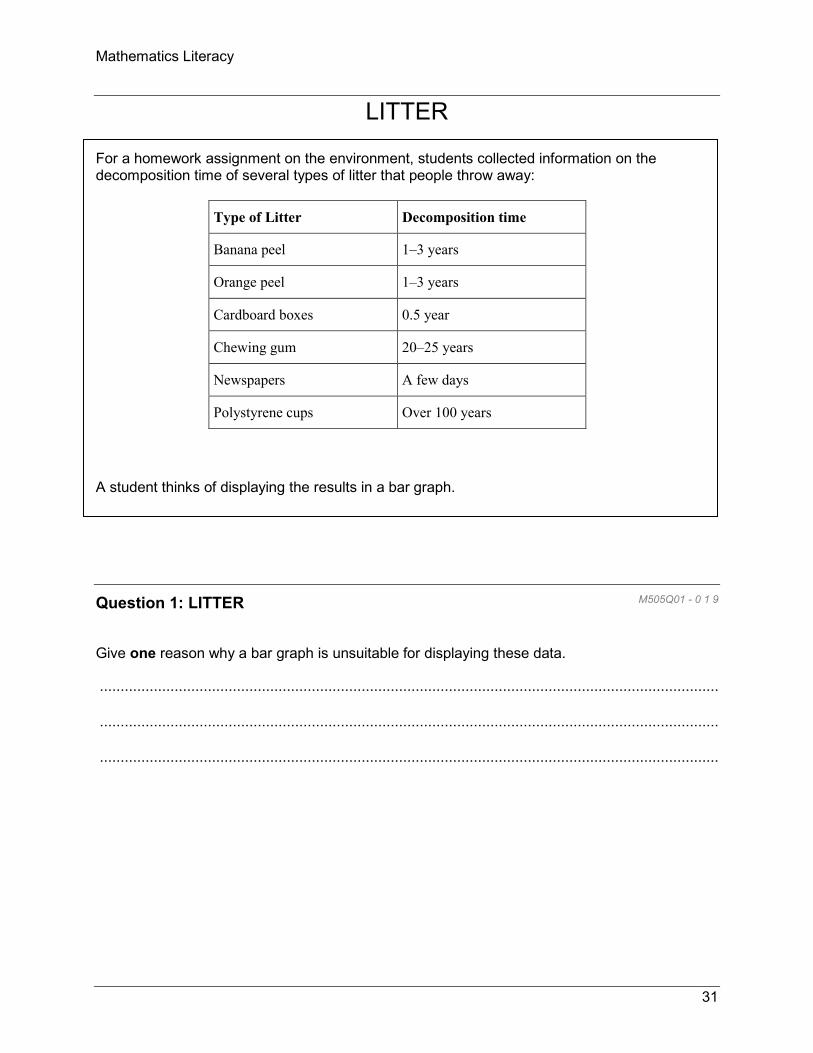
LITTER
For a homework assignment on the environment, students collected information on the decomposition time of several types of litter that people throw away:
Type of Litter Decomposition time
Banana peel 1–3 years
Orange peel 1–3 years
Cardboard boxes 0.5 year
Chewing gum 20–25 years
Newspapers A few days
Polystyrene cups Over 100 years
A student thinks of displaying the results in a bar graph.
Question 1: LITTER M505Q01 - 0 1 9
Give one reason why a bar graph is unsuitable for displaying these data.
.....................................................................................................................................................
.....................................................................................................................................................
.....................................................................................................................................................
31
Mathematics Literacy
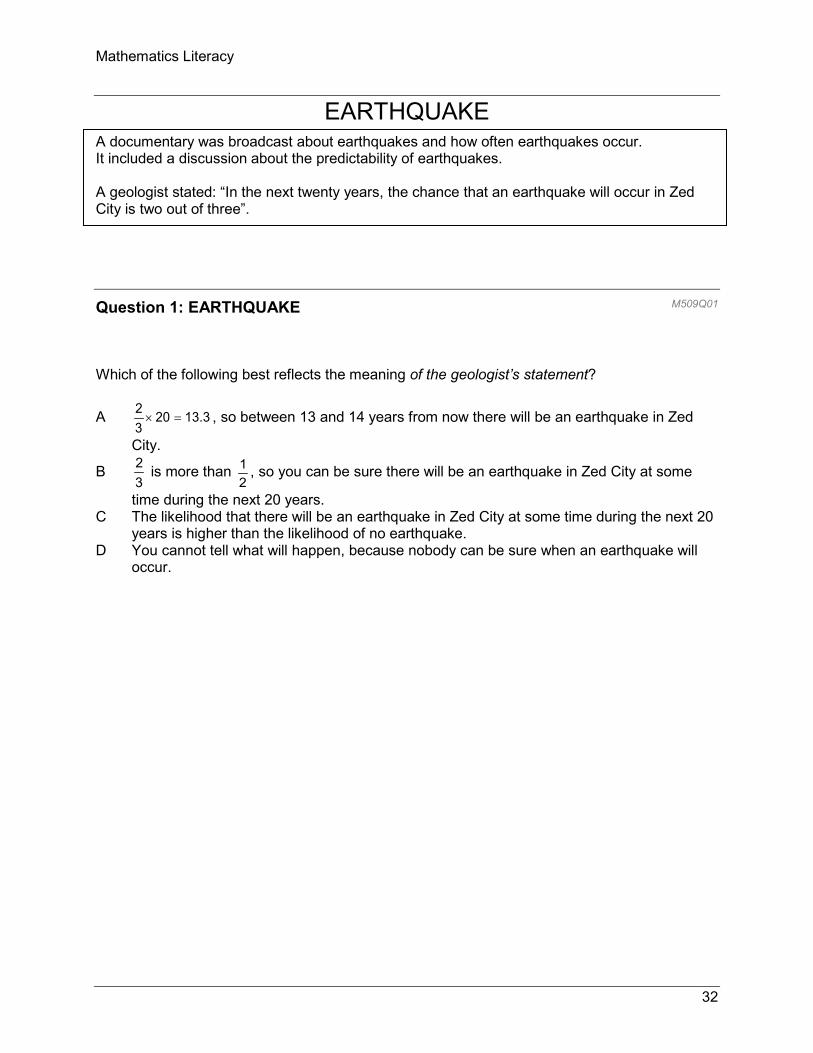
EARTHQUAKE A documentary was broadcast about earthquakes and how often earthquakes occur. It included a discussion about the predictability of earthquakes.
A geologist stated: “In the next twenty years, the chance that an earthquake will occur in Zed City is two out of three”.
Question 1: EARTHQUAKE M509Q01
Which of the following best reflects the meaning of the geologist’s statement?
A 13.32032
=× , so between 13 and 14 years from now there will be an earthquake in Zed
City.
B 32 is more than
21 , so you can be sure there will be an earthquake in Zed City at some
time during the next 20 years. C The likelihood that there will be an earthquake in Zed City at some time during the next 20
years is higher than the likelihood of no earthquake. D You cannot tell what will happen, because nobody can be sure when an earthquake will
occur.
32
Mathematics Literacy
CHOICES
In a pizza restaurant, you can get a basic pizza with two toppings: cheese and tomato. You can also make up your own pizza with extra toppings. You can choose from four different extra toppings: olives, ham, mushrooms and salami.
Ross wants to order a pizza with two different extra toppings.
Question 1: CHOICES M510Q01
How many different combinations can Ross choose from?
Answer: .................................................. combinations.
33
Mathematics Literacy
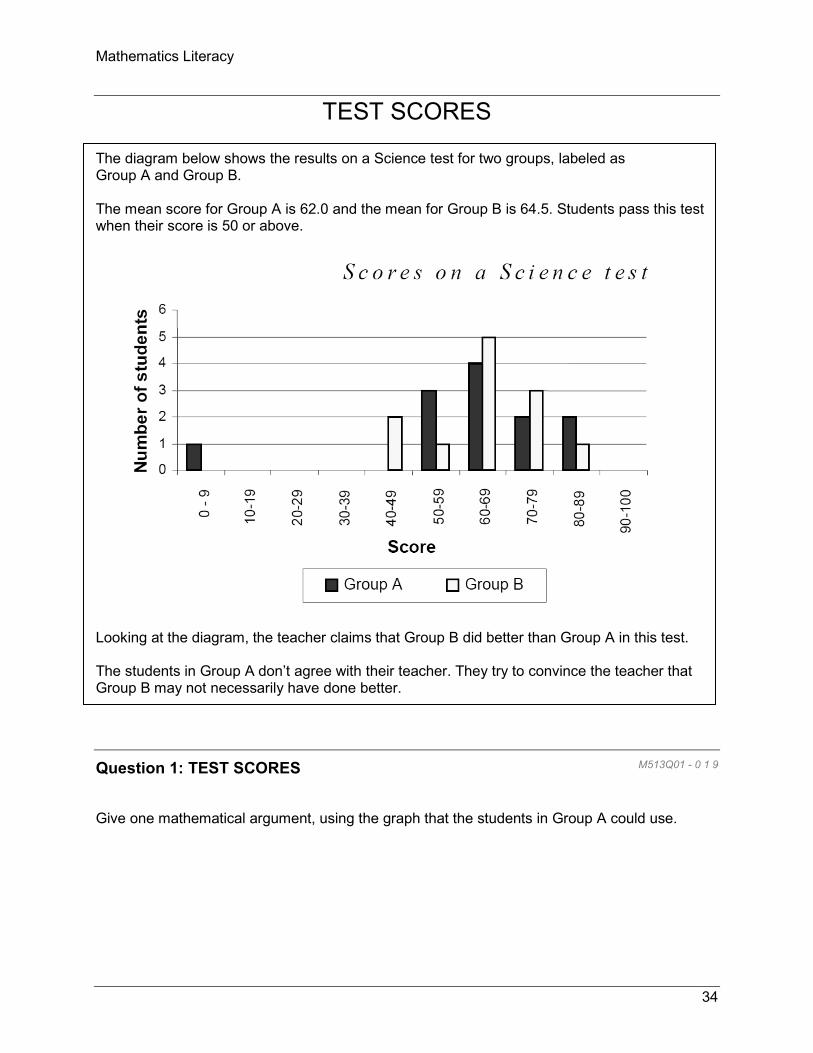
TEST SCORES
The diagram below shows the results on a Science test for two groups, labeled as Group A and Group B.
The mean score for Group A is 62.0 and the mean for Group B is 64.5. Students pass this test when their score is 50 or above.
Looking at the diagram, the teacher claims that Group B did better than Group A in this test.
The students in Group A don’t agree with their teacher. They try to convince the teacher that Group B may not necessarily have done better.
Question 1: TEST SCORES M513Q01 - 0 1 9
Give one mathematical argument, using the graph that the students in Group A could use.
34
Mathematics Literacy
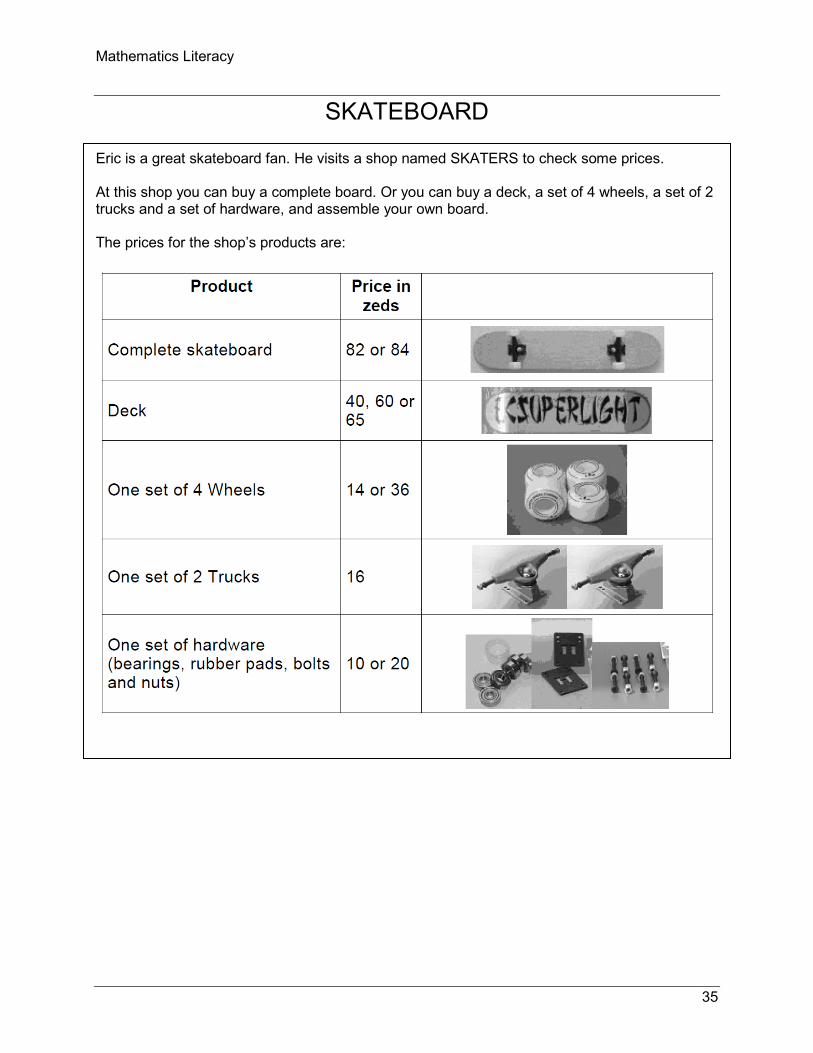
SKATEBOARD
Eric is a great skateboard fan. He visits a shop named SKATERS to check some prices.
At this shop you can buy a complete board. Or you can buy a deck, a set of 4 wheels, a set of 2 trucks and a set of hardware, and assemble your own board.
The prices for the shop’s products are:
35
Mathematics Literacy
Question 1: SKATEBOARD M520Q01a M520Q01b
Eric wants to assemble his own skateboard. What is the minimum price and the maximum price in this shop for self-assembled skateboards?
(a) Minimum price: ................................. zeds.
(b) Maximum price: ................................ zeds.
Question 2: SKATEBOARD
The shop offers three different decks, two different sets of wheels and two different sets of hardware. There is only one choice for a set of trucks.
How many different skateboards can Eric construct?
A 6 B 8 C 10 D 12
36
Mathematics Literacy
Question 3: SKATEBOARD M520Q03
Eric has 120 zeds to spend and wants to buy the most expensive skateboard he can afford.
How much money can Eric afford to spend on each of the 4 parts? Put your answer in the table below.
Part Amount (zeds) Deck
Wheels
Trucks
Hardware
37
Mathematics Literacy
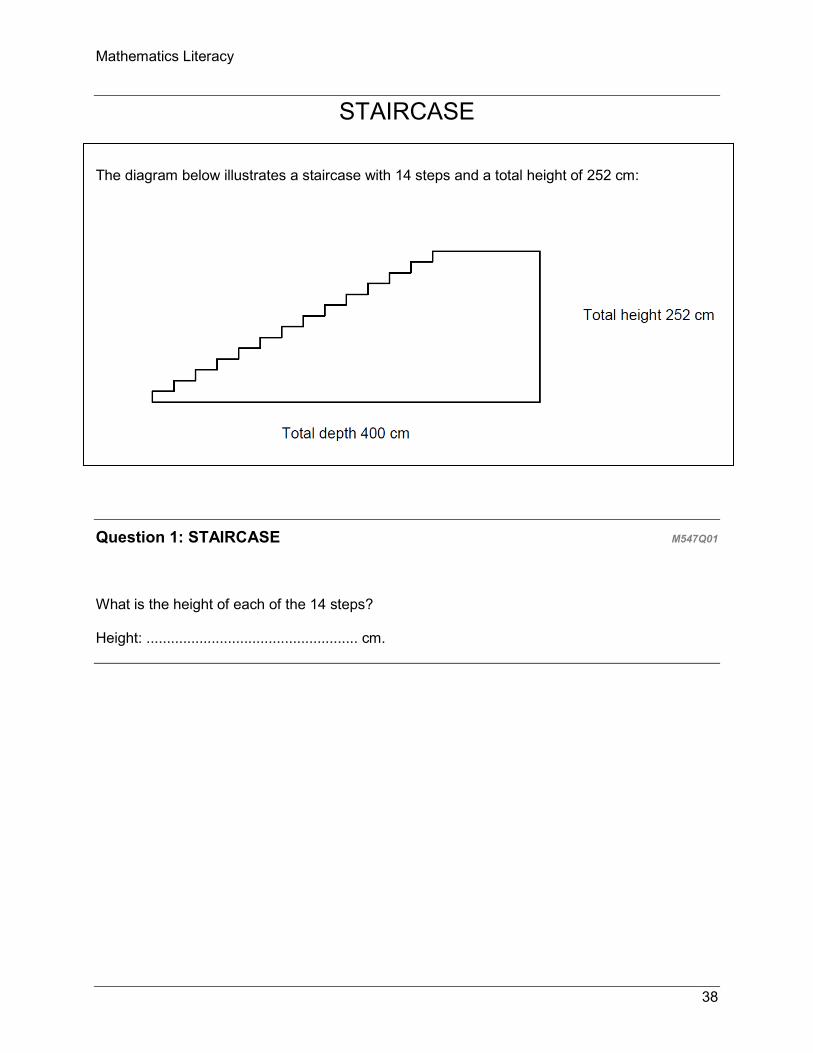
STAIRCASE
The diagram below illustrates a staircase with 14 steps and a total height of 252 cm:
Question 1: STAIRCASE M547Q01
What is the height of each of the 14 steps?
Height: .................................................... cm.
38
Mathematics Literacy
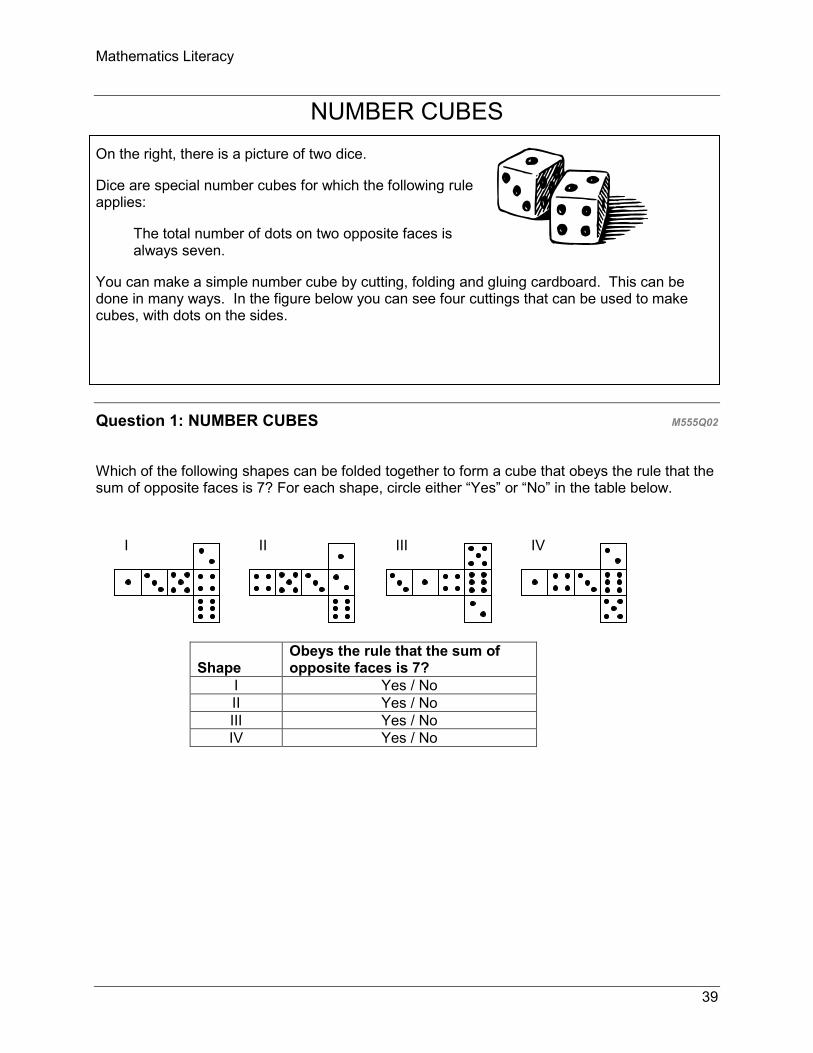
NUMBER CUBES On the right, there is a picture of two dice.
Dice are special number cubes for which the following rule applies:
The total number of dots on two opposite faces is always seven.
You can make a simple number cube by cutting, folding and gluing cardboard. This can be done in many ways. In the figure below you can see four cuttings that can be used to make cubes, with dots on the sides.
Question 1: NUMBER CUBES M555Q02
Which of the following shapes can be folded together to form a cube that obeys the rule that the sum of opposite faces is 7? For each shape, circle either “Yes” or “No” in the table below.
I II III IV
Shape Obeys the rule that the sum of opposite faces is 7?
I Yes / No II Yes / No III Yes / No IV Yes / No
39
Mathematics Literacy
SUPPORT FOR THE PRESIDENT
In Zedland, opinion polls were conducted to find out the level of support for the President in the forthcoming election. Four newspaper publishers did separate nationwide polls. The results for the four newspaper polls are shown below:
Newspaper 1: 36.5% (poll conducted on January 6, with a sample of 500 randomly selected citizens with voting rights)
Newspaper 2: 41.0% (poll conducted on January 20, with a sample of 500 randomly selected citizens with voting rights)
Newspaper 3: 39.0% (poll conducted on January 20, with a sample of 1000 randomly selected citizens with voting rights)
Newspaper 4: 44.5% (poll conducted on January 20, with 1000 readers phoning in to vote).
Question 1: SUPPORT FOR THE PRESIDENT M702Q01 - 0 1 2 9
Which newspaper’s result is likely to be the best for predicting the level of support for the President if the election is held on January 25? Give two reasons to support your answer.
40
Mathematics Literacy
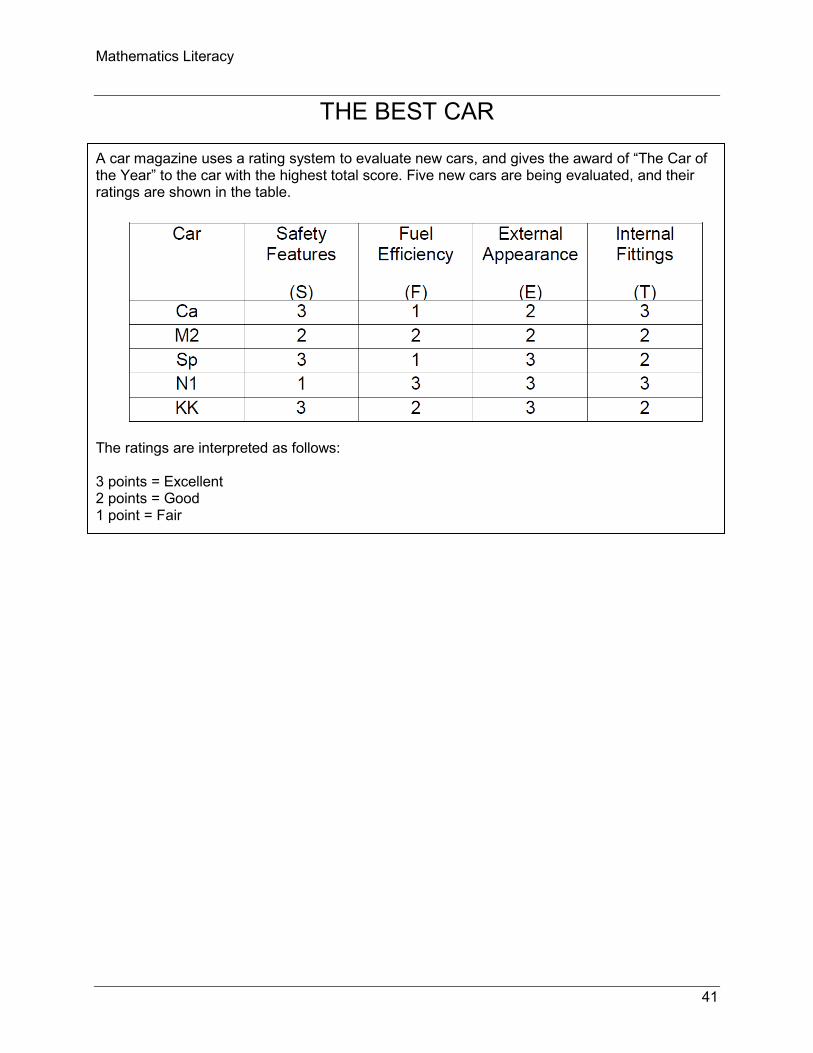
THE BEST CAR
A car magazine uses a rating system to evaluate new cars, and gives the award of “The Car of the Year” to the car with the highest total score. Five new cars are being evaluated, and their ratings are shown in the table.
The ratings are interpreted as follows:
3 points = Excellent 2 points = Good 1 point = Fair
41
Mathematics Literacy
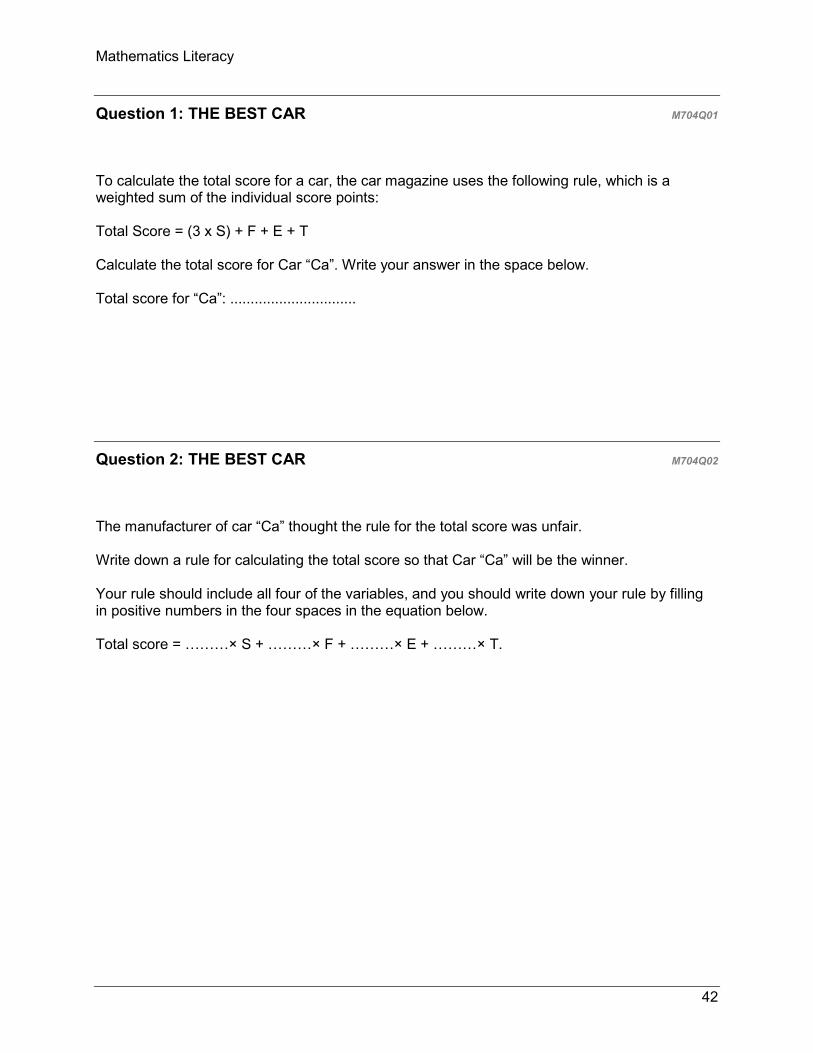
Question 1: THE BEST CAR M704Q01
To calculate the total score for a car, the car magazine uses the following rule, which is a weighted sum of the individual score points:
Total Score = (3 x S) + F + E + T
Calculate the total score for Car “Ca”. Write your answer in the space below.
Total score for “Ca”: ...............................
Question 2: THE BEST CAR M704Q02
The manufacturer of car “Ca” thought the rule for the total score was unfair.
Write down a rule for calculating the total score so that Car “Ca” will be the winner.
Your rule should include all four of the variables, and you should write down your rule by filling in positive numbers in the four spaces in the equation below.
Total score = ………× S + ………× F + ………× E + ………× T.
42
Mathematics Literacy
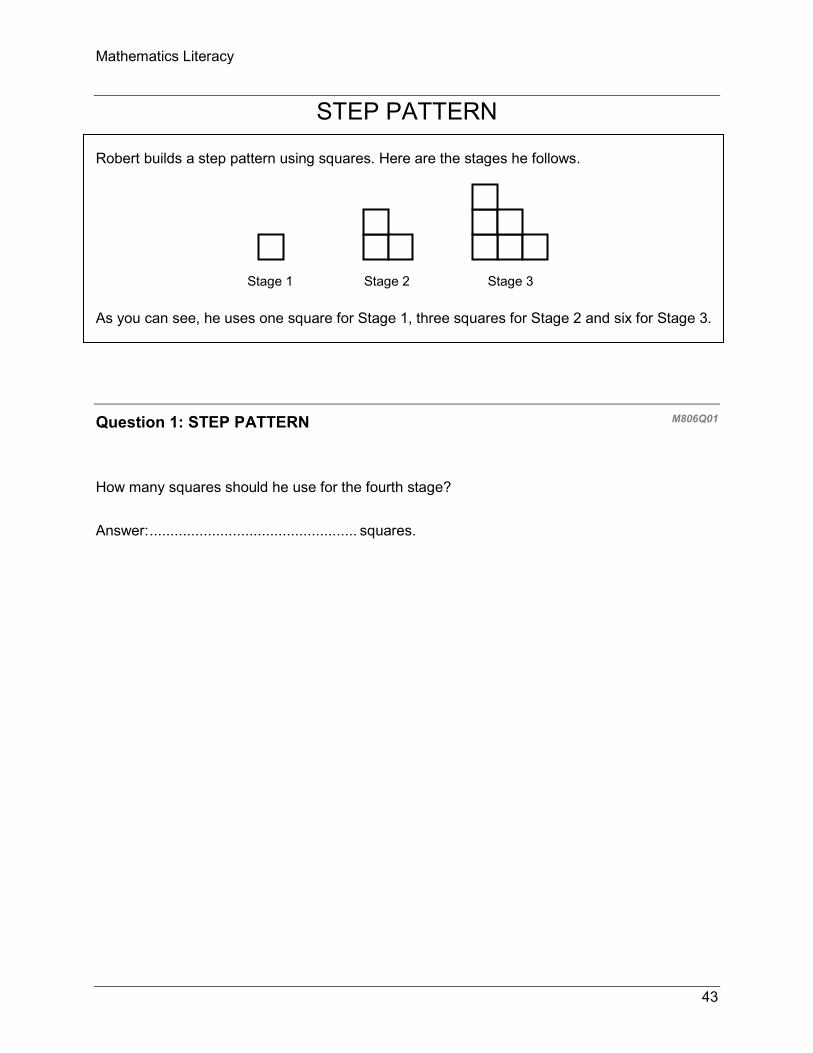
STEP PATTERN
Robert builds a step pattern using squares. Here are the stages he follows.
Stage 1 Stage 2 Stage 3
As you can see, he uses one square for Stage 1, three squares for Stage 2 and six for Stage 3.
Question 1: STEP PATTERN M806Q01
How many squares should he use for the fourth stage?
Answer: .................................................. squares.
43
Mathematics Literacy
FORECAST OF RAINFALL
Question 1: FORECAST OF RAINFALL M710Q01
On a particular day, the weather forecast predicts that from 12 noon to 6 pm the chance of rainfall is 30%.
Which of the following statements is the best interpretation of this forecast?
A 30% of the land in the forecast area will get rain. B 30% of the 6 hours (a total of 108 minutes) will have rain. C For the people in that area, 30 out of every 100 people will experience rain. D If the same prediction was given for 100 days, then about 30 days out of the 100 days will
have rain. E The amount of rain will be 30% of a heavy rainfall (as measured by rainfall per unit time).
44