pizza pizza limited management’s discussion and analysis
TRANSCRIPT

- 1 -
Pizza Pizza Limited Management’s Discussion and Analysis
This Management‟s Discussion and Analysis (“MD&A”) of the financial position and results of operations of Pizza Pizza Limited (”PPL”) covers the 13-weeks (the “Quarter”) and 52-weeks (the “Year”) ended January 1, 2017. The MD&A should be read in conjunction with PPL‟s January 1, 2017 audited consolidated financial statements and notes thereto (the “Financial Statements”). PPL prepares its Financial Statements in accordance with International Financial Reporting Standards (IFRS). The MD&A has been prepared as of March 8, 2017.
OVERVIEW PPL, a privately-owned Canadian corporation, operates two brands, Pizza Pizza and Pizza 73. PPL acquired 100% of the shares of Pizza 73, Inc. (“Pizza 73”) on July 24, 2007. Immediately following the acquisition, PPL and Pizza 73 amalgamated, continuing to operate as Pizza Pizza Limited. PPL pay a royalty to Pizza Pizza Royalty Limited Partnership (the “Partnership”) for the use of the Pizza Pizza Rights and Marks and the Pizza 73 Rights and Marks. (See “Pizza Pizza Limited and Pizza Pizza Royalty Corp.”) About the Pizza Pizza Brand Pizza Pizza restaurants operates primarily in the province of Ontario, where it dominates the pizza quick service restaurant (“QSR”) segment and is a franchise-oriented restaurant business. Of the 651 Pizza Pizza restaurants at January 1, 2017, 641 are franchised or licensed and 10 are owned and operated as corporate restaurants. Of the 651 restaurants, 228 are non-traditional locations which have limited operating hours and a limited menu. PPL provides a high level of service and operational support to its partners, including turn-key restaurants, a central food distribution centre which supplies all food and non-food items used in Pizza Pizza restaurant operations, and monitoring systems intended to ensure product and service quality and operational consistency across the chain.
PPL‟s modern restaurant system is structured to allow continuous renewal through its centrally managed renovation and re-imaging program which is funded by its franchisees. In early 2017, PPL began a major re-imaging of the restaurants‟ lobby and exterior signage. The expectation is that this project will continue for several years.
About the Pizza 73 Brand There are 101 Pizza 73 locations operating in the QSR segment, principally in the province of Alberta. Of the 76 traditional restaurants at January 1, 2017, one is franchised and 75 are jointly-owned by PPL and an independent owner/operator. There are 25 non-traditional locations which have limited operating hours and a limited menu. Pizza 73 has five traditional locations outside of Alberta; three in Saskatchewan and two in British Columbia. Sales through its centralized call centre and on-line ordering, together, account for approximately 90% of Pizza 73‟s system sales. The Pizza 73 business also includes two central food distribution centres. Background PPL has three distinct revenue sources: food and beverage sales, receipt of royalty payments, and profits from the 50% ownership in the Pizza 73 restaurants. These are driven by changes in retail system sales at franchised, jointly controlled and company restaurants. Changes in retail system sales are driven by economic conditions, marketing initiatives and the number of stores. PPL monitors these metrics closely, as they directly impact its revenues and profits, and PPL strives to consistently increase the related amounts. PPL devotes significant attention to its innovative marketing programs which are funded by the restaurant operators‟ contribution to a marketing fund that is administered by PPL. In accordance with their franchise
PIZZA PIZZA LIMITED MANAGEMENT’S DISCUSSION AND ANALYSIS For the 13-week period from October 3, 2016 to January 1, 2017 and the 52-week period from January 4, 2016 to January 1, 2017
- 2 -
or operating agreements, each traditional Pizza Pizza restaurant contributes approximately 6% of system sales (in addition to the base royalty and other franchise fees) and each traditional Pizza 73 restaurant contributes approximately 8% of system sales.
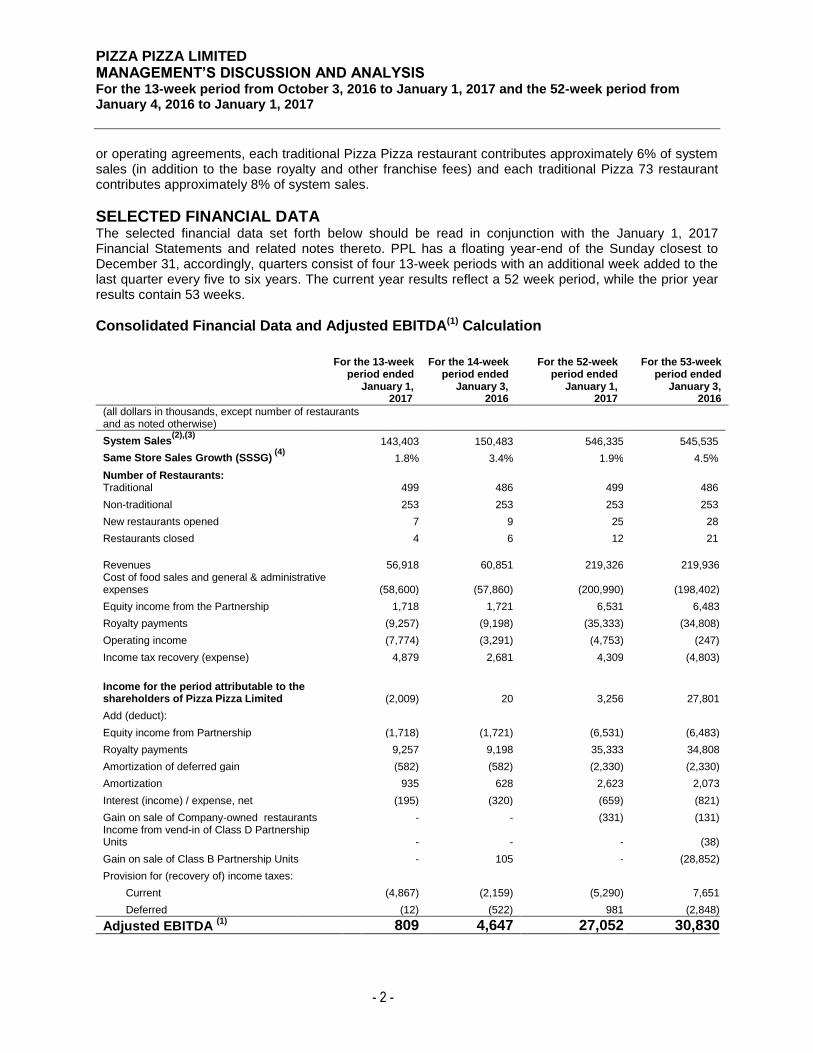
SELECTED FINANCIAL DATA The selected financial data set forth below should be read in conjunction with the January 1, 2017 Financial Statements and related notes thereto. PPL has a floating year-end of the Sunday closest to December 31, accordingly, quarters consist of four 13-week periods with an additional week added to the last quarter every five to six years. The current year results reflect a 52 week period, while the prior year results contain 53 weeks.
Consolidated Financial Data and Adjusted EBITDA(1) Calculation
For the 13-week period ended
January 1, 2017
For the 14-week period ended
January 3, 2016
For the 52-week period ended
January 1, 2017
For the 53-week period ended
January 3, 2016
(all dollars in thousands, except number of restaurants and as noted otherwise)
System Sales(2),(3)
143,403 150,483 546,335 545,535
Same Store Sales Growth (SSSG) (4)
1.8% 3.4% 1.9% 4.5%
Number of Restaurants: Traditional 499 486 499 486
Non-traditional 253 253 253 253
New restaurants opened 7 9 25 28
Restaurants closed 4 6 12 21
Revenues 56,918 60,851 219,326 219,936 Cost of food sales and general & administrative expenses (58,600) (57,860) (200,990) (198,402)
Equity income from the Partnership 1,718 1,721 6,531 6,483
Royalty payments (9,257) (9,198) (35,333) (34,808)
Operating income (7,774) (3,291) (4,753) (247)
Income tax recovery (expense) 4,879 2,681 4,309 (4,803)
Income for the period attributable to the shareholders of Pizza Pizza Limited (2,009) 20 3,256 27,801
Add (deduct):
Equity income from Partnership (1,718) (1,721) (6,531) (6,483)
Royalty payments 9,257 9,198 35,333 34,808
Amortization of deferred gain (582) (582) (2,330) (2,330)
Amortization 935 628 2,623 2,073
Interest (income) / expense, net (195) (320) (659) (821)
Gain on sale of Company-owned restaurants - - (331) (131) Income from vend-in of Class D Partnership Units - - - (38)
Gain on sale of Class B Partnership Units - 105 - (28,852)
Provision for (recovery of) income taxes:
Current (4,867) (2,159) (5,290) 7,651
Deferred (12) (522) 981 (2,848)
Adjusted EBITDA (1)
809 4,647 27,052 30,830

PIZZA PIZZA LIMITED MANAGEMENT’S DISCUSSION AND ANALYSIS For the 13-week period from October 3, 2016 to January 1, 2017 and the 52-week period from January 4, 2016 to January 1, 2017
- 3 -
Notes: (1) „„EBITDA‟‟ is not a recognized measure under IFRS. References to EBITDA are to earnings determined in accordance with
IFRS applicable to the financial statements before amounts for interest, taxes and depreciation and amortization. In addition, PPL has adjusted EBITDA for unusual charges in an attempt to demonstrate PPL operations as if a recombination of PPL and Pizza Pizza Royalty Corp. (“PPRC”) occurred. Adjusted EBITDA excludes gains and losses on sales of assets and other items resulting from its relationship with the Partnership. PPL believes that, in addition to net earnings, adjusted EBITDA is a useful supplemental measure in evaluating its performance as it provides investors with an indication of cash available for debt service, working capital needs and capital expenditures. Investors are cautioned, however, that adjusted EBITDA should not be construed as an alternative to the statement of cash flows as a measure of liquidity and cash flows. The method of calculating adjusted EBITDA for the purposes of this MD&A may differ from that used by other issuers and, accordingly, adjusted EBITDA in this MD&A may not be comparable to adjusted EBITDA used by other issuers.
(2) PPL has a floating year-end of the Sunday closest to December 31, accordingly, interim periods consist of four 13-week periods with an additional week added to the last interim period every 5 to 6 years. A 53
rd week was added to fiscal 2015
resulting in the year ending on January 3, 2016. (3) System Sales reported by Pizza Pizza and Pizza 73 restaurants include the gross sales of Pizza Pizza company-owned,
jointly-controlled and franchised restaurants, excluding sales and goods and service tax or similar amounts levied by any governmental or administrative authority. System Sales do not represent the consolidated operating results of PPL.
(4) Same store sales growth (“SSSG”) is not a recognized measure under IFRS. References to SSSG are to the changes in period gross revenue of Pizza Pizza and Pizza 73 restaurants as compared to sales in the previous period, where the restaurant has been open at least 13 months. Additionally, for a Pizza 73 restaurant whose restaurant territory was adjusted due to an additional restaurant, the sales used to derive the Step-Out Payment may be added to sales to arrive at SSSG. SSSG does not have any standardized meaning under IFRS. Therefore, these figures may not be comparable to similar figures presented by other companies. (See “Same Store Sales Growth”).
RESULTS OF OPERATIONS The following should be read in conjunction with the Selected Financial Data provided herein and in conjunction with the Financial Statements of PPL for the 52-week period ended January 1, 2017. See “Critical Accounting Policies and Estimates”. Readers should note that the 2016 results are not directly comparable to the 2015 results because of an extra week in 2015 due to the floating year-end. System Sales
(in thousands of dollars)
For the 13-week period ended
January 1, 2017
For the 14-week period ended
January 3, 2016
For the 52-week period ended
January 1, 2017
For the 53-week period ended
January 3, 2016
Pizza Pizza 120,329 125,117 459,666 451,089
Pizza 73 23,074 25,366 86,669 94,446
Total 143,403 150,483 546,335 545,535
System sales at both brands decreased when compared to the same quarter in 2015. The decrease in system sales is attributable to the current period containing one less week of sales; approximately $9.6 million for Pizza Pizza and $2.3 million for Pizza 73. For the Year, Pizza Pizza sales increased over 2015, while Pizza 73 sales decreased when compared to 2015. System sales for the Year were affected by net new store additions and the SSSG achieved during the Year. See “Same Store Sales Growth”.

PIZZA PIZZA LIMITED MANAGEMENT’S DISCUSSION AND ANALYSIS For the 13-week period from October 3, 2016 to January 1, 2017 and the 52-week period from January 4, 2016 to January 1, 2017
- 4 -
Same Store Sales Growth (“SSSG”) SSSG increased by 1.8% (3.4% - 2015) for the Quarter and 1.9% (4.5% - 2015) for the Year when compared to the same periods in 2015. SSSG is not affected by the additional day during the leap year, as SSSG is calculated using a 13-week comparative basis.
SSSG
Fourth Quarter (%)
Year to Date (%)
2016 2015 2016 2015 Pizza Pizza 2.3 5.3 3.3 5.2
Pizza 73 (0.9) (5.3) (5.2) 1.1
Combined 1.8 3.4 1.9 4.5
SSSG is driven by the growth in the average customer check and in customer traffic, both of which are affected by changes in pricing and sales mix. During the Quarter and for the Year, the average check increased while customer traffic decreased when compared to the same periods last year, on a consolidated basis. The increase in the average check works to increase restaurant profitability and is a result of creative promotional activity and selective menu price increases. The decrease in traffic is largely due to a decline at the Pizza 73 brand related to the weakened Alberta economy, however a portion of the decline is directly related to certain menu price increases taken at Pizza Pizza restaurants which adversely impacted traffic. PPL‟s management believes that geographic diversification has proven to be key to consistent, overall Royalty Pool sales growth. SSSG is a key indicator used by PPL to measure performance against internal targets and prior period results. SSSG is commonly used by financial analysts and investors to compare PPL to other QSR brands. SSSG is defined as the change in period gross revenue of Pizza Pizza and Pizza 73 restaurants as compared to sales in the previous comparative period, where the restaurant has been open at least 13 months. Additionally, for a Pizza 73 restaurant whose restaurant territory was adjusted due to an additional restaurant, a Step-Out Payment may be added to sales to arrive at SSSG. It is a key performance indicator for PPL as this measure excludes sales fluctuations due to store closings, permanent relocations and chain expansion.
(in thousands of dollars)
For the 13-week period ended
January 1, 2017
For the 14-week period ended
January 3, 2016
For the 52-week period ended
January 1, 2017
For the 53-week period ended
January 3, 2016
Total System Sales 143,403 150,483 546,335 545,535 Adjustments for stores opened less
than 13 months, and Step-Out payments (2,307) (846) (6,518) (4,523)
Sales for the 53rd week of PPL‟s 2015 year end 11,228 - 11,228 -
Same Store Sales 152,324 149,637 551,045 541,012
SSSG 1.8% 3.4% 1.9% 4.5%

PIZZA PIZZA LIMITED MANAGEMENT’S DISCUSSION AND ANALYSIS For the 13-week period from October 3, 2016 to January 1, 2017 and the 52-week period from January 4, 2016 to January 1, 2017
- 5 -
New Restaurant Development
For the 13-week period ended
January 1, 2017
Pizza Pizza Pizza 73 PPL
(Number of Restaurants)1 Traditional Non-traditional Total Traditional Non-traditional Total Grand Total
As at October 2, 2016 419 229 648 75 26 101 749 Openings 4 2 6 1 - 1 7 Closings - (3) (3) - 1 (1) (4)
As at January 1, 2017 423 228 651 76 25 101 752
For the 14-week period ended January 3, 2016
Pizza Pizza Pizza 73 PPL
(Number of Restaurants) 1 Traditional Non-traditional Total Traditional Non-traditional Total Grand Total
As at September 27, 2015 411 222 633 74 29 103 736 Openings 2 5 7 1 1 2 9 Closings (2) (2) (4) - (2) (2) (6)
As at January 3, 2016 411 225 636 75 28 103 739
For the Quarter, PPL continued its national expansion of traditional Pizza Pizza restaurants within Canada, by opening four traditional restaurants; one in Saskatchewan and three in Quebec. PPL opened one traditional Pizza 73 restaurant in Alberta.
For the 52-week period ended
January 1, 2017
Pizza Pizza Pizza 73 PPL
(Number of Restaurants)1 Traditional Non-traditional Total Traditional Non-traditional Total Grand Total
As at January 3, 2016 411 225 636 75 28 103 739 Openings 12 11 23 1 1 1 2 25 Closings - (8) (8) - (4) (4) (12)
As at January 1, 2017 423 228 651 76 25 101 752
For the 53-week period ended January 3, 2016
Pizza Pizza Pizza 73 PPL
(Number of Restaurants) 1 Traditional Non-traditional Total Traditional Non-traditional Total Grand Total
As at December 28, 2014 408 222 630 74 28 102 732 Openings 5 19 24 2 2 4 28 Closings (2) (16) (18) (1) (2) (3) (21)
As at January 3, 2016 411 225 636 75 28 103 739
For the Year, PPL opened 12 traditional Pizza Pizza restaurants; seven in Quebec, three in Ontario and one each in Manitoba and Saskatchewan, respectively. PPL opened one traditional Pizza 73 restaurant in Alberta. Of the 423 traditional Pizza Pizza restaurants, 10 are operated as company stores (2015 – 13). Of the 76 Pizza 73 traditional restaurants, 75 are operated as independent businesses, equally owned by PPL and
1 Number of restaurants added to the Royalty Pool each year may differ from the number of restaurant openings and closings
reported by PPL on an annual basis as the periods for which they are reported differ slightly.

PIZZA PIZZA LIMITED MANAGEMENT’S DISCUSSION AND ANALYSIS For the 13-week period from October 3, 2016 to January 1, 2017 and the 52-week period from January 4, 2016 to January 1, 2017
- 6 -
an owner/operator and one is operated as a franchised restaurant (2015 – 74 jointly-controlled and 1 company owned). Segmented Reporting As previously discussed, PPL operates two brands. While each brand operates in a similar market segment, the pizza QSR segment, they are in different geographic markets of Canada. Pizza Pizza operates mainly in the Ontario and Quebec (“Eastern Canada”) pizza QSR segment, whereas Pizza 73 operates mainly in the Alberta (“Western Canada”) pizza QSR segment. The following discussion offers further details regarding PPL‟s segmented results, prior to eliminations, which represent adjustments required to reconcile PPL‟s segmented reporting to the Financial Statements. Revenues
Food Sales
(in thousands of dollars)
For the 13-week period ended
January 1, 2017
For the 14-week period ended
January 3, 2016
% change
For the 52-week period ended
January 1, 2017
For the 53-week period ended
January 3, 2016 % change
Pizza Pizza 48,949 52,508 (6.8%) 189,063 189,521 (0.2%)
Pizza 73 10,831 12,017 (9.9%) 41,153 45,249 (9.1%)
Eliminations2 (10,831) (11,878) (40,994) (44,723)
Total 48,949 52,647 (7.0%) 189,222 190,047 (0.4%)
Food sales for both geographic markets are driven by SSSG, and change in the number of stores in the period. The decrease in food sales in the Quarter and Year is due to one less week of operating results in 2016 relative to the comparative periods of 2015. Excluding the impact of the one week differential, food sales in Eastern Canada for the Quarter and Year increased as a result of the 2.3% and 3.3% SSSG, respectively, plus the opening of a net, three Pizza Pizza restaurants during the Quarter and net, 15 restaurants in the Year. For Western Canada, on an adjusted basis, food sales decreased for the Quarter and Year, directly attributable to the negative SSSG of 0.9% and 5.2%, respectively. See “Same Store Sales Growth” and “New Restaurant Development”.
Royalties, franchise fees and other revenue
(in thousands of dollars)
For the 13-week period ended
January 1, 2017
For the 14-week period ended
January 3, 2016
% change
For the 52-week period ended
January 1, 2017
For the 53-week period ended
January 3, 2016 % change
Pizza Pizza 7,195 7,404 (2.8%) 27,287 26,883 1.5%
Pizza 73 774 800 (3.3%) 2,817 3,006 (6.3%)
Total 7,969 8,204 (2.9%) 30,104 29,889 0.7%
Royalties, franchise fees and other revenue for both geographic markets are driven by SSSG and movement in the number of stores. Royalties, franchise fees, and other revenue decreased during the Quarter. The decrease is driven by the Quarter containing one less week of system sales, translating into less revenue for the period.
2 The “Eliminations” row represents adjustments to the Pizza 73 joint ventures as required under IFRS 11.

PIZZA PIZZA LIMITED MANAGEMENT’S DISCUSSION AND ANALYSIS For the 13-week period from October 3, 2016 to January 1, 2017 and the 52-week period from January 4, 2016 to January 1, 2017
- 7 -
Excluding the impact of the one week differential, for the Year, the increase in royalty, franchise fee and other revenue in Eastern Canada is directly attributable to the 3.3% SSSG and the opening of 15, net, Pizza Pizza restaurants. In Western Canada, the decrease in revenue for the Year is attributable to the negative 5.2% SSSG. See “Same Store Sales Growth” and “New Restaurant Development”. Cost of Food Sales
(in thousands of dollars)
For the 13-week period ended
January 1, 2017
For the 14-week period ended
January 3, 2016 % change
For the 52-week period ended
January 1, 2017
For the 53-week period ended
January 3, 2016 % change
Pizza Pizza 39,321 42,006 (6.4%) 152,134 151,332 0.5%
Pizza 73 3,828 4,371 (12.4%) 15,039 16,651 (9.7%)
Eliminations3 (3,828) (4,257) (14,973) (16,431)
Total 39,321 42,120 (6.6%) 152,200 151,552 0.4%
For the Quarter, cost of food sales decreased when compared to the prior year comparative quarter. The decrease reflects the Quarter containing one less week. For the Year, cost of food sales in Eastern Canada increased mainly due to the 3.3% SSSG and the opening of 15, net, Pizza Pizza restaurants, offset by one less week of operations. For Western Canada, the decrease in cost of food sales is directly attributable to one less week of operations, as well as a decline in food sales resulting from negative 5.2% SSSG. PPL continued to leverage its buying power and manage food costs through its centralized purchasing system. General and Administrative (“G&A”) Expenses
(in thousands of dollars)
For the 13-week period ended
January 1, 2017
For the 14-week period ended
January 3, 2016 % change
For the 52-week period ended
January 1, 2017
For the 53-week period ended
January 3, 2016 % change
Pizza Pizza 18,960 15,587 21.6% 46,800 44,749 4.6%
Pizza 73 5,282 5,916 (10.7%) 19,689 21,203 (7.1%)
Eliminations3 (4,963) (5,763) (17,699) (19,102)
Total 19,279 15,740 22.4% 48,790 46,850 4.1%
G&A expenses include corporate expenses and company store expenses. The G&A expenses in Eastern
Canada increased in the Quarter and Year. The increase is mainly attributed to a provision of $10.0
million against various franchisee receivables, partially offset with one less week of operations in 2016
relative to the comparative periods of 2015. The decrease in G&A expenses for Western Canada, for the
Quarter and Year, is mainly driven by one less week of operations in 2016 relative to the comparative
periods of 2015.
3 The “Eliminations” row represents adjustments to the Pizza 73 joint ventures as required under IFRS 11.

PIZZA PIZZA LIMITED MANAGEMENT’S DISCUSSION AND ANALYSIS For the 13-week period from October 3, 2016 to January 1, 2017 and the 52-week period from January 4, 2016 to January 1, 2017
- 8 -
Royalty Payments
(in thousands of dollars)
For the 13-week period ended
January 1, 2017
For the 14-week period ended
January 3, 2016 % change
For the 52-week period ended
January 1, 2017
For the 53-week period ended
January 3, 2016 % change
Pizza Pizza 7,170 7,057 1.6% 27,414 26,474 3.6%
Pizza 73 2,087 2,141 (2.5%) 7,919 8,334 (5.0%)
Total 9,257 9,198 0.6% 35,333 34,808 1.5%
As per the Licence & Royalty Agreements, PPL pays the Partnership a monthly royalty based on the system sales of the Pizza Pizza and Pizza 73 restaurants in the Royalty Pool. For the Quarter and Year, the variance in royalty payments for both regions is due to the SSSG (see “Same Store Sales Growth”) plus net, new restaurants added to the Royalty Pool on January 1,
2016.
Additionally, for the Year, royalty expense reflects an extra day of sales in February 2016 due to the leap year. Equity income from Pizza Pizza Royalty Limited Partnership PPL accounts for its investment in the Partnership using the equity method of accounting. As at January 1, 2017, PPL owned an effective 21.1% interest in the Partnership. PPL‟s 21.1% interest in the earnings of the Partnership is through its ownership of Class B and Class D Units. (See “Pizza Pizza Limited and Pizza Pizza Royalty Corp.”). For the Quarter, equity income earned was consistent at $1.7 million when compared to the prior year‟s comparative quarter. For the Year, PPL‟s share of equity income from the Partnership remained consistent at $6.5 million for the Year when compared to 2015. Equity income from Jointly-controlled companies For the Quarter, equity income earned was $1.5 million, compared to $1.2 million in the prior year‟s comparable quarter. The increase in equity income for the Quarter is due lower management fee expenses charged to the jointly controlled companies. For the Year, equity income earned was $5.4 million, compared to $6.4 million for 2015. The decrease in equity income reflects lower Pizza 73 system sales as a direct result of the weakened Alberta economy. On May 1, 2016, PPL sold 50% of its ownership in one fully-owned, Pizza 73 restaurant, converting the restaurant from corporately-owned to jointly-controlled company, thereby, increasing the number of jointly-controlled companies to 75 (2015 – 74). Jointly-controlled companies are joint ventures, consisting of PPL‟s 50% interest in Pizza 73 restaurants. Gain on Sale of Company Restaurants and Jointly-Controlled Restaurants For the Quarter and the prior year comparable quarter, no company restaurants were sold. For the Year, five Pizza Pizza company restaurants and a 50% interest in a corporate Pizza 73 restaurant were sold for a gain of $331,000, compared to the prior year period during which PPL sold six company restaurants for a net gain of $131,000. Interest and Other Income Interest and other income earned by PPL increased to $325,000 for the Quarter compared to $201,000 for the comparable quarter of 2015. The increase for the Quarter is mainly due to higher notes receivable in the Quarter, compared to the comparative quarter of 2015. For the Year, interest and other income earned by PPL was $1.4 million compared to $1.7 million for the prior year comparable period. During

PIZZA PIZZA LIMITED MANAGEMENT’S DISCUSSION AND ANALYSIS For the 13-week period from October 3, 2016 to January 1, 2017 and the 52-week period from January 4, 2016 to January 1, 2017
- 9 -
2016, PPL redeemed $16.0 million in short-term investments. The redemption of the GICs resulted in lower interest income. Current income tax expense (recovery) Current income tax recovery for the Quarter was $4.9 million compared to a recovery of $2.2 million for the comparative quarter of 2015. For the Year, current income tax recovery was $5.3 million compared to an expense of $7.7 million for the same period in 2015. The current income tax recovery is largely due to a provision against various franchisee receivables in the Quarter. In 2015, a significant current income tax expense was realized on the gain associated with the sale of 2.8 million Class B Partnership Units.
Deferred tax expense Deferred tax expense for the Quarter was $12,000 compared to $522,000 for the comparable quarter in 2015. For the Quarter the decrease in deferred tax expense is due to higher undepreciated capital cost in the Quarter compared to the same period in 2015. For the Year, deferred tax expense was $981,000 compared to a deferred tax recovery of $2.8 million in 2015. The increase in expense for the Year is due to significant future tax recovery on the sale of Class B Partnership Units in 2015, which did not recur in 2016. Net Income PPL reported a net loss for the Quarter of $2.0 million compared to earnings of $20,000 in the 2015 comparable quarter. The decrease in earnings is directly attributed to a provision against various franchisee receivables, partially offset by an income tax recovery on the provision. For the Year, earnings were $3.3 million compared to $27.8 million in 2015. The year over year decrease in earnings is attributed to the $29.0 million gain on sale of 2.8 million Class B Partnership Units in 2015. Shareholders’ Deficiency The $96.6 million shareholders‟ deficiency shown in the Financial Statements is largely a result of PPL having paid $107.5 million in capital dividends to shareholders in 2005, $16.8 million in capital dividends in 2007, $7.2 million in capital dividends in 2012, and $39.0 million in capital dividends in 2015. The source of dividends to shareholders was the proceeds received from the Partnership in payment for the PPL Rights & Marks in 2005, funds from operations since 2005, and proceeds from the sale of Class B Partnership Units in 2015. The balance of the deferred gain from the 2005 sale of the PPL Rights & Marks is $203.9 million as at January 1, 2017 and is being amortized into earnings over a term of 99 years.
SUMMARY OF QUARTERLY RESULTS
The Pizza Pizza and Pizza 73 restaurants are subject to seasonal variations in their business; system sales for the quarter ended March 31 have generally been the softest and the December 31 quarter system sales have been the strongest.
13 weeks ended
January 1, 2017
13 weeks ended
October 2, 2016
13 weeks ended July 3, 2016
13 weeks ended April 3, 2016
14 weeks ended
January 3, 2016
13 weeks ended
September 27, 2015
13 weeks ended
June 28, 2015
13 weeks ended
March 29, 2015
(in thousands of dollars) Revenues $ 57,278 $ 54,270 $ 54,004 $ 54,134 $ 60,851 $ 54,063 $ 52,835 $ 52,187 Net income (loss) (2,009) $ 2,102 $ 1,673 $ 1,490 $ 20 $ 1,288 $ 1,349 $ 25,144 Adjusted EBITDA 809 $ 9,423 $ 8,239 $ 8,581 $ 4,647 $ 8,992 $ 7,734 $ 9,457
PIZZA PIZZA LIMITED MANAGEMENT’S DISCUSSION AND ANALYSIS For the 13-week period from October 3, 2016 to January 1, 2017 and the 52-week period from January 4, 2016 to January 1, 2017
- 10 -
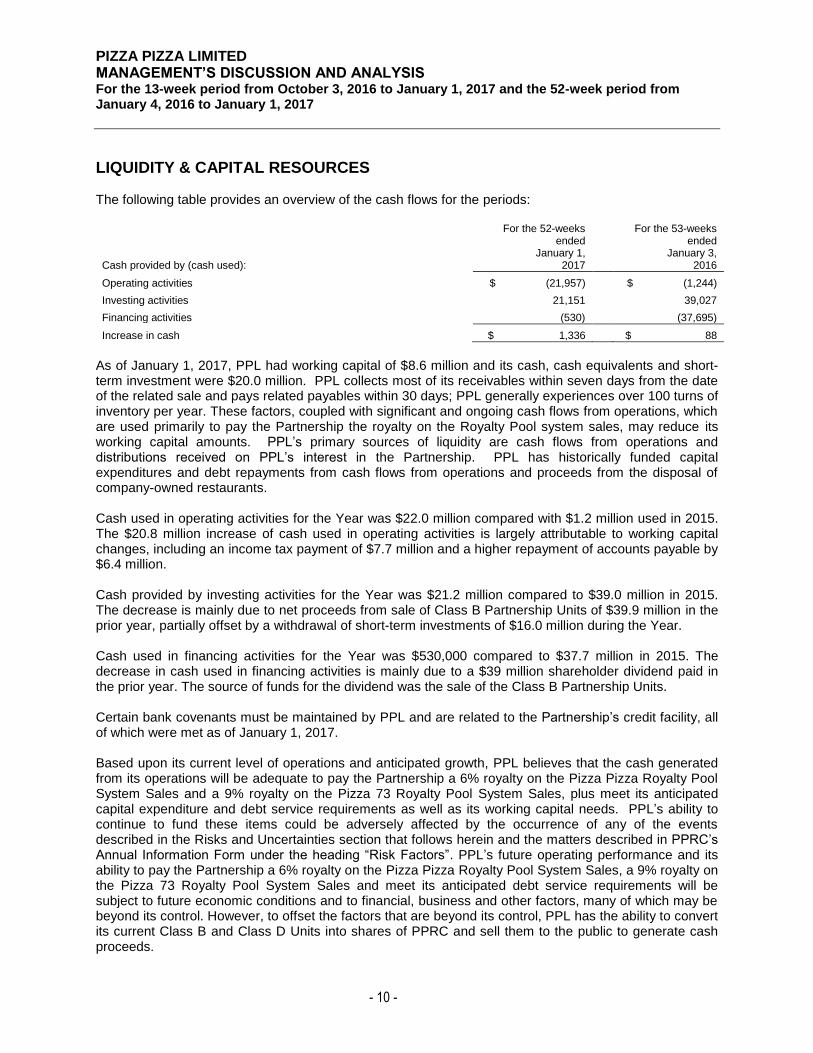
LIQUIDITY & CAPITAL RESOURCES The following table provides an overview of the cash flows for the periods:
Cash provided by (cash used):
For the 52-weeks ended
January 1, 2017
For the 53-weeks ended
January 3, 2016
Operating activities $ (21,957) $ (1,244)
Investing activities 21,151 39,027
Financing activities (530) (37,695)
Increase in cash $ 1,336 $ 88
As of January 1, 2017, PPL had working capital of $8.6 million and its cash, cash equivalents and short-term investment were $20.0 million. PPL collects most of its receivables within seven days from the date of the related sale and pays related payables within 30 days; PPL generally experiences over 100 turns of inventory per year. These factors, coupled with significant and ongoing cash flows from operations, which are used primarily to pay the Partnership the royalty on the Royalty Pool system sales, may reduce its working capital amounts. PPL‟s primary sources of liquidity are cash flows from operations and distributions received on PPL‟s interest in the Partnership. PPL has historically funded capital expenditures and debt repayments from cash flows from operations and proceeds from the disposal of company-owned restaurants. Cash used in operating activities for the Year was $22.0 million compared with $1.2 million used in 2015. The $20.8 million increase of cash used in operating activities is largely attributable to working capital changes, including an income tax payment of $7.7 million and a higher repayment of accounts payable by $6.4 million. Cash provided by investing activities for the Year was $21.2 million compared to $39.0 million in 2015. The decrease is mainly due to net proceeds from sale of Class B Partnership Units of $39.9 million in the prior year, partially offset by a withdrawal of short-term investments of $16.0 million during the Year. Cash used in financing activities for the Year was $530,000 compared to $37.7 million in 2015. The decrease in cash used in financing activities is mainly due to a $39 million shareholder dividend paid in the prior year. The source of funds for the dividend was the sale of the Class B Partnership Units. Certain bank covenants must be maintained by PPL and are related to the Partnership‟s credit facility, all of which were met as of January 1, 2017. Based upon its current level of operations and anticipated growth, PPL believes that the cash generated from its operations will be adequate to pay the Partnership a 6% royalty on the Pizza Pizza Royalty Pool System Sales and a 9% royalty on the Pizza 73 Royalty Pool System Sales, plus meet its anticipated capital expenditure and debt service requirements as well as its working capital needs. PPL‟s ability to continue to fund these items could be adversely affected by the occurrence of any of the events described in the Risks and Uncertainties section that follows herein and the matters described in PPRC‟s Annual Information Form under the heading “Risk Factors”. PPL‟s future operating performance and its ability to pay the Partnership a 6% royalty on the Pizza Pizza Royalty Pool System Sales, a 9% royalty on the Pizza 73 Royalty Pool System Sales and meet its anticipated debt service requirements will be subject to future economic conditions and to financial, business and other factors, many of which may be beyond its control. However, to offset the factors that are beyond its control, PPL has the ability to convert its current Class B and Class D Units into shares of PPRC and sell them to the public to generate cash proceeds.

PIZZA PIZZA LIMITED MANAGEMENT’S DISCUSSION AND ANALYSIS For the 13-week period from October 3, 2016 to January 1, 2017 and the 52-week period from January 4, 2016 to January 1, 2017
- 11 -
OFF-BALANCE SHEET ARRANGEMENTS PPL is a sublessor under the head lease for all restaurant locations, other than locations operated by certain licensees. Should franchisees fail to meet their obligations under the terms of their sublease, PPL would become liable for the obligations under the related head leases. The gross lease obligations are summarized in the following table: Payments due by Period 2017 2018 2019 2020 2021 Thereafter
(in thousands of dollars)
Minimum lease obligation 33,616 30,639 24,886 18,318 12,812 29,417
Less: Sublease to franchisees 27,715 24,343 20,795 16,542 11,321 19,663
Net lease obligation 5,901 6,296 4,091 1,776 1,491 9,754
PPL has provided certain guarantees as disclosed in note 16 of the Financial Statements with respect to certain franchisee loans. PPL believes that guarantees of franchisee loans are a low risk since PPL has, historically, been able to replace a defaulting franchisee with a new franchisee who has assumed the obligations of the defaulting franchisee.
PIZZA PIZZA LIMITED AND PIZZA PIZZA ROYALTY CORP.
Pizza Pizza Royalty Corp., (“PPRC” or the “Company”), has licensed the Pizza Pizza Rights and Marks to PPL, for which PPL pays a 6% royalty on the system sales of those Pizza Pizza restaurants included in the specific listing of restaurants referred to as the “Royalty Pool” (as described under “Royalty Pool Adjustments”). There are 636 Pizza Pizza restaurants in the Royalty Pool for 2016.
In July 2007, the Partnership acquired the Pizza 73 trademarks and other intellectual property associated with Pizza 73 (together, “Pizza 73 Rights”). The Partnership licensed the Pizza 73 Rights to PPL for a 9% royalty on system sales of the Pizza 73 restaurants included in the Royalty Pool (as described under “Royalty Pool Adjustments”). For 2016, there are 100 Pizza 73 restaurants in the Royalty Pool.
As of January 1, 2017, PPL indirectly held an effective 21.1% interest in the Partnership (January 3, 2016 – 20.4%) by holding all Class B and Class D Units of the Partnership. PPL has the right to exchange one Class B or Class D Unit indirectly for that number of common shares of PPRC (“Shares”) equal to the Class B Exchange Multiplier or Class D Exchange Multiplier, respectively, applicable at the date of such exchange, as described under “Royalty Pool Adjustments”. The Class B and Class D Units are entitled to receive monthly distributions established by PPRC‟s board of directors. A monthly distribution is paid to both PPL and PPRC on a pro rata ownership basis, with PPRC‟s ownership held through its Class A and Class C limited partnership Units of the Partnership. ROYALTY POOL ADJUSTMENTS
Annually, on January 1 (the “Adjustment Date”), an adjustment is made to the Royalty Pool to include the forecasted System Sales from new Pizza Pizza restaurants opened on or before December 31 of the prior year, less System Sales from any Pizza Pizza restaurants that have been permanently closed during the year. Once adjusted, the Royalty Pool remains fixed for the year, consequently, the number of stores in the Royalty Pool may vary from the number of stores actually open at any given time during the year. As the Royalty Pool does not reflect current year changes until the next adjustment date. The change in the amount of the Royalty due to the Partnership as a result of changes in the System Sales of the Royalty Pool will affect PPL‟s retained interest through an adjustment to the rate at which the Class B Units of the Partnership may ultimately be exchanged for Shares. On the Adjustment Date, the adjustment to the Class B Exchange Multiplier (as defined in the Pizza Pizza License and Royalty

PIZZA PIZZA LIMITED MANAGEMENT’S DISCUSSION AND ANALYSIS For the 13-week period from October 3, 2016 to January 1, 2017 and the 52-week period from January 4, 2016 to January 1, 2017
- 12 -
Agreement) involves first calculating the “Determined Amount”, which is defined as 92.5% of the royalty revenue added to the Royalty Pool, divided by the prevailing yield of the Shares. Beginning January 1, 2012, the Determined Amounts are multiplied by a number equal to (1-Tax%) where “Tax%” is an estimate of the Company‟s effective tax rate for the year (determined using the total income taxes paid by the Company during the fiscal year divided by the total cash received by the Company during that fiscal year) (i.e., for the Adjustment Date of January 1, 2015, it will be the effective Company tax rate for the year ended December 31, 2014). This estimate of the effective tax rate will be subject to an adjustment when the actual effective entity level tax rate of the Company for the year is known. The Determined Amount is multiplied by 80%, then divided by the current market price of the Shares, and then further divided by the number of Class B Units outstanding. This fraction is added to the Class B Exchange Multiplier from the preceding year, which was “one” on the closing of the Fund‟s initial public offering. On the following Adjustment Date, a second adjustment to the Class B Exchange Multiplier will be made in the same manner once the System Sales for new restaurants are known with certainty. The adjustment for new restaurants rolled into the Royalty Pool is designed to be accretive for current shareholders.
If, during a year, a Pizza Pizza restaurant is closed, the sales of the restaurant from the closing date would no longer be included in the calculation of the royalty payable to the Partnership by PPL. To compensate for this, in certain circumstances, the Pizza Pizza License and Royalty Agreement and the Partnership‟s Amended and Restated Limited Partnership Agreement (the “Partnership Agreement”) provide that an amount (the “Make-Whole Payment”) reflecting the reduction in the royalty resulting from the restaurant closure will be paid by PPL to the Partnership for the balance of the year in which the restaurant was closed, commencing from the closing date. The Make-Whole Payment will be the sales of the closed restaurant for the first 52-week period in which it was included in the Royalty Pool multiplied by the royalty rate, one twelfth of which is payable each month until the Adjustment Date.
Similarly, on the Adjustment Date, a separate adjustment is made to the Royalty Pool for the Pizza 73 restaurants. The Royalty Pool is increased to include the forecasted System Sales from new Pizza 73 restaurants opened on or before September 1 of the prior year, less System Sales from any Pizza 73 restaurants that have been permanently closed during the year. On the Adjustment Date, the adjustment to the Class D Exchange Multiplier is calculated in a similar manner as the Class B Exchange Multiplier described above. RESTAURANTS ADDED TO THE ROYALTY POOL 2015 Royalty Pool Adjustment – Class B Exchange Multiplier In early January 2016, adjustments to royalty payments and PPL‟s Class B Exchange Multiplier were made based on the actual performance of the 23 new restaurants added to the Royalty Pool on January 1, 2015. As a result of the adjustments, the new Class B Exchange Multiplier is 1.796297 and Class B Units can be exchanged for 4,505,541 shares, which is an increase of 17,641 shares, effective January 1, 2015 2015 Royalty Pool Adjustment – Class D Exchange Multiplier In early January 2016, adjustments to royalty payments and PPL‟s Class D Exchange Multiplier were made based on the actual performance of the eight Pizza 73 restaurants added to the Royalty Pool on January 1, 2015. As a result of the adjustments, the new Class D Exchange Multiplier is 17.07332 and Class D Units can be exchanged for 1,707,332 shares, which is an increase of 71,099 shares, effective January 1, 2015.
Sale of Class B Partnership Units On March 23, 2015, PPL entered into an underwriting agreement for the sale of 2,800,000 shares of the PPRC at a price of $15.00 per share for gross proceeds of $42 million. In order to provide the 2,800,000 shares of PPRC to the underwriters, PPL exchanged 1,564,889 of its Class B Units of the Partnership, applying the Class B Exchange Multiplier of 1.789264. PPL‟s ownership of the PPRC‟s fully diluted

PIZZA PIZZA LIMITED MANAGEMENT’S DISCUSSION AND ANALYSIS For the 13-week period from October 3, 2016 to January 1, 2017 and the 52-week period from January 4, 2016 to January 1, 2017
- 13 -
shares decreased from 29.0% to 19.9% as a result of this transaction. 2016 Royalty Pool Adjustment – Class B Exchange Multiplier On January 1, 2016, six net Pizza Pizza restaurants were added to the Royalty Pool as a result of 24 new restaurants opening and 18 closing from January 1, 2015 to December 31, 2015. The additional system sales from the 24 new restaurants are estimated at $4.9 million annually less sales of $3.6 million from 18 permanently closed Pizza Pizza restaurants resulting in net estimated Pizza Pizza sales of $1.3 million added to the Royalty Pool. The total number of Pizza Pizza restaurants in the Royalty Pool has increased to 636. The yield of the shares was determined to be 5.89% calculated using $13.85 as a weighted average share price. Weighted average share price is calculated based on the market price of the shares traded on the Toronto Stock Exchange during the period of twenty consecutive days ending on the fifth trading day before January 1, 2016. As a result of the contribution of the additional net sales to the Royalty Pool, the Class B Exchange Multiplier increased fractionally by 80% of the total adjustment or 0.021529; the new Class B Exchange Multiplier is 1.817826. This adjustment will also increase the entitlement of the holders of the Class B Units to distributions of cash and allocations of income from the Partnership. The second adjustment to the Class B Exchange Multiplier will be adjusted to be effective January 1, 2016, once the actual performance of the new restaurants is determined in early 2017.
In early January 2017, adjustments to royalty payments and PPL‟s Class B Exchange Multiplier were made based on the actual performance of the 24 new restaurants added to the Royalty Pool on January 1, 2016. As a result of the adjustments, the new Class B Exchange Multiplier is 1.819988 and Class B Units can be exchanged for 4,564,964 shares, which is an increase of 5,422 shares, effective January 1, 2016. 2016 Royalty Pool Adjustment – Class D Exchange Multiplier On January 1, 2016, the Pizza 73 Royalty Pool remained unchanged as a result of two new restaurants opening between September 2, 2014 and September 1, 2015 and two restaurants closing between January 1, 2015 and December 31, 2015. The forecasted additional system sales from the two new restaurants are estimated at $1.1 million annually less $0.5 million in system sales attributable to the two closed restaurants. The total number of Pizza 73 restaurants in the Royalty Pool remains at 100 for 2016. The yield of and the weighted average share price used in the calculation of the Class D Exchange Multiplier is determined in the same manner as that of the Class B Exchange Multiplier calculation at 5.89% and $13.85, respectively. As a result of the contribution of the additional net sales to the Royalty Pool, the Class D Exchange Multiplier increased fractionally by 80% of the total adjustment or 0.35975; the new Class D Exchange Multiplier is 17.43307. This adjustment will also increase the entitlement of the holders of the Class D units to distributions of cash and allocations of income from the Partnership. The second adjustment to the Class D Exchange Multiplier will be adjusted to be effective January 1, 2016, once the actual performance of the new restaurants is determined in early 2017.
In early January 2017, adjustments to royalty payments and PPL‟s Class D Exchange Multiplier were made based on the actual performance of the two Pizza 73 restaurants added to the Royalty Pool on January 1, 2016. As a result of the adjustments, the new Class D Exchange Multiplier is 17.52620 and Class D Units can be exchanged for 1,752,620 shares, which is an increase of 9,313 shares, effective January 1, 2016. 2017 Royalty Pool Adjustment – Class B Exchange Multiplier On January 1, 2017, 15 net Pizza Pizza restaurants were added to the Royalty Pool as a result of 23 new restaurants opening and eight closing from January 1, 2016 to December 31, 2016. The additional system sales from the 23 new restaurants are estimated at $7.7 million annually less sales of $0.9 million from eight permanently closed Pizza Pizza restaurants resulting in net estimated Pizza Pizza sales of $6.8 million added to the Royalty Pool. The total number of Pizza Pizza restaurants in the Royalty Pool has increased to 651. The yield of the shares was determined to be 5.16% calculated using $16.43 as a

PIZZA PIZZA LIMITED MANAGEMENT’S DISCUSSION AND ANALYSIS For the 13-week period from October 3, 2016 to January 1, 2017 and the 52-week period from January 4, 2016 to January 1, 2017
- 14 -
weighted average share price. Weighted average share price is calculated based on the market price of the shares traded on the Toronto Stock Exchange during the period of twenty consecutive days ending on the fifth trading day before January 1, 2017. As a result of the contribution of the additional net sales to the Royalty Pool, the Class B Exchange Multiplier increased fractionally by 80% of the total adjustment or 0.110643; the new Class B Exchange Multiplier is 1.930631. This adjustment will also increase the entitlement of the holders of the Class B Units to distributions of cash and allocations of income from the Partnership. The second adjustment to the Class B Exchange Multiplier will be adjusted to be effective January 1, 2017, once the actual performance of the new restaurants is determined in early 2018. 2017 Royalty Pool Adjustment – Class D Exchange Multiplier On January 1, 2017, the Pizza 73 Royalty Pool remained unchanged as a result of four new restaurants opening between September 2, 2015 and September 1, 2016 and four restaurants closing between January 1, 2016 and December 31, 2016. The forecasted additional system sales from the four new restaurants are estimated at $1.2 million annually less $0.2 million in system sales attributable to the four closed Pizza 73 restaurants resulting in net estimated Pizza 73 sales of $1.0 million added to the Royalty Pool. The net estimated sales were further reduced by $2.1 million in system sales attributable to certain restaurants previously added to the Royalty Pool whose territory adjusted a previously existing restaurant, resulting in a negative Pizza 73 Estimated Determined Amount. As per the Pizza Pizza Royalty Limited Partnership agreement, whenever the Estimated Determined Amount is negative it shall be deemed to be zero. Accordingly, the Class D Exchange Multiplier remained unchanged at 17.52620. Once the actual performance of the new restaurants is determined in early 2018, the Class D Exchange Multiplier may be adjusted to be effective January 1, 2017. The total number of Pizza 73 restaurants in the Royalty Pool remains at 100 for 2017.
PPRC Outstanding Shares In exchange for adding the forecasted Pizza Pizza system sales to the Royalty Pool, PPL has received 277,519 additional equivalent Shares (through the change to the Class B Exchange Multiplier). These represent 80% of the forecasted equivalent Shares entitlement to be received (346,899 equivalent Shares represent 100%), with the final equivalent Shares entitlement to be determined when the new restaurants‟ 2017 actual sales performance is known with certainty in early 2018.
PPL‟s Class D equivalent Share entitlement is unchanged for 2017. In any year that the forecasted system sales (less closed restaurants sales and other adjustments) is negative, as was the case with the Class D equivalent Share entitlement calculation for 2017, no increase or decrease in the Exchange Multiplier is made. PPL will only have a Class D equivalent Share entitlement for 2017 if the actual sales performance of the four new Pizza 73 restaurants, less the sales of adjustment restaurants, significantly exceeds forecasted system sales and yields net, positive sales when the actual sales performance is known with certainty in early 2018.
After giving effect to PPL‟s entitlement to additional equivalent Shares as at January 1, 2017, PPL owns equivalent Shares representing 21.1% of the Partnership‟s fully diluted shares.

PIZZA PIZZA LIMITED MANAGEMENT’S DISCUSSION AND ANALYSIS For the 13-week period from October 3, 2016 to January 1, 2017 and the 52-week period from January 4, 2016 to January 1, 2017
- 15 -
The chart below shows the Shares that would be outstanding if all of PPL‟s Class B and D Units of the Partnership were converted to Shares after accounting for their respective multipliers.
Shares outstanding & issuable on January 1, 2017
Shares outstanding 24,618,392
Class B equivalent Shares held by PPL at December 31, 2016 4,559,542 PPL additional Class B equivalent Shares - True-up Holdback as at December 31, 2016 5,422
Additional PPL Class B equivalent Shares as of January 1, 2017 277,519 4,842,483
Class D equivalent Shares held by PPL at December 31, 2016 1,743,307 PPL additional Class D equivalent Shares - True-up Holdback as at December 31, 2016 9,313
Additional PPL Class D equivalent Shares as of January 1, 2017 - 1,752,620
Number of fully diluted shares 31,213,495
PPL‟s proportion of all shares outstanding and available for exchange 21.1%
OUTLOOK Pizza Pizza Limited will be celebrating its 50
th anniversary in 2017. Marketing campaigns will feature an
historical review of how Pizza Pizza became the #1 pizzeria by showcasing our progress over the years. Pizza Pizza customers will be engaged through creative contests and compelling value offerings featuring our extensive menu. To kick off the festivities, in January 2017, Pizza Pizza began a major restaurant renovation program, including updating the lobby and signage, which will further modernize the customer experience and set the course for future growth. Management believes this 50
th year milestone event will present excellent opportunities to leverage its
brand dominance, especially when combined with PPL‟s competitive advantages of convenience, technological innovation, high-quality menu offerings and geographic diversification. In the fourth quarter, PPL reported SSSG of 1.8% and 1.9% for the Year. By brand, Pizza 73, operating largely in a weakened Alberta economy, reported a 0.9% decline in same store sales for the Quarter as the lower price of crude oil has resulted in increased unemployment and a decline in that province‟s consumer spending. The Pizza Pizza brand reported 2.3% SSSG for the Quarter as the average customer check in the Ontario and Quebec markets increased over the same period last year, while traffic decreased slightly. Geographic diversification has proven to be key in maintaining consistent and stable sales. (See “Same Store Sales Growth”) PPL believes its leading market share in its major markets presents long-term opportunities for continued sales growth, especially with new product introductions and the further expansion of digital ordering platforms that increase PPL‟s convenience factor.
TRANSACTIONS WITH RELATED PARTIES PPL has entered into related party transactions with companies under common control. These transactions are entered into in the normal course of business and are measured at the exchange amount, which is the amount of consideration established and agreed to by the related parties. Significant related party transactions include rent expense, distributions on Class B and Class D Partnership Units, management fees and food purchases as disclosed in note 22 of the Financial Statements of PPL. PPL does not have any outstanding commitments related to transactions with related parties, other than those

PIZZA PIZZA LIMITED MANAGEMENT’S DISCUSSION AND ANALYSIS For the 13-week period from October 3, 2016 to January 1, 2017 and the 52-week period from January 4, 2016 to January 1, 2017
- 16 -
disclosed in note 16 of the Financial Statements of PPL. Distributions payable and advances to or from related parties and receipt of or repayments of advances from related parties are summarized in note 22 of the Financial Statements of PPL. Advances from related party are due to the parent company. Advances from related party and receivables from jointly-controlled companies are non-interest bearing, have no specified terms of repayment and are unsecured. The related party has waived the right to demand repayment prior to January 2, 2018; accordingly, the advances from related party have been classified as long-term.
CRITICAL ACCOUNTING POLICIES The preparation of the Financial Statements of Pizza Pizza requires management to make judgments that affect the reported amounts of assets, liabilities, revenues and expenses and related disclosures of contingent assets and liabilities, such as revenue recognition, long-lived and intangible assets and income taxes. PPL believes that its most critical accounting policies are: Consolidation - Determining which entities are to be consolidated by PPL requires judgment on the definition of control. The definition of control under IFRS 10, Consolidated Financial Statements (“IFRS 10”), states that an investor controls an investee when it has power over the investee, is exposed, or has rights, to variable returns from its involvement with the investee and has the ability to affect those returns through its power over the investee. Based on an assessment of the activities of the Partnership and the franchisees, it was concluded that PPL does not control these entities, and therefore shall not consolidate their operations. The Partnership is consolidated by Pizza Pizza Royalty Corp (“PPRC”), formerly Pizza Pizza Royalty Income Fund (the “Fund”).
Investment in associate - An associate is an entity over which the Company has significant influence. Significant influence is the power to participate in the financial and operating policy decisions of the investee, but is not control or joint control over those policies.
PPL owns Class B and Class D Partnership Units that are exchangeable for Pizza Pizza Royalty Corp. (“PPRC”) Common Shares based on the exchange multiplier applicable at the exchange date and represent an effective 21.1% interest in the Pizza Pizza Royalty Limited Partnership (“Partnership”) as at January 1, 2017. PPL has the ability to exercise significant influence through both its shareholding and its nominated director's active participation on the Partnership Board of Directors and therefore applies equity accounting on its investment in the Partnership.
PPL accounts for its 21.1% (January 3, 2016 – 20.4%) share interest in the Partnership as an investment in an associate and applies equity accounting whereby PPL‟s investment is increased by its 21.1% share of the Partnership‟s profit for the period and reduced for distributions received during the Partnership‟s fiscal period. The Partnership‟s financial and fiscal periods differ from PPL‟s, as the Partnership operates on a calendar year end.
Investments in joint ventures - A joint venture is a type of joint arrangement whereby the parties that have joint control of the arrangement have rights to the net assets of the joint venture. Joint control is the contractually agreed sharing of control of an arrangement, which exists only when decisions about the relevant activities require unanimous consent of the parties sharing control.
PPL accounts for its 50% (January 3, 2016 – 50%) share interest in the 75 jointly-controlled companies as an investment in a joint ventures and applies equity accounting whereby PPL‟s investment is increased by its 50% share of profit for the period of the joint ventures and reduced for distributions received during the joint ventures fiscal period. The jointly-controlled companies‟ financial and fiscal periods differ from PPL‟s, as the joint ventures have a floating year-end of the Saturday immediately preceding July 31.

PIZZA PIZZA LIMITED MANAGEMENT’S DISCUSSION AND ANALYSIS For the 13-week period from October 3, 2016 to January 1, 2017 and the 52-week period from January 4, 2016 to January 1, 2017
- 17 -
Identification of CGUs - For the purposes of identifying CGUs, assets are grouped at the lowest levels for which there are separately identifiable cash flows. PPL concludes there are interdependencies of cash flows between Pizza 73 restaurants and PPL and therefore, the investment in jointly-controlled Pizza 73 restaurants is considered a single CGU. PPL‟s assets pertaining to Pizza Pizza operations are classified as a separate CGU.
Sale of rights and marks and annual vend-ins - PPL has applied judgment in assessing the application of the revenue recognition accounting policy for the initial sale of Rights and Marks, and the annual vend-ins of restaurants in the Royalty Pool. In making their assessment, management considered the substance of these transactions and whether the risks and rewards of ownership have been transferred. Based on this assessment, management has determined that revenue relating to the sale will be deferred and amortized as earned and that the subsequent vend-ins will have no impact on PPL. Cash in lieu of vend-ins is considered as proceeds of disposition of the contractual right to an increase in the Exchange Multiplier and is taken to income when due.
CRITICAL ACCOUNTING ESTIMATES The preparation of the Financial Statements of Pizza Pizza requires management to make judgments that affect the reported amounts of assets, liabilities, revenues and expenses and related disclosures of contingent assets and liabilities. On an ongoing basis, management evaluates its estimates, including those related to basis of consolidation, revenue recognition, long-lived and intangible assets and income taxes. PPL bases its estimates on historical experience and on various other assumptions that PPL believes are reasonable under the circumstances, the results of which form the basis for making judgments about the carrying values of assets and liabilities that are not readily apparent from other sources. Actual results may differ from those estimates. Changes in its estimates could materially impact PPL‟s results of operations and financial condition for any particular period. PPL believes that its most critical accounting estimates are: Impairment of investment in Pizza Pizza Royalty Limited Partnership PPL, at each period-end, identifies impairment indicators and assesses whether there is any objective evidence that its interest in the Partnership is impaired. If impaired, the carrying value of PPL‟s share of the underlying assets of the Partnership is written down to its estimated recoverable amount, being the higher of fair value less cost to sell and value in use, and the write-down is charged to the consolidated statements of income. The value-in-use calculation requires the Company to estimate the future cash flows expected to arise from the Partnership and a suitable discount rate in order to calculate present value. In measuring future cash flows, PPL makes assumptions about future sales and terminal growth rates which are based on historical experience and expected future performance. Determining the applicable discount rate also involves estimating appropriate adjustments to market risk and PPL specific risk factors. The two most sensitive assumptions are pre-tax discount rates and terminal growth rates. Impairment of investment in jointly-controlled companies PPL, at each period-end, identifies impairment indicators and assesses whether there is any objective evidence that its interest in the joint ventures is impaired. If impaired, the carrying value of PPL‟s share of the underlying assets of the joint ventures is written down to its estimated recoverable amount, being the higher of fair value less cost to sell and value in use, and charged to the consolidated statements of income.
The value-in-use calculation requires the Company to estimate the future cash flows expected to arise from the CGU and a suitable discount rate in order to calculate present value. In measuring future cash flows, PPL makes assumptions about future sales, tax rates, and terminal growth rates that were based on historical experience and expected future performance. Determining the applicable discount rate also

PIZZA PIZZA LIMITED MANAGEMENT’S DISCUSSION AND ANALYSIS For the 13-week period from October 3, 2016 to January 1, 2017 and the 52-week period from January 4, 2016 to January 1, 2017
- 18 -
involves estimating appropriate adjustments to market risk and PPL specific risk factors. The two most sensitive assumptions used are pre-tax discount rates and terminal growth rates. Impairment of non-trade assets PPL, at each period-end, identifies impairment indicators and assesses whether there is any objective evidence that its non-trade assets are impaired. If impaired, the carrying value of these assets is written down to its estimated recoverable amount, and charged to the consolidated statements of income.
RECENT ACCOUNTING PRONOUNCEMENTS
Standards, amendments and interpretations to existing standards that are not yet effective and have not yet been early adopted by PPL:
IFRS 9, Financial Instruments (“IFRS 9”) International Financial Reporting Standard (“IFRS”) 9, Financial Instruments, as issued in 2014, introduces new requirements for the classification and measurement of financial instruments, a new expected-loss impairment model that will require more timely recognition of expected credit losses and a substantially reformed model for hedge accounting, with enhanced disclosures about risk management activity. IFRS 9 also removes the volatility in profit or loss that was caused by changes in an entity‟s own credit risk for liabilities elected to be measured at fair value. IFRS 9 is effective for annual periods beginning on or after January 1, 2018. Earlier application is permitted. PPL has not yet begun the process of evaluating the impact of this standard on its consolidated financial statements.
IFRS 15, Revenue from Contracts with Customers (“IFRS 15”) In May 2014, the International Accounting Standards Board (“IASB”) issued IFRS 15, which covers principles for reporting about the nature, amount, timing and uncertainty of revenue and cash flows arising from contracts with customers. On July 22, 2015, the IASB confirmed a one-year deferral of the effective date of the revenue Standard to January 1, 2018. PPL is in the process of reviewing the standard to determine the impact on the consolidated financial statements. IFRS 16, Leases (“IFRS 16”) In January 2016 the IASB has issued IFRS 16, Leases, its new leases standard that requires lessees to recognize assets and liabilities for most leases on their balance sheets. Lessees applying IFRS 16 will have a single accounting model for all leases, with certain exemptions. Lessor accounting is substantially unchanged. The new standard will be effective from January 1, 2019 with limited early application permitted. PPL has not yet begun the process of evaluating the impact of this standard on its consolidated financial statements.
RISKS & UNCERTAINTIES The performance of PPL is primarily dependent upon its ability to maintain and increase system sales at the Pizza Pizza and Pizza 73 restaurants, add new profitable restaurants to the network and attract qualified restaurant operators. Sales are subject to a number of factors that affect the restaurant industry generally and the quick service segment of this industry, in particular, which is highly competitive with respect to price, service, location and food quality. In addition, factors such as the availability of experienced management and hourly employees may also adversely affect the system sales. Competitors include national and regional chains, as well as independently-owned restaurants and retailers of frozen pizza. If PPL and the Pizza Pizza and Pizza 73 restaurants are unable to successfully compete in the quick service sector, system sales may be adversely affected. Changes in demographic trends, traffic patterns and the type, number and location of competing restaurants also affect the restaurant industry. In addition, factors such as government regulations, risk of technology failures, inflation, publicity from any food-borne illnesses and increased food, labour and benefits costs may

PIZZA PIZZA LIMITED MANAGEMENT’S DISCUSSION AND ANALYSIS For the 13-week period from October 3, 2016 to January 1, 2017 and the 52-week period from January 4, 2016 to January 1, 2017
- 19 -
adversely affect the restaurant industry in general and therefore, potentially, system sales. PPL‟s success also depends on numerous factors affecting discretionary spending, including economic conditions, disposable consumer income and consumer confidence. Adverse changes in these factors could reduce guest traffic or impose practical limits on pricing, either of which could reduce revenue and operating income, which could adversely affect system sales and the ability of PPL to pay the royalty to the Partnership. For a more detailed list of risks and uncertainties please refer to the PPRC‟s Annual Information Form which is available on the investor relations section of the website www.pizzapizza.ca or on the SEDAR website for Canadian regulatory filings at www.sedar.com.
FORWARD-LOOKING STATEMENTS Certain statements in this report, including those concerning PPL‟s plans and strategies described under “Outlook”, may constitute “forward-looking” statements which involve known and unknown risks, uncertainties and other factors that may cause the actual results, performance or achievements to be materially different from any future results, performance or achievements expressed or implied by such forward-looking statements. When used in this report, such statements include such words as “may”, “will”, “expect”, “believe”, “plan”, and other similar terminology in conjunction with a discussion of future operating or financial performance. These statements reflect management‟s current expectations regarding future events and operating performance and speak only as of the date of this report. These forward-looking statements involve a number of risks and uncertainties. The following are some factors that could cause actual results to differ materially from those expressed in or underlying such forward-looking statements: competition, changes in demographic trends, changing consumer preferences and discretionary spending patterns, changes in national and local business and economic conditions, legislation and governmental regulation, accounting policies and practices, and the results of operations and financial condition of PPL. The foregoing list of factors is not exhaustive and should be considered in conjunction with the other risks and uncertainties described in PPRC‟s Annual Information Form. PPL assumes no obligation to update these forward looking statements, except as required by applicable securities laws.
ADDITIONAL INFORMATION Other information about PPL and PPRC, including the Annual Information Form, can be accessed on the investor relations section of the website www.pizzapizza.ca or on the SEDAR website for Canadian regulatory filings at www.sedar.com.