pjm load forecast report january 2017 - energy
TRANSCRIPT
PJM Load Forecast Report January 2017
Prepared by PJM Resource Adequacy Planning Department

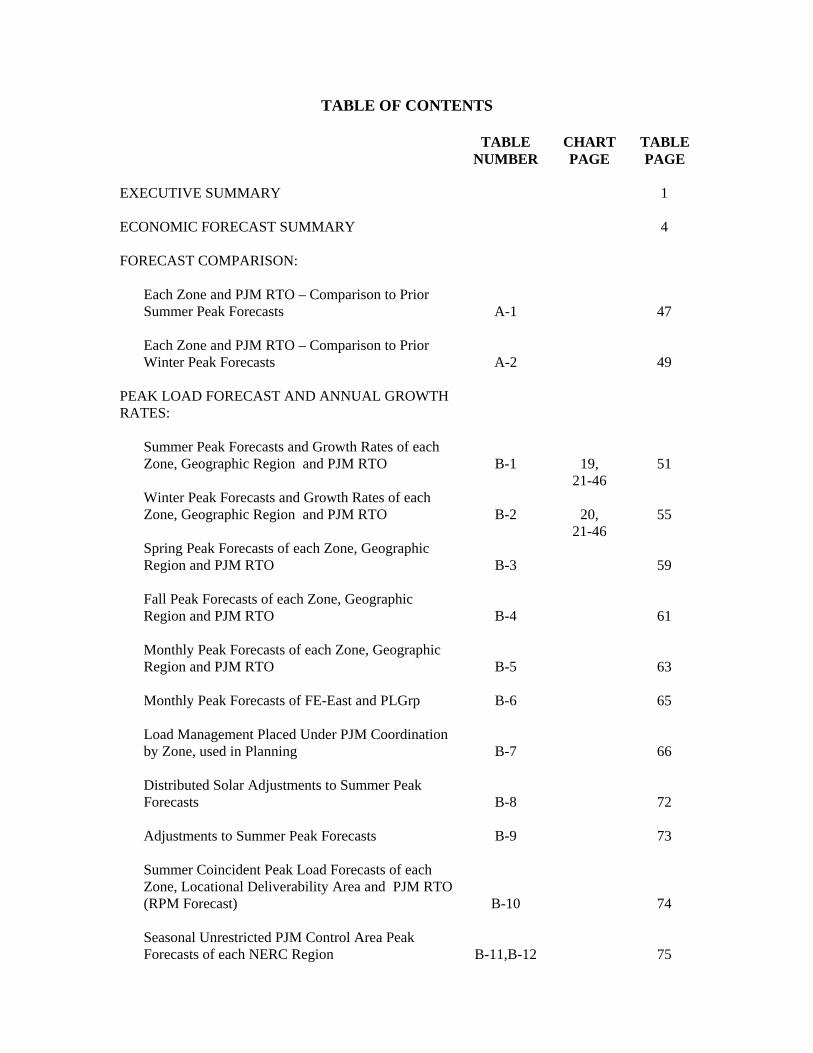
TABLE OF CONTENTS
TABLE NUMBER
CHART PAGE
TABLE PAGE
EXECUTIVE SUMMARY ECONOMIC FORECAST SUMMARY FORECAST COMPARISON:
Each Zone and PJM RTO – Comparison to Prior Summer Peak Forecasts Each Zone and PJM RTO – Comparison to Prior Winter Peak Forecasts
PEAK LOAD FORECAST AND ANNUAL GROWTH RATES:
Summer Peak Forecasts and Growth Rates of each Zone, Geographic Region and PJM RTO Winter Peak Forecasts and Growth Rates of each Zone, Geographic Region and PJM RTO Spring Peak Forecasts of each Zone, Geographic Region and PJM RTO Fall Peak Forecasts of each Zone, Geographic Region and PJM RTO Monthly Peak Forecasts of each Zone, Geographic Region and PJM RTO Monthly Peak Forecasts of FE-East and PLGrp Load Management Placed Under PJM Coordination by Zone, used in Planning Distributed Solar Adjustments to Summer Peak Forecasts Adjustments to Summer Peak Forecasts Summer Coincident Peak Load Forecasts of each Zone, Locational Deliverability Area and PJM RTO (RPM Forecast) Seasonal Unrestricted PJM Control Area Peak Forecasts of each NERC Region
A-1
A-2
B-1
B-2
B-3
B-4
B-5
B-6
B-7
B-8
B-9
B-10
B-11,B-12
19, 21-46
20,
21-46
1
4
47
49
51
55
59
61
63
65
66
72
73
74
75
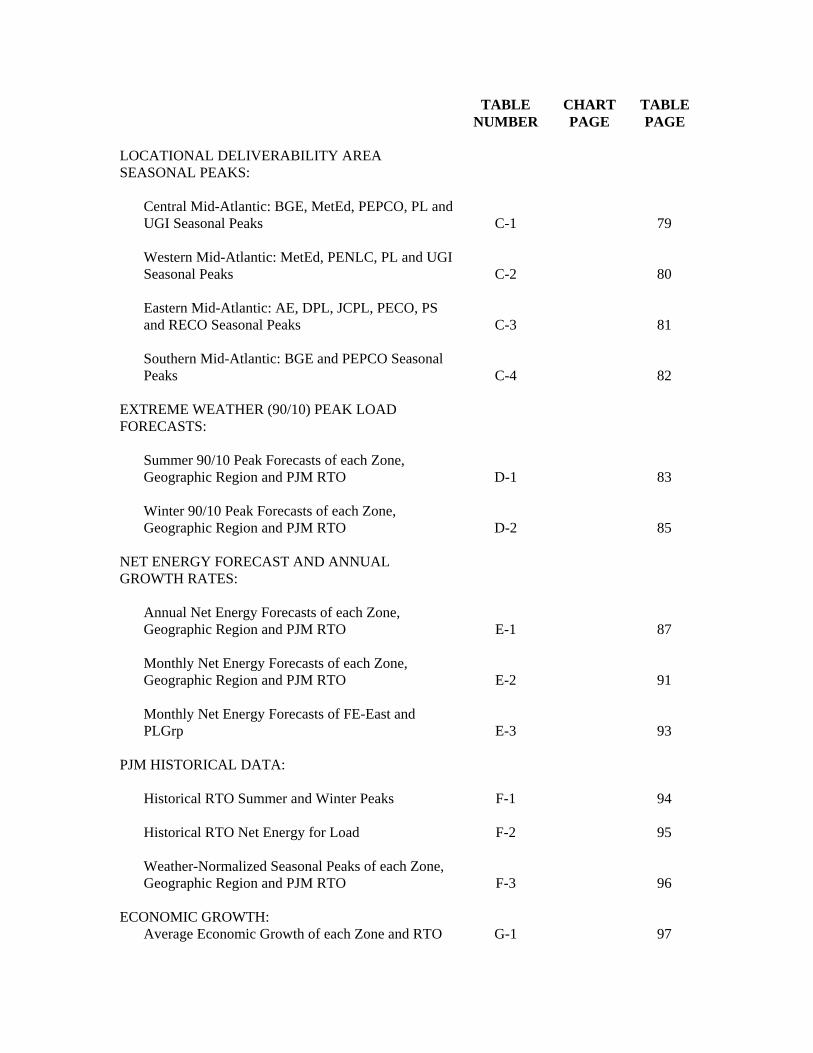
TABLE NUMBER
CHART PAGE
TABLE PAGE
LOCATIONAL DELIVERABILITY AREA SEASONAL PEAKS:
Central Mid-Atlantic: BGE, MetEd, PEPCO, PL and UGI Seasonal Peaks
Western Mid-Atlantic: MetEd, PENLC, PL and UGI Seasonal Peaks Eastern Mid-Atlantic: AE, DPL, JCPL, PECO, PS and RECO Seasonal Peaks Southern Mid-Atlantic: BGE and PEPCO Seasonal Peaks
EXTREME WEATHER (90/10) PEAK LOAD FORECASTS:
Summer 90/10 Peak Forecasts of each Zone, Geographic Region and PJM RTO Winter 90/10 Peak Forecasts of each Zone, Geographic Region and PJM RTO
NET ENERGY FORECAST AND ANNUAL GROWTH RATES:
Annual Net Energy Forecasts of each Zone, Geographic Region and PJM RTO Monthly Net Energy Forecasts of each Zone, Geographic Region and PJM RTO Monthly Net Energy Forecasts of FE-East and PLGrp
PJM HISTORICAL DATA:
Historical RTO Summer and Winter Peaks Historical RTO Net Energy for Load Weather-Normalized Seasonal Peaks of each Zone, Geographic Region and PJM RTO
ECONOMIC GROWTH:
Average Economic Growth of each Zone and RTO
C-1
C-2
C-3
C-4
D-1
D-2
E-1
E-2
E-3
F-1
F-2
F-3
G-1
79
80
81
82
83
85
87
91
93
94
95
96
97
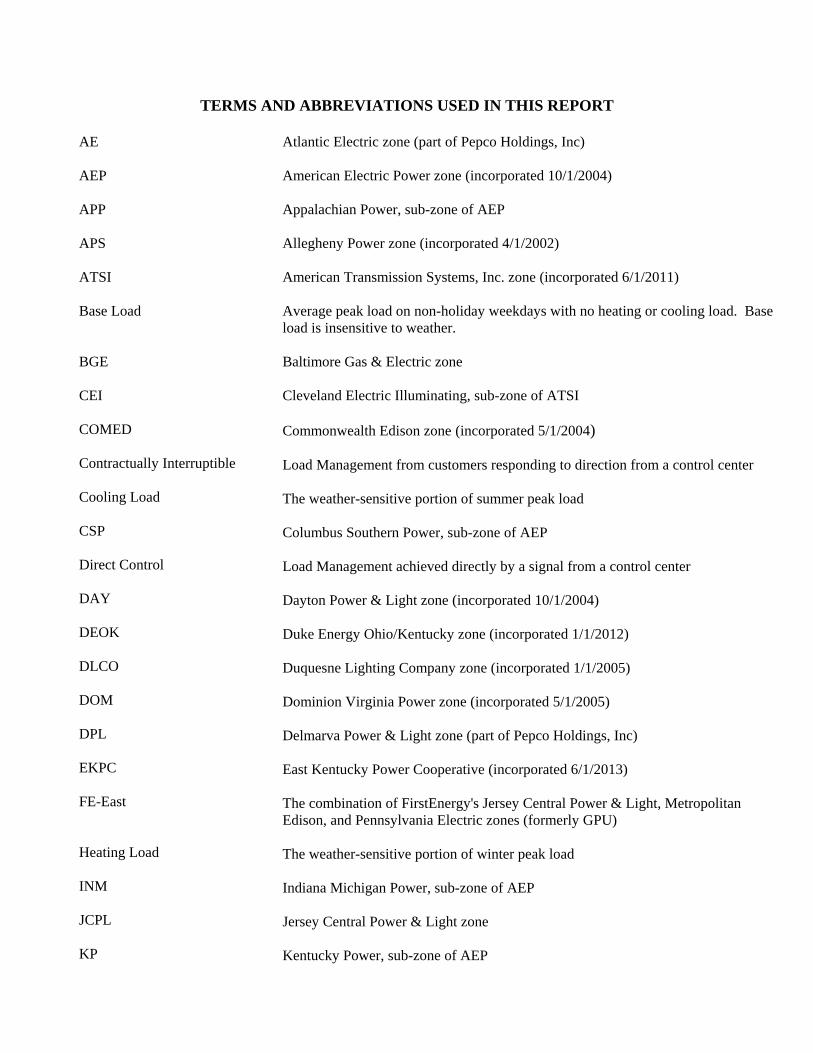
TERMS AND ABBREVIATIONS USED IN THIS REPORT
AE AEP APP APS ATSI Base Load BGE CEI COMED Contractually Interruptible Cooling Load CSP Direct Control DAY DEOK DLCO DOM DPL EKPC FE-East Heating Load INM JCPL KP
Atlantic Electric zone (part of Pepco Holdings, Inc) American Electric Power zone (incorporated 10/1/2004) Appalachian Power, sub-zone of AEP Allegheny Power zone (incorporated 4/1/2002) American Transmission Systems, Inc. zone (incorporated 6/1/2011) Average peak load on non-holiday weekdays with no heating or cooling load. Base load is insensitive to weather. Baltimore Gas & Electric zone Cleveland Electric Illuminating, sub-zone of ATSI Commonwealth Edison zone (incorporated 5/1/2004) Load Management from customers responding to direction from a control center The weather-sensitive portion of summer peak load Columbus Southern Power, sub-zone of AEP Load Management achieved directly by a signal from a control center Dayton Power & Light zone (incorporated 10/1/2004) Duke Energy Ohio/Kentucky zone (incorporated 1/1/2012) Duquesne Lighting Company zone (incorporated 1/1/2005) Dominion Virginia Power zone (incorporated 5/1/2005) Delmarva Power & Light zone (part of Pepco Holdings, Inc) East Kentucky Power Cooperative (incorporated 6/1/2013) The combination of FirstEnergy's Jersey Central Power & Light, Metropolitan Edison, and Pennsylvania Electric zones (formerly GPU) The weather-sensitive portion of winter peak load Indiana Michigan Power, sub-zone of AEP Jersey Central Power & Light zone Kentucky Power, sub-zone of AEP
METED MP NERC Net Energy OEP OP PECO PED PEPCO PL PLGroup/PLGRP PENLC PP PS RECO TOL UGI Unrestricted Peak WP Zone
Metropolitan Edison zone Monongahela Power, sub-zone of APS North American Electric Reliability Corporation Net Energy for Load, measured as net generation of main generating units plus energy receipts minus energy deliveries Ohio Edison, sub-zone of ATSI Ohio Power, sub-zone of AEP PECO Energy zone Potomac Edison, sub-zone of APS Potomac Electric Power zone (part of Pepco Holdings, Inc) PPL Electric Utilities, sub-zone of PLGroup Pennsylvania Power & Light zone Pennsylvania Electric zone Pennsylvania Power, sub-zone of ATSI Public Service Electric & Gas zone Rockland Electric (East) zone (incorporated 3/1/2002) Toledo Edison, sub-zone of ATSI UGI Utilities, sub-zone of PLGroup Peak load prior to any reduction for load management or voltage reduction. West Penn Power, sub-zone of APS Areas within the PJM Control Area, as defined in the PJM Reliability Assurance Agreement
1
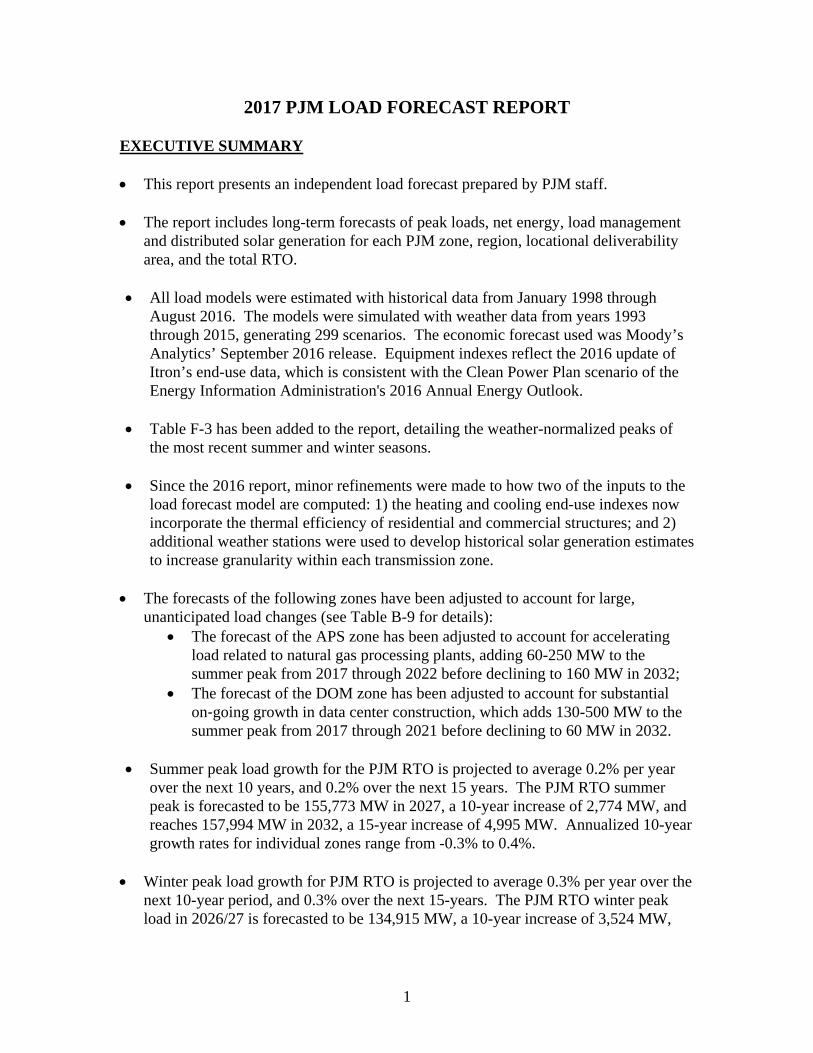
2017 PJM LOAD FORECAST REPORT EXECUTIVE SUMMARY This report presents an independent load forecast prepared by PJM staff. The report includes long-term forecasts of peak loads, net energy, load management
and distributed solar generation for each PJM zone, region, locational deliverability area, and the total RTO.
All load models were estimated with historical data from January 1998 through
August 2016. The models were simulated with weather data from years 1993 through 2015, generating 299 scenarios. The economic forecast used was Moody’s Analytics’ September 2016 release. Equipment indexes reflect the 2016 update of Itron’s end-use data, which is consistent with the Clean Power Plan scenario of the Energy Information Administration's 2016 Annual Energy Outlook.
Table F-3 has been added to the report, detailing the weather-normalized peaks of
the most recent summer and winter seasons. Since the 2016 report, minor refinements were made to how two of the inputs to the
load forecast model are computed: 1) the heating and cooling end-use indexes now incorporate the thermal efficiency of residential and commercial structures; and 2) additional weather stations were used to develop historical solar generation estimates to increase granularity within each transmission zone.
The forecasts of the following zones have been adjusted to account for large,
unanticipated load changes (see Table B-9 for details): The forecast of the APS zone has been adjusted to account for accelerating
load related to natural gas processing plants, adding 60-250 MW to the summer peak from 2017 through 2022 before declining to 160 MW in 2032;
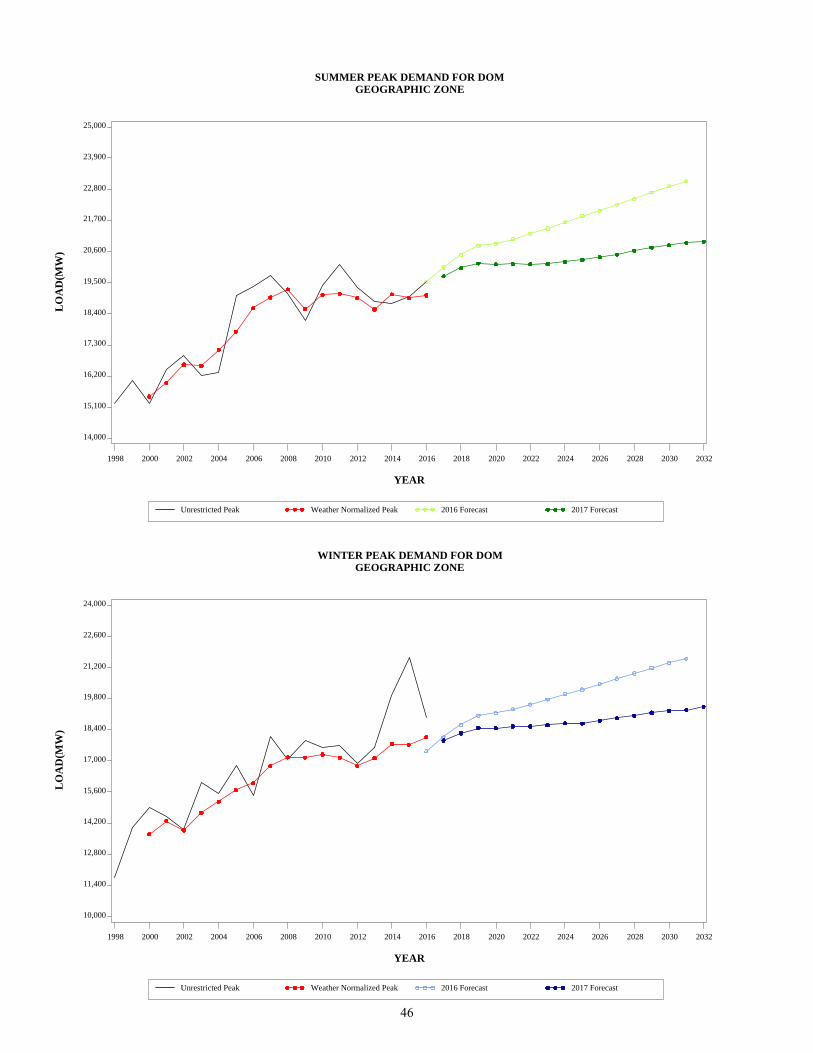
The forecast of the DOM zone has been adjusted to account for substantial on‐going growth in data center construction, which adds 130-500 MW to the summer peak from 2017 through 2021 before declining to 60 MW in 2032.
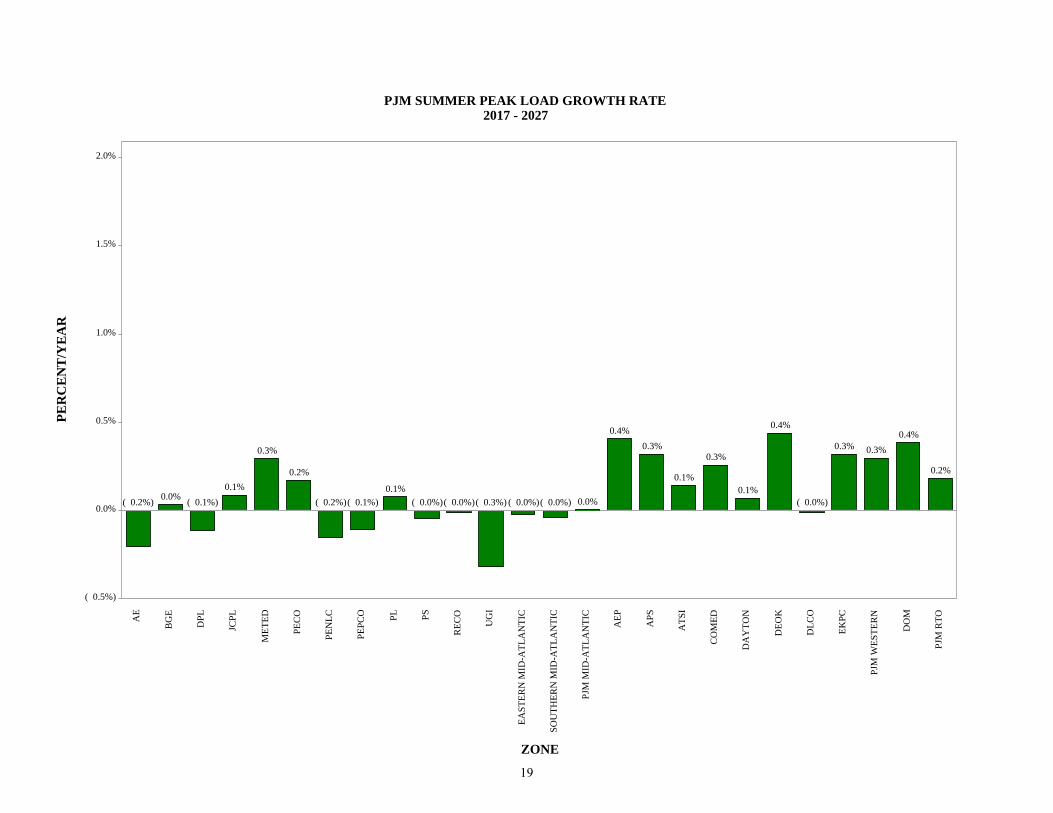
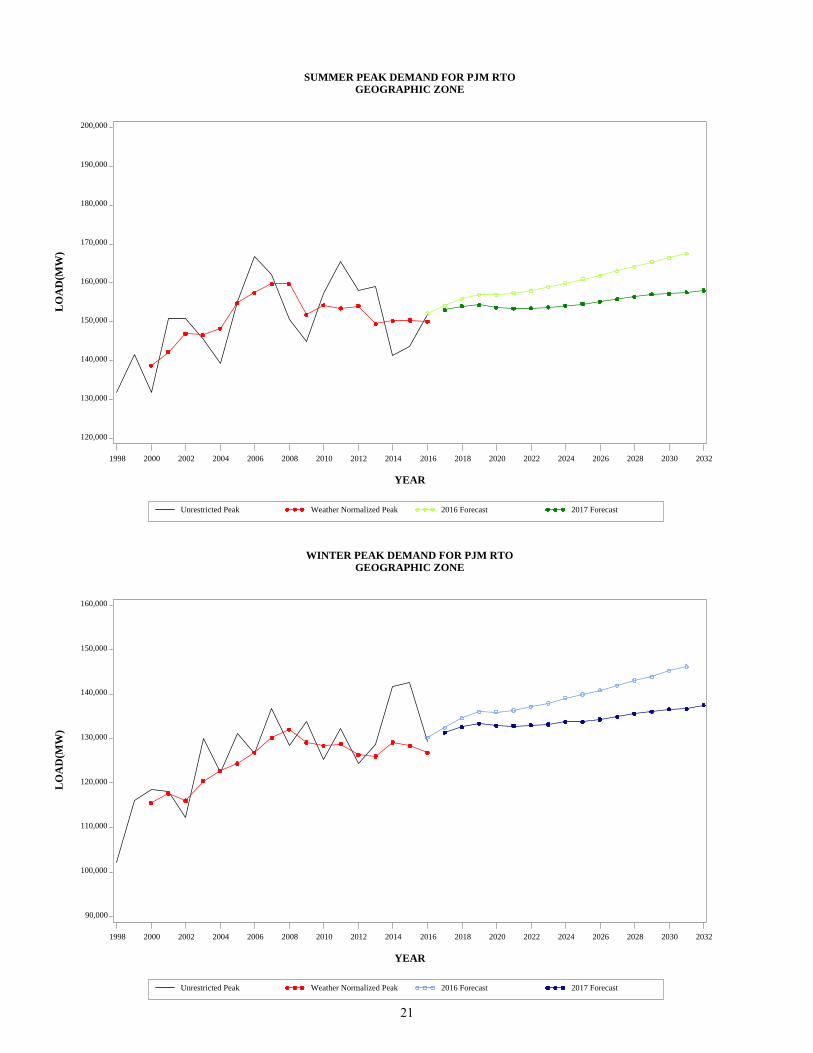
Summer peak load growth for the PJM RTO is projected to average 0.2% per year
over the next 10 years, and 0.2% over the next 15 years. The PJM RTO summer peak is forecasted to be 155,773 MW in 2027, a 10-year increase of 2,774 MW, and reaches 157,994 MW in 2032, a 15-year increase of 4,995 MW. Annualized 10-year growth rates for individual zones range from -0.3% to 0.4%.
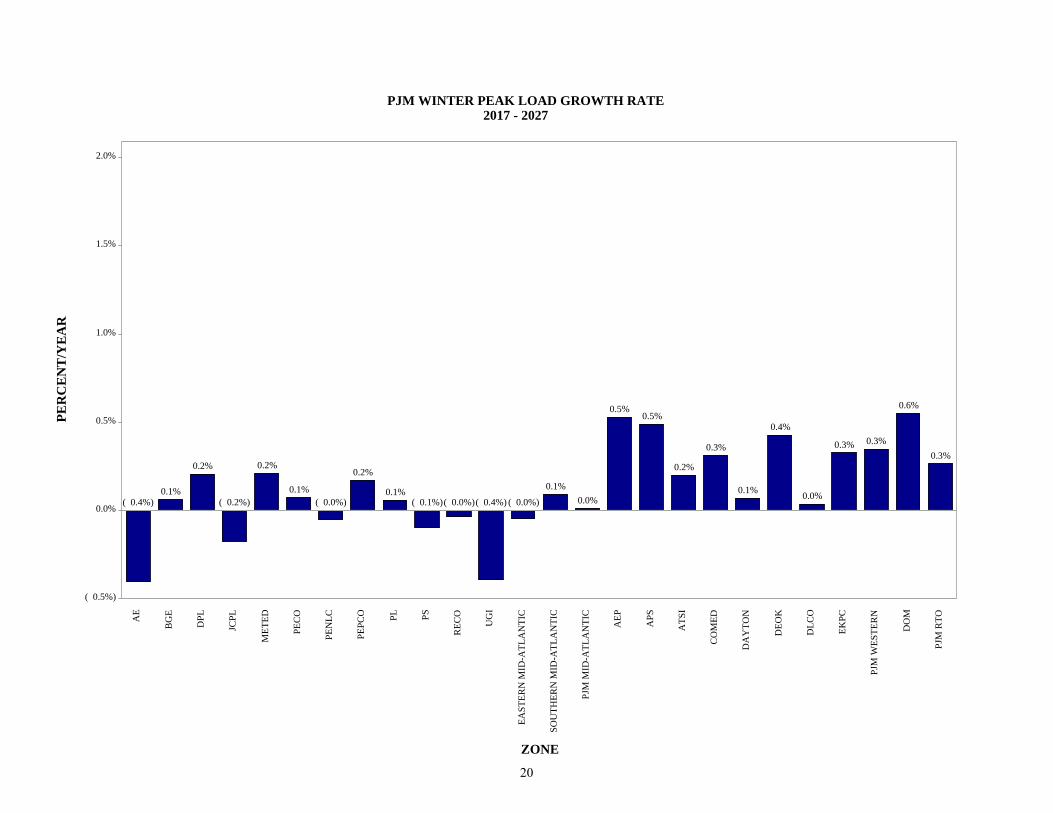
Winter peak load growth for PJM RTO is projected to average 0.3% per year over the
next 10-year period, and 0.3% over the next 15-years. The PJM RTO winter peak load in 2026/27 is forecasted to be 134,915 MW, a 10-year increase of 3,524 MW,

2
and reaches 137,486 MW in 2031/32, a 15-year increase of 6,095 MW. Annualized 10-year growth rates for individual zones range from -0.4% to 0.6%.
Net energy for load growth for PJM RTO is projected to average 0.2% per year over
the next 10-year period, and 0.3% over the next 15-years. Total PJM RTO energy is forecasted to be 835,137 GWh in 2027, a 10-year increase of 20,299 GWh, and reaches 851,227 GWh in 2032, a 15-year increase of 36,389 GWh. Annualized 10-year growth rates for individual zones range from -0.4% to 0.6%.
Compared to the 2016 Load Report, the 2017 PJM RTO summer peak forecast shows
the following changes for three years of interest: o The next delivery year – 2017 -1,150 MW (-0.7%) o The next RPM auction year – 2020 -3,203 MW (-2.0%) o The next RTEP study year – 2022 -4,561 MW (-2.9%)
NOTE: Unless noted otherwise, all peak and energy values are non-coincident, unrestricted peaks, which represent the peak load or net energy after reductions for distributed solar generation and prior to reductions for load management impacts. All compound growth rates are calculated from the first year of the forecast.
METERED UNRESTRICTED THIS YEAR RPM YEAR RTEP YEAR2016 2016 2017 2020 2022
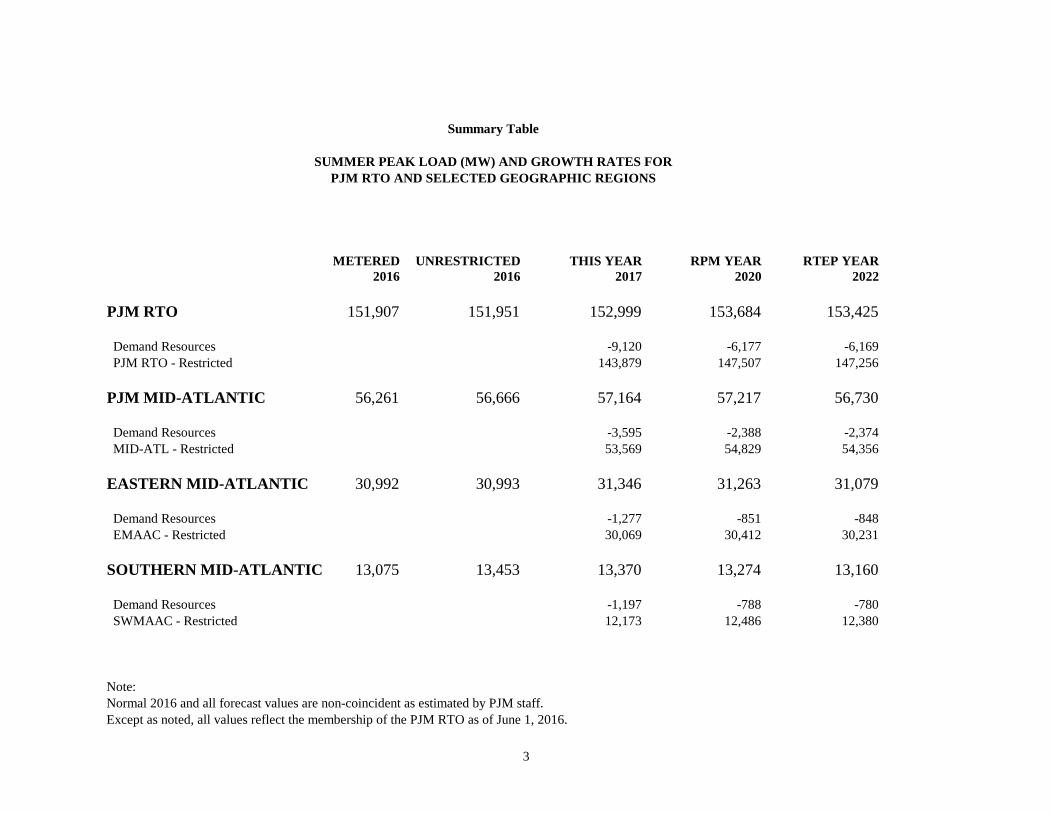
PJM RTO 151,907 151,951 152,999 153,684 153,425
Demand Resources -9,120 -6,177 -6,169 PJM RTO - Restricted 143,879 147,507 147,256
PJM MID-ATLANTIC 56,261 56,666 57,164 57,217 56,730
Demand Resources -3,595 -2,388 -2,374 MID-ATL - Restricted 53,569 54,829 54,356
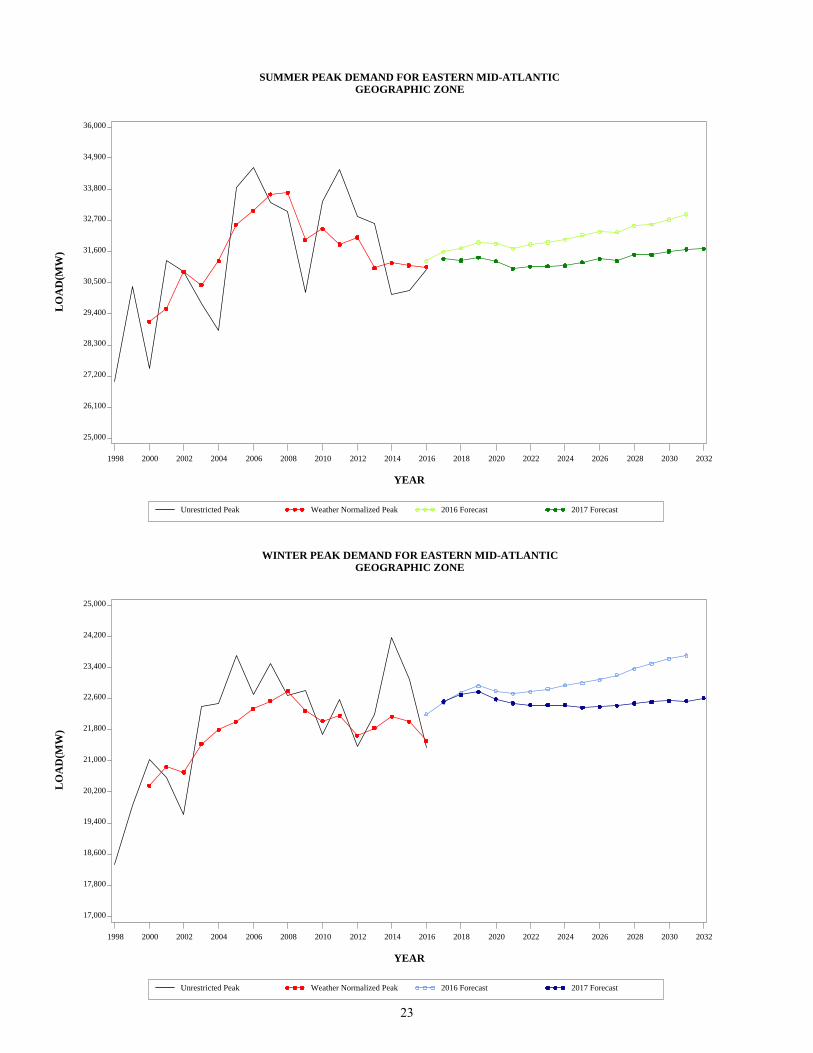
EASTERN MID-ATLANTIC 30,992 30,993 31,346 31,263 31,079
Demand Resources -1,277 -851 -848 EMAAC - Restricted 30,069 30,412 30,231
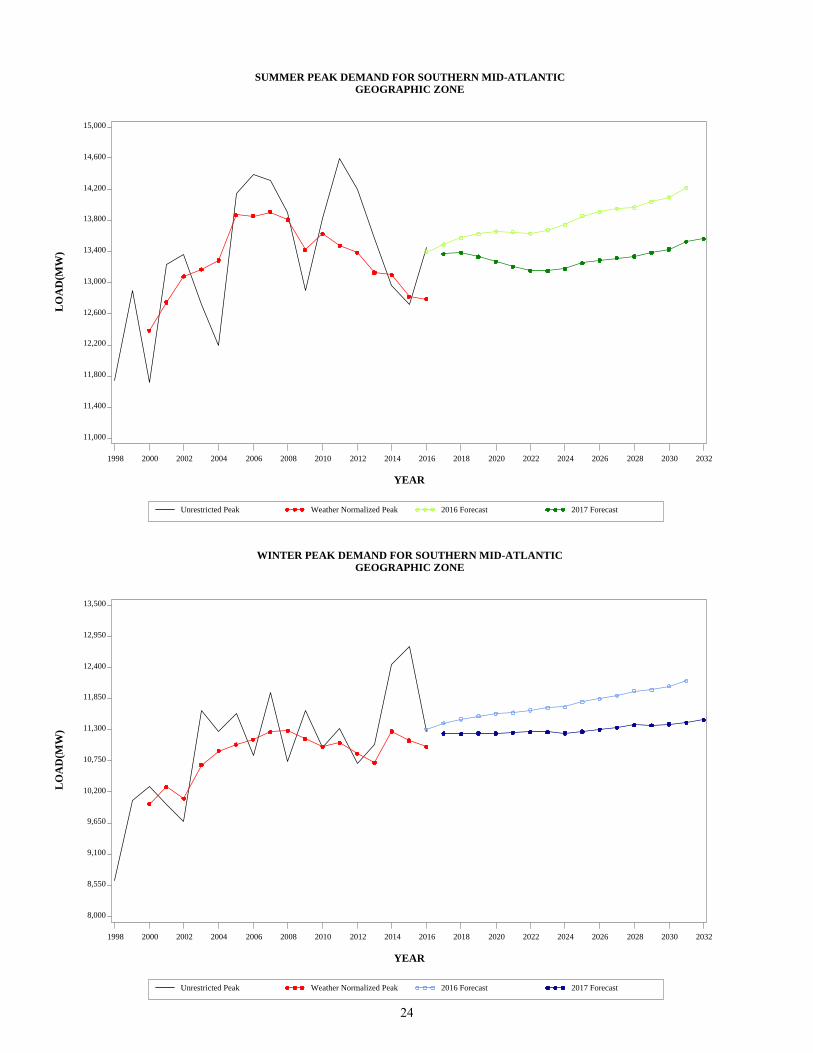
SOUTHERN MID-ATLANTIC 13,075 13,453 13,370 13,274 13,160
Demand Resources -1,197 -788 -780 SWMAAC - Restricted 12,173 12,486 12,380
Normal 2016 and all forecast values are non-coincident as estimated by PJM staff.Except as noted, all values reflect the membership of the PJM RTO as of June 1, 2016.
Summary Table
SUMMER PEAK LOAD (MW) AND GROWTH RATES FORPJM RTO AND SELECTED GEOGRAPHIC REGIONS
Note:
3

Adam Ozimek, 610-235-5127
Summary of the September 2016 U.S. macro forecast The U.S. economy had a good summer. The job market posted impressive gains, vehicle sales have never been stronger, home sales and house prices have largely recovered from the bust, and the stock market is hitting new highs. A string of geopolitical shocks, most notably the British vote to exit the European Union, has done no discernible damage.
Federal Reserve officials appear to be gearing up for another interest rate increase. The only hike since the financial crisis was in December 2015, when policymakers lifted rates off the zero bound. Their extraordinarily cautious approach to normalizing interest rates seems to have convinced financial markets of a new normal and rates are not likely to rise much. Anything that changes these expectations could ignite a rapid re-pricing of stocks, bonds, real estate and other assets, and quickly hurt the economy. Solid balance sheet A fundamental reason for optimism is the economy’s strong balance sheet. Household balance sheets could not be better. The household debt service burden is as low as it has been in the available data back to 1980. This reflects both the massive deleveraging during the financial crisis and the rock-bottom interest rates.
December 2016 121 N. Walnut St., Suite 500
West Chester, PA 19380
4
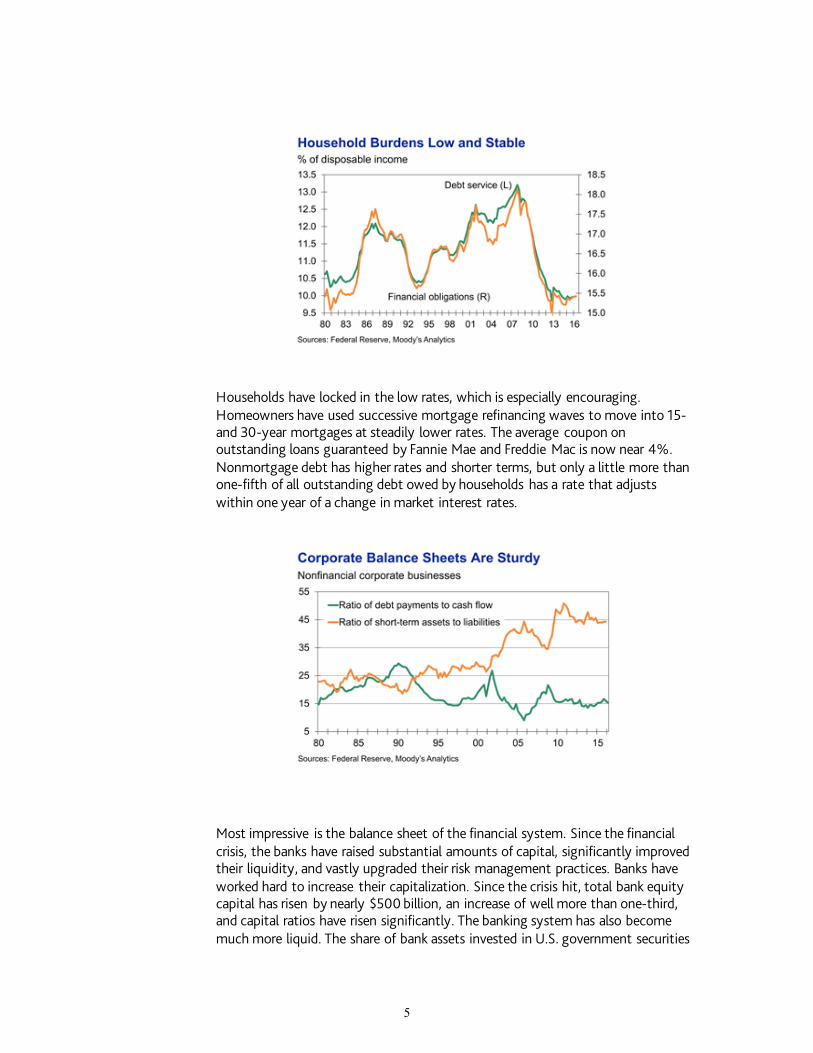
Households have locked in the low rates, which is especially encouraging. Homeowners have used successive mortgage refinancing waves to move into 15- and 30-year mortgages at steadily lower rates. The average coupon on outstanding loans guaranteed by Fannie Mae and Freddie Mac is now near 4%. Nonmortgage debt has higher rates and shorter terms, but only a little more than one-fifth of all outstanding debt owed by households has a rate that adjusts within one year of a change in market interest rates.
Most impressive is the balance sheet of the financial system. Since the financial crisis, the banks have raised substantial amounts of capital, significantly improved their liquidity, and vastly upgraded their risk management practices. Banks have worked hard to increase their capitalization. Since the crisis hit, total bank equity capital has risen by nearly $500 billion, an increase of well more than one-third, and capital ratios have risen significantly. The banking system has also become much more liquid. The share of bank assets invested in U.S. government securities
5
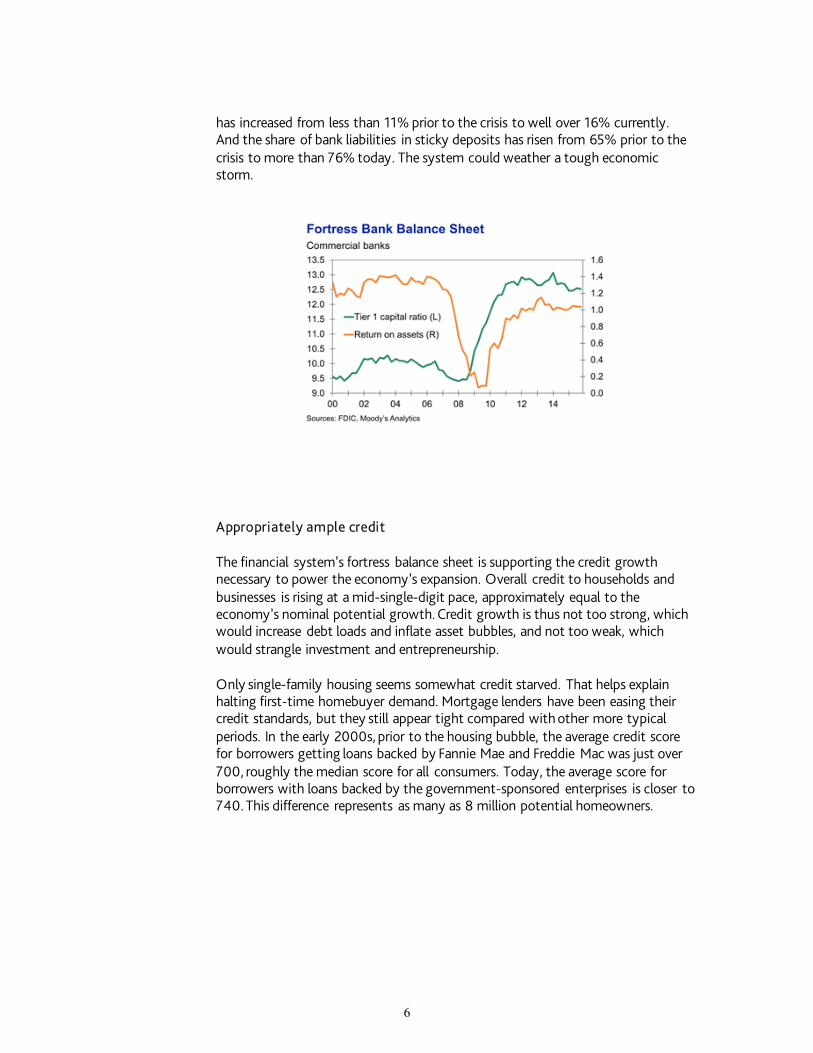
has increased from less than 11% prior to the crisis to well over 16% currently. And the share of bank liabilities in sticky deposits has risen from 65% prior to the crisis to more than 76% today. The system could weather a tough economic storm.
Appropriately ample credit
The financial system’s fortress balance sheet is supporting the credit growth necessary to power the economy’s expansion. Overall credit to households and businesses is rising at a mid-single-digit pace, approximately equal to the economy’s nominal potential growth. Credit growth is thus not too strong, which would increase debt loads and inflate asset bubbles, and not too weak, which would strangle investment and entrepreneurship.
Only single-family housing seems somewhat credit starved. That helps explain halting first-time homebuyer demand. Mortgage lenders have been easing their credit standards, but they still appear tight compared with other more typical periods. In the early 2000s, prior to the housing bubble, the average credit score for borrowers getting loans backed by Fannie Mae and Freddie Mac was just over 700, roughly the median score for all consumers. Today, the average score for borrowers with loans backed by the government-sponsored enterprises is closer to 740. This difference represents as many as 8 million potential homeowners.
6

A ways to run
At the center of every economic downturn is a serious problem with the economy’s balance sheet. In the financial crisis, highly leveraged households stopped making their mortgage payments and caused the financial system to seize up. The proximate cause of the Y2K recession was overextended technology companies and the bubble in the stock market. Junk corporate bonds and commercial real estate lending precipitated the savings and loan crisis and recession of the early 1990s.
Given the current strength of the economy’s balance sheet, it is difficult to be too anxious about another recession any time soon. It is also reassuring that regulators appear to be carefully monitoring the financial system, and willing and able to take action to head off problems before they become existential threats. Regulators’ recent guidance to banks on their multifamily mortgage lending is a case in point. This is a sea change from regulators’ stance prior to the financial crisis.
Another recession is coming, to be sure. It will emanate from a part of the economy’s balance sheet that is opaque and not well understood. Most everyone will miss it. But odds are that the current expansion, which is already one of the longest, has a ways to run.
Risks to the outlook
U.S. presidential election
The U.S. presidential election results came as a shock to many, including Moody’s Analytics. Financial markets initially reacted negatively to the news of a Donald Trump presidency: Futures markets plunged and volatility spiked. But after the initial shock, financial markets rallied and volatility subsided. Still, financial markets will remain volatile over the coming months as market participants assess the potential impacts on the economy. Trump’s upset victory increases uncertainty both in the U.S. and abroad. Chances are high that a Trump presidency will take an anti-globalization stance on trade and immigration, with important implications for the global economy. Immigration will add to uncertainty as undocumented workers leave the country, leading to a contraction in the labor force. It is possible that deportations could reduce the labor force by 2.16 million, or 1.4%. Given the increase in uncertainty, businesses will likely delay investment and hiring decisions, and consumers will pause at least for a while to take stock. Ultimately, the economic impact will depend on what policies the new administration will actually pursue.
7

Under the Trump economy, growth will be about the same as the baseline in 2017, but over his term per annum growth will be weaker. Behind this poorer performance is the smaller workforce as some undocumented workers leave and fewer legal immigrants come. Global trade also suffers given the greater skepticism around our trading relationships and what is likely to be a stronger U.S. dollar, particularly against the Chinese yuan and other emerging currencies such as the Mexican peso.
There are long-term economic benefits from lower marginal tax rates and the adoption of a territorial corporate tax system, but these changes are too small to have a significant impact on growth over the medium term. Unemployment will fall as low as 4.4%, well below the economy’s full-employment unemployment rate. This will fuel inflationary pressures, and in turn a more restrictive monetary policy and higher long-term interest rates.
Core inflation is expected to break through the Federal Reserve’s 2% target by this time next year and peak near 3% in early 2019. The Fed will respond to the tight labor market and above-target inflation by normalizing rates more quickly—raising rates at its next meeting in December and steadily thereafter, with the federal funds rate expected to rise well above its estimated long-run equilibrium rate of 3% by mid-2019. Ten-year Treasury yields will peak about the same time at near 4%.
China
A hard landing for China’s economy would reverberate across the world economy. The slowdown in China is already weighing on the country’s trading partners in Asia and Latin America and has fanned financial market volatility. Although conditions have stabilized, the global recovery remains fragile and could derail should growth in China falter significantly. Growth in the world’s second largest economy will continue to decelerate as the government attempts to transition away from excessive reliance on industry and more toward domestic consumption of services.
The uncertainty lies in China’s ability to continue to generate sturdy growth and the possible impact of its interventions in the foreign exchange market on other global markets. China’s economic growth has been supported by a huge buildup in credit that poured into residential and nonresidential investments. Should property prices crumble, that mountain of debt may prove to be unsustainable. Moreover, an unstable Chinese yuan could set off financial markets. China has already burned through more than $500 billion in foreign reserves in 2015 in an attempt to stabilize the yuan. Last year’s surprise yuan devaluation roiled markets, causing a global selloff of risky assets.
8

Geopolitical tensions
Geopolitical tensions pose an indirect threat to the U.S. economy, transmitted through international trade, consumer sentiment and financial markets. Britain’s vote to leave the European Union jolted financial markets and triggered a global selloff of risky assets. Although markets have since stabilized, the British vote casts uncertainty about the future, including how and under what terms Britain will leave the EU. The fallout from the British vote includes heightened concern about Italy’s already-weak banking system and threatens to undermine the Continent’s fourth largest economy. Uncertainty also surrounds the European project by energizing other Eurosceptic political parties in the region. Anti-EU sentiment driven by immigration and trade policies also poses long-term risks for the EU as well as for the broader global economy. Elections in Italy later this year and in France, Germany and Netherlands next year could drastically change the EU’s political and economic landscape. The risk is that these elections could result in further fragmentation of the EU, which would weaken the global economy and damage the U.S. expansion.
Elsewhere, conflicts in Iraq and Syria threaten to further destabilize the Middle East. Although the war against the Islamic State has been confined to Iraq and Syria, it could spread to other Middle Eastern countries. Additionally, the failed coup attempt in Turkey has strained U.S.-Turkey relations. The worst-case scenario involves an escalation of tensions in the region that could cause not only a spike in oil prices but also greater turmoil in global financial markets, leading to a drop in trade and slower global growth.
Monetary policy
Near-term economic uncertainty resulting from an unexpected Trump presidency could impact monetary policy decisions, especially if markets become unhinged. Fed funds futures are still pricing in around a 75% probability of a Federal Reserve rate hike in December. However, we are now less certain about that than are financial markets.
The Fed will still face the same challenges as it tries to normalize monetary policy. If the Fed were to raise interest rates too quickly it could undermine markets. This could derail the U.S. expansion and even force the Fed to reverse course and perhaps introduce a new round of quantitative easing or even negative interest rates. Another possibility is that the Fed waits too long to raise rates. As a result it might be forced to raise rates more aggressively than required, which could also undermine the expansion. Additionally, with interest rates still near the zero lower bound, the Fed is limited in the tools it has at its disposal to combat a re-cession.
Productivity
Productivity growth has been lackluster in the aftermath of the financial crisis. Since the recession, nonfarm business productivity has averaged a disappointing 1% per annum, and even less than that more recently. The decline in productivity
9
that stems from a pullback in business investment is especially concerning. Restrictions on legal immigration and the accelerated deportation of undocumented workers could reduce long-run productivity, as immigrants have historically been a key driver of business creation and have played an important role in increasing productivity growth and in the growth of tech industries. With the U.S. fast approaching full employment, unless productivity gains improve, the economy will not deliver on GDP, income, profits, tax revenue and asset returns.
Summary of the forecast for PJM service territories
The PJM service territory covers all or parts of 13 states and the District of Columbia, accounting for more than 52 million people, or about a sixth of the U.S. population. The regional economies of the service territory include metro areas in the Midwest, South and Northeast and run the gamut from highly diversified, large economies such as Chicago, to small economies that depend heavily on one industry, such as Elkhart-Goshen IN.
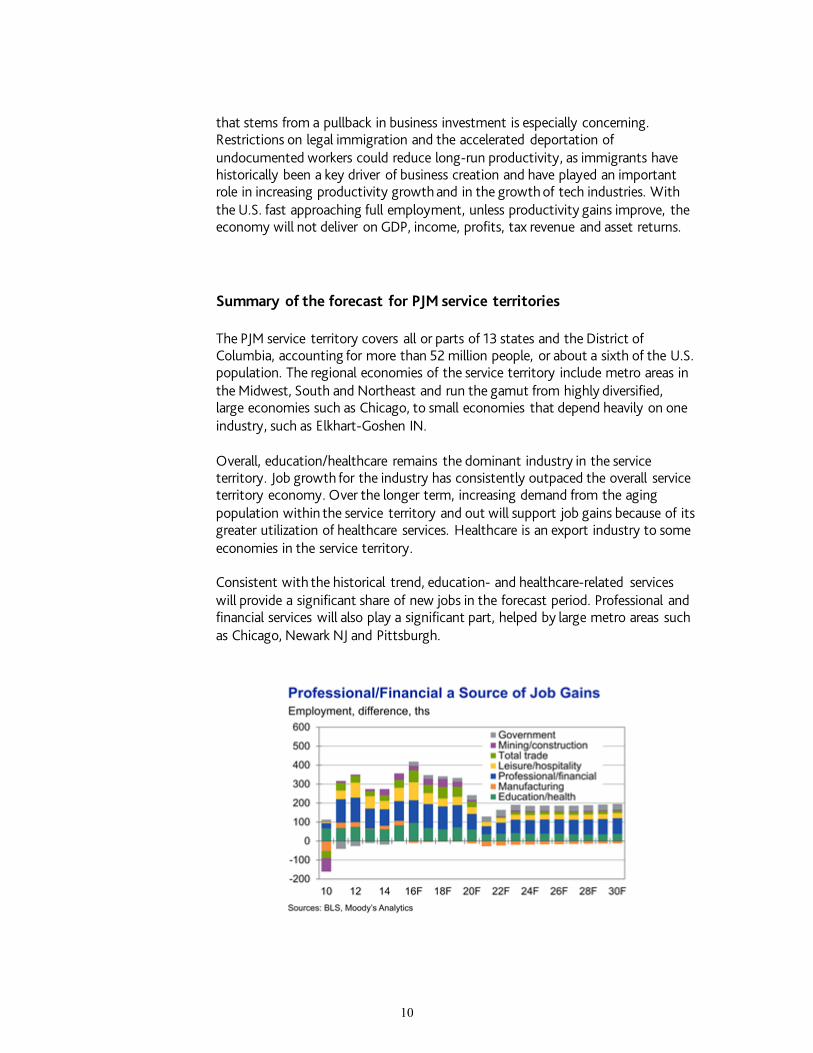
Overall, education/healthcare remains the dominant industry in the service territory. Job growth for the industry has consistently outpaced the overall service territory economy. Over the longer term, increasing demand from the aging population within the service territory and out will support job gains because of its greater utilization of healthcare services. Healthcare is an export industry to some economies in the service territory.
Consistent with the historical trend, education- and healthcare-related services will provide a significant share of new jobs in the forecast period. Professional and financial services will also play a significant part, helped by large metro areas such as Chicago, Newark NJ and Pittsburgh.
10

On average, the concentration of manufacturing in the service territory is roughly in line with the national average. However, approximately 60% of the metro areas, mainly smaller old-line manufacturing localities in the Northeast and Midwest, rely more heavily on industrial production for growth. The highest concentration of manufacturing is in Elkhart-Goshen IN, where nearly half of all jobs are in manufacturing. In contrast, the lowest concentration is in California-Lexington Park MD, where less than 1% of employment is in manufacturing.
The natural resources and mining industry represents a small portion of the service territory’s economy, but has been a major source of weakness in recent years. Low energy prices, a glut of natural gas, and heightened regulatory burdens on coal producers have left the industry shedding employment even faster in 2016 than last year. Compared with a year earlier, natural resources and mining employment has declined 15%. The losses have been widespread in the service territory, with significant declines in Pennsylvania, Ohio, Virginia and West Virginia. The good news is that employment has flatlined in the last few months, and even increased in Ohio. This suggests that the worst losses may be in the past.
Weakness in natural resources and mining is also affecting manufacturing, as demand for inputs falters. This has been especially pronounced in the areas with significant natural gas industries, such as Pittsburgh and Williamsport PA. Additional manufacturing weakness is being caused by a strong U.S. dollar, weakness in global demand, and a turn in the inventory cycle have weighed on output. Some of these weights will prove more persistent than others. The dollar will likely appreciate further as the Fed tightens monetary policy more in 2016.
While the public sector has a slightly smaller presence in the service territory than it does nationally, there is a greater concentration of federal government employment. This is largely due to the presence of the Washington-Arlington-Alexandria metro division, which contains the nation’s capital and is home to one out of 10 federal government employees. With federal budget deficits under 3% and the deficit forecast over the next 10 years improving, the political pressure for austerity has declined. However, poor state fiscal positions in Illinois and Pennsylvania present a risk to the forecast for the service territory.
11
Recent Performance
The service territory economy continues to improve. While the estimate of GDP growth from the third quarter of 2015 to the third quarter of 2016 is lower than expected, it still showed modest real growth. Total employment was much closer to the forecast, at 1.6% year to year in the third quarter compared with a forecast of 1.8%. Total employment is only 20,000 jobs short of 28 million forecast.
Healthcare/education has outperformed the forecast, as job growth has accelerated faster than expected. The acceleration is due to fading adjustment costs from the Affordable Care Act, which had weighed on hospital profitability and employment in particular. In addition, declining uninsured rates due to the Affordable Care Act and state Medicaid expansions are increasing the demand for healthcare services as well.
The tightening in the job market and increased churn have boosted income as jobs are more plentiful and employers must increasingly raise wages to hire and retain workers. Although real income growth in the second quarter, the most recent available data, has not improved as quickly as forecast it is likely that this will be revised upward. The added income has boosted consumer spending, which has benefited leisure/hospitality. Employment in leisure/hospitality is rising nearly twice as fast as overall employment, and is now well above last year’s forecast.
Manufacturing employment shrunk compared with a year earlier, falling short of expectations. Manufacturing is an important driver, particularly in many of the territory’s Midwest metal-producing and auto-related metro areas. A stronger dollar has held job growth back by eroding international competitiveness of manufacturing exports. Another factor has been spillover job losses from natural resources and mining. This can be seen clearly in the significant manufacturing losses in Pittsburgh, where manufacturers that supply the coal and natural gas industries have suffered layoffs.
Finance has given back some of the jobs generated in 2015 and has fallen short of the forecast. Professional and business services have been stronger, providing a wider boost to the economy thanks to high-paying, high-wage jobs. Gains in professional and business services have been especially strong in Philadelphia and the suburban Philadelphia metro division of Bucks-Chester-Montgomery. The region’s concentration of life science research institutes and skilled workforce are helping, with scientific research and development services adding nearly 1,000 jobs over the last year in Montgomery-Bucks-Chester.
While some metro areas grew fast in the service territory, others suffered job losses this year. The biggest losses were in Elkhart-Goshen IN, where the strong dollar has weighed on exports of recreational vehicles that the metro area specializes in, costing it 6% of its manufacturing jobs over the last year. Atlantic City NJ remains near the bottom of the list because of a casino industry has struggled under stiff regional competition. Williamsport PA is also among the
12

worst performing metro areas as a result of its reliance on the struggling natural gas industry.
While job growth in the service area is lagging that of the U.S. overall, it has closed the gap in 2016 as private services have picked up steam.
Local government remains a source of weakness in some areas because of state and local fiscal problems, in particular Illinois and Pennsylvania. Increasing pension costs are weighing on some areas, which has led local government employment to fall in Philadelphia, Allentown-Bethlehem and Lancaster PA.
Pennsylvania and Ohio are steadily adding jobs, which account for a substantial portion of PJM’s customers. Ohio and Pennsylvania metro areas make up 36% of the territory’s payroll employment.
Ohio’s economy is in the midst of its longest spate of growth since the early 1990s. Though slightly underperforming the Midwest, the state has strengthened since midyear thanks to solid growth in private services, which lifted payroll employment in the third quarter to its highest since late 2001. Technical services, healthcare, and transportation and warehousing are key growth drivers. The factory sector has been mixed with auto and heavy machinery manufacturing advancing but with steel manufacturing in the midst of a protracted slump. The jobless rate fell to 4.7% in August, but this was partially driven by a drop in the labor force in addition to more robust hiring.
Pennsylvania is lagging the rest of the Northeast, as challenges for goods producers are holding back the economy. Weak global demand, a strong dollar, and an energy glut have led to job losses in manufacturing and natural resources/mining, which together shaved 0.3 percentage point from overall job growth. This has slowed but not stopped progress toward full employment. Job additions are still around 1% year over year, a respectable pace for a state that is weathering fallout in manufacturing and energy, and has an aging and slowly growing population. Job opportunities have even improved enough to draw people back into the labor force to look for work.
13

Near-term outlook and changes to the forecast
The 2016 regional baseline forecast was generated in the context of the U.S. macro forecast. Changes to the near-term outlook for the PJM service territory are similar to those in the U.S. macro forecast. The recent performance was weaker than expected in terms of output, but closer to expectations in terms of employment. This reflects weak growth in productivity, a nationwide phenomenon. Overall, the forecast has been lowered for the next few quarters. However, the recovery is now expected to last longer than previously expected as a result of the slower return to full employment.
Manufacturing is an area that fell short of expectations in 2016 because of the stronger dollar, low energy prices, weakness in global demand, and a turn in the inventory cycle. However, following a broader U.S. trend, the near-term outlook for the worst losses for manufacturing are expected to be in the past and employment is expected to hold mostly steady for the next few years. As the U.S. economy heats up over the next two years, this will spur more domestic demand for manufacturing and drive job growth that will temporarily offset the longer structural decline due to automation and globalization.
The single-family housing market has improved steadily, but the robust catch-up in single-family permitting that was expected has not materialized. Probably the strongest, though the least quantifiable, reason for the slower than expected recovery is still-low confidence in the long-term aftermath of the housing crisis, given the strong links between the housing and labor markets. Employment growth may be relatively strong, but growth in the high- and mid-tier jobs needed to lift median income has been insufficient. Indeed, real median family income has been flat for the past 15 years, while real median household income has trended downward.
Given the depth of last decade’s housing crisis, there is also new awareness that purchasing a home may no longer be a solid investment. House prices, like financial prices, may be subject to prolonged downturns in the wake of overinvestment. When added to standard costs such as mortgage interest, property taxes, insurance and maintenance, a home purchase looks less lucrative this decade than prior to 2008.
Multifamily housing has continued to grow but also fell short of the forecast amid reports of skilled worker shortages and an increased backlog of multifamily construction projects.
Strong hiring in the labor market and increased tightness, as measured by the unemployment rate and ratio of employment to working-age population, points to stronger wage income growth in coming years. The indirect effect will be to strengthen household spending, including home purchases. Sales of existing homes will likely expand by close to 1 million annualized over the next two years before they subside, and this increase will also pull up construction. The extent of the projected increase in residential construction depends on the ability of the
14
industry to expand capacity and reduce skilled worker shortages, but builders will still be able to substantially increase the current pace of single-family construction at least.
Overall, the return of the service territory economy to full employment will be more gradual than expected, and as a result above-trend job growth will last slightly longer than previously expected. This short-term outlook mirrors the U.S. macro forecast. Over the past year, manufacturing and housing have fallen short of expectations, while the natural resources and mining sector shed jobs quickly. Growth will hold steady in 2017 as headwinds fade but the economy moves closer to full employment.
Long-term outlook
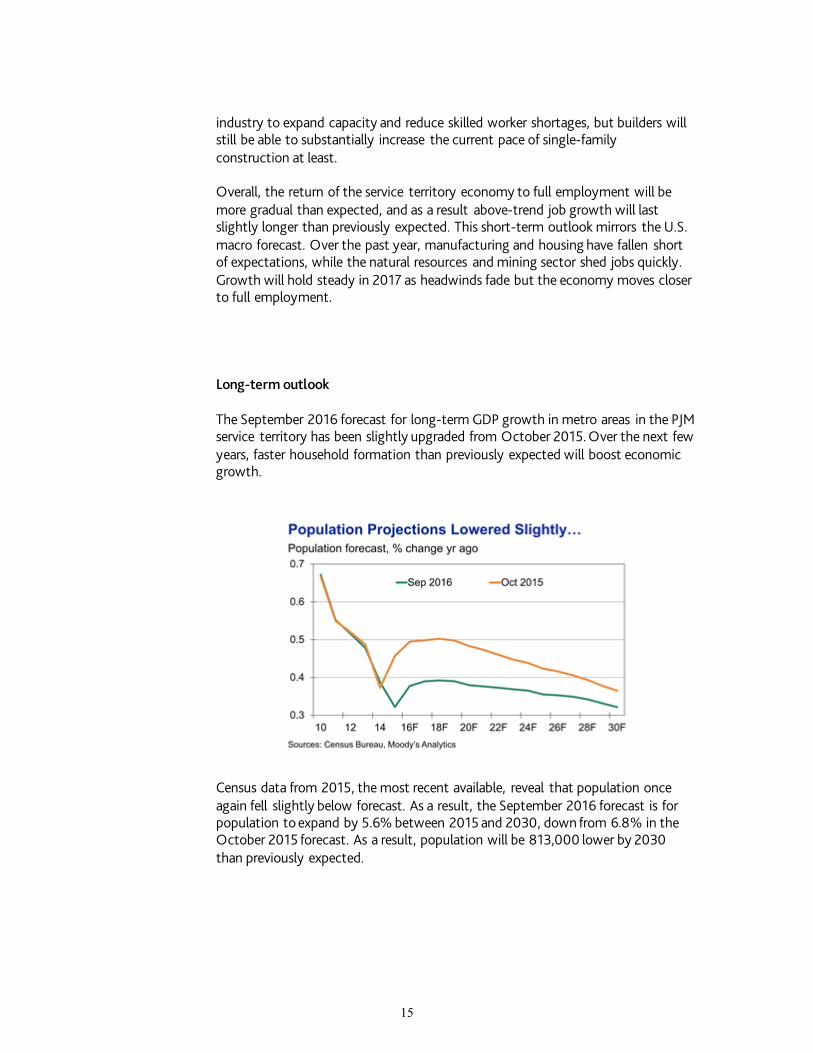
The September 2016 forecast for long-term GDP growth in metro areas in the PJM service territory has been slightly upgraded from October 2015. Over the next few years, faster household formation than previously expected will boost economic growth.
Census data from 2015, the most recent available, reveal that population once again fell slightly below forecast. As a result, the September 2016 forecast is for population to expand by 5.6% between 2015 and 2030, down from 6.8% in the October 2015 forecast. As a result, population will be 813,000 lower by 2030 than previously expected.
15
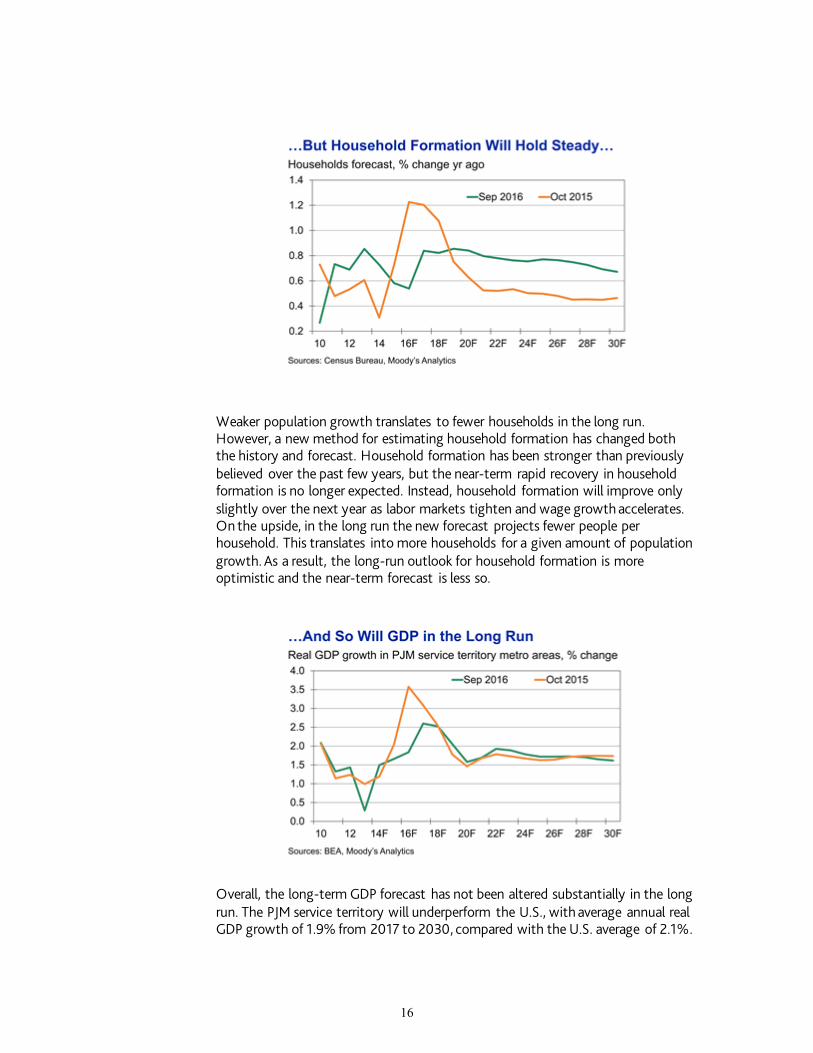
Weaker population growth translates to fewer households in the long run. However, a new method for estimating household formation has changed both the history and forecast. Household formation has been stronger than previously believed over the past few years, but the near-term rapid recovery in household formation is no longer expected. Instead, household formation will improve only slightly over the next year as labor markets tighten and wage growth accelerates. On the upside, in the long run the new forecast projects fewer people per household. This translates into more households for a given amount of population growth. As a result, the long-run outlook for household formation is more optimistic and the near-term forecast is less so.
Overall, the long-term GDP forecast has not been altered substantially in the long run. The PJM service territory will underperform the U.S., with average annual real GDP growth of 1.9% from 2017 to 2030, compared with the U.S. average of 2.1%.
16

Relative to last year’s forecast, GDP growth from 2017 to 2030 in the service territory is unchanged.
The southernmost metro areas, including the southern parts of Pennsylvania, are expected to be among the fastest-growing in the PJM service territory. The biggest comparative advantage for these areas is their favorable demographic trends, which will help boost overall final demand. While the near-term forecast is weaker, household formation will hold steady in the long run and will drive growth in consumer-based services, including education/healthcare and leisure/hospitality.
Suburban areas are outperforming the cities they neighbor in several cases, thanks to higher levels of education and the regulatory and policy problems that big cities face. For example, the Elgin metro division is expected to outpace the Chicago metro division in terms of population and GDP growth, and Montgomery-Bucks-Chester will do the same for Philadelphia. Washington DC will outperform the service territory thanks to a highly educated labor force, productivity growth, and positive demographic trends.
Metro areas in Ohio, West Virginia, and western and northern Pennsylvania will expand more slowly. Expansion in those states will be more restrained as the region transitions away from manufacturing and other blue-collar industries toward more service-oriented economies. With lower-value-added services accounting for a larger part of the regional economies, income gains are expected to be more restrained. Weaker demographics will also undermine long-term growth, as workers and their families are expected to seek opportunities in stronger labor markets outside of the slow-growth metro areas in the Midwest and Northeast. While the presence of institutions of higher education and high tech will help some cities such as Pittsburgh, even there the long-standing blue-collar industry headwinds will lead to below-average demographic performance.
17
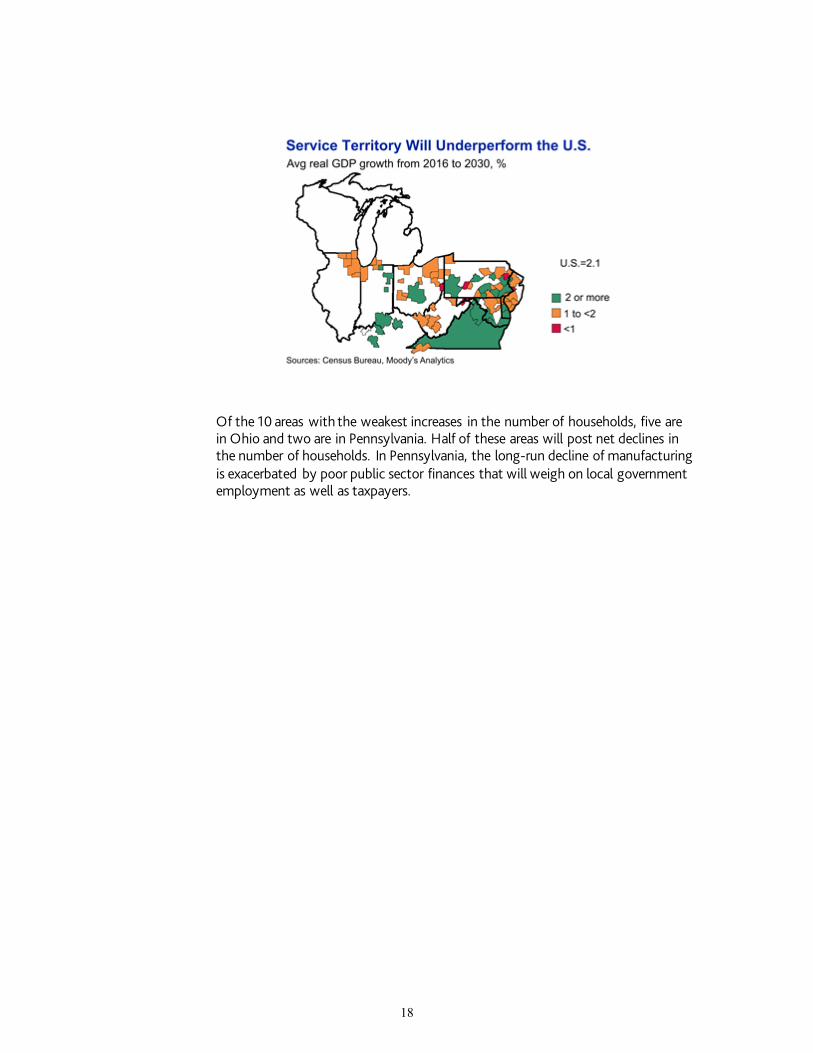
Of the 10 areas with the weakest increases in the number of households, five are in Ohio and two are in Pennsylvania. Half of these areas will post net declines in the number of households. In Pennsylvania, the long-run decline of manufacturing is exacerbated by poor public sector finances that will weigh on local government employment as well as taxpayers.
18
PJM SUMMER PEAK LOAD GROWTH RATE 2017 - 2027
( 0.2%)0.0%
( 0.1%)
0.1%
0.3%
0.2%
( 0.2%)( 0.1%)
0.1%
( 0.0%)( 0.0%)( 0.3%) ( 0.0%)( 0.0%) 0.0%
0.4%
0.3%
0.1%
0.3%
0.1%
0.4%
( 0.0%)
0.3% 0.3%
0.4%
0.2%
PE
RC
EN
T/Y
EA
R
( 0.5%)
0.0%
0.5%
1.0%
1.5%
2.0%
ZONE
AE
BG
E
DPL
JCPL
ME
TE
D
PEC
O
PEN
LC
PEPC
O PL PS
RE
CO
UG
I
EA
STE
RN
MID
-AT
LA
NT
IC
SOU
TH
ER
N M
ID-A
TL
AN
TIC
PJM
MID
-AT
LA
NT
IC
AE
P
APS
AT
SI
CO
ME
D
DA
YT
ON
DE
OK
DL
CO
EK
PC
PJM
WE
STE
RN
DO
M
PJM
RT
O
19
PJM WINTER PEAK LOAD GROWTH RATE 2017 - 2027
( 0.4%)0.1%
0.2%
( 0.2%)
0.2%
0.1%( 0.0%)
0.2%
0.1%( 0.1%)( 0.0%)( 0.4%) ( 0.0%)
0.1%
0.0%
0.5%0.5%
0.2%
0.3%
0.1%
0.4%
0.0%
0.3% 0.3%
0.6%
0.3%
PE
RC
EN
T/Y
EA
R
( 0.5%)
0.0%
0.5%
1.0%
1.5%
2.0%
ZONE
AE
BG
E
DPL
JCPL
ME
TE
D
PEC
O
PEN
LC
PEPC
O PL PS
RE
CO
UG
I
EA
STE
RN
MID
-AT
LA
NT
IC
SOU
TH
ER
N M
ID-A
TL
AN
TIC
PJM
MID
-AT
LA
NT
IC
AE
P
APS
AT
SI
CO
ME
D
DA
YT
ON
DE
OK
DL
CO
EK
PC
PJM
WE
STE
RN
DO
M
PJM
RT
O
20
LO
AD
(MW
)
120,000
130,000
140,000
150,000
160,000
170,000
180,000
190,000
200,000
YEAR
1998 2000 2002 2004 2006 2008 2010 2012 2014 2016 2018 2020 2022 2024 2026 2028 2030 2032
SUMMER PEAK DEMAND FOR PJM RTO GEOGRAPHIC ZONE
Unrestricted Peak Weather Normalized Peak 2016 Forecast 2017 Forecast
LO
AD
(MW
)
90,000
100,000
110,000
120,000
130,000
140,000
150,000
160,000
YEAR
1998 2000 2002 2004 2006 2008 2010 2012 2014 2016 2018 2020 2022 2024 2026 2028 2030 2032
WINTER PEAK DEMAND FOR PJM RTO GEOGRAPHIC ZONE
Unrestricted Peak Weather Normalized Peak 2016 Forecast 2017 Forecast
21

LO
AD
(MW
)
46,000
48,000
50,000
52,000
54,000
56,000
58,000
60,000
62,000
64,000
66,000
YEAR
1998 2000 2002 2004 2006 2008 2010 2012 2014 2016 2018 2020 2022 2024 2026 2028 2030 2032
SUMMER PEAK DEMAND FOR PJM MID-ATLANTIC GEOGRAPHIC ZONE
Unrestricted Peak Weather Normalized Peak 2016 Forecast 2017 Forecast
LO
AD
(MW
)
34,000
35,900
37,800
39,700
41,600
43,500
45,400
47,300
49,200
51,100
53,000
YEAR
1998 2000 2002 2004 2006 2008 2010 2012 2014 2016 2018 2020 2022 2024 2026 2028 2030 2032
WINTER PEAK DEMAND FOR PJM MID-ATLANTIC GEOGRAPHIC ZONE
Unrestricted Peak Weather Normalized Peak 2016 Forecast 2017 Forecast
22
LO
AD
(MW
)
25,000
26,100
27,200
28,300
29,400
30,500
31,600
32,700
33,800
34,900
36,000
YEAR
1998 2000 2002 2004 2006 2008 2010 2012 2014 2016 2018 2020 2022 2024 2026 2028 2030 2032
SUMMER PEAK DEMAND FOR EASTERN MID-ATLANTIC GEOGRAPHIC ZONE
Unrestricted Peak Weather Normalized Peak 2016 Forecast 2017 Forecast
LO
AD
(MW
)
17,000
17,800
18,600
19,400
20,200
21,000
21,800
22,600
23,400
24,200
25,000
YEAR
1998 2000 2002 2004 2006 2008 2010 2012 2014 2016 2018 2020 2022 2024 2026 2028 2030 2032
WINTER PEAK DEMAND FOR EASTERN MID-ATLANTIC GEOGRAPHIC ZONE
Unrestricted Peak Weather Normalized Peak 2016 Forecast 2017 Forecast
23
LO
AD
(MW
)
11,000
11,400
11,800
12,200
12,600
13,000
13,400
13,800
14,200
14,600
15,000
YEAR
1998 2000 2002 2004 2006 2008 2010 2012 2014 2016 2018 2020 2022 2024 2026 2028 2030 2032
SUMMER PEAK DEMAND FOR SOUTHERN MID-ATLANTIC GEOGRAPHIC ZONE
Unrestricted Peak Weather Normalized Peak 2016 Forecast 2017 Forecast
LO
AD
(MW
)
8,000
8,550
9,100
9,650
10,200
10,750
11,300
11,850
12,400
12,950
13,500
YEAR
1998 2000 2002 2004 2006 2008 2010 2012 2014 2016 2018 2020 2022 2024 2026 2028 2030 2032
WINTER PEAK DEMAND FOR SOUTHERN MID-ATLANTIC GEOGRAPHIC ZONE
Unrestricted Peak Weather Normalized Peak 2016 Forecast 2017 Forecast
24
LO
AD
(MW
)
66,000
68,600
71,200
73,800
76,400
79,000
81,600
84,200
86,800
89,400
92,000
YEAR
1998 2000 2002 2004 2006 2008 2010 2012 2014 2016 2018 2020 2022 2024 2026 2028 2030 2032
SUMMER PEAK DEMAND FOR PJM WESTERN GEOGRAPHIC ZONE
Unrestricted Peak Weather Normalized Peak 2016 Forecast 2017 Forecast
LO
AD
(MW
)
50,000
53,100
56,200
59,300
62,400
65,500
68,600
71,700
74,800
77,900
81,000
YEAR
1998 2000 2002 2004 2006 2008 2010 2012 2014 2016 2018 2020 2022 2024 2026 2028 2030 2032
WINTER PEAK DEMAND FOR PJM WESTERN GEOGRAPHIC ZONE
Unrestricted Peak Weather Normalized Peak 2016 Forecast 2017 Forecast
25
LO
AD
(MW
)
2,100
2,200
2,300
2,400
2,500
2,600
2,700
2,800
2,900
3,000
3,100
YEAR
1998 2000 2002 2004 2006 2008 2010 2012 2014 2016 2018 2020 2022 2024 2026 2028 2030 2032
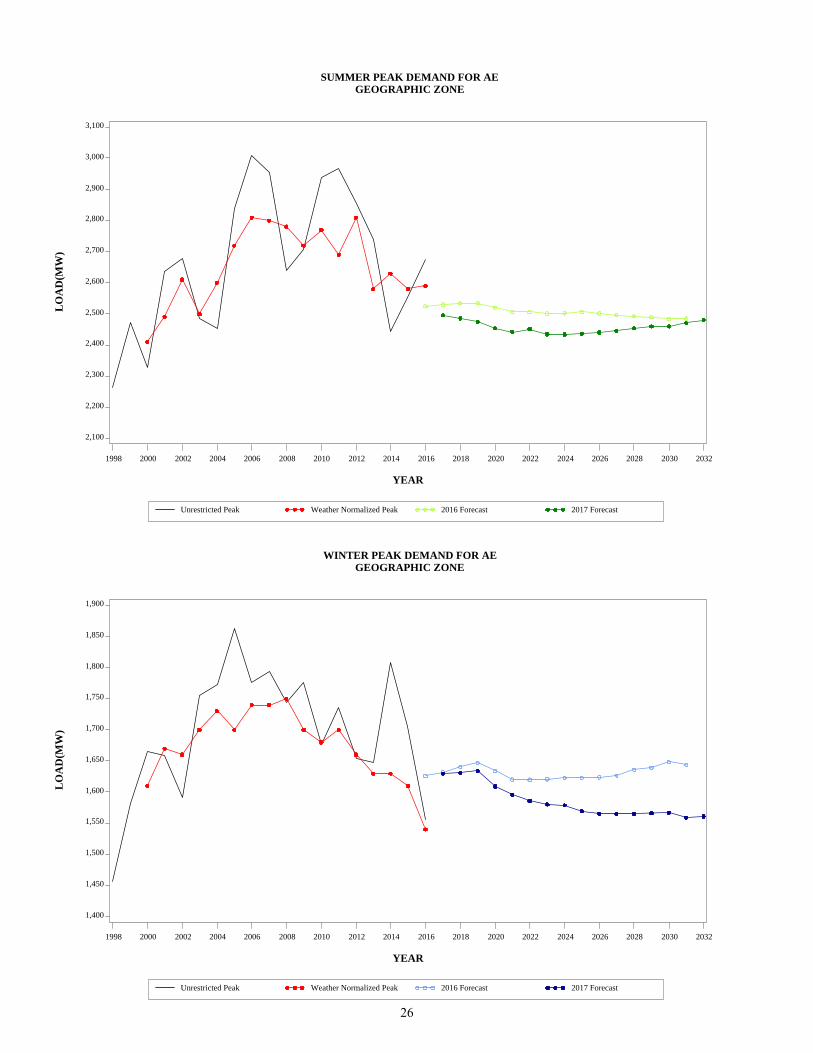
SUMMER PEAK DEMAND FOR AE GEOGRAPHIC ZONE
Unrestricted Peak Weather Normalized Peak 2016 Forecast 2017 Forecast
LO
AD
(MW
)
1,400
1,450
1,500
1,550
1,600
1,650
1,700
1,750
1,800
1,850
1,900
YEAR
1998 2000 2002 2004 2006 2008 2010 2012 2014 2016 2018 2020 2022 2024 2026 2028 2030 2032
WINTER PEAK DEMAND FOR AE GEOGRAPHIC ZONE
Unrestricted Peak Weather Normalized Peak 2016 Forecast 2017 Forecast
26
LO
AD
(MW
)
5,700
5,900
6,100
6,300
6,500
6,700
6,900
7,100
7,300
7,500
7,700
YEAR
1998 2000 2002 2004 2006 2008 2010 2012 2014 2016 2018 2020 2022 2024 2026 2028 2030 2032
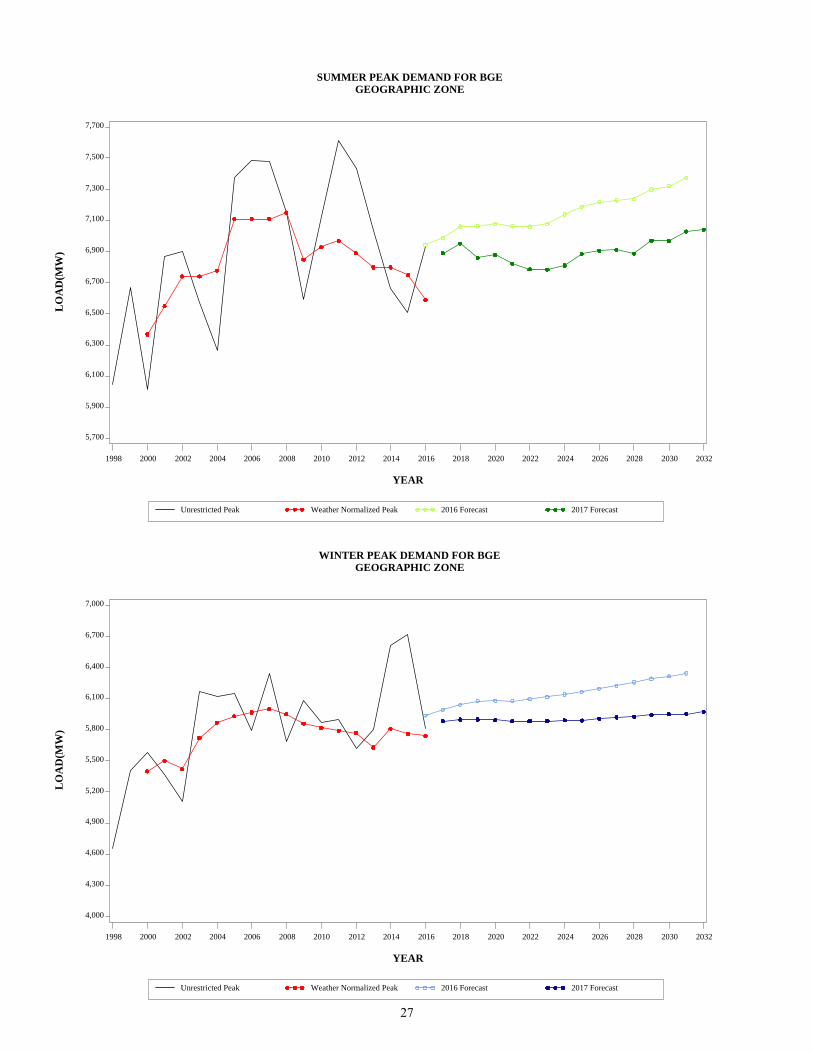
SUMMER PEAK DEMAND FOR BGE GEOGRAPHIC ZONE
Unrestricted Peak Weather Normalized Peak 2016 Forecast 2017 Forecast
LO
AD
(MW
)
4,000
4,300
4,600
4,900
5,200
5,500
5,800
6,100
6,400
6,700
7,000
YEAR
1998 2000 2002 2004 2006 2008 2010 2012 2014 2016 2018 2020 2022 2024 2026 2028 2030 2032
WINTER PEAK DEMAND FOR BGE GEOGRAPHIC ZONE
Unrestricted Peak Weather Normalized Peak 2016 Forecast 2017 Forecast
27
LO
AD
(MW
)
3,100
3,250
3,400
3,550
3,700
3,850
4,000
4,150
4,300
4,450
4,600
YEAR
1998 2000 2002 2004 2006 2008 2010 2012 2014 2016 2018 2020 2022 2024 2026 2028 2030 2032
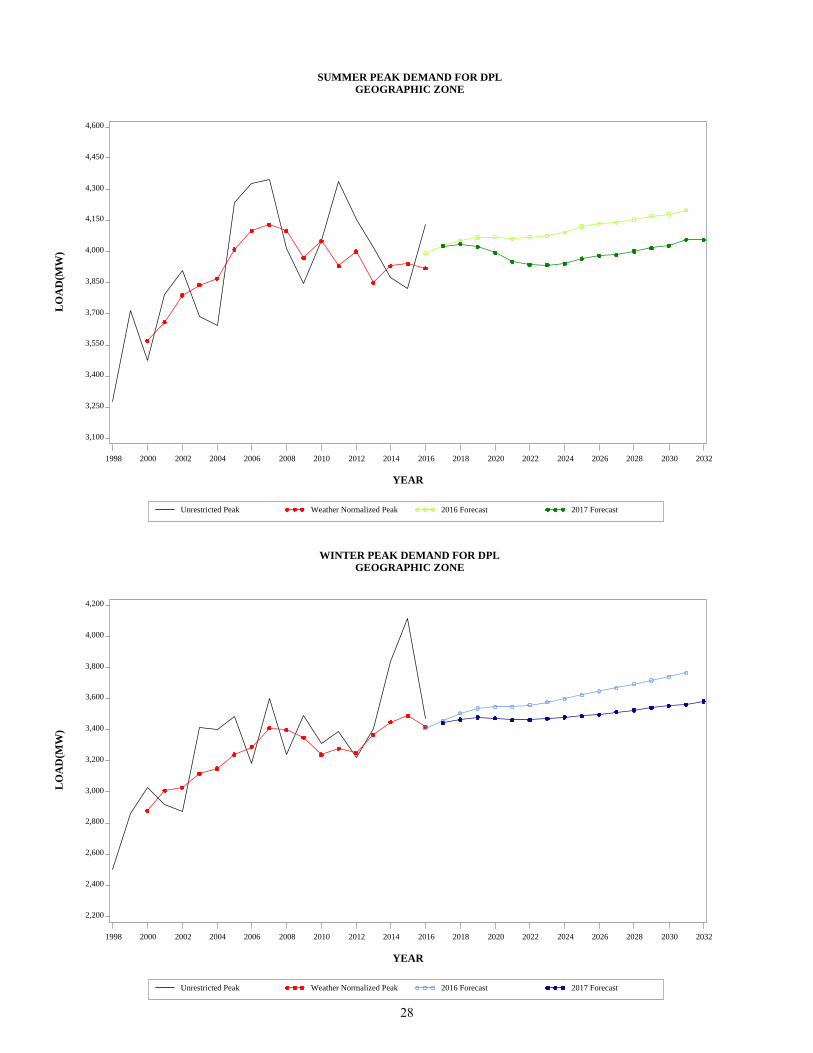
SUMMER PEAK DEMAND FOR DPL GEOGRAPHIC ZONE
Unrestricted Peak Weather Normalized Peak 2016 Forecast 2017 Forecast
LO
AD
(MW
)
2,200
2,400
2,600
2,800
3,000
3,200
3,400
3,600
3,800
4,000
4,200
YEAR
1998 2000 2002 2004 2006 2008 2010 2012 2014 2016 2018 2020 2022 2024 2026 2028 2030 2032
WINTER PEAK DEMAND FOR DPL GEOGRAPHIC ZONE
Unrestricted Peak Weather Normalized Peak 2016 Forecast 2017 Forecast
28
LO
AD
(MW
)
4,600
4,850
5,100
5,350
5,600
5,850
6,100
6,350
6,600
6,850
7,100
YEAR
1998 2000 2002 2004 2006 2008 2010 2012 2014 2016 2018 2020 2022 2024 2026 2028 2030 2032
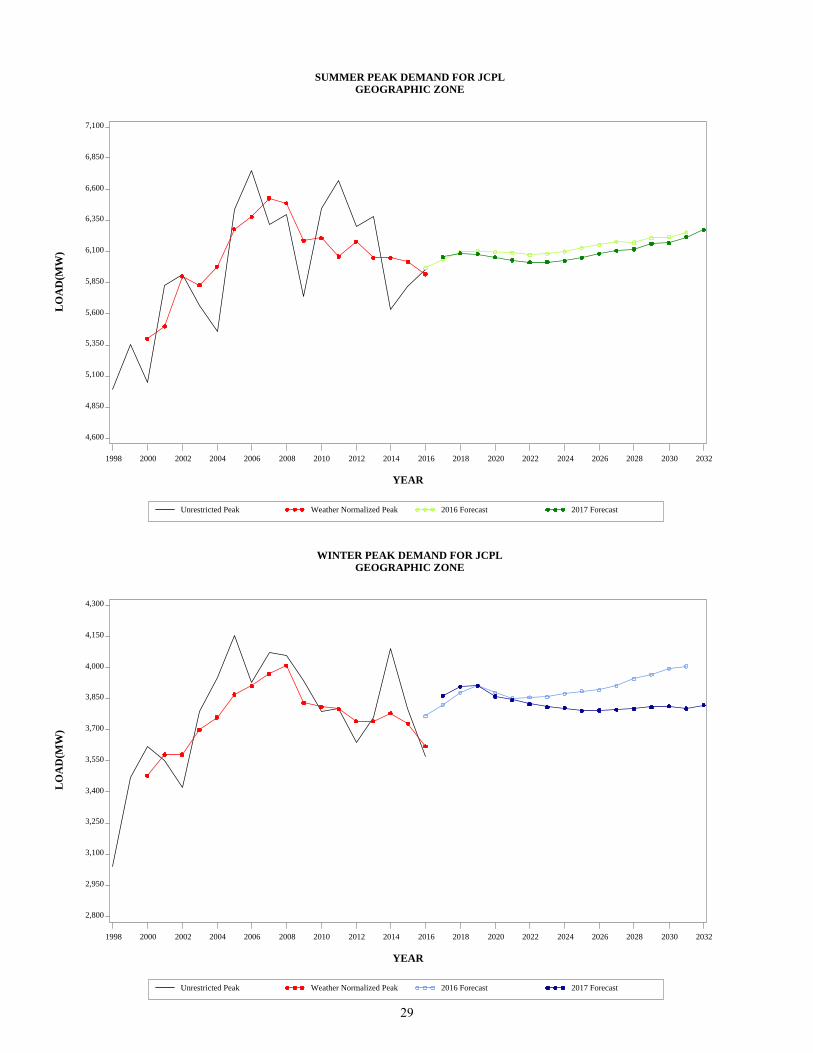
SUMMER PEAK DEMAND FOR JCPL GEOGRAPHIC ZONE
Unrestricted Peak Weather Normalized Peak 2016 Forecast 2017 Forecast
LO
AD
(MW
)
2,800
2,950
3,100
3,250
3,400
3,550
3,700
3,850
4,000
4,150
4,300
YEAR
1998 2000 2002 2004 2006 2008 2010 2012 2014 2016 2018 2020 2022 2024 2026 2028 2030 2032
WINTER PEAK DEMAND FOR JCPL GEOGRAPHIC ZONE
Unrestricted Peak Weather Normalized Peak 2016 Forecast 2017 Forecast
29
LO
AD
(MW
)
2,000
2,150
2,300
2,450
2,600
2,750
2,900
3,050
3,200
3,350
3,500
YEAR
1998 2000 2002 2004 2006 2008 2010 2012 2014 2016 2018 2020 2022 2024 2026 2028 2030 2032
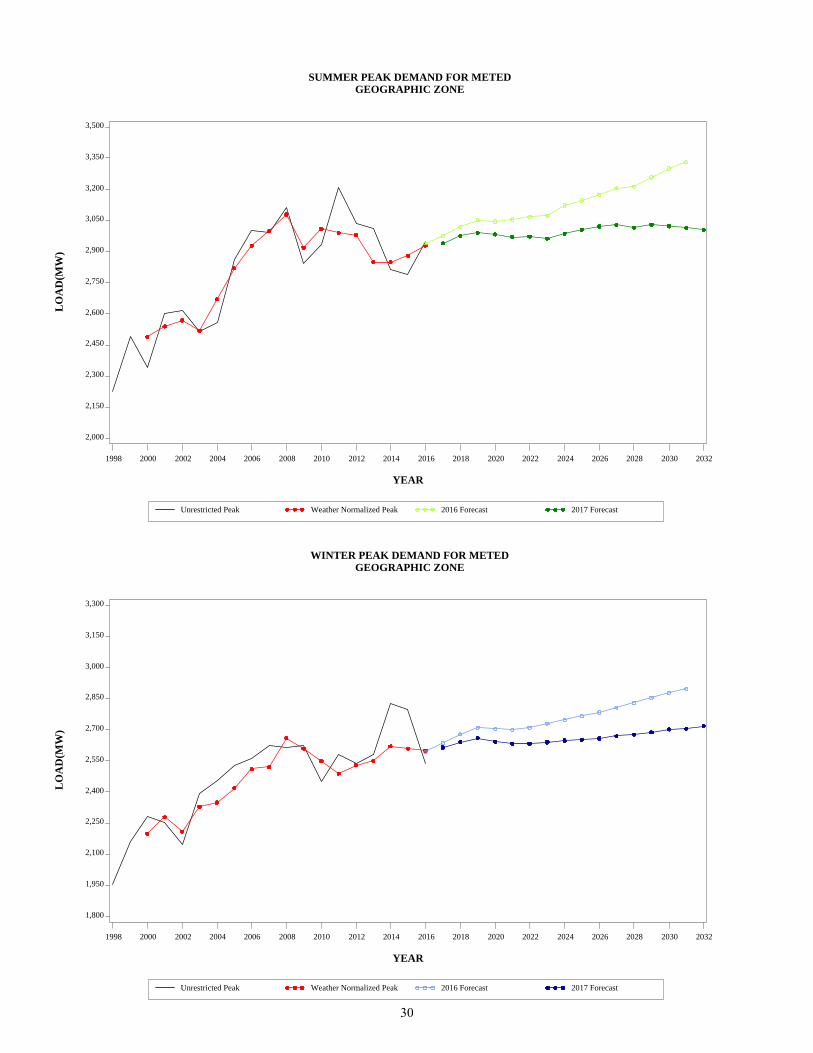
SUMMER PEAK DEMAND FOR METED GEOGRAPHIC ZONE
Unrestricted Peak Weather Normalized Peak 2016 Forecast 2017 Forecast
LO
AD
(MW
)
1,800
1,950
2,100
2,250
2,400
2,550
2,700
2,850
3,000
3,150
3,300
YEAR
1998 2000 2002 2004 2006 2008 2010 2012 2014 2016 2018 2020 2022 2024 2026 2028 2030 2032
WINTER PEAK DEMAND FOR METED GEOGRAPHIC ZONE
Unrestricted Peak Weather Normalized Peak 2016 Forecast 2017 Forecast
30
LO
AD
(MW
)
6,500
6,850
7,200
7,550
7,900
8,250
8,600
8,950
9,300
9,650
10,000
YEAR
1998 2000 2002 2004 2006 2008 2010 2012 2014 2016 2018 2020 2022 2024 2026 2028 2030 2032
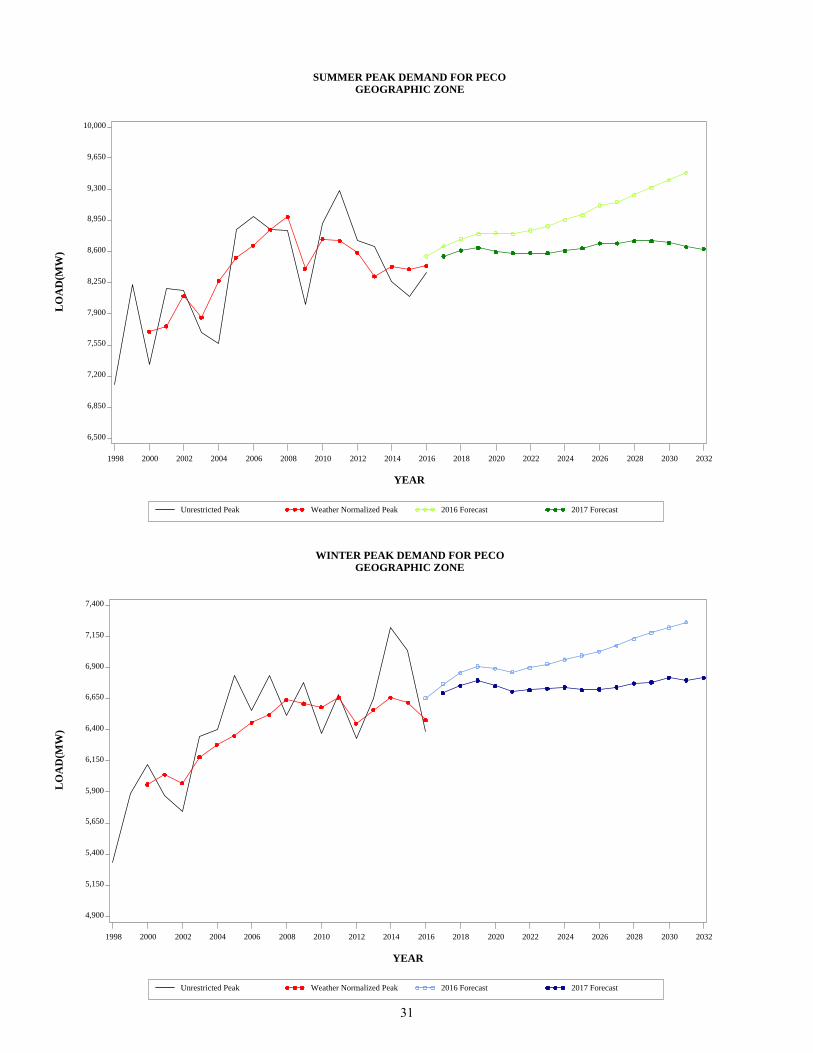
SUMMER PEAK DEMAND FOR PECO GEOGRAPHIC ZONE
Unrestricted Peak Weather Normalized Peak 2016 Forecast 2017 Forecast
LO
AD
(MW
)
4,900
5,150
5,400
5,650
5,900
6,150
6,400
6,650
6,900
7,150
7,400
YEAR
1998 2000 2002 2004 2006 2008 2010 2012 2014 2016 2018 2020 2022 2024 2026 2028 2030 2032
WINTER PEAK DEMAND FOR PECO GEOGRAPHIC ZONE
Unrestricted Peak Weather Normalized Peak 2016 Forecast 2017 Forecast
31
LO
AD
(MW
)
2,300
2,400
2,500
2,600
2,700
2,800
2,900
3,000
3,100
3,200
3,300
YEAR
1998 2000 2002 2004 2006 2008 2010 2012 2014 2016 2018 2020 2022 2024 2026 2028 2030 2032
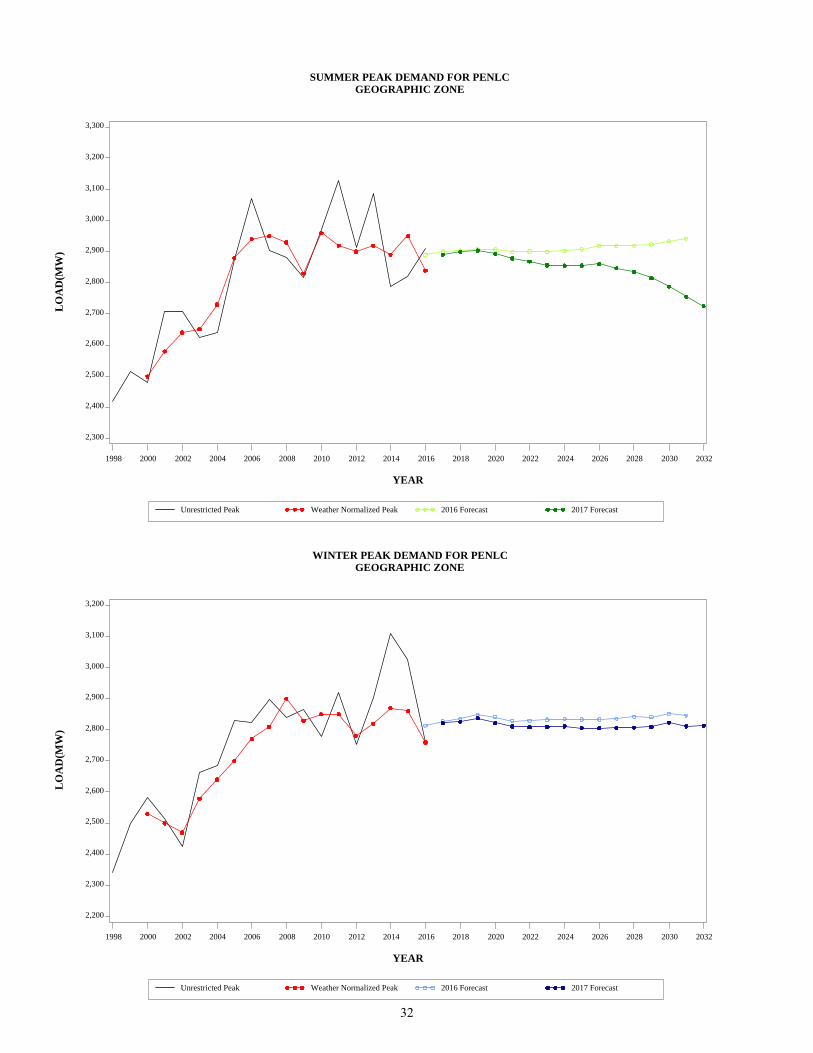
SUMMER PEAK DEMAND FOR PENLC GEOGRAPHIC ZONE
Unrestricted Peak Weather Normalized Peak 2016 Forecast 2017 Forecast
LO
AD
(MW
)
2,200
2,300
2,400
2,500
2,600
2,700
2,800
2,900
3,000
3,100
3,200
YEAR
1998 2000 2002 2004 2006 2008 2010 2012 2014 2016 2018 2020 2022 2024 2026 2028 2030 2032
WINTER PEAK DEMAND FOR PENLC GEOGRAPHIC ZONE
Unrestricted Peak Weather Normalized Peak 2016 Forecast 2017 Forecast
32
LO
AD
(MW
)
5,500
5,700
5,900
6,100
6,300
6,500
6,700
6,900
7,100
7,300
7,500
YEAR
1998 2000 2002 2004 2006 2008 2010 2012 2014 2016 2018 2020 2022 2024 2026 2028 2030 2032
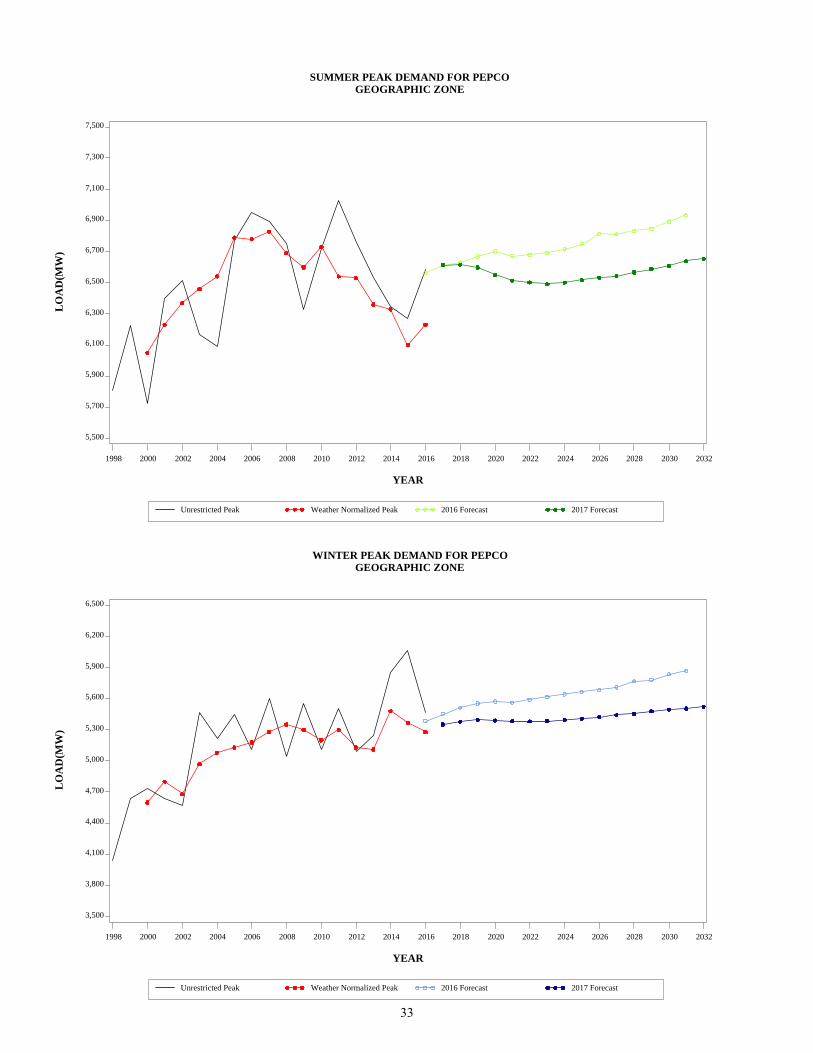
SUMMER PEAK DEMAND FOR PEPCO GEOGRAPHIC ZONE
Unrestricted Peak Weather Normalized Peak 2016 Forecast 2017 Forecast
LO
AD
(MW
)
3,500
3,800
4,100
4,400
4,700
5,000
5,300
5,600
5,900
6,200
6,500
YEAR
1998 2000 2002 2004 2006 2008 2010 2012 2014 2016 2018 2020 2022 2024 2026 2028 2030 2032
WINTER PEAK DEMAND FOR PEPCO GEOGRAPHIC ZONE
Unrestricted Peak Weather Normalized Peak 2016 Forecast 2017 Forecast
33
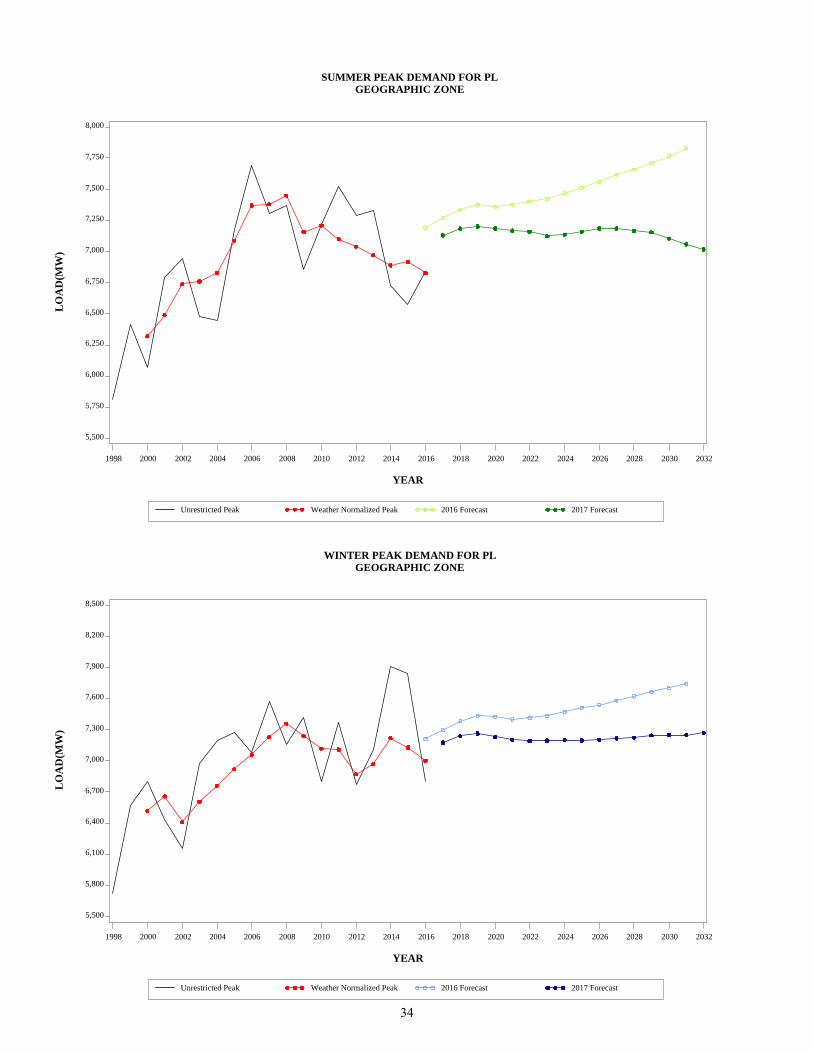
LO
AD
(MW
)
5,500
5,750
6,000
6,250
6,500
6,750
7,000
7,250
7,500
7,750
8,000
YEAR
1998 2000 2002 2004 2006 2008 2010 2012 2014 2016 2018 2020 2022 2024 2026 2028 2030 2032
SUMMER PEAK DEMAND FOR PL GEOGRAPHIC ZONE
Unrestricted Peak Weather Normalized Peak 2016 Forecast 2017 Forecast
LO
AD
(MW
)
5,500
5,800
6,100
6,400
6,700
7,000
7,300
7,600
7,900
8,200
8,500
YEAR
1998 2000 2002 2004 2006 2008 2010 2012 2014 2016 2018 2020 2022 2024 2026 2028 2030 2032
WINTER PEAK DEMAND FOR PL GEOGRAPHIC ZONE
Unrestricted Peak Weather Normalized Peak 2016 Forecast 2017 Forecast
34
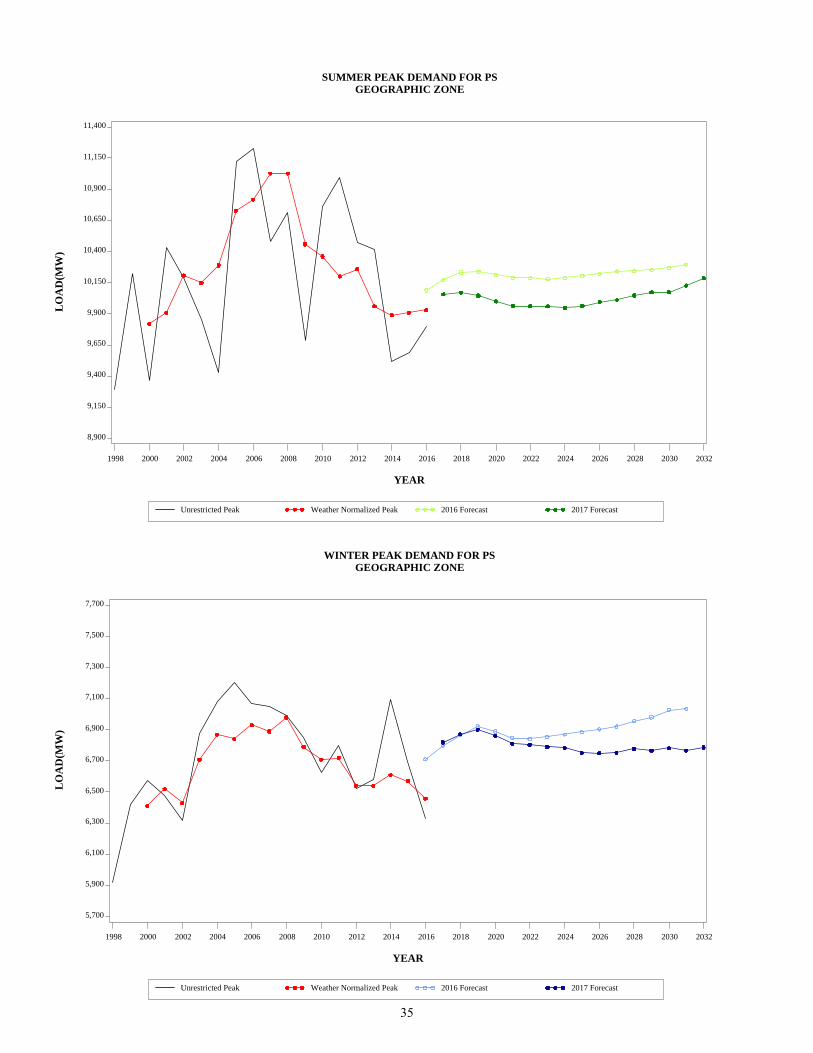
LO
AD
(MW
)
8,900
9,150
9,400
9,650
9,900
10,150
10,400
10,650
10,900
11,150
11,400
YEAR
1998 2000 2002 2004 2006 2008 2010 2012 2014 2016 2018 2020 2022 2024 2026 2028 2030 2032
SUMMER PEAK DEMAND FOR PS GEOGRAPHIC ZONE
Unrestricted Peak Weather Normalized Peak 2016 Forecast 2017 Forecast
LO
AD
(MW
)
5,700
5,900
6,100
6,300
6,500
6,700
6,900
7,100
7,300
7,500
7,700
YEAR
1998 2000 2002 2004 2006 2008 2010 2012 2014 2016 2018 2020 2022 2024 2026 2028 2030 2032
WINTER PEAK DEMAND FOR PS GEOGRAPHIC ZONE
Unrestricted Peak Weather Normalized Peak 2016 Forecast 2017 Forecast
35
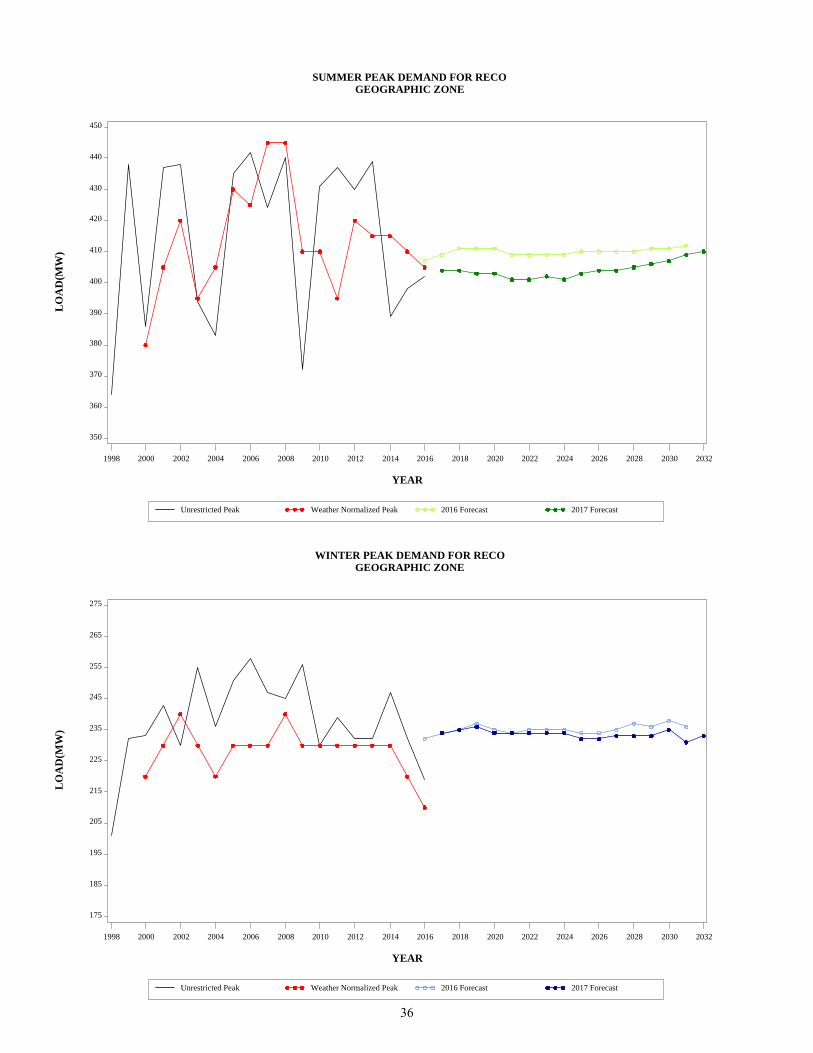
LO
AD
(MW
)
350
360
370
380
390
400
410
420
430
440
450
YEAR
1998 2000 2002 2004 2006 2008 2010 2012 2014 2016 2018 2020 2022 2024 2026 2028 2030 2032
SUMMER PEAK DEMAND FOR RECO GEOGRAPHIC ZONE
Unrestricted Peak Weather Normalized Peak 2016 Forecast 2017 Forecast
LO
AD
(MW
)
175
185
195
205
215
225
235
245
255
265
275
YEAR
1998 2000 2002 2004 2006 2008 2010 2012 2014 2016 2018 2020 2022 2024 2026 2028 2030 2032
WINTER PEAK DEMAND FOR RECO GEOGRAPHIC ZONE
Unrestricted Peak Weather Normalized Peak 2016 Forecast 2017 Forecast
36
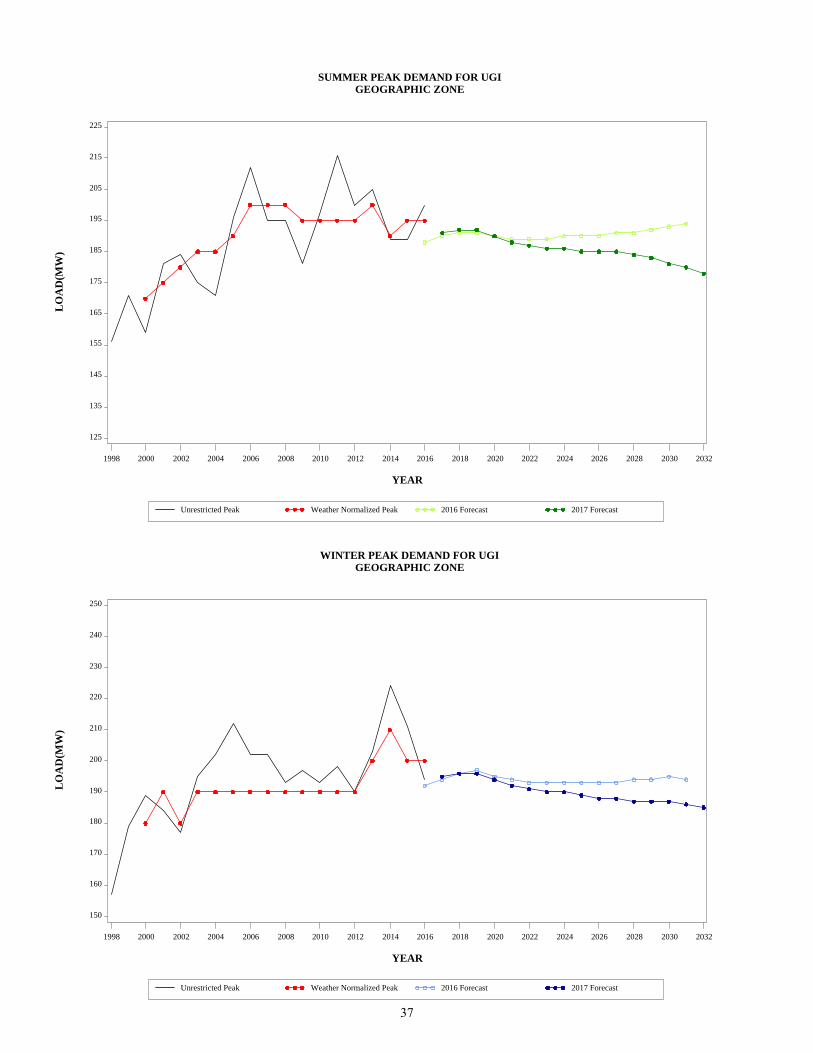
LO
AD
(MW
)
125
135
145
155
165
175
185
195
205
215
225
YEAR
1998 2000 2002 2004 2006 2008 2010 2012 2014 2016 2018 2020 2022 2024 2026 2028 2030 2032
SUMMER PEAK DEMAND FOR UGI GEOGRAPHIC ZONE
Unrestricted Peak Weather Normalized Peak 2016 Forecast 2017 Forecast
LO
AD
(MW
)
150
160
170
180
190
200
210
220
230
240
250
YEAR
1998 2000 2002 2004 2006 2008 2010 2012 2014 2016 2018 2020 2022 2024 2026 2028 2030 2032
WINTER PEAK DEMAND FOR UGI GEOGRAPHIC ZONE
Unrestricted Peak Weather Normalized Peak 2016 Forecast 2017 Forecast
37
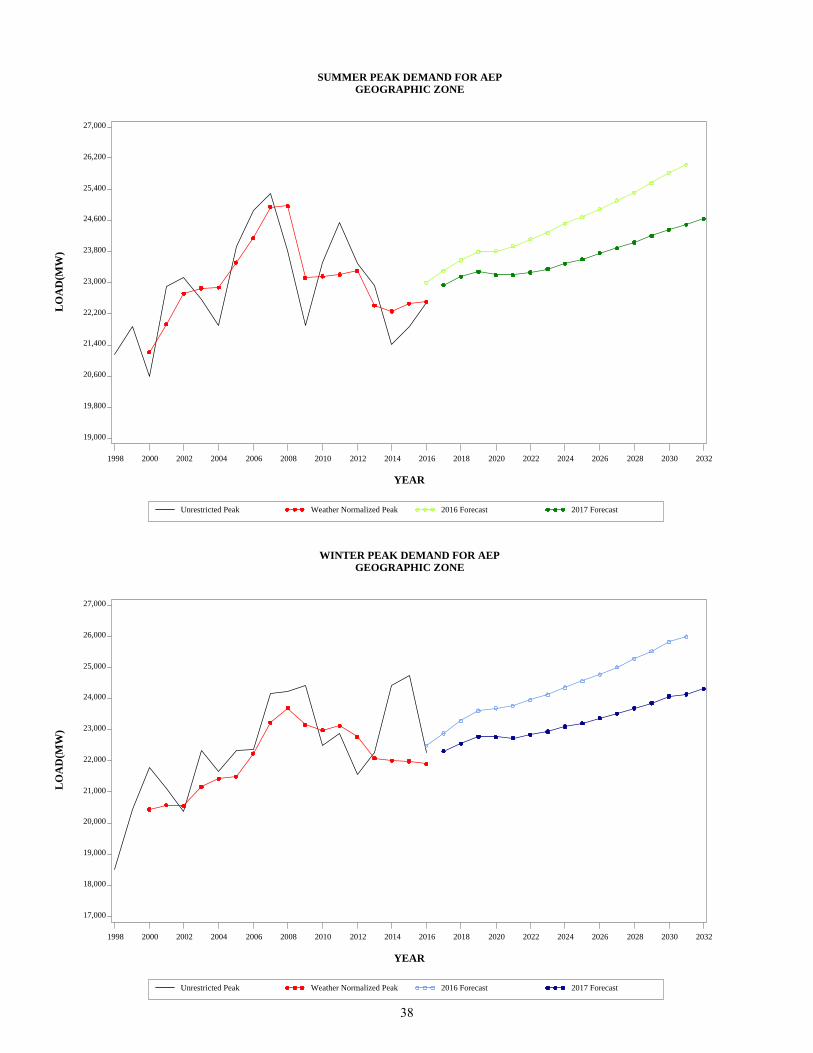
LO
AD
(MW
)
19,000
19,800
20,600
21,400
22,200
23,000
23,800
24,600
25,400
26,200
27,000
YEAR
1998 2000 2002 2004 2006 2008 2010 2012 2014 2016 2018 2020 2022 2024 2026 2028 2030 2032
SUMMER PEAK DEMAND FOR AEP GEOGRAPHIC ZONE
Unrestricted Peak Weather Normalized Peak 2016 Forecast 2017 Forecast
LO
AD
(MW
)
17,000
18,000
19,000
20,000
21,000
22,000
23,000
24,000
25,000
26,000
27,000
YEAR
1998 2000 2002 2004 2006 2008 2010 2012 2014 2016 2018 2020 2022 2024 2026 2028 2030 2032
WINTER PEAK DEMAND FOR AEP GEOGRAPHIC ZONE
Unrestricted Peak Weather Normalized Peak 2016 Forecast 2017 Forecast
38
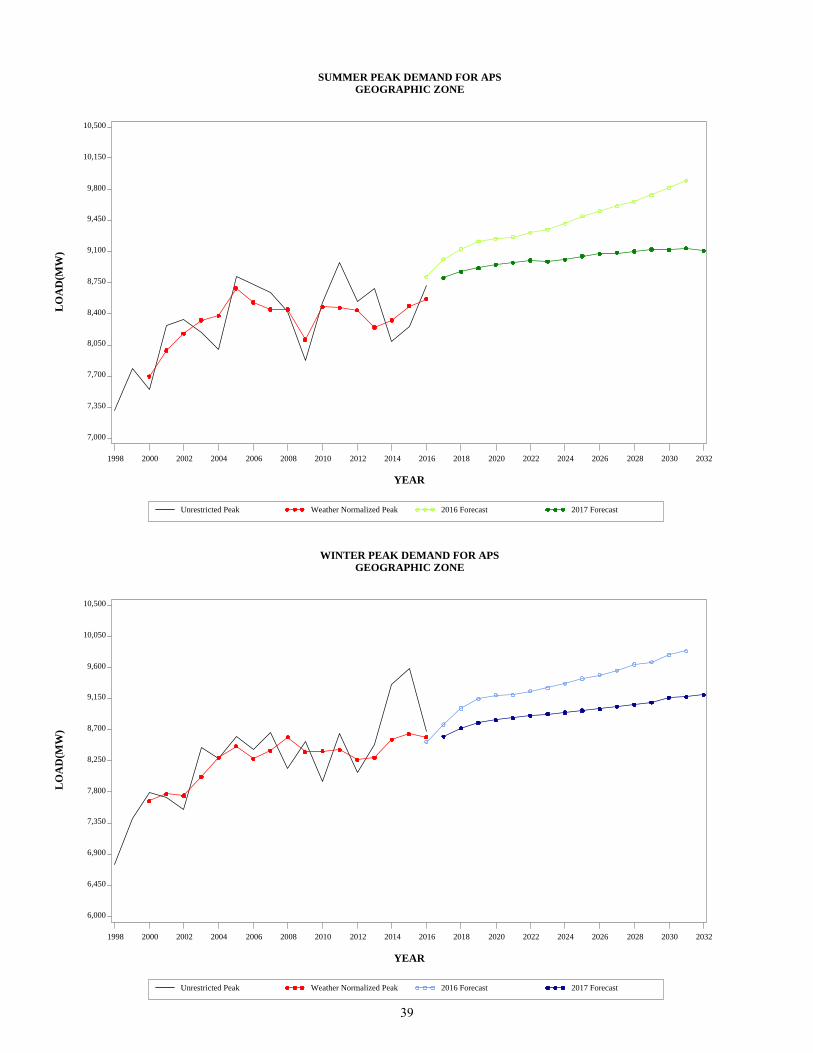
LO
AD
(MW
)
7,000
7,350
7,700
8,050
8,400
8,750
9,100
9,450
9,800
10,150
10,500
YEAR
1998 2000 2002 2004 2006 2008 2010 2012 2014 2016 2018 2020 2022 2024 2026 2028 2030 2032
SUMMER PEAK DEMAND FOR APS GEOGRAPHIC ZONE
Unrestricted Peak Weather Normalized Peak 2016 Forecast 2017 Forecast
LO
AD
(MW
)
6,000
6,450
6,900
7,350
7,800
8,250
8,700
9,150
9,600
10,050
10,500
YEAR
1998 2000 2002 2004 2006 2008 2010 2012 2014 2016 2018 2020 2022 2024 2026 2028 2030 2032
WINTER PEAK DEMAND FOR APS GEOGRAPHIC ZONE
Unrestricted Peak Weather Normalized Peak 2016 Forecast 2017 Forecast
39
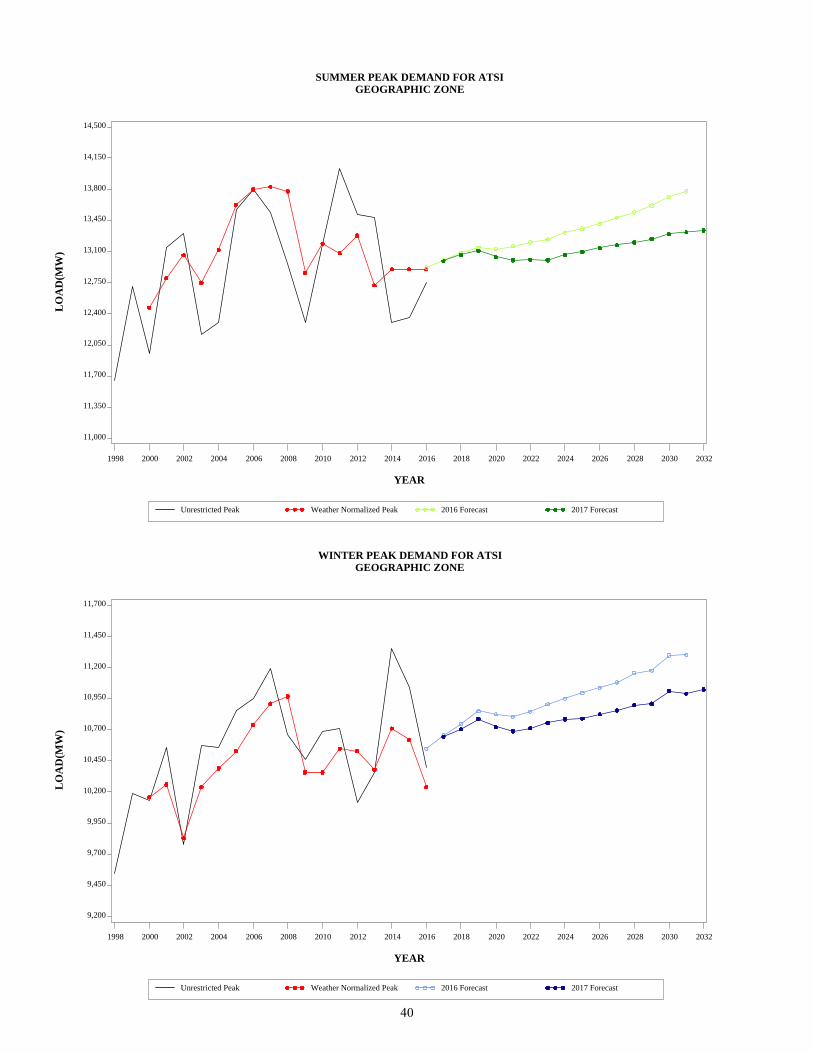
LO
AD
(MW
)
11,000
11,350
11,700
12,050
12,400
12,750
13,100
13,450
13,800
14,150
14,500
YEAR
1998 2000 2002 2004 2006 2008 2010 2012 2014 2016 2018 2020 2022 2024 2026 2028 2030 2032
SUMMER PEAK DEMAND FOR ATSI GEOGRAPHIC ZONE
Unrestricted Peak Weather Normalized Peak 2016 Forecast 2017 Forecast
LO
AD
(MW
)
9,200
9,450
9,700
9,950
10,200
10,450
10,700
10,950
11,200
11,450
11,700
YEAR
1998 2000 2002 2004 2006 2008 2010 2012 2014 2016 2018 2020 2022 2024 2026 2028 2030 2032
WINTER PEAK DEMAND FOR ATSI GEOGRAPHIC ZONE
Unrestricted Peak Weather Normalized Peak 2016 Forecast 2017 Forecast
40
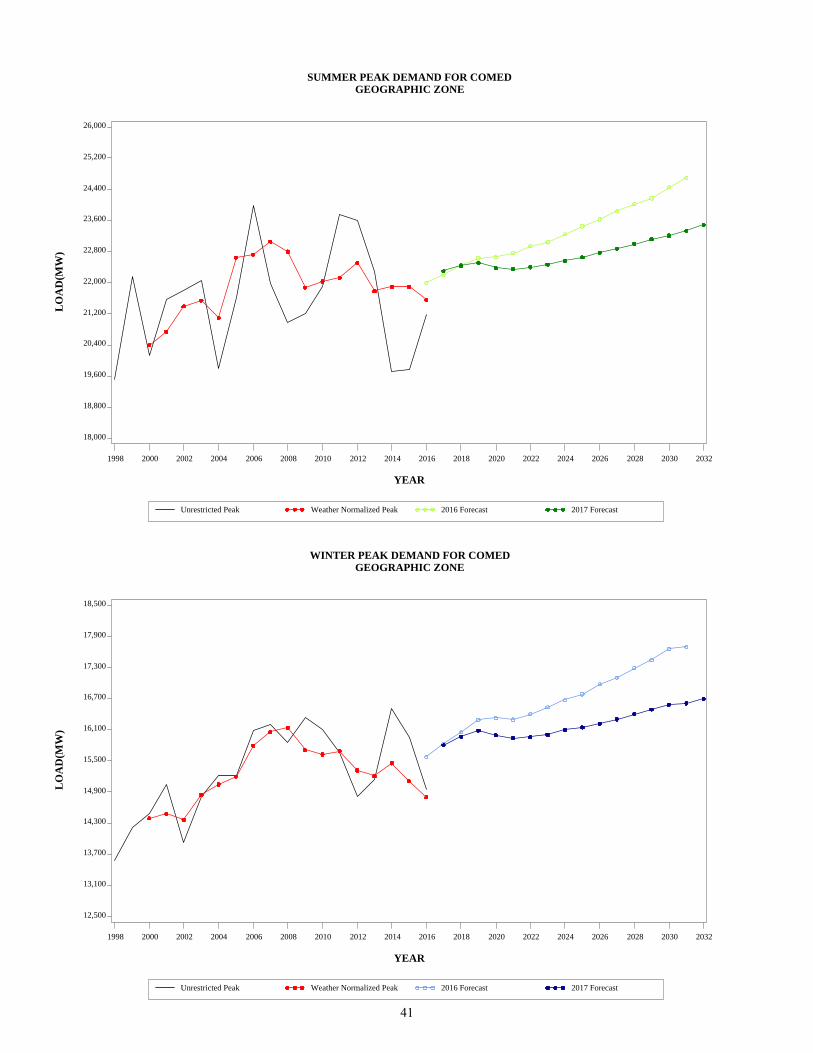
LO
AD
(MW
)
18,000
18,800
19,600
20,400
21,200
22,000
22,800
23,600
24,400
25,200
26,000
YEAR
1998 2000 2002 2004 2006 2008 2010 2012 2014 2016 2018 2020 2022 2024 2026 2028 2030 2032
SUMMER PEAK DEMAND FOR COMED GEOGRAPHIC ZONE
Unrestricted Peak Weather Normalized Peak 2016 Forecast 2017 Forecast
LO
AD
(MW
)
12,500
13,100
13,700
14,300
14,900
15,500
16,100
16,700
17,300
17,900
18,500
YEAR
1998 2000 2002 2004 2006 2008 2010 2012 2014 2016 2018 2020 2022 2024 2026 2028 2030 2032
WINTER PEAK DEMAND FOR COMED GEOGRAPHIC ZONE
Unrestricted Peak Weather Normalized Peak 2016 Forecast 2017 Forecast
41
LO
AD
(MW
)
3,100
3,180
3,260
3,340
3,420
3,500
3,580
3,660
3,740
3,820
3,900
YEAR
1998 2000 2002 2004 2006 2008 2010 2012 2014 2016 2018 2020 2022 2024 2026 2028 2030 2032
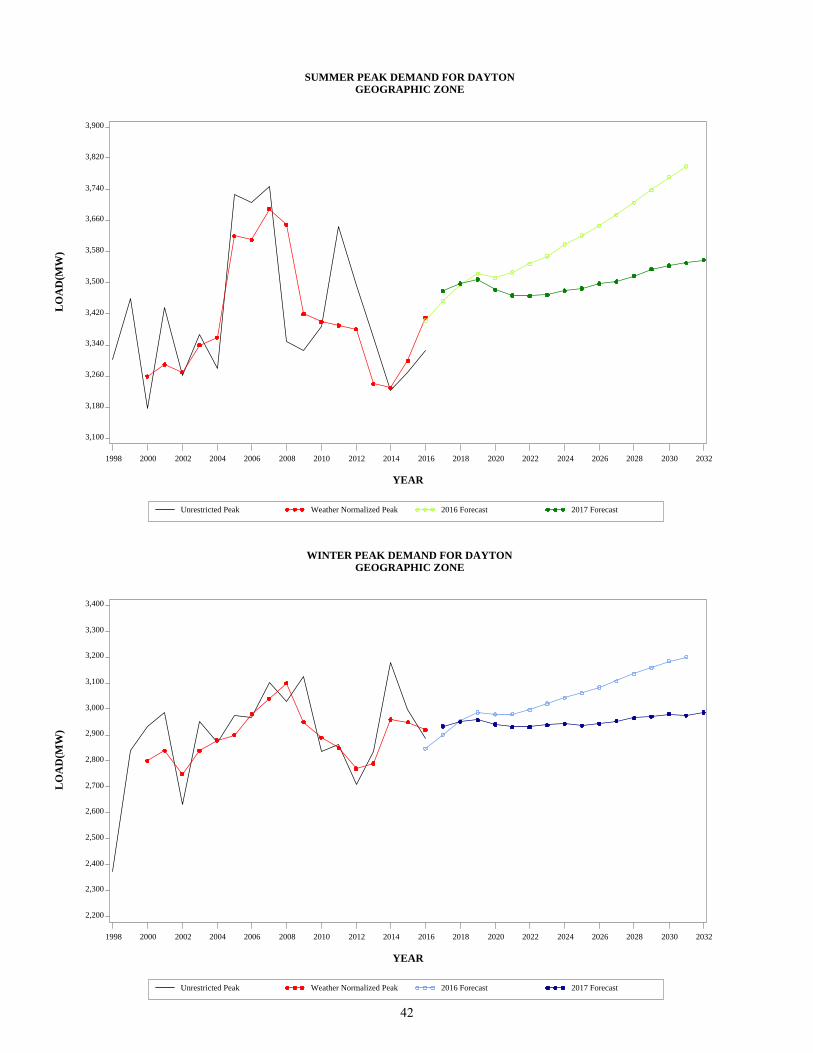
SUMMER PEAK DEMAND FOR DAYTON GEOGRAPHIC ZONE
Unrestricted Peak Weather Normalized Peak 2016 Forecast 2017 Forecast
LO
AD
(MW
)
2,200
2,300
2,400
2,500
2,600
2,700
2,800
2,900
3,000
3,100
3,200
3,300
3,400
YEAR
1998 2000 2002 2004 2006 2008 2010 2012 2014 2016 2018 2020 2022 2024 2026 2028 2030 2032
WINTER PEAK DEMAND FOR DAYTON GEOGRAPHIC ZONE
Unrestricted Peak Weather Normalized Peak 2016 Forecast 2017 Forecast
42
LO
AD
(MW
)
4,600
4,800
5,000
5,200
5,400
5,600
5,800
6,000
6,200
6,400
6,600
YEAR
1998 2000 2002 2004 2006 2008 2010 2012 2014 2016 2018 2020 2022 2024 2026 2028 2030 2032
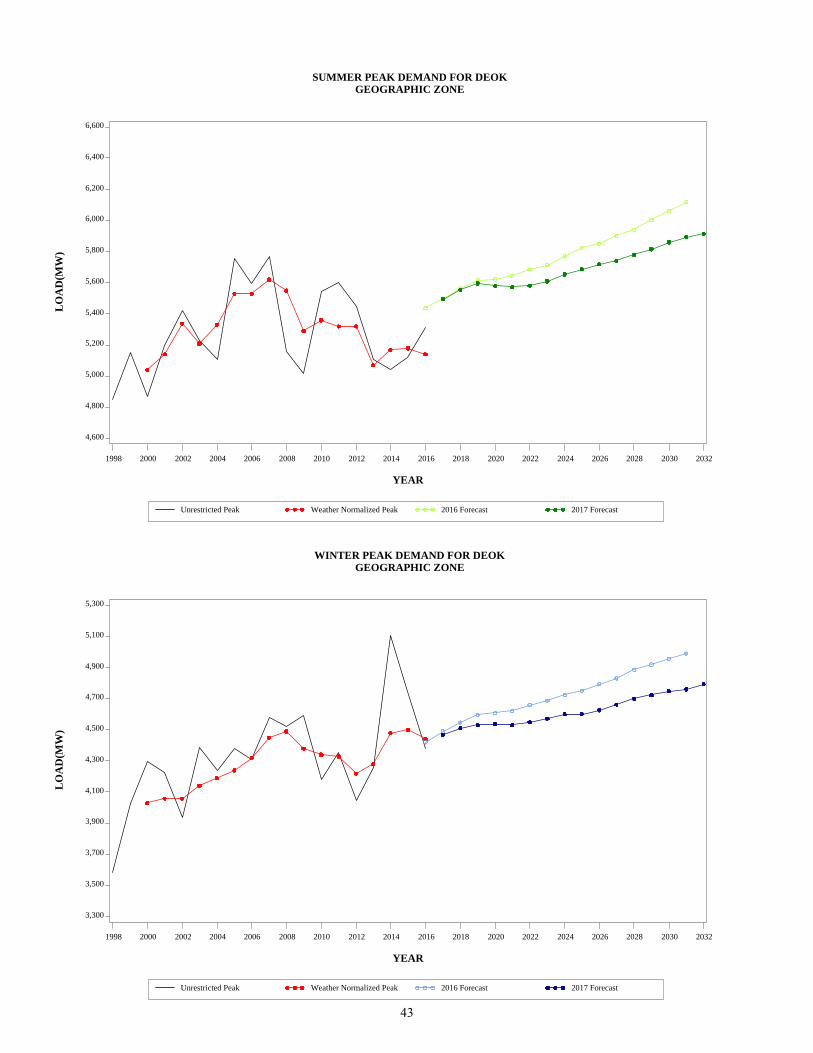
SUMMER PEAK DEMAND FOR DEOK GEOGRAPHIC ZONE
Unrestricted Peak Weather Normalized Peak 2016 Forecast 2017 Forecast
LO
AD
(MW
)
3,300
3,500
3,700
3,900
4,100
4,300
4,500
4,700
4,900
5,100
5,300
YEAR
1998 2000 2002 2004 2006 2008 2010 2012 2014 2016 2018 2020 2022 2024 2026 2028 2030 2032
WINTER PEAK DEMAND FOR DEOK GEOGRAPHIC ZONE
Unrestricted Peak Weather Normalized Peak 2016 Forecast 2017 Forecast
43
LO
AD
(MW
)
2,400
2,480
2,560
2,640
2,720
2,800
2,880
2,960
3,040
3,120
3,200
YEAR
1998 2000 2002 2004 2006 2008 2010 2012 2014 2016 2018 2020 2022 2024 2026 2028 2030 2032
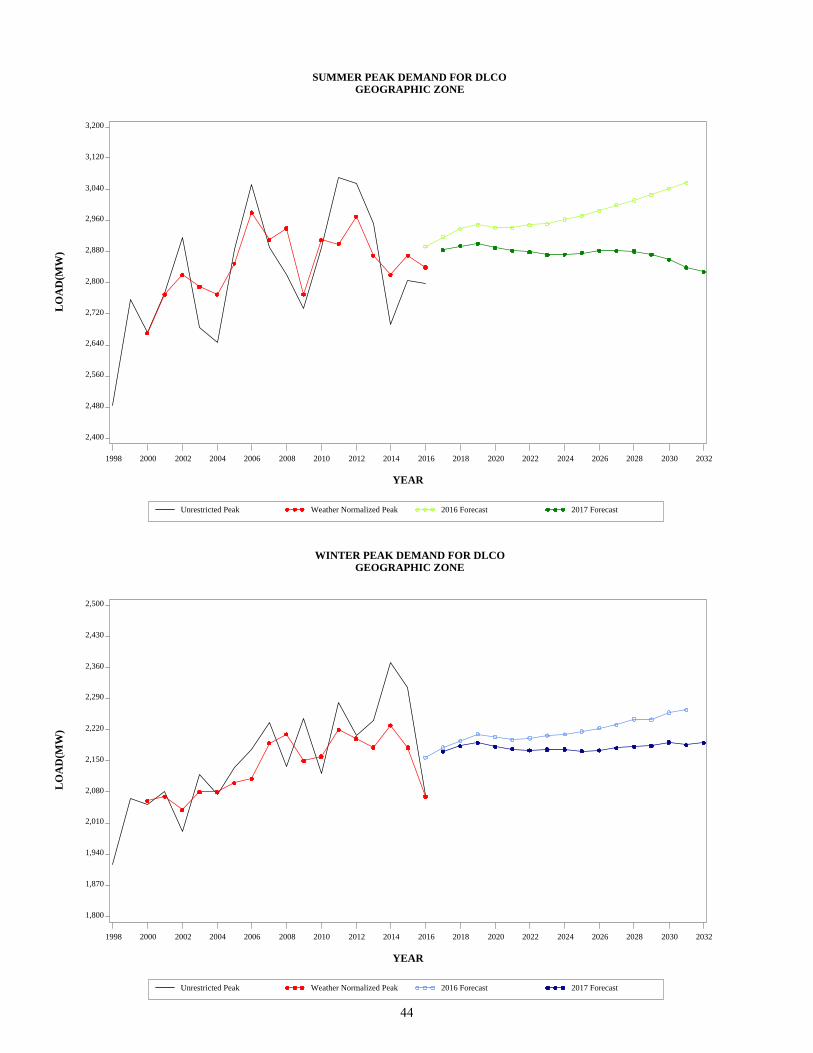
SUMMER PEAK DEMAND FOR DLCO GEOGRAPHIC ZONE
Unrestricted Peak Weather Normalized Peak 2016 Forecast 2017 Forecast
LO
AD
(MW
)
1,800
1,870
1,940
2,010
2,080
2,150
2,220
2,290
2,360
2,430
2,500
YEAR
1998 2000 2002 2004 2006 2008 2010 2012 2014 2016 2018 2020 2022 2024 2026 2028 2030 2032
WINTER PEAK DEMAND FOR DLCO GEOGRAPHIC ZONE
Unrestricted Peak Weather Normalized Peak 2016 Forecast 2017 Forecast
44
LO
AD
(MW
)
1,600
1,660
1,720
1,780
1,840
1,900
1,960
2,020
2,080
2,140
2,200
YEAR
1998 2000 2002 2004 2006 2008 2010 2012 2014 2016 2018 2020 2022 2024 2026 2028 2030 2032
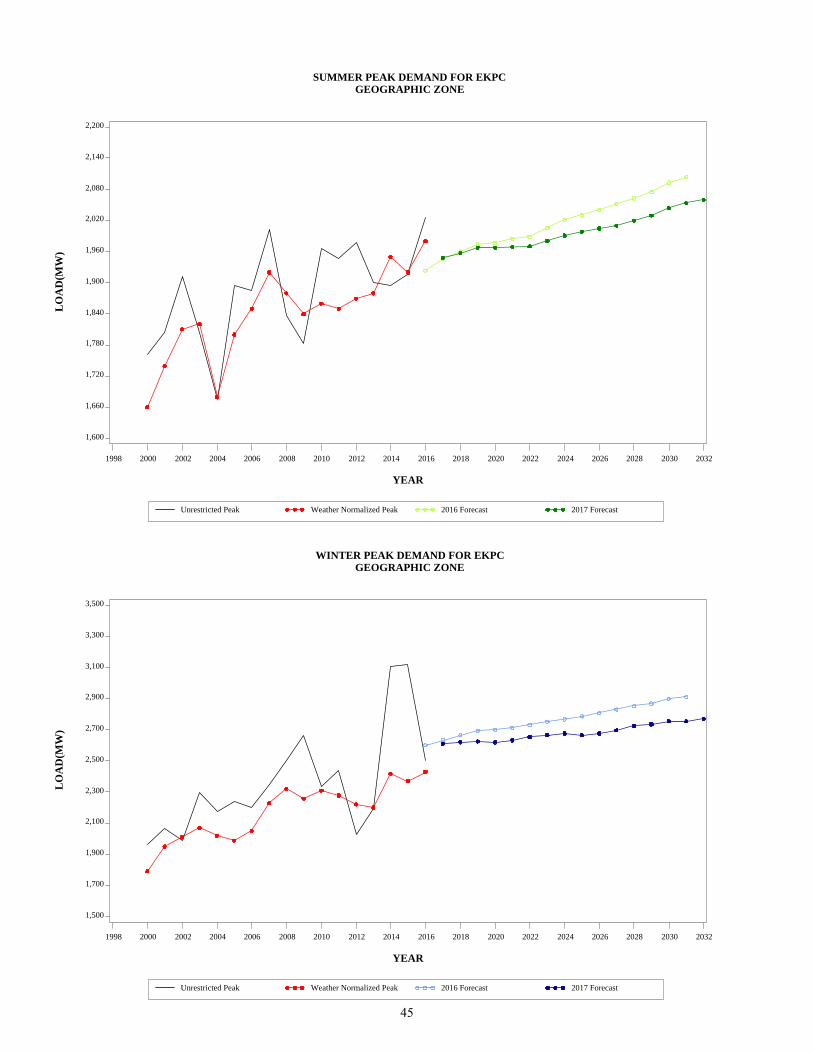
SUMMER PEAK DEMAND FOR EKPC GEOGRAPHIC ZONE
Unrestricted Peak Weather Normalized Peak 2016 Forecast 2017 Forecast
LO
AD
(MW
)
1,500
1,700
1,900
2,100
2,300
2,500
2,700
2,900
3,100
3,300
3,500
YEAR
1998 2000 2002 2004 2006 2008 2010 2012 2014 2016 2018 2020 2022 2024 2026 2028 2030 2032
WINTER PEAK DEMAND FOR EKPC GEOGRAPHIC ZONE
Unrestricted Peak Weather Normalized Peak 2016 Forecast 2017 Forecast
45
LO
AD
(MW
)
14,000
15,100
16,200
17,300
18,400
19,500
20,600
21,700
22,800
23,900
25,000
YEAR
1998 2000 2002 2004 2006 2008 2010 2012 2014 2016 2018 2020 2022 2024 2026 2028 2030 2032
SUMMER PEAK DEMAND FOR DOM GEOGRAPHIC ZONE
Unrestricted Peak Weather Normalized Peak 2016 Forecast 2017 Forecast
LO
AD
(MW
)
10,000
11,400
12,800
14,200
15,600
17,000
18,400
19,800
21,200
22,600
24,000
YEAR
1998 2000 2002 2004 2006 2008 2010 2012 2014 2016 2018 2020 2022 2024 2026 2028 2030 2032
WINTER PEAK DEMAND FOR DOM GEOGRAPHIC ZONE
Unrestricted Peak Weather Normalized Peak 2016 Forecast 2017 Forecast
46
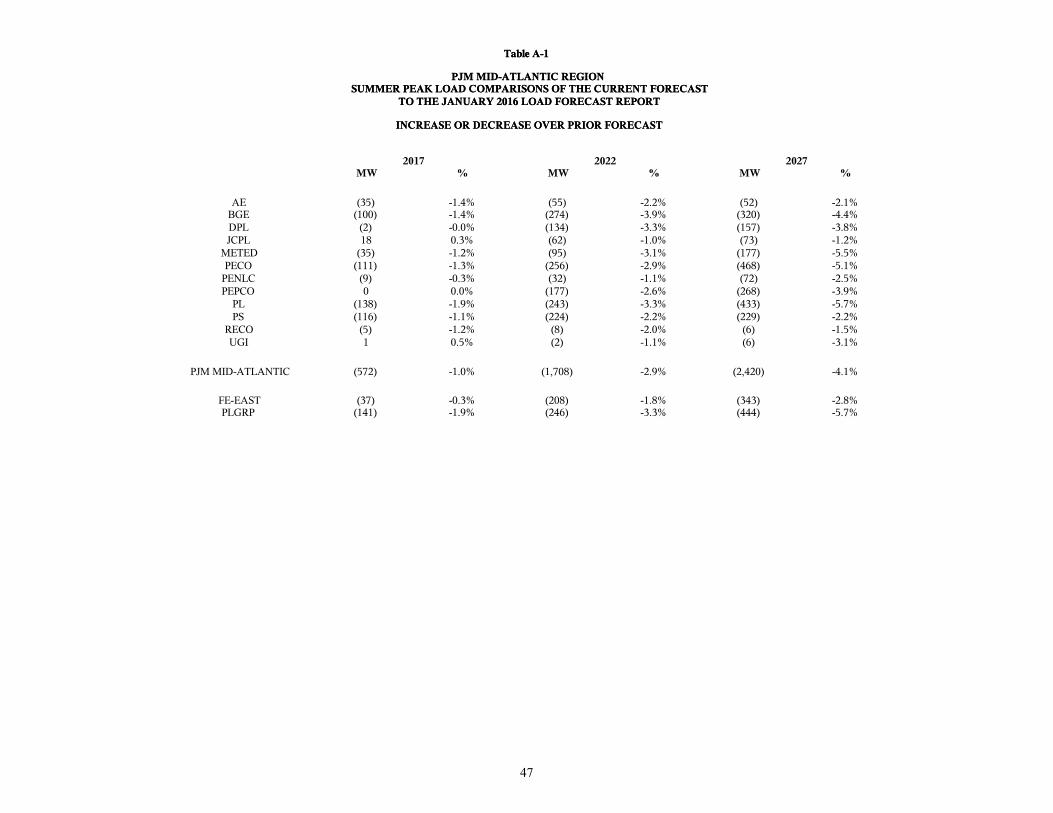
Table A-1
PJM MID-ATLANTIC REGIONSUMMER PEAK LOAD COMPARISONS OF THE CURRENT FORECAST
TO THE JANUARY 2016 LOAD FORECAST REPORT
INCREASE OR DECREASE OVER PRIOR FORECAST
Table A-1
PJM MID-ATLANTIC REGIONSUMMER PEAK LOAD COMPARISONS OF THE CURRENT FORECAST
TO THE JANUARY 2016 LOAD FORECAST REPORT
INCREASE OR DECREASE OVER PRIOR FORECAST
2017 2022 2027MW % MW % MW %
AE (35) -1.4% (55) -2.2% (52) -2.1%BGE (100) -1.4% (274) -3.9% (320) -4.4%DPL (2) -0.0% (134) -3.3% (157) -3.8%JCPL 18 0.3% (62) -1.0% (73) -1.2%
METED (35) -1.2% (95) -3.1% (177) -5.5%PECO (111) -1.3% (256) -2.9% (468) -5.1%
PENLC (9) -0.3% (32) -1.1% (72) -2.5%PEPCO 0 0.0% (177) -2.6% (268) -3.9%
PL (138) -1.9% (243) -3.3% (433) -5.7%PS (116) -1.1% (224) -2.2% (229) -2.2%
RECO (5) -1.2% (8) -2.0% (6) -1.5%UGI 1 0.5% (2) -1.1% (6) -3.1%
PJM MID-ATLANTIC (572) -1.0% (1,708) -2.9% (2,420) -4.1%
FE-EAST (37) -0.3% (208) -1.8% (343) -2.8%PLGRP (141) -1.9% (246) -3.3% (444) -5.7%
47
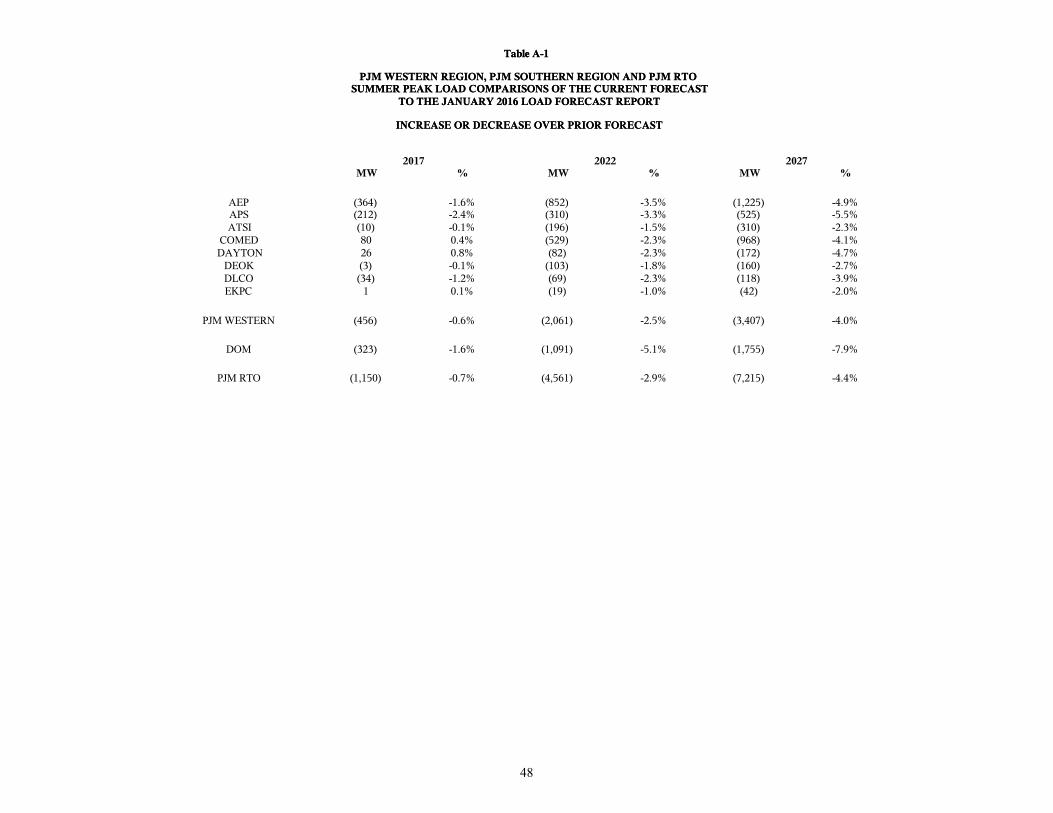
Table A-1
PJM WESTERN REGION, PJM SOUTHERN REGION AND PJM RTOSUMMER PEAK LOAD COMPARISONS OF THE CURRENT FORECAST
TO THE JANUARY 2016 LOAD FORECAST REPORT
INCREASE OR DECREASE OVER PRIOR FORECAST
Table A-1
PJM WESTERN REGION, PJM SOUTHERN REGION AND PJM RTOSUMMER PEAK LOAD COMPARISONS OF THE CURRENT FORECAST
TO THE JANUARY 2016 LOAD FORECAST REPORT
INCREASE OR DECREASE OVER PRIOR FORECAST
2017 2022 2027MW % MW % MW %
AEP (364) -1.6% (852) -3.5% (1,225) -4.9%APS (212) -2.4% (310) -3.3% (525) -5.5%ATSI (10) -0.1% (196) -1.5% (310) -2.3%
COMED 80 0.4% (529) -2.3% (968) -4.1%DAYTON 26 0.8% (82) -2.3% (172) -4.7%
DEOK (3) -0.1% (103) -1.8% (160) -2.7%DLCO (34) -1.2% (69) -2.3% (118) -3.9%EKPC 1 0.1% (19) -1.0% (42) -2.0%
PJM WESTERN (456) -0.6% (2,061) -2.5% (3,407) -4.0%
DOM (323) -1.6% (1,091) -5.1% (1,755) -7.9%
PJM RTO (1,150) -0.7% (4,561) -2.9% (7,215) -4.4%
48
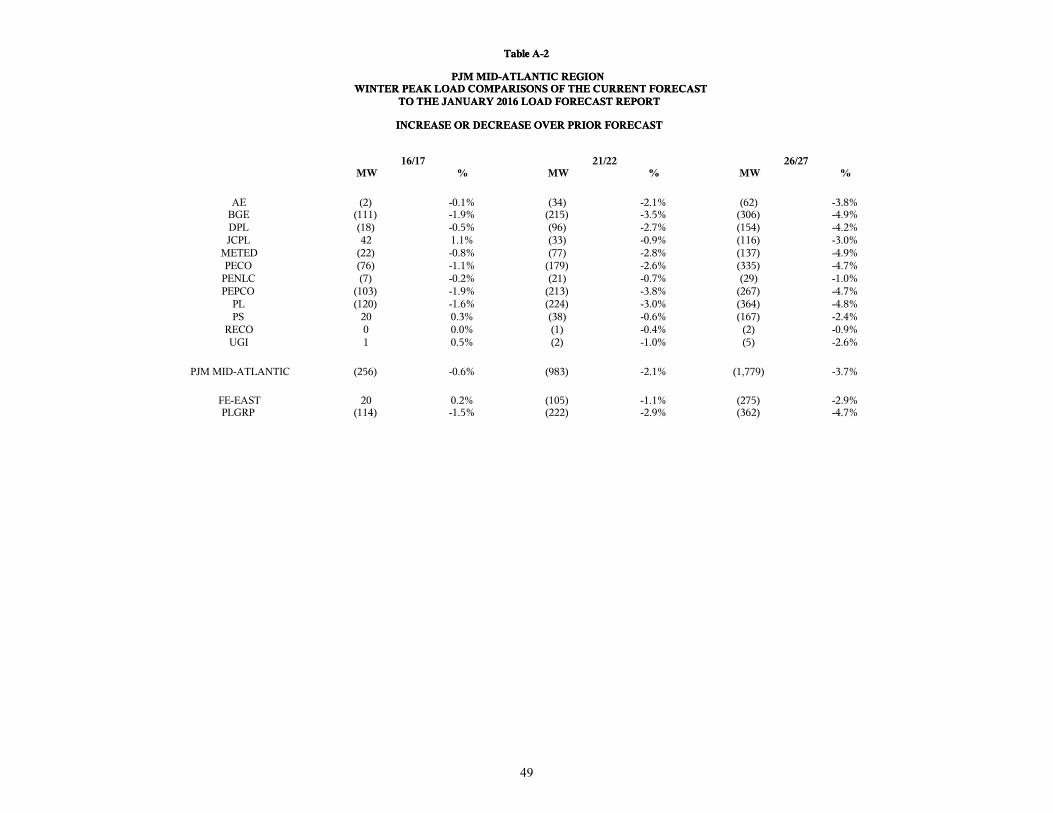
Table A-2
PJM MID-ATLANTIC REGIONWINTER PEAK LOAD COMPARISONS OF THE CURRENT FORECAST
TO THE JANUARY 2016 LOAD FORECAST REPORT
INCREASE OR DECREASE OVER PRIOR FORECAST
Table A-2
PJM MID-ATLANTIC REGIONWINTER PEAK LOAD COMPARISONS OF THE CURRENT FORECAST
TO THE JANUARY 2016 LOAD FORECAST REPORT
INCREASE OR DECREASE OVER PRIOR FORECAST
16/17 21/22 26/27MW % MW % MW %
AE (2) -0.1% (34) -2.1% (62) -3.8%BGE (111) -1.9% (215) -3.5% (306) -4.9%DPL (18) -0.5% (96) -2.7% (154) -4.2%JCPL 42 1.1% (33) -0.9% (116) -3.0%
METED (22) -0.8% (77) -2.8% (137) -4.9%PECO (76) -1.1% (179) -2.6% (335) -4.7%
PENLC (7) -0.2% (21) -0.7% (29) -1.0%PEPCO (103) -1.9% (213) -3.8% (267) -4.7%
PL (120) -1.6% (224) -3.0% (364) -4.8%PS 20 0.3% (38) -0.6% (167) -2.4%
RECO 0 0.0% (1) -0.4% (2) -0.9%UGI 1 0.5% (2) -1.0% (5) -2.6%
PJM MID-ATLANTIC (256) -0.6% (983) -2.1% (1,779) -3.7%
FE-EAST 20 0.2% (105) -1.1% (275) -2.9%PLGRP (114) -1.5% (222) -2.9% (362) -4.7%
49
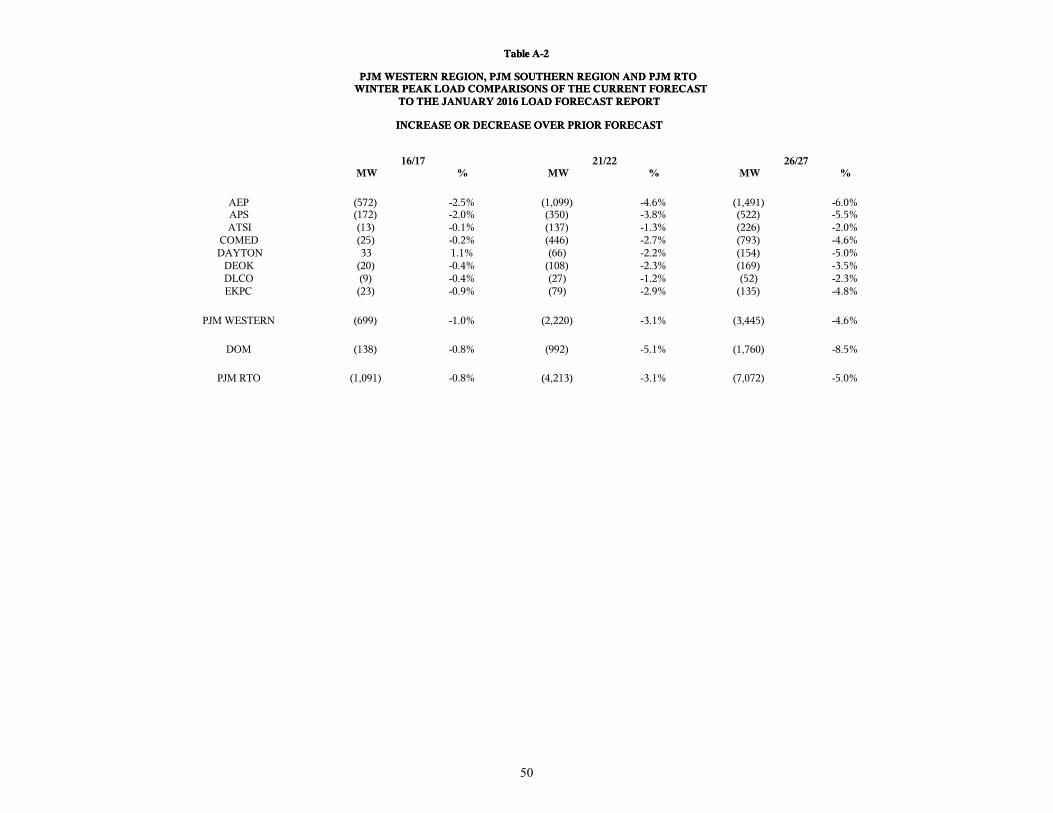
Table A-2
PJM WESTERN REGION, PJM SOUTHERN REGION AND PJM RTOWINTER PEAK LOAD COMPARISONS OF THE CURRENT FORECAST
TO THE JANUARY 2016 LOAD FORECAST REPORT
INCREASE OR DECREASE OVER PRIOR FORECAST
Table A-2
PJM WESTERN REGION, PJM SOUTHERN REGION AND PJM RTOWINTER PEAK LOAD COMPARISONS OF THE CURRENT FORECAST
TO THE JANUARY 2016 LOAD FORECAST REPORT
INCREASE OR DECREASE OVER PRIOR FORECAST
16/17 21/22 26/27MW % MW % MW %
AEP (572) -2.5% (1,099) -4.6% (1,491) -6.0%APS (172) -2.0% (350) -3.8% (522) -5.5%ATSI (13) -0.1% (137) -1.3% (226) -2.0%
COMED (25) -0.2% (446) -2.7% (793) -4.6%DAYTON 33 1.1% (66) -2.2% (154) -5.0%
DEOK (20) -0.4% (108) -2.3% (169) -3.5%DLCO (9) -0.4% (27) -1.2% (52) -2.3%EKPC (23) -0.9% (79) -2.9% (135) -4.8%
PJM WESTERN (699) -1.0% (2,220) -3.1% (3,445) -4.6%
DOM (138) -0.8% (992) -5.1% (1,760) -8.5%
PJM RTO (1,091) -0.8% (4,213) -3.1% (7,072) -5.0%
50
Summer season indicates peak from June, July, August.All average growth rates are calculated from the first year of the forecast (2017).All forecast values represent unrestricted peaks, after reductions for distributed solar generation and prior to reductions for load management.All forecast values are non-coincident as estimated by PJM staff.Notes:
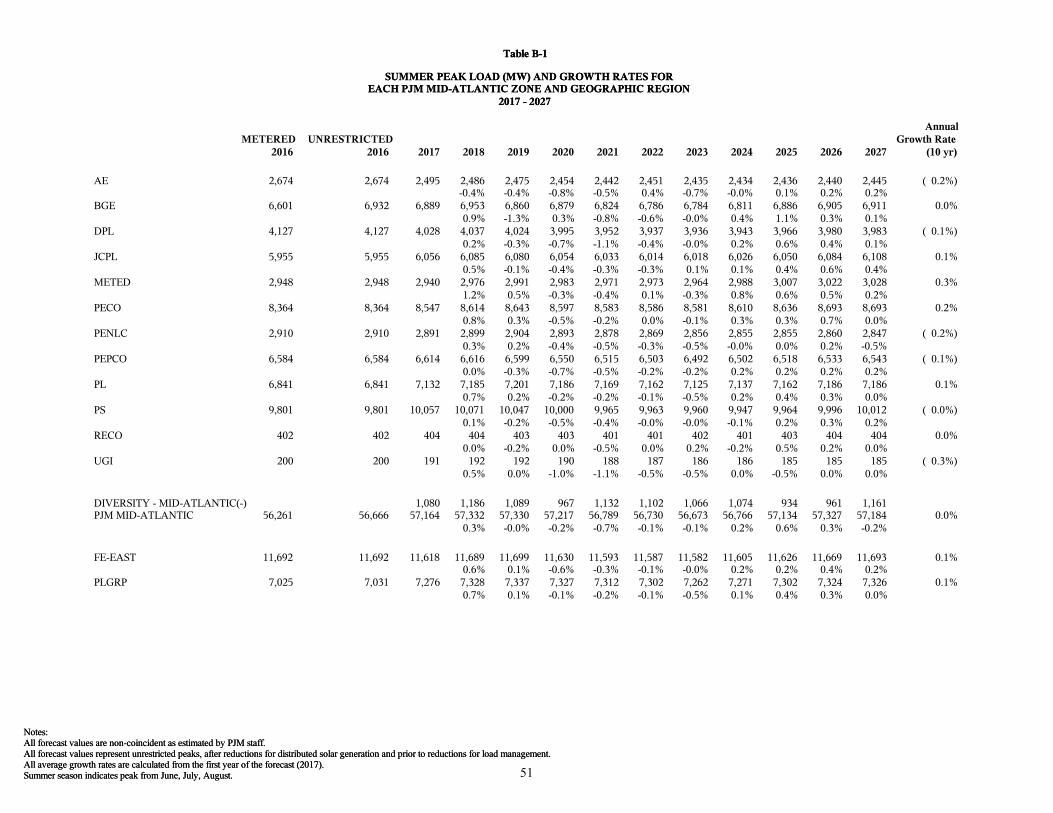
Table B-1
SUMMER PEAK LOAD (MW) AND GROWTH RATES FOREACH PJM MID-ATLANTIC ZONE AND GEOGRAPHIC REGION
2017 - 2027
Summer season indicates peak from June, July, August.All average growth rates are calculated from the first year of the forecast (2017).All forecast values represent unrestricted peaks, after reductions for distributed solar generation and prior to reductions for load management.All forecast values are non-coincident as estimated by PJM staff.Notes:
Table B-1
SUMMER PEAK LOAD (MW) AND GROWTH RATES FOREACH PJM MID-ATLANTIC ZONE AND GEOGRAPHIC REGION
2017 - 2027
METERED2016
UNRESTRICTED2016 2017 2018 2019 2020 2021 2022 2023 2024 2025 2026 2027
AnnualGrowth Rate
(10 yr)
AE 2,674 2,674 2,495 2,486 2,475 2,454 2,442 2,451 2,435 2,434 2,436 2,440 2,445 ( 0.2%)-0.4% -0.4% -0.8% -0.5% 0.4% -0.7% -0.0% 0.1% 0.2% 0.2%
BGE 6,601 6,932 6,889 6,953 6,860 6,879 6,824 6,786 6,784 6,811 6,886 6,905 6,911 0.0%0.9% -1.3% 0.3% -0.8% -0.6% -0.0% 0.4% 1.1% 0.3% 0.1%
DPL 4,127 4,127 4,028 4,037 4,024 3,995 3,952 3,937 3,936 3,943 3,966 3,980 3,983 ( 0.1%)0.2% -0.3% -0.7% -1.1% -0.4% -0.0% 0.2% 0.6% 0.4% 0.1%
JCPL 5,955 5,955 6,056 6,085 6,080 6,054 6,033 6,014 6,018 6,026 6,050 6,084 6,108 0.1%0.5% -0.1% -0.4% -0.3% -0.3% 0.1% 0.1% 0.4% 0.6% 0.4%
METED 2,948 2,948 2,940 2,976 2,991 2,983 2,971 2,973 2,964 2,988 3,007 3,022 3,028 0.3%1.2% 0.5% -0.3% -0.4% 0.1% -0.3% 0.8% 0.6% 0.5% 0.2%
PECO 8,364 8,364 8,547 8,614 8,643 8,597 8,583 8,586 8,581 8,610 8,636 8,693 8,693 0.2%0.8% 0.3% -0.5% -0.2% 0.0% -0.1% 0.3% 0.3% 0.7% 0.0%
PENLC 2,910 2,910 2,891 2,899 2,904 2,893 2,878 2,869 2,856 2,855 2,855 2,860 2,847 ( 0.2%)0.3% 0.2% -0.4% -0.5% -0.3% -0.5% -0.0% 0.0% 0.2% -0.5%
PEPCO 6,584 6,584 6,614 6,616 6,599 6,550 6,515 6,503 6,492 6,502 6,518 6,533 6,543 ( 0.1%)0.0% -0.3% -0.7% -0.5% -0.2% -0.2% 0.2% 0.2% 0.2% 0.2%
PL 6,841 6,841 7,132 7,185 7,201 7,186 7,169 7,162 7,125 7,137 7,162 7,186 7,186 0.1%0.7% 0.2% -0.2% -0.2% -0.1% -0.5% 0.2% 0.4% 0.3% 0.0%
PS 9,801 9,801 10,057 10,071 10,047 10,000 9,965 9,963 9,960 9,947 9,964 9,996 10,012 ( 0.0%)0.1% -0.2% -0.5% -0.4% -0.0% -0.0% -0.1% 0.2% 0.3% 0.2%
RECO 402 402 404 404 403 403 401 401 402 401 403 404 404 0.0%0.0% -0.2% 0.0% -0.5% 0.0% 0.2% -0.2% 0.5% 0.2% 0.0%
UGI 200 200 191 192 192 190 188 187 186 186 185 185 185 ( 0.3%)0.5% 0.0% -1.0% -1.1% -0.5% -0.5% 0.0% -0.5% 0.0% 0.0%
DIVERSITY - MID-ATLANTIC(-) 1,080 1,186 1,089 967 1,132 1,102 1,066 1,074 934 961 1,161PJM MID-ATLANTIC 56,261 56,666 57,164 57,332 57,330 57,217 56,789 56,730 56,673 56,766 57,134 57,327 57,184 0.0%
0.3% -0.0% -0.2% -0.7% -0.1% -0.1% 0.2% 0.6% 0.3% -0.2%
FE-EAST 11,692 11,692 11,618 11,689 11,699 11,630 11,593 11,587 11,582 11,605 11,626 11,669 11,693 0.1%0.6% 0.1% -0.6% -0.3% -0.1% -0.0% 0.2% 0.2% 0.4% 0.2%
PLGRP 7,025 7,031 7,276 7,328 7,337 7,327 7,312 7,302 7,262 7,271 7,302 7,324 7,326 0.1%0.7% 0.1% -0.1% -0.2% -0.1% -0.5% 0.1% 0.4% 0.3% 0.0%
51
Summer season indicates peak from June, July, August.All average growth rates are calculated from the first year of the forecast (2017).All forecast values represent unrestricted peaks, after reductions for distributed solar generation and prior to reductions for load management.All forecast values are non-coincident as estimated by PJM staff.Notes:
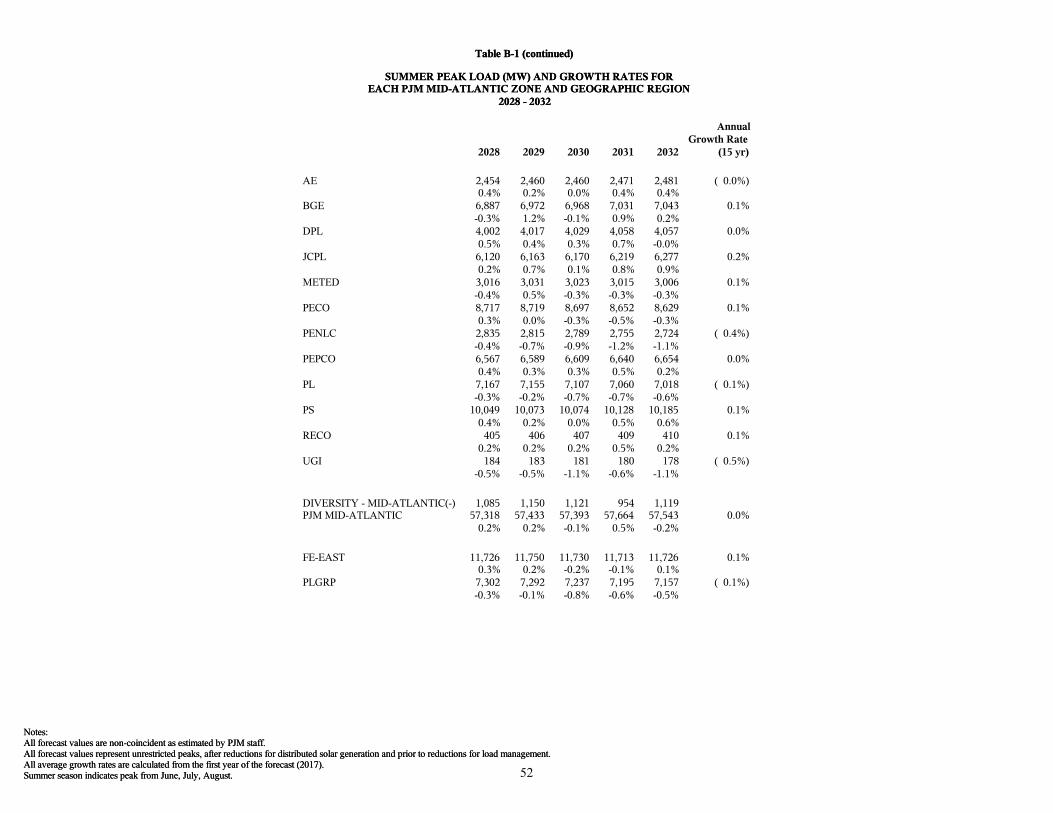
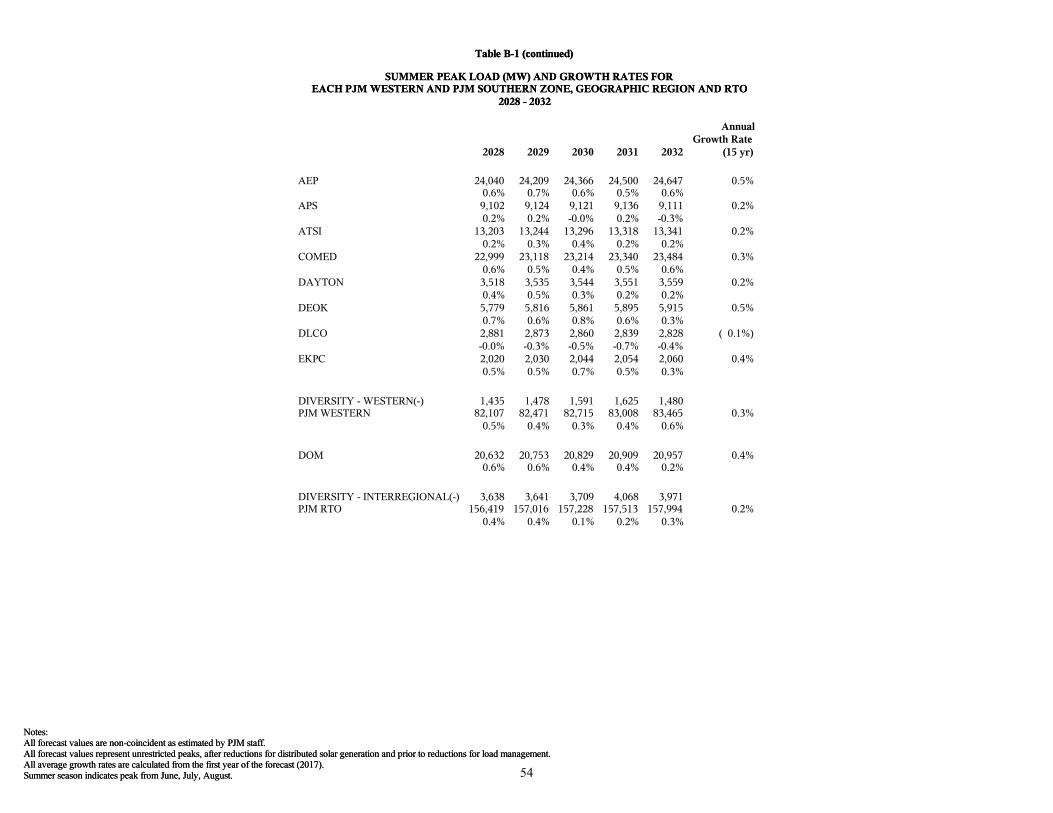
Table B-1 (continued)
SUMMER PEAK LOAD (MW) AND GROWTH RATES FOREACH PJM MID-ATLANTIC ZONE AND GEOGRAPHIC REGION
2028 - 2032
Summer season indicates peak from June, July, August.All average growth rates are calculated from the first year of the forecast (2017).All forecast values represent unrestricted peaks, after reductions for distributed solar generation and prior to reductions for load management.All forecast values are non-coincident as estimated by PJM staff.Notes:
Table B-1 (continued)
SUMMER PEAK LOAD (MW) AND GROWTH RATES FOREACH PJM MID-ATLANTIC ZONE AND GEOGRAPHIC REGION
2028 - 2032
2028 2029 2030 2031 2032
AnnualGrowth Rate
(15 yr)
AE 2,454 2,460 2,460 2,471 2,481 ( 0.0%)0.4% 0.2% 0.0% 0.4% 0.4%
BGE 6,887 6,972 6,968 7,031 7,043 0.1%-0.3% 1.2% -0.1% 0.9% 0.2%
DPL 4,002 4,017 4,029 4,058 4,057 0.0%0.5% 0.4% 0.3% 0.7% -0.0%
JCPL 6,120 6,163 6,170 6,219 6,277 0.2%0.2% 0.7% 0.1% 0.8% 0.9%
METED 3,016 3,031 3,023 3,015 3,006 0.1%-0.4% 0.5% -0.3% -0.3% -0.3%
PECO 8,717 8,719 8,697 8,652 8,629 0.1%0.3% 0.0% -0.3% -0.5% -0.3%
PENLC 2,835 2,815 2,789 2,755 2,724 ( 0.4%)-0.4% -0.7% -0.9% -1.2% -1.1%
PEPCO 6,567 6,589 6,609 6,640 6,654 0.0%0.4% 0.3% 0.3% 0.5% 0.2%
PL 7,167 7,155 7,107 7,060 7,018 ( 0.1%)-0.3% -0.2% -0.7% -0.7% -0.6%
PS 10,049 10,073 10,074 10,128 10,185 0.1%0.4% 0.2% 0.0% 0.5% 0.6%
RECO 405 406 407 409 410 0.1%0.2% 0.2% 0.2% 0.5% 0.2%
UGI 184 183 181 180 178 ( 0.5%)-0.5% -0.5% -1.1% -0.6% -1.1%
DIVERSITY - MID-ATLANTIC(-) 1,085 1,150 1,121 954 1,119PJM MID-ATLANTIC 57,318 57,433 57,393 57,664 57,543 0.0%
0.2% 0.2% -0.1% 0.5% -0.2%
FE-EAST 11,726 11,750 11,730 11,713 11,726 0.1%0.3% 0.2% -0.2% -0.1% 0.1%
PLGRP 7,302 7,292 7,237 7,195 7,157 ( 0.1%)-0.3% -0.1% -0.8% -0.6% -0.5%
52
Summer season indicates peak from June, July, August.All average growth rates are calculated from the first year of the forecast (2017).All forecast values represent unrestricted peaks, after reductions for distributed solar generation and prior to reductions for load management.All forecast values are non-coincident as estimated by PJM staff.Notes:
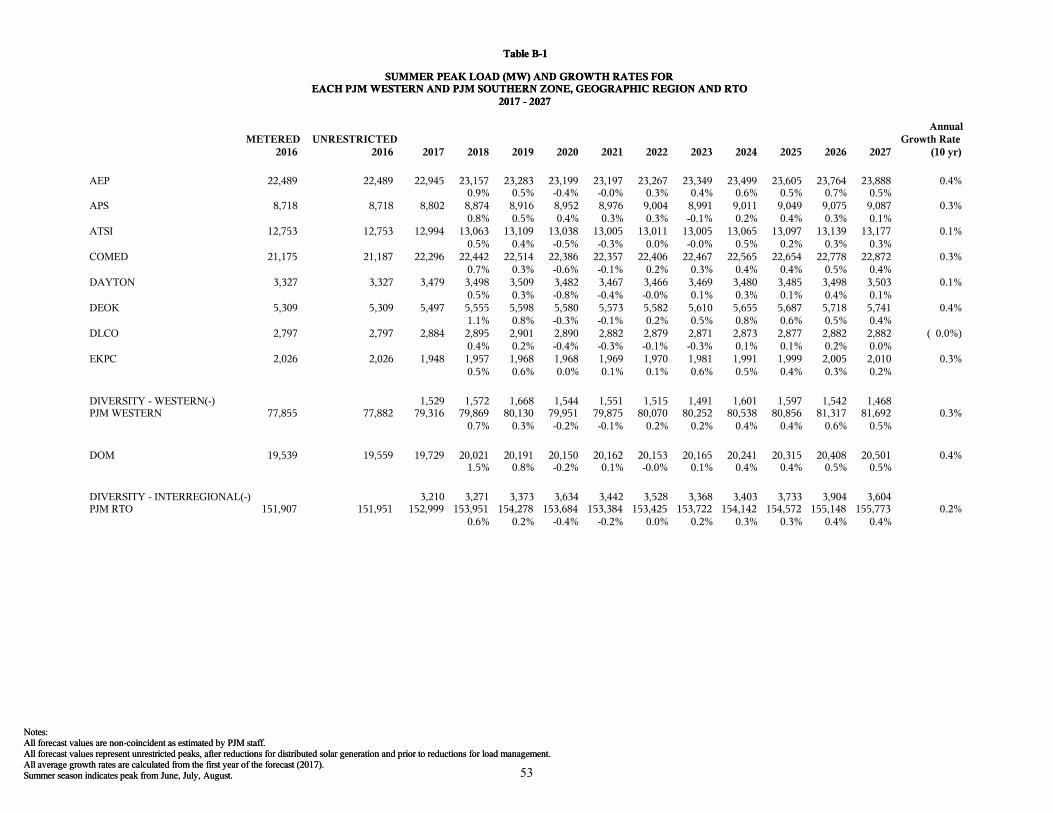
Table B-1
SUMMER PEAK LOAD (MW) AND GROWTH RATES FOREACH PJM WESTERN AND PJM SOUTHERN ZONE, GEOGRAPHIC REGION AND RTO
2017 - 2027
Summer season indicates peak from June, July, August.All average growth rates are calculated from the first year of the forecast (2017).All forecast values represent unrestricted peaks, after reductions for distributed solar generation and prior to reductions for load management.All forecast values are non-coincident as estimated by PJM staff.Notes:
Table B-1
SUMMER PEAK LOAD (MW) AND GROWTH RATES FOREACH PJM WESTERN AND PJM SOUTHERN ZONE, GEOGRAPHIC REGION AND RTO
2017 - 2027
METERED2016
UNRESTRICTED2016 2017 2018 2019 2020 2021 2022 2023 2024 2025 2026 2027
AnnualGrowth Rate
(10 yr)
AEP 22,489 22,489 22,945 23,157 23,283 23,199 23,197 23,267 23,349 23,499 23,605 23,764 23,888 0.4%0.9% 0.5% -0.4% -0.0% 0.3% 0.4% 0.6% 0.5% 0.7% 0.5%
APS 8,718 8,718 8,802 8,874 8,916 8,952 8,976 9,004 8,991 9,011 9,049 9,075 9,087 0.3%0.8% 0.5% 0.4% 0.3% 0.3% -0.1% 0.2% 0.4% 0.3% 0.1%
ATSI 12,753 12,753 12,994 13,063 13,109 13,038 13,005 13,011 13,005 13,065 13,097 13,139 13,177 0.1%0.5% 0.4% -0.5% -0.3% 0.0% -0.0% 0.5% 0.2% 0.3% 0.3%
COMED 21,175 21,187 22,296 22,442 22,514 22,386 22,357 22,406 22,467 22,565 22,654 22,778 22,872 0.3%0.7% 0.3% -0.6% -0.1% 0.2% 0.3% 0.4% 0.4% 0.5% 0.4%
DAYTON 3,327 3,327 3,479 3,498 3,509 3,482 3,467 3,466 3,469 3,480 3,485 3,498 3,503 0.1%0.5% 0.3% -0.8% -0.4% -0.0% 0.1% 0.3% 0.1% 0.4% 0.1%
DEOK 5,309 5,309 5,497 5,555 5,598 5,580 5,573 5,582 5,610 5,655 5,687 5,718 5,741 0.4%1.1% 0.8% -0.3% -0.1% 0.2% 0.5% 0.8% 0.6% 0.5% 0.4%
DLCO 2,797 2,797 2,884 2,895 2,901 2,890 2,882 2,879 2,871 2,873 2,877 2,882 2,882 ( 0.0%)0.4% 0.2% -0.4% -0.3% -0.1% -0.3% 0.1% 0.1% 0.2% 0.0%
EKPC 2,026 2,026 1,948 1,957 1,968 1,968 1,969 1,970 1,981 1,991 1,999 2,005 2,010 0.3%0.5% 0.6% 0.0% 0.1% 0.1% 0.6% 0.5% 0.4% 0.3% 0.2%
DIVERSITY - WESTERN(-) 1,529 1,572 1,668 1,544 1,551 1,515 1,491 1,601 1,597 1,542 1,468PJM WESTERN 77,855 77,882 79,316 79,869 80,130 79,951 79,875 80,070 80,252 80,538 80,856 81,317 81,692 0.3%
0.7% 0.3% -0.2% -0.1% 0.2% 0.2% 0.4% 0.4% 0.6% 0.5%
DOM 19,539 19,559 19,729 20,021 20,191 20,150 20,162 20,153 20,165 20,241 20,315 20,408 20,501 0.4%1.5% 0.8% -0.2% 0.1% -0.0% 0.1% 0.4% 0.4% 0.5% 0.5%
DIVERSITY - INTERREGIONAL(-) 3,210 3,271 3,373 3,634 3,442 3,528 3,368 3,403 3,733 3,904 3,604PJM RTO 151,907 151,951 152,999 153,951 154,278 153,684 153,384 153,425 153,722 154,142 154,572 155,148 155,773 0.2%
0.6% 0.2% -0.4% -0.2% 0.0% 0.2% 0.3% 0.3% 0.4% 0.4%
53
Summer season indicates peak from June, July, August.All average growth rates are calculated from the first year of the forecast (2017).All forecast values represent unrestricted peaks, after reductions for distributed solar generation and prior to reductions for load management.All forecast values are non-coincident as estimated by PJM staff.Notes:
Table B-1 (continued)
SUMMER PEAK LOAD (MW) AND GROWTH RATES FOREACH PJM WESTERN AND PJM SOUTHERN ZONE, GEOGRAPHIC REGION AND RTO
2028 - 2032
2028 2029 2030 2031 2032
AnnualGrowth Rate
(15 yr)
AEP 24,040 24,209 24,366 24,500 24,647 0.5%0.6% 0.7% 0.6% 0.5% 0.6%
APS 9,102 9,124 9,121 9,136 9,111 0.2%0.2% 0.2% -0.0% 0.2% -0.3%
ATSI 13,203 13,244 13,296 13,318 13,341 0.2%0.2% 0.3% 0.4% 0.2% 0.2%
COMED 22,999 23,118 23,214 23,340 23,484 0.3%0.6% 0.5% 0.4% 0.5% 0.6%
DAYTON 3,518 3,535 3,544 3,551 3,559 0.2%0.4% 0.5% 0.3% 0.2% 0.2%
DEOK 5,779 5,816 5,861 5,895 5,915 0.5%0.7% 0.6% 0.8% 0.6% 0.3%
DLCO 2,881 2,873 2,860 2,839 2,828 ( 0.1%)-0.0% -0.3% -0.5% -0.7% -0.4%
EKPC 2,020 2,030 2,044 2,054 2,060 0.4%0.5% 0.5% 0.7% 0.5% 0.3%
DIVERSITY - WESTERN(-) 1,435 1,478 1,591 1,625 1,480PJM WESTERN 82,107 82,471 82,715 83,008 83,465 0.3%
0.5% 0.4% 0.3% 0.4% 0.6%
DOM 20,632 20,753 20,829 20,909 20,957 0.4%0.6% 0.6% 0.4% 0.4% 0.2%
DIVERSITY - INTERREGIONAL(-) 3,638 3,641 3,709 4,068 3,971PJM RTO 156,419 157,016 157,228 157,513 157,994 0.2%
0.4% 0.4% 0.1% 0.2% 0.3%
54
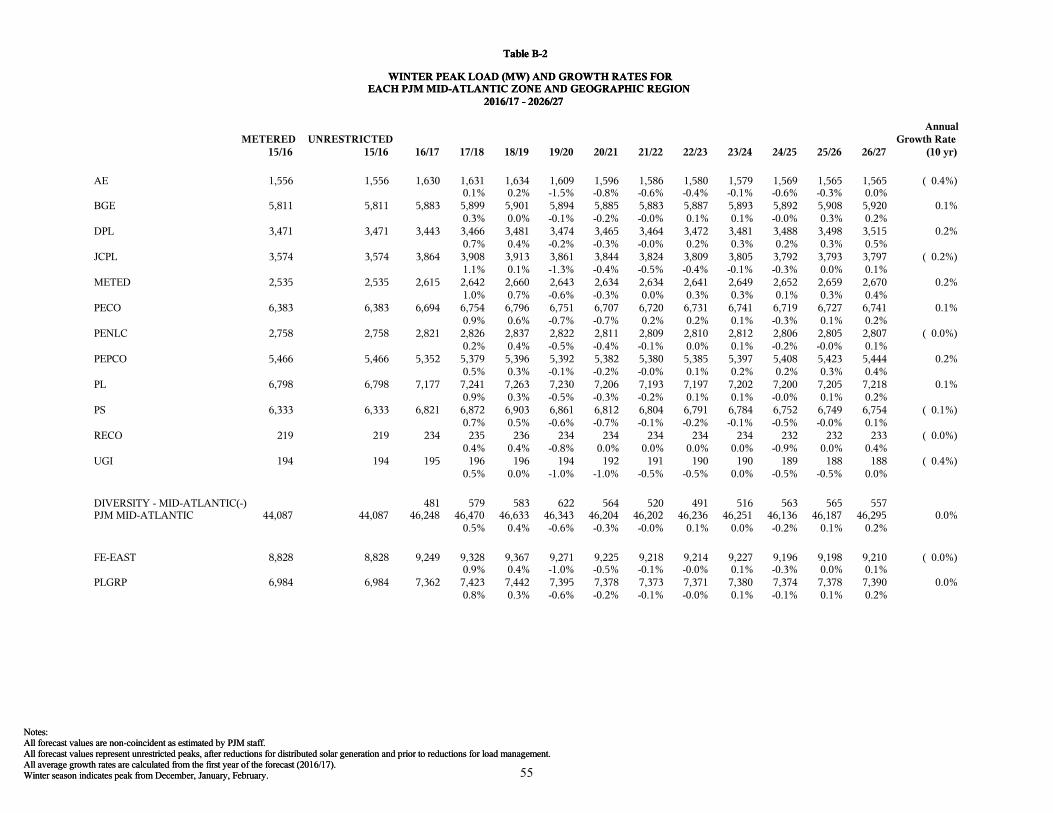
Winter season indicates peak from December, January, February.All average growth rates are calculated from the first year of the forecast (2016/17).All forecast values represent unrestricted peaks, after reductions for distributed solar generation and prior to reductions for load management.All forecast values are non-coincident as estimated by PJM staff.Notes:
Table B-2
WINTER PEAK LOAD (MW) AND GROWTH RATES FOREACH PJM MID-ATLANTIC ZONE AND GEOGRAPHIC REGION
2016/17 - 2026/27
METERED15/16
UNRESTRICTED15/16 16/17 17/18 18/19 19/20 20/21 21/22 22/23 23/24 24/25 25/26 26/27
AnnualGrowth Rate
(10 yr)
AE 1,556 1,556 1,630 1,631 1,634 1,609 1,596 1,586 1,580 1,579 1,569 1,565 1,565 ( 0.4%)0.1% 0.2% -1.5% -0.8% -0.6% -0.4% -0.1% -0.6% -0.3% 0.0%
BGE 5,811 5,811 5,883 5,899 5,901 5,894 5,885 5,883 5,887 5,893 5,892 5,908 5,920 0.1%0.3% 0.0% -0.1% -0.2% -0.0% 0.1% 0.1% -0.0% 0.3% 0.2%
DPL 3,471 3,471 3,443 3,466 3,481 3,474 3,465 3,464 3,472 3,481 3,488 3,498 3,515 0.2%0.7% 0.4% -0.2% -0.3% -0.0% 0.2% 0.3% 0.2% 0.3% 0.5%
JCPL 3,574 3,574 3,864 3,908 3,913 3,861 3,844 3,824 3,809 3,805 3,792 3,793 3,797 ( 0.2%)1.1% 0.1% -1.3% -0.4% -0.5% -0.4% -0.1% -0.3% 0.0% 0.1%
METED 2,535 2,535 2,615 2,642 2,660 2,643 2,634 2,634 2,641 2,649 2,652 2,659 2,670 0.2%1.0% 0.7% -0.6% -0.3% 0.0% 0.3% 0.3% 0.1% 0.3% 0.4%
PECO 6,383 6,383 6,694 6,754 6,796 6,751 6,707 6,720 6,731 6,741 6,719 6,727 6,741 0.1%0.9% 0.6% -0.7% -0.7% 0.2% 0.2% 0.1% -0.3% 0.1% 0.2%
PENLC 2,758 2,758 2,821 2,826 2,837 2,822 2,811 2,809 2,810 2,812 2,806 2,805 2,807 ( 0.0%)0.2% 0.4% -0.5% -0.4% -0.1% 0.0% 0.1% -0.2% -0.0% 0.1%
PEPCO 5,466 5,466 5,352 5,379 5,396 5,392 5,382 5,380 5,385 5,397 5,408 5,423 5,444 0.2%0.5% 0.3% -0.1% -0.2% -0.0% 0.1% 0.2% 0.2% 0.3% 0.4%
PL 6,798 6,798 7,177 7,241 7,263 7,230 7,206 7,193 7,197 7,202 7,200 7,205 7,218 0.1%0.9% 0.3% -0.5% -0.3% -0.2% 0.1% 0.1% -0.0% 0.1% 0.2%
PS 6,333 6,333 6,821 6,872 6,903 6,861 6,812 6,804 6,791 6,784 6,752 6,749 6,754 ( 0.1%)0.7% 0.5% -0.6% -0.7% -0.1% -0.2% -0.1% -0.5% -0.0% 0.1%
RECO 219 219 234 235 236 234 234 234 234 234 232 232 233 ( 0.0%)0.4% 0.4% -0.8% 0.0% 0.0% 0.0% 0.0% -0.9% 0.0% 0.4%
UGI 194 194 195 196 196 194 192 191 190 190 189 188 188 ( 0.4%)0.5% 0.0% -1.0% -1.0% -0.5% -0.5% 0.0% -0.5% -0.5% 0.0%
DIVERSITY - MID-ATLANTIC(-) 481 579 583 622 564 520 491 516 563 565 557PJM MID-ATLANTIC 44,087 44,087 46,248 46,470 46,633 46,343 46,204 46,202 46,236 46,251 46,136 46,187 46,295 0.0%
0.5% 0.4% -0.6% -0.3% -0.0% 0.1% 0.0% -0.2% 0.1% 0.2%
FE-EAST 8,828 8,828 9,249 9,328 9,367 9,271 9,225 9,218 9,214 9,227 9,196 9,198 9,210 ( 0.0%)0.9% 0.4% -1.0% -0.5% -0.1% -0.0% 0.1% -0.3% 0.0% 0.1%
PLGRP 6,984 6,984 7,362 7,423 7,442 7,395 7,378 7,373 7,371 7,380 7,374 7,378 7,390 0.0%0.8% 0.3% -0.6% -0.2% -0.1% -0.0% 0.1% -0.1% 0.1% 0.2%
55

Winter season indicates peak from December, January, February.All average growth rates are calculated from the first year of the forecast (2016/17).All forecast values represent unrestricted peaks, after reductions for distributed solar generation and prior to reductions for load management.All forecast values are non-coincident as estimated by PJM staff.Notes:
Table B-2 (Continued)
WINTER PEAK LOAD (MW) AND GROWTH RATES FOREACH PJM MID-ATLANTIC ZONE AND GEOGRAPHIC REGION
2027/28 - 2031/32
27/28 28/29 29/30 30/31 31/32
AnnualGrowth Rate
(15 yr)
AE 1,565 1,566 1,567 1,559 1,561 ( 0.3%)0.0% 0.1% 0.1% -0.5% 0.1%
BGE 5,926 5,943 5,952 5,955 5,976 0.1%0.1% 0.3% 0.2% 0.1% 0.4%
DPL 3,526 3,541 3,554 3,562 3,583 0.3%0.3% 0.4% 0.4% 0.2% 0.6%
JCPL 3,801 3,809 3,814 3,802 3,819 ( 0.1%)0.1% 0.2% 0.1% -0.3% 0.4%
METED 2,678 2,688 2,703 2,705 2,719 0.3%0.3% 0.4% 0.6% 0.1% 0.5%
PECO 6,774 6,783 6,818 6,798 6,818 0.1%0.5% 0.1% 0.5% -0.3% 0.3%
PENLC 2,808 2,810 2,824 2,812 2,814 ( 0.0%)0.0% 0.1% 0.5% -0.4% 0.1%
PEPCO 5,456 5,479 5,496 5,505 5,525 0.2%0.2% 0.4% 0.3% 0.2% 0.4%
PL 7,225 7,245 7,251 7,251 7,272 0.1%0.1% 0.3% 0.1% 0.0% 0.3%
PS 6,778 6,767 6,782 6,768 6,786 ( 0.0%)0.4% -0.2% 0.2% -0.2% 0.3%
RECO 233 233 235 231 233 ( 0.0%)0.0% 0.0% 0.9% -1.7% 0.9%
UGI 187 187 187 186 185 ( 0.4%)-0.5% 0.0% 0.0% -0.5% -0.5%
DIVERSITY - MID-ATLANTIC(-) 465 537 556 524 548PJM MID-ATLANTIC 46,492 46,514 46,627 46,610 46,743 0.1%
0.4% 0.0% 0.2% -0.0% 0.3%
FE-EAST 9,245 9,264 9,297 9,276 9,303 0.0%0.4% 0.2% 0.4% -0.2% 0.3%
PLGRP 7,404 7,415 7,415 7,422 7,440 0.1%0.2% 0.1% 0.0% 0.1% 0.2%
56
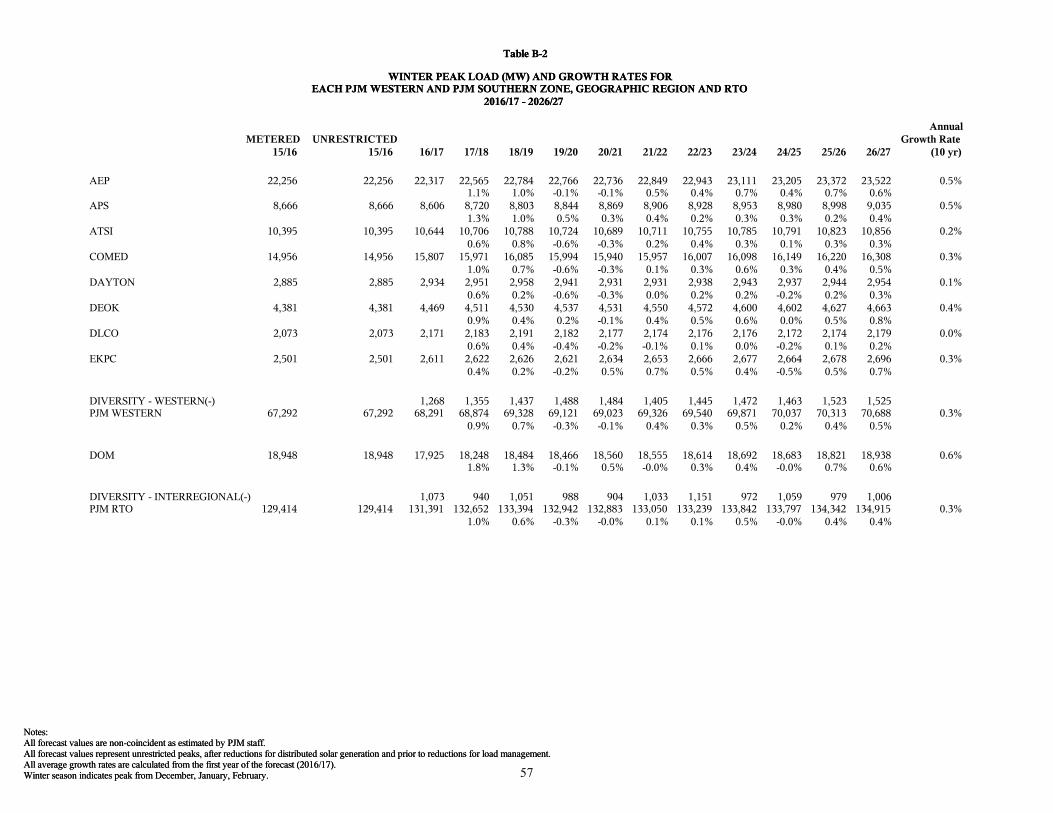
Winter season indicates peak from December, January, February.All average growth rates are calculated from the first year of the forecast (2016/17).All forecast values represent unrestricted peaks, after reductions for distributed solar generation and prior to reductions for load management.All forecast values are non-coincident as estimated by PJM staff.Notes:
Table B-2
WINTER PEAK LOAD (MW) AND GROWTH RATES FOREACH PJM WESTERN AND PJM SOUTHERN ZONE, GEOGRAPHIC REGION AND RTO
2016/17 - 2026/27
METERED15/16
UNRESTRICTED15/16 16/17 17/18 18/19 19/20 20/21 21/22 22/23 23/24 24/25 25/26 26/27
AnnualGrowth Rate
(10 yr)
AEP 22,256 22,256 22,317 22,565 22,784 22,766 22,736 22,849 22,943 23,111 23,205 23,372 23,522 0.5%1.1% 1.0% -0.1% -0.1% 0.5% 0.4% 0.7% 0.4% 0.7% 0.6%
APS 8,666 8,666 8,606 8,720 8,803 8,844 8,869 8,906 8,928 8,953 8,980 8,998 9,035 0.5%1.3% 1.0% 0.5% 0.3% 0.4% 0.2% 0.3% 0.3% 0.2% 0.4%
ATSI 10,395 10,395 10,644 10,706 10,788 10,724 10,689 10,711 10,755 10,785 10,791 10,823 10,856 0.2%0.6% 0.8% -0.6% -0.3% 0.2% 0.4% 0.3% 0.1% 0.3% 0.3%
COMED 14,956 14,956 15,807 15,971 16,085 15,994 15,940 15,957 16,007 16,098 16,149 16,220 16,308 0.3%1.0% 0.7% -0.6% -0.3% 0.1% 0.3% 0.6% 0.3% 0.4% 0.5%
DAYTON 2,885 2,885 2,934 2,951 2,958 2,941 2,931 2,931 2,938 2,943 2,937 2,944 2,954 0.1%0.6% 0.2% -0.6% -0.3% 0.0% 0.2% 0.2% -0.2% 0.2% 0.3%
DEOK 4,381 4,381 4,469 4,511 4,530 4,537 4,531 4,550 4,572 4,600 4,602 4,627 4,663 0.4%0.9% 0.4% 0.2% -0.1% 0.4% 0.5% 0.6% 0.0% 0.5% 0.8%
DLCO 2,073 2,073 2,171 2,183 2,191 2,182 2,177 2,174 2,176 2,176 2,172 2,174 2,179 0.0%0.6% 0.4% -0.4% -0.2% -0.1% 0.1% 0.0% -0.2% 0.1% 0.2%
EKPC 2,501 2,501 2,611 2,622 2,626 2,621 2,634 2,653 2,666 2,677 2,664 2,678 2,696 0.3%0.4% 0.2% -0.2% 0.5% 0.7% 0.5% 0.4% -0.5% 0.5% 0.7%
DIVERSITY - WESTERN(-) 1,268 1,355 1,437 1,488 1,484 1,405 1,445 1,472 1,463 1,523 1,525PJM WESTERN 67,292 67,292 68,291 68,874 69,328 69,121 69,023 69,326 69,540 69,871 70,037 70,313 70,688 0.3%
0.9% 0.7% -0.3% -0.1% 0.4% 0.3% 0.5% 0.2% 0.4% 0.5%
DOM 18,948 18,948 17,925 18,248 18,484 18,466 18,560 18,555 18,614 18,692 18,683 18,821 18,938 0.6%1.8% 1.3% -0.1% 0.5% -0.0% 0.3% 0.4% -0.0% 0.7% 0.6%
DIVERSITY - INTERREGIONAL(-) 1,073 940 1,051 988 904 1,033 1,151 972 1,059 979 1,006PJM RTO 129,414 129,414 131,391 132,652 133,394 132,942 132,883 133,050 133,239 133,842 133,797 134,342 134,915 0.3%
1.0% 0.6% -0.3% -0.0% 0.1% 0.1% 0.5% -0.0% 0.4% 0.4%
57

Winter season indicates peak from December, January, February.All average growth rates are calculated from the first year of the forecast (2016/17).All forecast values represent unrestricted peaks, after reductions for distributed solar generation and prior to reductions for load management.All forecast values are non-coincident as estimated by PJM staff.Notes:
Table B-2 (Continued)
WINTER PEAK LOAD (MW) AND GROWTH RATES FOREACH PJM WESTERN AND PJM SOUTHERN ZONE, GEOGRAPHIC REGION AND RTO
2027/28 - 2031/32
27/28 28/29 29/30 30/31 31/32
AnnualGrowth Rate
(15 yr)
AEP 23,696 23,861 24,078 24,140 24,327 0.6%0.7% 0.7% 0.9% 0.3% 0.8%
APS 9,066 9,096 9,166 9,176 9,206 0.5%0.3% 0.3% 0.8% 0.1% 0.3%
ATSI 10,899 10,910 11,012 10,990 11,023 0.2%0.4% 0.1% 0.9% -0.2% 0.3%
COMED 16,406 16,492 16,588 16,613 16,697 0.4%0.6% 0.5% 0.6% 0.2% 0.5%
DAYTON 2,965 2,971 2,981 2,976 2,987 0.1%0.4% 0.2% 0.3% -0.2% 0.4%
DEOK 4,699 4,723 4,748 4,761 4,793 0.5%0.8% 0.5% 0.5% 0.3% 0.7%
DLCO 2,182 2,184 2,192 2,186 2,191 0.1%0.1% 0.1% 0.4% -0.3% 0.2%
EKPC 2,726 2,736 2,755 2,755 2,773 0.4%1.1% 0.4% 0.7% 0.0% 0.7%
DIVERSITY - WESTERN(-) 1,435 1,508 1,665 1,566 1,604PJM WESTERN 71,204 71,465 71,855 72,031 72,393 0.4%
0.7% 0.4% 0.5% 0.2% 0.5%
DOM 19,035 19,177 19,258 19,296 19,441 0.5%0.5% 0.7% 0.4% 0.2% 0.8%
DIVERSITY - INTERREGIONAL(-) 1,064 1,061 1,125 1,261 1,091PJM RTO 135,667 136,095 136,615 136,676 137,486 0.3%
0.6% 0.3% 0.4% 0.0% 0.6%
58
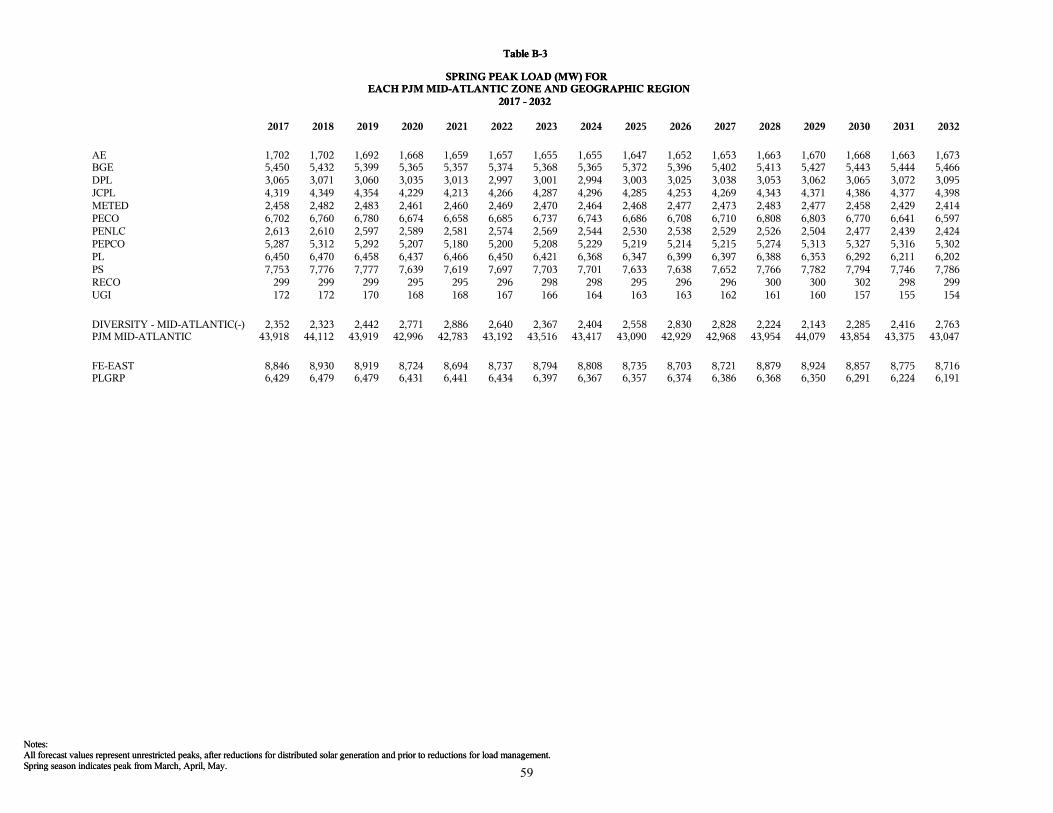
Spring season indicates peak from March, April, May.All forecast values represent unrestricted peaks, after reductions for distributed solar generation and prior to reductions for load management.Notes:
Table B-3
SPRING PEAK LOAD (MW) FOREACH PJM MID-ATLANTIC ZONE AND GEOGRAPHIC REGION
2017 - 2032
Spring season indicates peak from March, April, May.All forecast values represent unrestricted peaks, after reductions for distributed solar generation and prior to reductions for load management.Notes:
Table B-3
SPRING PEAK LOAD (MW) FOREACH PJM MID-ATLANTIC ZONE AND GEOGRAPHIC REGION
2017 - 2032
2017 2018 2019 2020 2021 2022 2023 2024 2025 2026 2027 2028 2029 2030 2031 2032
AE 1,702 1,702 1,692 1,668 1,659 1,657 1,655 1,655 1,647 1,652 1,653 1,663 1,670 1,668 1,663 1,673BGE 5,450 5,432 5,399 5,365 5,357 5,374 5,368 5,365 5,372 5,396 5,402 5,413 5,427 5,443 5,444 5,466DPL 3,065 3,071 3,060 3,035 3,013 2,997 3,001 2,994 3,003 3,025 3,038 3,053 3,062 3,065 3,072 3,095JCPL 4,319 4,349 4,354 4,229 4,213 4,266 4,287 4,296 4,285 4,253 4,269 4,343 4,371 4,386 4,377 4,398METED 2,458 2,482 2,483 2,461 2,460 2,469 2,470 2,464 2,468 2,477 2,473 2,483 2,477 2,458 2,429 2,414PECO 6,702 6,760 6,780 6,674 6,658 6,685 6,737 6,743 6,686 6,708 6,710 6,808 6,803 6,770 6,641 6,597PENLC 2,613 2,610 2,597 2,589 2,581 2,574 2,569 2,544 2,530 2,538 2,529 2,526 2,504 2,477 2,439 2,424PEPCO 5,287 5,312 5,292 5,207 5,180 5,200 5,208 5,229 5,219 5,214 5,215 5,274 5,313 5,327 5,316 5,302PL 6,450 6,470 6,458 6,437 6,466 6,450 6,421 6,368 6,347 6,399 6,397 6,388 6,353 6,292 6,211 6,202PS 7,753 7,776 7,777 7,639 7,619 7,697 7,703 7,701 7,633 7,638 7,652 7,766 7,782 7,794 7,746 7,786RECO 299 299 299 295 295 296 298 298 295 296 296 300 300 302 298 299UGI 172 172 170 168 168 167 166 164 163 163 162 161 160 157 155 154
DIVERSITY - MID-ATLANTIC(-) 2,352 2,323 2,442 2,771 2,886 2,640 2,367 2,404 2,558 2,830 2,828 2,224 2,143 2,285 2,416 2,763PJM MID-ATLANTIC 43,918 44,112 43,919 42,996 42,783 43,192 43,516 43,417 43,090 42,929 42,968 43,954 44,079 43,854 43,375 43,047
FE-EAST 8,846 8,930 8,919 8,724 8,694 8,737 8,794 8,808 8,735 8,703 8,721 8,879 8,924 8,857 8,775 8,716PLGRP 6,429 6,479 6,479 6,431 6,441 6,434 6,397 6,367 6,357 6,374 6,386 6,368 6,350 6,291 6,224 6,191
59
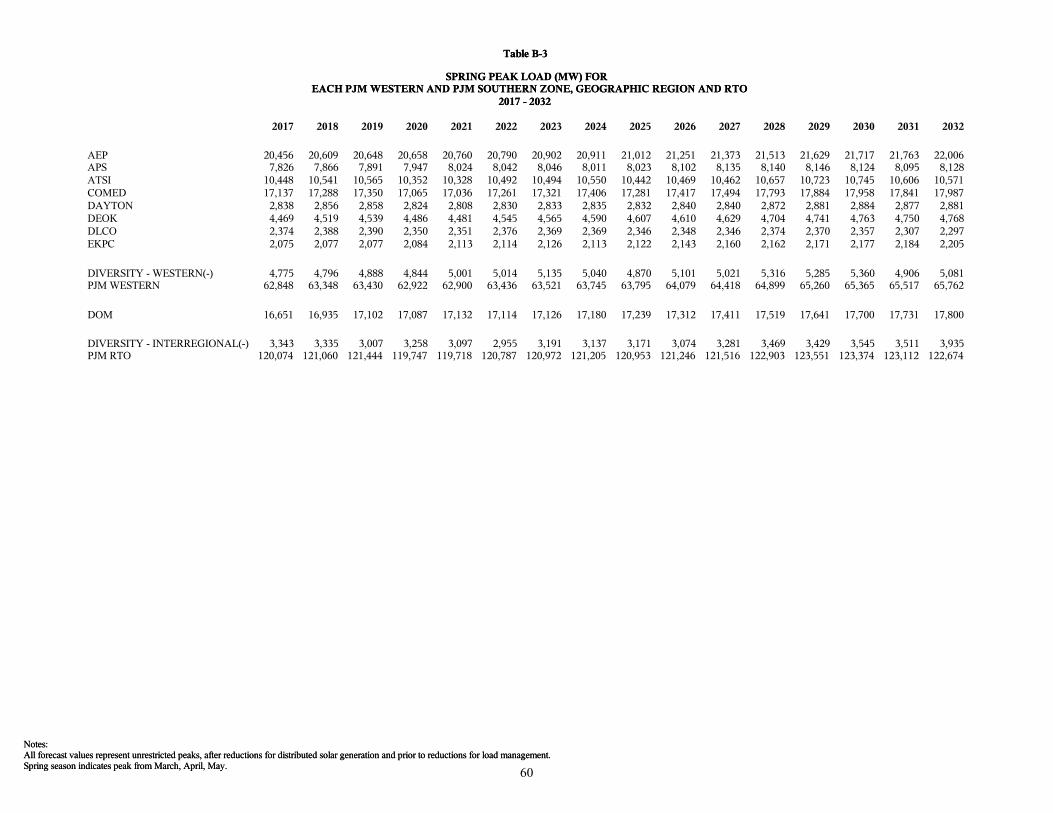
Spring season indicates peak from March, April, May.All forecast values represent unrestricted peaks, after reductions for distributed solar generation and prior to reductions for load management.Notes:
Table B-3
SPRING PEAK LOAD (MW) FOREACH PJM WESTERN AND PJM SOUTHERN ZONE, GEOGRAPHIC REGION AND RTO
2017 - 2032
2017 2018 2019 2020 2021 2022 2023 2024 2025 2026 2027 2028 2029 2030 2031 2032
AEP 20,456 20,609 20,648 20,658 20,760 20,790 20,902 20,911 21,012 21,251 21,373 21,513 21,629 21,717 21,763 22,006APS 7,826 7,866 7,891 7,947 8,024 8,042 8,046 8,011 8,023 8,102 8,135 8,140 8,146 8,124 8,095 8,128ATSI 10,448 10,541 10,565 10,352 10,328 10,492 10,494 10,550 10,442 10,469 10,462 10,657 10,723 10,745 10,606 10,571COMED 17,137 17,288 17,350 17,065 17,036 17,261 17,321 17,406 17,281 17,417 17,494 17,793 17,884 17,958 17,841 17,987DAYTON 2,838 2,856 2,858 2,824 2,808 2,830 2,833 2,835 2,832 2,840 2,840 2,872 2,881 2,884 2,877 2,881DEOK 4,469 4,519 4,539 4,486 4,481 4,545 4,565 4,590 4,607 4,610 4,629 4,704 4,741 4,763 4,750 4,768DLCO 2,374 2,388 2,390 2,350 2,351 2,376 2,369 2,369 2,346 2,348 2,346 2,374 2,370 2,357 2,307 2,297EKPC 2,075 2,077 2,077 2,084 2,113 2,114 2,126 2,113 2,122 2,143 2,160 2,162 2,171 2,177 2,184 2,205
DIVERSITY - WESTERN(-) 4,775 4,796 4,888 4,844 5,001 5,014 5,135 5,040 4,870 5,101 5,021 5,316 5,285 5,360 4,906 5,081PJM WESTERN 62,848 63,348 63,430 62,922 62,900 63,436 63,521 63,745 63,795 64,079 64,418 64,899 65,260 65,365 65,517 65,762
DOM 16,651 16,935 17,102 17,087 17,132 17,114 17,126 17,180 17,239 17,312 17,411 17,519 17,641 17,700 17,731 17,800
DIVERSITY - INTERREGIONAL(-) 3,343 3,335 3,007 3,258 3,097 2,955 3,191 3,137 3,171 3,074 3,281 3,469 3,429 3,545 3,511 3,935PJM RTO 120,074 121,060 121,444 119,747 119,718 120,787 120,972 121,205 120,953 121,246 121,516 122,903 123,551 123,374 123,112 122,674
60
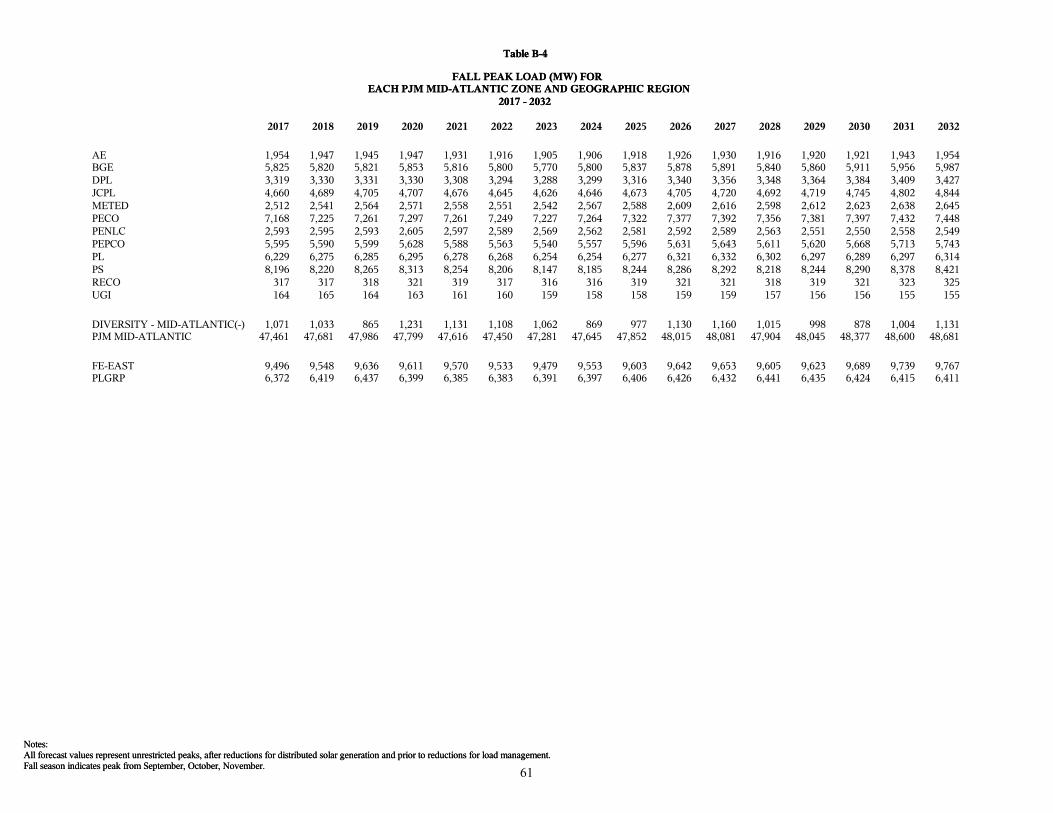
Fall season indicates peak from September, October, November.All forecast values represent unrestricted peaks, after reductions for distributed solar generation and prior to reductions for load management.Notes:
Table B-4
FALL PEAK LOAD (MW) FOREACH PJM MID-ATLANTIC ZONE AND GEOGRAPHIC REGION
2017 - 2032
2017 2018 2019 2020 2021 2022 2023 2024 2025 2026 2027 2028 2029 2030 2031 2032
AE 1,954 1,947 1,945 1,947 1,931 1,916 1,905 1,906 1,918 1,926 1,930 1,916 1,920 1,921 1,943 1,954BGE 5,825 5,820 5,821 5,853 5,816 5,800 5,770 5,800 5,837 5,878 5,891 5,840 5,860 5,911 5,956 5,987DPL 3,319 3,330 3,331 3,330 3,308 3,294 3,288 3,299 3,316 3,340 3,356 3,348 3,364 3,384 3,409 3,427JCPL 4,660 4,689 4,705 4,707 4,676 4,645 4,626 4,646 4,673 4,705 4,720 4,692 4,719 4,745 4,802 4,844METED 2,512 2,541 2,564 2,571 2,558 2,551 2,542 2,567 2,588 2,609 2,616 2,598 2,612 2,623 2,638 2,645PECO 7,168 7,225 7,261 7,297 7,261 7,249 7,227 7,264 7,322 7,377 7,392 7,356 7,381 7,397 7,432 7,448PENLC 2,593 2,595 2,593 2,605 2,597 2,589 2,569 2,562 2,581 2,592 2,589 2,563 2,551 2,550 2,558 2,549PEPCO 5,595 5,590 5,599 5,628 5,588 5,563 5,540 5,557 5,596 5,631 5,643 5,611 5,620 5,668 5,713 5,743PL 6,229 6,275 6,285 6,295 6,278 6,268 6,254 6,254 6,277 6,321 6,332 6,302 6,297 6,289 6,297 6,314PS 8,196 8,220 8,265 8,313 8,254 8,206 8,147 8,185 8,244 8,286 8,292 8,218 8,244 8,290 8,378 8,421RECO 317 317 318 321 319 317 316 316 319 321 321 318 319 321 323 325UGI 164 165 164 163 161 160 159 158 158 159 159 157 156 156 155 155
DIVERSITY - MID-ATLANTIC(-) 1,071 1,033 865 1,231 1,131 1,108 1,062 869 977 1,130 1,160 1,015 998 878 1,004 1,131PJM MID-ATLANTIC 47,461 47,681 47,986 47,799 47,616 47,450 47,281 47,645 47,852 48,015 48,081 47,904 48,045 48,377 48,600 48,681
FE-EAST 9,496 9,548 9,636 9,611 9,570 9,533 9,479 9,553 9,603 9,642 9,653 9,605 9,623 9,689 9,739 9,767PLGRP 6,372 6,419 6,437 6,399 6,385 6,383 6,391 6,397 6,406 6,426 6,432 6,441 6,435 6,424 6,415 6,411
61
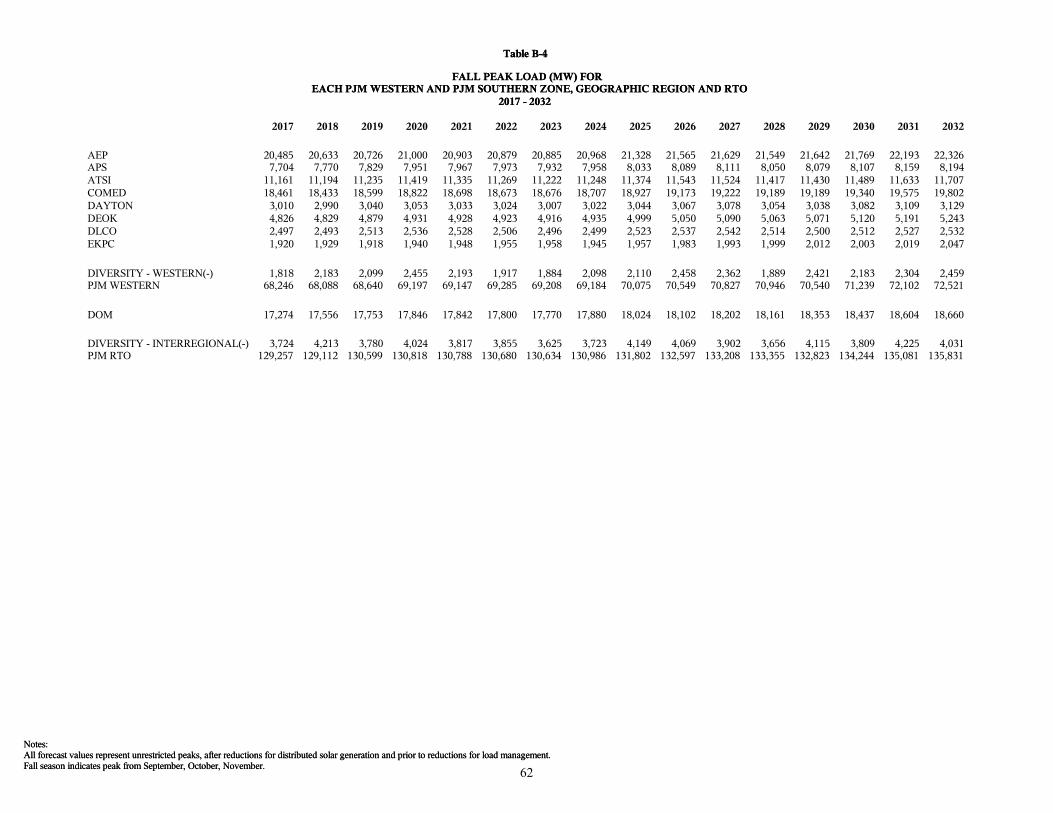
Fall season indicates peak from September, October, November.All forecast values represent unrestricted peaks, after reductions for distributed solar generation and prior to reductions for load management.Notes:
Table B-4
FALL PEAK LOAD (MW) FOREACH PJM WESTERN AND PJM SOUTHERN ZONE, GEOGRAPHIC REGION AND RTO
2017 - 2032
2017 2018 2019 2020 2021 2022 2023 2024 2025 2026 2027 2028 2029 2030 2031 2032
AEP 20,485 20,633 20,726 21,000 20,903 20,879 20,885 20,968 21,328 21,565 21,629 21,549 21,642 21,769 22,193 22,326APS 7,704 7,770 7,829 7,951 7,967 7,973 7,932 7,958 8,033 8,089 8,111 8,050 8,079 8,107 8,159 8,194ATSI 11,161 11,194 11,235 11,419 11,335 11,269 11,222 11,248 11,374 11,543 11,524 11,417 11,430 11,489 11,633 11,707COMED 18,461 18,433 18,599 18,822 18,698 18,673 18,676 18,707 18,927 19,173 19,222 19,189 19,189 19,340 19,575 19,802DAYTON 3,010 2,990 3,040 3,053 3,033 3,024 3,007 3,022 3,044 3,067 3,078 3,054 3,038 3,082 3,109 3,129DEOK 4,826 4,829 4,879 4,931 4,928 4,923 4,916 4,935 4,999 5,050 5,090 5,063 5,071 5,120 5,191 5,243DLCO 2,497 2,493 2,513 2,536 2,528 2,506 2,496 2,499 2,523 2,537 2,542 2,514 2,500 2,512 2,527 2,532EKPC 1,920 1,929 1,918 1,940 1,948 1,955 1,958 1,945 1,957 1,983 1,993 1,999 2,012 2,003 2,019 2,047
DIVERSITY - WESTERN(-) 1,818 2,183 2,099 2,455 2,193 1,917 1,884 2,098 2,110 2,458 2,362 1,889 2,421 2,183 2,304 2,459PJM WESTERN 68,246 68,088 68,640 69,197 69,147 69,285 69,208 69,184 70,075 70,549 70,827 70,946 70,540 71,239 72,102 72,521
DOM 17,274 17,556 17,753 17,846 17,842 17,800 17,770 17,880 18,024 18,102 18,202 18,161 18,353 18,437 18,604 18,660
DIVERSITY - INTERREGIONAL(-) 3,724 4,213 3,780 4,024 3,817 3,855 3,625 3,723 4,149 4,069 3,902 3,656 4,115 3,809 4,225 4,031PJM RTO 129,257 129,112 130,599 130,818 130,788 130,680 130,634 130,986 131,802 132,597 133,208 133,355 132,823 134,244 135,081 135,831
62
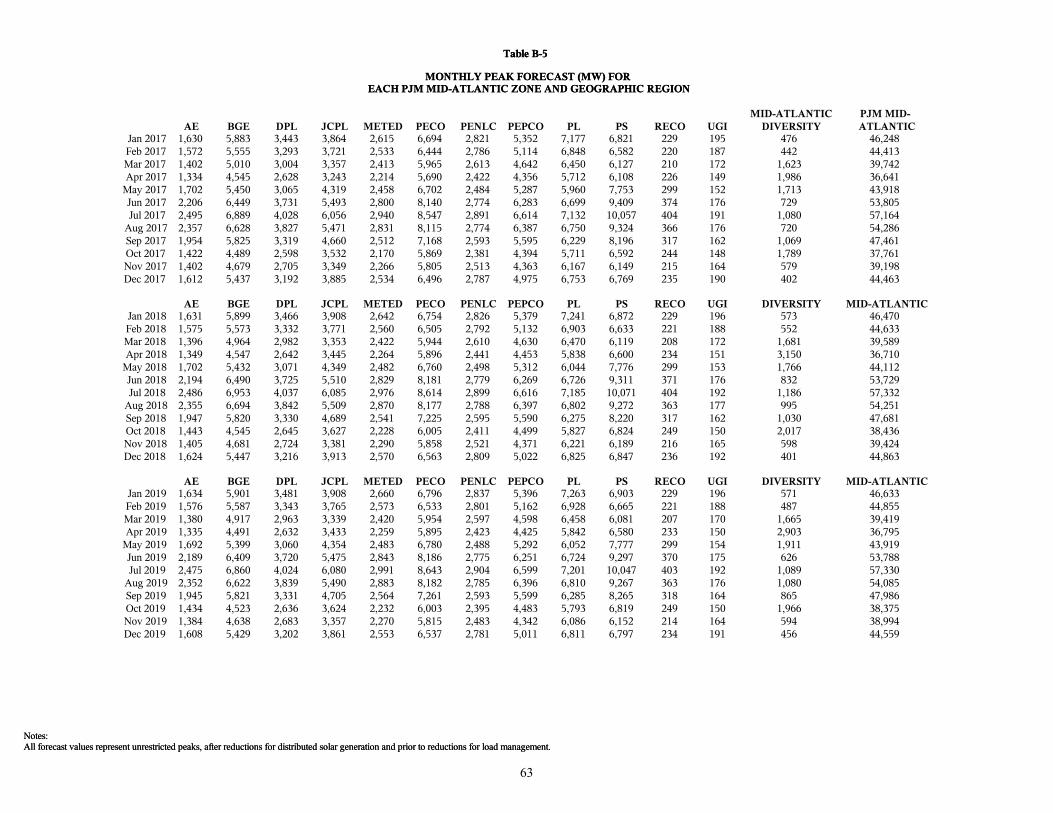
All forecast values represent unrestricted peaks, after reductions for distributed solar generation and prior to reductions for load management.Notes:
Table B-5
MONTHLY PEAK FORECAST (MW) FOREACH PJM MID-ATLANTIC ZONE AND GEOGRAPHIC REGION
All forecast values represent unrestricted peaks, after reductions for distributed solar generation and prior to reductions for load management.Notes:
Table B-5
MONTHLY PEAK FORECAST (MW) FOREACH PJM MID-ATLANTIC ZONE AND GEOGRAPHIC REGION
AE BGE DPL JCPL METED PECO PENLC PEPCO PL PS RECO UGIMID-ATLANTIC
DIVERSITYPJM MID-ATLANTIC
Jan 2017 1,630 5,883 3,443 3,864 2,615 6,694 2,821 5,352 7,177 6,821 229 195 476 46,248Feb 2017 1,572 5,555 3,293 3,721 2,533 6,444 2,786 5,114 6,848 6,582 220 187 442 44,413Mar 2017 1,402 5,010 3,004 3,357 2,413 5,965 2,613 4,642 6,450 6,127 210 172 1,623 39,742Apr 2017 1,334 4,545 2,628 3,243 2,214 5,690 2,422 4,356 5,712 6,108 226 149 1,986 36,641
May 2017 1,702 5,450 3,065 4,319 2,458 6,702 2,484 5,287 5,960 7,753 299 152 1,713 43,918Jun 2017 2,206 6,449 3,731 5,493 2,800 8,140 2,774 6,283 6,699 9,409 374 176 729 53,805Jul 2017 2,495 6,889 4,028 6,056 2,940 8,547 2,891 6,614 7,132 10,057 404 191 1,080 57,164
Aug 2017 2,357 6,628 3,827 5,471 2,831 8,115 2,774 6,387 6,750 9,324 366 176 720 54,286Sep 2017 1,954 5,825 3,319 4,660 2,512 7,168 2,593 5,595 6,229 8,196 317 162 1,069 47,461Oct 2017 1,422 4,489 2,598 3,532 2,170 5,869 2,381 4,394 5,711 6,592 244 148 1,789 37,761Nov 2017 1,402 4,679 2,705 3,349 2,266 5,805 2,513 4,363 6,167 6,149 215 164 579 39,198Dec 2017 1,612 5,437 3,192 3,885 2,534 6,496 2,787 4,975 6,753 6,769 235 190 402 44,463
AE BGE DPL JCPL METED PECO PENLC PEPCO PL PS RECO UGI DIVERSITY MID-ATLANTICJan 2018 1,631 5,899 3,466 3,908 2,642 6,754 2,826 5,379 7,241 6,872 229 196 573 46,470Feb 2018 1,575 5,573 3,332 3,771 2,560 6,505 2,792 5,132 6,903 6,633 221 188 552 44,633Mar 2018 1,396 4,964 2,982 3,353 2,422 5,944 2,610 4,630 6,470 6,119 208 172 1,681 39,589Apr 2018 1,349 4,547 2,642 3,445 2,264 5,896 2,441 4,453 5,838 6,600 234 151 3,150 36,710
May 2018 1,702 5,432 3,071 4,349 2,482 6,760 2,498 5,312 6,044 7,776 299 153 1,766 44,112Jun 2018 2,194 6,490 3,725 5,510 2,829 8,181 2,779 6,269 6,726 9,311 371 176 832 53,729Jul 2018 2,486 6,953 4,037 6,085 2,976 8,614 2,899 6,616 7,185 10,071 404 192 1,186 57,332
Aug 2018 2,355 6,694 3,842 5,509 2,870 8,177 2,788 6,397 6,802 9,272 363 177 995 54,251Sep 2018 1,947 5,820 3,330 4,689 2,541 7,225 2,595 5,590 6,275 8,220 317 162 1,030 47,681Oct 2018 1,443 4,545 2,645 3,627 2,228 6,005 2,411 4,499 5,827 6,824 249 150 2,017 38,436Nov 2018 1,405 4,681 2,724 3,381 2,290 5,858 2,521 4,371 6,221 6,189 216 165 598 39,424Dec 2018 1,624 5,447 3,216 3,913 2,570 6,563 2,809 5,022 6,825 6,847 236 192 401 44,863
AE BGE DPL JCPL METED PECO PENLC PEPCO PL PS RECO UGI DIVERSITY MID-ATLANTICJan 2019 1,634 5,901 3,481 3,908 2,660 6,796 2,837 5,396 7,263 6,903 229 196 571 46,633Feb 2019 1,576 5,587 3,343 3,765 2,573 6,533 2,801 5,162 6,928 6,665 221 188 487 44,855Mar 2019 1,380 4,917 2,963 3,339 2,420 5,954 2,597 4,598 6,458 6,081 207 170 1,665 39,419Apr 2019 1,335 4,491 2,632 3,433 2,259 5,895 2,423 4,425 5,842 6,580 233 150 2,903 36,795
May 2019 1,692 5,399 3,060 4,354 2,483 6,780 2,488 5,292 6,052 7,777 299 154 1,911 43,919Jun 2019 2,189 6,409 3,720 5,475 2,843 8,186 2,775 6,251 6,724 9,297 370 175 626 53,788Jul 2019 2,475 6,860 4,024 6,080 2,991 8,643 2,904 6,599 7,201 10,047 403 192 1,089 57,330
Aug 2019 2,352 6,622 3,839 5,490 2,883 8,182 2,785 6,396 6,810 9,267 363 176 1,080 54,085Sep 2019 1,945 5,821 3,331 4,705 2,564 7,261 2,593 5,599 6,285 8,265 318 164 865 47,986Oct 2019 1,434 4,523 2,636 3,624 2,232 6,003 2,395 4,483 5,793 6,819 249 150 1,966 38,375Nov 2019 1,384 4,638 2,683 3,357 2,270 5,815 2,483 4,342 6,086 6,152 214 164 594 38,994Dec 2019 1,608 5,429 3,202 3,861 2,553 6,537 2,781 5,011 6,811 6,797 234 191 456 44,559
63
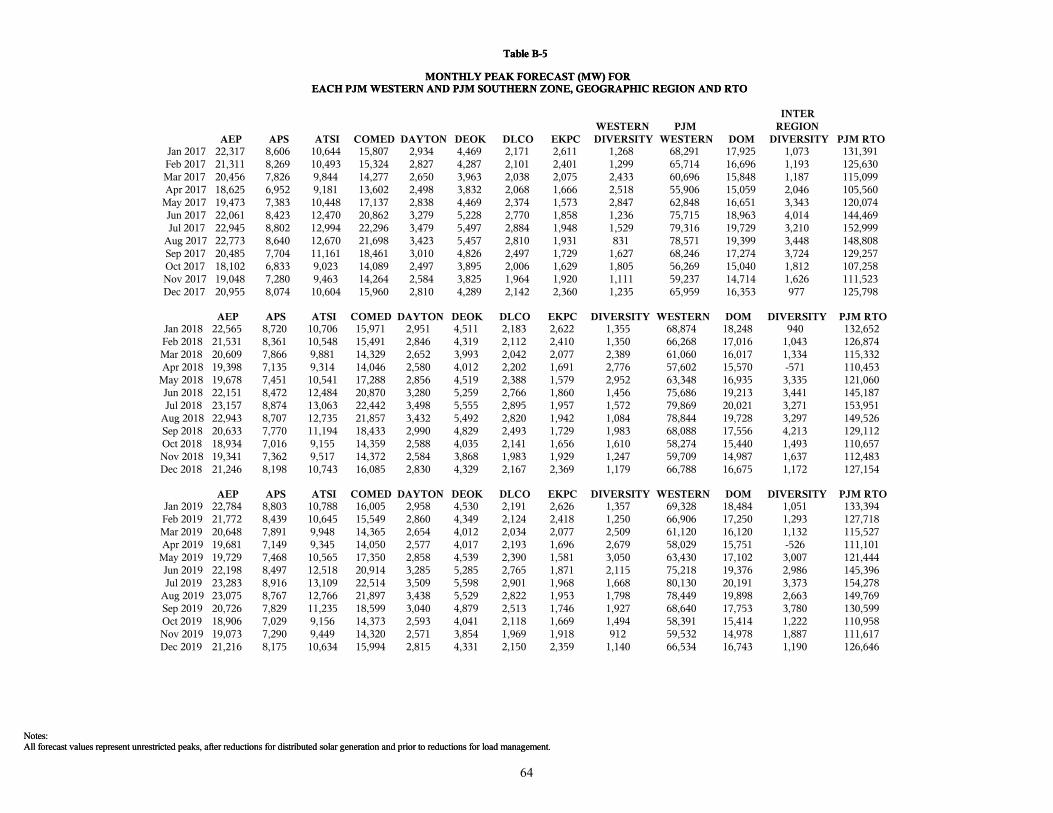
All forecast values represent unrestricted peaks, after reductions for distributed solar generation and prior to reductions for load management.Notes:
Table B-5
MONTHLY PEAK FORECAST (MW) FOREACH PJM WESTERN AND PJM SOUTHERN ZONE, GEOGRAPHIC REGION AND RTO
All forecast values represent unrestricted peaks, after reductions for distributed solar generation and prior to reductions for load management.Notes:
Table B-5
MONTHLY PEAK FORECAST (MW) FOREACH PJM WESTERN AND PJM SOUTHERN ZONE, GEOGRAPHIC REGION AND RTO
AEP APS ATSI COMED DAYTON DEOK DLCO EKPCWESTERNDIVERSITY
PJMWESTERN DOM
INTERREGION
DIVERSITY PJM RTOJan 2017 22,317 8,606 10,644 15,807 2,934 4,469 2,171 2,611 1,268 68,291 17,925 1,073 131,391Feb 2017 21,311 8,269 10,493 15,324 2,827 4,287 2,101 2,401 1,299 65,714 16,696 1,193 125,630Mar 2017 20,456 7,826 9,844 14,277 2,650 3,963 2,038 2,075 2,433 60,696 15,848 1,187 115,099Apr 2017 18,625 6,952 9,181 13,602 2,498 3,832 2,068 1,666 2,518 55,906 15,059 2,046 105,560
May 2017 19,473 7,383 10,448 17,137 2,838 4,469 2,374 1,573 2,847 62,848 16,651 3,343 120,074Jun 2017 22,061 8,423 12,470 20,862 3,279 5,228 2,770 1,858 1,236 75,715 18,963 4,014 144,469Jul 2017 22,945 8,802 12,994 22,296 3,479 5,497 2,884 1,948 1,529 79,316 19,729 3,210 152,999
Aug 2017 22,773 8,640 12,670 21,698 3,423 5,457 2,810 1,931 831 78,571 19,399 3,448 148,808Sep 2017 20,485 7,704 11,161 18,461 3,010 4,826 2,497 1,729 1,627 68,246 17,274 3,724 129,257Oct 2017 18,102 6,833 9,023 14,089 2,497 3,895 2,006 1,629 1,805 56,269 15,040 1,812 107,258Nov 2017 19,048 7,280 9,463 14,264 2,584 3,825 1,964 1,920 1,111 59,237 14,714 1,626 111,523Dec 2017 20,955 8,074 10,604 15,960 2,810 4,289 2,142 2,360 1,235 65,959 16,353 977 125,798
AEP APS ATSI COMED DAYTON DEOK DLCO EKPC DIVERSITY WESTERN DOM DIVERSITY PJM RTOJan 2018 22,565 8,720 10,706 15,971 2,951 4,511 2,183 2,622 1,355 68,874 18,248 940 132,652Feb 2018 21,531 8,361 10,548 15,491 2,846 4,319 2,112 2,410 1,350 66,268 17,016 1,043 126,874Mar 2018 20,609 7,866 9,881 14,329 2,652 3,993 2,042 2,077 2,389 61,060 16,017 1,334 115,332Apr 2018 19,398 7,135 9,314 14,046 2,580 4,012 2,202 1,691 2,776 57,602 15,570 -571 110,453
May 2018 19,678 7,451 10,541 17,288 2,856 4,519 2,388 1,579 2,952 63,348 16,935 3,335 121,060Jun 2018 22,151 8,472 12,484 20,870 3,280 5,259 2,766 1,860 1,456 75,686 19,213 3,441 145,187Jul 2018 23,157 8,874 13,063 22,442 3,498 5,555 2,895 1,957 1,572 79,869 20,021 3,271 153,951
Aug 2018 22,943 8,707 12,735 21,857 3,432 5,492 2,820 1,942 1,084 78,844 19,728 3,297 149,526Sep 2018 20,633 7,770 11,194 18,433 2,990 4,829 2,493 1,729 1,983 68,088 17,556 4,213 129,112Oct 2018 18,934 7,016 9,155 14,359 2,588 4,035 2,141 1,656 1,610 58,274 15,440 1,493 110,657Nov 2018 19,341 7,362 9,517 14,372 2,584 3,868 1,983 1,929 1,247 59,709 14,987 1,637 112,483Dec 2018 21,246 8,198 10,743 16,085 2,830 4,329 2,167 2,369 1,179 66,788 16,675 1,172 127,154
AEP APS ATSI COMED DAYTON DEOK DLCO EKPC DIVERSITY WESTERN DOM DIVERSITY PJM RTOJan 2019 22,784 8,803 10,788 16,005 2,958 4,530 2,191 2,626 1,357 69,328 18,484 1,051 133,394Feb 2019 21,772 8,439 10,645 15,549 2,860 4,349 2,124 2,418 1,250 66,906 17,250 1,293 127,718Mar 2019 20,648 7,891 9,948 14,365 2,654 4,012 2,034 2,077 2,509 61,120 16,120 1,132 115,527Apr 2019 19,681 7,149 9,345 14,050 2,577 4,017 2,193 1,696 2,679 58,029 15,751 -526 111,101
May 2019 19,729 7,468 10,565 17,350 2,858 4,539 2,390 1,581 3,050 63,430 17,102 3,007 121,444Jun 2019 22,198 8,497 12,518 20,914 3,285 5,285 2,765 1,871 2,115 75,218 19,376 2,986 145,396Jul 2019 23,283 8,916 13,109 22,514 3,509 5,598 2,901 1,968 1,668 80,130 20,191 3,373 154,278
Aug 2019 23,075 8,767 12,766 21,897 3,438 5,529 2,822 1,953 1,798 78,449 19,898 2,663 149,769Sep 2019 20,726 7,829 11,235 18,599 3,040 4,879 2,513 1,746 1,927 68,640 17,753 3,780 130,599Oct 2019 18,906 7,029 9,156 14,373 2,593 4,041 2,118 1,669 1,494 58,391 15,414 1,222 110,958Nov 2019 19,073 7,290 9,449 14,320 2,571 3,854 1,969 1,918 912 59,532 14,978 1,887 111,617Dec 2019 21,216 8,175 10,634 15,994 2,815 4,331 2,150 2,359 1,140 66,534 16,743 1,190 126,646
64
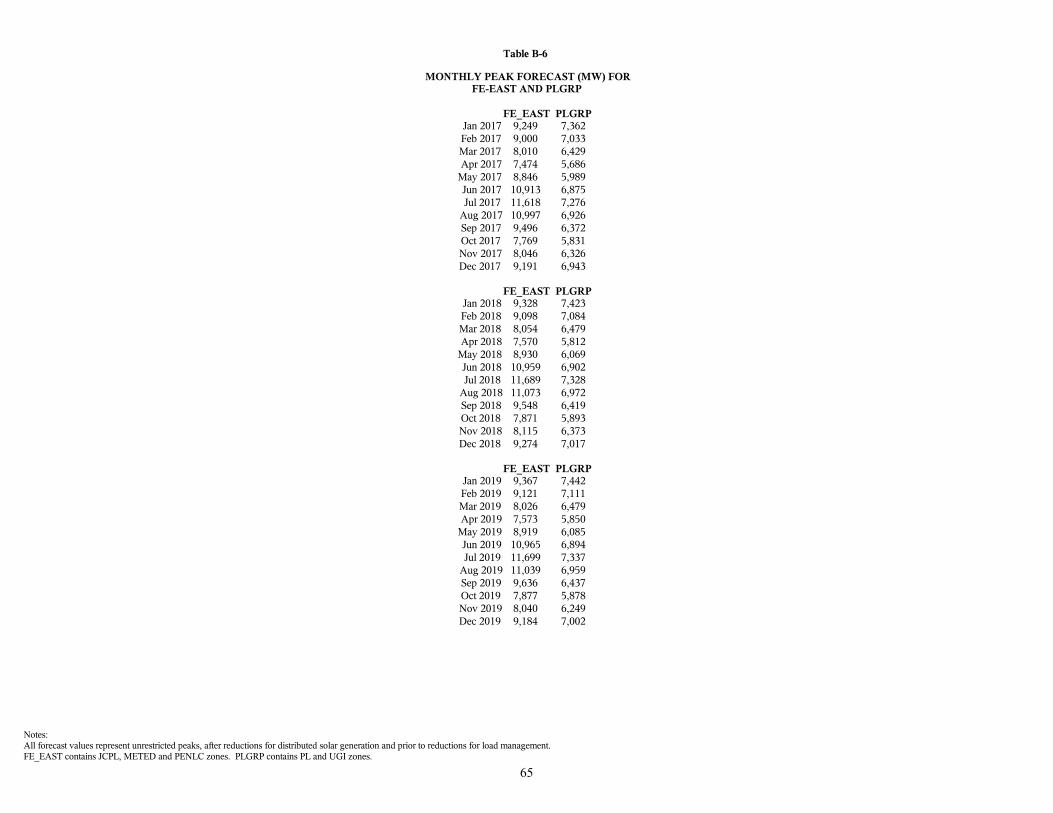
FE_EAST contains JCPL, METED and PENLC zones. PLGRP contains PL and UGI zones.All forecast values represent unrestricted peaks, after reductions for distributed solar generation and prior to reductions for load management.Notes:
Table B-6
MONTHLY PEAK FORECAST (MW) FORFE-EAST AND PLGRP
FE_EAST PLGRPJan 2017 9,249 7,362Feb 2017 9,000 7,033Mar 2017 8,010 6,429Apr 2017 7,474 5,686
May 2017 8,846 5,989Jun 2017 10,913 6,875Jul 2017 11,618 7,276
Aug 2017 10,997 6,926Sep 2017 9,496 6,372Oct 2017 7,769 5,831Nov 2017 8,046 6,326Dec 2017 9,191 6,943
FE_EAST PLGRPJan 2018 9,328 7,423Feb 2018 9,098 7,084Mar 2018 8,054 6,479Apr 2018 7,570 5,812
May 2018 8,930 6,069Jun 2018 10,959 6,902Jul 2018 11,689 7,328
Aug 2018 11,073 6,972Sep 2018 9,548 6,419Oct 2018 7,871 5,893Nov 2018 8,115 6,373Dec 2018 9,274 7,017
FE_EAST PLGRPJan 2019 9,367 7,442Feb 2019 9,121 7,111Mar 2019 8,026 6,479Apr 2019 7,573 5,850
May 2019 8,919 6,085Jun 2019 10,965 6,894Jul 2019 11,699 7,337
Aug 2019 11,039 6,959Sep 2019 9,636 6,437Oct 2019 7,877 5,878Nov 2019 8,040 6,249Dec 2019 9,184 7,002
65
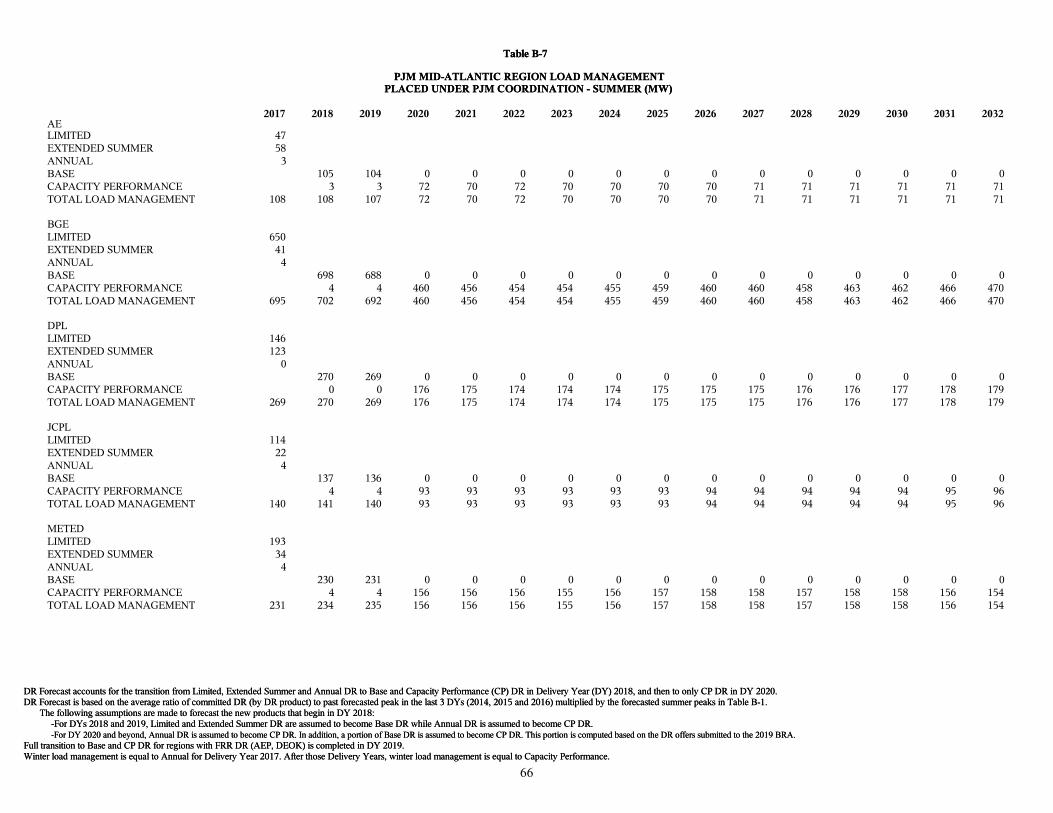
Winter load management is equal to Annual for Delivery Year 2017. After those Delivery Years, winter load management is equal to Capacity Performance.Full transition to Base and CP DR for regions with FRR DR (AEP, DEOK) is completed in DY 2019.JUSTE-For DY 2020 and beyond, Annual DR is assumed to become CP DR. In addition, a portion of Base DR is assumed to become CP DR. This portion is computed based on the DR offers submitted to the 2019 BRA.JUSTE-For DYs 2018 and 2019, Limited and Extended Summer DR are assumed to become Base DR while Annual DR is assumed to become CP DR.JUSThe following assumptions are made to forecast the new products that begin in DY 2018:DR Forecast is based on the average ratio of committed DR (by DR product) to past forecasted peak in the last 3 DYs (2014, 2015 and 2016) multiplied by the forecasted summer peaks in Table B-1.DR Forecast accounts for the transition from Limited, Extended Summer and Annual DR to Base and Capacity Performance (CP) DR in Delivery Year (DY) 2018, and then to only CP DR in DY 2020.
Table B-7
PJM MID-ATLANTIC REGION LOAD MANAGEMENTPLACED UNDER PJM COORDINATION - SUMMER (MW)
2017 2018 2019 2020 2021 2022 2023 2024 2025 2026 2027 2028 2029 2030 2031 2032AELIMITED 47EXTENDED SUMMER 58ANNUAL 3BASE 105 104 0 0 0 0 0 0 0 0 0 0 0 0 0CAPACITY PERFORMANCE 3 3 72 70 72 70 70 70 70 71 71 71 71 71 71TOTAL LOAD MANAGEMENT 108 108 107 72 70 72 70 70 70 70 71 71 71 71 71 71
BGELIMITED 650EXTENDED SUMMER 41ANNUAL 4BASE 698 688 0 0 0 0 0 0 0 0 0 0 0 0 0CAPACITY PERFORMANCE 4 4 460 456 454 454 455 459 460 460 458 463 462 466 470TOTAL LOAD MANAGEMENT 695 702 692 460 456 454 454 455 459 460 460 458 463 462 466 470
DPLLIMITED 146EXTENDED SUMMER 123ANNUAL 0BASE 270 269 0 0 0 0 0 0 0 0 0 0 0 0 0CAPACITY PERFORMANCE 0 0 176 175 174 174 174 175 175 175 176 176 177 178 179TOTAL LOAD MANAGEMENT 269 270 269 176 175 174 174 174 175 175 175 176 176 177 178 179
JCPLLIMITED 114EXTENDED SUMMER 22ANNUAL 4BASE 137 136 0 0 0 0 0 0 0 0 0 0 0 0 0CAPACITY PERFORMANCE 4 4 93 93 93 93 93 93 94 94 94 94 94 95 96TOTAL LOAD MANAGEMENT 140 141 140 93 93 93 93 93 93 94 94 94 94 94 95 96
METEDLIMITED 193EXTENDED SUMMER 34ANNUAL 4BASE 230 231 0 0 0 0 0 0 0 0 0 0 0 0 0CAPACITY PERFORMANCE 4 4 156 156 156 155 156 157 158 158 157 158 158 156 154TOTAL LOAD MANAGEMENT 231 234 235 156 156 156 155 156 157 158 158 157 158 158 156 154
66
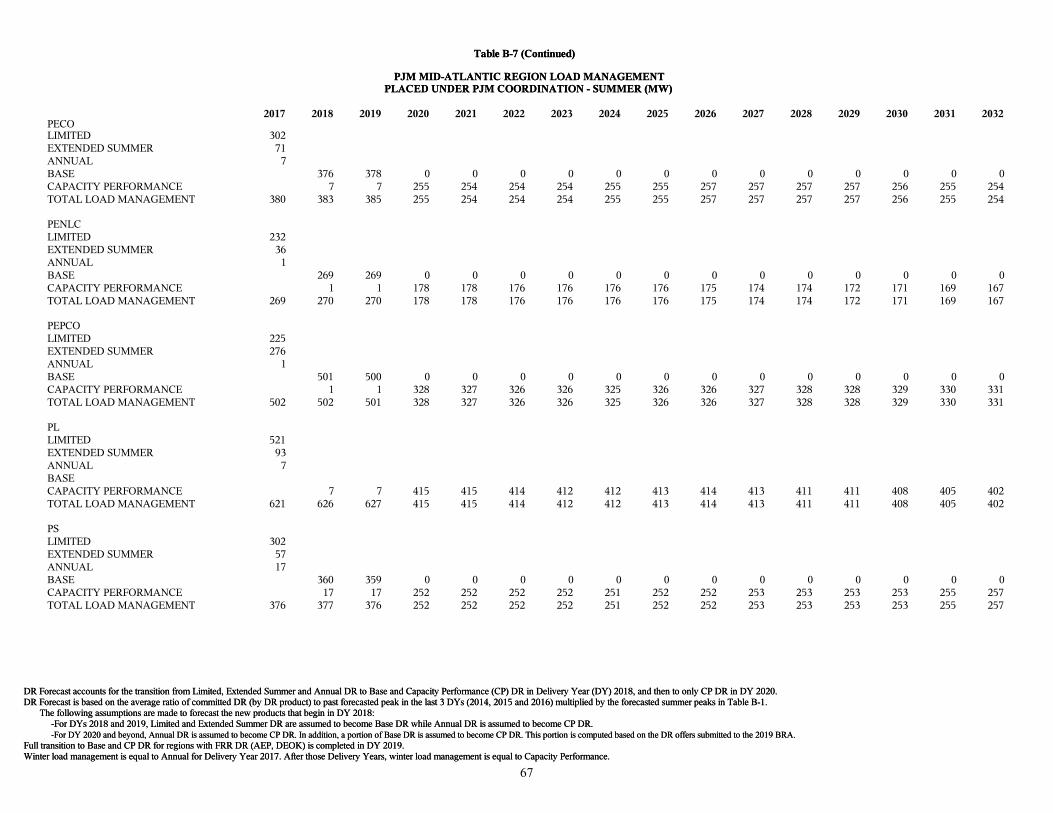
Winter load management is equal to Annual for Delivery Year 2017. After those Delivery Years, winter load management is equal to Capacity Performance.Full transition to Base and CP DR for regions with FRR DR (AEP, DEOK) is completed in DY 2019.JUSTE-For DY 2020 and beyond, Annual DR is assumed to become CP DR. In addition, a portion of Base DR is assumed to become CP DR. This portion is computed based on the DR offers submitted to the 2019 BRA.JUSTE-For DYs 2018 and 2019, Limited and Extended Summer DR are assumed to become Base DR while Annual DR is assumed to become CP DR.JUSThe following assumptions are made to forecast the new products that begin in DY 2018:DR Forecast is based on the average ratio of committed DR (by DR product) to past forecasted peak in the last 3 DYs (2014, 2015 and 2016) multiplied by the forecasted summer peaks in Table B-1.DR Forecast accounts for the transition from Limited, Extended Summer and Annual DR to Base and Capacity Performance (CP) DR in Delivery Year (DY) 2018, and then to only CP DR in DY 2020.
Table B-7 (Continued)
PJM MID-ATLANTIC REGION LOAD MANAGEMENTPLACED UNDER PJM COORDINATION - SUMMER (MW)
2017 2018 2019 2020 2021 2022 2023 2024 2025 2026 2027 2028 2029 2030 2031 2032PECOLIMITED 302EXTENDED SUMMER 71ANNUAL 7BASE 376 378 0 0 0 0 0 0 0 0 0 0 0 0 0CAPACITY PERFORMANCE 7 7 255 254 254 254 255 255 257 257 257 257 256 255 254TOTAL LOAD MANAGEMENT 380 383 385 255 254 254 254 255 255 257 257 257 257 256 255 254
PENLCLIMITED 232EXTENDED SUMMER 36ANNUAL 1BASE 269 269 0 0 0 0 0 0 0 0 0 0 0 0 0CAPACITY PERFORMANCE 1 1 178 178 176 176 176 176 175 174 174 172 171 169 167TOTAL LOAD MANAGEMENT 269 270 270 178 178 176 176 176 176 175 174 174 172 171 169 167
PEPCOLIMITED 225EXTENDED SUMMER 276ANNUAL 1BASE 501 500 0 0 0 0 0 0 0 0 0 0 0 0 0CAPACITY PERFORMANCE 1 1 328 327 326 326 325 326 326 327 328 328 329 330 331TOTAL LOAD MANAGEMENT 502 502 501 328 327 326 326 325 326 326 327 328 328 329 330 331
PLLIMITED 521EXTENDED SUMMER 93ANNUAL 7BASECAPACITY PERFORMANCE 7 7 415 415 414 412 412 413 414 413 411 411 408 405 402TOTAL LOAD MANAGEMENT 621 626 627 415 415 414 412 412 413 414 413 411 411 408 405 402
PSLIMITED 302EXTENDED SUMMER 57ANNUAL 17BASE 360 359 0 0 0 0 0 0 0 0 0 0 0 0 0CAPACITY PERFORMANCE 17 17 252 252 252 252 251 252 252 253 253 253 253 255 257TOTAL LOAD MANAGEMENT 376 377 376 252 252 252 252 251 252 252 253 253 253 253 255 257
67
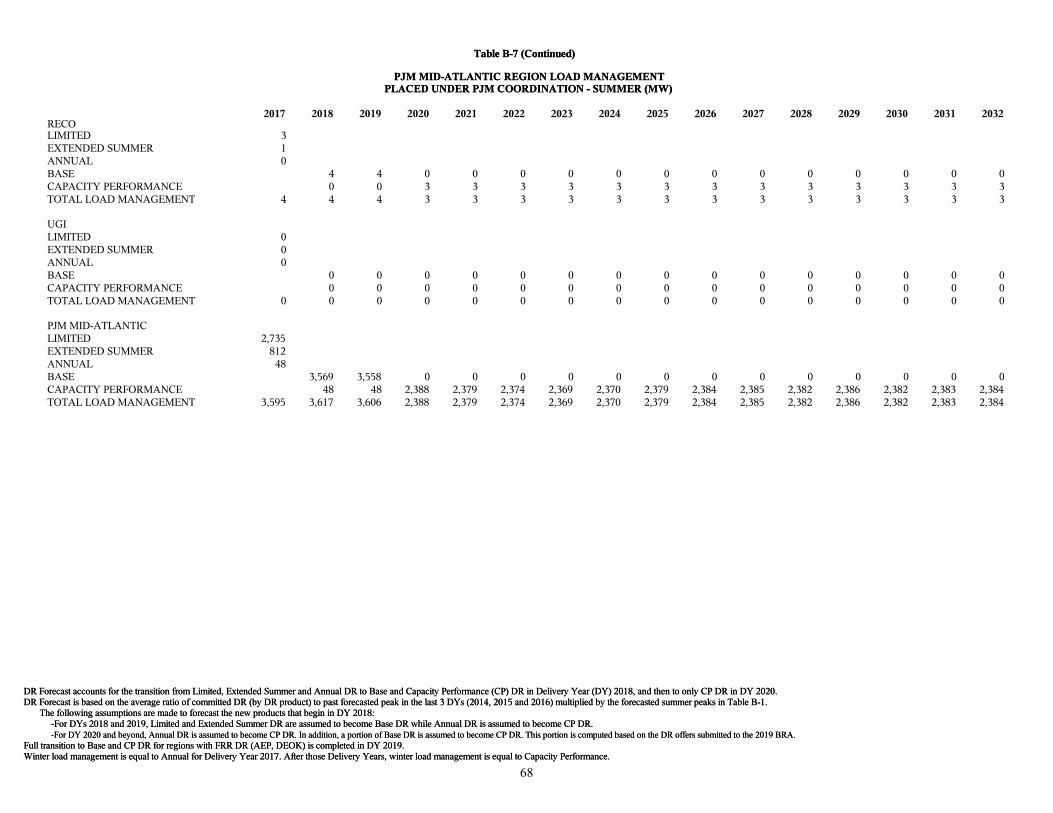
Winter load management is equal to Annual for Delivery Year 2017. After those Delivery Years, winter load management is equal to Capacity Performance.Full transition to Base and CP DR for regions with FRR DR (AEP, DEOK) is completed in DY 2019.JUSTE-For DY 2020 and beyond, Annual DR is assumed to become CP DR. In addition, a portion of Base DR is assumed to become CP DR. This portion is computed based on the DR offers submitted to the 2019 BRA.JUSTE-For DYs 2018 and 2019, Limited and Extended Summer DR are assumed to become Base DR while Annual DR is assumed to become CP DR.JUSThe following assumptions are made to forecast the new products that begin in DY 2018:DR Forecast is based on the average ratio of committed DR (by DR product) to past forecasted peak in the last 3 DYs (2014, 2015 and 2016) multiplied by the forecasted summer peaks in Table B-1.DR Forecast accounts for the transition from Limited, Extended Summer and Annual DR to Base and Capacity Performance (CP) DR in Delivery Year (DY) 2018, and then to only CP DR in DY 2020.
Table B-7 (Continued)
PJM MID-ATLANTIC REGION LOAD MANAGEMENTPLACED UNDER PJM COORDINATION - SUMMER (MW)
2017 2018 2019 2020 2021 2022 2023 2024 2025 2026 2027 2028 2029 2030 2031 2032RECOLIMITED 3EXTENDED SUMMER 1ANNUAL 0BASE 4 4 0 0 0 0 0 0 0 0 0 0 0 0 0CAPACITY PERFORMANCE 0 0 3 3 3 3 3 3 3 3 3 3 3 3 3TOTAL LOAD MANAGEMENT 4 4 4 3 3 3 3 3 3 3 3 3 3 3 3 3
UGILIMITED 0EXTENDED SUMMER 0ANNUAL 0BASE 0 0 0 0 0 0 0 0 0 0 0 0 0 0 0CAPACITY PERFORMANCE 0 0 0 0 0 0 0 0 0 0 0 0 0 0 0TOTAL LOAD MANAGEMENT 0 0 0 0 0 0 0 0 0 0 0 0 0 0 0 0
PJM MID-ATLANTICLIMITED 2,735EXTENDED SUMMER 812ANNUAL 48BASE 3,569 3,558 0 0 0 0 0 0 0 0 0 0 0 0 0CAPACITY PERFORMANCE 48 48 2,388 2,379 2,374 2,369 2,370 2,379 2,384 2,385 2,382 2,386 2,382 2,383 2,384TOTAL LOAD MANAGEMENT 3,595 3,617 3,606 2,388 2,379 2,374 2,369 2,370 2,379 2,384 2,385 2,382 2,386 2,382 2,383 2,384
68
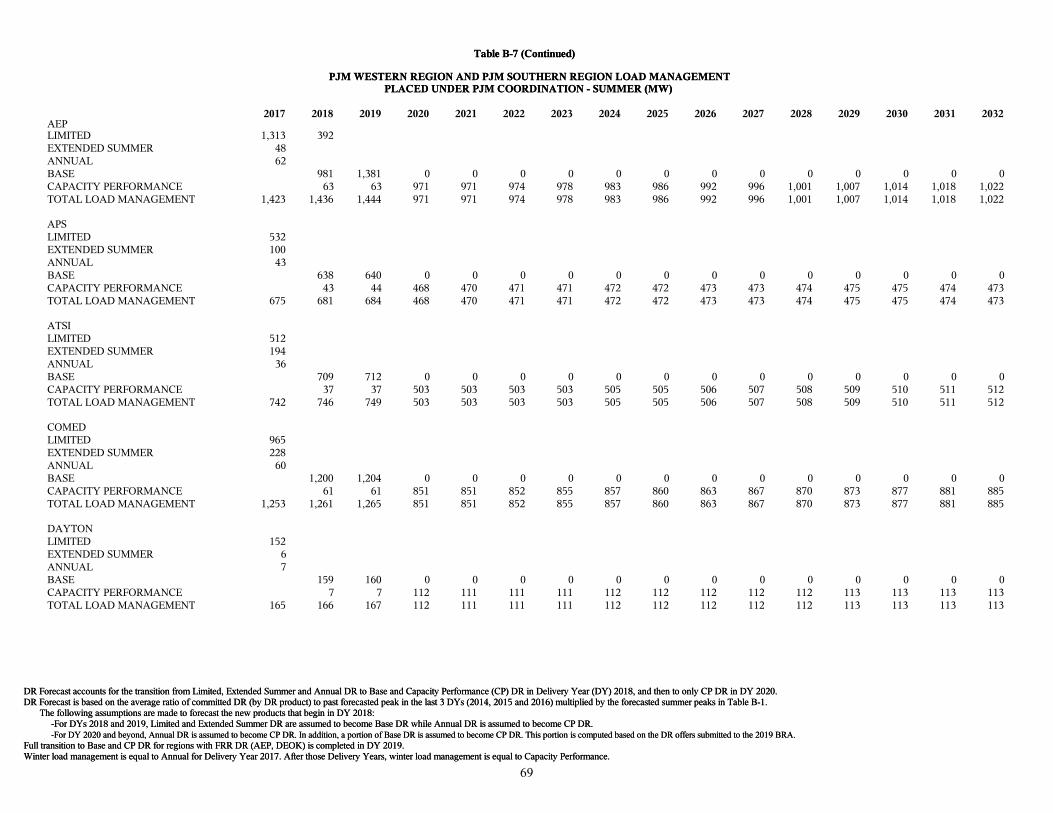
Winter load management is equal to Annual for Delivery Year 2017. After those Delivery Years, winter load management is equal to Capacity Performance.Full transition to Base and CP DR for regions with FRR DR (AEP, DEOK) is completed in DY 2019.JUSTE-For DY 2020 and beyond, Annual DR is assumed to become CP DR. In addition, a portion of Base DR is assumed to become CP DR. This portion is computed based on the DR offers submitted to the 2019 BRA.JUSTE-For DYs 2018 and 2019, Limited and Extended Summer DR are assumed to become Base DR while Annual DR is assumed to become CP DR.JUSThe following assumptions are made to forecast the new products that begin in DY 2018:DR Forecast is based on the average ratio of committed DR (by DR product) to past forecasted peak in the last 3 DYs (2014, 2015 and 2016) multiplied by the forecasted summer peaks in Table B-1.DR Forecast accounts for the transition from Limited, Extended Summer and Annual DR to Base and Capacity Performance (CP) DR in Delivery Year (DY) 2018, and then to only CP DR in DY 2020.
Table B-7 (Continued)
PJM WESTERN REGION AND PJM SOUTHERN REGION LOAD MANAGEMENTPLACED UNDER PJM COORDINATION - SUMMER (MW)
2017 2018 2019 2020 2021 2022 2023 2024 2025 2026 2027 2028 2029 2030 2031 2032AEPLIMITED 1,313 392EXTENDED SUMMER 48ANNUAL 62BASE 981 1,381 0 0 0 0 0 0 0 0 0 0 0 0 0CAPACITY PERFORMANCE 63 63 971 971 974 978 983 986 992 996 1,001 1,007 1,014 1,018 1,022TOTAL LOAD MANAGEMENT 1,423 1,436 1,444 971 971 974 978 983 986 992 996 1,001 1,007 1,014 1,018 1,022
APSLIMITED 532EXTENDED SUMMER 100ANNUAL 43BASE 638 640 0 0 0 0 0 0 0 0 0 0 0 0 0CAPACITY PERFORMANCE 43 44 468 470 471 471 472 472 473 473 474 475 475 474 473TOTAL LOAD MANAGEMENT 675 681 684 468 470 471 471 472 472 473 473 474 475 475 474 473
ATSILIMITED 512EXTENDED SUMMER 194ANNUAL 36BASE 709 712 0 0 0 0 0 0 0 0 0 0 0 0 0CAPACITY PERFORMANCE 37 37 503 503 503 503 505 505 506 507 508 509 510 511 512TOTAL LOAD MANAGEMENT 742 746 749 503 503 503 503 505 505 506 507 508 509 510 511 512
COMEDLIMITED 965EXTENDED SUMMER 228ANNUAL 60BASE 1,200 1,204 0 0 0 0 0 0 0 0 0 0 0 0 0CAPACITY PERFORMANCE 61 61 851 851 852 855 857 860 863 867 870 873 877 881 885TOTAL LOAD MANAGEMENT 1,253 1,261 1,265 851 851 852 855 857 860 863 867 870 873 877 881 885
DAYTONLIMITED 152EXTENDED SUMMER 6ANNUAL 7BASE 159 160 0 0 0 0 0 0 0 0 0 0 0 0 0CAPACITY PERFORMANCE 7 7 112 111 111 111 112 112 112 112 112 113 113 113 113TOTAL LOAD MANAGEMENT 165 166 167 112 111 111 111 112 112 112 112 112 113 113 113 113
69
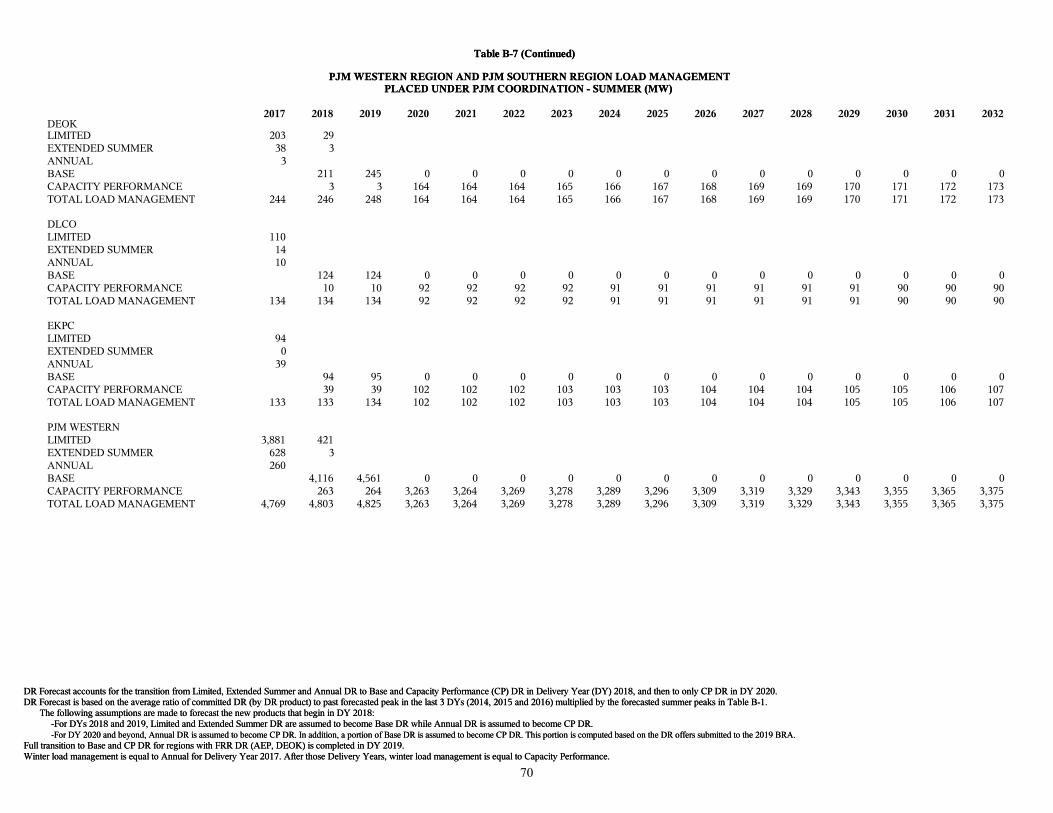
Winter load management is equal to Annual for Delivery Year 2017. After those Delivery Years, winter load management is equal to Capacity Performance.Full transition to Base and CP DR for regions with FRR DR (AEP, DEOK) is completed in DY 2019.JUSTE-For DY 2020 and beyond, Annual DR is assumed to become CP DR. In addition, a portion of Base DR is assumed to become CP DR. This portion is computed based on the DR offers submitted to the 2019 BRA.JUSTE-For DYs 2018 and 2019, Limited and Extended Summer DR are assumed to become Base DR while Annual DR is assumed to become CP DR.JUSThe following assumptions are made to forecast the new products that begin in DY 2018:DR Forecast is based on the average ratio of committed DR (by DR product) to past forecasted peak in the last 3 DYs (2014, 2015 and 2016) multiplied by the forecasted summer peaks in Table B-1.DR Forecast accounts for the transition from Limited, Extended Summer and Annual DR to Base and Capacity Performance (CP) DR in Delivery Year (DY) 2018, and then to only CP DR in DY 2020.
Table B-7 (Continued)
PJM WESTERN REGION AND PJM SOUTHERN REGION LOAD MANAGEMENTPLACED UNDER PJM COORDINATION - SUMMER (MW)
2017 2018 2019 2020 2021 2022 2023 2024 2025 2026 2027 2028 2029 2030 2031 2032DEOKLIMITED 203 29EXTENDED SUMMER 38 3ANNUAL 3BASE 211 245 0 0 0 0 0 0 0 0 0 0 0 0 0CAPACITY PERFORMANCE 3 3 164 164 164 165 166 167 168 169 169 170 171 172 173TOTAL LOAD MANAGEMENT 244 246 248 164 164 164 165 166 167 168 169 169 170 171 172 173
DLCOLIMITED 110EXTENDED SUMMER 14ANNUAL 10BASE 124 124 0 0 0 0 0 0 0 0 0 0 0 0 0CAPACITY PERFORMANCE 10 10 92 92 92 92 91 91 91 91 91 91 90 90 90TOTAL LOAD MANAGEMENT 134 134 134 92 92 92 92 91 91 91 91 91 91 90 90 90
EKPCLIMITED 94EXTENDED SUMMER 0ANNUAL 39BASE 94 95 0 0 0 0 0 0 0 0 0 0 0 0 0CAPACITY PERFORMANCE 39 39 102 102 102 103 103 103 104 104 104 105 105 106 107TOTAL LOAD MANAGEMENT 133 133 134 102 102 102 103 103 103 104 104 104 105 105 106 107
PJM WESTERNLIMITED 3,881 421EXTENDED SUMMER 628 3ANNUAL 260BASE 4,116 4,561 0 0 0 0 0 0 0 0 0 0 0 0 0CAPACITY PERFORMANCE 263 264 3,263 3,264 3,269 3,278 3,289 3,296 3,309 3,319 3,329 3,343 3,355 3,365 3,375TOTAL LOAD MANAGEMENT 4,769 4,803 4,825 3,263 3,264 3,269 3,278 3,289 3,296 3,309 3,319 3,329 3,343 3,355 3,365 3,375
70
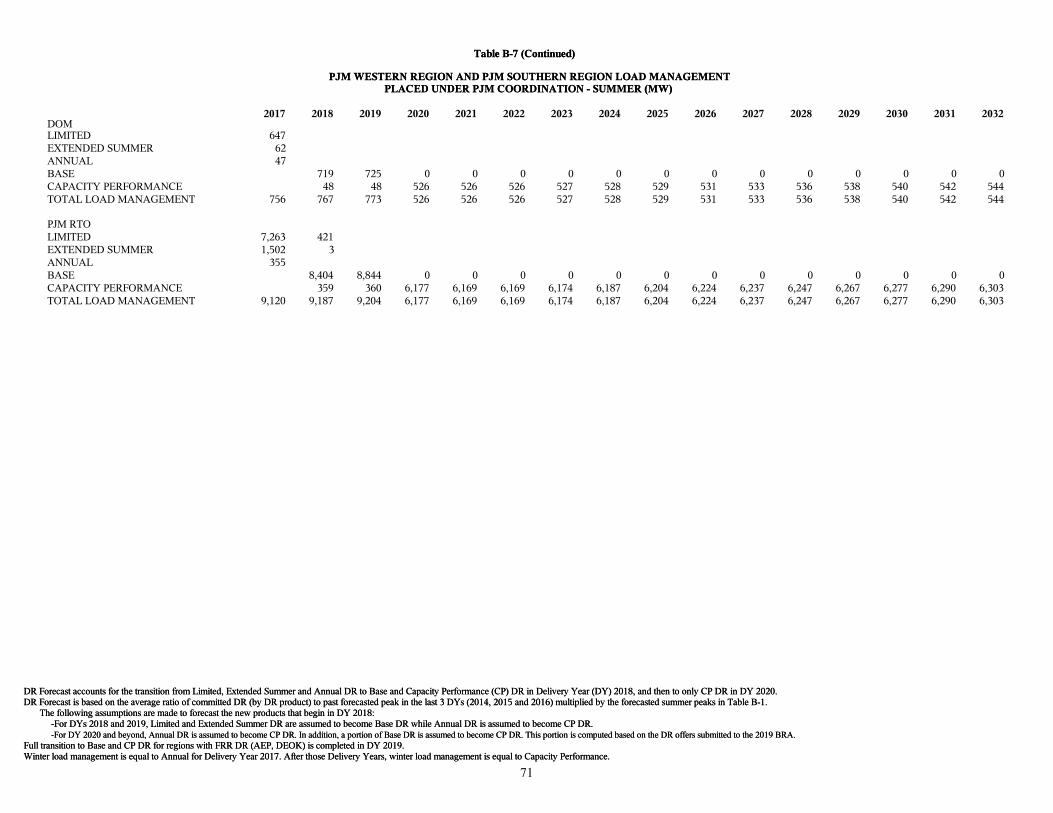
Winter load management is equal to Annual for Delivery Year 2017. After those Delivery Years, winter load management is equal to Capacity Performance.Full transition to Base and CP DR for regions with FRR DR (AEP, DEOK) is completed in DY 2019.JUSTE-For DY 2020 and beyond, Annual DR is assumed to become CP DR. In addition, a portion of Base DR is assumed to become CP DR. This portion is computed based on the DR offers submitted to the 2019 BRA.JUSTE-For DYs 2018 and 2019, Limited and Extended Summer DR are assumed to become Base DR while Annual DR is assumed to become CP DR.JUSThe following assumptions are made to forecast the new products that begin in DY 2018:DR Forecast is based on the average ratio of committed DR (by DR product) to past forecasted peak in the last 3 DYs (2014, 2015 and 2016) multiplied by the forecasted summer peaks in Table B-1.DR Forecast accounts for the transition from Limited, Extended Summer and Annual DR to Base and Capacity Performance (CP) DR in Delivery Year (DY) 2018, and then to only CP DR in DY 2020.
Table B-7 (Continued)
PJM WESTERN REGION AND PJM SOUTHERN REGION LOAD MANAGEMENTPLACED UNDER PJM COORDINATION - SUMMER (MW)
2017 2018 2019 2020 2021 2022 2023 2024 2025 2026 2027 2028 2029 2030 2031 2032DOMLIMITED 647EXTENDED SUMMER 62ANNUAL 47BASE 719 725 0 0 0 0 0 0 0 0 0 0 0 0 0CAPACITY PERFORMANCE 48 48 526 526 526 527 528 529 531 533 536 538 540 542 544TOTAL LOAD MANAGEMENT 756 767 773 526 526 526 527 528 529 531 533 536 538 540 542 544
PJM RTOLIMITED 7,263 421EXTENDED SUMMER 1,502 3ANNUAL 355BASE 8,404 8,844 0 0 0 0 0 0 0 0 0 0 0 0 0CAPACITY PERFORMANCE 359 360 6,177 6,169 6,169 6,174 6,187 6,204 6,224 6,237 6,247 6,267 6,277 6,290 6,303TOTAL LOAD MANAGEMENT 9,120 9,187 9,204 6,177 6,169 6,169 6,174 6,187 6,204 6,224 6,237 6,247 6,267 6,277 6,290 6,303
71
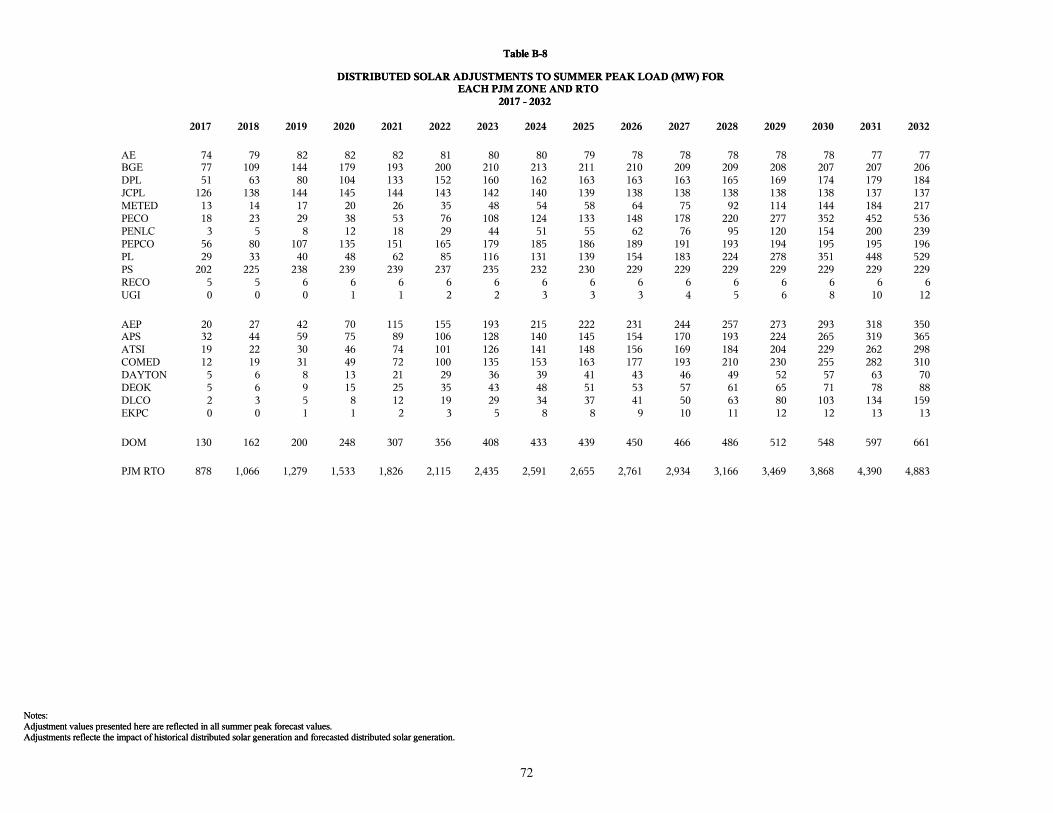
Adjustments reflecte the impact of historical distributed solar generation and forecasted distributed solar generation.Adjustment values presented here are reflected in all summer peak forecast values.Notes:
Table B-8
DISTRIBUTED SOLAR ADJUSTMENTS TO SUMMER PEAK LOAD (MW) FOREACH PJM ZONE AND RTO
2017 - 2032
2017 2018 2019 2020 2021 2022 2023 2024 2025 2026 2027 2028 2029 2030 2031 2032
AE 74 79 82 82 82 81 80 80 79 78 78 78 78 78 77 77BGE 77 109 144 179 193 200 210 213 211 210 209 209 208 207 207 206DPL 51 63 80 104 133 152 160 162 163 163 163 165 169 174 179 184JCPL 126 138 144 145 144 143 142 140 139 138 138 138 138 138 137 137METED 13 14 17 20 26 35 48 54 58 64 75 92 114 144 184 217PECO 18 23 29 38 53 76 108 124 133 148 178 220 277 352 452 536PENLC 3 5 8 12 18 29 44 51 55 62 76 95 120 154 200 239PEPCO 56 80 107 135 151 165 179 185 186 189 191 193 194 195 195 196PL 29 33 40 48 62 85 116 131 139 154 183 224 278 351 448 529PS 202 225 238 239 239 237 235 232 230 229 229 229 229 229 229 229RECO 5 5 6 6 6 6 6 6 6 6 6 6 6 6 6 6UGI 0 0 0 1 1 2 2 3 3 3 4 5 6 8 10 12
AEP 20 27 42 70 115 155 193 215 222 231 244 257 273 293 318 350APS 32 44 59 75 89 106 128 140 145 154 170 193 224 265 319 365ATSI 19 22 30 46 74 101 126 141 148 156 169 184 204 229 262 298COMED 12 19 31 49 72 100 135 153 163 177 193 210 230 255 282 310DAYTON 5 6 8 13 21 29 36 39 41 43 46 49 52 57 63 70DEOK 5 6 9 15 25 35 43 48 51 53 57 61 65 71 78 88DLCO 2 3 5 8 12 19 29 34 37 41 50 63 80 103 134 159EKPC 0 0 1 1 2 3 5 8 8 9 10 11 12 12 13 13
DOM 130 162 200 248 307 356 408 433 439 450 466 486 512 548 597 661
PJM RTO 878 1,066 1,279 1,533 1,826 2,115 2,435 2,591 2,655 2,761 2,934 3,166 3,469 3,868 4,390 4,883
72
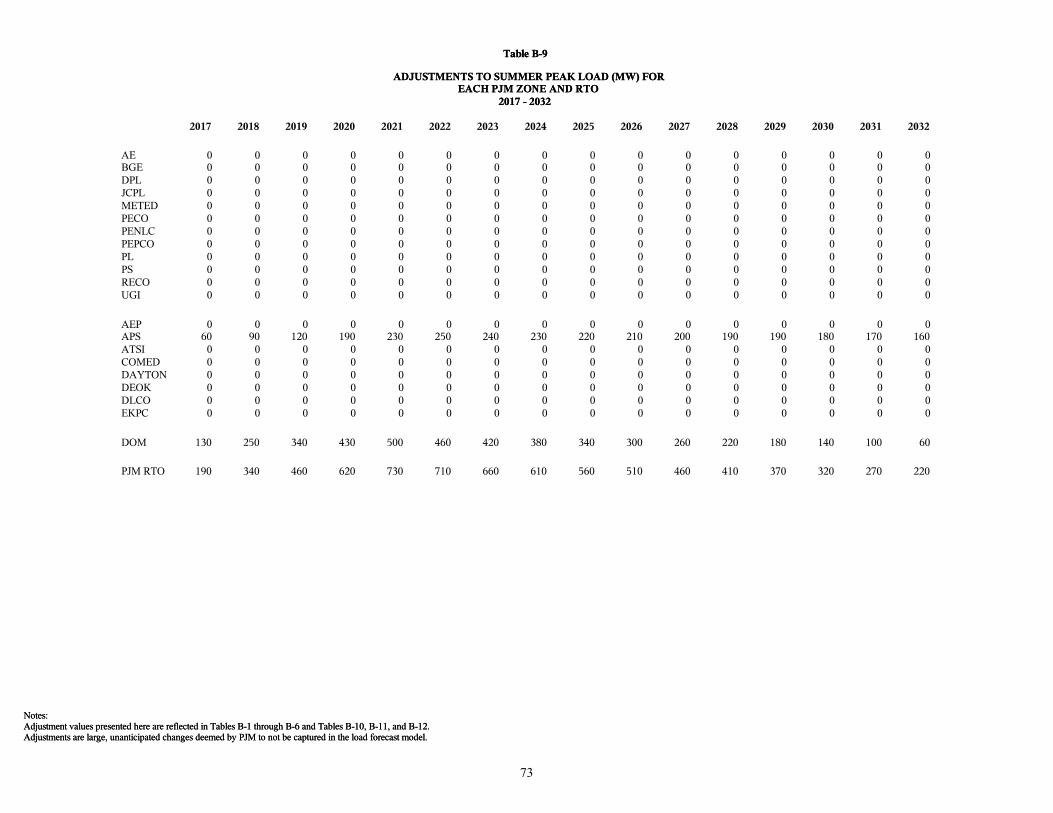
Adjustments are large, unanticipated changes deemed by PJM to not be captured in the load forecast model.Adjustment values presented here are reflected in Tables B-1 through B-6 and Tables B-10, B-11, and B-12.Notes:
Table B-9
ADJUSTMENTS TO SUMMER PEAK LOAD (MW) FOREACH PJM ZONE AND RTO
2017 - 2032
2017 2018 2019 2020 2021 2022 2023 2024 2025 2026 2027 2028 2029 2030 2031 2032
AE 0 0 0 0 0 0 0 0 0 0 0 0 0 0 0 0BGE 0 0 0 0 0 0 0 0 0 0 0 0 0 0 0 0DPL 0 0 0 0 0 0 0 0 0 0 0 0 0 0 0 0JCPL 0 0 0 0 0 0 0 0 0 0 0 0 0 0 0 0METED 0 0 0 0 0 0 0 0 0 0 0 0 0 0 0 0PECO 0 0 0 0 0 0 0 0 0 0 0 0 0 0 0 0PENLC 0 0 0 0 0 0 0 0 0 0 0 0 0 0 0 0PEPCO 0 0 0 0 0 0 0 0 0 0 0 0 0 0 0 0PL 0 0 0 0 0 0 0 0 0 0 0 0 0 0 0 0PS 0 0 0 0 0 0 0 0 0 0 0 0 0 0 0 0RECO 0 0 0 0 0 0 0 0 0 0 0 0 0 0 0 0UGI 0 0 0 0 0 0 0 0 0 0 0 0 0 0 0 0
AEP 0 0 0 0 0 0 0 0 0 0 0 0 0 0 0 0APS 60 90 120 190 230 250 240 230 220 210 200 190 190 180 170 160ATSI 0 0 0 0 0 0 0 0 0 0 0 0 0 0 0 0COMED 0 0 0 0 0 0 0 0 0 0 0 0 0 0 0 0DAYTON 0 0 0 0 0 0 0 0 0 0 0 0 0 0 0 0DEOK 0 0 0 0 0 0 0 0 0 0 0 0 0 0 0 0DLCO 0 0 0 0 0 0 0 0 0 0 0 0 0 0 0 0EKPC 0 0 0 0 0 0 0 0 0 0 0 0 0 0 0 0
DOM 130 250 340 430 500 460 420 380 340 300 260 220 180 140 100 60
PJM RTO 190 340 460 620 730 710 660 610 560 510 460 410 370 320 270 220
73
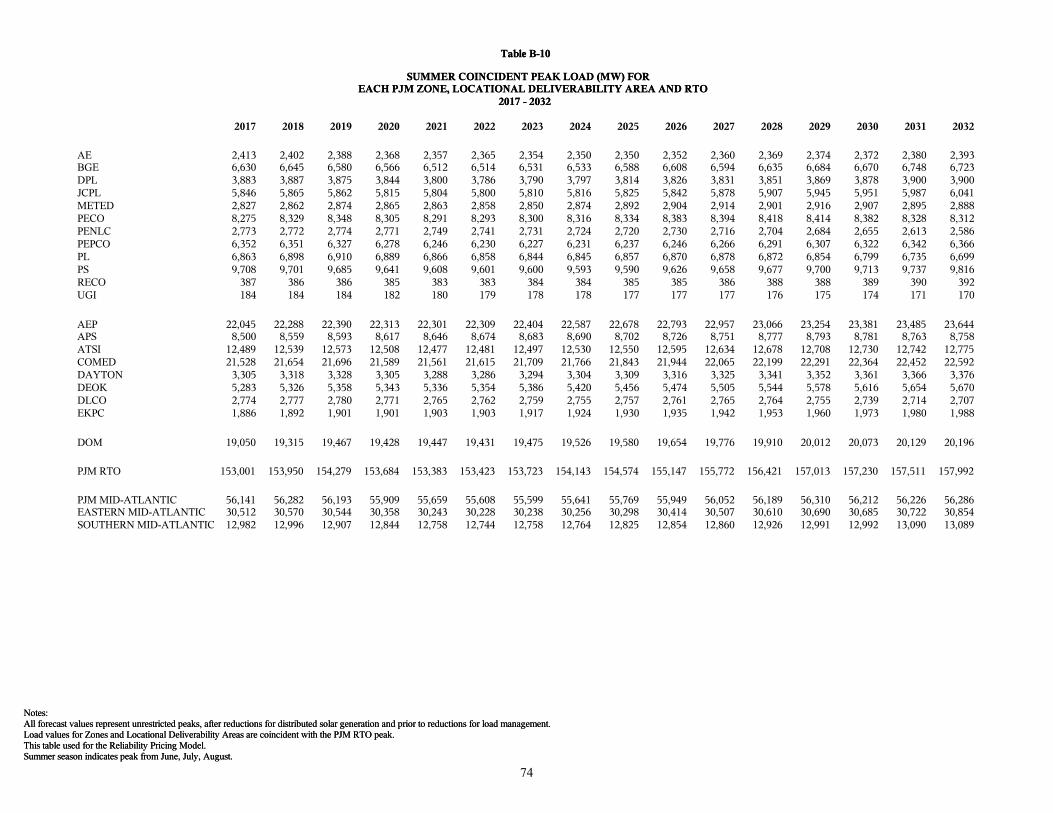
Summer season indicates peak from June, July, August.This table used for the Reliability Pricing Model.Load values for Zones and Locational Deliverability Areas are coincident with the PJM RTO peak.All forecast values represent unrestricted peaks, after reductions for distributed solar generation and prior to reductions for load management.Notes:
Table B-10
SUMMER COINCIDENT PEAK LOAD (MW) FOREACH PJM ZONE, LOCATIONAL DELIVERABILITY AREA AND RTO
2017 - 2032
2017 2018 2019 2020 2021 2022 2023 2024 2025 2026 2027 2028 2029 2030 2031 2032
AE 2,413 2,402 2,388 2,368 2,357 2,365 2,354 2,350 2,350 2,352 2,360 2,369 2,374 2,372 2,380 2,393BGE 6,630 6,645 6,580 6,566 6,512 6,514 6,531 6,533 6,588 6,608 6,594 6,635 6,684 6,670 6,748 6,723DPL 3,883 3,887 3,875 3,844 3,800 3,786 3,790 3,797 3,814 3,826 3,831 3,851 3,869 3,878 3,900 3,900JCPL 5,846 5,865 5,862 5,815 5,804 5,800 5,810 5,816 5,825 5,842 5,878 5,907 5,945 5,951 5,987 6,041METED 2,827 2,862 2,874 2,865 2,863 2,858 2,850 2,874 2,892 2,904 2,914 2,901 2,916 2,907 2,895 2,888PECO 8,275 8,329 8,348 8,305 8,291 8,293 8,300 8,316 8,334 8,383 8,394 8,418 8,414 8,382 8,328 8,312PENLC 2,773 2,772 2,774 2,771 2,749 2,741 2,731 2,724 2,720 2,730 2,716 2,704 2,684 2,655 2,613 2,586PEPCO 6,352 6,351 6,327 6,278 6,246 6,230 6,227 6,231 6,237 6,246 6,266 6,291 6,307 6,322 6,342 6,366PL 6,863 6,898 6,910 6,889 6,866 6,858 6,844 6,845 6,857 6,870 6,878 6,872 6,854 6,799 6,735 6,699PS 9,708 9,701 9,685 9,641 9,608 9,601 9,600 9,593 9,590 9,626 9,658 9,677 9,700 9,713 9,737 9,816RECO 387 386 386 385 383 383 384 384 385 385 386 388 388 389 390 392UGI 184 184 184 182 180 179 178 178 177 177 177 176 175 174 171 170
AEP 22,045 22,288 22,390 22,313 22,301 22,309 22,404 22,587 22,678 22,793 22,957 23,066 23,254 23,381 23,485 23,644APS 8,500 8,559 8,593 8,617 8,646 8,674 8,683 8,690 8,702 8,726 8,751 8,777 8,793 8,781 8,763 8,758ATSI 12,489 12,539 12,573 12,508 12,477 12,481 12,497 12,530 12,550 12,595 12,634 12,678 12,708 12,730 12,742 12,775COMED 21,528 21,654 21,696 21,589 21,561 21,615 21,709 21,766 21,843 21,944 22,065 22,199 22,291 22,364 22,452 22,592DAYTON 3,305 3,318 3,328 3,305 3,288 3,286 3,294 3,304 3,309 3,316 3,325 3,341 3,352 3,361 3,366 3,376DEOK 5,283 5,326 5,358 5,343 5,336 5,354 5,386 5,420 5,456 5,474 5,505 5,544 5,578 5,616 5,654 5,670DLCO 2,774 2,777 2,780 2,771 2,765 2,762 2,759 2,755 2,757 2,761 2,765 2,764 2,755 2,739 2,714 2,707EKPC 1,886 1,892 1,901 1,901 1,903 1,903 1,917 1,924 1,930 1,935 1,942 1,953 1,960 1,973 1,980 1,988
DOM 19,050 19,315 19,467 19,428 19,447 19,431 19,475 19,526 19,580 19,654 19,776 19,910 20,012 20,073 20,129 20,196
PJM RTO 153,001 153,950 154,279 153,684 153,383 153,423 153,723 154,143 154,574 155,147 155,772 156,421 157,013 157,230 157,511 157,992
PJM MID-ATLANTIC 56,141 56,282 56,193 55,909 55,659 55,608 55,599 55,641 55,769 55,949 56,052 56,189 56,310 56,212 56,226 56,286EASTERN MID-ATLANTIC 30,512 30,570 30,544 30,358 30,243 30,228 30,238 30,256 30,298 30,414 30,507 30,610 30,690 30,685 30,722 30,854SOUTHERN MID-ATLANTIC 12,982 12,996 12,907 12,844 12,758 12,744 12,758 12,764 12,825 12,854 12,860 12,926 12,991 12,992 13,090 13,089
74
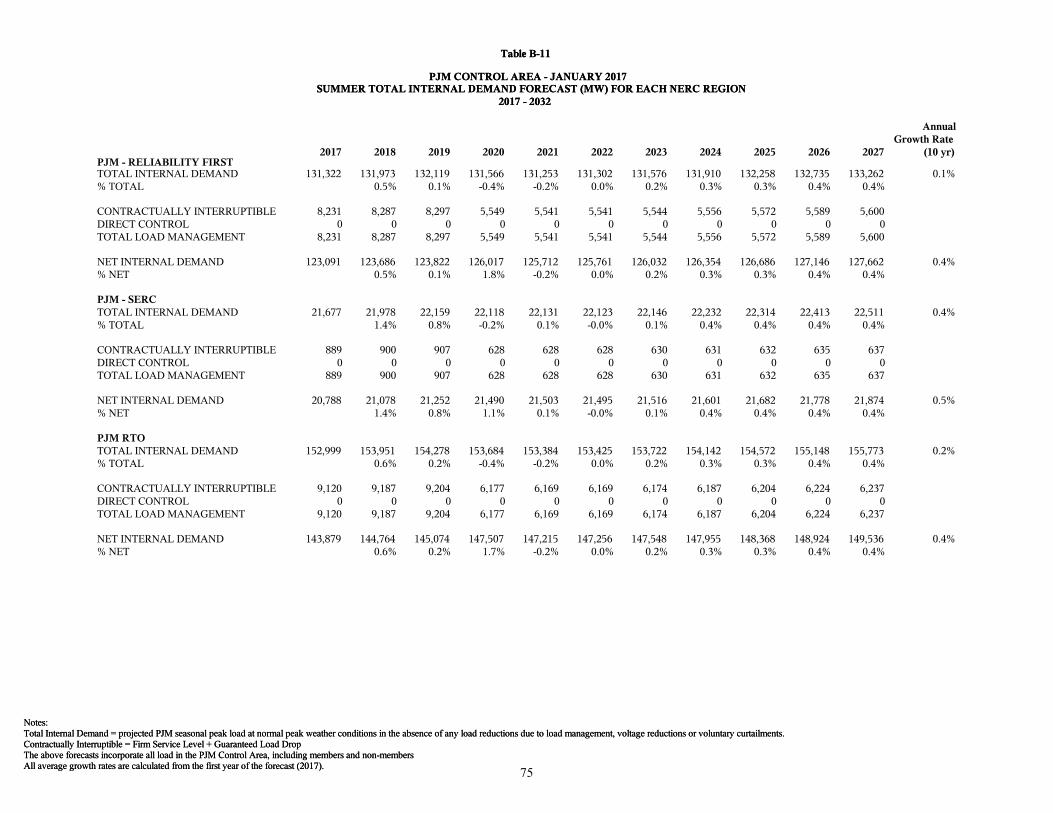
All average growth rates are calculated from the first year of the forecast (2017).The above forecasts incorporate all load in the PJM Control Area, including members and non-membersContractually Interruptible = Firm Service Level + Guaranteed Load DropTotal Internal Demand = projected PJM seasonal peak load at normal peak weather conditions in the absence of any load reductions due to load management, voltage reductions or voluntary curtailments.Notes:
Table B-11
PJM CONTROL AREA - JANUARY 2017SUMMER TOTAL INTERNAL DEMAND FORECAST (MW) FOR EACH NERC REGION
2017 - 2032
2017 2018 2019 2020 2021 2022 2023 2024 2025 2026 2027
AnnualGrowth Rate
(10 yr)PJM - RELIABILITY FIRSTTOTAL INTERNAL DEMAND 131,322 131,973 132,119 131,566 131,253 131,302 131,576 131,910 132,258 132,735 133,262 0.1%% TOTAL 0.5% 0.1% -0.4% -0.2% 0.0% 0.2% 0.3% 0.3% 0.4% 0.4%
CONTRACTUALLY INTERRUPTIBLE 8,231 8,287 8,297 5,549 5,541 5,541 5,544 5,556 5,572 5,589 5,600DIRECT CONTROL 0 0 0 0 0 0 0 0 0 0 0TOTAL LOAD MANAGEMENT 8,231 8,287 8,297 5,549 5,541 5,541 5,544 5,556 5,572 5,589 5,600
NET INTERNAL DEMAND 123,091 123,686 123,822 126,017 125,712 125,761 126,032 126,354 126,686 127,146 127,662 0.4%% NET 0.5% 0.1% 1.8% -0.2% 0.0% 0.2% 0.3% 0.3% 0.4% 0.4%
PJM - SERCTOTAL INTERNAL DEMAND 21,677 21,978 22,159 22,118 22,131 22,123 22,146 22,232 22,314 22,413 22,511 0.4%% TOTAL 1.4% 0.8% -0.2% 0.1% -0.0% 0.1% 0.4% 0.4% 0.4% 0.4%
CONTRACTUALLY INTERRUPTIBLE 889 900 907 628 628 628 630 631 632 635 637DIRECT CONTROL 0 0 0 0 0 0 0 0 0 0 0TOTAL LOAD MANAGEMENT 889 900 907 628 628 628 630 631 632 635 637
NET INTERNAL DEMAND 20,788 21,078 21,252 21,490 21,503 21,495 21,516 21,601 21,682 21,778 21,874 0.5%% NET 1.4% 0.8% 1.1% 0.1% -0.0% 0.1% 0.4% 0.4% 0.4% 0.4%
PJM RTOTOTAL INTERNAL DEMAND 152,999 153,951 154,278 153,684 153,384 153,425 153,722 154,142 154,572 155,148 155,773 0.2%% TOTAL 0.6% 0.2% -0.4% -0.2% 0.0% 0.2% 0.3% 0.3% 0.4% 0.4%
CONTRACTUALLY INTERRUPTIBLE 9,120 9,187 9,204 6,177 6,169 6,169 6,174 6,187 6,204 6,224 6,237DIRECT CONTROL 0 0 0 0 0 0 0 0 0 0 0TOTAL LOAD MANAGEMENT 9,120 9,187 9,204 6,177 6,169 6,169 6,174 6,187 6,204 6,224 6,237
NET INTERNAL DEMAND 143,879 144,764 145,074 147,507 147,215 147,256 147,548 147,955 148,368 148,924 149,536 0.4%% NET 0.6% 0.2% 1.7% -0.2% 0.0% 0.2% 0.3% 0.3% 0.4% 0.4%
75
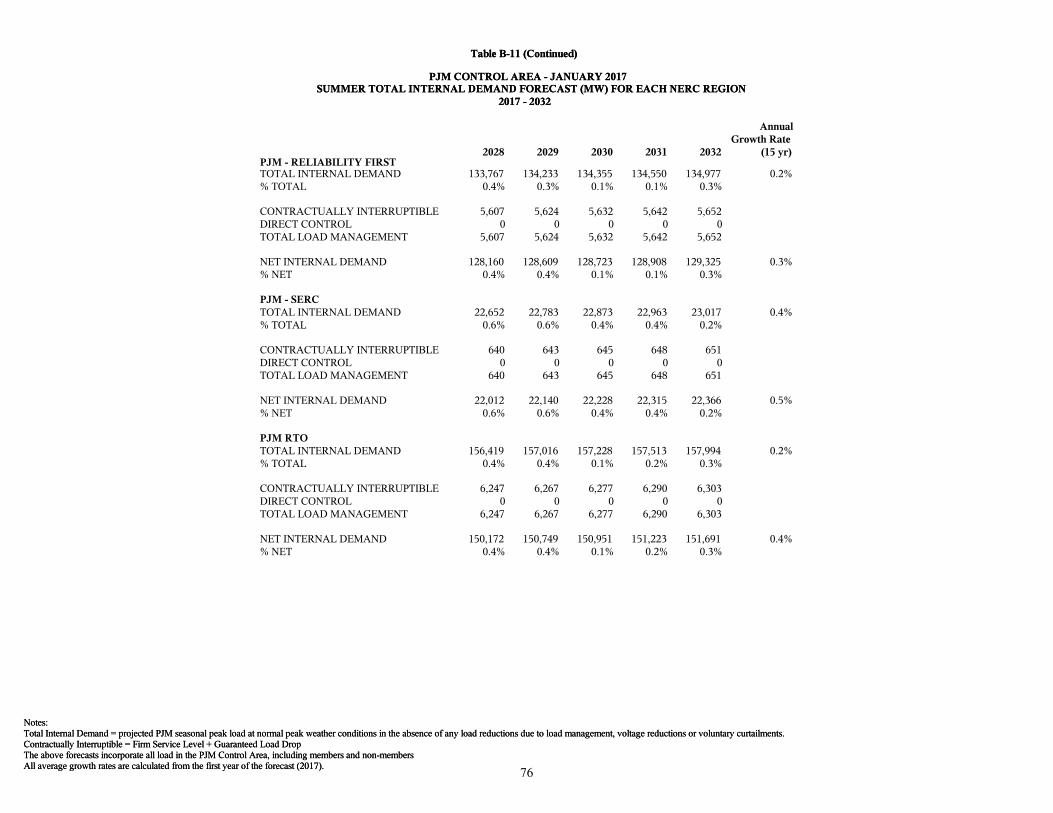
All average growth rates are calculated from the first year of the forecast (2017).The above forecasts incorporate all load in the PJM Control Area, including members and non-membersContractually Interruptible = Firm Service Level + Guaranteed Load DropTotal Internal Demand = projected PJM seasonal peak load at normal peak weather conditions in the absence of any load reductions due to load management, voltage reductions or voluntary curtailments.Notes:
Table B-11 (Continued)
PJM CONTROL AREA - JANUARY 2017SUMMER TOTAL INTERNAL DEMAND FORECAST (MW) FOR EACH NERC REGION
2017 - 2032
2028 2029 2030 2031 2032
AnnualGrowth Rate
(15 yr)PJM - RELIABILITY FIRSTTOTAL INTERNAL DEMAND 133,767 134,233 134,355 134,550 134,977 0.2%% TOTAL 0.4% 0.3% 0.1% 0.1% 0.3%
CONTRACTUALLY INTERRUPTIBLE 5,607 5,624 5,632 5,642 5,652DIRECT CONTROL 0 0 0 0 0TOTAL LOAD MANAGEMENT 5,607 5,624 5,632 5,642 5,652
NET INTERNAL DEMAND 128,160 128,609 128,723 128,908 129,325 0.3%% NET 0.4% 0.4% 0.1% 0.1% 0.3%
PJM - SERCTOTAL INTERNAL DEMAND 22,652 22,783 22,873 22,963 23,017 0.4%% TOTAL 0.6% 0.6% 0.4% 0.4% 0.2%
CONTRACTUALLY INTERRUPTIBLE 640 643 645 648 651DIRECT CONTROL 0 0 0 0 0TOTAL LOAD MANAGEMENT 640 643 645 648 651
NET INTERNAL DEMAND 22,012 22,140 22,228 22,315 22,366 0.5%% NET 0.6% 0.6% 0.4% 0.4% 0.2%
PJM RTOTOTAL INTERNAL DEMAND 156,419 157,016 157,228 157,513 157,994 0.2%% TOTAL 0.4% 0.4% 0.1% 0.2% 0.3%
CONTRACTUALLY INTERRUPTIBLE 6,247 6,267 6,277 6,290 6,303DIRECT CONTROL 0 0 0 0 0TOTAL LOAD MANAGEMENT 6,247 6,267 6,277 6,290 6,303
NET INTERNAL DEMAND 150,172 150,749 150,951 151,223 151,691 0.4%% NET 0.4% 0.4% 0.1% 0.2% 0.3%
76
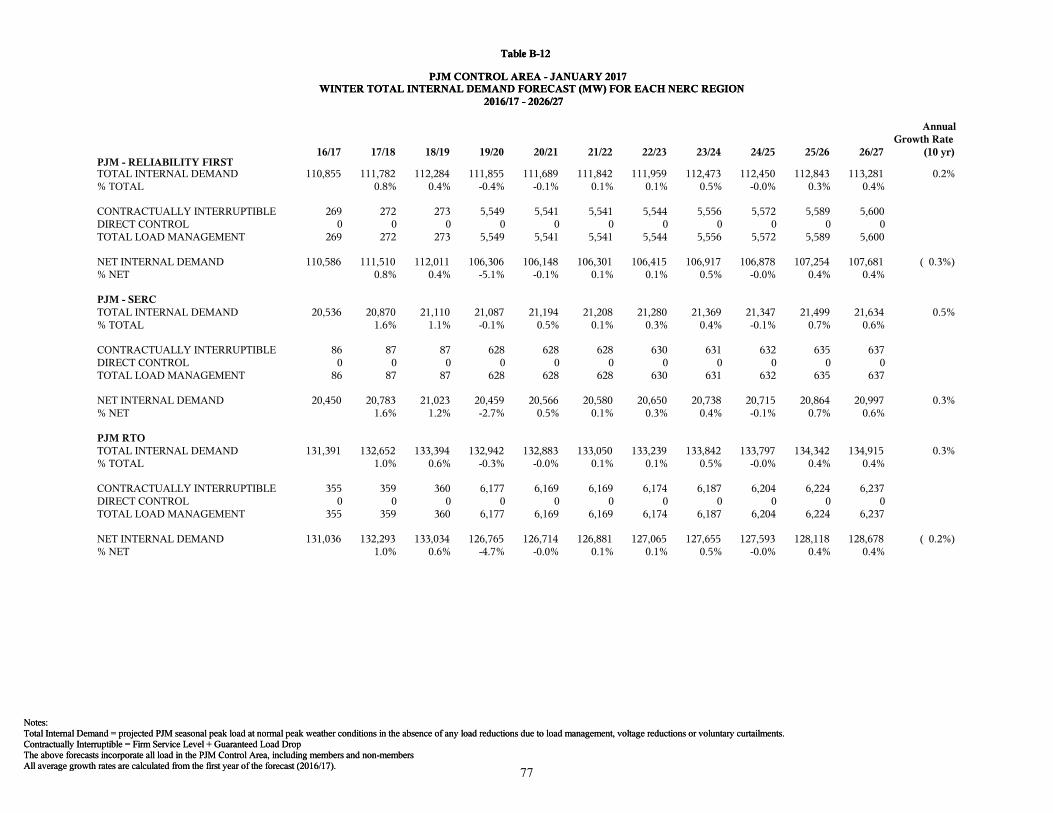
All average growth rates are calculated from the first year of the forecast (2016/17).The above forecasts incorporate all load in the PJM Control Area, including members and non-membersContractually Interruptible = Firm Service Level + Guaranteed Load DropTotal Internal Demand = projected PJM seasonal peak load at normal peak weather conditions in the absence of any load reductions due to load management, voltage reductions or voluntary curtailments.Notes:
Table B-12
PJM CONTROL AREA - JANUARY 2017WINTER TOTAL INTERNAL DEMAND FORECAST (MW) FOR EACH NERC REGION
2016/17 - 2026/27
16/17 17/18 18/19 19/20 20/21 21/22 22/23 23/24 24/25 25/26 26/27
AnnualGrowth Rate
(10 yr)PJM - RELIABILITY FIRSTTOTAL INTERNAL DEMAND 110,855 111,782 112,284 111,855 111,689 111,842 111,959 112,473 112,450 112,843 113,281 0.2%% TOTAL 0.8% 0.4% -0.4% -0.1% 0.1% 0.1% 0.5% -0.0% 0.3% 0.4%
CONTRACTUALLY INTERRUPTIBLE 269 272 273 5,549 5,541 5,541 5,544 5,556 5,572 5,589 5,600DIRECT CONTROL 0 0 0 0 0 0 0 0 0 0 0TOTAL LOAD MANAGEMENT 269 272 273 5,549 5,541 5,541 5,544 5,556 5,572 5,589 5,600
NET INTERNAL DEMAND 110,586 111,510 112,011 106,306 106,148 106,301 106,415 106,917 106,878 107,254 107,681 ( 0.3%)% NET 0.8% 0.4% -5.1% -0.1% 0.1% 0.1% 0.5% -0.0% 0.4% 0.4%
PJM - SERCTOTAL INTERNAL DEMAND 20,536 20,870 21,110 21,087 21,194 21,208 21,280 21,369 21,347 21,499 21,634 0.5%% TOTAL 1.6% 1.1% -0.1% 0.5% 0.1% 0.3% 0.4% -0.1% 0.7% 0.6%
CONTRACTUALLY INTERRUPTIBLE 86 87 87 628 628 628 630 631 632 635 637DIRECT CONTROL 0 0 0 0 0 0 0 0 0 0 0TOTAL LOAD MANAGEMENT 86 87 87 628 628 628 630 631 632 635 637
NET INTERNAL DEMAND 20,450 20,783 21,023 20,459 20,566 20,580 20,650 20,738 20,715 20,864 20,997 0.3%% NET 1.6% 1.2% -2.7% 0.5% 0.1% 0.3% 0.4% -0.1% 0.7% 0.6%
PJM RTOTOTAL INTERNAL DEMAND 131,391 132,652 133,394 132,942 132,883 133,050 133,239 133,842 133,797 134,342 134,915 0.3%% TOTAL 1.0% 0.6% -0.3% -0.0% 0.1% 0.1% 0.5% -0.0% 0.4% 0.4%
CONTRACTUALLY INTERRUPTIBLE 355 359 360 6,177 6,169 6,169 6,174 6,187 6,204 6,224 6,237DIRECT CONTROL 0 0 0 0 0 0 0 0 0 0 0TOTAL LOAD MANAGEMENT 355 359 360 6,177 6,169 6,169 6,174 6,187 6,204 6,224 6,237
NET INTERNAL DEMAND 131,036 132,293 133,034 126,765 126,714 126,881 127,065 127,655 127,593 128,118 128,678 ( 0.2%)% NET 1.0% 0.6% -4.7% -0.0% 0.1% 0.1% 0.5% -0.0% 0.4% 0.4%
77
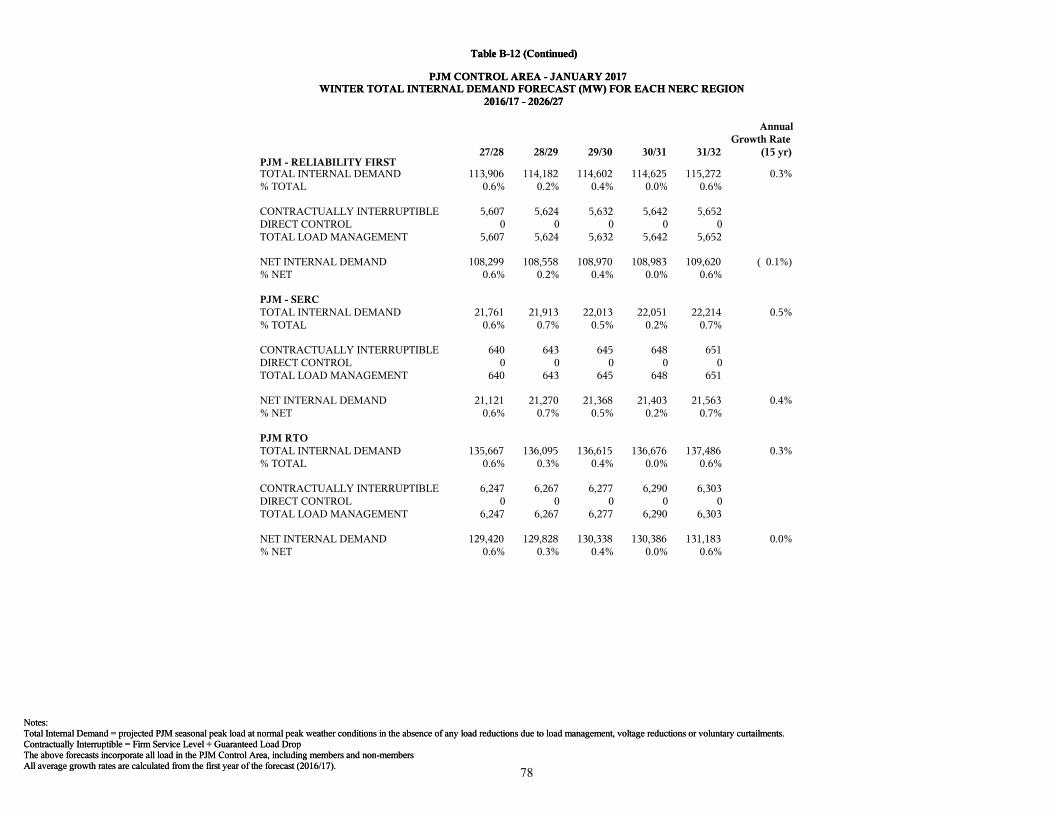
All average growth rates are calculated from the first year of the forecast (2016/17).The above forecasts incorporate all load in the PJM Control Area, including members and non-membersContractually Interruptible = Firm Service Level + Guaranteed Load DropTotal Internal Demand = projected PJM seasonal peak load at normal peak weather conditions in the absence of any load reductions due to load management, voltage reductions or voluntary curtailments.Notes:
Table B-12 (Continued)
PJM CONTROL AREA - JANUARY 2017WINTER TOTAL INTERNAL DEMAND FORECAST (MW) FOR EACH NERC REGION
2016/17 - 2026/27
27/28 28/29 29/30 30/31 31/32
AnnualGrowth Rate
(15 yr)PJM - RELIABILITY FIRSTTOTAL INTERNAL DEMAND 113,906 114,182 114,602 114,625 115,272 0.3%% TOTAL 0.6% 0.2% 0.4% 0.0% 0.6%
CONTRACTUALLY INTERRUPTIBLE 5,607 5,624 5,632 5,642 5,652DIRECT CONTROL 0 0 0 0 0TOTAL LOAD MANAGEMENT 5,607 5,624 5,632 5,642 5,652
NET INTERNAL DEMAND 108,299 108,558 108,970 108,983 109,620 ( 0.1%)% NET 0.6% 0.2% 0.4% 0.0% 0.6%
PJM - SERCTOTAL INTERNAL DEMAND 21,761 21,913 22,013 22,051 22,214 0.5%% TOTAL 0.6% 0.7% 0.5% 0.2% 0.7%
CONTRACTUALLY INTERRUPTIBLE 640 643 645 648 651DIRECT CONTROL 0 0 0 0 0TOTAL LOAD MANAGEMENT 640 643 645 648 651
NET INTERNAL DEMAND 21,121 21,270 21,368 21,403 21,563 0.4%% NET 0.6% 0.7% 0.5% 0.2% 0.7%
PJM RTOTOTAL INTERNAL DEMAND 135,667 136,095 136,615 136,676 137,486 0.3%% TOTAL 0.6% 0.3% 0.4% 0.0% 0.6%
CONTRACTUALLY INTERRUPTIBLE 6,247 6,267 6,277 6,290 6,303DIRECT CONTROL 0 0 0 0 0TOTAL LOAD MANAGEMENT 6,247 6,267 6,277 6,290 6,303
NET INTERNAL DEMAND 129,420 129,828 130,338 130,386 131,183 0.0%% NET 0.6% 0.3% 0.4% 0.0% 0.6%
78

Winter season indicates peak from December, January, February.Fall season indicates peak from September, October, November.Summer season indicates peak from June, July, August.Spring season indicates peak from March, April, May.All forecast values represent unrestricted peaks, after reductions for distributed solar generation and prior to reductions for load management.Notes:
Table C-1
PJM LOCATIONAL DELIVERABILITY AREASCENTRAL MID-ATLANTIC: BGE, METED, PEPCO, PL and UGI
SEASONAL PEAKS - MW
BASE (50/50) FORECAST
YEAR SPRING SUMMER FALL WINTER2017 18,933 23,446 19,966 21,1322018 19,007 23,520 20,045 21,2362019 18,981 23,499 20,106 21,2842020 18,776 23,386 20,068 21,1912021 18,724 23,284 19,986 21,1572022 18,782 23,250 19,954 21,1712023 18,763 23,220 19,909 21,1772024 18,762 23,273 20,009 21,2142025 18,760 23,346 20,110 21,2082026 18,757 23,406 20,185 21,2392027 18,768 23,462 20,217 21,2852028 18,901 23,495 20,174 21,3782029 18,894 23,533 20,230 21,4372030 18,808 23,517 20,325 21,4592031 18,735 23,481 20,418 21,4562032 18,644 23,484 20,450 21,516
EXTREME WEATHER (90/10) FORECAST
YEAR SPRING SUMMER FALL WINTER2017 20,431 24,885 21,604 21,9662018 20,499 24,761 21,641 22,0732019 20,489 24,749 21,638 22,1112020 20,136 24,672 21,544 22,0272021 20,174 24,540 21,513 22,0022022 20,272 24,688 21,478 21,9922023 20,265 24,681 21,538 22,0112024 20,300 24,569 21,546 22,0332025 20,153 24,781 21,666 22,0422026 20,189 24,765 21,676 22,0772027 20,373 24,778 21,750 22,1242028 20,514 25,001 21,855 22,1842029 20,554 24,888 21,868 22,2192030 20,525 24,890 21,918 22,2372031 20,297 25,022 21,974 22,2902032 20,498 24,899 22,018 22,347
79
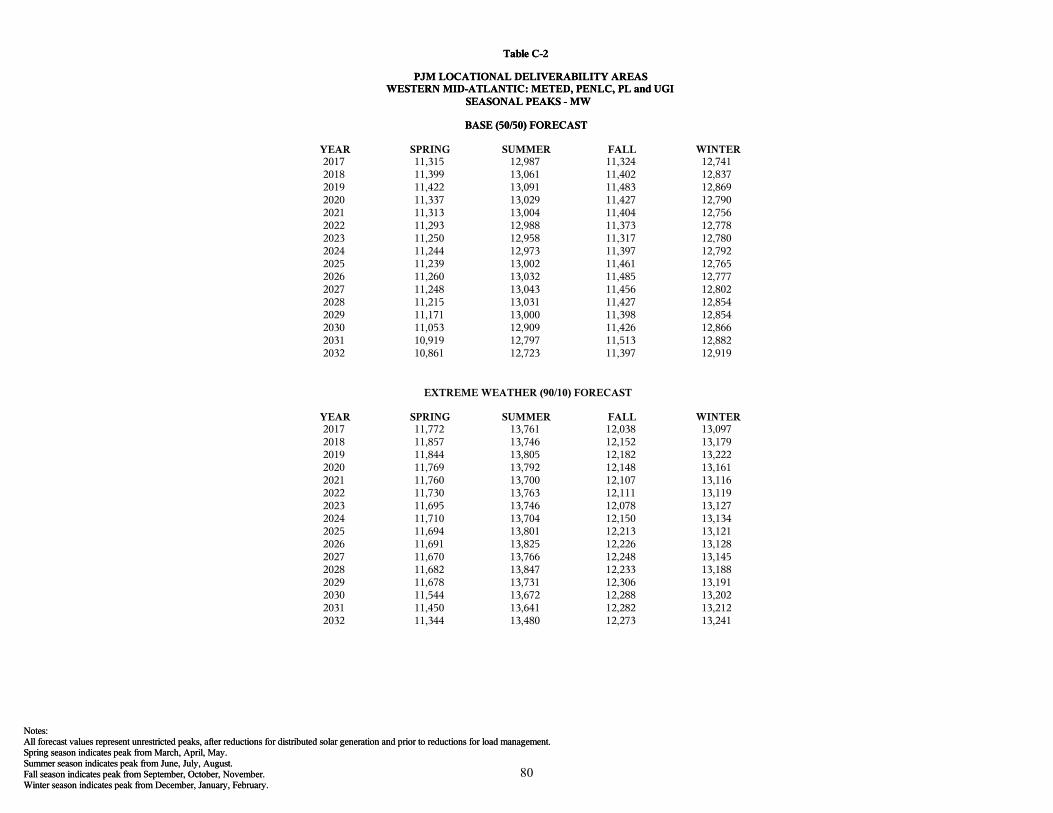
Winter season indicates peak from December, January, February.Fall season indicates peak from September, October, November.Summer season indicates peak from June, July, August.Spring season indicates peak from March, April, May.All forecast values represent unrestricted peaks, after reductions for distributed solar generation and prior to reductions for load management.Notes:
Table C-2
PJM LOCATIONAL DELIVERABILITY AREASWESTERN MID-ATLANTIC: METED, PENLC, PL and UGI
SEASONAL PEAKS - MW
BASE (50/50) FORECAST
YEAR SPRING SUMMER FALL WINTER2017 11,315 12,987 11,324 12,7412018 11,399 13,061 11,402 12,8372019 11,422 13,091 11,483 12,8692020 11,337 13,029 11,427 12,7902021 11,313 13,004 11,404 12,7562022 11,293 12,988 11,373 12,7782023 11,250 12,958 11,317 12,7802024 11,244 12,973 11,397 12,7922025 11,239 13,002 11,461 12,7652026 11,260 13,032 11,485 12,7772027 11,248 13,043 11,456 12,8022028 11,215 13,031 11,427 12,8542029 11,171 13,000 11,398 12,8542030 11,053 12,909 11,426 12,8662031 10,919 12,797 11,513 12,8822032 10,861 12,723 11,397 12,919
EXTREME WEATHER (90/10) FORECAST
YEAR SPRING SUMMER FALL WINTER2017 11,772 13,761 12,038 13,0972018 11,857 13,746 12,152 13,1792019 11,844 13,805 12,182 13,2222020 11,769 13,792 12,148 13,1612021 11,760 13,700 12,107 13,1162022 11,730 13,763 12,111 13,1192023 11,695 13,746 12,078 13,1272024 11,710 13,704 12,150 13,1342025 11,694 13,801 12,213 13,1212026 11,691 13,825 12,226 13,1282027 11,670 13,766 12,248 13,1452028 11,682 13,847 12,233 13,1882029 11,678 13,731 12,306 13,1912030 11,544 13,672 12,288 13,2022031 11,450 13,641 12,282 13,2122032 11,344 13,480 12,273 13,241
80
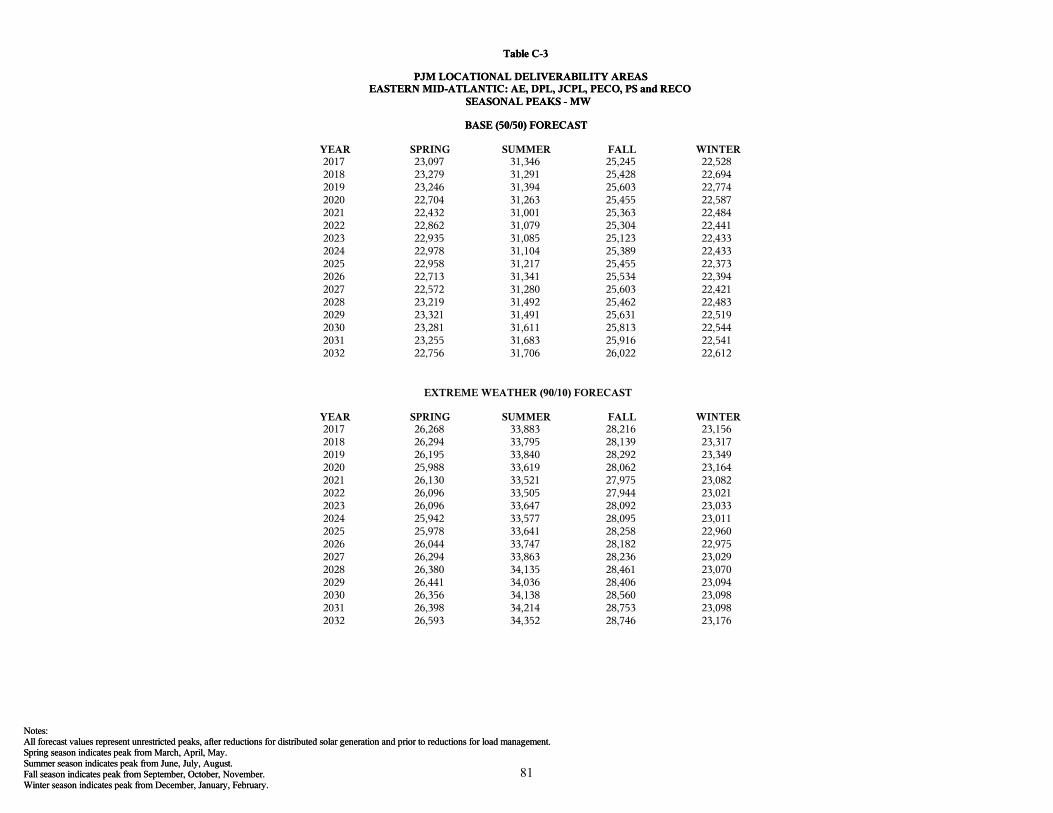
Winter season indicates peak from December, January, February.Fall season indicates peak from September, October, November.Summer season indicates peak from June, July, August.Spring season indicates peak from March, April, May.All forecast values represent unrestricted peaks, after reductions for distributed solar generation and prior to reductions for load management.Notes:
Table C-3
PJM LOCATIONAL DELIVERABILITY AREASEASTERN MID-ATLANTIC: AE, DPL, JCPL, PECO, PS and RECO
SEASONAL PEAKS - MW
BASE (50/50) FORECAST
YEAR SPRING SUMMER FALL WINTER2017 23,097 31,346 25,245 22,5282018 23,279 31,291 25,428 22,6942019 23,246 31,394 25,603 22,7742020 22,704 31,263 25,455 22,5872021 22,432 31,001 25,363 22,4842022 22,862 31,079 25,304 22,4412023 22,935 31,085 25,123 22,4332024 22,978 31,104 25,389 22,4332025 22,958 31,217 25,455 22,3732026 22,713 31,341 25,534 22,3942027 22,572 31,280 25,603 22,4212028 23,219 31,492 25,462 22,4832029 23,321 31,491 25,631 22,5192030 23,281 31,611 25,813 22,5442031 23,255 31,683 25,916 22,5412032 22,756 31,706 26,022 22,612
EXTREME WEATHER (90/10) FORECAST
YEAR SPRING SUMMER FALL WINTER2017 26,268 33,883 28,216 23,1562018 26,294 33,795 28,139 23,3172019 26,195 33,840 28,292 23,3492020 25,988 33,619 28,062 23,1642021 26,130 33,521 27,975 23,0822022 26,096 33,505 27,944 23,0212023 26,096 33,647 28,092 23,0332024 25,942 33,577 28,095 23,0112025 25,978 33,641 28,258 22,9602026 26,044 33,747 28,182 22,9752027 26,294 33,863 28,236 23,0292028 26,380 34,135 28,461 23,0702029 26,441 34,036 28,406 23,0942030 26,356 34,138 28,560 23,0982031 26,398 34,214 28,753 23,0982032 26,593 34,352 28,746 23,176
81

Winter season indicates peak from December, January, February.Fall season indicates peak from September, October, November.Summer season indicates peak from June, July, August.Spring season indicates peak from March, April, May.All forecast values represent unrestricted peaks, after reductions for distributed solar generation and prior to reductions for load management.Notes:
Table C-4
PJM LOCATIONAL DELIVERABILITY AREASSOUTHERN MID-ATLANTIC: BGE and PEPCO
SEASONAL PEAKS - MW
BASE (50/50) FORECAST
YEAR SPRING SUMMER FALL WINTER2017 10,441 13,370 11,351 11,2352018 10,498 13,389 11,361 11,2252019 10,457 13,334 11,362 11,2382020 10,240 13,274 11,349 11,2342021 10,177 13,207 11,290 11,2472022 10,245 13,160 11,254 11,2632023 10,268 13,150 11,238 11,2582024 10,333 13,181 11,297 11,2382025 10,298 13,256 11,373 11,2672026 10,254 13,292 11,401 11,3062027 10,265 13,318 11,408 11,3382028 10,418 13,335 11,385 11,3822029 10,489 13,388 11,429 11,3792030 10,516 13,429 11,508 11,3982031 10,519 13,529 11,608 11,4292032 10,450 13,567 11,617 11,473
EXTREME WEATHER (90/10) FORECAST
YEAR SPRING SUMMER FALL WINTER2017 11,453 14,214 12,226 11,7292018 11,445 14,138 12,254 11,7592019 11,402 14,133 12,176 11,7682020 11,308 14,026 12,120 11,7532021 11,280 13,935 12,102 11,7332022 11,271 14,002 12,074 11,7352023 11,271 14,000 12,112 11,7392024 11,283 13,996 12,103 11,7542025 11,295 14,028 12,158 11,7692026 11,327 14,059 12,164 11,7922027 11,377 14,074 12,210 11,8192028 11,425 14,203 12,276 11,8542029 11,467 14,180 12,338 11,8732030 11,498 14,273 12,333 11,8832031 11,530 14,333 12,386 11,9232032 11,592 14,356 12,426 11,951
82
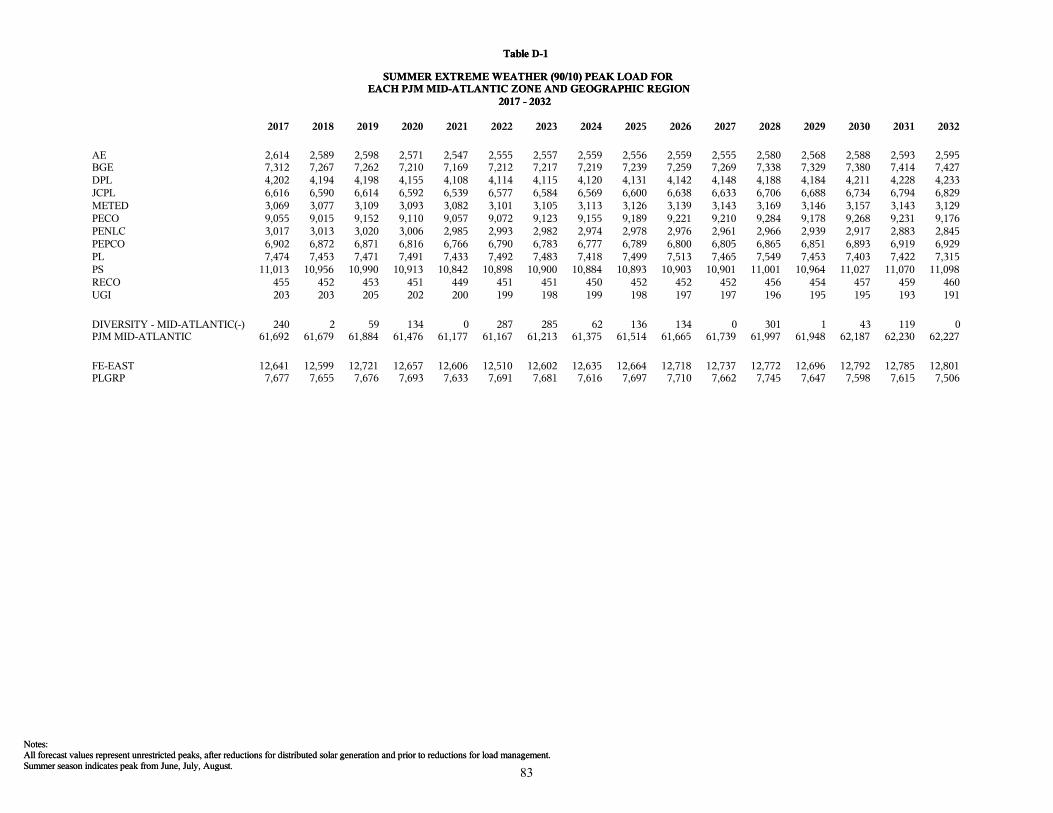
Summer season indicates peak from June, July, August.All forecast values represent unrestricted peaks, after reductions for distributed solar generation and prior to reductions for load management.Notes:
Table D-1
SUMMER EXTREME WEATHER (90/10) PEAK LOAD FOREACH PJM MID-ATLANTIC ZONE AND GEOGRAPHIC REGION
2017 - 2032
2017 2018 2019 2020 2021 2022 2023 2024 2025 2026 2027 2028 2029 2030 2031 2032
AE 2,614 2,589 2,598 2,571 2,547 2,555 2,557 2,559 2,556 2,559 2,555 2,580 2,568 2,588 2,593 2,595BGE 7,312 7,267 7,262 7,210 7,169 7,212 7,217 7,219 7,239 7,259 7,269 7,338 7,329 7,380 7,414 7,427DPL 4,202 4,194 4,198 4,155 4,108 4,114 4,115 4,120 4,131 4,142 4,148 4,188 4,184 4,211 4,228 4,233JCPL 6,616 6,590 6,614 6,592 6,539 6,577 6,584 6,569 6,600 6,638 6,633 6,706 6,688 6,734 6,794 6,829METED 3,069 3,077 3,109 3,093 3,082 3,101 3,105 3,113 3,126 3,139 3,143 3,169 3,146 3,157 3,143 3,129PECO 9,055 9,015 9,152 9,110 9,057 9,072 9,123 9,155 9,189 9,221 9,210 9,284 9,178 9,268 9,231 9,176PENLC 3,017 3,013 3,020 3,006 2,985 2,993 2,982 2,974 2,978 2,976 2,961 2,966 2,939 2,917 2,883 2,845PEPCO 6,902 6,872 6,871 6,816 6,766 6,790 6,783 6,777 6,789 6,800 6,805 6,865 6,851 6,893 6,919 6,929PL 7,474 7,453 7,471 7,491 7,433 7,492 7,483 7,418 7,499 7,513 7,465 7,549 7,453 7,403 7,422 7,315PS 11,013 10,956 10,990 10,913 10,842 10,898 10,900 10,884 10,893 10,903 10,901 11,001 10,964 11,027 11,070 11,098RECO 455 452 453 451 449 451 451 450 452 452 452 456 454 457 459 460UGI 203 203 205 202 200 199 198 199 198 197 197 196 195 195 193 191
DIVERSITY - MID-ATLANTIC(-) 240 2 59 134 0 287 285 62 136 134 0 301 1 43 119 0PJM MID-ATLANTIC 61,692 61,679 61,884 61,476 61,177 61,167 61,213 61,375 61,514 61,665 61,739 61,997 61,948 62,187 62,230 62,227
FE-EAST 12,641 12,599 12,721 12,657 12,606 12,510 12,602 12,635 12,664 12,718 12,737 12,772 12,696 12,792 12,785 12,801PLGRP 7,677 7,655 7,676 7,693 7,633 7,691 7,681 7,616 7,697 7,710 7,662 7,745 7,647 7,598 7,615 7,506
83
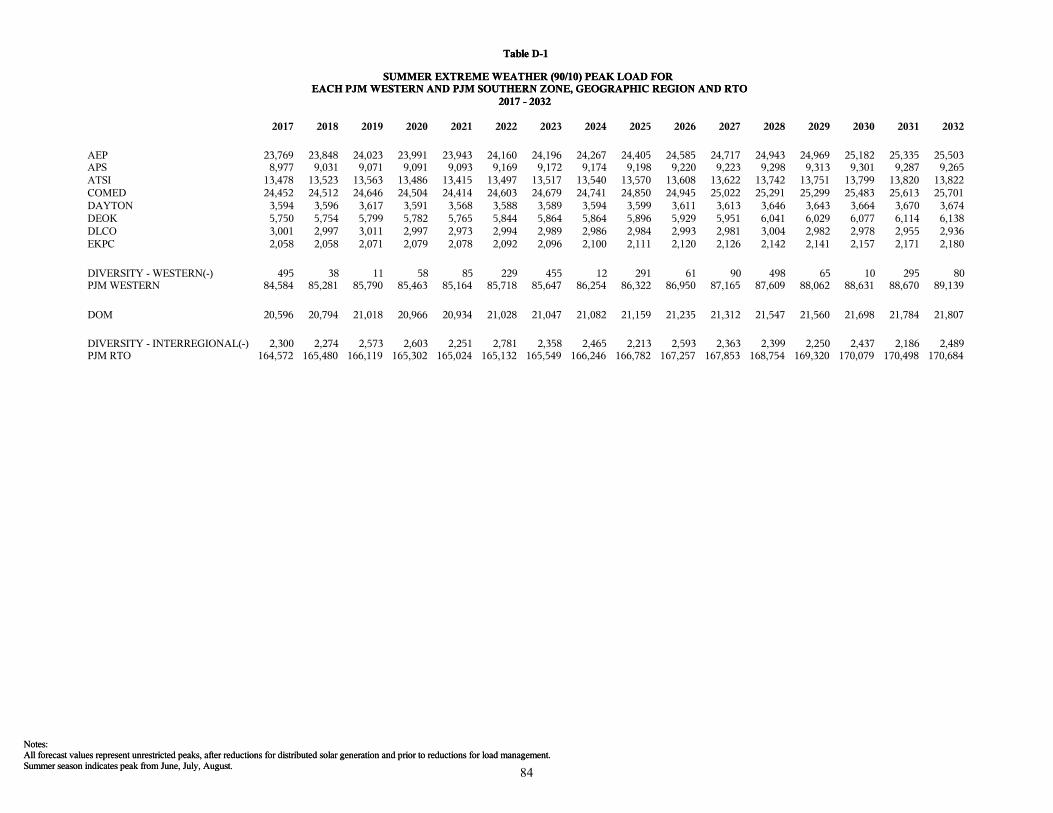
Summer season indicates peak from June, July, August.All forecast values represent unrestricted peaks, after reductions for distributed solar generation and prior to reductions for load management.Notes:
Table D-1
SUMMER EXTREME WEATHER (90/10) PEAK LOAD FOREACH PJM WESTERN AND PJM SOUTHERN ZONE, GEOGRAPHIC REGION AND RTO
2017 - 2032
2017 2018 2019 2020 2021 2022 2023 2024 2025 2026 2027 2028 2029 2030 2031 2032
AEP 23,769 23,848 24,023 23,991 23,943 24,160 24,196 24,267 24,405 24,585 24,717 24,943 24,969 25,182 25,335 25,503APS 8,977 9,031 9,071 9,091 9,093 9,169 9,172 9,174 9,198 9,220 9,223 9,298 9,313 9,301 9,287 9,265ATSI 13,478 13,523 13,563 13,486 13,415 13,497 13,517 13,540 13,570 13,608 13,622 13,742 13,751 13,799 13,820 13,822COMED 24,452 24,512 24,646 24,504 24,414 24,603 24,679 24,741 24,850 24,945 25,022 25,291 25,299 25,483 25,613 25,701DAYTON 3,594 3,596 3,617 3,591 3,568 3,588 3,589 3,594 3,599 3,611 3,613 3,646 3,643 3,664 3,670 3,674DEOK 5,750 5,754 5,799 5,782 5,765 5,844 5,864 5,864 5,896 5,929 5,951 6,041 6,029 6,077 6,114 6,138DLCO 3,001 2,997 3,011 2,997 2,973 2,994 2,989 2,986 2,984 2,993 2,981 3,004 2,982 2,978 2,955 2,936EKPC 2,058 2,058 2,071 2,079 2,078 2,092 2,096 2,100 2,111 2,120 2,126 2,142 2,141 2,157 2,171 2,180
DIVERSITY - WESTERN(-) 495 38 11 58 85 229 455 12 291 61 90 498 65 10 295 80PJM WESTERN 84,584 85,281 85,790 85,463 85,164 85,718 85,647 86,254 86,322 86,950 87,165 87,609 88,062 88,631 88,670 89,139
DOM 20,596 20,794 21,018 20,966 20,934 21,028 21,047 21,082 21,159 21,235 21,312 21,547 21,560 21,698 21,784 21,807
DIVERSITY - INTERREGIONAL(-) 2,300 2,274 2,573 2,603 2,251 2,781 2,358 2,465 2,213 2,593 2,363 2,399 2,250 2,437 2,186 2,489PJM RTO 164,572 165,480 166,119 165,302 165,024 165,132 165,549 166,246 166,782 167,257 167,853 168,754 169,320 170,079 170,498 170,684
84

Winter season indicates peak from December, January, February.All forecast values represent unrestricted peaks, after reductions for distributed solar generation and prior to reductions for load management.Notes:
Table D-2
WINTER EXTREME WEATHER (90/10) PEAK LOAD FOREACH PJM MID-ATLANTIC ZONE AND GEOGRAPHIC REGION
2016/17 - 2031/32
16/17 17/18 18/19 19/20 20/21 21/22 22/23 23/24 24/25 25/26 26/27 27/28 28/29 29/30 30/31 31/32
AE 1,670 1,669 1,663 1,642 1,628 1,620 1,614 1,610 1,601 1,598 1,597 1,598 1,596 1,594 1,588 1,590BGE 6,150 6,160 6,161 6,151 6,140 6,139 6,138 6,146 6,151 6,159 6,170 6,180 6,190 6,192 6,210 6,221DPL 3,608 3,626 3,616 3,609 3,623 3,627 3,629 3,643 3,627 3,658 3,673 3,696 3,699 3,696 3,707 3,741JCPL 3,928 3,965 3,994 3,955 3,918 3,905 3,897 3,895 3,860 3,850 3,858 3,870 3,869 3,903 3,860 3,875METED 2,676 2,696 2,716 2,713 2,698 2,709 2,715 2,709 2,714 2,718 2,725 2,749 2,744 2,766 2,762 2,773PECO 6,844 6,896 6,911 6,870 6,851 6,847 6,851 6,866 6,864 6,873 6,886 6,902 6,918 6,916 6,933 6,954PENLC 2,874 2,865 2,879 2,854 2,847 2,847 2,851 2,855 2,841 2,840 2,840 2,849 2,846 2,856 2,845 2,845PEPCO 5,579 5,599 5,608 5,602 5,593 5,596 5,601 5,608 5,618 5,633 5,650 5,674 5,684 5,691 5,713 5,730PL 7,360 7,416 7,425 7,394 7,374 7,366 7,365 7,375 7,372 7,377 7,386 7,398 7,409 7,396 7,414 7,432PS 6,896 6,940 6,971 6,928 6,891 6,881 6,879 6,877 6,829 6,825 6,831 6,851 6,838 6,876 6,846 6,852RECO 239 239 240 237 237 238 238 238 236 235 236 237 236 239 236 236UGI 201 202 202 200 198 197 196 195 194 194 194 193 192 192 191 191
DIVERSITY - MID-ATLANTIC(-) 188 135 171 241 234 199 211 218 192 211 311 236 260 270 189 198PJM MID-ATLANTIC 47,837 48,138 48,215 47,914 47,764 47,773 47,763 47,799 47,715 47,749 47,735 47,961 47,961 48,047 48,116 48,242
FE-EAST 9,464 9,526 9,569 9,492 9,439 9,431 9,430 9,425 9,407 9,399 9,411 9,441 9,454 9,482 9,467 9,491PLGRP 7,561 7,618 7,627 7,593 7,572 7,563 7,561 7,570 7,566 7,570 7,580 7,591 7,601 7,588 7,605 7,623
85
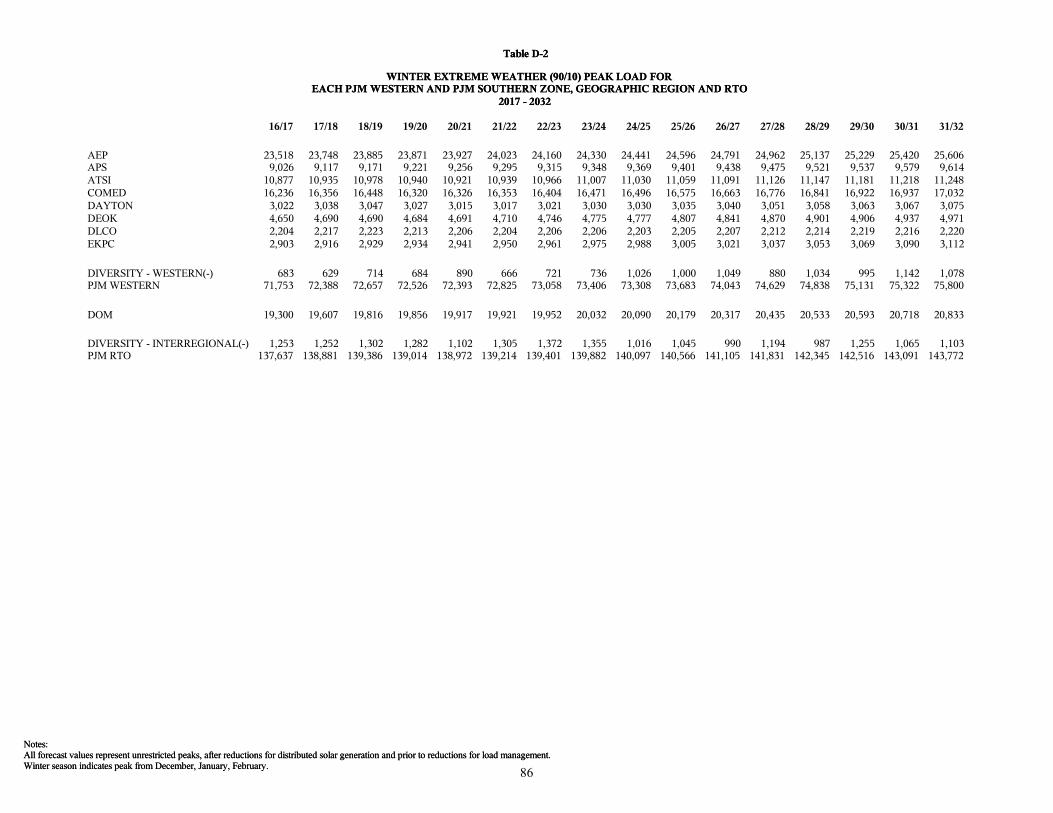
Winter season indicates peak from December, January, February.All forecast values represent unrestricted peaks, after reductions for distributed solar generation and prior to reductions for load management.Notes:
Table D-2
WINTER EXTREME WEATHER (90/10) PEAK LOAD FOREACH PJM WESTERN AND PJM SOUTHERN ZONE, GEOGRAPHIC REGION AND RTO
2017 - 2032
16/17 17/18 18/19 19/20 20/21 21/22 22/23 23/24 24/25 25/26 26/27 27/28 28/29 29/30 30/31 31/32
AEP 23,518 23,748 23,885 23,871 23,927 24,023 24,160 24,330 24,441 24,596 24,791 24,962 25,137 25,229 25,420 25,606APS 9,026 9,117 9,171 9,221 9,256 9,295 9,315 9,348 9,369 9,401 9,438 9,475 9,521 9,537 9,579 9,614ATSI 10,877 10,935 10,978 10,940 10,921 10,939 10,966 11,007 11,030 11,059 11,091 11,126 11,147 11,181 11,218 11,248COMED 16,236 16,356 16,448 16,320 16,326 16,353 16,404 16,471 16,496 16,575 16,663 16,776 16,841 16,922 16,937 17,032DAYTON 3,022 3,038 3,047 3,027 3,015 3,017 3,021 3,030 3,030 3,035 3,040 3,051 3,058 3,063 3,067 3,075DEOK 4,650 4,690 4,690 4,684 4,691 4,710 4,746 4,775 4,777 4,807 4,841 4,870 4,901 4,906 4,937 4,971DLCO 2,204 2,217 2,223 2,213 2,206 2,204 2,206 2,206 2,203 2,205 2,207 2,212 2,214 2,219 2,216 2,220EKPC 2,903 2,916 2,929 2,934 2,941 2,950 2,961 2,975 2,988 3,005 3,021 3,037 3,053 3,069 3,090 3,112
DIVERSITY - WESTERN(-) 683 629 714 684 890 666 721 736 1,026 1,000 1,049 880 1,034 995 1,142 1,078PJM WESTERN 71,753 72,388 72,657 72,526 72,393 72,825 73,058 73,406 73,308 73,683 74,043 74,629 74,838 75,131 75,322 75,800
DOM 19,300 19,607 19,816 19,856 19,917 19,921 19,952 20,032 20,090 20,179 20,317 20,435 20,533 20,593 20,718 20,833
DIVERSITY - INTERREGIONAL(-) 1,253 1,252 1,302 1,282 1,102 1,305 1,372 1,355 1,016 1,045 990 1,194 987 1,255 1,065 1,103PJM RTO 137,637 138,881 139,386 139,014 138,972 139,214 139,401 139,882 140,097 140,566 141,105 141,831 142,345 142,516 143,091 143,772
86
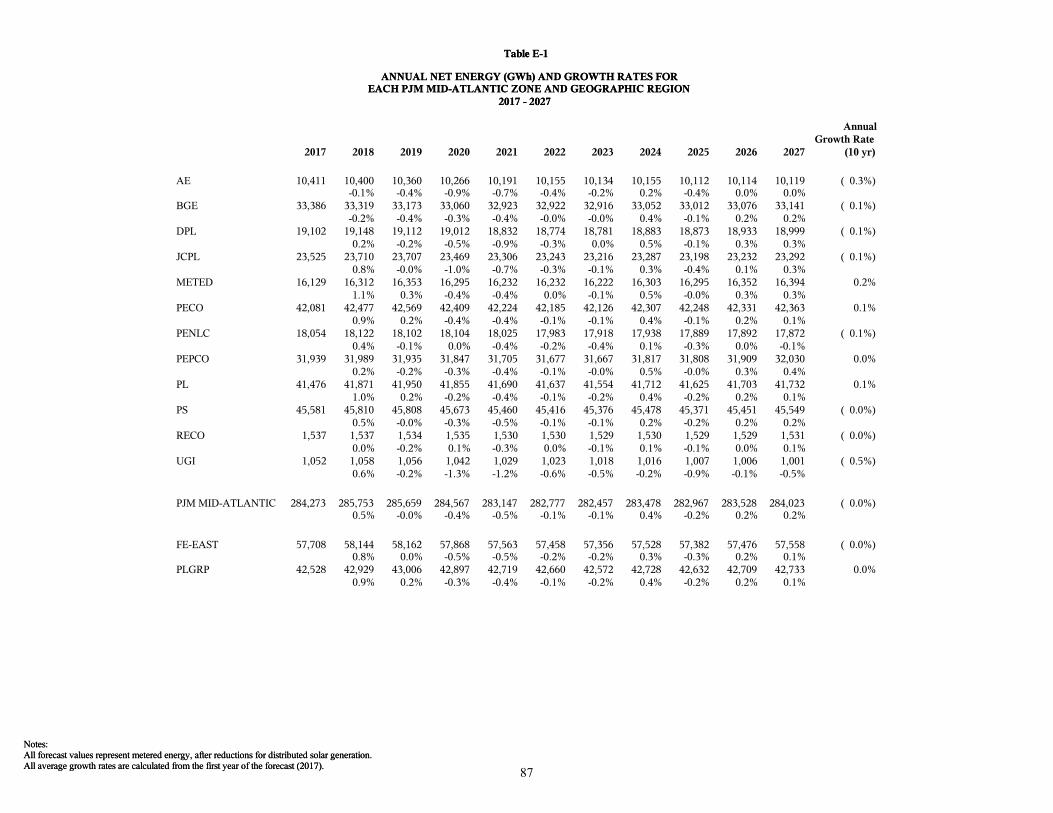
All average growth rates are calculated from the first year of the forecast (2017).All forecast values represent metered energy, after reductions for distributed solar generation.Notes:
Table E-1
ANNUAL NET ENERGY (GWh) AND GROWTH RATES FOREACH PJM MID-ATLANTIC ZONE AND GEOGRAPHIC REGION
2017 - 2027
2017 2018 2019 2020 2021 2022 2023 2024 2025 2026 2027
AnnualGrowth Rate
(10 yr)
AE 10,411 10,400 10,360 10,266 10,191 10,155 10,134 10,155 10,112 10,114 10,119 ( 0.3%)-0.1% -0.4% -0.9% -0.7% -0.4% -0.2% 0.2% -0.4% 0.0% 0.0%
BGE 33,386 33,319 33,173 33,060 32,923 32,922 32,916 33,052 33,012 33,076 33,141 ( 0.1%)-0.2% -0.4% -0.3% -0.4% -0.0% -0.0% 0.4% -0.1% 0.2% 0.2%
DPL 19,102 19,148 19,112 19,012 18,832 18,774 18,781 18,883 18,873 18,933 18,999 ( 0.1%)0.2% -0.2% -0.5% -0.9% -0.3% 0.0% 0.5% -0.1% 0.3% 0.3%
JCPL 23,525 23,710 23,707 23,469 23,306 23,243 23,216 23,287 23,198 23,232 23,292 ( 0.1%)0.8% -0.0% -1.0% -0.7% -0.3% -0.1% 0.3% -0.4% 0.1% 0.3%
METED 16,129 16,312 16,353 16,295 16,232 16,232 16,222 16,303 16,295 16,352 16,394 0.2%1.1% 0.3% -0.4% -0.4% 0.0% -0.1% 0.5% -0.0% 0.3% 0.3%
PECO 42,081 42,477 42,569 42,409 42,224 42,185 42,126 42,307 42,248 42,331 42,363 0.1%0.9% 0.2% -0.4% -0.4% -0.1% -0.1% 0.4% -0.1% 0.2% 0.1%
PENLC 18,054 18,122 18,102 18,104 18,025 17,983 17,918 17,938 17,889 17,892 17,872 ( 0.1%)0.4% -0.1% 0.0% -0.4% -0.2% -0.4% 0.1% -0.3% 0.0% -0.1%
PEPCO 31,939 31,989 31,935 31,847 31,705 31,677 31,667 31,817 31,808 31,909 32,030 0.0%0.2% -0.2% -0.3% -0.4% -0.1% -0.0% 0.5% -0.0% 0.3% 0.4%
PL 41,476 41,871 41,950 41,855 41,690 41,637 41,554 41,712 41,625 41,703 41,732 0.1%1.0% 0.2% -0.2% -0.4% -0.1% -0.2% 0.4% -0.2% 0.2% 0.1%
PS 45,581 45,810 45,808 45,673 45,460 45,416 45,376 45,478 45,371 45,451 45,549 ( 0.0%)0.5% -0.0% -0.3% -0.5% -0.1% -0.1% 0.2% -0.2% 0.2% 0.2%
RECO 1,537 1,537 1,534 1,535 1,530 1,530 1,529 1,530 1,529 1,529 1,531 ( 0.0%)0.0% -0.2% 0.1% -0.3% 0.0% -0.1% 0.1% -0.1% 0.0% 0.1%
UGI 1,052 1,058 1,056 1,042 1,029 1,023 1,018 1,016 1,007 1,006 1,001 ( 0.5%)0.6% -0.2% -1.3% -1.2% -0.6% -0.5% -0.2% -0.9% -0.1% -0.5%
PJM MID-ATLANTIC 284,273 285,753 285,659 284,567 283,147 282,777 282,457 283,478 282,967 283,528 284,023 ( 0.0%)0.5% -0.0% -0.4% -0.5% -0.1% -0.1% 0.4% -0.2% 0.2% 0.2%
FE-EAST 57,708 58,144 58,162 57,868 57,563 57,458 57,356 57,528 57,382 57,476 57,558 ( 0.0%)0.8% 0.0% -0.5% -0.5% -0.2% -0.2% 0.3% -0.3% 0.2% 0.1%
PLGRP 42,528 42,929 43,006 42,897 42,719 42,660 42,572 42,728 42,632 42,709 42,733 0.0%0.9% 0.2% -0.3% -0.4% -0.1% -0.2% 0.4% -0.2% 0.2% 0.1%
87
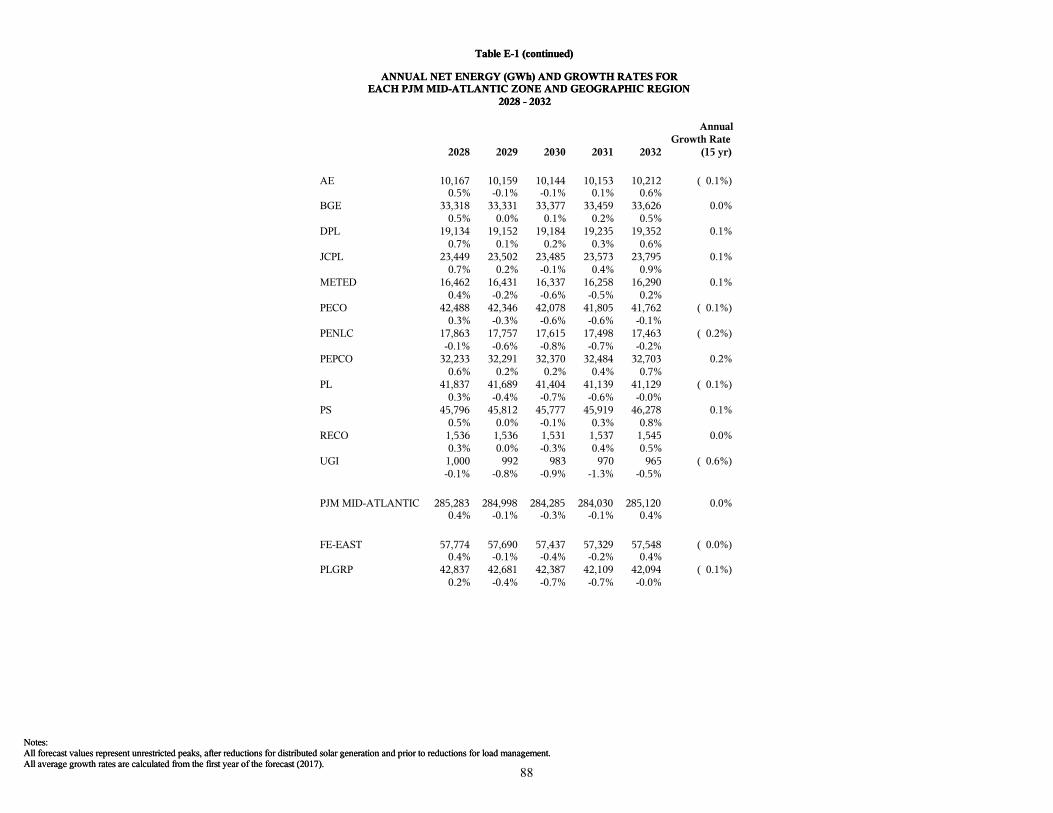
All average growth rates are calculated from the first year of the forecast (2017).All forecast values represent unrestricted peaks, after reductions for distributed solar generation and prior to reductions for load management.Notes:
Table E-1 (continued)
ANNUAL NET ENERGY (GWh) AND GROWTH RATES FOREACH PJM MID-ATLANTIC ZONE AND GEOGRAPHIC REGION
2028 - 2032
2028 2029 2030 2031 2032
AnnualGrowth Rate
(15 yr)
AE 10,167 10,159 10,144 10,153 10,212 ( 0.1%)0.5% -0.1% -0.1% 0.1% 0.6%
BGE 33,318 33,331 33,377 33,459 33,626 0.0%0.5% 0.0% 0.1% 0.2% 0.5%
DPL 19,134 19,152 19,184 19,235 19,352 0.1%0.7% 0.1% 0.2% 0.3% 0.6%
JCPL 23,449 23,502 23,485 23,573 23,795 0.1%0.7% 0.2% -0.1% 0.4% 0.9%
METED 16,462 16,431 16,337 16,258 16,290 0.1%0.4% -0.2% -0.6% -0.5% 0.2%
PECO 42,488 42,346 42,078 41,805 41,762 ( 0.1%)0.3% -0.3% -0.6% -0.6% -0.1%
PENLC 17,863 17,757 17,615 17,498 17,463 ( 0.2%)-0.1% -0.6% -0.8% -0.7% -0.2%
PEPCO 32,233 32,291 32,370 32,484 32,703 0.2%0.6% 0.2% 0.2% 0.4% 0.7%
PL 41,837 41,689 41,404 41,139 41,129 ( 0.1%)0.3% -0.4% -0.7% -0.6% -0.0%
PS 45,796 45,812 45,777 45,919 46,278 0.1%0.5% 0.0% -0.1% 0.3% 0.8%
RECO 1,536 1,536 1,531 1,537 1,545 0.0%0.3% 0.0% -0.3% 0.4% 0.5%
UGI 1,000 992 983 970 965 ( 0.6%)-0.1% -0.8% -0.9% -1.3% -0.5%
PJM MID-ATLANTIC 285,283 284,998 284,285 284,030 285,120 0.0%0.4% -0.1% -0.3% -0.1% 0.4%
FE-EAST 57,774 57,690 57,437 57,329 57,548 ( 0.0%)0.4% -0.1% -0.4% -0.2% 0.4%
PLGRP 42,837 42,681 42,387 42,109 42,094 ( 0.1%)0.2% -0.4% -0.7% -0.7% -0.0%
88
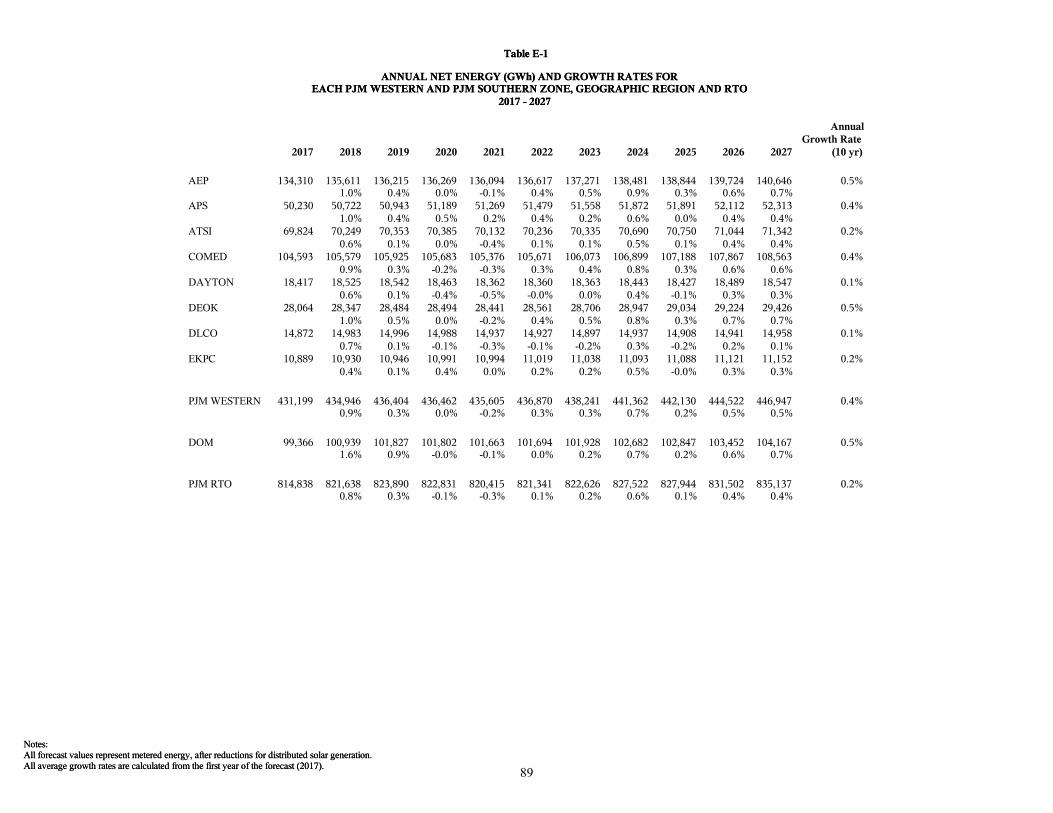
All average growth rates are calculated from the first year of the forecast (2017).All forecast values represent metered energy, after reductions for distributed solar generation.Notes:
Table E-1
ANNUAL NET ENERGY (GWh) AND GROWTH RATES FOREACH PJM WESTERN AND PJM SOUTHERN ZONE, GEOGRAPHIC REGION AND RTO
2017 - 2027
2017 2018 2019 2020 2021 2022 2023 2024 2025 2026 2027
AnnualGrowth Rate
(10 yr)
AEP 134,310 135,611 136,215 136,269 136,094 136,617 137,271 138,481 138,844 139,724 140,646 0.5%1.0% 0.4% 0.0% -0.1% 0.4% 0.5% 0.9% 0.3% 0.6% 0.7%
APS 50,230 50,722 50,943 51,189 51,269 51,479 51,558 51,872 51,891 52,112 52,313 0.4%1.0% 0.4% 0.5% 0.2% 0.4% 0.2% 0.6% 0.0% 0.4% 0.4%
ATSI 69,824 70,249 70,353 70,385 70,132 70,236 70,335 70,690 70,750 71,044 71,342 0.2%0.6% 0.1% 0.0% -0.4% 0.1% 0.1% 0.5% 0.1% 0.4% 0.4%
COMED 104,593 105,579 105,925 105,683 105,376 105,671 106,073 106,899 107,188 107,867 108,563 0.4%0.9% 0.3% -0.2% -0.3% 0.3% 0.4% 0.8% 0.3% 0.6% 0.6%
DAYTON 18,417 18,525 18,542 18,463 18,362 18,360 18,363 18,443 18,427 18,489 18,547 0.1%0.6% 0.1% -0.4% -0.5% -0.0% 0.0% 0.4% -0.1% 0.3% 0.3%
DEOK 28,064 28,347 28,484 28,494 28,441 28,561 28,706 28,947 29,034 29,224 29,426 0.5%1.0% 0.5% 0.0% -0.2% 0.4% 0.5% 0.8% 0.3% 0.7% 0.7%
DLCO 14,872 14,983 14,996 14,988 14,937 14,927 14,897 14,937 14,908 14,941 14,958 0.1%0.7% 0.1% -0.1% -0.3% -0.1% -0.2% 0.3% -0.2% 0.2% 0.1%
EKPC 10,889 10,930 10,946 10,991 10,994 11,019 11,038 11,093 11,088 11,121 11,152 0.2%0.4% 0.1% 0.4% 0.0% 0.2% 0.2% 0.5% -0.0% 0.3% 0.3%
PJM WESTERN 431,199 434,946 436,404 436,462 435,605 436,870 438,241 441,362 442,130 444,522 446,947 0.4%0.9% 0.3% 0.0% -0.2% 0.3% 0.3% 0.7% 0.2% 0.5% 0.5%
DOM 99,366 100,939 101,827 101,802 101,663 101,694 101,928 102,682 102,847 103,452 104,167 0.5%1.6% 0.9% -0.0% -0.1% 0.0% 0.2% 0.7% 0.2% 0.6% 0.7%
PJM RTO 814,838 821,638 823,890 822,831 820,415 821,341 822,626 827,522 827,944 831,502 835,137 0.2%0.8% 0.3% -0.1% -0.3% 0.1% 0.2% 0.6% 0.1% 0.4% 0.4%
89
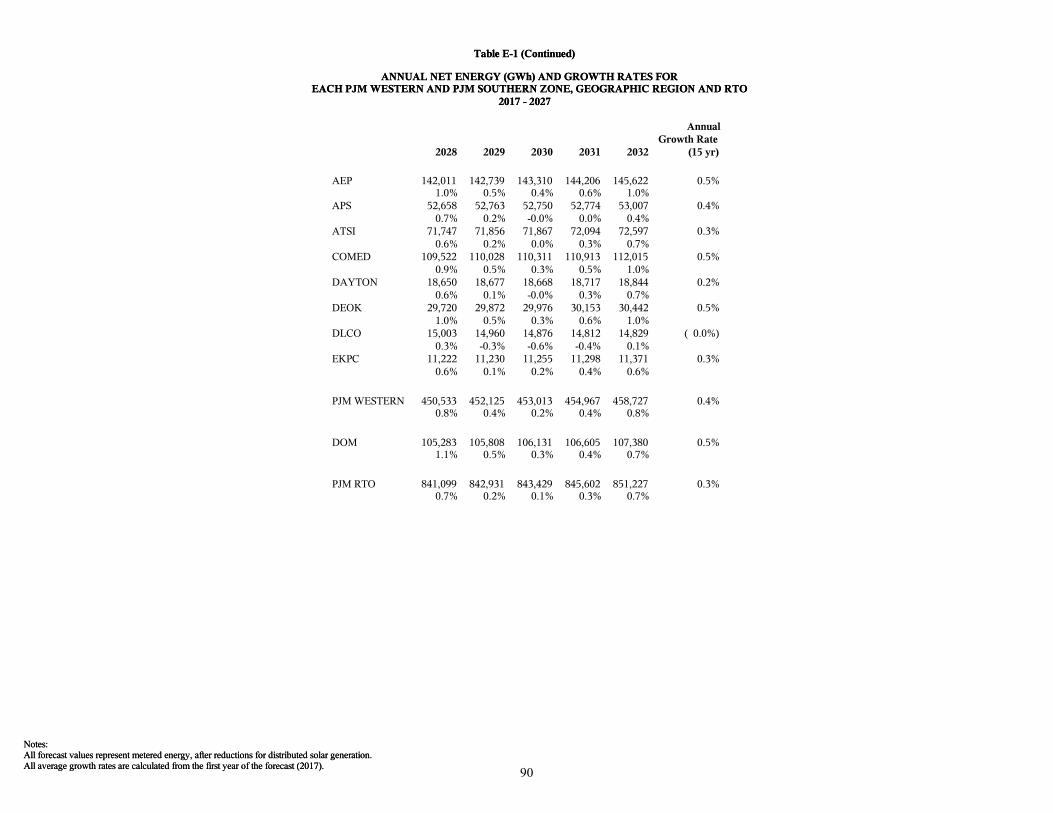
All average growth rates are calculated from the first year of the forecast (2017).All forecast values represent metered energy, after reductions for distributed solar generation.Notes:
Table E-1 (Continued)
ANNUAL NET ENERGY (GWh) AND GROWTH RATES FOREACH PJM WESTERN AND PJM SOUTHERN ZONE, GEOGRAPHIC REGION AND RTO
2017 - 2027
2028 2029 2030 2031 2032
AnnualGrowth Rate
(15 yr)
AEP 142,011 142,739 143,310 144,206 145,622 0.5%1.0% 0.5% 0.4% 0.6% 1.0%
APS 52,658 52,763 52,750 52,774 53,007 0.4%0.7% 0.2% -0.0% 0.0% 0.4%
ATSI 71,747 71,856 71,867 72,094 72,597 0.3%0.6% 0.2% 0.0% 0.3% 0.7%
COMED 109,522 110,028 110,311 110,913 112,015 0.5%0.9% 0.5% 0.3% 0.5% 1.0%
DAYTON 18,650 18,677 18,668 18,717 18,844 0.2%0.6% 0.1% -0.0% 0.3% 0.7%
DEOK 29,720 29,872 29,976 30,153 30,442 0.5%1.0% 0.5% 0.3% 0.6% 1.0%
DLCO 15,003 14,960 14,876 14,812 14,829 ( 0.0%)0.3% -0.3% -0.6% -0.4% 0.1%
EKPC 11,222 11,230 11,255 11,298 11,371 0.3%0.6% 0.1% 0.2% 0.4% 0.6%
PJM WESTERN 450,533 452,125 453,013 454,967 458,727 0.4%0.8% 0.4% 0.2% 0.4% 0.8%
DOM 105,283 105,808 106,131 106,605 107,380 0.5%1.1% 0.5% 0.3% 0.4% 0.7%
PJM RTO 841,099 842,931 843,429 845,602 851,227 0.3%0.7% 0.2% 0.1% 0.3% 0.7%
90
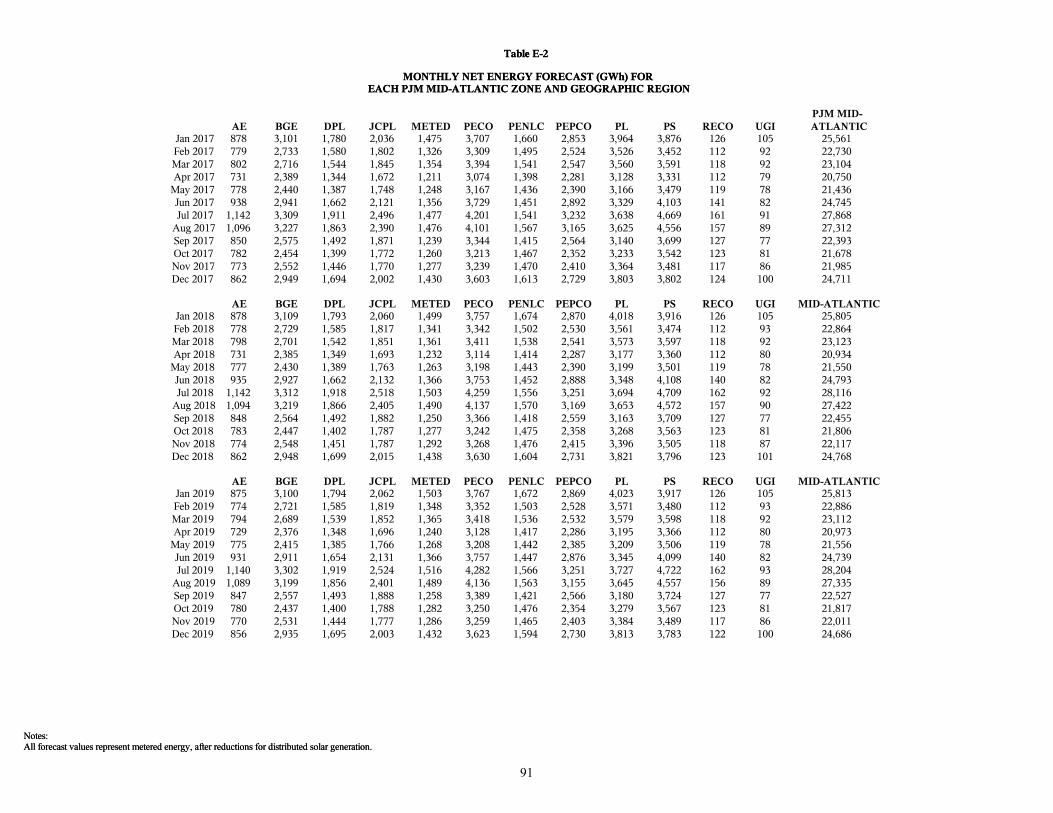
All forecast values represent metered energy, after reductions for distributed solar generation.Notes:
Table E-2
MONTHLY NET ENERGY FORECAST (GWh) FOREACH PJM MID-ATLANTIC ZONE AND GEOGRAPHIC REGION
All forecast values represent metered energy, after reductions for distributed solar generation.Notes:
Table E-2
MONTHLY NET ENERGY FORECAST (GWh) FOREACH PJM MID-ATLANTIC ZONE AND GEOGRAPHIC REGION
AE BGE DPL JCPL METED PECO PENLC PEPCO PL PS RECO UGIPJM MID-ATLANTIC
Jan 2017 878 3,101 1,780 2,036 1,475 3,707 1,660 2,853 3,964 3,876 126 105 25,561Feb 2017 779 2,733 1,580 1,802 1,326 3,309 1,495 2,524 3,526 3,452 112 92 22,730Mar 2017 802 2,716 1,544 1,845 1,354 3,394 1,541 2,547 3,560 3,591 118 92 23,104Apr 2017 731 2,389 1,344 1,672 1,211 3,074 1,398 2,281 3,128 3,331 112 79 20,750
May 2017 778 2,440 1,387 1,748 1,248 3,167 1,436 2,390 3,166 3,479 119 78 21,436Jun 2017 938 2,941 1,662 2,121 1,356 3,729 1,451 2,892 3,329 4,103 141 82 24,745Jul 2017 1,142 3,309 1,911 2,496 1,477 4,201 1,541 3,232 3,638 4,669 161 91 27,868
Aug 2017 1,096 3,227 1,863 2,390 1,476 4,101 1,567 3,165 3,625 4,556 157 89 27,312Sep 2017 850 2,575 1,492 1,871 1,239 3,344 1,415 2,564 3,140 3,699 127 77 22,393Oct 2017 782 2,454 1,399 1,772 1,260 3,213 1,467 2,352 3,233 3,542 123 81 21,678Nov 2017 773 2,552 1,446 1,770 1,277 3,239 1,470 2,410 3,364 3,481 117 86 21,985Dec 2017 862 2,949 1,694 2,002 1,430 3,603 1,613 2,729 3,803 3,802 124 100 24,711
AE BGE DPL JCPL METED PECO PENLC PEPCO PL PS RECO UGI MID-ATLANTICJan 2018 878 3,109 1,793 2,060 1,499 3,757 1,674 2,870 4,018 3,916 126 105 25,805Feb 2018 778 2,729 1,585 1,817 1,341 3,342 1,502 2,530 3,561 3,474 112 93 22,864Mar 2018 798 2,701 1,542 1,851 1,361 3,411 1,538 2,541 3,573 3,597 118 92 23,123Apr 2018 731 2,385 1,349 1,693 1,232 3,114 1,414 2,287 3,177 3,360 112 80 20,934
May 2018 777 2,430 1,389 1,763 1,263 3,198 1,443 2,390 3,199 3,501 119 78 21,550Jun 2018 935 2,927 1,662 2,132 1,366 3,753 1,452 2,888 3,348 4,108 140 82 24,793Jul 2018 1,142 3,312 1,918 2,518 1,503 4,259 1,556 3,251 3,694 4,709 162 92 28,116
Aug 2018 1,094 3,219 1,866 2,405 1,490 4,137 1,570 3,169 3,653 4,572 157 90 27,422Sep 2018 848 2,564 1,492 1,882 1,250 3,366 1,418 2,559 3,163 3,709 127 77 22,455Oct 2018 783 2,447 1,402 1,787 1,277 3,242 1,475 2,358 3,268 3,563 123 81 21,806Nov 2018 774 2,548 1,451 1,787 1,292 3,268 1,476 2,415 3,396 3,505 118 87 22,117Dec 2018 862 2,948 1,699 2,015 1,438 3,630 1,604 2,731 3,821 3,796 123 101 24,768
AE BGE DPL JCPL METED PECO PENLC PEPCO PL PS RECO UGI MID-ATLANTICJan 2019 875 3,100 1,794 2,062 1,503 3,767 1,672 2,869 4,023 3,917 126 105 25,813Feb 2019 774 2,721 1,585 1,819 1,348 3,352 1,503 2,528 3,571 3,480 112 93 22,886Mar 2019 794 2,689 1,539 1,852 1,365 3,418 1,536 2,532 3,579 3,598 118 92 23,112Apr 2019 729 2,376 1,348 1,696 1,240 3,128 1,417 2,286 3,195 3,366 112 80 20,973
May 2019 775 2,415 1,385 1,766 1,268 3,208 1,442 2,385 3,209 3,506 119 78 21,556Jun 2019 931 2,911 1,654 2,131 1,366 3,757 1,447 2,876 3,345 4,099 140 82 24,739Jul 2019 1,140 3,302 1,919 2,524 1,516 4,282 1,566 3,251 3,727 4,722 162 93 28,204
Aug 2019 1,089 3,199 1,856 2,401 1,489 4,136 1,563 3,155 3,645 4,557 156 89 27,335Sep 2019 847 2,557 1,493 1,888 1,258 3,389 1,421 2,566 3,180 3,724 127 77 22,527Oct 2019 780 2,437 1,400 1,788 1,282 3,250 1,476 2,354 3,279 3,567 123 81 21,817Nov 2019 770 2,531 1,444 1,777 1,286 3,259 1,465 2,403 3,384 3,489 117 86 22,011Dec 2019 856 2,935 1,695 2,003 1,432 3,623 1,594 2,730 3,813 3,783 122 100 24,686
91
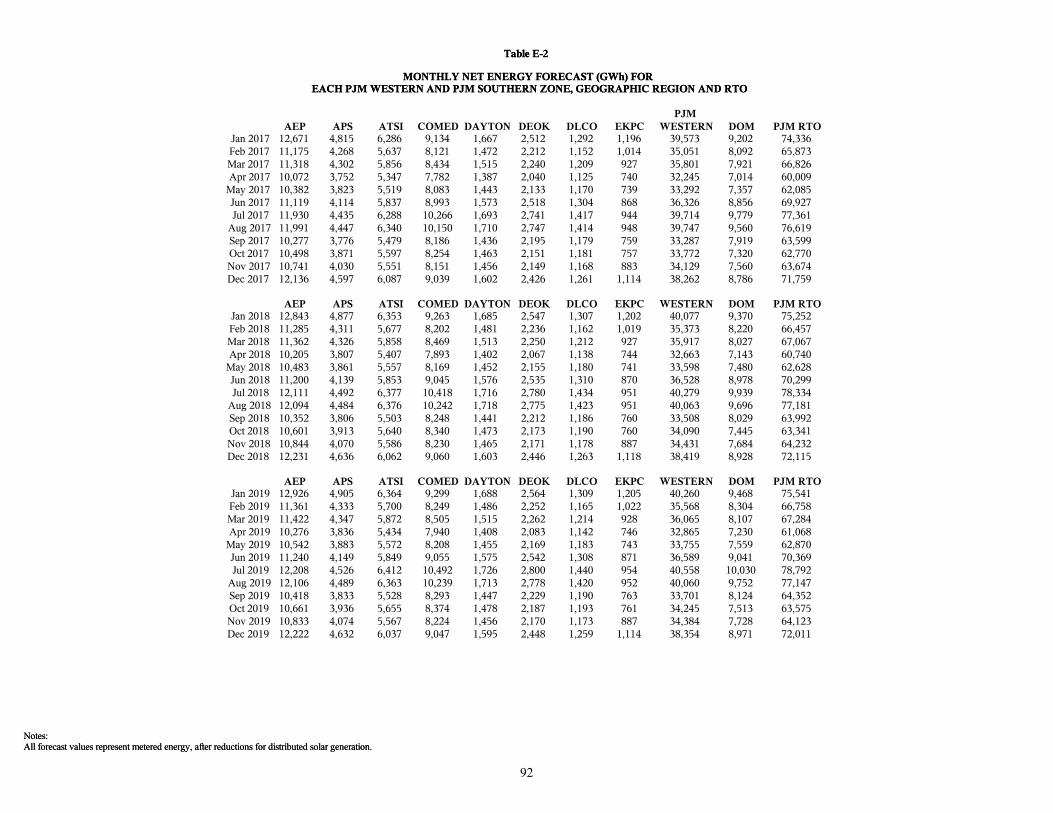
All forecast values represent metered energy, after reductions for distributed solar generation.Notes:
Table E-2
MONTHLY NET ENERGY FORECAST (GWh) FOREACH PJM WESTERN AND PJM SOUTHERN ZONE, GEOGRAPHIC REGION AND RTO
All forecast values represent metered energy, after reductions for distributed solar generation.Notes:
Table E-2
MONTHLY NET ENERGY FORECAST (GWh) FOREACH PJM WESTERN AND PJM SOUTHERN ZONE, GEOGRAPHIC REGION AND RTO
AEP APS ATSI COMED DAYTON DEOK DLCO EKPCPJM
WESTERN DOM PJM RTOJan 2017 12,671 4,815 6,286 9,134 1,667 2,512 1,292 1,196 39,573 9,202 74,336Feb 2017 11,175 4,268 5,637 8,121 1,472 2,212 1,152 1,014 35,051 8,092 65,873Mar 2017 11,318 4,302 5,856 8,434 1,515 2,240 1,209 927 35,801 7,921 66,826Apr 2017 10,072 3,752 5,347 7,782 1,387 2,040 1,125 740 32,245 7,014 60,009
May 2017 10,382 3,823 5,519 8,083 1,443 2,133 1,170 739 33,292 7,357 62,085Jun 2017 11,119 4,114 5,837 8,993 1,573 2,518 1,304 868 36,326 8,856 69,927Jul 2017 11,930 4,435 6,288 10,266 1,693 2,741 1,417 944 39,714 9,779 77,361
Aug 2017 11,991 4,447 6,340 10,150 1,710 2,747 1,414 948 39,747 9,560 76,619Sep 2017 10,277 3,776 5,479 8,186 1,436 2,195 1,179 759 33,287 7,919 63,599Oct 2017 10,498 3,871 5,597 8,254 1,463 2,151 1,181 757 33,772 7,320 62,770Nov 2017 10,741 4,030 5,551 8,151 1,456 2,149 1,168 883 34,129 7,560 63,674Dec 2017 12,136 4,597 6,087 9,039 1,602 2,426 1,261 1,114 38,262 8,786 71,759
AEP APS ATSI COMED DAYTON DEOK DLCO EKPC WESTERN DOM PJM RTOJan 2018 12,843 4,877 6,353 9,263 1,685 2,547 1,307 1,202 40,077 9,370 75,252Feb 2018 11,285 4,311 5,677 8,202 1,481 2,236 1,162 1,019 35,373 8,220 66,457Mar 2018 11,362 4,326 5,858 8,469 1,513 2,250 1,212 927 35,917 8,027 67,067Apr 2018 10,205 3,807 5,407 7,893 1,402 2,067 1,138 744 32,663 7,143 60,740
May 2018 10,483 3,861 5,557 8,169 1,452 2,155 1,180 741 33,598 7,480 62,628Jun 2018 11,200 4,139 5,853 9,045 1,576 2,535 1,310 870 36,528 8,978 70,299Jul 2018 12,111 4,492 6,377 10,418 1,716 2,780 1,434 951 40,279 9,939 78,334
Aug 2018 12,094 4,484 6,376 10,242 1,718 2,775 1,423 951 40,063 9,696 77,181Sep 2018 10,352 3,806 5,503 8,248 1,441 2,212 1,186 760 33,508 8,029 63,992Oct 2018 10,601 3,913 5,640 8,340 1,473 2,173 1,190 760 34,090 7,445 63,341Nov 2018 10,844 4,070 5,586 8,230 1,465 2,171 1,178 887 34,431 7,684 64,232Dec 2018 12,231 4,636 6,062 9,060 1,603 2,446 1,263 1,118 38,419 8,928 72,115
AEP APS ATSI COMED DAYTON DEOK DLCO EKPC WESTERN DOM PJM RTOJan 2019 12,926 4,905 6,364 9,299 1,688 2,564 1,309 1,205 40,260 9,468 75,541Feb 2019 11,361 4,333 5,700 8,249 1,486 2,252 1,165 1,022 35,568 8,304 66,758Mar 2019 11,422 4,347 5,872 8,505 1,515 2,262 1,214 928 36,065 8,107 67,284Apr 2019 10,276 3,836 5,434 7,940 1,408 2,083 1,142 746 32,865 7,230 61,068
May 2019 10,542 3,883 5,572 8,208 1,455 2,169 1,183 743 33,755 7,559 62,870Jun 2019 11,240 4,149 5,849 9,055 1,575 2,542 1,308 871 36,589 9,041 70,369Jul 2019 12,208 4,526 6,412 10,492 1,726 2,800 1,440 954 40,558 10,030 78,792
Aug 2019 12,106 4,489 6,363 10,239 1,713 2,778 1,420 952 40,060 9,752 77,147Sep 2019 10,418 3,833 5,528 8,293 1,447 2,229 1,190 763 33,701 8,124 64,352Oct 2019 10,661 3,936 5,655 8,374 1,478 2,187 1,193 761 34,245 7,513 63,575Nov 2019 10,833 4,074 5,567 8,224 1,456 2,170 1,173 887 34,384 7,728 64,123Dec 2019 12,222 4,632 6,037 9,047 1,595 2,448 1,259 1,114 38,354 8,971 72,011
92
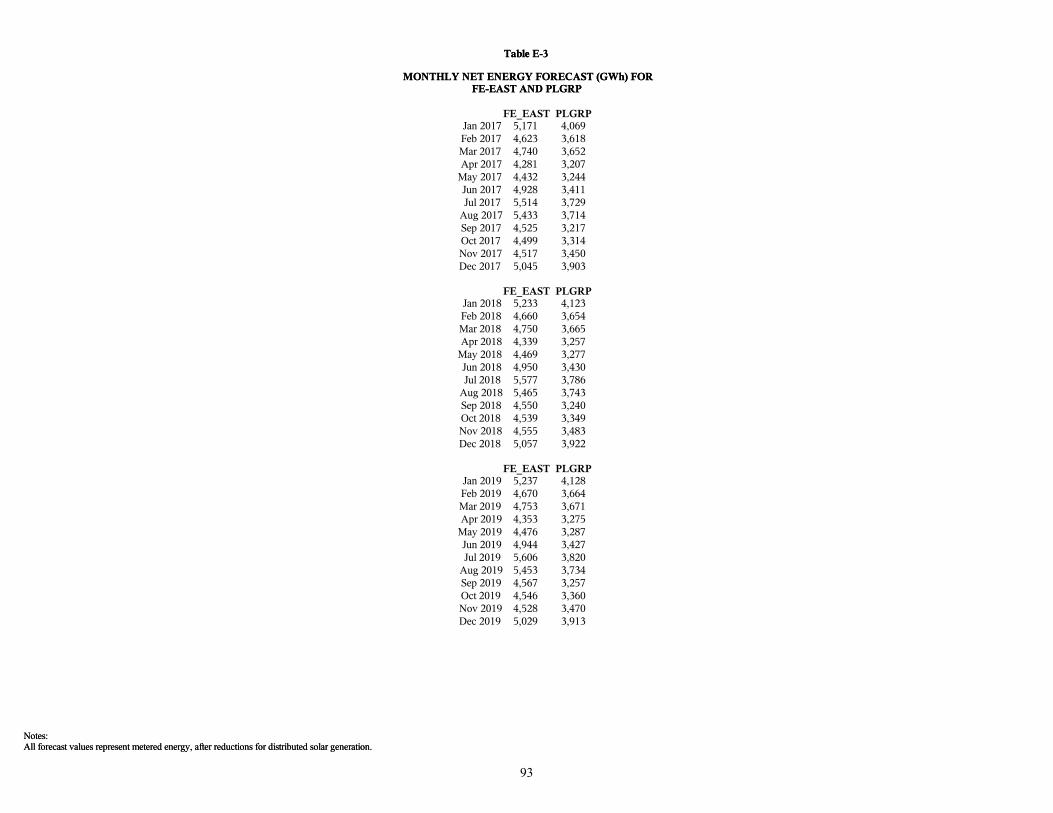
All forecast values represent metered energy, after reductions for distributed solar generation.Notes:
Table E-3
MONTHLY NET ENERGY FORECAST (GWh) FORFE-EAST AND PLGRP
All forecast values represent metered energy, after reductions for distributed solar generation.Notes:
Table E-3
MONTHLY NET ENERGY FORECAST (GWh) FORFE-EAST AND PLGRP
FE_EAST PLGRPJan 2017 5,171 4,069Feb 2017 4,623 3,618Mar 2017 4,740 3,652Apr 2017 4,281 3,207
May 2017 4,432 3,244Jun 2017 4,928 3,411Jul 2017 5,514 3,729
Aug 2017 5,433 3,714Sep 2017 4,525 3,217Oct 2017 4,499 3,314Nov 2017 4,517 3,450Dec 2017 5,045 3,903
FE_EAST PLGRPJan 2018 5,233 4,123Feb 2018 4,660 3,654Mar 2018 4,750 3,665Apr 2018 4,339 3,257
May 2018 4,469 3,277Jun 2018 4,950 3,430Jul 2018 5,577 3,786
Aug 2018 5,465 3,743Sep 2018 4,550 3,240Oct 2018 4,539 3,349Nov 2018 4,555 3,483Dec 2018 5,057 3,922
FE_EAST PLGRPJan 2019 5,237 4,128Feb 2019 4,670 3,664Mar 2019 4,753 3,671Apr 2019 4,353 3,275
May 2019 4,476 3,287Jun 2019 4,944 3,427Jul 2019 5,606 3,820
Aug 2019 5,453 3,734Sep 2019 4,567 3,257Oct 2019 4,546 3,360Nov 2019 4,528 3,470Dec 2019 5,029 3,913
93
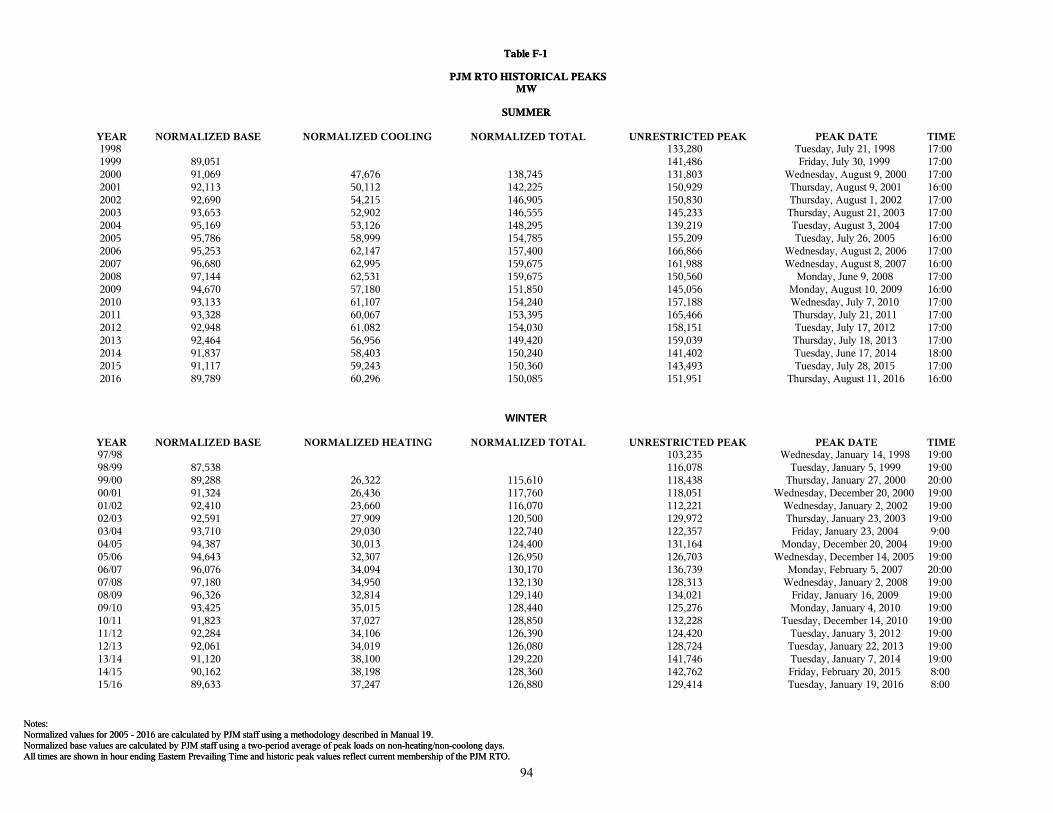
All times are shown in hour ending Eastern Prevailing Time and historic peak values reflect current membership of the PJM RTO.Normalized base values are calculated by PJM staff using a two-period average of peak loads on non-heating/non-coolong days.Normalized values for 2005 - 2016 are calculated by PJM staff using a methodology described in Manual 19.Notes:
Table F-1
PJM RTO HISTORICAL PEAKSMW
SUMMER
YEAR NORMALIZED BASE NORMALIZED COOLING NORMALIZED TOTAL UNRESTRICTED PEAK PEAK DATE TIME1998 133,280 Tuesday, July 21, 1998 17:001999 89,051 141,486 Friday, July 30, 1999 17:002000 91,069 47,676 138,745 131,803 Wednesday, August 9, 2000 17:002001 92,113 50,112 142,225 150,929 Thursday, August 9, 2001 16:002002 92,690 54,215 146,905 150,830 Thursday, August 1, 2002 17:002003 93,653 52,902 146,555 145,233 Thursday, August 21, 2003 17:002004 95,169 53,126 148,295 139,219 Tuesday, August 3, 2004 17:002005 95,786 58,999 154,785 155,209 Tuesday, July 26, 2005 16:002006 95,253 62,147 157,400 166,866 Wednesday, August 2, 2006 17:002007 96,680 62,995 159,675 161,988 Wednesday, August 8, 2007 16:002008 97,144 62,531 159,675 150,560 Monday, June 9, 2008 17:002009 94,670 57,180 151,850 145,056 Monday, August 10, 2009 16:002010 93,133 61,107 154,240 157,188 Wednesday, July 7, 2010 17:002011 93,328 60,067 153,395 165,466 Thursday, July 21, 2011 17:002012 92,948 61,082 154,030 158,151 Tuesday, July 17, 2012 17:002013 92,464 56,956 149,420 159,039 Thursday, July 18, 2013 17:002014 91,837 58,403 150,240 141,402 Tuesday, June 17, 2014 18:002015 91,117 59,243 150,360 143,493 Tuesday, July 28, 2015 17:002016 89,789 60,296 150,085 151,951 Thursday, August 11, 2016 16:00
WINTER
YEAR NORMALIZED BASE NORMALIZED HEATING NORMALIZED TOTAL UNRESTRICTED PEAK PEAK DATE TIME97/98 103,235 Wednesday, January 14, 1998 19:0098/99 87,538 116,078 Tuesday, January 5, 1999 19:0099/00 89,288 26,322 115,610 118,438 Thursday, January 27, 2000 20:0000/01 91,324 26,436 117,760 118,051 Wednesday, December 20, 2000 19:0001/02 92,410 23,660 116,070 112,221 Wednesday, January 2, 2002 19:0002/03 92,591 27,909 120,500 129,972 Thursday, January 23, 2003 19:0003/04 93,710 29,030 122,740 122,357 Friday, January 23, 2004 9:0004/05 94,387 30,013 124,400 131,164 Monday, December 20, 2004 19:0005/06 94,643 32,307 126,950 126,703 Wednesday, December 14, 2005 19:0006/07 96,076 34,094 130,170 136,739 Monday, February 5, 2007 20:0007/08 97,180 34,950 132,130 128,313 Wednesday, January 2, 2008 19:0008/09 96,326 32,814 129,140 134,021 Friday, January 16, 2009 19:0009/10 93,425 35,015 128,440 125,276 Monday, January 4, 2010 19:0010/11 91,823 37,027 128,850 132,228 Tuesday, December 14, 2010 19:0011/12 92,284 34,106 126,390 124,420 Tuesday, January 3, 2012 19:0012/13 92,061 34,019 126,080 128,724 Tuesday, January 22, 2013 19:0013/14 91,120 38,100 129,220 141,746 Tuesday, January 7, 2014 19:0014/15 90,162 38,198 128,360 142,762 Friday, February 20, 2015 8:0015/16 89,633 37,247 126,880 129,414 Tuesday, January 19, 2016 8:00
94
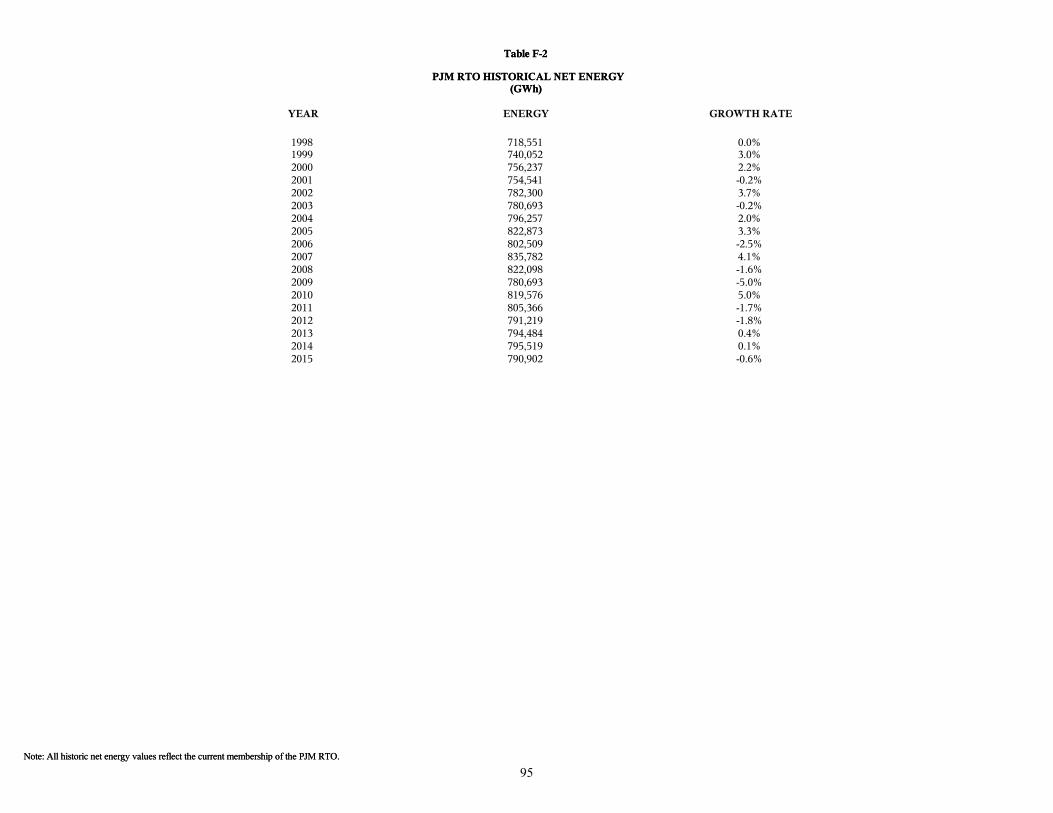
Note: All historic net energy values reflect the current membership of the PJM RTO.
Table F-2
PJM RTO HISTORICAL NET ENERGY(GWh)
Note: All historic net energy values reflect the current membership of the PJM RTO.
Table F-2
PJM RTO HISTORICAL NET ENERGY(GWh)
YEAR ENERGY GROWTH RATE
1998 718,551 0.0%1999 740,052 3.0%2000 756,237 2.2%2001 754,541 -0.2%2002 782,300 3.7%2003 780,693 -0.2%2004 796,257 2.0%2005 822,873 3.3%2006 802,509 -2.5%2007 835,782 4.1%2008 822,098 -1.6%2009 780,693 -5.0%2010 819,576 5.0%2011 805,366 -1.7%2012 791,219 -1.8%2013 794,484 0.4%2014 795,519 0.1%2015 790,902 -0.6%
95
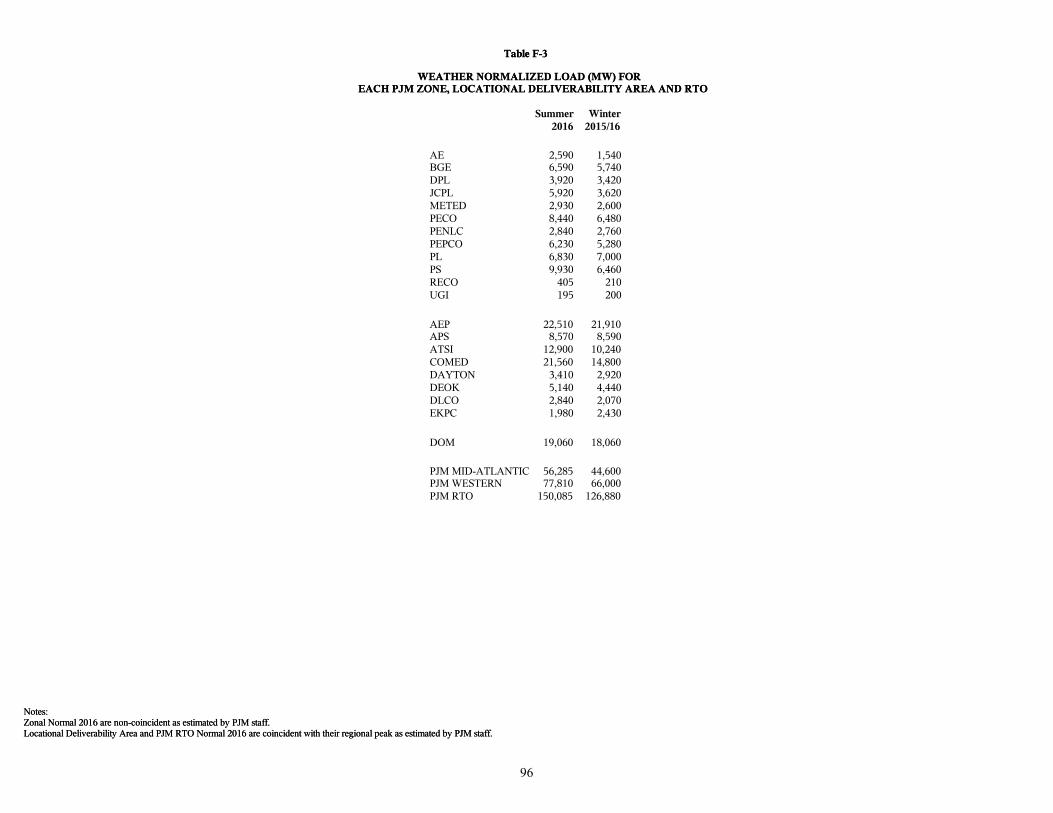
Locational Deliverability Area and PJM RTO Normal 2016 are coincident with their regional peak as estimated by PJM staff.Zonal Normal 2016 are non-coincident as estimated by PJM staff.Notes:
Table F-3
WEATHER NORMALIZED LOAD (MW) FOREACH PJM ZONE, LOCATIONAL DELIVERABILITY AREA AND RTO
Locational Deliverability Area and PJM RTO Normal 2016 are coincident with their regional peak as estimated by PJM staff.Zonal Normal 2016 are non-coincident as estimated by PJM staff.Notes:
Table F-3
WEATHER NORMALIZED LOAD (MW) FOREACH PJM ZONE, LOCATIONAL DELIVERABILITY AREA AND RTO
Summer2016
Winter2015/16
AE 2,590 1,540BGE 6,590 5,740DPL 3,920 3,420JCPL 5,920 3,620METED 2,930 2,600PECO 8,440 6,480PENLC 2,840 2,760PEPCO 6,230 5,280PL 6,830 7,000PS 9,930 6,460RECO 405 210UGI 195 200
AEP 22,510 21,910APS 8,570 8,590ATSI 12,900 10,240COMED 21,560 14,800DAYTON 3,410 2,920DEOK 5,140 4,440DLCO 2,840 2,070EKPC 1,980 2,430
DOM 19,060 18,060
PJM MID-ATLANTIC 56,285 44,600PJM WESTERN 77,810 66,000PJM RTO 150,085 126,880
96

Indexed economic variable is a combination of U.S. Gross Domestic Product, Gross Metropolitan Product, Real Personal Income, Population, Households, and Non-Manufacturing Employment.Values presented are annualized compound average growth rates.Notes:
Table G-1
ANNUALIZED AVERAGE GROWTH OF INDEXED ECONOMIC VARIABLEFOR EACH PJM ZONE AND RTO
5-Year(2017-22)
10-Year(2017-27)
15-Year(2017-32)
AE 0.6% 0.7% 0.7%BGE 1.2% 1.2% 1.2%DPL 1.4% 1.3% 1.3%JCPL 0.9% 0.9% 0.9%
METED 1.6% 1.5% 1.5%PECO 1.4% 1.4% 1.4%
PENLC 1.1% 1.1% 1.1%PEPCO 1.4% 1.3% 1.3%
PL 1.4% 1.4% 1.3%PS 1.0% 0.9% 0.9%
RECO 0.9% 0.9% 0.9%UGI 0.8% 0.8% 0.7%
AEP 1.6% 1.5% 1.5%APS 1.6% 1.5% 1.5%ATSI 1.3% 1.3% 1.2%
COMED 1.3% 1.2% 1.2%DAYTON 1.1% 1.0% 0.9%
DEOK 1.5% 1.5% 1.4%DLCO 1.3% 1.2% 1.2%EKPC 1.6% 1.5% 1.5%
DOM 1.5% 1.4% 1.4%
PJM RTO 1.4% 1.3% 1.3%
Source: Moody's Analytics, September, 2016
97