planar blast scaling with condensed-phase explosives...
TRANSCRIPT
23rd ICDERS July 24–29, 2011 Irvine, USA
Planar Blast Scaling withCondensed-Phase Explosives in a Shock Tube
Scott I. JacksonShock and Detonation Physics Group, Los Alamos National Laboratory,
Los Alamos, NM 87544
1 Introduction
Blast waves are strong shock waves that result from large power density deposition into a fluid. Therapid energy release of high-explosive (HE) detonation provides sufficiently high power density forblast wave generation. Often it is desirable to quantify the energy released by such an event and todetermine that energy relative to other reference explosives to derive an explosive-equivalence value.In this study, we use condensed-phase explosives to drive a blast wave in a shock tube. The explosivematerial and quantity were varied to produce blast waves of differing strengths. Pressure transducersat varying lengths measured the post-shock pressure, shock-wave arrival time and sidewall impulseassociated with each test. Blast-scaling concepts in a one-dimensional geometry were then used to bothdetermine the energy release associated with each test and to verify the scaling of the shock positionversus time, overpressure versus distance, and impulse.
Most blast scaling measurements to-date have been performed in a three-dimensional geometry suchas a blast arena. Testing in a three-dimensional geometry can be challenging, however, as sphericalshock-wave symmetry is required for good measurements. Additionally, the spherical wave strengthdecays rapidly with distance and it can be necessary to utilize larger (several kg) quantities of explosiveto prevent significant decay from occurring before an idealized blast wave has formed. Such a modeof testing can be expensive, require large quantities of explosive, and be limited by both atmosphericconditions (such as rain) and by noise complaints from the population density near the test arena.
Testing is possible in more compact geometries, however. Non-planar blast waves can be formed into aquasi-planar shape by confining the shock diffraction with the walls of a shock tube. Regardless of theinitial form, the wave shape will begin to approximate a planar front after successive wave reflectionsfrom the tube walls. Such a technique has previously been used to obtain blast scaling measurements inthe planar geometry with gaseous explosives and the condensed-phase explosive nitroguanidine [1–3].
Recently, there has been much interest in the blast characterization of various non-ideal high explosive(NIHE) materials. With non-ideals, the detonation reaction zone is significantly larger (up to several cmfor ANFO) than more ideal explosives. Wave curvature, induced by charge-geometry, can significantlyaffect the energy release associated with NIHEs. To measure maximum NIHE energy release accurately,it is desirable to minimize any such curvature and, if possible, to overdrive the detonation shock to ensure
Correspondence to: [email protected] 1
Jackson Planar Blast Scaling
completion of chemical reactions ahead of the sonic locus associated with the reaction zone. This isachieved in the current study through use of a powerful booster HE and a charge geometry consisting ofshort cylindrical lengths of NIHE initiated along the charge centerline.
2 Blast Scaling Theory
Blast scaling concepts were first developed almost a century ago [4] and understanding of the theory hasbeen significantly improved since that time [5–7]. In this study, we consider the dimensionless groupthat characterizes the propagation of a shock front from an intense explosion [6].
Π =r(
Eρ0
)1/(2+ν)t(2/2+ν)
(1)
The group is self-similar and consists of four variables: E, the source energy; ρ0, the ambient atmo-spheric density; r, the distance of the shock front from the source; and t, the time from energy release.The parameter ν is a dimension-dependent index corresponding to 1, 2, or 3 for blast waves of pla-nar, cylindrical, or spherical symmetry, respectively. The source energy accordingly has dimensions ofMT−2, MLT−2, or ML2T−2 where M is mass, L is length, and T is time.
Proceeding in the planar geometry approximated by a quasi-planar shock propagating longitudinallyinside a tube
r =
(αE
ρ0
)1/3
t2/3 (2)
where the proportionality constant α = f(ν, γ) and γ is the atmospheric ratio of specific heats.
Differentiation with respect to time yields
Us =2
3
√αE
ρ0
1√r
(3)
where Us is the shock velocity.
For a strong shock (M2s � 1) in a perfect gas,
P
P0→ 2γ
γ + 1M2s (4)
where Ms is the shock Mach number, P0 is the ambient pressure, and P is the post shock pressure.Equations 3 and 4 combine to form
P =8
9
(1
γ + 1
)(αE0
A
)1
r(5)
Thus, the postshock pressure of a planar blast wave is inversely proportional to r. The planar energyE has been replaced by the physical energy release E0 (with the standard dimensions of ML2T−2)normalized by the cross-sectional area of the tube A. In this study, α is unity [6].
23rd ICDERS July 24-29, 2011 Irvine 2

Jackson Planar Blast Scaling
Figure 1: The shock tube.
Test chargeBooster
Detonatord
L
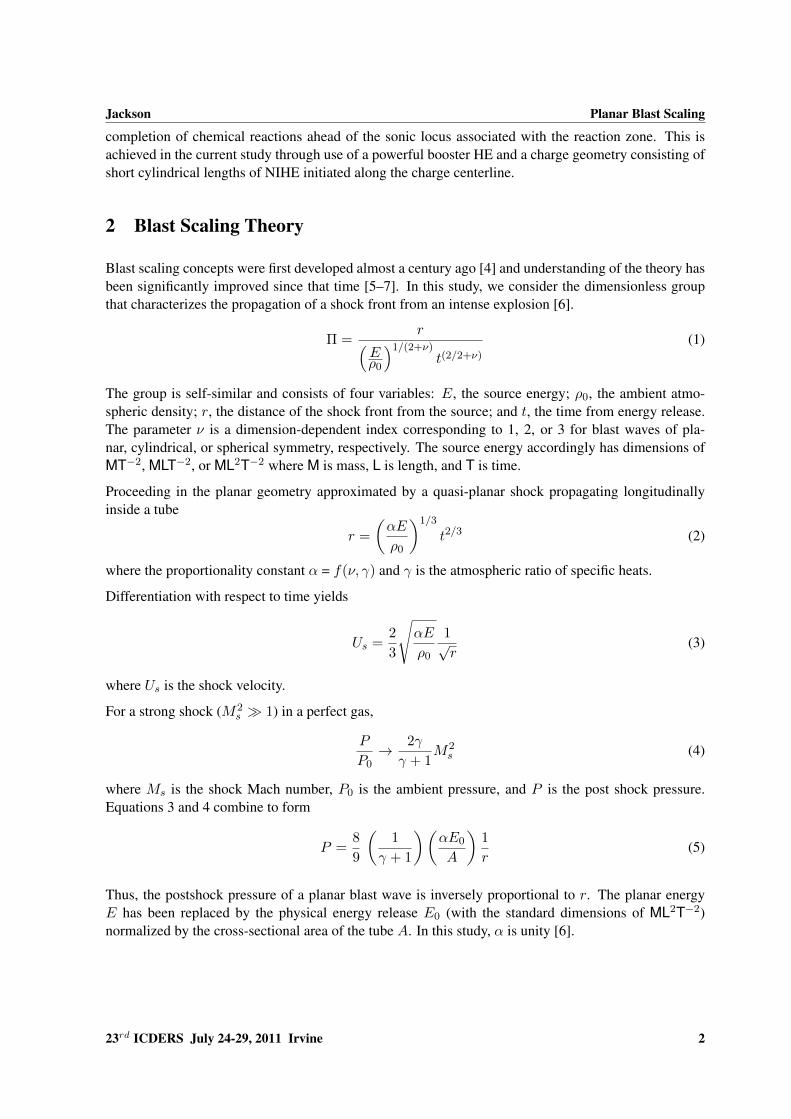
Figure 2: The axisymmetric charge geometry.
3 Experiment and Results
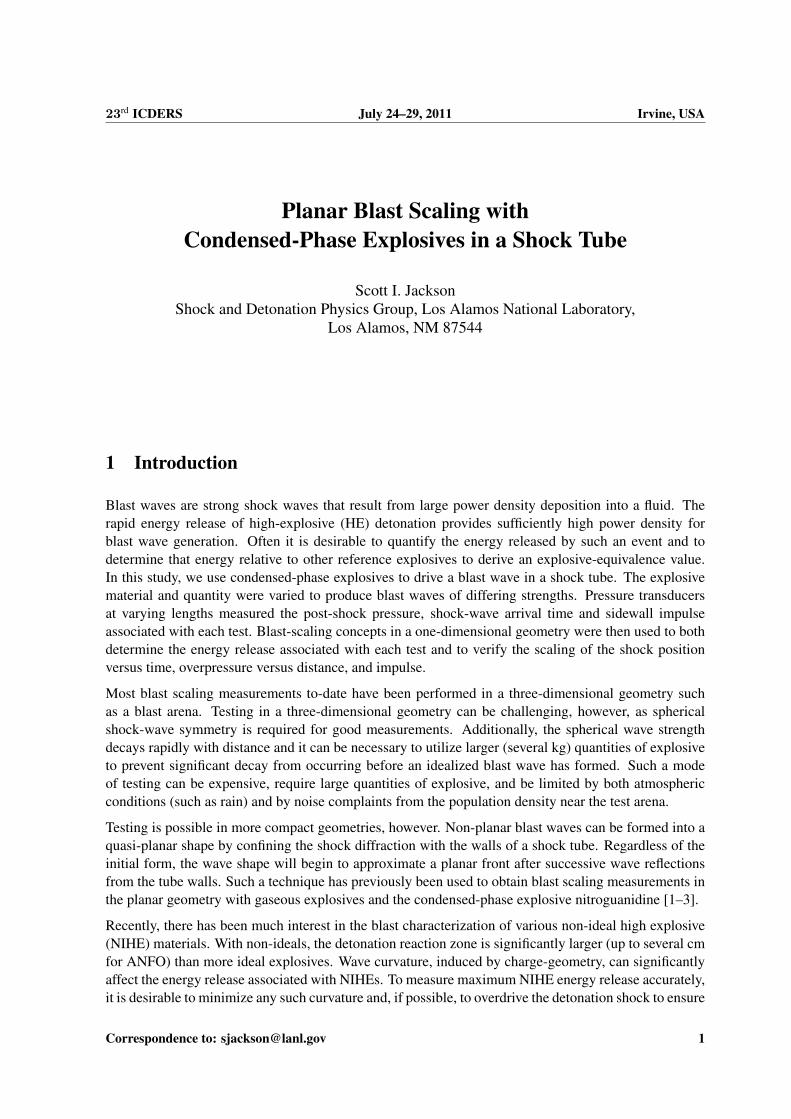
Data in the current study were obtained from tests in a shock tube with a 15.2-cm inner diameter and alength of 5.1 m. The working fluid was atmospheric air at Los Alamos atmospheric pressure (nominally0.777 bar). Special consideration was used in the design to prevent plastic deformation of the facility dueto the locally high-pressures near the condensed-phase detonation and to minimize the effect of structuralnoise on the measurements. Pressure transducers recorded the time-resolved shock overpressure as afunction of distance and were located 0.64, 1.64, 2.64, 3.64, 4.64 and 5.04 m from the upstream end ofthe tube. The shock tube is shown inside of a blast chamber in Fig. 1.
Testing was performed for both ideal and non-ideal explosives. Ideal explosives tested included HMX-based PBX 9501 and PBX 9404, as well as RDX-based Composition 4 (C4) and PBX 9407. Non-idealexplosives tested included powdered, stoichiometric mixtures of potassium perchlorate (KClO4) bal-anced with sugar (C12H22O11), sodium perchlorate (NaClO4) balanced with sugar, and ANFO (ammonium-nitrate-fuel-oil). Non-ideals were boosted (and significantly overdriven) by the PBX HEs. Explosivequantities fielded ranged from 2.5–51.0 g and at least three different masses of each charge were tested.
1 2 3 4 5 60
10
20
30
40
Pre
ssure
(bar
)
Distance (m)
Fit to data
JWL (cylinder tests)
Cheetah
Figure 3: Comparison of Eq. 5 fit.
E0(m) = 2.05m + 40.5
0
20
40
60
80
100
120
0 5 10 15 20 25 30 Test explosive mass (g)
Ener
gy re
leas
e (k
J)
Booster contribution
Figure 4: Determination of ∆Hdet for an HE.
23rd ICDERS July 24-29, 2011 Irvine 3
Jackson Planar Blast Scaling
As some of the non-ideal mixtures were tested at diameters below their unconfined failure diameterlimit, charges were formed into right cylinders with length-to-diameter ratios less than unity in order toprevent significant wave decay before the charge was consumed. Consoldiated charges were not con-fined and powdered ones were contained with a single layer of copy paper. The charge geometry isshown in Fig. 2. Additional details are given in Ref. 8.
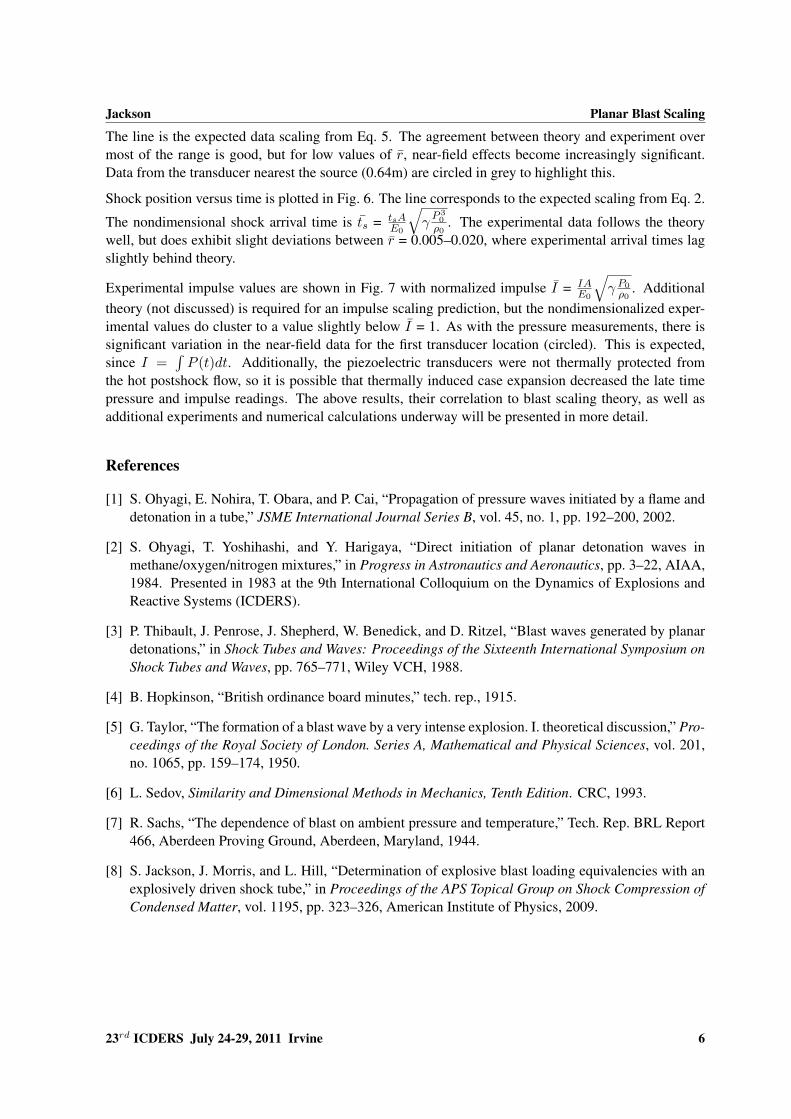
For a given condensed-phase detonation in the shock tube, measurement of shock arrival times ts or Pversus r along with Eqs. 2 or 5, respectively, allow determination of the released detonation energy E0
that couples to the gas in the shock tube. In this study, E0 values were derived from P measurements.For a given test, Eq. 5 was fit to the peak P values varying only E0. The E0 fit is shown for a 25gC4 shot in Fig. 3 and lies in between a prediction from the thermochemical code Cheetah and cylindertest experiments. For each explosive main charge series, identical boosters were used and linear fittingwas then performed over all E0 values to determine the specific energy or heat of detonation ∆Hdet
associated with the known booster and main charge masses (NaClO4 data is shown in Fig. 4). They-intercept of the fit corresponds to the booster energy, while the line slope was ∆Hdet of the maincharge. The experimentally measured ∆Hdet values agreed well with accepted values for the PBX andC4 explosives obtained from calculation and other experiment. Additionally, all energy versus mass datafit well to a straight line (Fig. 4), indicating consistent ∆Hdet measurements from test-to-test.
Since the flow is self-similar, experiments of different planar explosion lengths E/P0 are expected tocollapse together when nondimensionalized. Poor correlation or deviations from the theoretical curveindicate the failure of theoretical assumptions. Such an approach may seem circular, given that E0
values were determined by fitting to theory. This is not the case, however. Each E0 applies to allexperimental P data from a test, consisting of at least four measurements that were collected over arange of normalized distance r. Thus, it is possible for specific P values to not follow theory. It is alsonoted that the fit correlation shown in Fig. 4 is characteristic of all datasets, indicating little variation inthe specific energies measured in each test.
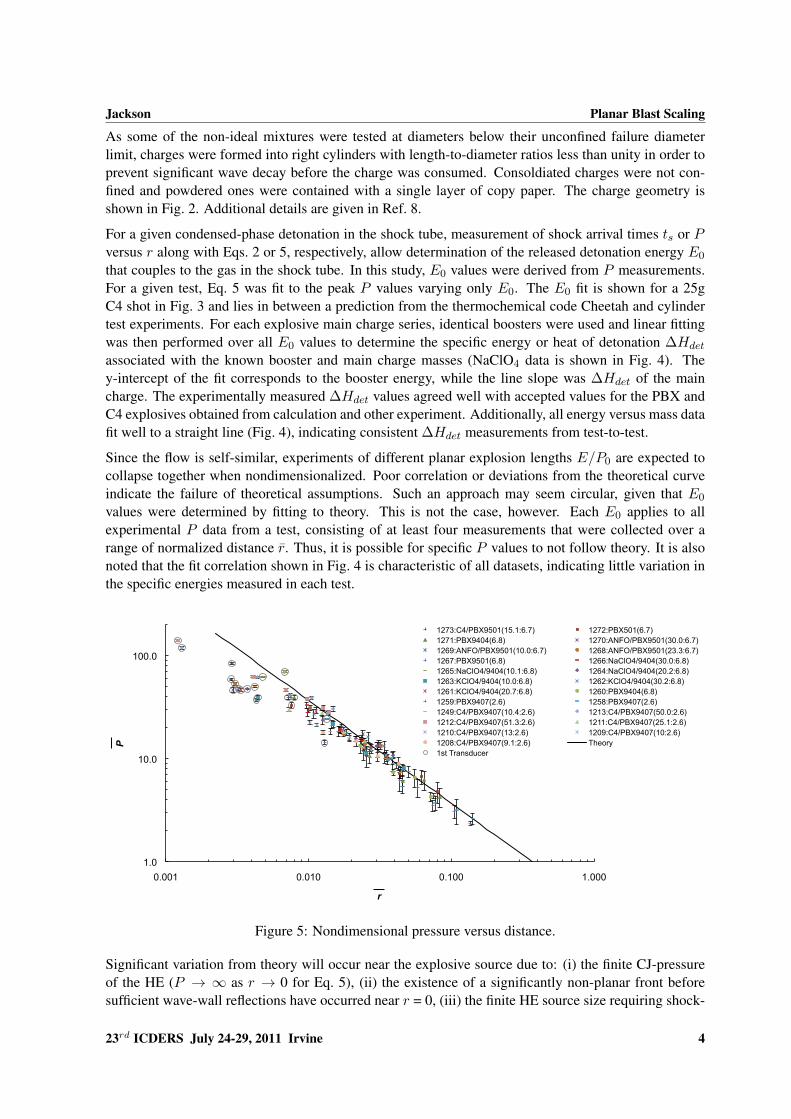
1.0
10.0
100.0
0.001 0.010 0.100 1.000
P
r
1273:C4/PBX9501(15.1:6.7) 1272:PBX501(6.7)
1271:PBX9404(6.8) 1270:ANFO/PBX9501(30.0:6.7)
1269:ANFO/PBX9501(10.0:6.7) 1268:ANFO/PBX9501(23.3:6.7)
1267:PBX9501(6.8) 1266:NaClO4/9404(30.0:6.8)
1265:NaClO4/9404(10.1:6.8) 1264:NaClO4/9404(20.2:6.8)
1263:KClO4/9404(10.0:6.8) 1262:KClO4/9404(30.2:6.8)
1261:KClO4/9404(20.7:6.8) 1260:PBX9404(6.8)
1259:PBX9407(2.6) 1258:PBX9407(2.6)
1249:C4/PBX9407(10.4:2.6) 1213:C4/PBX9407(50.0:2.6)
1212:C4/PBX9407(51.3:2.6) 1211:C4/PBX9407(25.1:2.6)
1210:C4/PBX9407(13:2.6) 1209:C4/PBX9407(10:2.6)
1208:C4/PBX9407(9.1:2.6) Theory
1st Transducer
Figure 5: Nondimensional pressure versus distance.
Significant variation from theory will occur near the explosive source due to: (i) the finite CJ-pressureof the HE (P → ∞ as r → 0 for Eq. 5), (ii) the existence of a significantly non-planar front beforesufficient wave-wall reflections have occurred near r = 0, (iii) the finite HE source size requiring shock-
23rd ICDERS July 24-29, 2011 Irvine 4

Jackson Planar Blast Scaling
steepening for a well-formed shock front (planar blast scaling theory assumes energy release along aplane of zero thickness), (iv) the “piston-effect” from the expansion of HE product gas, (v) and thebreakdown of the perfect gas assumption at high temperature. These near-field effects will not scalewith above theory and are best modeled numerically. Deviations in the far-field can also occur as thestrong shock approximation is not longer met, requiring acoustic models [3].
1.00E-05
1.00E-04
1.00E-03
1.00E-02
1.00E-01
0.001 0.010 0.100
t s
r
!"#$%&'#(%"#)*+,-"./+0)1'+2"(%3"#+4'5(6(+7%&'+
1273:C4/PBX9501(15.1:6.7) 1272:PBX501(6.7)
1271:PBX9404(6.8) 1270:ANFO/PBX9501(30.0:6.7)
1269:ANFO/PBX9501(10.0:6.7) 1268:ANFO/PBX9501(23.3:6.7)
1267:PBX9501(6.8) 1266:NaClO4/9404(30.0:6.8)
1265:NaClO4/9404(10.1:6.8) 1264:NaClO4/9404(20.2:6.8)
1263:KClO4/9404(10.0:6.8) 1262:KClO4/9404(30.2:6.8)
1261:KClO4/9404(20.7:6.8) 1260:PBX9404(6.8)
1259:PBX9407(2.6) 1258:PBX9407(2.6)
1257:PBX9407(2.6) 1256:PBX9407(2.6)
1249:C4/PBX9407(10.4:2.6) 1213:C4/PBX9407(50.0:2.6)
1212:C4/PBX9407(51.3:2.6) 1211:C4/PBX9407(25.1:2.6)
1210:C4/PBX9407(13:2.6) 1209:C4/PBX9407(10:2.6)
1208:C4/PBX9407(9.1:2.6) Theory
Figure 6: Nondimensional shock position versus time.
0.0010
0.0100
0.1000
1.0000
10.0000
0.001 0.010 0.100
I
r
!"#$%&'#(%"#)*+,&-.*('+/'0(.(+1%&'+
1273:C4/PBX9501(15.1:6.7) 1272:PBX501(6.7)
1271:PBX9404(6.8) 1270:ANFO/PBX9501(30.0:6.7)
1269:ANFO/PBX9501(10.0:6.7) 1268:ANFO/PBX9501(23.3:6.7)
1267:PBX9501(6.8) 1266:NaClO4/9404(30.0:6.8)
1265:NaClO4/9404(10.1:6.8) 1264:NaClO4/9404(20.2:6.8)
1263:KClO4/9404(10.0:6.8) 1262:KClO4/9404(30.2:6.8)
1261:KClO4/9404(20.7:6.8) 1260:PBX9404(6.8)
1259:PBX9407(2.6) 1258:PBX9407(2.6)
1257:PBX9407(2.6) 1256:PBX9407(2.6)
1249:C4/PBX9407(10.4:2.6) 1213:C4/PBX9407(50.0:2.6)
1212:C4/PBX9407(51.3:2.6) 1211:C4/PBX9407(25.1:2.6)
1210:C4/PBX9407(13:2.6) 1209:C4/PBX9407(10:2.6)
1208:C4/PBX9407(9.1:2.6) 1st transducer
Figure 7: Nondimensional impulse versus distance.
The pressure correlation was previously demonstrated with a more limited data set [8]. Figure 5 containsadditional pressure data and shows the nondimensional pressure P = ∆P
P0, where ∆P = P − P0, versus
nondimensional radius r = rP0AE0
. The plot legend for each shot is of the form 〈shot identificationnumber〉:〈booster type〉/〈Main charge type〉(〈Booster mass in grams〉:〈Main charge mass in grams〉).
23rd ICDERS July 24-29, 2011 Irvine 5
Jackson Planar Blast Scaling
The line is the expected data scaling from Eq. 5. The agreement between theory and experiment overmost of the range is good, but for low values of r, near-field effects become increasingly significant.Data from the transducer nearest the source (0.64m) are circled in grey to highlight this.
Shock position versus time is plotted in Fig. 6. The line corresponds to the expected scaling from Eq. 2.
The nondimensional shock arrival time is ts = tsAE0
√γP 30ρ0
. The experimental data follows the theorywell, but does exhibit slight deviations between r = 0.005–0.020, where experimental arrival times lagslightly behind theory.
Experimental impulse values are shown in Fig. 7 with normalized impulse I = IAE0
√γ P0ρ0
. Additionaltheory (not discussed) is required for an impulse scaling prediction, but the nondimensionalized exper-imental values do cluster to a value slightly below I = 1. As with the pressure measurements, there issignificant variation in the near-field data for the first transducer location (circled). This is expected,since I =
∫P (t)dt. Additionally, the piezoelectric transducers were not thermally protected from
the hot postshock flow, so it is possible that thermally induced case expansion decreased the late timepressure and impulse readings. The above results, their correlation to blast scaling theory, as well asadditional experiments and numerical calculations underway will be presented in more detail.
References
[1] S. Ohyagi, E. Nohira, T. Obara, and P. Cai, “Propagation of pressure waves initiated by a flame anddetonation in a tube,” JSME International Journal Series B, vol. 45, no. 1, pp. 192–200, 2002.
[2] S. Ohyagi, T. Yoshihashi, and Y. Harigaya, “Direct initiation of planar detonation waves inmethane/oxygen/nitrogen mixtures,” in Progress in Astronautics and Aeronautics, pp. 3–22, AIAA,1984. Presented in 1983 at the 9th International Colloquium on the Dynamics of Explosions andReactive Systems (ICDERS).
[3] P. Thibault, J. Penrose, J. Shepherd, W. Benedick, and D. Ritzel, “Blast waves generated by planardetonations,” in Shock Tubes and Waves: Proceedings of the Sixteenth International Symposium onShock Tubes and Waves, pp. 765–771, Wiley VCH, 1988.
[4] B. Hopkinson, “British ordinance board minutes,” tech. rep., 1915.
[5] G. Taylor, “The formation of a blast wave by a very intense explosion. I. theoretical discussion,” Pro-ceedings of the Royal Society of London. Series A, Mathematical and Physical Sciences, vol. 201,no. 1065, pp. 159–174, 1950.
[6] L. Sedov, Similarity and Dimensional Methods in Mechanics, Tenth Edition. CRC, 1993.
[7] R. Sachs, “The dependence of blast on ambient pressure and temperature,” Tech. Rep. BRL Report466, Aberdeen Proving Ground, Aberdeen, Maryland, 1944.
[8] S. Jackson, J. Morris, and L. Hill, “Determination of explosive blast loading equivalencies with anexplosively driven shock tube,” in Proceedings of the APS Topical Group on Shock Compression ofCondensed Matter, vol. 1195, pp. 323–326, American Institute of Physics, 2009.
23rd ICDERS July 24-29, 2011 Irvine 6