plankton aerosol, cloud, ocean ecosystem mission: atmosphere measurements for … · 2018-12-28 ·...
TRANSCRIPT

Plankton Aerosol, Cloud, oceanEcosystem mission: atmospheremeasurements for air qualityapplications
Ali H. OmarMaria TzortziouOdele CoddingtonLorraine A. Remer
Ali H. Omar, Maria Tzortziou, Odele Coddington, Lorraine A. Remer, “Plankton Aerosol, Cloud, oceanEcosystem mission: atmosphere measurements for air quality applications,” J. Appl. Remote Sens.12(4), 042608 (2018), doi: 10.1117/1.JRS.12.042608.
Downloaded From: https://www.spiedigitallibrary.org/journals/Journal-of-Applied-Remote-Sensing on 12/28/2018Terms of Use: https://www.spiedigitallibrary.org/terms-of-use

Plankton Aerosol, Cloud, ocean Ecosystem mission:atmosphere measurements for air quality applications
Ali H. Omar,a,* Maria Tzortziou,b Odele Coddington,c andLorraine A. Remerd
aNASA Langley Research Center, Hampton, Virginia, United StatesbCity College of New York, New York, United States
cUniversity of Colorado, Boulder, Colorado, United StatesdUniversity of Maryland Baltimore County, Baltimore, Maryland, United States
Abstract. We present the instrumentation and products of the NASA Plankton Aerosol,Cloud, ocean Ecosystem (PACE) mission relevant to air quality management. Since PACEwill launch in the 2022 to 2023 timeframe, we discuss several activities in anticipation ofa robust air quality applications program using PACE products. Products from the PACEocean color imager and two multiangle polarimeters will be used synergistically to retrieve prop-erties relevant to air quality applications. These instruments provide high spectral and spatialresolution measurements used to derive key properties of aerosols and clouds including effectiveparticle radii, particle shapes, aerosol and cloud optical depths, refractive indices and singlescattering albedos, all of which are critical for characterizing airmasses for managing air quality,hazardous episodes of wildfire and volcanic emissions, and long range transport of pollution.Because of the number of products with potential societal benefits, the PACE mission is highlypertinent to NASA’s Applied Sciences Program’s efforts to promote, discover, and demonstrateinnovative, practical, and sustainable uses of the Earth observations. We discuss plans to supportthese efforts by establishing a prelaunch early adopter program and outline communication strat-egies to engage the air quality user community. © The Authors. Published by SPIE under a CreativeCommons Attribution 3.0 Unported License. Distribution or reproduction of this work in whole or in partrequires full attribution of the original publication, including its DOI. [DOI: 10.1117/1.JRS.12.042608]
Keywords: air quality; applications; ocean color imager; aerosol; cloud; polarimeter.
Paper 180460SS received Jun. 7, 2018; accepted for publication Aug. 24, 2018; published onlineOct. 10, 2018.
1 Introduction
NASA’s Plankton, Aerosol, Cloud, and ocean Ecosystem (PACE) mission will make globalocean color and atmospheric measurements to provide extended data records on ocean ecologyand global biogeochemistry, along with polarimetry measurements to provide advanced system-atic observations of aerosols and clouds. The PACE mission will monitor atmospheric processesresulting from the interaction of atmospheric gases, aerosols, and clouds with radiation. As such,applications developed using PACE observations will benefit a broad spectrum of public groups,including various local, state, federal, and international agencies, policy makers and implement-ers, the commercial sector, scientists, educators, and the general public. PACE atmosphericmeasurements will augment NASA’s satellite observations of aerosols and clouds and providea dataset that will be exploited for societal benefit applications beyond the science for whichthe instruments were designed. In addition, PACE atmospheric measurements will enhancemethods required to correct for the effects of absorbing and scattering aerosol in the Earth’satmosphere; these signals mask or alias ocean-color retrievals that prescribe the health of theEarth’s oceans.
The spatial and expanded spectral resolution, angular range and polarization measurementswill be attractive to atmospheric applications data users, such as air quality practitioners and
*Address all correspondence to: Ali H. Omar, E-mail: [email protected]
Journal of Applied Remote Sensing 042608-1 Oct–Dec 2018 • Vol. 12(4)
Downloaded From: https://www.spiedigitallibrary.org/journals/Journal-of-Applied-Remote-Sensing on 12/28/2018Terms of Use: https://www.spiedigitallibrary.org/terms-of-use
policy makers, the renewable energy sectors, hazard warning decision makers, scientists withinthe federal and state governments, and those responsible for regional and global climate changeprediction and mitigation. The high spectral range and resolution radiance measurements havepotential applications in the retrieval of column concentrations of trace gases and solar energyavailability. The insurance and reinsurance industry, policy makers, and protectors of thenation’s infrastructure are concerned about the large uncertainties of estimates of climate changeparameters (particularly temperature change and sea-level rise) and the local weather responsesto climate change. The radiative effects of aerosols and clouds have been identified as the largestsource of uncertainty in climate prediction.1,2 NASA’s assets have been an essential componentin ongoing research that addresses these large uncertainties due to aerosols and clouds. Thesesame cloud and aerosol observations will be used by regulatory agencies, resource managers,and weather forecasters for applications spanning a wide range of other societal benefits.Recognizing this potential, the 2007 Decadal Survey report3 specifically poses a fundamentalchallenge to ensure that “societal needs help to guide scientific priorities more effectively andthat emerging scientific knowledge is actively applied to obtain societal benefits.” The 2017Decadal Survey4 also affirms that “improved capacity for transitioning science to applicationswill make it possible to more quickly and effectively achieve the societal benefits of scientificexploration.” In the report, PACE is a program of record, i.e., a previously planned observation,which will form the foundation of the next decade’s observing system.
PACE atmospheric measurements will continue the heritage of aerosol measurements used toaddress air quality, long-range transport of pollution, and volcanic ash hazards for aviationsafety. These measurements will also provide continuity in the cloud measurements record.The PACE measurements will provide new retrieval characterization information to researchersthat will further reduce uncertainties in climate prediction, particularly for aerosols and augmentretrievals by other NASA and NOAA satellites to provide direct benefits to society. Due to itshigh spectral resolution, broad spectral range and spatial coverage, and high radiometric accu-racy, PACE will provide a better characterization of aerosol than can be obtained from moderateresolution imaging spectroradiometer (MODIS)5 or ozone monitoring instrument (OMI),6 andover a broader swath than is provided by multiangle imaging spectroradiometer (MISR).7 Thiswill lead to better assessments of the local and regional air quality and public health risk, andbetter characterization of hazards to aid in issuing disaster warnings for public safety, all ofwhich will improve the ability of decision makers to manage natural resources and protect publichealth and property. The spectral and spatial resolution of PACE measurements will also beuseful in coastal and urban areas where there are large gradients in air quality and wherethe air masses merge. This is particularly important as the nation sees an unprecedented growthin its coastal population. In 1999, 55% to 60% of Americans lived in 772 counties adjacent to theAtlantic and Pacific Oceans, the Gulf of Mexico, and the Great Lakes. By the year 2025, nearly75% of Americans are expected to live in coastal counties. These counties already contain 14 ofthe country’s 20 largest metropolitan areas.8 Additional PACE products that will be used toinform safety agencies, including volcanic eruption events, were identified in the PACEScience Definition Team Report.9
2 Plankton, Aerosol, Cloud, and Ocean Ecosystem Instrument Suite
PACE is being implemented as a NASA class C mission with a notional launch date in the 2022to 2023 timeframe and a minimum mission duration of 3 years, with orbit maintenance capa-bilities for 10 years. The nominal spacecraft altitude is 676.5 km (420 miles) with an inclinationof 98 deg. The primary science instrument for PACE is the ocean color instrument (OCI) that willmeasure the intensity of reflected light from the ultraviolet to the shortwave infrared (i.e., 350 to2250 nm). The OCI has a ground sample distance ≤1 km2 at nadir with a spectral resolution of5-nm resolution between 350 and 890 nm, and SWIR bands centered on 940, 1038, 1250, 1380,1615, 2130, and 2260 nm. It has an ideal blue–red spectrograph transition range with imageartifacts <0.5% at calibrated, top of atmosphere radiances. The imager has two 2-μm bands toimprove retrievals of cloud thermodynamic phase,10 which are historically performed usinga combination of infrared measurements along with visible and near-infrared measurements.Additional features under consideration include extending the spectral range to ∼315 nm
Omar et al.: Plankton Aerosol, Cloud, ocean Ecosystem mission. . .
Journal of Applied Remote Sensing 042608-2 Oct–Dec 2018 • Vol. 12(4)
Downloaded From: https://www.spiedigitallibrary.org/journals/Journal-of-Applied-Remote-Sensing on 12/28/2018Terms of Use: https://www.spiedigitallibrary.org/terms-of-use

and reducing the sampling interval from 5 to 1.25 nm in some spectral ranges. This variablespectral super-sampling will enhance aerosol property retrievals, thereby improving atmosphericcorrection results. OCI will have a 2-day global coverage at 60-deg instrument view angle. PACEwill also have two multiangle polarimeters (MAPs): the spectropolarimeter for planetary explo-ration (SPEXone) contributed by the Netherlands, and the hyper angular rainbow polarimeter(HARP-2) contributed by the University of Maryland, Baltimore County. The two polarimetersare in the microsatellites class (10 to 100 kg) and will be integrated into the PACE spacecraft bus.Because the polarimeters are integrated on the spacecraft bus, the design duration of operation islonger than a free flying cubesat. Polarimeters measure the rotation of polarized light as it passesthrough clouds, aerosols, the upper layers of the ocean, or any optically active medium. Themeasured rotation can be used to retrieve the optical properties of the medium. The PACE polar-imeters are very compact but differ in their spatial and spectral resolution, viewing angles, andswath width capabilities and therefore contribute complimentary capabilities for retrieving orenhancing retrievals of PACE products. HARP-2 is a hyperangular instrument with a wideswath and discrete spectral bands, whereas SPEXone is a hyperspectral instrument with a narrowswath and discrete viewing angles (Table 1).
For air quality studies, the two MAP instruments in conjunction with OCI will be exceptionalfor aerosol characterization. HARP-2 will provide a larger field of view for aerosol and cloudobservations and, along with the hyperangular viewing, will enable retrieval of key cloudmicrophysical properties such as cloud droplet size, ice particle shape and roughness, andenhanced thermodynamic phase retrievals.11 The SPEXone instrument nearly completelycharacterizes the aerosol and cloud optical properties including the stokes I, Q, and U param-eters at multiple wavelengths and scattering angles. Table 2 shows the PACE measurementproducts and their potential applications. Retrievals from SPEXone will include, for aerosols:single scattering albedo, effective radius, refractive indices, aerosol optical depth, aerosol layerheight, and for clouds: cloud optical thickness, effective radius, effective variance, and cloudphase, respectively.
3 Applications of Plankton, Aerosol, Cloud, and Ocean Ecosystem Data
Observations from the PACE mission are highly relevant to the Applied Sciences Program (ASP)within NASA’s Earth Science Directorate and the programs’ efforts to promote, discover, anddemonstrate innovative, practical, and sustainable uses of the Earth observations. The ASP pro-gram sponsors applied science research and applications projects to enable near-term uses of theEarth observations in the nine interagency U.S. Group on Earth Observations (USGEO) SocietalBenefit Areas (SBAs): agriculture, climate, disasters, ecological forecasting, energy, health,oceans, water resources, and weather. PACE atmosphere measurements are highly relevantto six of these thematic areas: health (including Air Quality), disasters, ecological forecasting,climate, ocean, and water resources. The ASP sponsored projects include formulation of newapplications, integration of Earth observations and related products in practitioners’ decisionmaking, transitioning applications to operations, and developing plans for sustainability.
Table 1 Specifications of SPEXone and HARP-2.
HARP-2 SPEXone
Ground sample distance 3 km 2.5 km
Spectral range [resolution] 440, 550, 670 nm [10 nm] and870 nm [40 nm]
385 to 770 nm[hyperspectral 2 nm]
Number of viewingangles [degrees]
20 for 440, 550, 870 nm and60 for 670 nm [spaced over 114 deg]
5 [−57 deg, −20 deg,0 deg, 20 deg, 57 deg]
Coverage [swath width] 94 deg [1550 km] 9 deg [100 km]
Attributes Hyperangular and wide swath Hyperspectral and narrow swath
Omar et al.: Plankton Aerosol, Cloud, ocean Ecosystem mission. . .
Journal of Applied Remote Sensing 042608-3 Oct–Dec 2018 • Vol. 12(4)
Downloaded From: https://www.spiedigitallibrary.org/journals/Journal-of-Applied-Remote-Sensing on 12/28/2018Terms of Use: https://www.spiedigitallibrary.org/terms-of-use

The projects are carried out in partnership with public- and private-sector organizations toachieve sustained use and sustained benefits from the Earth observations. The area also addressesthe effects of climate change on air quality and public health to achieve sustained use and ben-efits from Earth observations, ranging from the long-term effects of climate change on air qualityand health, to more immediate support for public health-related decision-making. The NaturalDisaster Application area uses NASA’s capabilities in spaceborne, airborne, surface observa-tions, and higher-level derived data products to improve natural disaster forecasting, mitigation,and response. Two examples, air quality and disaster monitoring using PACE measurements, arediscussed next.
4 Improving Ambient Air Quality Monitoring and Trends
The U.S. EPA, NOAA, National Park Service (NPS), and tribal, state, and local agencies haverecently developed nationwide daily air quality forecasts and near real-time reporting of airquality through the use of air quality indices (AQI, see also Ref. 12). This information is
Table 2 Potential applications of PACE atmospheric measurements from the OCI and MAP.
PACE measurement Instrument Application for societal benefit
Aerosol properties
Aerosol optical depth OCI/MAP Air quality, visibility, public health
Aerosol size distribution OCI/MAP Air quality, public health
Aerosol type OCI/MAP Air quality, visibility
Aerosol layer height OCI (O2 A Band), MAP Air quality, pollution transport,public health
Aerosol absorption fromUV similar to OMI
OCI Air quality, public health
Cloud properties
Cloud optical depth OCI Visibility, convection/precipitation
Cloud effective particle size OCI/MAP Convection/precipitation
Effective variance of cloudparticle size distribution
MAP Convection/precipitation
Ice crystal shape MAP Convection/precipitation
Cloud thermodynamic phase OCI/MAP Convection/precipitation
Cloud top height/pressure OCI (O2 A Band) Convection/precipitation
Trace gases—ozone, NO2, H2O[column measurements]
OCI Air quality, public health, humidityestimates for aerosol modeling studiesand air quality forecasting, visibility
Volcanic ash advisories OCI, MAP Disaster monitoring/warning
Solar energy availability OCI/MAP Renewable energy (cloud products)
Stratospheric aerosol concentration (SWIR, MAP) Climate
Ash concentrations from Limb scattering MAP Disaster monitoring/warning
Assimilation of radiances andderived products for weather forecasting
OCI/MAP Weather forecasting(NCEP, NWS, NRL, and ECMWF)
Imagery OCI Disaster monitoring/warning
Omar et al.: Plankton Aerosol, Cloud, ocean Ecosystem mission. . .
Journal of Applied Remote Sensing 042608-4 Oct–Dec 2018 • Vol. 12(4)
Downloaded From: https://www.spiedigitallibrary.org/journals/Journal-of-Applied-Remote-Sensing on 12/28/2018Terms of Use: https://www.spiedigitallibrary.org/terms-of-use

disseminated by the EPA through the AirNow system that produces a daily AQI from groundmeasurements and satellite data to advise society about how clean or polluted the air is, and itsassociated health effects. The high spectral and spatial resolution of PACE measurements espe-cially in densely populated coastal regions will improve the accuracy and availability of AQI.Effective use of these products will require that the data are accessible to operational users in theright format as soon as possible.
Aerosol with aerodynamic diameters <2.5 μm, commonly referred to as PM2.5 by air qualitypractitioners, are a federally regulated pollutant due to their deleterious effects on humanhealth.13,14 MODIS and MISR aerosol retrievals have already been combined with ground-based monitoring network and the space-based Cloud-Aerosol Lidar and Infrared PathfinderSatellite Observations (CALIPSO) data, as well as models to estimate PM2.5 over the continentalUS and globally.15,16 A common approach for estimating the PM2.5 concentrations17 at thesurface involves the use of spatially and temporally resolved correction factors (η) betweenground-level PM2.5 mass concentration and satellite-retrieved column integrated AOD suchthat
EQ-TARGET;temp:intralink-;e001;116;556PM2.5 ¼ η × AOD; η ¼ PMmodel2.5
AODmodel: (1)
The correction factors are determined from model-derived ground-level PM2.5 mass concen-tration and column-integrated AOD. Continuity of these measurements using PACE andother NASA satellites will allow NASA and US policymakers to determine the effectivenessof pollution reduction initiatives. For example, PACE data could be used to extend the afore-mentioned MODIS and MISR PM2.5 estimates and provide insights into the decadal trends inpopulation exposure to PM2.5 and associated health effects.
PACE measurements will also have direct applications in near-real-time monitoring of airpollution. AQI provide the public with easy access to national ambient air quality information,namely real-time and forecasted air quality conditions. Integration of future satellite data (e.g.,TEMPO and PACE) with these databases will continue these forecasts, enabling public aware-ness of potentially deleterious air quality events that can adversely affect susceptible individuals.Figure 1 shows that, although substantial progress has been made to use satellite data to predictair quality for most of the country, a large area (shown in red) still lacks coverage. Thereare substantial health benefits for people who take protective action to avoid exposure tohigh outdoor PM2.5 concentrations. Shaded red areas in Fig. 1 are regions for which AirNowprovides no air quality information, because the prediction standard error is > ∼ 5 μg∕m3
(the U.S. National Ambient Air Quality PM2.5 Standard is 35 μg∕m3 for 24 h average).
Fig. 1 AirNow surface PM2.5 observations (black dots). The red areas are gaps in the data. Theseresults from a combination of missing ground sites and bright ground surfaces that precludeaccurate retrievals of aerosol properties from satellite observations (figure courtesy of PhilDickerson, EPA).
Omar et al.: Plankton Aerosol, Cloud, ocean Ecosystem mission. . .
Journal of Applied Remote Sensing 042608-5 Oct–Dec 2018 • Vol. 12(4)
Downloaded From: https://www.spiedigitallibrary.org/journals/Journal-of-Applied-Remote-Sensing on 12/28/2018Terms of Use: https://www.spiedigitallibrary.org/terms-of-use
5 Improving Hazard Assessment and Aviation Safety
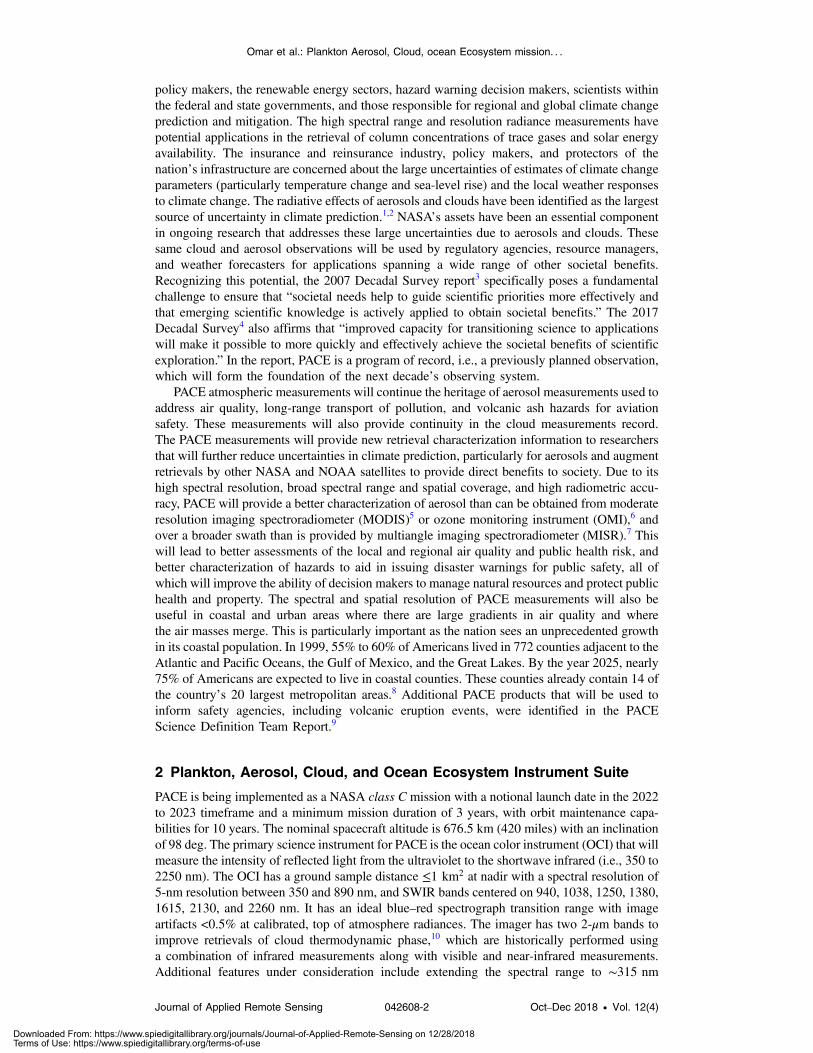
Aviation operations are significantly impacted by volcanic eruptions, as evident from theEyjafjallajökull volcano in Iceland (April 2010). The Eyjafjallajökull plume was observed bymany satellite sensors including OMI, MISR, MODIS, CALIPSO, and Spinning EnhancedVisible Infrared Imager (SEVIRI).18–23 Figure 2 is an image of the Eyjafjalljökull volcanoash plume plotted using MISR data retrieved on April 19, 2010.
The figure shows increasing information content moving from a camera image in the firstpanel to the identification of nonspherical particles (indicative of volcanic ash) in the fourthpanel. Multiangle, multispectral measurements provide critical information about particlesize and by inference particle type. Volcanic plumes of the H2SO4 particles (small water-solubleparticles) are far less hazardous to aircraft than plumes consisting of ash particles (large silicabased particles). Ingestion of these particles into engines causes them to melt in the combustionchamber and then to solidify on turbine blades, blocking air flow, and causing the engine to stall.So, while the small particles are relatively harmless, the large particles warrant a warning and insome cases shutting down affected airways. The PACE MAP will provide critical data for mak-ing decisions to safely manage airspace in the presence of volcanic hazards. Observations ofthe Eyjafjallajökull volcano in Iceland (April 2010) is a good example of how satellite data,including the OCI and MAP on PACE, can be used to provide appropriate aviation advisorieswith notable public safety and measurable economic benefits. Figure 2 shows MISR’s airmassmapping of the Eyjafjallajökull volcano on April 19, 2010. The MISR retrieval approach is basedon selecting aerosol optical models and corresponding aerosol optical depth that produce accept-able matches to the MISR-observed top of atmosphere equivalent reflectances. The hazardwarning for aviation that PACE will address are the long-lived plumes of ash that form afterthe eruption and are sustained in a lofted state for days. The imagery and characteristics ofthe aged plume from the PACE OCI and polarimeters will provide information about the locationand properties of the plumes to the Volcanic Ash Advisory Centers (VAACs). The VAACsdisseminate information on atmospheric volcanic ash clouds that may endanger aviation.This is similar to the imagery and characteristics provided by OMI, MISR, MODIS, SEVIRI,and CALIPSO for days after the Eyjafjallajökull volcanic eruption in 2010.
6 Engagement with Air Quality Communities
As a new mission, PACE products must necessarily be introduced to applied practitioners and,likewise, PACE scientists must be introduced to practitioners of societal benefit applications
Fig. 2 An example of MISR air mass mapping applied to the Eyjafjalljökull plume on April 19, 2010.24
Omar et al.: Plankton Aerosol, Cloud, ocean Ecosystem mission. . .
Journal of Applied Remote Sensing 042608-6 Oct–Dec 2018 • Vol. 12(4)
Downloaded From: https://www.spiedigitallibrary.org/journals/Journal-of-Applied-Remote-Sensing on 12/28/2018Terms of Use: https://www.spiedigitallibrary.org/terms-of-use

because the two groups (practitioners and scientists) will need to work together to maximize thebenefits of these products. The PACE mission will identify and engage potential user commun-ities (Communities of Practice) early in the PACE mission design and development process, toensure that the product suite and delivery mechanisms maximize the usefulness and societalvalue of PACE observations. Specific outreach activities, communication strategies such asthe use of succinct one-page white papers shown in Fig. 3, and community engagementapproaches have commenced. The objective of these communication strategies is to demonstratethe value of PACE products across a wide range of practical application areas and foster inter-actions between the PACE program, project team, science teams, operational users, resourcemanagers, policy makers, and other relevant stakeholders.
Specific activities to engage users include applications workshops, tutorials, town halls, jour-nal papers, and the popular press. The application workshops held biannually, provide feedbackto the PACE mission about PACE product applications, and the thematic areas in which theirproducts may be applied. These events provide a forum for the user groups to receive specificsupport and information on the utility of PACE OCI and polarimetry products. Online and offlinePACE applications tutorials will be available to the early adopter (EA) to provide detailed infor-mation on a particular topic, such as introduction to specific tools and utilities for working withPACE data. Tutorials define project product application opportunities and leverage innovationfor how to best combine datasets, models, and expertise for use in air quality applications. PACEscience and applications organized sessions, town halls, breakout sessions in widely attendedremote sensing and environmental science meetings are planned for the latter phases of the mis-sion. Outreach materials, including PACE Applications brochures and PACE product posterswill be distributed during conferences and meetings by applications and science team membersthroughout the life of the PACE mission.
Data workshops and short courses designed to prepare the community of practice and pro-vide hands-on instruction on data access and use of mission data products. PACE-simulateddatasets and scripts for processing and analyzing data that are customarily available to thewider science community will be disseminated at the data workshops and short courses. ThePACE applications team will encourage the development of additional tools specific to the appli-cations community by the early adopters, community of practice, science team members, andfederal partners. These tools will be distributed by a suitable NASA Distributed Active ArchiveCenter for use by the wider community. Online tools, user services, and data access willbe advertized and presented to the user community during the prelaunch phase (phase D),
Fig. 3 Examples of one-page white papers on specific PACE applications. These one page com-muniques present the application question/issue, why it is important, the needed measurementsand the NASA response for both atmosphere and ocean products of PACE.
Omar et al.: Plankton Aerosol, Cloud, ocean Ecosystem mission. . .
Journal of Applied Remote Sensing 042608-7 Oct–Dec 2018 • Vol. 12(4)
Downloaded From: https://www.spiedigitallibrary.org/journals/Journal-of-Applied-Remote-Sensing on 12/28/2018Terms of Use: https://www.spiedigitallibrary.org/terms-of-use

so familiarity with these services will be well established by the operational phase of the mission.Articles in peer-reviewed journals and the popular press, press-releases, announcements ordescriptions of the mission in newsletters, user forums, or other venues frequented by theuser community will be provided to the science communications team for single point dissemi-nation to the public. The PACE applications team will target key international user groups thatare mature, have solid missions and budgets, and can ensure that investments are made in newways of using OCI/polarimetry information from the PACE mission.
PACE will establish an EA program to engage the air quality community. The main goal ofthe EA program is to promote prelaunch applied research to facilitate feedback on PACE prod-ucts prelaunch, and accelerate the use of PACE products postlaunch. PACE EAs are defined asthose groups and individuals who have a direct or clearly defined need for PACE-like ocean coloror polarimetry data, have an existing application or new ideas for PACE-related applications, andintend to apply their own resources to demonstrate the utility of PACE data for their particularsystem or model. The goal of this designation is to accelerate the use and integration of PACEproducts into policy, decision-making, and scientific support settings by providing specific guid-ance to EAs who commit to engage in prereadiness studies that incorporate PACE data in theirapplications. EAs will connect to the PACE project through an informal letter of interest.
In the framework of the EA program, each EAwill provide an EA research project title withthe end user clearly identified, and a short abstract describing the societal benefit of the project.After selection, each EA will be partnered with a science team member who can provide guid-ance and information on project data and product development. Through this partnership, the EAprogram will be beneficial to both the PACE end users and the mission, as the EAs will receiveaccess to developmental products and interaction with the product developer enabling them to beamong the first to integrate the new PACE products into their systems. The science team mem-bers will gain a partner who can evaluate products and offer feedback from a functionality per-spective, as well as potential calibration and validation information. Through interactions withthe PACE science and applications teams, the EAs will be able to (i) get access to and resolveissues with PACE pre-launch simulated data products and (ii) report on the EA program suc-cesses, challenges, and progress during PACE science team and applications working groupmeetings. An impact workshop will be held with members of the EA program and otherkey stakeholders and user communities at the start of flight phase of the mission, to assess met-rics upon which quantitative values of the impact of project products on decision-making can becompared. Key stakeholders from the EPA, NOAA, NRL, and NASA have expressed interest inPACE data for applications. We conducted an informal survey of the air quality applicationscommunity and found that they are inclined to use PACE aerosol products if these are producedand delivered to the community with specifications (resolution, latency, and format) similar toMODIS. Since systems to ingest and analyze MODIS products are already in place, the use ofsuch PACE products will leverage existing infrastructure and expertise at very little cost.
7 Conclusion
PACE atmospheric measurements will provide the community with a unique dataset that will beexploited for air quality applications, beyond the science for which the instruments weredesigned. The spectral and spatial resolution of PACE measurements will meet current require-ments for air quality applications, and will particularly be useful in coastal and urban areas withlarge gradients in air quality and for regions of the country where high-quality, real-time mon-itoring of air quality is currently lacking. The OCI and multiangle polarimeters on PACE willprovide critical information about particle size, shape, and optical depth from which informationabout air mass characteristics can be inferred to inform policy on air quality, disaster mitigation,and hazard avoidance. In addition to augmenting and continuing NASA’s satellite observationsof aerosols and clouds, PACE products will address the large uncertainties of estimates of climatechange parameters and the local weather responses to climate change relevant to applicationsfor the insurance and reinsurance industry, and to policy makers, and protectors of the nation’sinfrastructure. A fairly robust plan to disseminate information to air quality managers and toattract and engage the air quality community through an EAs program has been developed.
Omar et al.: Plankton Aerosol, Cloud, ocean Ecosystem mission. . .
Journal of Applied Remote Sensing 042608-8 Oct–Dec 2018 • Vol. 12(4)
Downloaded From: https://www.spiedigitallibrary.org/journals/Journal-of-Applied-Remote-Sensing on 12/28/2018Terms of Use: https://www.spiedigitallibrary.org/terms-of-use

References
1. IPCC, Climate Change 2007: The Physical Basis. Contribution of Working Group I to theFourth Assessment Report of the Intergovernmental Panel of Climate Change, p. 996,Cambridge University Press, Cambridge; New York (2007).
2. O. Boucher et al., Clouds and Aerosols Supplementary Material. Climate Change 2013:The Physical Science Basis. Contribution of Working Group I to the Fifth AssessmentReport of the Intergovernmental Panel on Climate Change, Cambridge University Press,New York (2013).
3. National Research Council, Earth Science and Applications from Space: NationalImperatives for the Next Decade and Beyond, p. 454, The National Academies Press,Washington, DC (2007).
4. National Academies of Sciences, Engineering, and Medicine, Thriving on Our ChangingPlanet: A Decadal Strategy for Earth Observation from Space, p. 700, The NationalAcademies Press, Washington, DC (2018).
5. Y. J. Kaufman et al., “Operational remote sensing of tropospheric aerosol over land fromEOS moderate resolution imaging spectroradiometer,” J. Geophys. Res.: Atmos. 102(D14),17051–17067 (1997).
6. P. F. Levelt et al., “Science objectives of the ozone monitoring instrument,” IEEE Trans.Geosci. Remote Sens. 44(5), 1199–1208 (2006).
7. D. J. Diner et al., “Multi-angle imaging spectroradiometer (MISR) instrument descriptionand experiment overview,” IEEE Trans. Geosci. Remote Sens. 36(4), 1072–1087 (1998).
8. N. M. Foster, B. Cicin-Sain, and R. W. Knecht, Trends and Future Challenges for U.S.National Ocean and Coastal Policy August 1999, DIANE Publishing, Collingdale,Pennsylvania (1999).
9. https://pace.oceansciences.org/docs/pace_sdt_report_final.pdf.10. O. M. Coddington et al., “Characterizing the information content of cloud thermodynamic
phase retrievals from the notional PACE OCI shortwave reflectance measurements,”J. Geophys. Res.: Atmos. 122(15), 8079–8100 (2017).
11. B. van Diedenhoven et al., “Remote sensing of ice crystal asymmetry parameter usingmulti-directional polarization measurements—part 2: application to the Research ScanningPolarimeter,” Atmos. Chem. Phys. 13(6), 3185–3203 (2013).
12. http://airnow.gov/.13. C. A. Pope, M. Ezzati, and D. W. Dockery, “Fine-particulate air pollution and life
expectancy in the United States,” N. Engl. J. Med. 360(4), 376–386 (2009).14. A. Seaton et al., “Particulate air-pollution and acute health effects,” Lancet 345(8943),
176–178 (1995).15. Y. Liu et al., “Estimating fine particulate matter component concentrations and size
distributions using satellite-retrieved fractional aerosol optical depth: part 2 - a case study,”J. Air Waste Manag. Assoc. 57(11), 1360–1369 (2007).
16. A. van Donkelaar et al., “Global estimates of ambient fine particulate matter concentrationsfrom satellite-based aerosol optical depth: development and application,” Environ. HealthPerspect. 118(6), 847–855 (2010).
17. B. L. Boys et al., “Fifteen-year global time series of satellite-derived fine particulate matter,”Environ. Sci. Technol. 48(19), 11109–11118 (2014).
18. A. Ansmann et al., “Ash and fine-mode particle mass profiles from EARLINET-AERONETobservations over central Europe after the eruptions of the Eyjafjallajökull volcano in 2010,”J. Geophys. Res. 116, D00U02 (2011).
19. A. Stohl et al., “Determination of time- and height-resolved volcanic ash emissions andtheir use for quantitative ash dispersion modeling: the 2010 Eyjafjallajökull eruption,”Atmos. Chem. Phys. 11(9), 4333–4351 (2011).
20. H. Flentje et al., “The Eyjafjallajokull eruption in April 2010-detection of volcanic plumeusing in-situ measurements, ozone sondes and lidar-ceilometer profiles,” Atmos. Chem.Phys. 10(20), 10085–10092 (2010).
21. R. A. Kahn and J. Limbacher, “Eyjafjallajökull volcano plume particle-type characterizationfrom space-based multi-angle imaging,” Atmos. Chem. Phys. 12(20), 9459–9477 (2012).
Omar et al.: Plankton Aerosol, Cloud, ocean Ecosystem mission. . .
Journal of Applied Remote Sensing 042608-9 Oct–Dec 2018 • Vol. 12(4)
Downloaded From: https://www.spiedigitallibrary.org/journals/Journal-of-Applied-Remote-Sensing on 12/28/2018Terms of Use: https://www.spiedigitallibrary.org/terms-of-use

22. F. Marenco et al., “Airborne lidar observations of the 2010 Eyjafjallajökull volcanic ashplume,” J. Geophys. Res.: Atmos. 116(D20), D00U05 (2011).
23. D. M. Winker et al., “CALIOP observations of the transport of ash from the Eyjafjallajökullvolcano in April 2010,” J. Geophys. Res. 117, D00U15 (2012).
24. R. A. Kahn, “Reducing the uncertainties in direct aerosol radiative forcing,” Surv. Geophys.33(3), 701–721 (2012).
Ali H. Omar, head of the Atmospheric Composition Branch at Langley Research Center,received his Ph.D. from the University of Illinois Urbana-Champaign (UIUC) in 1997. Alidid his postdoctoral fellowship at the UIUC Electro-Optics Systems Laboratory, working onthe retrieval of temperature and aerosol profiles from NASA’s Lidar In-space TechnologyExperiment (LITE) aboard space shuttle Discovery in September 1994. Ali is a scienceteam member of the CALIPSO and PACE missions and led the CALIPSO aerosol classificationalgorithm development effort.
Biographies for the other authors are not available.
Omar et al.: Plankton Aerosol, Cloud, ocean Ecosystem mission. . .
Journal of Applied Remote Sensing 042608-10 Oct–Dec 2018 • Vol. 12(4)
Downloaded From: https://www.spiedigitallibrary.org/journals/Journal-of-Applied-Remote-Sensing on 12/28/2018Terms of Use: https://www.spiedigitallibrary.org/terms-of-use