planning after planyc - home | cbcny · 2020-01-02 · planning after planyc: a framework for...
TRANSCRIPT

Planning After PLANYC:A Framework for Developing New York City’s NextTen-Year Capital Strategy

Citizens Budget Commission

Planning After PLANYC: A Framework for Developing New York City’s Next Ten-Year Capital Strategy
TABLE OF CONTENTS
INTRODUCTION AND SUMMARY .......................................................................................................................................4
CAPITAL PLANNING AND BUDGETING IN NEW YORK CITY .............................................................................5
Strategic Planning .......................................................................................................................................................................5
Needs Assessment ......................................................................................................................................................................5
Resource Identification .............................................................................................................................................................4
Capital Plan ...................................................................................................................................................................................7
Implementation and Asset Management .............................................................................................................................7
CAPITAL SPENDING DURING THE BLOOMBERG ADMINISTRATION ........................................................................9
Reasons for Expanded Capital Spending ..........................................................................................................................10
Outcomes of Investment........................................................................................................................................................11
Impact on the City’s Finances ...............................................................................................................................................15
Mayor Bloomberg’s Final Ten-Year Capital Strategy ..................................................................................................... 17
SHORTCOMINGS OF THE BLOOMBERG ERA .................................................................................................................... 18
No Citywide Policies for Routine Asset Maintenance and Replacement ................................................................18
Insufficient Investment in and Planning for State of Good Repair Work ................................................................20
Increased Spending Paid For Almost Entirely By Debt ................................................................................................ 21
Increased Capital Spending During a Period of High Construction Costs .............................................................22
Contracting and Management Challenges Contributed to Delays and Overruns...............................................22
Funding Gap for Resiliency and Mitigation Efforts ........................................................................................................ 24
FRAMEWORK FOR DEVELOPING THE NEXT TEN-YEAR CAPITAL STRATEGY ....................................................26
Improve Asset Management and the Capital Planning Process ................................................................................ 26
Develop an Investment Standard that Includes Policies for Debt and Pay-Go Capital ......................................27
Use Clear Guidelines to Establish Priorities in the Capital Strategy ........................................................................ 27
Adopt More Cost-Effective Approaches to Contract and Construction Management .....................................28
ENDNOTES ........................................................................................................................................................................................30

Citizens Budget Commission

Planning After PLANYC: A Framework for Developing New York City’s Next Ten-Year Capital Strategy
1
INTRODUCTION AND SUMMARY
New York City is the center of the largest metropolitan area in the nation. More than eight million people live in the five boroughs, and they are joined by millions of commuters and tourists who visit the city for work, school, shopping, cultural events and other recreational activities. Facilitating these activities is a vast system of infrastructure and capital assets that is necessary to provide government services, engage in economic activity and support a good quality of life.
Maintaining and improving these capital assets is crucial to the city’s continued competitiveness, and the importance of capital investment was recognized by Mayor Michael Bloomberg and his administration. Mayor Bloomberg’s infrastructure and sustainability plan, PLANYC, included ambitious goals to improve the transportation system, expand the water and sewer system, increase the supply of parks and housing, and make the city’s buildings greener and its waterfront more resilient against climate change.
In pursuit of these goals, more money was committed to capital projects than under any mayor since the fiscal crisis of the 1970s. The City has more than $100 billion in debt outstanding and its debt burden is high when evaluated under the benchmarks used by rating agencies to assess affordability. The outcomes of investment have been mixed: the condition of schools and bridges improved, carbon dioxide emissions were reduced dramatically, park space expanded and tree planting accelerated, but citizens express dissatisfaction with street maintenance, water main breaks remain a costly problem, and sewer backups continue to plague many neighborhoods.
The new mayor will face a difficult challenge: how to responsibly fund competing capital priorities without increasing capital spending and debt extensively. This report reviews capital planning and spending during Mayor Bloomberg’s tenure in order to suggest principles that can guide the development of a new long-term capital plan and financing strategy. The start of a new administration provides a valuable opportunity to articulate a vision for a modern city and establish broad priorities, as well as to improve the city’s operations and establish a new tenor of doing business. By improving the city’s asset management practices, developing an appropriate investment standard, using clear guidelines to establish priorities and adopting more cost-effective approaches to managing contracts and construction, the next mayor can have a long-term impact on the city’s infrastructure, government, economy and quality of life.

Citizens Budget Commission
2
CAPITAL PLANNING AND BUDGETING IN NEW YORK CITY
The city’s capital planning and budgeting processes are set forth in the New York City Charter. The Charter provides for a dynamic process that is shaped by elected officials, city agencies, the City Planning Commission, and community representatives, including community boards and borough presidents. In different ways, these actors evaluate what the city has, decide what it will need and plan for how goals can be best accomplished.
This section describes capital planning and budgeting during the administration of Mayor Michael Bloomberg, and explains how city agencies implemented each of these basic steps:
1. Establishing priorities and goals as part of a strategic planning process;
2. Conducting a thorough needs assessment;
3. Identifying resources available for a capital improvement plan;
4. Devising a capital improvement plan based on goals, needs and available resources; and
5. Implementing the plan, including authorizing funding, developing project schedules, managing projects and maintaining assets.
Strategic Planning
The City Charter requires the mayor to devise a strategic policy statement that summarizes the long-term challenges facing the city and proposes strategies to address those challenges over a four-year period.1 The statement allows the mayor to articulate his vision for the city, establish the priorities of his administration, and specify policies and programs that are needed, including those to maintain, expand and operate the city’s capital assets. The statement also provides a guidepost by which New Yorkers can judge the administration’s successes and the city’s progress.
As it managed the city’s finances in the wake of the 2001 recession and September 11th attacks, the Bloomberg Administration did not publish a strategic policy statement in 2003 as required by the Charter; in 2007, it satisfied the charter requirement with PLANYC. PLANYC was shaped around the premise that the city’s population would increase by one million people by 2030. It had ten broad goals, several of which focused on upgrading infrastructure, to enhance sustainability and quality of life in the city.
PLANYC improved upon prior planning exercises by specifying funding sources and milestones for accomplishing its 127 initiatives. Progress reports were issued annually to provide updates on milestones met. The plan was updated in 2011 to include 11 goals and 132 initiatives, many of which continued from the 2007 plan. Goals directly related to the city’s capital assets included stimulating housing development, enhancing park space, ensuring the quality of the water supply, improving the reliability of transportation and increasing resiliency.
Needs Assessment
Once the overarching goals are established, the condition, usefulness and performance of capital assets must be evaluated with respect to the citywide capital agenda.
The Department of City Planning (DCP) is responsible for analyzing competing demands from community districts.2 Using “fair share” criteria to ensure an equitable distribution of facilities

Planning After PLANYC: A Framework for Developing New York City’s Next Ten-Year Capital Strategy
3
throughout the city,3 DCP issues the Citywide Statement of Needs, which contains proposals to cite, replace, consolidate, expand or reduce city facilities over the course of two fiscal years.4
DCP also works jointly with the Office of Management and Budget (OMB) and city agencies to report on the condition of the city’s capital assets—specifically, how much spending is required to get to “state of good repair,” meaning assets are fully functional and safe to use. Agencies report needed spending in the Asset Information Management System (AIMS), published annually. But AIMS does not provide a full picture: it excludes some of the City’s most valuable assets– for example, the water and sewer system, public housing and the East River Bridges– as well as less valuable assets like equipment and vehicles.
Three agencies that manage large capital assets– bridges and tunnels, schools and the water and sewer system– conduct detailed inspections and issue yearly reports on the conditions of these assets. The Department of Transportation uses the State rating scale to assess bridges and tunnels. The School Construction Authority performs thorough architectural, mechanical and electrical inspections of school buildings and reports on deficiencies, safety violations, and overall condition. The Water Authority contracts with an independent engineering firm to evaluate the water and sewer system.
Resource Identification
The speed with which goals can be achieved and the scope of needs that can be met are constrained by the resources available to undertake capital investment.
Funding for capital improvements typically comes from three sources. The first is intergovernmental aid, which commonly takes the form of grants, and, increasingly, loans or bond support. The second is funding from annual budget resources; this “pay-as-you-go” funding can be appropriated from the general fund or from enterprise funds that rely on user fees or excise taxes, such as gas taxes, tolls or water bills. Third, governments issue bonds; the length of the bond is typically tied to the useful life of the capital asset, and the rationale for borrowing is to “pay-as-you-use,” allowing future taxpayers to share the cost of an asset as they, too, benefit from its use.
Governments vary in their funding approaches, although most use a mix of sources. Data on local governments are not available, but annual capital spending by New York City exceeds that of most states. Between fiscal years 2010 and 2012 approximately 30 percent of state capital spending was from federal funds, 33 percent was from debt and the remainder came from state budget funds.5
The City receives about 20 to 25 percent of its capital funding from the state and federal sources. The remaining city-funded portion is financed fully with debt.6 The City relies on three types of bonds: general obligation bonds, backed by the full faith and credit of the City; bonds issued by the Transitional Finance Authority (TFA), which are backed by the personal income tax; and bonds, repaid with user fees, issued by the Municipal Water Finance Authority, a component unit of city government, to improve the water and sewer system.
What stops the city from borrowing for all its capital needs? The State constitution limits general obligation debt to 10 percent of the average of the full value of taxable real property in the previous
There is no single, comprehensive source on capital needs; agencies use different criteria and metrics to assess and report on the condition of their assets.

Citizens Budget Commission
4
five years. The City was close to this limit in 1997;7 at the behest of the city leaders, the New York State Legislature created the TFA to increase the city’s bonding capacity. TFA is a separate bankruptcy-remote legal entity, initially authorized to offer $7.5 billion in bonds. Over time, TFA’s borrowing capacity has been increased, and is now limited to $13.5 billion in outstanding bonds. Under state law, the City has authority to issue bonds over this threshold provided that the excess, together with the amount of general obligation debt outstanding, does not exceed the constitutional debt limit. There is no formal limit on Water Authority debt since it is repaid from user fees.
The city is also limited by its ability to repay the principal and interest on the bonds, known as debt service, from the operating budget. If the city borrows too much, the resulting debt service will reduce resources available for other priorities and programs. How much is too much? Each year, the Mayor must issue a Statement of Debt Affordability that demonstrates the level of capital spending proposed is within constitutional limits, and provides metrics on future debt and debt service as a share of the tax base and budget resources. The Bloomberg Administration did not articulate a formal policy for issuing debt,8 but consistently kept capital spending at a level such that debt service remained near 15 percent of total city tax revenues.
Capital Plan
Once the resources available for investment are identified, the parameters of the capital program are established. The capital improvement plan is then developed based on strategic objectives, agency needs and requests, policy constraints and feedback from the public. Some state and local governments have clearly defined criteria for prioritizing projects to determine which are included in the plan and which are not.
New York City has a long-term capital planning process. Every two years,9 DCP and OMB prepare a rolling Ten-Year Capital Strategy that provides a blueprint for capital spending and describes goals, priorities and major projects for each agency. The city does not have transparent criteria for prioritizing or selecting projects, but much of the spending undertaken since 2007 relates to PLANYC goals and initiatives. A financing plan and ten-year debt projections are also included in the Strategy.
Implementation and Asset Management
The Ten-Year Capital Strategy is implemented through the capital budget and the capital commitment plan.
Funding for New York City capital projects is appropriated in a separate capital budget, which follows the same procedural track as the operating budget: the Mayor releases a preliminary budget
Two Budgets
There are two intersections between the capital and operating budgets, and they are best explained with an example. Suppose the capital budget provides for the construction of a firehouse in Flushing, Queens. The firehouse, which will cost $10 million to build and is expected to last 50 years, is eligible for capital funding because it is a physical asset with a value greater than $35,000 and a useful life greater than 5 years.
The City will issue a bond to pay for the cost of constructing the firehouse, and the debt service will be paid from the operating budget. In addition, maintenance of the building will be paid from the fire department’s operating budget. The bond does not cover operations and maintenance, and these “lifecycle” costs are not necessarily made clear or taken into consideration when a capital project is approved.
Planning After PLANYC: A Framework for Developing New York City’s Next Ten-Year Capital Strategy
5
in January and an executive budget in April. The City Council can alter and add to the capital budget before it is adopted, but its size cannot exceed the financing boundaries established in the Statement of Debt Affordability. Just as with the operating budget, the City Council adds hundreds of millions of dollars in spending each year for projects supported by its members before adopting the capital budget.
After it is adopted, an implementation schedule, known as the capital commitment plan, is developed. The commitment plan gives an agency the authority to register contracts to procure assets or to work on projects, and provides schedules for project management. Due to the size of the capital program, the City does not issue separate bonds for individual projects; instead, it borrows hundreds of millions of dollars at once, linking its financing needs to anticipated cash outlays as the contracted work is performed.
Before work can begin, the agency completes a project scope, detailing the project’s purpose, the type of construction (e.g. new construction, partial renovation, etc.), needed features, performance standards, important milestones, potential challenges, estimated cost and any other important information. The project is then designed; sometimes this is contracted out, but usually it is completed by city personnel.
Once the design is completed, a request for proposals (RFP) is issued to solicit bids from private contractors. State law requires the City to award the contract to the business that submits the lowest bid. To ensure low-bidding companies do not undercut wages and compromise safe labor practices, a private contractor awarded a public construction or maintenance contract in New York State is required to pay employees on the project a “prevailing wage.” Prevailing wage rates, which include supplemental pay for fringe benefits, are determined in New York City by the Comptroller for each occupation and title annually.10
If the project is a building or facility worth more than $3 million, the city must issue several RFPs– a State law, known as Wicks Law, requires that different contracts be awarded for work on plumbing, electric and heating/cooling systems. Division of construction responsibility, as well as the separation of design from construction, often leads to problems managing the project: for example, the design may prove unworkable or too costly, or the individual contractors may not work well together or organize themselves efficiently, leading to delays or cost overruns.
Once the capital project is completed, regular maintenance should be performed to ensure the asset remains in good working condition for as long as it was built to last. Funding for operations and maintenance of an asset cannot be included as part of the capital budget; these costs should be funded from the operating budget. Nevertheless, capital budgets in the past specified projected maintenance and operations and debt service costs for each capital project; however, these are no longer provided, so “lifecycle” costs and their impact on the operating budget are not taken into consideration when a capital project is approved.

Citizens Budget Commission
6
CAPITAL SPENDING DURING THE BLOOMBERG ADMINISTRATION
Capital investment has been a hallmark of the Bloomberg Administration: $90.2 billion worth of capital commitments were registered since fiscal year 2003, with an additional $20.9 billion authorized in the current fiscal year, for a total of $111 billion.11
Figure 1 shows how this spending has been allocated across government functions. The bulk of capital work and purchases– almost 70 percent– has been undertaken by just a handful of agencies. Capital spending by the Departments of Education (DOE) and Environmental Protection (DEP) has surpassed all other agencies, totaling $53.3 billion and 48 percent of all commitments. The Departments of Transportation ($12.5 billion), Parks and Recreation and Cultural Affairs ($8.8 billion) have been big spenders, as well.
While other agencies received smaller slices of the pie, the dollars invested across all government functions have been substantial. More than $7 billion were spent to upgrade technology and purchase new equipment, and $5.1 billion were used to construct a new police academy, renovate correctional facilities and firehouses, and purchase new vehicles for the uniformed services. More than $4 billion were devoted to stimulating economic development, renovating and modernizing public hospitals and preserving and developing housing. Sizeable improvements were also made to courts and other public buildings.
The level of capital spending has been unprecedented since the fiscal crisis of the 1970s. After adjusting for changes to construction costs, the City spent $123 billion under Mayor Bloomberg–$33.5 billion more than under Mayors Giuliani and Dinkins combined and $53.5 billion more than under Mayor Koch. As Figure 2 shows, capital commitments during Mayor Bloomberg’s first term were only slightly higher than his immediate predecessors; commitments expanded dramatically during the second term and remained high in the third term.
Ed
uca
tio
n, $
27
,87
4
En
viro
nm
enta
l Pro
tect
ion
, $2
5,4
44
Tra
nsp
ort
atio
n, $
12
,46
9
Par
ks &
Cu
ltu
rals
, $8
,75
0
Tec
hn
olo
gy &
Eq
uip
men
t,$
7,2
72
Pu
blic
Pro
tect
ion
, $5
,06
2
Ho
usi
ng,
$4
,59
2
All
Oth
er, $
4,4
69
Ho
spit
als,
$4
,14
7
Eco
no
mic
Dev
., $
4,0
16
Co
urt
s &
Pu
blic
Bu
ildin
gs, $
3,6
91
San
itat
ion
, $3
,25
0
0% 10% 20% 30% 40% 50% 60% 70% 80% 90% 100%
Figure 1: Total Capital Commitments by Function, FY2003-2014(dollars in millions)
Note: Fiscal Year 2014 total commitments planned as of September 2013.Source: New York City Office of Management and Budget, Adopted Capital Commitment Plan for Fiscal Year 2014, September 2013, and previous editions.

Planning After PLANYC: A Framework for Developing New York City’s Next Ten-Year Capital Strategy
7
Reasons for Expanded Capital Spending
Several factors explain the expansion in capital spending. First, the Administration’s strategic plan for the city, PLANYC, released in 2007, focused on improving quality of life through repairs, upgrades and enhancements to the city’s capital assets. PLANYC included specific goals to reach state of good repair on transportation, to invest in the construction of the third water tunnel and to replace water and sewer infrastructure that is more than a century old. PLANYC also outlined investments to “green” schools and city buildings, expand park space and playgrounds, preserve and upgrade affordable housing, and improve solid waste disposal.
Second, the City was able to pursue PLANYC objectives because the economy prospered. With tax revenues growing rapidly year over year, the Administration could undertake more debt to support greater capital expenditure– with debt service remaining at or below 15 percent of taxes, the metric of affordability relied upon by the Bloomberg Administration.
Third, the City benefited from a new source of intergovernmental aid (see Figure 2). Traditionally, the City’s capital program for education was funded almost exclusively by city dollars. Beginning in 2007, the State agreed to pay for half of the DOE’s capital program;12 rather than supplant its own commitment with State dollars, the City expanded the size of the DOE capital plan.
$0
$10
$20
$30
$40
$50
MayorDinkins
FY1991-1994
MayorGiuliani I
FY1995-1998
MayorGiuliani II
FY1999-2002
MayorBloomberg I
FY2003-2006
MayorBloomberg II
FY2007-2010
MayorBloomberg IIIFY2011-2014
Do
llars
in B
illio
ns
Figure 2: Index-Adjusted Capital Spending by Mayor,City of New York, FY1991-2014
City Funds Index-Adjusted Spending Non-City Index-Adjusted Spending
Note: Index adjusts for rise in construction costs. Fiscal Year 2014 total commitments planned as of September 2013.Source: New York City Office of Management and Budget, Adopted Capital Commitment Plan for Fiscal Year 2014, September 2013, and previous editions.

Citizens Budget Commission
8
Finally, spending by the DEP was driven by unfunded mandates and paid for by user-fee backed debt. New York City has been granted a rare exemption from filtering its drinking water; but in order to protect the quality of water source, it had to spend $400 million to acquire land around its reservoirs in the Catskill Mountains to deter development that produces pollution. In addition, the City undertook costly and over-budget projects, such as the $5 billion Newton Creek Treatment Plant Upgrade and $3.2 billion Croton Filtration Plant, to comply with federal and state mandates for water quality standards.13 DEP is also required to stop combined sewer overflows, the spill of untreated wastewater into the city’s waterways during heavy rainfall. Increased debt by the Water Authority to take on these projects was enabled by steep increases in water and sewer fees— 135 percent since fiscal year 2003— paid by homeowners, landlords and businesses.
Outcomes of Investment
This capital investment increased the value of the assets owned by New York City and its related public authorities by 79 percent since fiscal year 2002 to $87.7 billion. The value of capital assets owned directly by the City grew from $26.7 billion to $50.5 billion – almost $24 billion. Public authorities under the City’s control, which are also part of the City’s capital portfolio, own $37.2 billion in assets, $14.9 billion more than at the outset of the administration.
NEW YORK CITY $26,659 $50,510 $23,851 89%
Education 4,224 19,848 15,625 370%
Transportation services 4,989 9,454 4,465 90%
Land and undepreciated assets 7,934 6,405 (1,529) -19%
General government 2,643 4,899 2,255 85%
Parks, recreation and culturals 1,666 4,118 2,452 147%
Public safety and judicial 2,821 2,702 (118) -4%
Health 455 1,019 564 124%
Environmental protection 833 983 150 18%
Social services 815 646 (169) -21%
Libraries 150 327 177 118%
Housing 0 71 71 -
City University 130 38 (92) -71%
NYC PUBLIC AUTHORITIES $22,318 $37,183 $14,865 67%
Water and Sewer System 16,067 27,460 11,393 71%
Housing Authority 4,559 5,662 1,103 24%
Health and Hospitals Corporation 1,594 3,374 1,780 112%
All Others 98 686 588 600%
TOTAL, NYC & PUBLIC AUTHORITIES $48,977 $87,693 $38,716 79%
FY2002 FY2013 Dollars PercentChange
Table 1: New York City & Its Public Authorities,Capital Assets, Net of Depreciation
(dollars in millions)
Source: New York City Office of the Comptroller, Comprehensive Annual Financial Report, Fiscal Years 2002, 2013.

Planning After PLANYC: A Framework for Developing New York City’s Next Ten-Year Capital Strategy
9
As would be expected, the largest gains have been in the areas where the greatest investments were made. In education, the greatly-expanded capital program— which included upgrades to old structures but also the creation of 167 new schools and additions since fiscal year 2003– quadrupled the value of school facilities since fiscal year 2002, bringing the total value to $19.8 billion, or 40 percent of the City’s total capital stock.
Assets of the water and sewer system increased by more than $11 billion as the City built or reconstructed sewers and water mains, made progress on the Third Water Tunnel, added land and built new water and wastewater treatment plans.
Transportation assets also grew by $4.5 billion and general government assets increased by $2.3 billion. In addition, the value of health facilities, parks, cultural institutions and libraries doubled during this period.
It is worth noting the value of the City’s assets did not increase by the full amount of capital spending. The value of an asset, once purchased or constructed, decreases as it is used over time; to account for this depreciation, the city reduces the value of a capital asset evenly over the course of its useful life: 25 to 50 years for new construction, 15 to 40 years for infrastructure, 10 to 25 years for reconstruction and 5 to 15 years for equipment. Annual depreciation was $3 billion in fiscal year 2013 and totaled $25 billion since fiscal year 2003. Depreciation also explains why values for public safety, social service and city university assets decreased.
Depreciation provides limited insight into whether the condition of the city’s assets is improving or declining. Typically, if an asset is fully depreciated, it has reached the end of its useful life and should be replaced. But, it is possible that an asset near the end of its useful life may still be in good working condition because it has been properly maintained or has been rehabilitated. Conversely, a relatively new asset may be in poor condition because routine maintenance or upkeep has not been performed.
While the city reports depreciation for all its capital assets, only the agencies that manage infrastructure and large capital assets provide specific metrics on their condition. The following section culls information from different sources to report on how capital spending expanded and improved the city’s assets since fiscal year 2002. The effectiveness has been mixed.
There has been progress in improving the condition of schools and bridges, and green space and the third water tunnel have expanded significantly.
Schools – The City has greatly expanded capacity and improved the condition of its school buildings. More than 126,000 new seats were added, reducing crowding significantly. Schools that exceed capacity were reduced from 44 percent to 33 percent of elementary schools, from 38 percent to 12 percent of middle schools, and from 64 percent to 32 percent of high schools between fiscal year 2002 and 2012.
Condition assessments also demonstrate improvements in facilities. In fiscal year 2002, more than three-quarters of schools were in “fair” condition, meaning substantial structural, mechanical or electrical repairs were needed. That share decreased to 49 percent in fiscal year 2012. The backlog of hazardous building violations has been virtually eliminated, decreasing to 123 in fiscal year 2013 from 2,200 in fiscal year 2002.
The value of educational facilities has quadrupled since fiscal year 2002 as a result of rehabilitation and expansion of capacity.

Citizens Budget Commission
10
SCHOOLS
New schools and additions created since 2003 16 45 124 167
New seats created, cumulative since 2003 14,160 20,007 71,349 126,726
Schools that exceed capacity*
Elementary 44% 24% 31% 33%
Middle school 38% 15% 9% 12%
High school 64% 48% 37% 32%
Conditions of schools rated as:*
"Fair to good" 21% 28% 47% 49%
"Fair" 77% 69% 51% 49%
BRIDGES
Rated "good" or "very good" 296 328 320 326
Rated "fair" 451 456 462 460
Rated "poor" or closed 8 3 5 1
PARKS
Parks 1,697 1,951 1,896 1,923
Acreage 28,843 28,860 29,043 29,284
Trees planted, cumulative NA NA 401,187 770,548
Parks rated as acceptable for:
Overall condition 88% 88% 83% 85%
Overall cleanliness 93% 93% 88% 90%
Playgrounds rated "acceptable" for:
Safety surfaces 94% 92% 94% 93%
Play equipment 85% 88% 91% 93%
Monuments receiving annual maintenance 15% 36% 69% 63%
ROADS
Signalized intersections 11,192 11,946 12,362 12,697
Street lights 329,025 340,000 341,298 343,007
Lane miles reconstructed yearly 48.8 60.2 42.7 51.8
Streets maintained with a rating of "good" 82% 70% 71% 70%
Highways with a cleanliness rating of "good" NA NA 98% 100%
On-street parking meters that are operable 90% 91% 83% 99%
Metered spaces with muni-meters NA 21% 41% 100%
WATER MAINS AND SEWERS
Water main breaks 494 450 421 403
Water main miles, new or replaced 107.6 47.9 19.1 38.2
Sewers miles constructed or reconstructed 72.1 28.6 14.8 18.7
Table 2: Selected Indicators for Major Capital Assets
FY2013FY2010FY2006FY2002
*For these indicators, fiscal year 2013 values are not yet available; fiscal year 2012 values are shown instead.
Source: New York City Mayor's Office of Operations, Mayor's Management Report; New York City Office of the Comptroller, Comprehensive Annual Financial Report for the City of New York; selected years.

Planning After PLANYC: A Framework for Developing New York City’s Next Ten-Year Capital Strategy
11
Bridges – The City uses the State rating scale to assess the condition of bridges. A bridge in “good” condition is one on which maintenance and repairs are performed regularly, while a “poor” bridge is not in a state of good repair and may pose a safety threat that would require it to be closed. Even as it has assumed responsibility for 40 bridges previously owned by other agencies, the Department of Transportation has increased the number of bridges in good condition, while reducing the number of poorly-rated bridges to one: the Brooklyn Bridge. A small pedestrian bridge in Flushing Meadow Park has been closed.
Parks – Increasing green and recreational space was a key initiative of PLANYC: park space grew by 440 acres and 770,550 trees were planted. Even with this expansion, the share of parks rated as “acceptable” by inspectors averaged of 85 percent for overall condition and 90 percent for cleanliness (although the trend has been slightly downward since 2002). Ninety-three percent of playgrounds are rated “acceptable” for safety surfaces and play equipment. In addition, the share of monuments receiving annual maintenance increased to 63 percent from 15 percent in fiscal year 2002.
Third water tunnel – Construction on the third water tunnel began in 1970, in order to allow the first and second water tunnels to be shut down for inspection and repair. The Administration committed more money—almost $5 billion— to the project than all prior administrations combined. The Manhattan section of the third tunnel was completed and became operational in October, and the remaining sections, which will bring water to the remaining boroughs, are scheduled to be operational by 2026.14
Investment in some infrastructure, including roads, water mains and sewers, has not been sufficient to prevent further deterioration.
Streets – In contrast to bridges, the percentage of streets maintained with a rating of “good” decreased from 82 in fiscal year 2002 to 70 in fiscal year 2013. Part of the decline can be explained by a slower pace of repairs: lane miles reconstructed yearly increased after 2002, but fell to a low of 28 in fiscal year 2012 before rebounding to 51.8 in fiscal year 2013.15 A recent TRIP report rated the New York City-Newark area as 6th among large urban areas in the share (51 percent) of major roads and highways with pavements in poor condition, almost double the national average (27 percent). They estimate the tough terrain causes motorists to pay an additional $673 a year in additional vehicle maintenance.16 New Yorkers are highly dissatisfied with the condition of roads: in a 2008 citywide survey, only 39 percent of respondents considered the maintenance of streets and roads in their neighborhoods good or better.17
Water mains and sewers – Despite record levels of investment in environmental protection, improvements to some of the system’s oldest infrastructure continue to lag. Most water mains are at least 50 years old, and about 20 percent of all water main miles are at least 100 years old.18 Water main breaks have become less frequent, but the pace of construction and replacement of water mains dropped from more than 100 miles a year to less than 20 in fiscal year 2010 before increasing modestly in recent years. Similarly, only 18.7 miles of sewers were constructed or reconstructed in fiscal year 2013, while sewer backup complaints still number in the tens of thousands each year. More than 40 percent of sewer backups recur locally within two years.
The impact of other investments is unclear.
Economic development – Economic development investments ranged from transformational projects like the redevelopment of Willets Point and Coney Island to less ambitious efforts to upgrade infrastructure in industrial areas, improve neighborhood amenities and support projects undertaken by Business Improvement Districts (BIDs). Most of this spending is undertaken by the Economic Development Corporation (EDC) under the rationale that these investments will generate new economic activity; however, little or no analytic evidence is available on the expected or actual return

Citizens Budget Commission
12
on these investments. In fact, capital spending is not captured in the cost-benefit analyses published in the EDC’s annual report.19 This is especially problematic with respect to smaller projects, which generally receive less scrutiny, are sometimes undertaken at the behest of local officials, and are often lumped together under a large appropriation, making it difficult to isolate specific costs and benefits.
Cultural institutions – There are 33 cultural institutions located on city-owned property, but the City also supports approximately 200 non-profit institutions with capital funds. The City does not gain any assets through these investments, but they may make sense if they will generate increased economic activity, such as attracting additional tourists or visitors; however, awards to cultural institutions are not accompanied with analysis demonstrating the expected results of these investments. Many of these investments are made at the request of borough presidents or added by the City Council in the budget adoption process with little scrutiny. This direct capital spending is in addition to triple-tax exempt conduit financing provided by the City to cultural institutions through the Trust for Cultural Resources. At least six institutions have received both conduit financing and capital funds from the city.20
Impact on the City’s Finances
The impact of capital spending is also apparent in the high and growing debt burden. Between fiscal years 2003 and 2014, state and federal dollars funded less than 20 percent of the City’s capital spending; the remaining $100 billion was financed by debt21— issued by the City, the Transitional Finance Authority and the Municipal Water Finance Authority. As a result, the City-related debt outstanding has grown 80 percent since fiscal year 2002, surpassing $100 billion.
$30
$40
$50
$60
$70
$80
$90
$100
$110
FY02 FY03 FY04 FY05 FY06 FY07 FY08 FY09 FY10 FY11 FY12 FY13 FY14
Term I Term II Term III
Do
llars
in B
illio
ns
Figure 3: City-Related Debt Outstanding, City of New York, FY2002-2014
Total City Debt
Water Authority Debt
Note: Total City debt includes GO, MAC, TFA, TSASC, and Conduit.Source: New York City Office of the Comptroller, Comprehensive Annual Financial Report, Fiscal Years 2002 to 2013; New York City Office of Management and Budget, Executive Budget for Fiscal Year 2014: Message of the Mayor, May 2, 2013.
Planning After PLANYC: A Framework for Developing New York City’s Next Ten-Year Capital Strategy
13
Bond rating agencies typically judge debt affordability in relation to the adequacy of resources available to repay it. Because Water Authority bonds are not legally debt of New York City and are not repaid from the city budget, they are excluded from the affordability analysis; however, other forms of debt— including “conduit debt” from bonds sold on behalf of other entities, now-retired debt of the Municipal Assistance Corporation, and debt from the securitization of revenues from tobacco settlements in the 1990s—are included because they are repaid directly from city revenues.
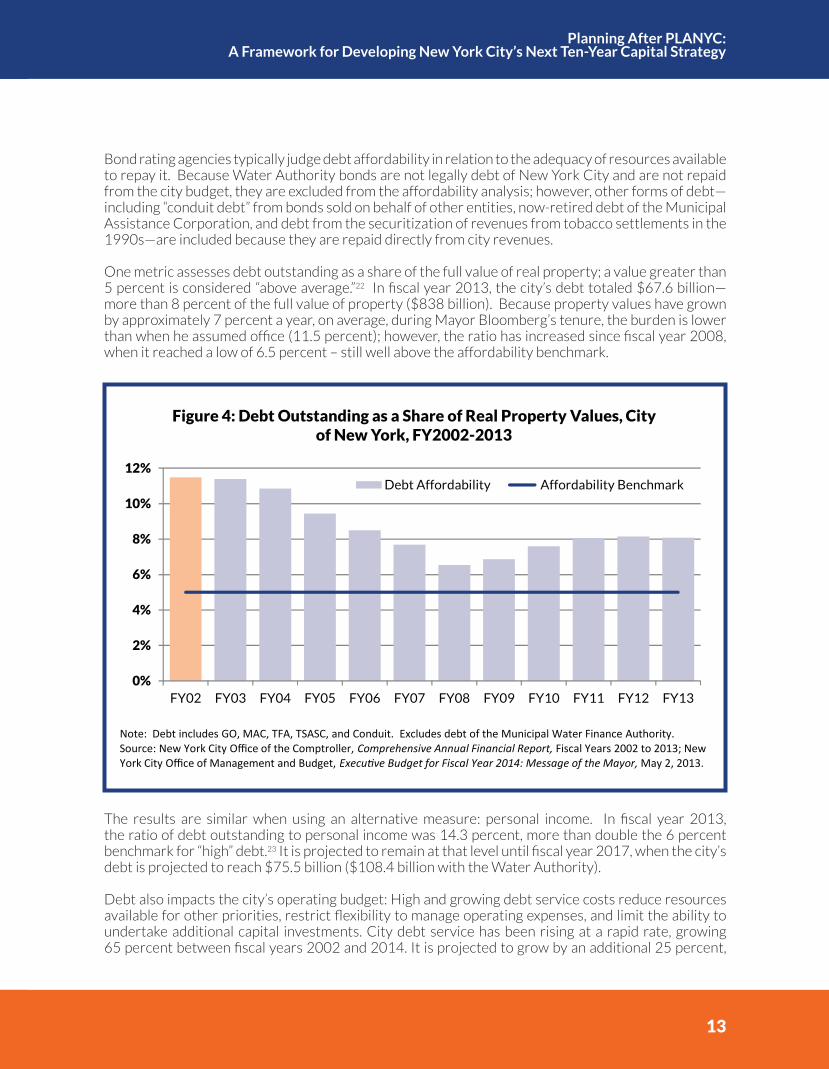
One metric assesses debt outstanding as a share of the full value of real property; a value greater than 5 percent is considered “above average.”22 In fiscal year 2013, the city’s debt totaled $67.6 billion—more than 8 percent of the full value of property ($838 billion). Because property values have grown by approximately 7 percent a year, on average, during Mayor Bloomberg’s tenure, the burden is lower than when he assumed office (11.5 percent); however, the ratio has increased since fiscal year 2008, when it reached a low of 6.5 percent – still well above the affordability benchmark.
The results are similar when using an alternative measure: personal income. In fiscal year 2013, the ratio of debt outstanding to personal income was 14.3 percent, more than double the 6 percent benchmark for “high” debt.23 It is projected to remain at that level until fiscal year 2017, when the city’s debt is projected to reach $75.5 billion ($108.4 billion with the Water Authority).
Debt also impacts the city’s operating budget: High and growing debt service costs reduce resources available for other priorities, restrict flexibility to manage operating expenses, and limit the ability to undertake additional capital investments. City debt service has been rising at a rapid rate, growing 65 percent between fiscal years 2002 and 2014. It is projected to grow by an additional 25 percent,
0%
2%
4%
6%
8%
10%
12%
FY02 FY03 FY04 FY05 FY06 FY07 FY08 FY09 FY10 FY11 FY12 FY13
Figure 4: Debt Outstanding as a Share of Real Property Values, City of New York, FY2002-2013
Debt Affordability Affordability Benchmark
Note: Debt includes GO, MAC, TFA, TSASC, and Conduit. Excludes debt of the Municipal Water Finance Authority.Source: New York City Office of the Comptroller, Comprehensive Annual Financial Report, Fiscal Years 2002 to 2013; New York City Office of Management and Budget, Executive Budget for Fiscal Year 2014: Message of the Mayor, May 2, 2013.

Citizens Budget Commission
14
from $6.3 billion to $7.8 billion, by fiscal year 2017. The affordability of debt service is examined with respect to the share of spending: more than 12 percent of general fund spending is deemed “above average” and more than 15 percent is “high.” Debt service currently makes up 12 percent of city-funded expenditures and will rise to 13.7 percent by fiscal year 2017.
Mayor Bloomberg’s Final Ten-Year Capital Strategy
The final Ten-Year Capital Strategy devised by the Bloomberg Administration was released in May and approved by the City Council in June 2013. It spans fiscal years 2014 to 2023, and will likely serve as the starting point for the next mayor to develop a long-term capital plan. The Strategy outlines $53.7 billion in capital commitments, three-quarters of which are for the Departments of Education, Environmental Protection and Transportation.
Half the plan, $24.5 billion, will be devoted to state of good repair, and a quarter, or $13.5 billion, will be for replacement. Expansion spending on new assets and large-scale capital improvements will total $13.6 billion. In addition to the ongoing work to build and renovate schools, repave roads and replace and extend water mains and sewers, notable projects include $1 billion to replace sanitation trucks, $900 million for sewer overflow reduction, $744 million for energy efficiency, including building retrofits, $550 million for the construction of a new 1,500 bed facility on Rikers Island, and $200 million for the replacement of the electronic medical record system by the Health and Hospitals Corporation.24
$0
$1
$2
$3
$4
$5
$6
$7
$8
FY02 FY03 FY04 FY05 FY06 FY07 FY08 FY09 FY10 FY11 FY12 FY13 FY14 FY15 FY16 FY17
Term I Term II Term II Outyears
Dolla
rs in
Bill
ions
Figure 5: City of New York, Annual Debt Service, FY2002-2017
Note: Includes debt service of GO, TFA, TSASC, MAC and Conduit debt.Sources: Independent Budget Office; New York City Office of Management and Budget, Executive Budget for Fiscal Year 2014, May 2, 2013.

Planning After PLANYC: A Framework for Developing New York City’s Next Ten-Year Capital Strategy
15
SHORTCOMINGS OF THE BLOOMBERG ERA
Investment in capital assets is important for the city’s competitiveness and continued prosperity: at the federal level, the return on investment for infrastructure has been estimated to be as high as $1.44 for each dollar spent. 25 The investments made under the Bloomberg Administration were the underpinnings to increased economic activity, improvements in quality of life and record population and tourism growth; yet the extraordinary level of spending was insufficient to improve the condition of some important capital assets and left the City with a high debt burden. This section describes some practices that limited the impact of investment.
No Citywide Policies for Routine Asset Maintenance and Replacement
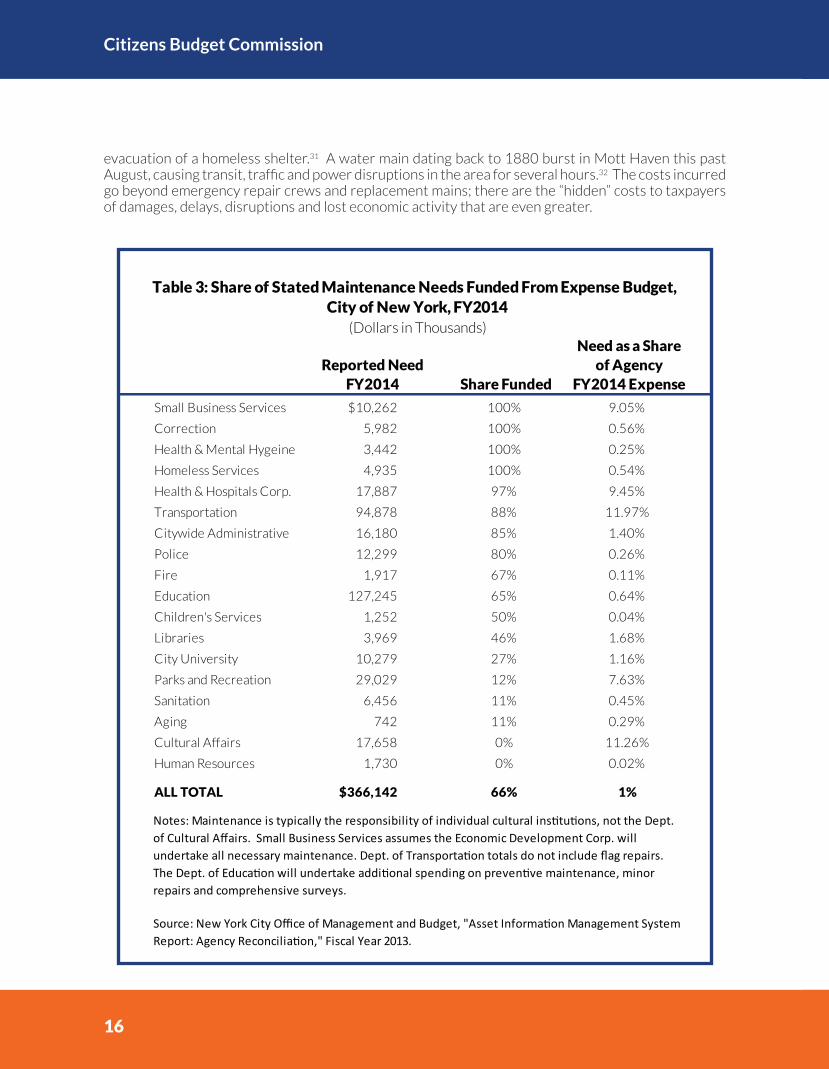
The City does not have a formal policy or directive for performing routine maintenance and replacement, and asset management practices at many city agencies are inadequate. As Table 3 shows, agencies vary widely— from 0 to 100 percent— in the share of maintenance needs funded, and in most cases, the amounts spent are insufficient. For example, the Department of Education only funds 65 percent of reported maintenance needs, and comparative research indicates it spends a smaller percentage of its budget on maintenance than other large school districts, including Los Angeles, Houston and Chicago.26
Expenditures for maintenance and upkeep, necessary to keep assets from falling into disrepair, are paid from the operating budget, where they compete with other priorities. While it typically comprises a small share of total agency expenses, maintenance spending is particularly sensitive to reductions during economic downturns: during the most recent recession, attempts to shield classrooms from cuts led the Department of Education to reduce funding for non-capital repairs to school facilities,27 and the share of operational funding for school facilities remains smaller than it was prior to 2010.28 Many elected officials view these maintenance cuts as preferable to layoffs or service reductions because they do not seem to impose a cost to taxpayers or employees; however, deferring maintenance causes assets to fall into disrepair, which proves to be more costly down the road.
Another reason maintenance receives short shrift is capital projects are not undertaken with an eye toward upkeep after the project is constructed or the asset is procured. Operations and maintenance figures are no longer provided for projects in the capital budget, and projects are approved without a clear understanding of the operating resources necessary to properly maintain them. For example, a hallmark initiative of the parks capital program is to plant one million trees; however, the operating budget has not increased to provide for tree pruning. In fact, budget cuts forced staffing reductions that doubled the tree pruning cycle to fifteen years from seven, which is widely accepted as the standard.29 After a series of lawsuits resulting from injuries and deaths due to falling tree limbs in public parks, the City Council added funds for tree pruning before adopting the fiscal year 2013 budget.30
In addition, the City does not adhere to strict replacement cycles for assets that reach the end of their useful lives. While the useful life of some asset classes (buildings, infrastructure, equipment) are identified, assets tend to be replaced on an ad-hoc basis that focuses resources on where they are most urgently needed, e.g. on assets that malfunction unexpectedly. While it may be cost-effective to continue to employ well-functioning assets, extending use well beyond useful life can actually prove to be more costly.
These costs are most vividly illustrated by the disruptions caused periodically by water main breaks. More than 20 percent of water mains are over 100 years old, far past their useful lives and prone to breaks. A break in a 108-year old water main caused a flood on Jerome Avenue in the Bronx in July 2011, submerging cars, ruining personal property and businesses, damaging gas lines and forcing the
Citizens Budget Commission
16
evacuation of a homeless shelter.31 A water main dating back to 1880 burst in Mott Haven this past August, causing transit, traffic and power disruptions in the area for several hours.32 The costs incurred go beyond emergency repair crews and replacement mains; there are the “hidden” costs to taxpayers of damages, delays, disruptions and lost economic activity that are even greater.
Small Business Services $10,262 100% 9.05%
Correction 5,982 100% 0.56%
Health & Mental Hygeine 3,442 100% 0.25%
Homeless Services 4,935 100% 0.54%
Health & Hospitals Corp. 17,887 97% 9.45%
Transportation 94,878 88% 11.97%
Citywide Administrative 16,180 85% 1.40%
Police 12,299 80% 0.26%
Fire 1,917 67% 0.11%
Education 127,245 65% 0.64%
Children's Services 1,252 50% 0.04%
Libraries 3,969 46% 1.68%
City University 10,279 27% 1.16%
Parks and Recreation 29,029 12% 7.63%
Sanitation 6,456 11% 0.45%
Aging 742 11% 0.29%
Cultural Affairs 17,658 0% 11.26%
Human Resources 1,730 0% 0.02%
ALL TOTAL $366,142 66% 1%
Notes: Maintenance is typically the responsibility of individual cultural institutions, not the Dept. of Cultural Affairs. Small Business Services assumes the Economic Development Corp. will undertake all necessary maintenance. Dept. of Transportation totals do not include flag repairs. The Dept. of Education will undertake additional spending on preventive maintenance, minor repairs and comprehensive surveys.
Source: New York City Office of Management and Budget, "Asset Information Management System Report: Agency Reconciliation," Fiscal Year 2013.
Reported NeedFY2014 Share Funded
Need as a Share of Agency
FY2014 Expense
Table 3: Share of Stated Maintenance Needs Funded From Expense Budget, City of New York, FY2014
(Dollars in Thousands)

Planning After PLANYC: A Framework for Developing New York City’s Next Ten-Year Capital Strategy
17
Failure to plan for the replacement of assets also creates disincentives for performing regular maintenance; rather than use scarce operating dollars to perform maintenance, assets that are allowed to deteriorate can be replaced with funds from the capital budget. Of course, once assets fall into disrepair, replacing them is more costly than performing maintenance would have been; for example, repairing or rehabilitating pavement costs six to eight times more than maintaining it in good condition.33
Insufficient Investment in and Planning for State of Good Repair Work
As a result of its asset management practices, the City is falling further behind on the maintenance backlog: State of good repair requirements, as reported in the Asset Information Management System (AIMS), have grown from $4.6 billion in fiscal year 2002 to $6.4 billion in fiscal year 2014. The dollars invested in state of good repair also grew— from $1.7 to $3.7 billion– but not sufficiently to keep pace with growing needs. The share of need funded dropped from 64 percent to a low of 41 percent in 2004, and has averaged around 50 percent since.34
The funding shortfall is likely underestimated, as AIMS is limited in scope, excluding less valuable assets like equipment and vehicles, and large assets, such as the water and sewer system and public housing. The maintenance backlog at the New York City Housing Authority (NYCHA) has been well documented in the press; at its peak, there were 423,000 open work orders on 179,000 units. 35 NYCHA’s most recent Physical Needs Assessments identified more than $13 billion in unmet needs through 2015, with $7.5 billion anticipated in the 2011-2015 period.36
Less is known about the magnitude of needs for the water and sewer system. The engineers contracted to independently review the system’s condition label it as “adequate” and note increased resources devoted to state of good repair work in the current capital plan, but estimates of total need are not reported.37
$-
$1
$2
$3
$4
$5
$6
$7
2002 2003 2004 2005 2006 2007 2008 2009 2010 2011 2012 2013 2014
Billi
ons o
f Dol
lars
Figure 6: New York City, Funding for State of Good Repair, FY2002 -2014
Funding for SOGR Unfunded Need
Source: NYC Office of Management and Budget, "Asset Information Management System Report," FY2001-2013.

Citizens Budget Commission
18
Reaching a state of good repair on the transportation network was a key goal of the first PLANYC report; however, after State legislative leaders failed to approve a congestion pricing scheme that would have provided a new source of revenue for improvements, the goal was dropped from the 2011 update to the plan. Academic research suggests that improvements to highway conditions yield the greatest rate of return;38 nevertheless, the City does not have a plan or schedule for achieving state of good repair on its transportation infrastructure or other assets.
Increased Spending Paid for Almost Entirely By Debt
The vision behind PLANYC was broad and long-term, and the agenda did not focus solely on state of good repair: it included goals to expand or build water tunnels and mains, sewers, parks and waste transfer stations. In addition to these priorities, the city also allocated substantial capital dollars to non-PLANYC areas: school buildings, neighborhood revitalization projects, a new police academy, public hospitals and non-profit cultural institutions. Spending was spread out across many objectives instead of being focused on a handful of important priorities.
These projects were paid for by proceeds from the sale of bonds; with the economy thriving between 2003 and 2008, growing revenues allowed the City to borrow increasing amounts without debt service exceeding 15 percent of tax revenue, the Administration’s affordability metric. This limited the need to prioritize projects strictly; more projects could be undertaken at once.
As Figure 7 shows, most large states fund public capital projects with a mix of debt and current budget resources. When the economy is doing well, state and local governments flush with revenues typically
$0 $2,000 $4,000 $6,000 $8,000 $10,000
Florida
California
New York City
New York State
Illinois
New Jersey
Maryland
Ohio
Washington
Figure 7: Capital Spending by Source of Funds, Selected States and New York City, FY2012
(dollars in millions)
Pay-Go Capital
Intergovernmental Funds
Bonds
Sources: National Association of State Budget Officers, "Chapter 8: Capital Expenditures," State Expenditure Report, 2013; NYC Office of Management and Budget, Executive Budget for Fiscal Year 2014, May 2, 2013.

Planning After PLANYC: A Framework for Developing New York City’s Next Ten-Year Capital Strategy
19
increase “pay-go” capital from the operating budget.39 While the City recognized record year-end general fund surpluses ranging from $3.5 to $4.7 billion between fiscal years 2005 and 2008, just $500 million was devoted to pay-go capital in fiscal years 2006 and 2007— less than 3 percent of the capital commitments registered in these two years. Since 2008, surplus funds have been used to plug budget deficits and the capital budget has been financed exclusively with debt, resulting in the City’s high debt burden.
Increased Capital Spending During a Period of High Construction Costs
Capital spending began to ramp up in 2005, in the midst of a construction boom during which costs were escalating rapidly. General contractors reported annual cost increases as high as 10 to 12 percent in 2005 and 2006.40 By 2008, construction costs citywide were 30 percent higher than they were in 2002.41 The construction bid price for school capacity projects increased from $314 to $468 per square foot— an increase of almost 50 percent— between fiscal years 2003 and 2008. The average cost per street lane mile resurfaced citywide increased similarly during this period. Driving the increases were high land, labor and material costs, as well as “soft costs” such as those related to design, insurance and financing.42
The City bid many construction projects during this time period, with a record level of commitments in fiscal years 2007 and 2008. Contracts were more pricey— not only because costs were rapidly rising, but because the boom resulted in a shortage of contractors available to undertake the work.43 The share of construction contracts which received at least 3 bids declined from 91 percent to 82 percent between fiscal years 2004 and 2008. As a share of contract value, the decline was steeper, dipping from 85 percent to just 26 percent. This indicates several large contracts—mostly for the water and sewer system—were bid with little competition, and hence limited opportunities for savings.
The city has continued to maintain a robust capital program since 2008, and the number of contracts soliciting at least 3 bids has grown steadily to encompass almost all contracts— 93 percent by number and 96 percent by value— in fiscal year 2013.
Contracting and Management Challenges Contributed to Delays and Overruns
State laws complicate contracting and management of public projects in three important ways: the method of procurement; the pay and scheduling of workers; and organization of the work.
State law restricts the procurement methods available to the City. Construction contracts must be awarded to the lowest bidder. This does not allow the City to bid contracts under the “best value” method, which permits consideration of the expertise and prior performance of a contractor, the quality of materials and approach, and other relevant factors in addition to price.
The State’s prevailing wage laws govern the compensation and scheduling of construction and building service workers on public projects. In New York City, the Comptroller is responsible for the annual determination of wages and supplemental pay for fringe benefits that public contractors doing business with the city must provide their employees. A 2012 CBC report found these wages were not determined in a simple or transparent manner, and were almost always higher than mean hourly wages in the New York City metropolitan area— in some cases, by as much as 200 percent. Mandated supplemental rates of pay were also quite costly, doubling the wages of some titles and trades.44
The prevailing wage statute also imposes strict work rules. Employees in building and construction trades are not permitted to work more than 8 hours a day or five days a week, except in cases of “extraordinary emergency.” In addition, rest periods of 20 minutes or less are considered time worked.
Citizens Budget Commission
20
Any hours worked in excess of eight hours in a single day are subject to overtime pay, which must be paid even if employees are called to work fewer than five days in a given week or do not reach a maximum of 40 hours that week. Employers must apply and be authorized by the State Department of Labor to allow a 10-hour/ 4-day work schedule, and there are few such exceptions. These restrictions add to the cost of labor on public projects; a report by the Citizens Housing and Planning Council found prevailing wage mandates increase the cost of housing construction by 25 percent.45
Another state regulation, Wicks Law, requires several subcontractors to work on building construction or renovation. The Office of Management and Budget estimates it increases costs by 14 percent on average,46 although by some accounts, subcontractors add 20 percent to their bids to general contractors for public projects.47 Bidding the work out to one contractor and letting her delegate the work would be more efficient and cost-effective.
Wicks Law is one reason some construction projects are not completed on schedule. Thirty-one percent of school capital improvement projects are completed late and 29 percent are over-budget. Almost 30 percent of structural work on bridges is completed late. The Department of Design and Construction, which manages the capital portfolios of most city agencies, reports that 10 to 15 percent of design projects and 12 to 17 percent of construction projects are late.
Contributing to delays is the lengthy time to process change orders. Change orders authorize additional work on a project that is outside the original scope, but not a material change to the project; common reasons for change orders include uncertain field conditions, design omissions or errors or changes necessitated by administrative or political input. Reforms enacted in 2008 focused on halving the time needed by agencies to process changes orders caused by unforeseen field conditions from 300 days to 150 days,48 but the average time to process change orders remains high: 71 days for design work and 98 days for construction work, on average.
Design change orders tend to be more costly than construction change orders. The average design change order was approximately $750,000, and the total value of design change orders in fiscal year 2013, $130 million, constituted almost 20 percent of the original contract values. While some of these changes are intended to reduce construction costs later in the process, they are also indicative of insufficient scoping and a lack of capacity to manage the design process. Fortunately, both the volume and the value of design change orders have declined since fiscal year 2008, the first year for which data was reported. A pilot project in which $20 million in operating budget resources were appropriated for preliminary project scoping has contributed to this decline.49
On the other hand, the number of construction change orders doubled since fiscal year 2006 and the value grew from $210 million to $500 million in fiscal year 2013. Change orders increased the value of contracts by 3.5 percent on average, but by as much as 11 percent for agencies such as the Department of Parks and Recreation.
Almost 40 percent of all construction change orders originate from a single agency: the Department of Environmental Protection (DEP). In the last decade, DEP has undertaken large capital projects that have suffered from delays and cost overruns. The most prominent example is the Croton Water Filtration Plant, originally projected in 2004 to be completed in 2012 at a cost of $1.2 billion.50 According to the Independent Budget Office, the project was poorly scoped, resulting in cost underestimations, including parts of the project being completely left out of the original estimates.51 Amidst delays, the cost ballooned to $2.1 billion, and the federal government began fining the City $30,000 per day for failing to have a primary contactor in place to start work.52 The cost of completing the plant is now projected to be $3.2 billion,53 more than double the original cost. Plant commissioning is not expected to occur until the first quarter of 2014.54

Planning After PLANYC: A Framework for Developing New York City’s Next Ten-Year Capital Strategy
21
The Catskill/Delaware Ultra Violet Filtration Plant is another megaproject that has suffered cost overruns. The UV Plant was constructed in response to the federal Surface Water Treatment Rule, which requires filtration of surface water unless a waiver is acquired.55 To avoid a $10 billion full-scale filtration plant, the DEP won approval in 2004 to construct the UV facility at an expected cost of $600 million. Operations were expected to begin in 2009; the plant began operating in 2012 and was completed, at a cost of $1.6 billion, in October 2013.56
Capital spending by the Department of Environmental Protection is projected to decrease as the City completes large, over-budget, federally-mandated projects like the Croton Water Filtration Project. This spending trajectory assumes that currently planned megaprojects57 will not experience the cost overruns of past projects and that the City will successfully fend off any additional mandates. Part of this strategy calls for limiting traditional, or “grey,” infrastructure investments and supplementing them with “green” technologies and investments, like swales, green roofs and permeable pavements. These investments are expected to achieve important goals, like limiting combined sewer overflows, in a more cost-effective and eco-friendly manner than building massive new plants.
Funding Gap for Resiliency and Mitigation Efforts
PLANYC included many initiatives to limit the impact of climate change on the city: replicating the Staten Island Bluebelt model, expanding wetlands, changing building codes to improve sustainability, expanding sewers, creating green spaces and improving the reliability of power delivery.58 Many efforts were already underway and funded in the capital budget.
After Hurricane Sandy, the Bloomberg Administration issued a report that analyzed the weaknesses in the city’s infrastructure and government operations during and immediately after the storm. The report made a broad set of recommendations for repairing infrastructure, hardening utilities and
0
500
1,000
1,500
2,000
2,500
3,000
$-
$100
$200
$300
$400
$500
$600
FY2006 FY2007 FY2008 FY2009 FY2010 FY2011 FY2012 FY2013
Dolla
rs in
Mill
ions
Figure 8: Construction Change Orders, Value and Count,City of New York, FY2006-FY2013
Value Count
Source: New York City Mayor's Office of Contract Services, "Agency Procurement Indicators," Fiscal Years 2006-2013.
Citizens Budget Commission
22
buildings, improving coastal protection, particularly in the most vulnerable neighborhoods, and generally mitigating the impact of future storms.
The plan’s price tag was $20 billion; however, this was an understatement, as for many of the recommendations, e.g. “Seaport City,” the specified cost is for studying the feasibility of the project, rather than completing it. More importantly, even with half the stated cost expected to be covered by federal funds and $5.5 billion already authorized in the Capital Strategy, the plan still had a stated funding gap of $4.5 billion.59

Planning After PLANYC: A Framework for Developing New York City’s Next Ten-Year Capital Strategy
23
FRAMEWORK FOR DEVELOPING THE NEXT TEN-YEAR CAPITAL STRATEGY
When the new mayor enters office in January 2014, he will have a year to devise a Preliminary Ten-Year Capital Strategy to start in fiscal year 2016. Capital investment is important to the city’s continued competitiveness as a place to live, work and visit. As the city’s population grows, infrastructure continues to age, and the threats of climate change become increasingly apparent, the next mayor and his team will have to address these challenges in a fiscally responsible and cost-effective way. CBC proposes this framework to help the next administration develop the Ten-Year Capital Strategy for Fiscal Years 2016-2025:
Improve Asset Management and the Capital Planning Process
Capital strategy priorities should be informed by capital needs. Keeping assets properly maintained and limiting the growth in state of good repair work requires having protocols in place for maintaining and replacing assets regularly.
There is no single, comprehensive source on the condition of the city’s assets and infrastructure; agencies use different criteria and metrics for their assessments and reporting. The City Charter intended the Asset Information Management System (AIMS) report to be the citywide asset inventory and condition report, but AIMS is not comprehensive in scope; it excludes the water and sewer system and public housing, both managed by public authorities, as well as less valuable assets like equipment and vehicles.60 For agencies that do provide estimates, they do not dovetail with other capital planning documents— neither the objectives specified in the capital strategy nor spending provided in the capital budget. This makes it extremely difficult to understand the trade-offs between and within agencies, to assess progress toward achieving state of good repair, and to understand clearly what capital spending is intended to achieve each fiscal year.
The next administration should take four steps to improve the city’s asset management and capital planning processes. First, it should enact clear guidelines or directives for performing routine maintenance and regular replacement of assets. This will prevent the state of good repair backlog from growing and will limit the costly damages and emergency repairs that occur when assets long past their useful lives break or malfunction.
Second, all city agencies and component units should undertake a comprehensive needs assessment that details the condition of major asset classes and the cost to fix those in disrepair. The City of Portland provides a model for a citywide asset report that is clear and easy to understand. It details the replacement value of assets, summarizes asset management practices and accepted industry best practices, describes approaches for inspecting assets and the confidence level of the assessment, analyzes asset condition, and reports a funding gap based on standards for asset upkeep and service delivery.61
Third, the needs assessment should be used to develop a plan to achieve state of good repair. The plan should include a detailed timeline with four-year and ten-year goals that are used to develop the capital budget, commitment plan and the ten-year strategy.
Finally, this timeline should be used to publish easy-to-read progress reports, similar to those issued for PLANYC, that describe what the capital program accomplished in that year relative to state of good repair goals. The progress report should not be limited to state of good repair objectives, of course; it should also show expansions in the city’s asset base and report on how major capital projects are proceeding, including whether they are on time and on budget.

Citizens Budget Commission
24
Develop an Investment Standard that Includes Policies for Debt and Pay-Go Capital
The next mayor must focus on reducing the city’s high debt burden. The scale of capital spending should be defined by an investment policy that includes two standards: one for maintaining a responsible level of debt and one for the regular use of pay-as-you-go capital.
Debt outstanding is high under either benchmark used by the rating agencies, and debt service currently makes up 12 percent of city-funded expenditures, which is above average. The most recent financial plan indicates the share will rise to 13.7 percent by fiscal year 2017. The next administration should articulate a standard for keeping debt from becoming unaffordable.
The administration should also develop criteria for paying for some capital expenses from the operating budget. Almost all states rely on a mix of debt and pay-go capital to fund their capital programs, and the use of pay-go funds helps keep the long-run debt burden manageable. A reasonable policy would be to fund the regular replacement of vehicles and equipment using pay-go capital; based on the most recent ten-year capital plan, this would result in $300 million in annual expenditures from the operating budget— less than one percent of the total. The administration may choose to seed a fund for pay-go capital with a new revenue source, such as tolls on the East River Bridges or taxi medallion sales to fund the regular reconstruction of roads or other transportation improvements. Another approach would be to have a standard for dedicating a share of yearly surplus revenues or annual budget growth toward capital projects.
Decreasing the debt level and using operating funds for capital expenses would also give the City some leeway to switch off between the methods of funding in a counter-cyclical way to maintain a level capital program, not one that spikes during good times and declines during recessionary periods.
Use Clear Guidelines to Establish Priorities in the Capital Strategy
Restraining the level of debt incurred by the City will require greater prioritization of projects in the capital plan. Rather than pursuing a diffuse set of priorities, investment should be focused with the purpose of achieving transformative results toward the improvement of the city’s assets and reaching state of good repair.
The mayor will have very little flexibility with a portion of the capital plan. Some projects, such as those mandated by the federal or state governments and those related to hazard, will have to be included in the plan. Large, ongoing projects, such as the third water tunnel, in which the City has already invested substantial resources, should also continue. And it makes sense to include projects that are backed or tied to federal or state funds, like post-storm recovery and some resiliency initiatives. In some cases, the mayor may exercise discretion to slow down the pace of expenditures; for example, he may dedicate less per year toward constructing the third water tunnel in Queens or rehabilitating the school system while still maintaining a level of investment that allows for progress toward those goals.
To devise the remainder of the plan, the City should adopt a “fix it first” strategy, in which state of good repair projects receive priority at each agency. After serious disinvestment in infrastructure in the 1970s and 1980s, the City made progress in improving the condition of its capital stock. But capital needs remain large for some agencies; a concerted focusing of resources toward state of good repair is needed to finally put a real dent in the maintenance backlog. Seventy percent of the next Ten-Year Capital Strategy should be dedicated to state of good repair work until 70 percent of the state of good repair backlog is eradicated. The share of spending dedicated to state of good repair can then be reduced to give greater priority to other investments.

Planning After PLANYC: A Framework for Developing New York City’s Next Ten-Year Capital Strategy
25
The next set of priorities should be for the regular replacement of those assets needed to ensure that service levels are maintained or improved. Replacement offers an opportunity to use technological advances to recognize efficiencies, such as swapping single-spot parking meters prone to failure with the multi-area muni-meters that accept credit cards.
Any funds that remain should be dedicated to new or expansionary projects. Proposed expansion projects should be accompanied with rigorous cost-benefit analysis demonstrating service improvements or economic enhancements, and only projects with the greatest potential return on investment should be included in the capital plan. Some examples of worthy investments in the current capital plan include $400 million to construct or extend sewers in Queens and Staten Island, with priority given to areas that experience frequent flooding and are served only by septic systems or sanitary drains; a $46 million “re-engineering” initiative to modernize the computer systems and databases of the Human Resource Administration, allowing it to improve customer service while reducing its staff by 385 positions; 62 and $20 million for street upgrades, including lane markings, signals and a photo enforcement system, to expand or improve Select Bus Service.63
Adopt More Cost-Effective Approaches to Contract and Construction Management
Changes to contracting rules and practices are necessary. Increased funding in the operating budget for project scoping can improve the design process and reduce the need later for change orders. The City should also renew its Project Labor Agreements to reduce labor costs and improve managerial flexibility. First negotiated in 2009, these agreements saved between 3 to 15 percent on 213 project contracts worth a total of $3 billion, with $300 million in estimated capital budget savings over four years.64 The savings are derived from exemptions to Wicks Law requirements and changes to work rules, most notably caps to overtime and flexibility in scheduling times and across job sites. The Project Labor Agreements expire on June 30, 2014 and should be renewed.
City leaders should also advocate for changes to contracting rules that increase costs and impede efficient construction management. This State agenda should consist of a repeal of Wicks Law and an expansion of the city’s toolbox for effective contracting, including the latitude to award construction contracts on a “best value” basis and the authority to pursue public-private partnerships. “Best value” contracts would allow city agencies to choose contractors with a demonstrated record of timely and on-budget performance, limiting the need for change orders, or to select a bid that promises higher
A “Fix it First” Strategy
In 2003, the Michigan Department of Transportation released a capital plan called “Preserve First,” in which capital investments designed to bring the transportation network to state of good repair were prioritized over expansions. New projects were deferred until 90 percent of existing roads and bridges were restored to good condition. This prioritization led to a significant increase in the condition of the state’s surface transportation assets: the share in fair or good condition increased from 84 to 94 percent for non-freeway bridges and from 70 percent to 87 percent for pavement between 2002 and 2012. The National Cooperative Highway Research Program praised the use of a variety of fixes at critical points in asset lifecycles to maximize infrastructure investments.

Citizens Budget Commission
26
quality materials that can reduce maintenance costs down the road. Public-private partnerships build on best value contracting, as CBC explained in its 2008 report, by focusing on objectives, costs and asset performance across the entire lifecycle of a capital asset, allowing the city to achieve savings across both capital and operating budgets.65

Planning After PLANYC: A Framework for Developing New York City’s Next Ten-Year Capital Strategy
27
ENDNOTES
1 See New York City Charter, Chapter 1, Section 17. The Mayor’s strategic policy statement should also draw upon the strategic policy statements issued by borough presidents.
2 Community boards submit Statements of Community District Needs that detail their operating and capital budget priorities.
3 New York City Charter, Chapter 8, Section 203; see also New York City Department of City Planning, “Fair Share Criteria: A Guide for City Agencies,” 1998.
4 See New York City Charter, Chapter 8, Section 204. Significant expansions and reductions are those that would expand or reduce the size or capacity of a facility by 25 percent or more.
5 National Association of State Budget Officers, “Capital Expenditures,” State Expenditure Report: Examining Fiscal 2010-2012 State Spending, 2013.
6 In fiscal years 2006 and 2007, $500 million in pay-go capital was allocated from the budget.
7 To see a calculation of the City’s legal debt margin under the constitution dating back to 1997, visit New York City Office of the Comptroller, “Legal Debt Margin Information,” CheckbookNYC, accessed October 15, 2013, http://www.checkbooknyc.com/trends/node/407.
8 In 2001, the Giuliani Administration issued a statement of debt policy that defined an affordable debt burden as one for which debt service does not exceed 20 percent of city tax revenues.
9 The New York City Charter states the preliminary version of the Ten-Year Capital Strategy should be released in November of even-numbered years, although the last few editions have been released in January of odd-numbered years with the Preliminary Financial Plan. The City Planning Commission and City Council hold hearings on the plan, solicit input from borough presidents, community boards and the public, and issue responses that are taken into account before a final version is released in April.
10 For more information on prevailing wage, see Citizens Budget Commission, “6 Things New Yorkers Should Know About Prevailing Wage,” February 2012, http://www.cbcny.org/sites/default/files/REPORT_PrevailingWage_02142012.pdf.
11 Includes $4.9 billion reserve for unattained commitments; net of this reserve, the commitment plan for fiscal year 2014 is $16 billion. Total commitments in fiscal years 2014 reflect an agreement by the Mayor, Comptroller and City Council to accelerate work originally planned in fiscal years 2015 and 2016.
12 State legislation authorized the New York City Transitional Finance Authority to issue $9.4 billion in Building Aid Revenue Bonds (BARBs) to finance a portion of New York City’s capital program for schools. Under the agreement, the State increased its building aid, reimbursement for certain construction-related expenses, to the City; the City then assigned all State building aid to back the BARBs.
13 City of New York, “Mayor Bloomberg and Commissioner Strickland Detail $20 Billion Investments in City Water System Since 2002,” Press Release, May 13, 2013, http://on.nyc.gov/17KeDuI.
14 City of New York, “Mayor Bloomberg and Commissioner Strickland Detail $20 Billion Investments in City Water System Since 2002,” May 13, 2013, http://on.nyc.gov/17KeDuI.
15 Also affecting the quality of road surfaces is utility construction and renovation. The assets of most important utilities, including water mains, sewers, electrical lines and telecommunications cables, are located underground. In order to expand, repair or maintain any of this infrastructure, utility company personnel must cut into the roadway; they are responsible for repairing the road surface once their work is completed, but the quality of such work varies.
16 For more information on the methodology used, see TRIP, “Bumpy Roads Ahead: America’s Roughest Rides
Citizens Budget Commission
28
and Strategies to Make our Roads Smoother,” October 3, 2013, http://www.tripnet.org/docs/Urban_Roads_Report_Oct_2013.pdf.
17 New York City Mayor’s Office of Operations, NYC Feedback: Citywide Customer Survey, December 2008.
18 New York City Office of the Comptroller, “Dilemma in the Millennium: Volume 1,” August 1998.
19 Rahul Jain, “Economic Development Reporting in New York City: What’s Missing?” April 12, 2012, http://www.cbcny.org/cbc-blogs/blogs/economic-development-reporting-new-york-city-what%E2%80%99s-missing.
20 These institutions are the American Museum of Natural History, Carnegie Hall, the Lincoln Center for the Performing Arts, the Metropolitan Museum of Art, the New York Botanical Garden and the Wildlife Conservation Society.
21 Five hundred million in operating budget revenues were dedicated to capital projects in fiscal years 2006 and 2007.
22 Fitch Ratings, “U.S. Local Government Tax-Supported Rating Criteria,” August 14, 2012, pg. 8. See also Fitch’s discussion of the city’s “high debt burden” in its rating of the City’s GO bonds in Business Wire, “Fitch rates New York City’s GOs ‘AA’,” February 22, 2013, accessed February 23, 2013, http://www.businesswire.com/news/home/20130222005858/en/Fitch-Rates-York-City-NYs-GOs-AA.
23 Standard and Poor’s public finance ratings criteria as reported by New York City Comptroller, “Fiscal Year 2013 Annual Report on Capital Debt and Obligations,” December 2012, pg. 25. See also Standard and Poor’s, “RatingsDirect: New York City; General Obligation,” February 25, 2013, accessed April 29, 2013, http://www.comptroller.nyc.gov/bureaus/pf/pdf/ratings-reports/SP-Report-NYC-GO-2013-F1F2GH-FRN-Reoffering.pdf.
24 New York City Office of Management and Budget, “Executive Budget Fiscal Year 2014: Budget Summary,” pg. 32, http://www.nyc.gov/html/omb/downloads/pdf/sum5_13.pdf.
25 Estimates for the increase in gross domestic product for every additional dollar spent by the federal government. For more information, see Moody’s Analytics, “Global Policy Prescriptions: How Another Recession Can Be Avoided,” August 2011, http://www.moodysanalytics.com/~/media/Insight/Economic-Analysis/Dismal/11-26-08-Global-Policy-Prescriptions-How-Another-Recession-Can-Be-Avoided.ashx.
26 SEIU Local 32BJ, “Falling Further Apart: Decaying Schools in New York City’s Poorest Neighborhoods,” 2013.
27 See, for example, details of the agency’s program-to-eliminate the gap in the Executive Budget for Fiscal Year 2009, pg. 36, http://www.nyc.gov/html/omb/downloads/pdf/sum5_08.pdf
28 SEIU Local 32BJ, “Falling Further Apart: Decaying Schools in New York City’s Poorest Neighborhoods,” 2013.
29 Lisa W. Foderaro, “After Accidents and Lawsuits, More Money for Tree Care,” The New York Times, July 5, 2012, http://www.nytimes.com/2012/07/06/nyregion/new-york-officials-increase-budget-for-care-of-street-trees.html.
30 Lisa W. Foderaro, “After Accidents and Lawsuits, More Money for Tree Care,” The New York Times, July 5, 2012, http://www.nytimes.com/2012/07/06/nyregion/new-york-officials-increase-budget-for-care-of-street-trees.html.
31 Kerry Wills, Barry Paddock and Bill Hutchinson, “Bronx water main break floods streets, snarls traffic,” New York Daily News, July 27, 2011, http://www.nydailynews.com/new-york/bronx-water-main-break-floods-streets-snarls-traffic-article-1.159539; Perry Chiaramonte, “Water-main break causes massive flood in Bronx,” The New York Post, July 28, 2011, http://nypost.com/2011/07/28/water-main-break-causes-massive-flood-in-bronx/.
32 NY1News, “Bronx Water Main Break Snarls 6 Train Service,” August 19, 2013, available at http://www.ny1.com/content/news/transit/187347/bronx-water-main-break-snarls-6-train-service.

Planning After PLANYC: A Framework for Developing New York City’s Next Ten-Year Capital Strategy
29
33 Federal Highway Administration, Insights into Pavement Preservation: A Compendium, U.S. Department of Transportation, January 2000, pg. 19, http://www.fhwa.dot.gov/infrastructure/asstmgmt/compend.pdf.
34 The share funded varies by agency.
35 New York City Housing Authority, “NYCHA Eliminates More than 233,000 Repair Work Orders from Its Backlog,” Press Release, September 4, 2012, http://www.nyc.gov/html/nycha/html/news/nycha-eliminates-over-233000-repair-work-orders-from-its-backlog.shtml.
36 New York City Housing Authority, “Plan NYCHA: A Road Map for Preservation,” December 2011, pgs. 11-12, http://www.nyc.gov/html/nycha/downloads/pdf/plan-nycha.pdf.
37 AECOM, “Fiscal Year 2013 Consulting Engineer’s Report,” March 1, 2013, http://www.nyc.gov/html/nyw/pdf/fy13_consulting_engineers.pdf.
38 Edward M. Gramlich, “Infrastructure Investment: A Review Essay,” Journal of Economic Literature, v. 3. no. 3, September 1994, pgs. 1176-1196.
39 See, for example, Michael A. Pagano, “Municipal Capital Spending during the ‘Boom,’” Public Budgeting & Finance v. 22 no. 2, Summer 2002, pgs. 1-20.
40 New York Building Congress, “New York’s Rising Construction Costs: Issues and Solutions,” 2008.
41 CBC Analysis of the ENR-McGraw Hill Construction Cost Historical Index for New York City.
42 New York Building Congress, “New York’s Rising Construction Costs: Issues and Solutions,” 2008; Rosemary Scanlon, “Raise the Roof, Lower the Costs: Construction Costs and Housing Affordability in New York City,” Center for Urban Innovation, July 2008, http://www.rpa-cui.org/pdf/200806_raise_the_roof_lower_the_costs.pdf.
43 Rosemary Scanlon, “Raise the Roof, Lower the Costs: Construction Costs and Housing Affordability in New York City,” Center for Urban Innovation, July 2008, http://www.rpa-cui.org/pdf/200806_raise_the_roof_lower_the_costs.pdf.
44 Citizens Budget Commission, “6 Things New Yorkers Should Know About Prevailing Wage,” February 2012, http://www.cbcny.org/sites/default/files/REPORT_PrevailingWage_02142012.pdf.
45 Citizens Planning and Housing Council, “Prevailing Wisdom: The Potential Impact of Prevailing Wages on Affordable Housing,” December 2008, http://www.chpcny.org/wp-content/uploads/2011/02/Prevailing-Wisdom-web-version1.pdf.
46 New York City Office of Management and Budget, “January 2010 Financial Plan,” January 28, 2010, pg. 30, http://www.nyc.gov/html/omb/downloads/pdf/tech1_10.pdf.
47 New York Building Congress, “New York’s Rising Construction Costs: Issues and Solutions,” 2008, pg. 5.
48 City of New York, “Mayor Bloomberg Announces Reforms to Make City Capital Construction Project More Affordable and Efficient,” Press Release, July 28, 2008.
49 City of New York, “Mayor Bloomberg Announces Reforms to Make City Capital Construction Project More Affordable and Efficient,” Press Release, July 28, 2008.
50 New York City Department of Environmental Protection, “Croton Water Treatment Plan Final Supplemental Environmental Impact Statement Executive Summary,” accessed September 26, 2013, available at http://www.nyc.gov/html/dep/pdf/croton/execsumm.pdf.
51 New York City Independent Budget Office, “Increasing Costs of the Croton Filtration Plant at Mosholu,” November 2008, http://www.ibo.nyc.ny.us/iboreports/croton2008.pdf.
52 Timothy Williams, “U.S. Fines the City $30,000 a Day Over Delay in Water Filtration Project, The New York

Citizens Budget Commission
30
Times, August 11, 2007, available at http://www.nytimes.com/2007/08/11/nyregion/11plant.html.
53 Juan Gonzalez, “Ten years later, Croton Water Filtration Plan deal to invest in parks, playgrounds a mess of broken promises,” New York Daily News, June 25, 2013, available at http://www.nydailynews.com/new-york/bronx/croton-water-filtration-system-deal-mess-broken-promises-article-1.1382460.
54 New York City Department of Environmental Protection, “Croton Facility Monitoring Committee Meeting Notes,” June 6, 2013, accessed September 26, 2013, available at http://www.nyc.gov/html/dep/pdf/croton6-6-13.pdf.
55 New York City Department of Environmental Protection, “2011 Watershed Protection Program Summary and Assessment,” March 2011, http://www.nyc.gov/html/dep/pdf/reports/2011_watershed_protection_program_summary_assessment.pdf.
56 New York City Department of Environmental Protection, “Deputy Mayor Holloway and Commissioner Strickland Announce Completion of Catskill/Delaware Ultraviolet Treatment Facility for Drinking Water,” Press Release, October 8, 2013, http://www.nyc.gov/html/dep/html/press_releases/13-104pr.shtml.
57 Includes $2.9 billion for upgrades to city wastewater treatment facilities and conveyance infrastructure; $195 million for a new cogeneration plant at the North River Plant; $560 million for the construction of a bypass tunnel at the Delaware Aqueduct; $392 million for modifications at the Hillview Reservoir; and $138 million for the reconstruction of the Gilboa Dam. New York City Office of Management and Budget, Ten-Year Capital Strategy, Fiscal Years 2014-2023, May 2013.
58 See City of New York, “PLANYC: Update 2011,”pg. 154, for a neat summary.
59 City of New York, “PLANYC: A Stronger More Resilient New York,” NYC Special Initiative for Rebuilding and Resiliency, accessed September 26, 2013, http://www.nyc.gov/html/sirr/html/report/report.shtml.
60 In 2008, the Office of Management and Budget reported that the Asset Information Management System (AIMS) would be upgraded and expanded to be more comprehensive and to allow agencies to define and prioritize state of good repair requirements; however, the AIMS report has not changed. System upgrades were limited to the creation of an intranet portal to improve data access. For more information, see New York City Office of Management and Budget, Executive Budget for Fiscal Year 2009: Message of the Mayor, pgs. 70-71, and Executive Budget for Fiscal Year 2014: Message of the Mayor, pg. 56.
61 City of Portland, “2012 Citywide Assets Report: Status and Best Practices,” http://www.portlandoregon.gov/bps/article/441932.
62 See New York City Office of Management and Budget, “November 2012 Plan: Agency Gap Closing Programs,” November 9, 2012, http://www.nyc.gov/html/omb/downloads/pdf/peg11_12.pdf.
63 New York City Office of Management and Budget, Ten-Year Capital Strategy, Fiscal Years 2014 to 2023, May 2013, pg. 22.
64 See New York City Mayor’s Office of Contract Services, “NYC Project Labor Agreements,” http://www.nyc.gov/html/mocs/downloads/pdf/pla/PLA%20Vendor%20Training%20Slides.pdf; New York City Mayor’s Office of Contract Services, Agency Procurement Indicators, Fiscal Year 2013, http://www.nyc.gov/html/mocs/downloads/pdf/Fiscal%202013%20Procurement%20Indicators%20complete%20text%20_10%2007_final_forweb.pdf.
65 See also Maria Doulis, “The Do’s and Don’ts of PPPs,” Citizens Budget Commission Blog, December 5, 2011, http://www.cbcny.org/cbc-blogs/blogs/dos-and-don%E2%80%99ts-ppps. For examples of prospects for public-private partnerships in New York City, see Maria Doulis, “Think Small to Think Big,” PPP Journal no. 73, also available at http://www.cbcny.org/sites/default/files/OPED_PPPJ_07012011.pdf.