planning and economic development - stpaul.gov service… · planning and economic development...
TRANSCRIPT

Planning and Economic Development
Director
Admin.\Financial Services Housing•DepartmentAccounting•Admin/Operations•Asset&ContractMgmt.•CapitalBudgeting•Neighborhood& CulturalSTAR
•HumanResources•ProgramReporting/Compliance
•ProgramCompliance•GrantWriting•CommunicationServices
•HousingFinance•SingleFamilyPrograms•MultiFamilyPrograms•EnergyImprovements•MortgageForeclosurePrevention•HomelessnessPrevention•InvestSaintPaul–ISPImplementation–NSP1&2Implementation–ProjectServices–CommunityEngagement
•HousingResearch/Statistics•GrantWriting
•HRAExecutiveDirector•Dept.PolicyOversight&Coordination•Fiscal&HumanResourceManagement
•MBDRLiaison•BusinessConcierge•StrategicInvestments•BondFinancing•LivableCommunities•CreditCommittee•TaxIncrementFinancing•GrantWriting
•Citywide/NeighborhoodPlanning
•ZoningCases•HeritagePreservation•Research/GIS•EnvironmentalReviews•GrantWriting
Economic Development Planning
11.7 FTE 22.2 FTE
16.0 FTE18.2 FTE
4.0 FTE
(Total 72.1 FTE) 8/06/14
To actively create opportunities and encourage investment for the benefit of Saint Paul residentsand businesses, which preserve, sustain, and grow the city’s diverse neighborhoods.
1
Department Description:
Department Facts Department Goals
● Total General Fund Budget: $0
● Total Special Fund Budget: $48,274,982
● Total FTEs: 72.10
Recent Accomplishments
2015 Adopted Budget
Planning and Economic Development
PED's mission is to actively create opportunities and encourage investment for the benefit of Saint Paul residents and business, which preserve, sustain, and grow the City's diverse
neighborhoods. We accomplish this by assisting in the production of new housing; the rehabilitation and preservation of existing housing; providing mortgage financing to existing
homeowners and new homebuyers; and strategic commercial and economic development investment. These actions are guided by careful neighborhood planning by professional
planning staff, community collaboration, and inclusiveness. PED continues to build upon its past accomplishments, while looking forward to help establish Saint Paul as the Most
Livable City in America.
● Preserve and improve the City's affordable rental and ownership housing stock.
●Encourage private and public development along the Central Corridor Transit Line.
● Stimulate economic growth and vitality in neighborhoods by making strategic
investments in our commercial corridors.
● Provides planning/zoning/HPC services and administers Parking and Transit
Program.
•Economic Development: additional business development at Hamm's Brewery, $85+
million in conduit bond project development; $32 million in state bonding for Ordway,
Palace Theater, Children's Museum, Metro Business Plan Initiatives, 29 Small Business
Neighborhood STAR activities, Business Attraction, Retention and Citywide Expansion
Program.
• Planning: Continued progress with Central Corridor Plans, Public Art, Stormwater, and
Brownfields Assessment Grant, Ford Plant Redevelopment, Great River Passage Plan
Addendum, Streetcar Study, Market Watch Report, Historic Tax Cedit Design Review.
• Housing Development: Progress continues on Episcopal Homes, Hospital Linen Site,
Hamline Station, Custom House, Jamestown, Old Home Site, Maryland Apartments, 2700
University and Elder's Lodge.
• Housing assistance: Mortgage Foreclosure Prevention, Single Family Home Loans, Credit
and Bankruptcy counseling, HUD NSP rehabilitation and new construction in targeted
neighborhoods.
● 2015 operations budget is approximately $9.4 million.
● Administers in excess of $90 million annually in Federal, State, and local resources.
● Provides management of 200+ housing and economic development activities.
● Provides housing and economic development products (public lending institution).
● Administers a combined City/HRA loan portfolio of $150M+.
2
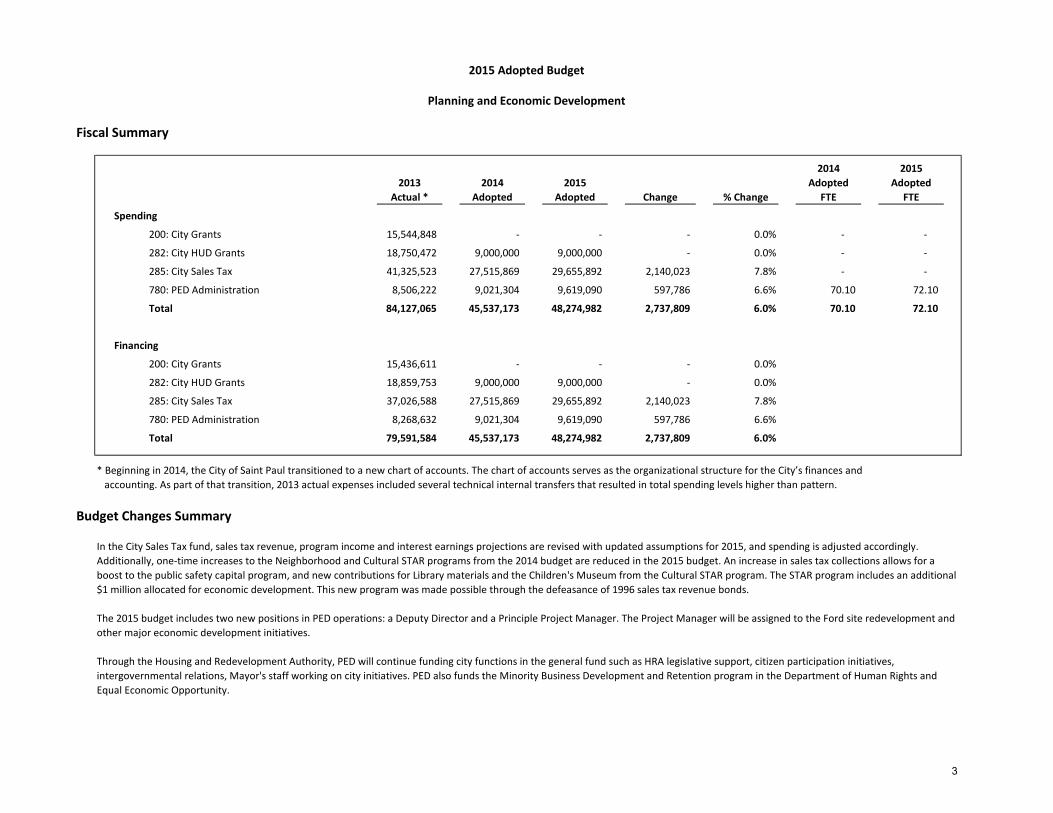
Fiscal Summary
2013
Actual *
2014
Adopted
2015
Adopted Change % Change
2014
Adopted
FTE
2015
Adopted
FTE
Spending
15,544,848 - - - 0.0% - -
18,750,472 9,000,000 9,000,000 - 0.0% - -
41,325,523 27,515,869 29,655,892 2,140,023 7.8% - -
780: PED Administration 8,506,222 9,021,304 9,619,090 597,786 6.6% 70.10 72.10
84,127,065 45,537,173 48,274,982 2,737,809 6.0% 70.10 72.10
Financing
15,436,611 - - - 0.0%
18,859,753 9,000,000 9,000,000 - 0.0%
37,026,588 27,515,869 29,655,892 2,140,023 7.8%
8,268,632 9,021,304 9,619,090 597,786 6.6%
79,591,584 45,537,173 48,274,982 2,737,809 6.0%
* Beginning in 2014, the City of Saint Paul transitioned to a new chart of accounts. The chart of accounts serves as the organizational structure for the City’s finances and
accounting. As part of that transition, 2013 actual expenses included several technical internal transfers that resulted in total spending levels higher than pattern.
Budget Changes Summary
2015 Adopted Budget
Planning and Economic Development
In the City Sales Tax fund, sales tax revenue, program income and interest earnings projections are revised with updated assumptions for 2015, and spending is adjusted accordingly.
Additionally, one-time increases to the Neighborhood and Cultural STAR programs from the 2014 budget are reduced in the 2015 budget. An increase in sales tax collections allows for a
boost to the public safety capital program, and new contributions for Library materials and the Children's Museum from the Cultural STAR program. The STAR program includes an additional
$1 million allocated for economic development. This new program was made possible through the defeasance of 1996 sales tax revenue bonds.
The 2015 budget includes two new positions in PED operations: a Deputy Director and a Principle Project Manager. The Project Manager will be assigned to the Ford site redevelopment and
other major economic development initiatives.
Through the Housing and Redevelopment Authority, PED will continue funding city functions in the general fund such as HRA legislative support, citizen participation initiatives,
intergovernmental relations, Mayor's staff working on city initiatives. PED also funds the Minority Business Development and Retention program in the Department of Human Rights and
Equal Economic Opportunity.
285: City Sales Tax
282: City HUD Grants
200: City Grants
282: City HUD Grants
285: City Sales Tax
200: City Grants
Total
780: PED Administration
Total
3

200: City Grants
Spending Financing FTE
No Changes from 2014 Adopted Budget - - -
Subtotal: - - -
Fund 200 Budget Changes Total - - -
282: City HUD Grants
Spending Financing FTE
No Changes from 2013 Adopted Budget - - -
Subtotal: - - -
Fund 282 Budget Changes Total - - -
Planning and Economic Development
The City Grants fund includes state and federal planning and development grants administered by PED.
Change from 2014 Adopted
Planning and Economic Development
The Community Development Block Grant (CDBG) program is administered in this fund. Because the annual grant period runs from June to May, program estimates
are initially proposed and adopted. Once the final grant award is known, projects are finalized via separate action.
Change from 2014 Adopted
4
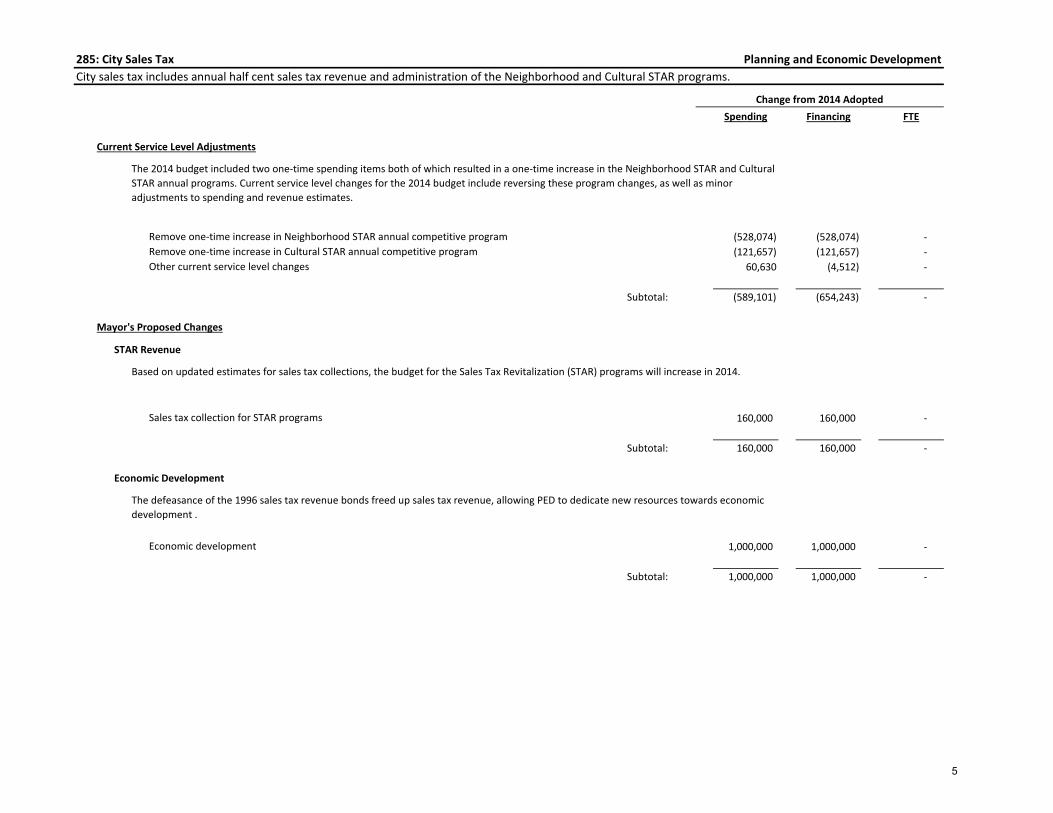
285: City Sales Tax
Spending Financing FTE
Current Service Level Adjustments
Remove one-time increase in Neighborhood STAR annual competitive program (528,074) (528,074) -
Remove one-time increase in Cultural STAR annual competitive program (121,657) (121,657) -
Other current service level changes 60,630 (4,512) -
Subtotal: (589,101) (654,243) -
Mayor's Proposed Changes
STAR Revenue
Sales tax collection for STAR programs 160,000 160,000 -
Subtotal: 160,000 160,000 -
Economic Development
Economic development 1,000,000 1,000,000 -
Subtotal: 1,000,000 1,000,000 -
Planning and Economic Development
Change from 2014 Adopted
City sales tax includes annual half cent sales tax revenue and administration of the Neighborhood and Cultural STAR programs.
The 2014 budget included two one-time spending items both of which resulted in a one-time increase in the Neighborhood STAR and Cultural
STAR annual programs. Current service level changes for the 2014 budget include reversing these program changes, as well as minor
adjustments to spending and revenue estimates.
Based on updated estimates for sales tax collections, the budget for the Sales Tax Revitalization (STAR) programs will increase in 2014.
The defeasance of the 1996 sales tax revenue bonds freed up sales tax revenue, allowing PED to dedicate new resources towards economic
development .
5
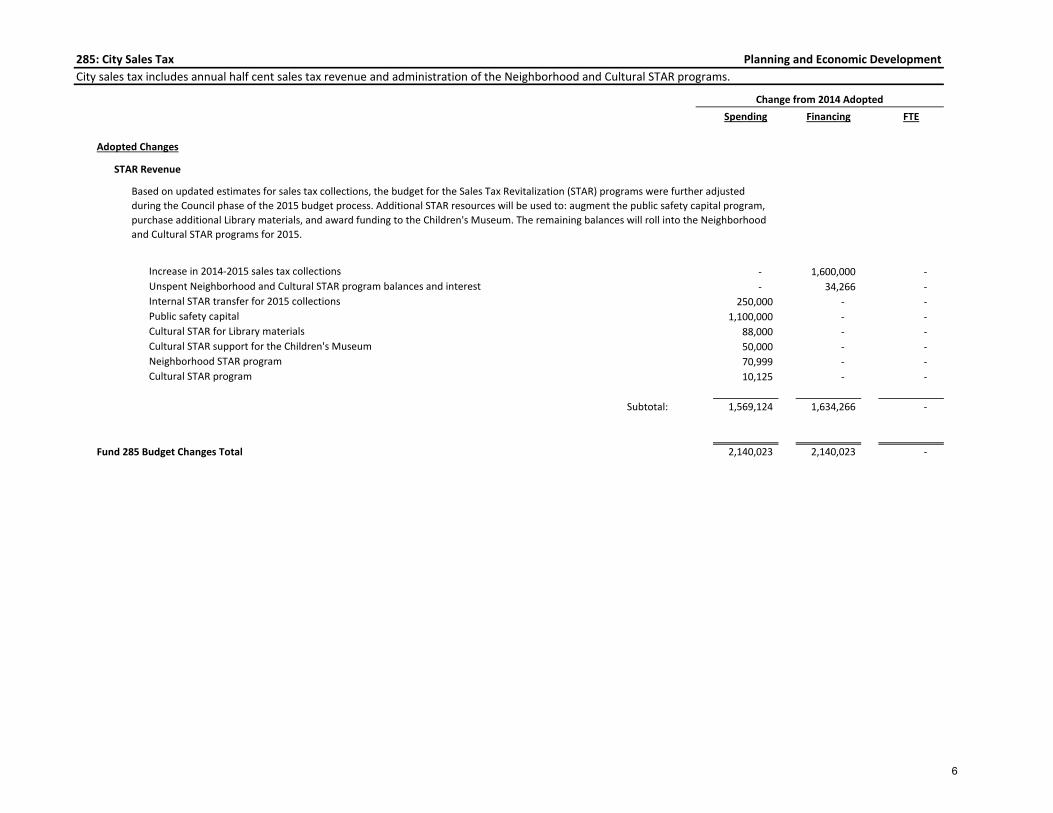
285: City Sales Tax
Spending Financing FTE
Adopted Changes
STAR Revenue
Increase in 2014-2015 sales tax collections - 1,600,000 -
Unspent Neighborhood and Cultural STAR program balances and interest - 34,266 -
Internal STAR transfer for 2015 collections 250,000 - -
Public safety capital 1,100,000 - -
Cultural STAR for Library materials 88,000 - -
Cultural STAR support for the Children's Museum 50,000 - -
Neighborhood STAR program 70,999 - -
Cultural STAR program 10,125 - -
Subtotal: 1,569,124 1,634,266 -
Fund 285 Budget Changes Total 2,140,023 2,140,023 -
Planning and Economic Development
City sales tax includes annual half cent sales tax revenue and administration of the Neighborhood and Cultural STAR programs.
Change from 2014 Adopted
Based on updated estimates for sales tax collections, the budget for the Sales Tax Revitalization (STAR) programs were further adjusted
during the Council phase of the 2015 budget process. Additional STAR resources will be used to: augment the public safety capital program,
purchase additional Library materials, and award funding to the Children's Museum. The remaining balances will roll into the Neighborhood
and Cultural STAR programs for 2015.
6

780: PED Administration
Spending Financing FTE
Current Service Level Adjustments 359,075 359,075 -
Subtotal: 359,075 359,075 -
Mayor's Proposed Changes
Staffing Additions
Deputy Director 143,871 143,871 1.00
Principle Project Manager 77,554 77,554 1.00
Associated overhead 17,286 17,286 -
Subtotal: 238,711 238,711 2.00
Fund 780 Budget Changes Total 597,786 597,786 2.00
In 2015, PED will add two new positions to help the department carry out its "Prosper St. Paul" initiative. A Deputy Director will be added to
manage organizational and operational issues, and a Principle Project Manager will lead work on the Ford Site redevelopment.
PED operations are all budgeted in the Central Service Internal fund.
Change from 2014 Adopted
Planning and Economic Development
7

Spending Reports 8

CITY OF SAINT PAULDepartment Budget Summary
(Spending and Financing)Department: Budget Year: 2015
2012Actuals
Change From
2014Adopted
2015Adopted
2014Adopted
2013Actuals
PLANNING ECONOMIC DEVELOPMENT
Spending by FundCITY GRANTS 3,742,476 15,544,848
CITY HUD GRANTS 26,988,016 18,750,472 9,000,000 9,000,000
CITY SALES TAX 39,611,285 41,325,523 27,515,869 29,655,892 2,140,023
PED ADMINISTRATION 8,438,132 8,506,222 9,021,304 9,619,090 597,786
TOTAL SPENDING BY FUND 48,274,982 45,537,173 84,127,065 78,779,909 2,737,809
Spending by Major AccountEMPLOYEE EXPENSE 6,791,374 7,842,534 7,371,659 6,511,012 470,875 SERVICES 4,912,903 3,149,042 3,001,798 4,478,174 147,244 MATERIALS AND SUPPLIES 64,527 64,725 55,750 54,401 8,975 PROGRAM EXPENSE 21,629,634 11,783,107 11,053,272 47,011,212 729,835 ADDITIONAL EXPENSES 8,437,975 165,000 165,000 (9,332,449)CAPITAL OUTLAY 7,654 1,538,000 1,535,000 14,379 3,000 OTHER FINANCING USES 36,935,842 23,732,574 22,354,694 35,390,337 1,377,880
TOTAL SPENDING BY MAJOR ACCOUNT 48,274,982 45,537,173 84,127,065 78,779,909 2,737,809
Financing by Major AccountTAXES 15,940,712 16,750,000 16,400,000 17,034,422 350,000
INTERGOVERNMENTAL REVENUE 26,890,174 8,100,000 8,100,000 28,755,859
CHARGES FOR SERVICES 9,894,590 9,619,090 8,897,719 12,919,639 721,371
INVESTMENT EARNINGS 700,050 253,418 301,159 (1,310) (47,741)
MISCELLANEOUS REVENUE 782,290 400,000 523,584 82,972 (123,584)
OTHER FINANCING SOURCES 24,542,957 12,009,210 10,664,979 20,800,003 1,344,231
BUDGET ADJUSTMENTS 1,143,264 649,731 493,533
TOTAL FINANCING BY MAJOR ACCOUNT 48,274,982 45,537,172 79,591,585 78,750,773 2,737,810
9
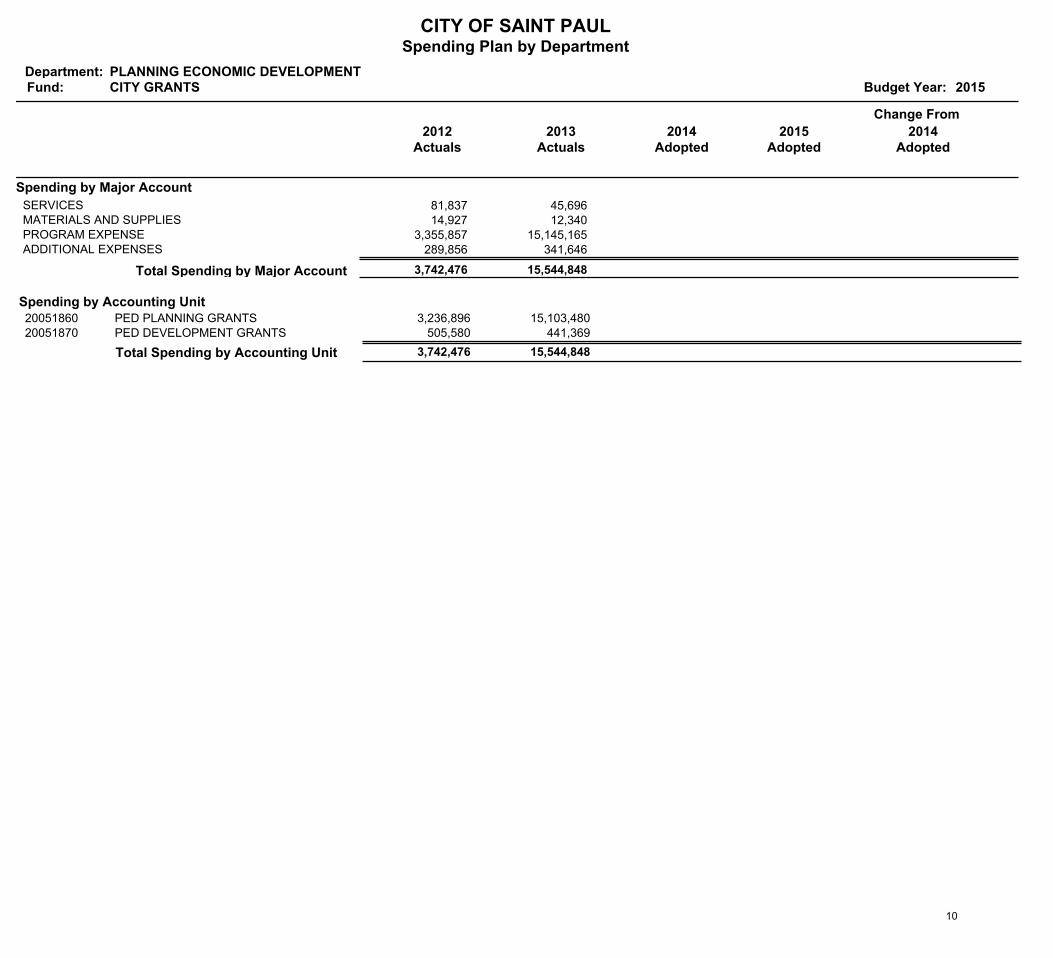
CITY OF SAINT PAULSpending Plan by Department
Department:Fund: Budget Year: 2015
PLANNING ECONOMIC DEVELOPMENTCITY GRANTS
2012Actuals
Change From
2013Actuals
2014Adopted
2015Adopted
2014Adopted
Spending by Major Account
81,837 45,696 SERVICES 14,927 12,340 MATERIALS AND SUPPLIES
3,355,857 15,145,165 PROGRAM EXPENSE 289,856 341,646 ADDITIONAL EXPENSES
15,544,848 3,742,476 Total Spending by Major Account
Spending by Accounting UnitPED PLANNING GRANTS 3,236,896 15,103,480 20051860PED DEVELOPMENT GRANTS 505,580 441,369 20051870
Total Spending by Accounting Unit 3,742,476 15,544,848
10
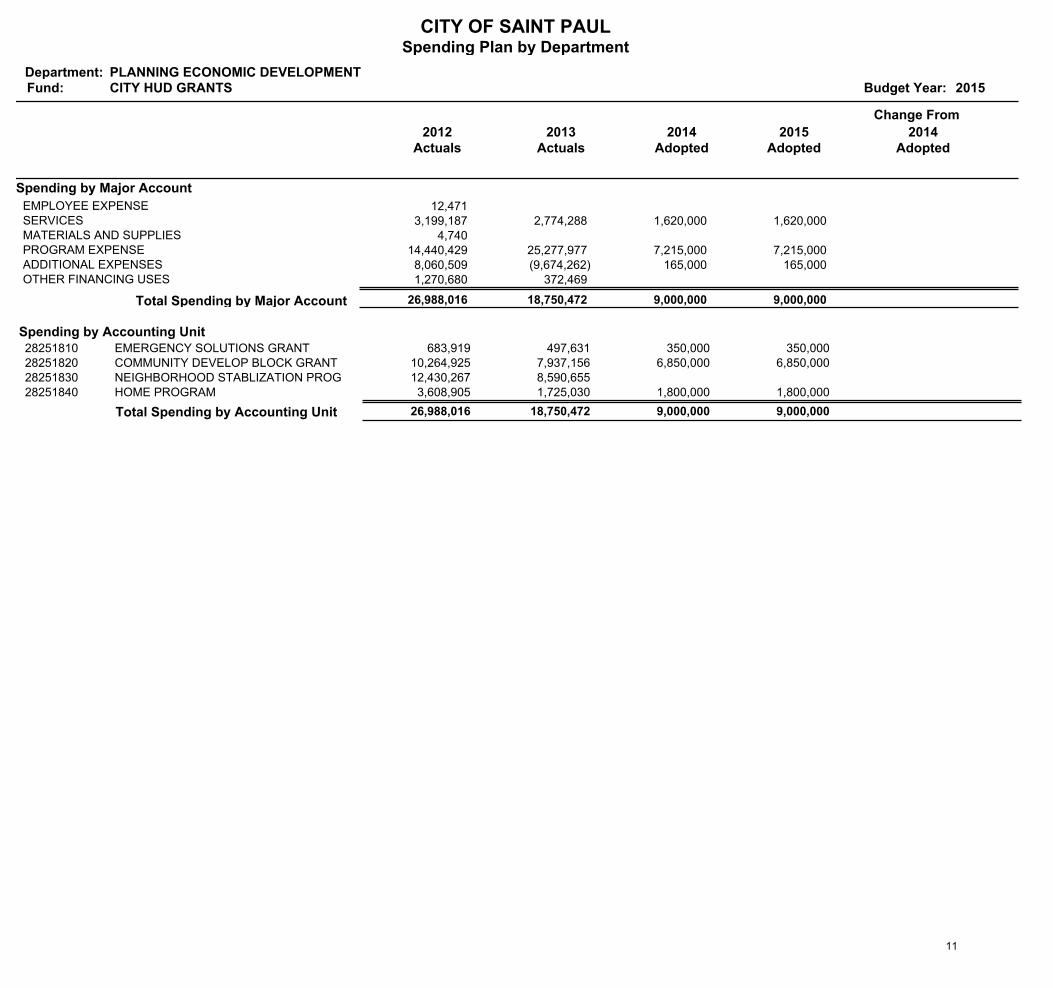
CITY OF SAINT PAULSpending Plan by Department
Department:Fund: Budget Year: 2015
PLANNING ECONOMIC DEVELOPMENTCITY HUD GRANTS
2012Actuals
Change From
2013Actuals
2014Adopted
2015Adopted
2014Adopted
Spending by Major Account
12,471 EMPLOYEE EXPENSE 3,199,187 2,774,288 1,620,000 1,620,000 SERVICES
4,740 MATERIALS AND SUPPLIES 14,440,429 25,277,977 7,215,000 7,215,000 PROGRAM EXPENSE 8,060,509 (9,674,262) 165,000 165,000 ADDITIONAL EXPENSES 1,270,680 372,469 OTHER FINANCING USES
9,000,000 9,000,000 18,750,472 26,988,016 Total Spending by Major Account
Spending by Accounting UnitEMERGENCY SOLUTIONS GRANT 683,919 350,000 350,000 497,631 28251810COMMUNITY DEVELOP BLOCK GRANT 10,264,925 6,850,000 6,850,000 7,937,156 28251820NEIGHBORHOOD STABLIZATION PROG 12,430,267 8,590,655 28251830HOME PROGRAM 3,608,905 1,800,000 1,800,000 1,725,030 28251840
Total Spending by Accounting Unit 26,988,016 9,000,000 18,750,472 9,000,000
11
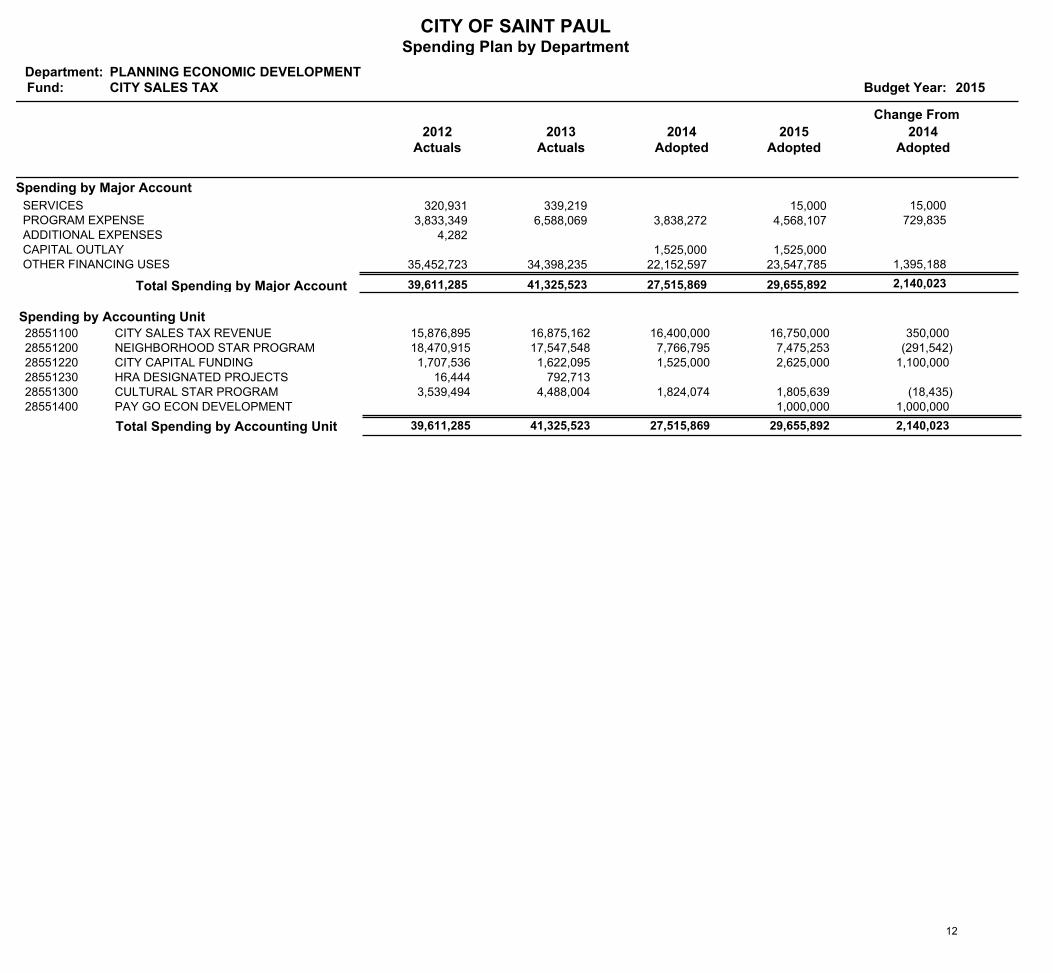
CITY OF SAINT PAULSpending Plan by Department
Department:Fund: Budget Year: 2015
PLANNING ECONOMIC DEVELOPMENTCITY SALES TAX
2012Actuals
Change From
2013Actuals
2014Adopted
2015Adopted
2014Adopted
Spending by Major Account
320,931 339,219 15,000 SERVICES 15,000 3,833,349 6,588,069 3,838,272 4,568,107 PROGRAM EXPENSE 729,835
4,282 ADDITIONAL EXPENSES 1,525,000 1,525,000 CAPITAL OUTLAY
35,452,723 34,398,235 22,152,597 23,547,785 OTHER FINANCING USES 1,395,188
2,140,023 29,655,892 27,515,869 41,325,523 39,611,285 Total Spending by Major Account
Spending by Accounting UnitCITY SALES TAX REVENUE 15,876,895 16,750,000 16,400,000 16,875,162 28551100 350,000 NEIGHBORHOOD STAR PROGRAM 18,470,915 7,475,253 7,766,795 17,547,548 28551200 (291,542)CITY CAPITAL FUNDING 1,707,536 2,625,000 1,525,000 1,622,095 28551220 1,100,000 HRA DESIGNATED PROJECTS 16,444 792,713 28551230CULTURAL STAR PROGRAM 3,539,494 1,805,639 1,824,074 4,488,004 28551300 (18,435)PAY GO ECON DEVELOPMENT 1,000,000 28551400 1,000,000
Total Spending by Accounting Unit 39,611,285 29,655,892 2,140,023 41,325,523 27,515,869
12

CITY OF SAINT PAULSpending Plan by Department
Department:Fund: Budget Year: 2015
PLANNING ECONOMIC DEVELOPMENTPED ADMINISTRATION
2012Actuals
Change From
2013Actuals
2014Adopted
2015Adopted
2014Adopted
Spending by Major Account
6,778,904 6,511,012 7,371,659 7,842,534 EMPLOYEE EXPENSE 470,875 1,310,948 1,318,971 1,381,798 1,514,042 SERVICES 132,244
44,860 42,060 55,750 64,725 MATERIALS AND SUPPLIES 8,975 83,328 166 ADDITIONAL EXPENSES 7,654 14,379 10,000 13,000 CAPITAL OUTLAY 3,000
212,438 619,634 202,097 184,789 OTHER FINANCING USES (17,308)
597,786 9,619,090 9,021,304 8,506,222 8,438,132 Total Spending by Major Account
Spending by Accounting UnitPED OPERATIONS 8,354,804 9,619,090 9,021,304 8,506,056 78051100 597,786 URBAN REVITALIZATION 83,328 166 78051105
Total Spending by Accounting Unit 8,438,132 9,619,090 597,786 8,506,222 9,021,304
13
Financing Reports 14

CITY OF SAINT PAULFinancing by Company and Department
Budget Year:
CITY OF SAINT PAULCompany:
Department: PLANNING ECONOMIC DEVELOPMENT
Change From
2014Adopted
2013Actuals
2012Actuals
Account Account Description
2014Adopted
2015Adopted
Fund: CITY GRANTS 2015
FEDERAL DIRECT GRANTS43001-0 438,656 391,770
FEDERAL GRANT STATE ADMIN43101-0 326,008 183,357
FEDERAL GRANT OTHER ADMIN43201-0 382,300
STATE GRANTS43401-0 386,657 2,960,037
COUNTY GRANT43701-0 97,500
METROPOLITAN COUNCIL43905-0 2,244,200 11,296,179
OTHER GRANT HISTORY43999-0 63,531 (58,031)
TOTAL FOR INTERGOVERNMENTAL REVENUE 3,459,052 15,253,111
OUTSIDE CONTRIBUTION DONATIONS55505-0 216,500 116,500
TOTAL FOR MISCELLANEOUS REVENUE 216,500 116,500
TRANSFER FR CAPITAL PROJ FUND56235-0 50,000
TRANSFER FR ENTERPRISE FUND56240-0 17,000
TOTAL FOR OTHER FINANCING SOURCES 67,000
TOTAL FOR CITY GRANTS 3,675,552 15,436,611
15

CITY OF SAINT PAULFinancing by Company and Department
Budget Year:
CITY OF SAINT PAULCompany:
Department: PLANNING ECONOMIC DEVELOPMENT
Change From
2014Adopted
2013Actuals
2012Actuals
Account Account Description
2014Adopted
2015Adopted
Fund: CITY HUD GRANTS 2015
FEDERAL DIRECT GRANTS43001-0 21,739,883 12,479,802 8,100,000 8,100,000
FEDERAL GRANT STATE ADMIN43101-0 1,689,940 947,946
TOTAL FOR INTERGOVERNMENTAL REVENUE 23,429,822 13,427,748 8,100,000 8,100,000
OTHER SALES44299-0 (6,900)
SPACE RENTAL47510-0 100 100
DEFERRED LOAN REPAYMENT50220-0 122,531 83,389
LAND HELD FOR RESALE PED50235-0 1,962,896 4,655,038
TOTAL FOR CHARGES FOR SERVICES 2,085,527 4,731,628
INTEREST INTERNAL POOL54505-0 (132)
INCR OR DECR IN FV INVESTMENTS54510-0 (1,394)
INTEREST NOTE AND LOAN HISTORY54605-0 109,196 68,216
TOTAL FOR INVESTMENT EARNINGS 107,670 68,216
PROGRAM INCOME55105-0 480,116 (10,010) 400,000 400,000
REFUNDS OVERPAYMENTS55815-0 (37,845)
OTHER MISC REVENUE55915-0 30,174 552
TOTAL FOR MISCELLANEOUS REVENUE 510,290 (47,304) 400,000 400,000
INTRA FUND IN TRANSFER56115-0
TRANSFER FR CAPITAL PROJ FUND56235-0 155,389 294,362
TRANSFER FR CDBG56250-0 500,000 500,000
REPAYMENT OF ADVANCE57605-0 731,836 385,103
TOTAL FOR OTHER FINANCING SOURCES 887,224 679,466 500,000 500,000
9,000,000 TOTAL FOR CITY HUD GRANTS 27,020,534 18,859,753 9,000,000
16
CITY OF SAINT PAULFinancing by Company and Department
Budget Year:
CITY OF SAINT PAULCompany:
Department: PLANNING ECONOMIC DEVELOPMENT
Change From
2014Adopted
2013Actuals
2012Actuals
Account Account Description
2014Adopted
2015Adopted
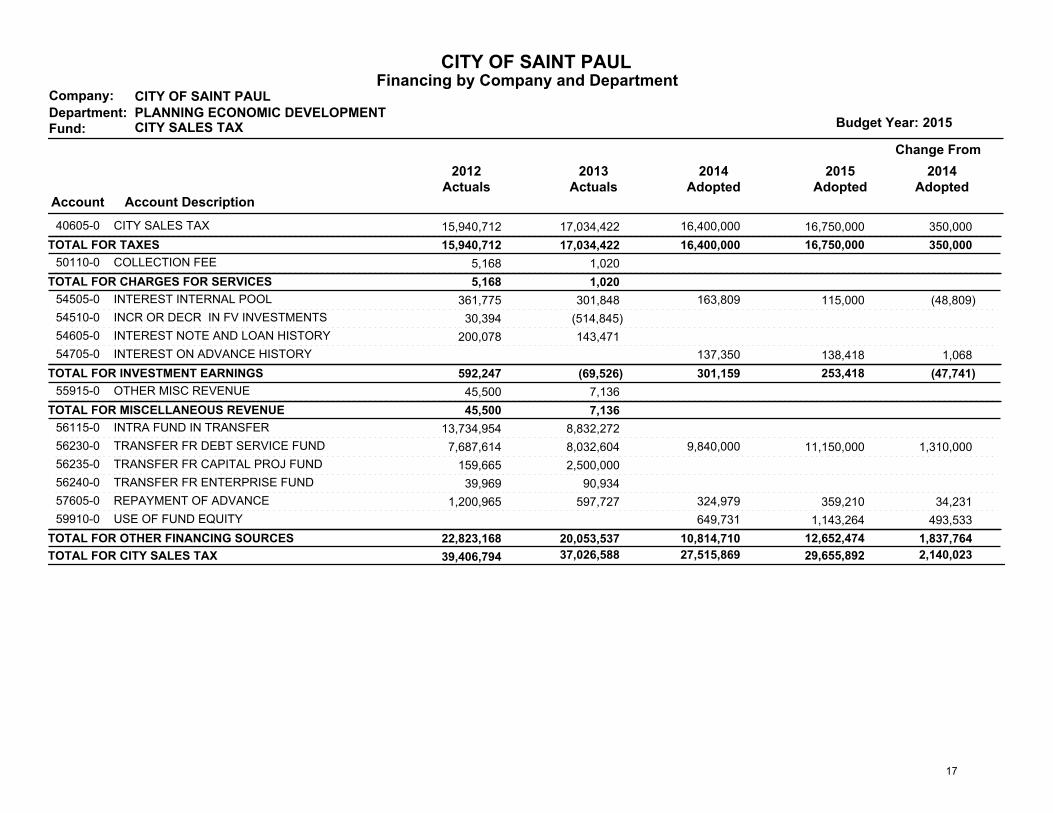
Fund: CITY SALES TAX 2015
CITY SALES TAX40605-0 350,000 15,940,712 17,034,422 16,400,000 16,750,000
350,000 TOTAL FOR TAXES 15,940,712 17,034,422 16,400,000 16,750,000
COLLECTION FEE50110-0 5,168 1,020
TOTAL FOR CHARGES FOR SERVICES 5,168 1,020
INTEREST INTERNAL POOL54505-0 (48,809) 361,775 301,848 163,809 115,000
INCR OR DECR IN FV INVESTMENTS54510-0 30,394 (514,845)
INTEREST NOTE AND LOAN HISTORY54605-0 200,078 143,471
INTEREST ON ADVANCE HISTORY54705-0 1,068 137,350 138,418
(47,741)TOTAL FOR INVESTMENT EARNINGS 592,247 (69,526) 301,159 253,418
OTHER MISC REVENUE55915-0 45,500 7,136
TOTAL FOR MISCELLANEOUS REVENUE 45,500 7,136
INTRA FUND IN TRANSFER56115-0 13,734,954 8,832,272
TRANSFER FR DEBT SERVICE FUND56230-0 1,310,000 7,687,614 8,032,604 9,840,000 11,150,000
TRANSFER FR CAPITAL PROJ FUND56235-0 159,665 2,500,000
TRANSFER FR ENTERPRISE FUND56240-0 39,969 90,934
REPAYMENT OF ADVANCE57605-0 34,231 1,200,965 597,727 324,979 359,210
USE OF FUND EQUITY59910-0 493,533 649,731 1,143,264
1,837,764 TOTAL FOR OTHER FINANCING SOURCES 22,823,168 20,053,537 10,814,710 12,652,474
29,655,892 TOTAL FOR CITY SALES TAX 39,406,794 37,026,588 27,515,869 2,140,023
17
CITY OF SAINT PAULFinancing by Company and Department
Budget Year:
CITY OF SAINT PAULCompany:
Department: PLANNING ECONOMIC DEVELOPMENT
Change From
2014Adopted
2013Actuals
2012Actuals
Account Account Description
2014Adopted
2015Adopted
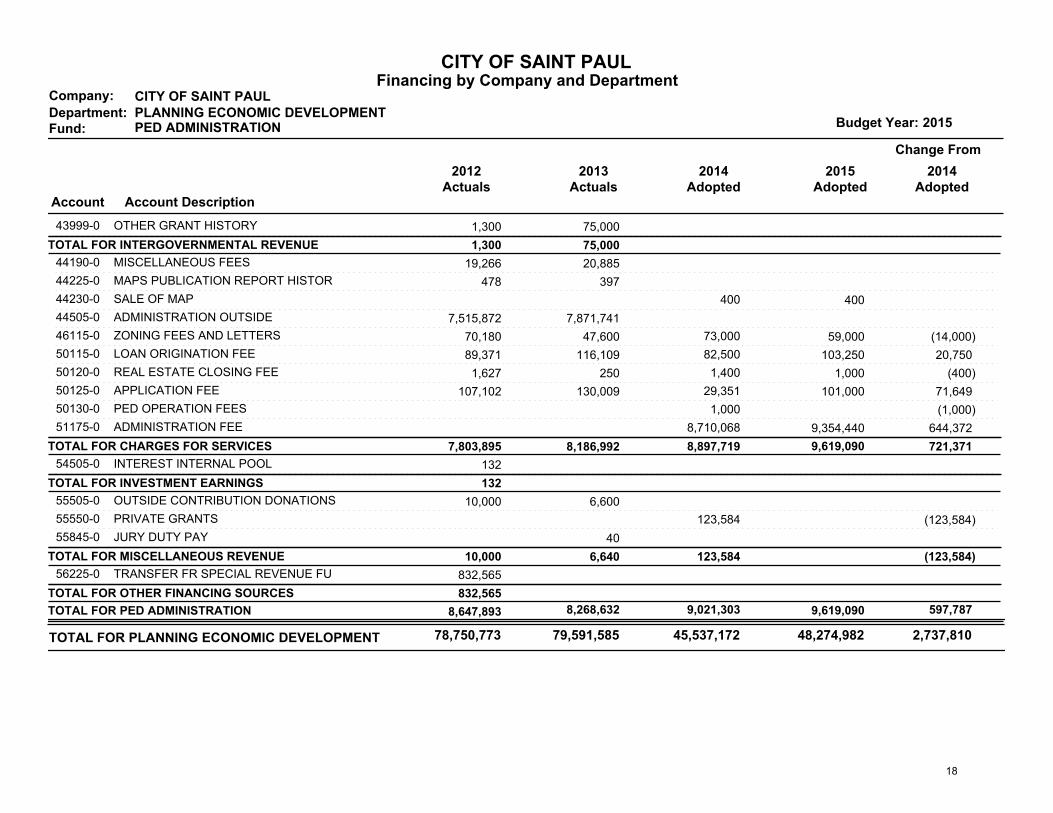
Fund: PED ADMINISTRATION 2015
OTHER GRANT HISTORY43999-0 1,300 75,000
TOTAL FOR INTERGOVERNMENTAL REVENUE 1,300 75,000
MISCELLANEOUS FEES44190-0 19,266 20,885
MAPS PUBLICATION REPORT HISTOR44225-0 478 397
SALE OF MAP44230-0 400 400
ADMINISTRATION OUTSIDE44505-0 7,515,872 7,871,741
ZONING FEES AND LETTERS46115-0 (14,000) 70,180 47,600 73,000 59,000
LOAN ORIGINATION FEE50115-0 20,750 89,371 116,109 82,500 103,250
REAL ESTATE CLOSING FEE50120-0 (400) 1,627 250 1,400 1,000
APPLICATION FEE50125-0 71,649 107,102 130,009 29,351 101,000
PED OPERATION FEES50130-0 (1,000) 1,000
ADMINISTRATION FEE51175-0 644,372 8,710,068 9,354,440
721,371 TOTAL FOR CHARGES FOR SERVICES 7,803,895 8,186,992 8,897,719 9,619,090
INTEREST INTERNAL POOL54505-0 132
TOTAL FOR INVESTMENT EARNINGS 132
OUTSIDE CONTRIBUTION DONATIONS55505-0 10,000 6,600
PRIVATE GRANTS55550-0 (123,584) 123,584
JURY DUTY PAY55845-0 40
(123,584)TOTAL FOR MISCELLANEOUS REVENUE 10,000 6,640 123,584
TRANSFER FR SPECIAL REVENUE FU56225-0 832,565
TOTAL FOR OTHER FINANCING SOURCES 832,565
9,619,090 TOTAL FOR PED ADMINISTRATION 8,647,893 8,268,632 9,021,303 597,787
45,537,172 48,274,982 2,737,810 TOTAL FOR PLANNING ECONOMIC DEVELOPMENT 79,591,585 78,750,773
18
CITY OF SAINT PAULFinancing Plan by Department
Department:Fund: Budget Year: 2015
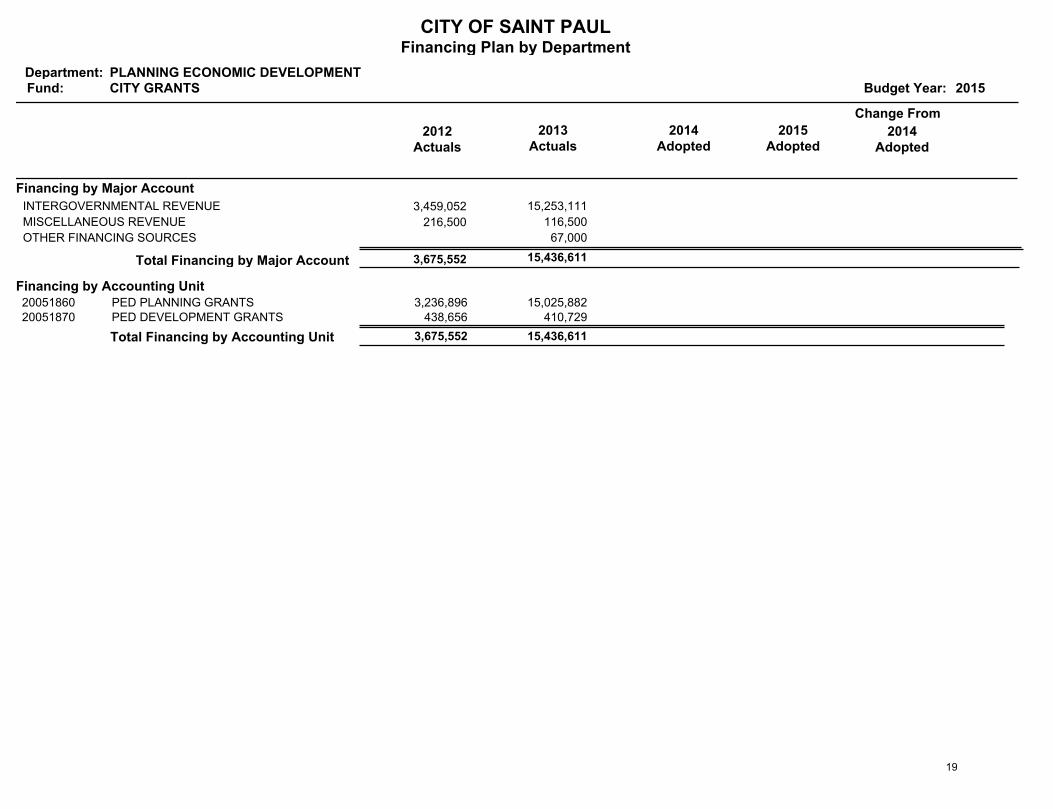
PLANNING ECONOMIC DEVELOPMENTCITY GRANTS
2012Actuals
Change From
2013Actuals
2014Adopted
2015Adopted
2014Adopted
Financing by Major Account
3,459,052 15,253,111 INTERGOVERNMENTAL REVENUE
216,500 116,500 MISCELLANEOUS REVENUE
67,000 OTHER FINANCING SOURCES
15,436,611 3,675,552 Total Financing by Major Account
Financing by Accounting UnitPED PLANNING GRANTS 3,236,896 15,025,882 20051860PED DEVELOPMENT GRANTS 438,656 410,729 20051870
Total Financing by Accounting Unit 3,675,552 15,436,611
19
CITY OF SAINT PAULFinancing Plan by Department
Department:Fund: Budget Year: 2015
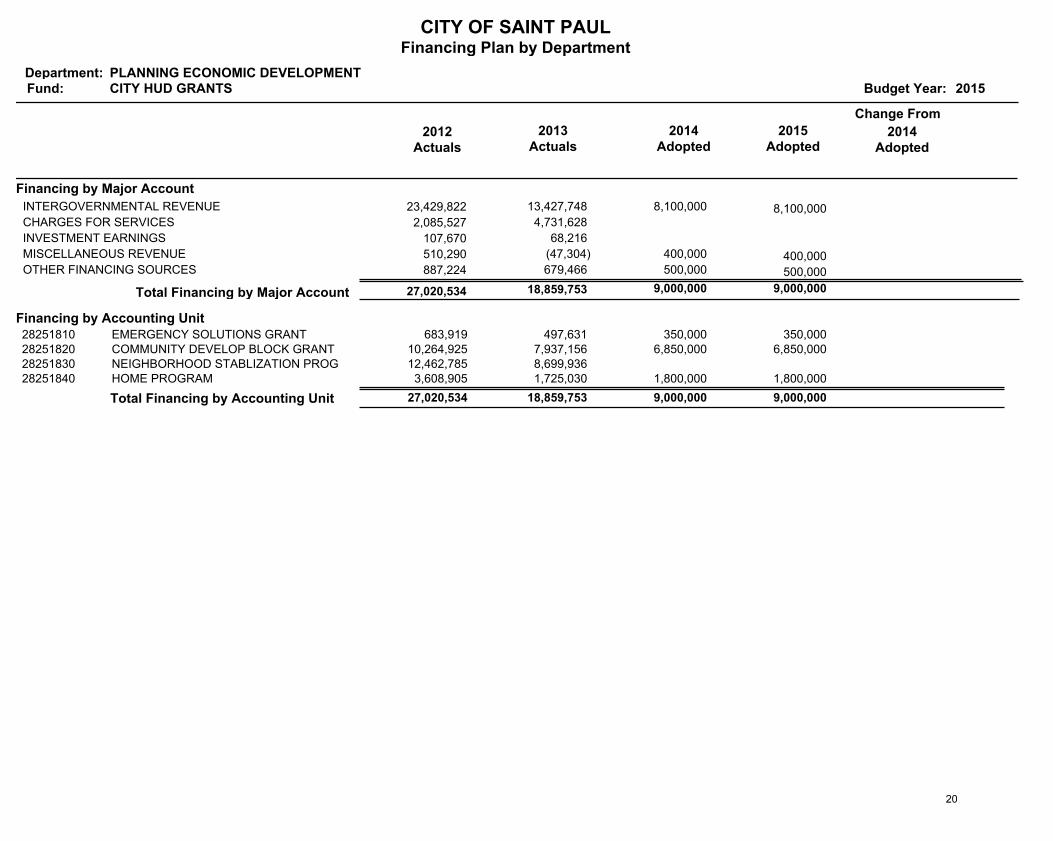
PLANNING ECONOMIC DEVELOPMENTCITY HUD GRANTS
2012Actuals
Change From
2013Actuals
2014Adopted
2015Adopted
2014Adopted
Financing by Major Account
23,429,822 13,427,748 8,100,000 8,100,000 INTERGOVERNMENTAL REVENUE
2,085,527 4,731,628 CHARGES FOR SERVICES
107,670 68,216 INVESTMENT EARNINGS
510,290 (47,304) 400,000 400,000 MISCELLANEOUS REVENUE
887,224 679,466 500,000 500,000 OTHER FINANCING SOURCES
9,000,000 9,000,000 18,859,753 27,020,534 Total Financing by Major Account
Financing by Accounting UnitEMERGENCY SOLUTIONS GRANT 683,919 350,000 350,000 497,631 28251810COMMUNITY DEVELOP BLOCK GRANT 10,264,925 6,850,000 6,850,000 7,937,156 28251820NEIGHBORHOOD STABLIZATION PROG 12,462,785 8,699,936 28251830HOME PROGRAM 3,608,905 1,800,000 1,800,000 1,725,030 28251840
Total Financing by Accounting Unit 27,020,534 9,000,000 18,859,753 9,000,000
20
CITY OF SAINT PAULFinancing Plan by Department
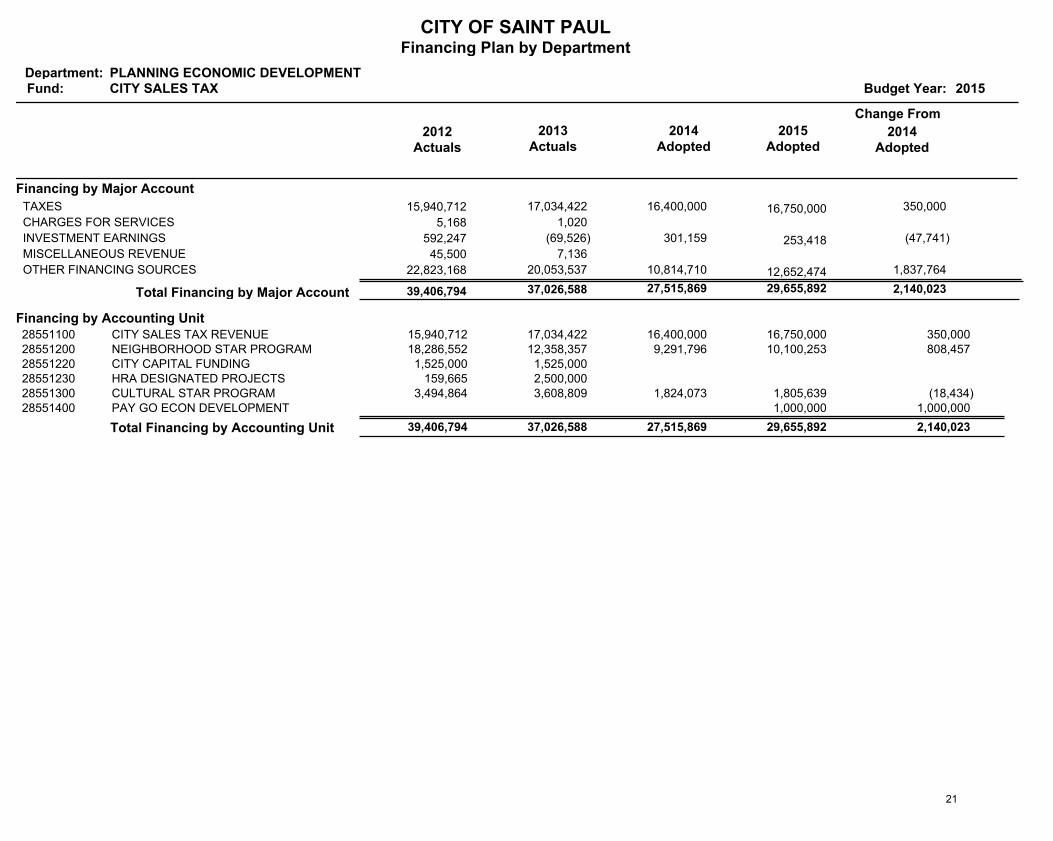
Department:Fund: Budget Year: 2015
PLANNING ECONOMIC DEVELOPMENTCITY SALES TAX
2012Actuals
Change From
2013Actuals
2014Adopted
2015Adopted
2014Adopted
Financing by Major Account
15,940,712 17,034,422 16,400,000 16,750,000 TAXES 350,000
5,168 1,020 CHARGES FOR SERVICES
592,247 (69,526) 301,159 253,418 INVESTMENT EARNINGS (47,741)
45,500 7,136 MISCELLANEOUS REVENUE
22,823,168 20,053,537 10,814,710 12,652,474 OTHER FINANCING SOURCES 1,837,764
2,140,023 29,655,892 27,515,869 37,026,588 39,406,794 Total Financing by Major Account
Financing by Accounting UnitCITY SALES TAX REVENUE 15,940,712 16,750,000 16,400,000 17,034,422 28551100 350,000 NEIGHBORHOOD STAR PROGRAM 18,286,552 10,100,253 9,291,796 12,358,357 28551200 808,457 CITY CAPITAL FUNDING 1,525,000 1,525,000 28551220HRA DESIGNATED PROJECTS 159,665 2,500,000 28551230CULTURAL STAR PROGRAM 3,494,864 1,805,639 1,824,073 3,608,809 28551300 (18,434)PAY GO ECON DEVELOPMENT 1,000,000 28551400 1,000,000
Total Financing by Accounting Unit 39,406,794 29,655,892 2,140,023 37,026,588 27,515,869
21
CITY OF SAINT PAULFinancing Plan by Department
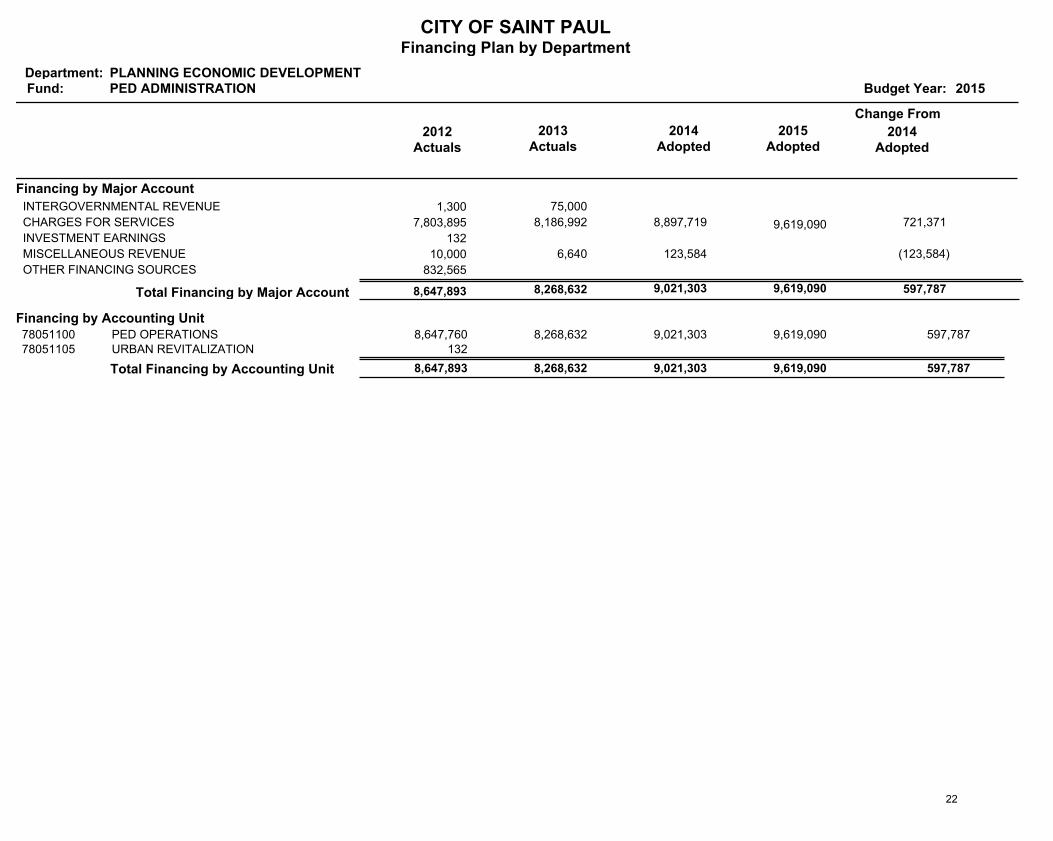
Department:Fund: Budget Year: 2015
PLANNING ECONOMIC DEVELOPMENTPED ADMINISTRATION
2012Actuals
Change From
2013Actuals
2014Adopted
2015Adopted
2014Adopted
Financing by Major Account
1,300 75,000 INTERGOVERNMENTAL REVENUE
7,803,895 8,186,992 8,897,719 9,619,090 CHARGES FOR SERVICES 721,371
132 INVESTMENT EARNINGS
10,000 6,640 123,584 MISCELLANEOUS REVENUE (123,584)
832,565 OTHER FINANCING SOURCES
597,787 9,619,090 9,021,303 8,268,632 8,647,893 Total Financing by Major Account
Financing by Accounting UnitPED OPERATIONS 8,647,760 9,619,090 9,021,303 8,268,632 78051100 597,787 URBAN REVITALIZATION 132 78051105
Total Financing by Accounting Unit 8,647,893 9,619,090 597,787 8,268,632 9,021,303
22